Telenor Group | PowerPoint Template 16:9
20
Sensitivity: Open Grameenphone Ltd. 4 th Quarter 2020 Results Yasir Azman, CEO 28 January 2021
Transcript of Telenor Group | PowerPoint Template 16:9
Sensitivity: Open
Grameenphone Ltd. 4th Quarter 2020 Results
Yasir Azman, CEO
28 January 2021

Sensitivity: Open
Disclaimer
The following presentation is being made only to, and is only
directed at, persons to whom such presentation may lawfully be
communicated (’relevant persons’). Any person who is not a
relevant person should not act or rely on this presentation or any of
its contents. Information in the following presentation relating to the
price at which relevant investments have been bought or sold in the
past or the yield on such investments cannot be relied upon as a
guide to the future performance of such investments.
This presentation does not constitute an offering of securities or
otherwise constitute an invitation or inducement to any person to
underwrite, subscribe for or otherwise acquire securities in
Grameenphone Ltd. The release, publication or distribution of this
presentation in certain jurisdictions may be restricted by law, and
therefore persons in such jurisdictions into which this presentation is
released, published or distributed should inform themselves about,
and observe, such restrictions.

Sensitivity: Open
Q4 2020
Highlights
An unprecedented 2020
Overcoming operational barriers
Efficiently managing challenges
A foundation for 2021

Sensitivity: Open
Slower than expected economic recovery from pandemic in the fourth quarter
• Tower Co. operations have commenced
• Update on BTRC Audit*
REGULATORYENVIRONMENT
• Sluggish recovery in economic activity
• Drive on GA & data; integration with MFS
• Customer engagement through digital channels
• Improved 4G conversion, reaching 19.8 Mn users
Q4 2020*More details on Business Highlights
OPERATIONAL
UPDATE
Sensitivity: Open
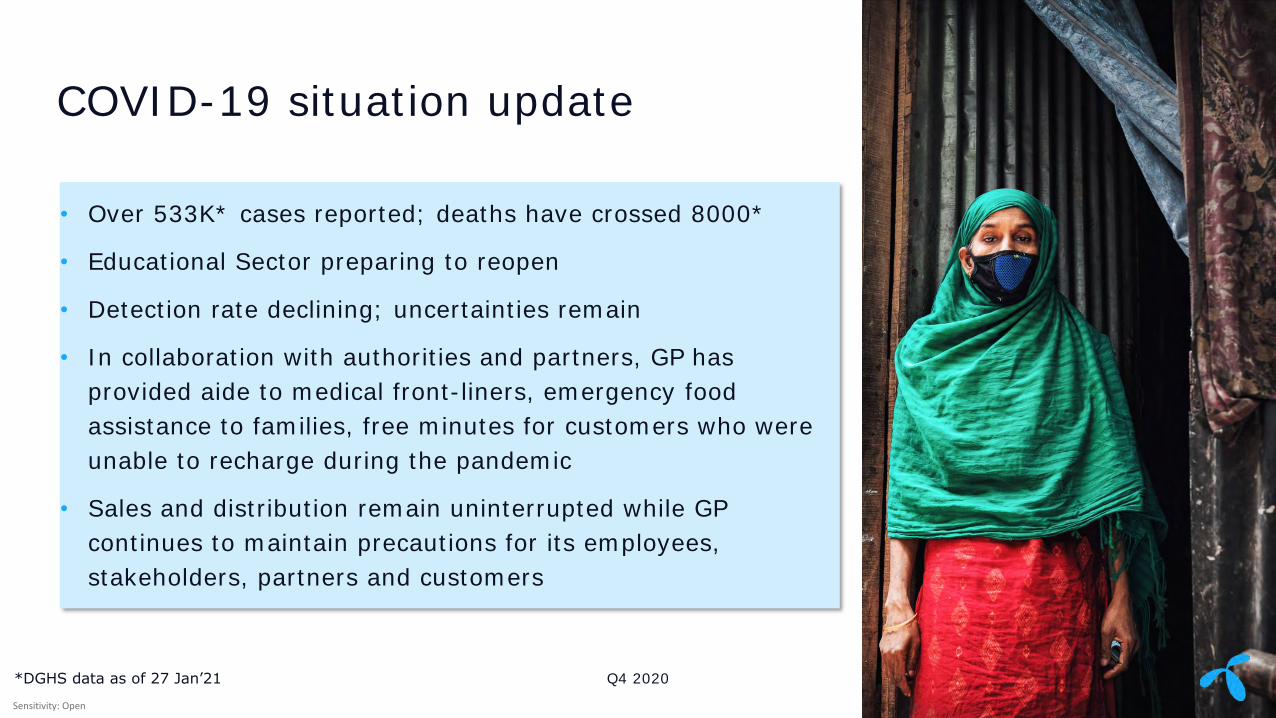
COVID-19 situation update
• Over 533K* cases reported; deaths have crossed 8000*
• Educational Sector preparing to reopen
• Detection rate declining; uncertainties remain
• In collaboration with authorities and partners, GP has
provided aide to medical front-liners, emergency food
assistance to families, free minutes for customers who were
unable to recharge during the pandemic
• Sales and distribution remain uninterrupted while GP
continues to maintain precautions for its employees,
stakeholders, partners and customers
Q4 2020*DGHS data as of 27 Jan’21

Sensitivity: Open
BDT 98.2 Bn paid to National Exchequer in 2020
Child Online Safety, in partnership with UNICEF
Bangladesh, launched to educate 2.5 million
children and build awareness for 20 million people
GP focused on Youth Skill and Employment as one
of its key areas for creating impact in the society
and the nation, working with government,
development, and private sector representatives
to commemorate National Youth Day
GP will continue its collaborative efforts in helping
communities recover from the pandemic
Empowering Societies
Q4 2020
79.0 Mn (+3.4% YoY) connected
41.3 Mn (+1.7% YoY) access to internet
19.8 Mn (+65.6% YoY) empowered with 4G

Sensitivity: Open
Grameenphone Ltd. 4th Quarter 2020 Results
Jens Becker, CFO
28 January 2021
Sensitivity: Open
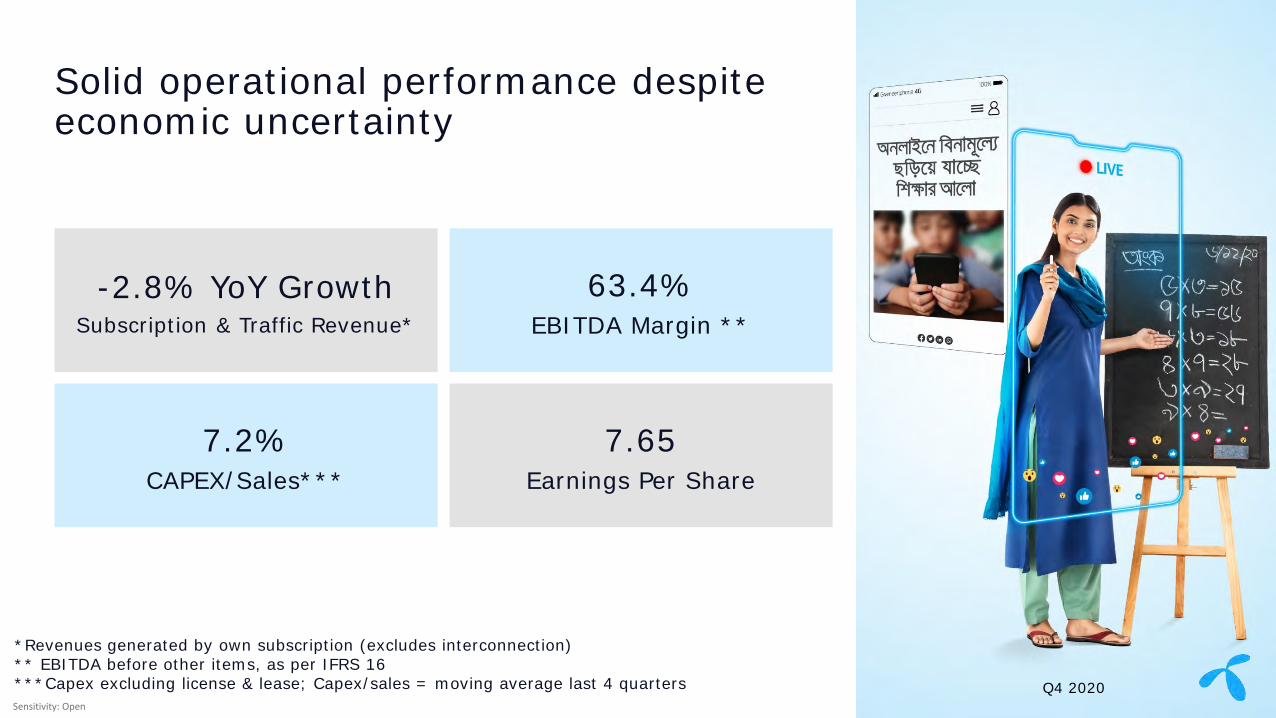
Solid operational performance despite economic uncertainty
-2.8% YoY GrowthSubscription & Traffic Revenue*
63.4%EBITDA Margin **
7.2% CAPEX/Sales***
7.65Earnings Per Share
Q3 2019
*Revenues generated by own subscription (excludes interconnection)** EBITDA before other items, as per IFRS 16 ***Capex excluding license & lease; Capex/sales = moving average last 4 quarters Q4 2020
Sensitivity: Open
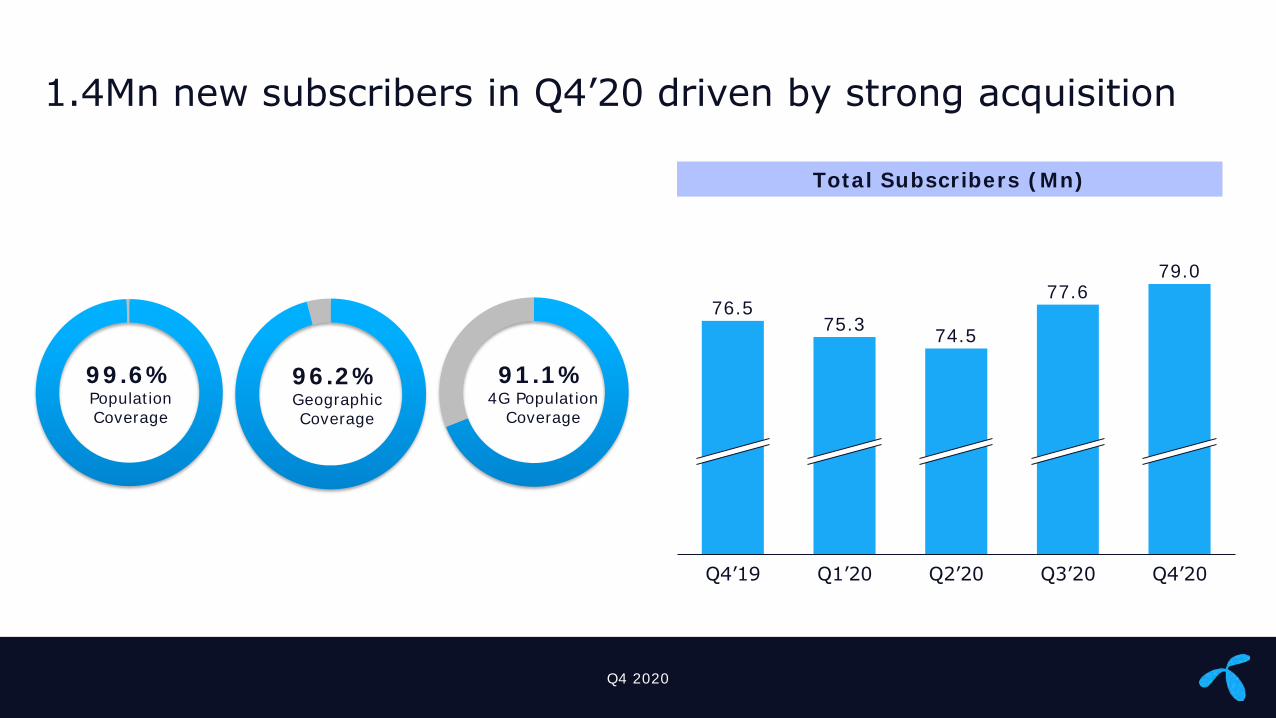
1.4Mn new subscribers in Q4’20 driven by strong acquisition
Total Subscribers (Mn)
Q4 2020
99.6%Population Coverage
96.2%Geographic Coverage
91.1%4G Population
Coverage
Q3’20
79.0
75.3
Q4’19 Q1’20 Q2’20 Q4’20
76.5
74.5
77.6
Sensitivity: Open
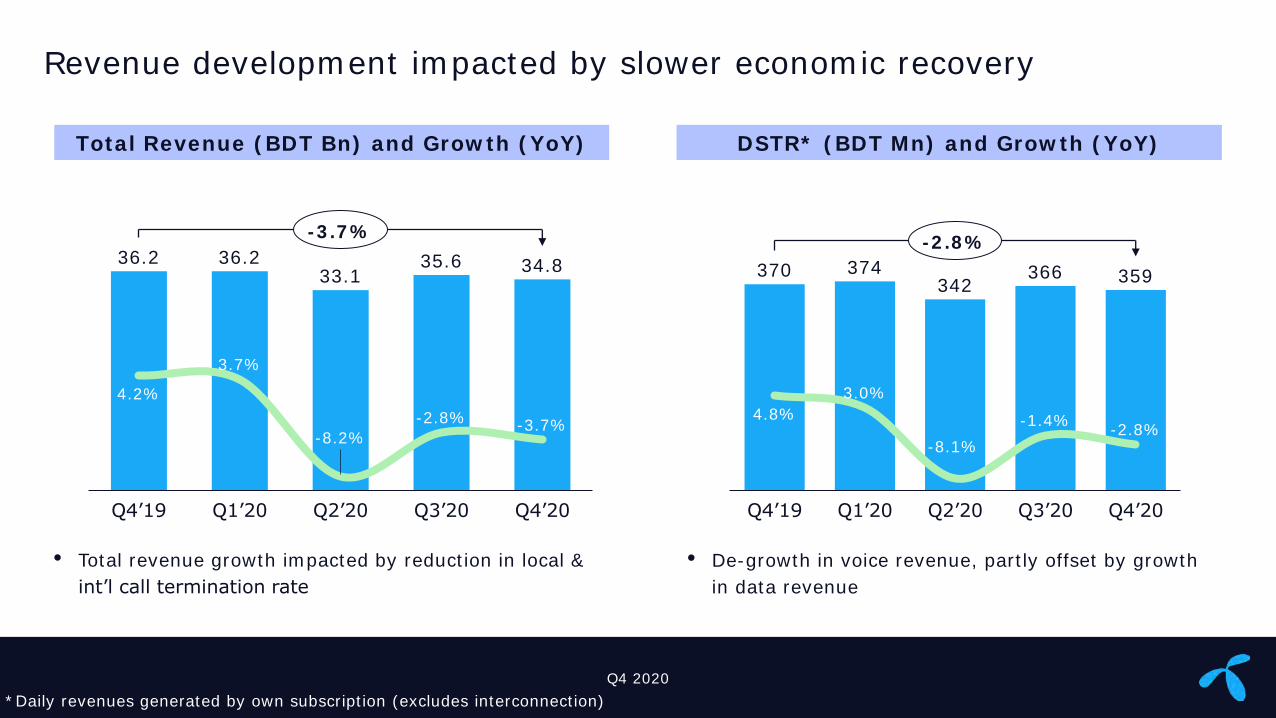
Revenue development impacted by slower economic recovery
*Daily revenues generated by own subscription (excludes interconnection)
Total Revenue (BDT Bn) and Growth (YoY)
Q4 2020
DSTR* (BDT Mn) and Growth (YoY)
36.2 36.2 33.1
35.6 34.8
Q1’20Q4’19
4.2%
3.7%
-2.8%
Q2’20
-8.2%
Q3’20
-3.7%
Q4’20
-3.7%
370 374342
366 359
4.8% -1.4%
Q2’20
3.0%
Q4’19 Q3’20Q1’20
-8.1%-2.8%
Q4’20
-2.8%
• De-growth in voice revenue, partly offset by growth
in data revenue
• Total revenue growth impacted by reduction in local &
int’l call termination rate

Sensitivity: Open
Continued growth in data revenue
Q4 2020*Revenues generated by own subscription (includes interconnection)** Minimum 150 KB usage within last 3 months
• Data revenue growth mainly driven by 2.9% growth
in data ARPU
Data Revenue (BDT Bn) and % of Service Revenue*
• Continued expansion of 4G network along with 4G
conversion
Active Data Users** (Mn) and % of Sub-base
8.0 8.5 8.4 8.7 8.4
Q2’20
22.5% 24.8%
Q4’19
24.0%
Q1’20
25.7%
Q3’20
24.6%
Q4’20
+5.1%
40.6 40.4 40.9 42.0 41.3
Q1’20Q4’19 Q2’20
53.1% 53.6% 52.2%54.8%
Q3’20
54.1%
Q4’20
+1.7%
Data Revenue (Bn) % of Service Revenue Active Data User % of Sub-base
Sensitivity: Open
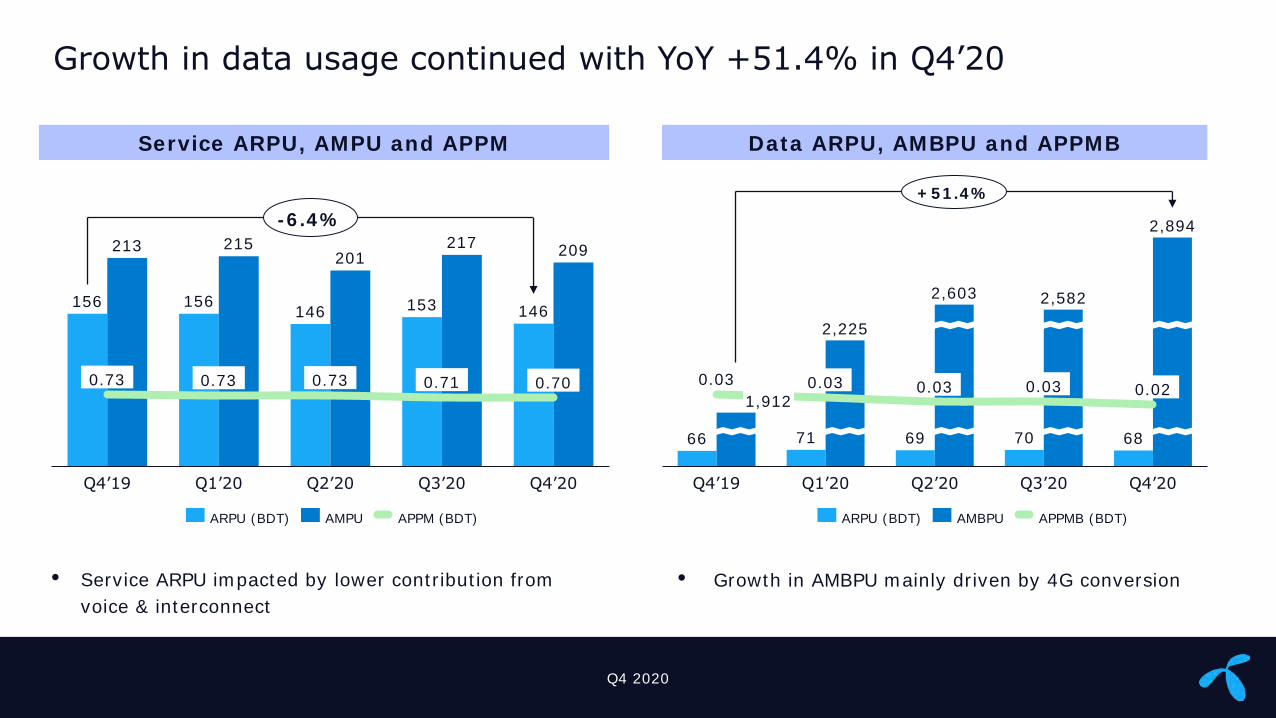
Growth in data usage continued with YoY +51.4% in Q4’20
Service ARPU, AMPU and APPM
Q4 2020
156 156146 153 146
213 215201
217209
Q3’20
0.730.73 0.73
Q1’20Q4’19 Q2’20
0.700.71
Q4’20
-6.4%
Data ARPU, AMBPU and APPMB
66 71 69 70 68
0.03
Q4’19
0.03
2,603
0.031,912
0.03
Q2’20 Q3’20
0.02
Q4’20
2,225
2,582
2,894
Q1’20
+51.4%
AMBPUARPU (BDT) APPMB (BDT)
• Growth in AMBPU mainly driven by 4G conversion
ARPU (BDT) AMPU APPM (BDT)
• Service ARPU impacted by lower contribution from
voice & interconnect
Sensitivity: Open
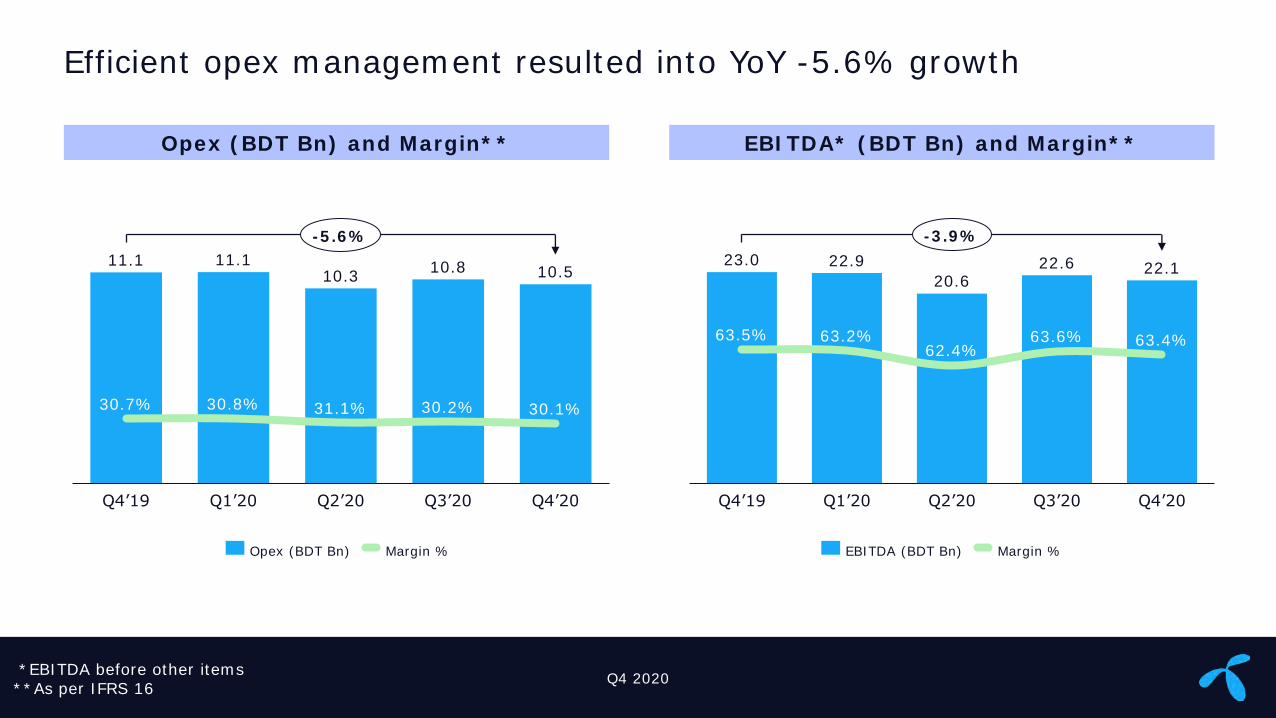
Efficient opex management resulted into YoY -5.6% growth
Q4 2020
Opex (BDT Bn) and Margin**
*EBITDA before other items**As per IFRS 16
EBITDA* (BDT Bn) and Margin**
11.1 11.1 10.3
10.8 10.5
Q1’20
30.8%30.7%
Q4’19
30.2%31.1%
Q2’20 Q3’20
30.1%
Q4’20
-5.6%
Opex (BDT Bn) Margin %
23.0 22.9
20.6 22.6 22.1
Q2’20
63.5%62.4%
63.6%
Q4’19
63.2%
Q1’20 Q3’20
63.4%
Q4’20
-3.9%
EBITDA (BDT Bn) Margin %
Sensitivity: Open
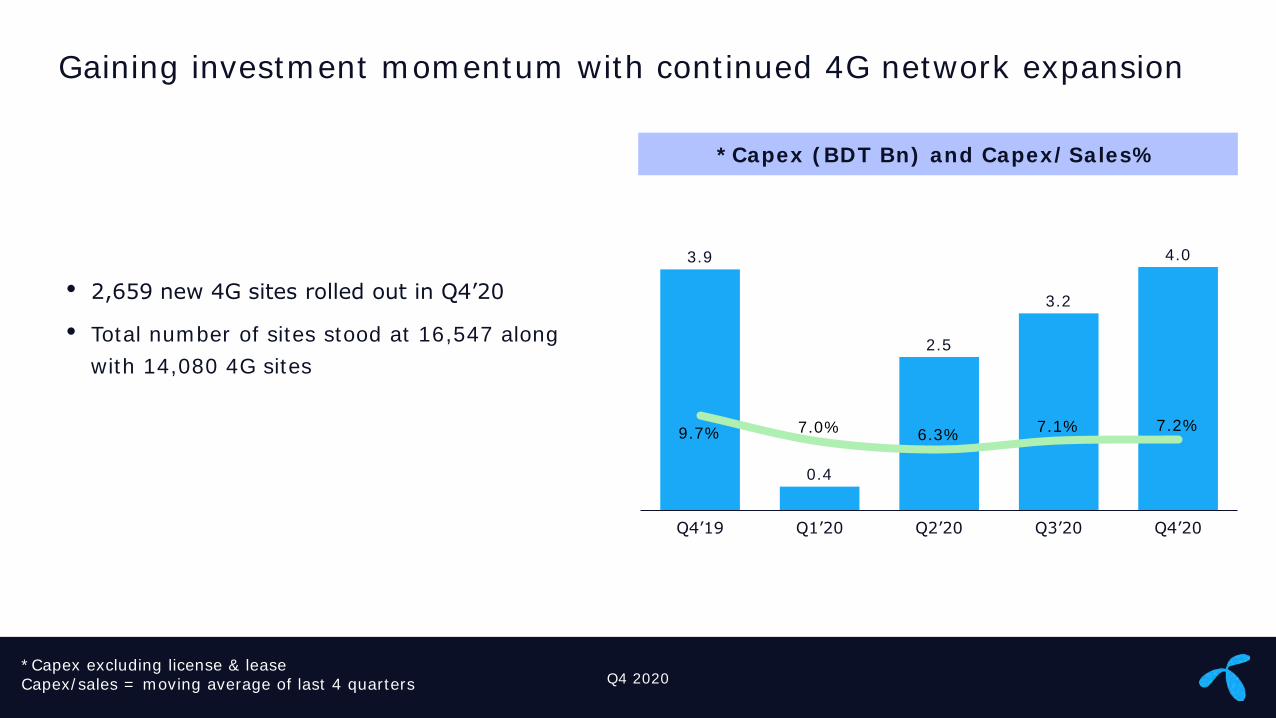
Gaining investment momentum with continued 4G network expansion
Q4 2020
• 2,659 new 4G sites rolled out in Q4’20
• Total number of sites stood at 16,547 along
with 14,080 4G sites
*Capex excluding license & leaseCapex/sales = moving average of last 4 quarters
*Capex (BDT Bn) and Capex/Sales%
3.9
0.4
2.5
3.2
4.0
7.1%9.7%
Q4’19
7.0%
Q2’20Q1’20
6.3%
Q3’20
7.2%
Q4’20
Sensitivity: Open
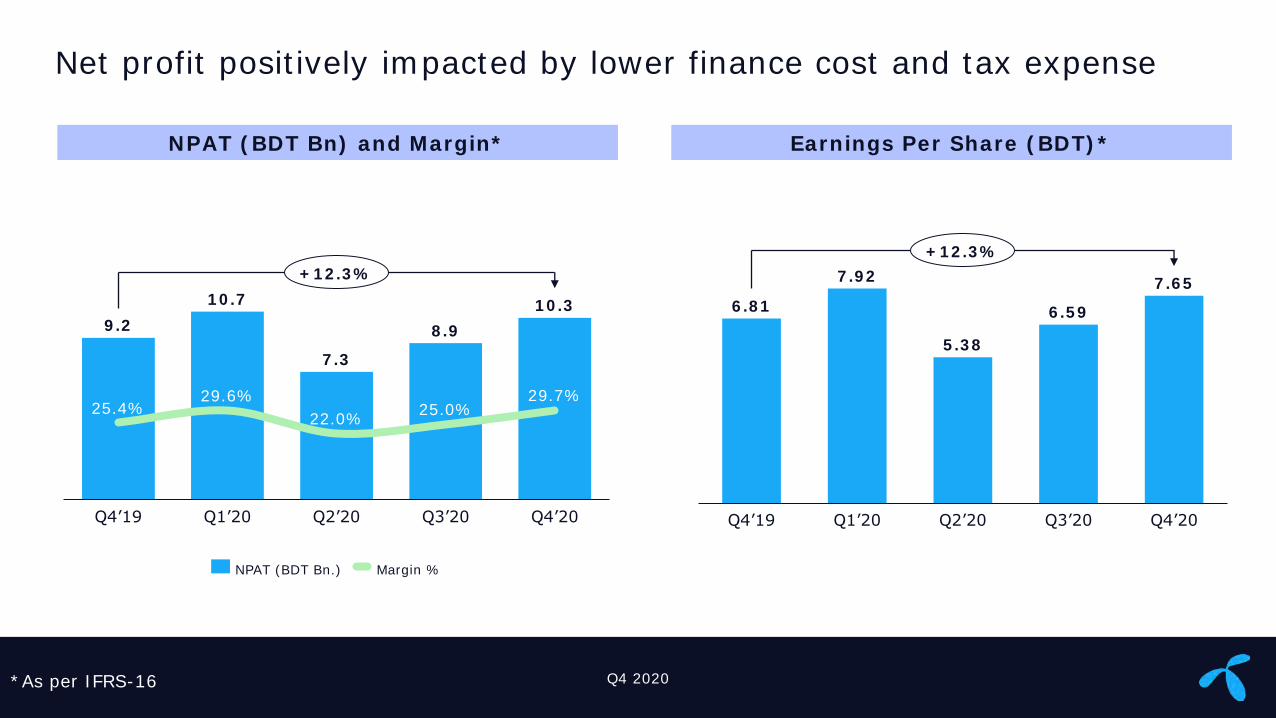
Net profit positively impacted by lower finance cost and tax expense
Q4 2020
NPAT (BDT Bn) and Margin*
*As per IFRS-16
Earnings Per Share (BDT)*
9.2
10.7
7.3
8.9
10.3
Q1’20 Q2’20
25.4%
Q4’19
29.6%
22.0%25.0%
Q3’20
29.7%
Q4’20
+12.3%
NPAT (BDT Bn.) Margin %
6.81
7.92
5.38
6.59
7.65
Q4’19 Q1’20 Q2’20 Q3’20 Q4’20
+12.3%
Sensitivity: Open
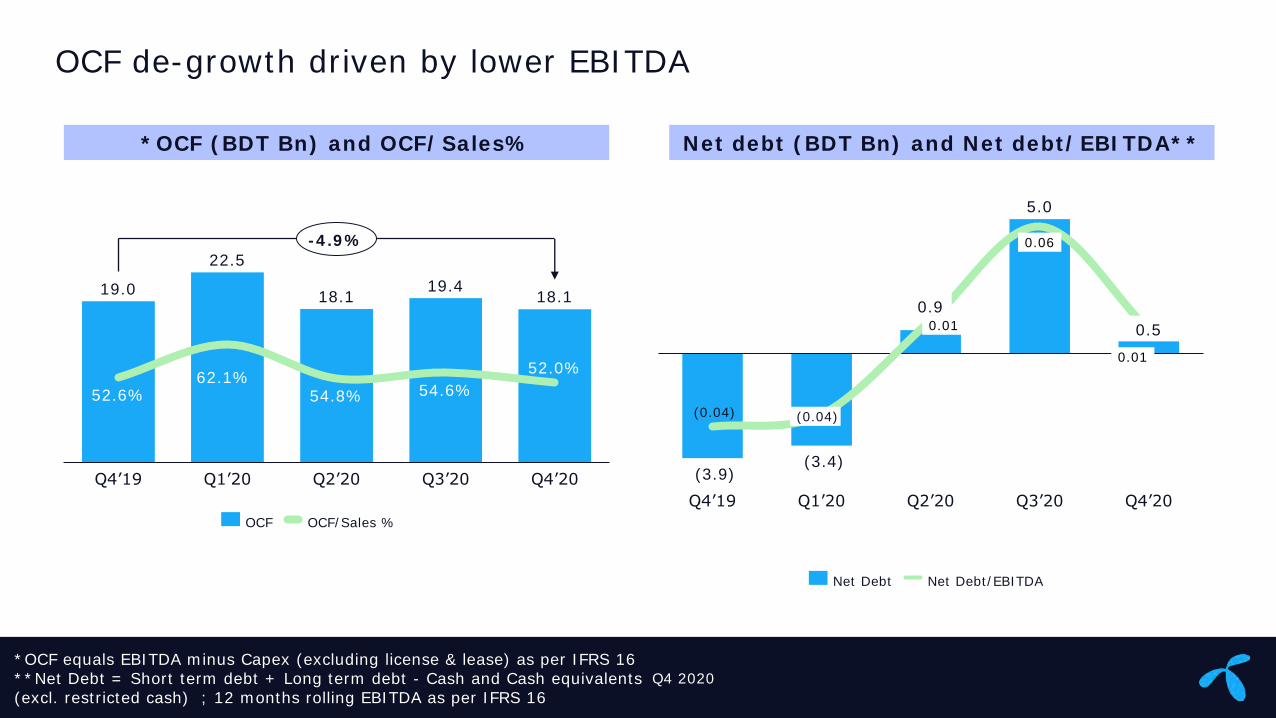
OCF de-growth driven by lower EBITDA
Q4 2020
*OCF (BDT Bn) and OCF/Sales%
*OCF equals EBITDA minus Capex (excluding license & lease) as per IFRS 16**Net Debt = Short term debt + Long term debt - Cash and Cash equivalents (excl. restricted cash) ; 12 months rolling EBITDA as per IFRS 16
Net debt (BDT Bn) and Net debt/EBITDA**
19.0
22.5
18.1 19.4
18.1
54.6%62.1%
54.8%52.6%
Q2’20Q4’19 Q1’20 Q3’20
52.0%
Q4’20
-4.9%
OCF/Sales %OCF
(3.9)(3.4)
5.0
(0.04)
Q4’19
(0.04)
0.01
Q2’20Q1’20
0.01
0.06
Q3’20 Q4’20
0.9
0.5
Net Debt Net Debt/EBITDA
Sensitivity: Open
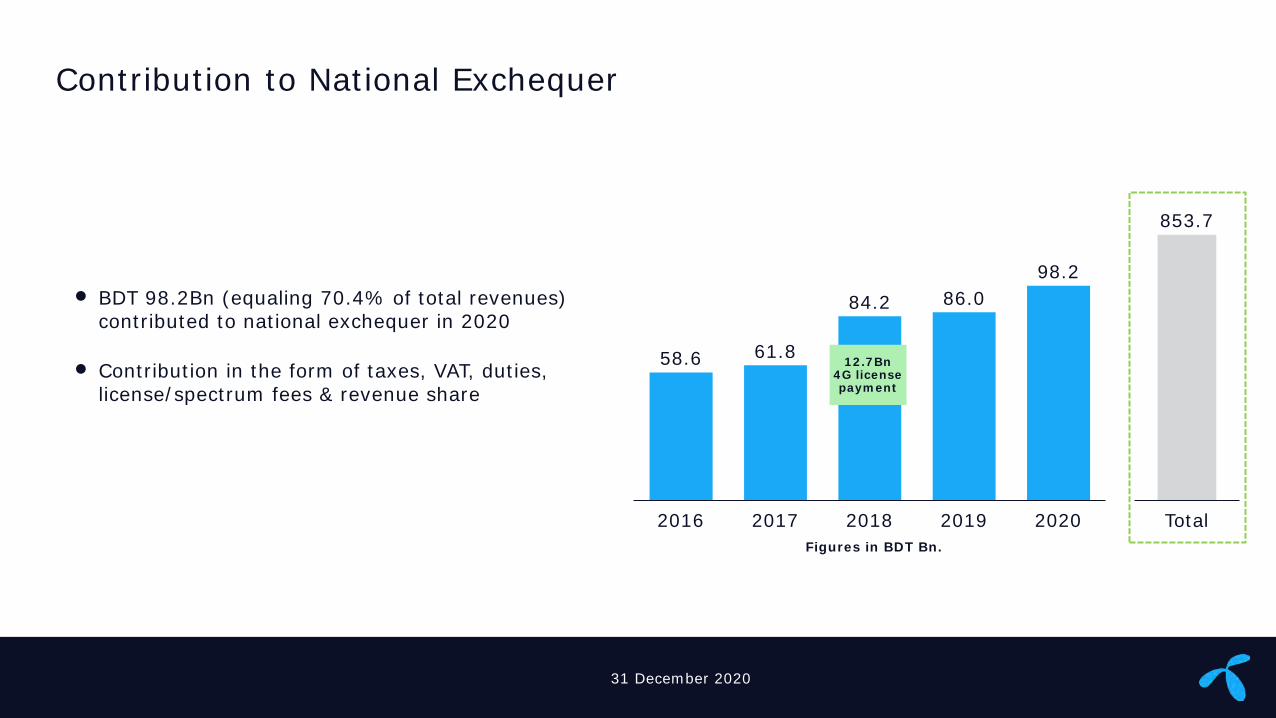
Contribution to National Exchequer
• BDT 98.2Bn (equaling 70.4% of total revenues) contributed to national exchequer in 2020
• Contribution in the form of taxes, VAT, duties, license/spectrum fees & revenue share
31 December 2020
58.6 61.8
84.2 86.0
98.2
2018 20192016 2017 2020
12.7Bn 4G license payment
853.7
Total
Figures in BDT Bn.
Sensitivity: Open
2020
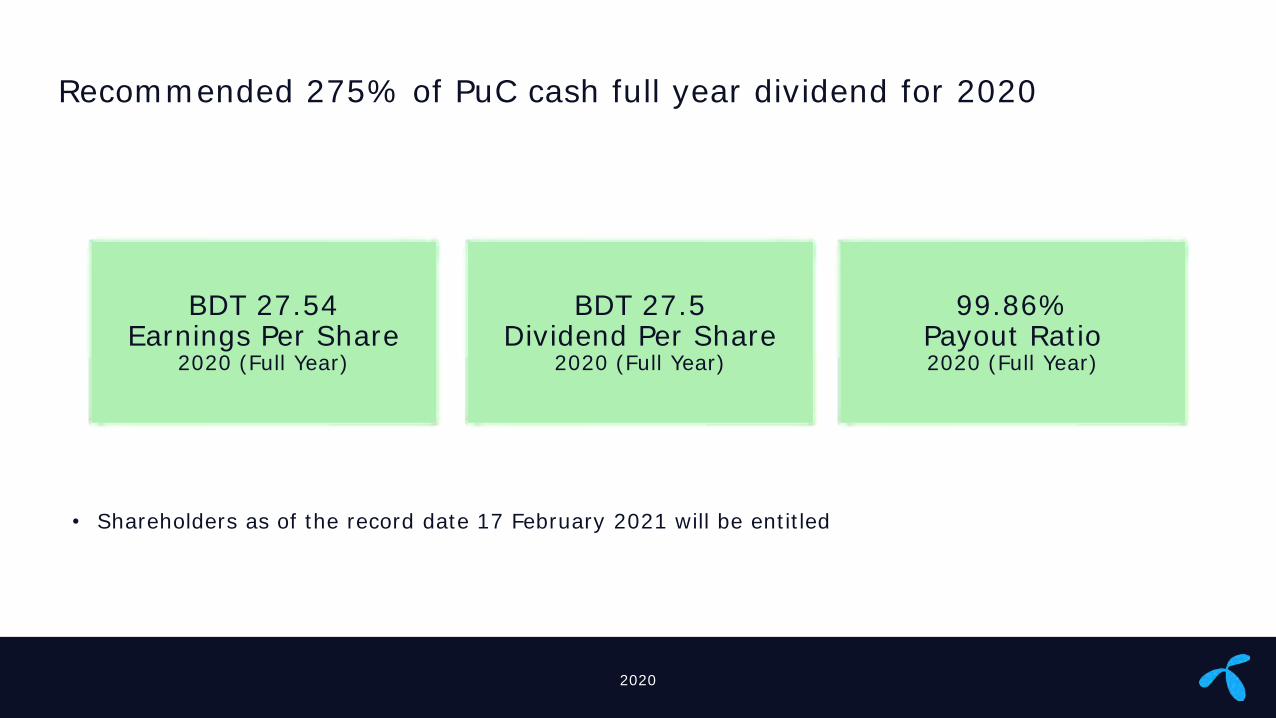
Recommended 275% of PuC cash full year dividend for 2020
BDT 27.5Dividend Per Share
2020 (Full Year)
99.86%Payout Ratio2020 (Full Year)
BDT 27.54Earnings Per Share
2020 (Full Year)
• Shareholders as of the record date 17 February 2021 will be entitled

Sensitivity: Open
Strong resilience in managing unforeseen challenges have paved the foundation for 2021, many uncertainties remain
We are dedicated to using our technology expertise and digital know-how in supporting recovery from COVID-19
Technology leadership and superior customer experience supported by strong digital distribution are key value drivers for future growth
Q4 2020

Sensitivity: Open
Thank You
Q4 2020
*In consideration of the local regulations, Grameenphone Ltd. does not provide any forward looking statements.