TELECOM NEW ZEALAND Q2 FY10 RESULT...
41
TELECOM NEW ZEALAND Q2 FY10 RESULT BRIEFING Chief Executive Officer – Paul Reynolds Chief Financial Officer – Russ Houlden
Transcript of TELECOM NEW ZEALAND Q2 FY10 RESULT...

TELECOM NEW ZEALAND
Q2 FY10 RESULT BRIEFING
Chief Executive Officer – Paul ReynoldsChief Financial Officer – Russ Houlden
TELECOM NEW ZEALAND > Q2 FY10 2
CONTENTS
Paul Reynolds
Key messages
Market trends
Mobile
Business unit performance
Russ Houlden
Economy
Group financials
Paul Reynolds
Transformation
Regulation
Guidance

Key messages, market trends, mobile, and business unit performance

TELECOM NEW ZEALAND > Q2 FY10 4
GROUP Q2 FY10 KEY MESSAGES
Group Adjusted EBITDA 1.7% up on Q2 FY09, includes Southern Cross dividends of $9m
Full year adjusted Group EBITDA guidance of -1 to +2% maintained
Now expect to be in lower half of range, reflecting continued impacts of the economic downturn and XT mobile outage
Outcomes delivered in quarter
60k connection growth in mobile
Retail 64% of Broadband connection growth
Continued strong reduction in fixed line churn
IT Solutions margin up from 6% to 8% (vs Q2 FY09)
Cost out on track
All enforceable undertakings milestones met
Most complicated quarter to date
2 detailed UFB proposals submitted post quarter end

TELECOM NEW ZEALAND > Q2 FY10 5
1 million Broadband connections in the NZ market
Rate of market growth slowing
Q2 a ‘slow’ quarter as market focused on mobile for Xmas
Retail 64% of net connection growth, market share at 57%
BROADBAND MARKET TRENDS
Note – Q2 data is based on a combination of IDC and Telecom estimates. “Other Network” assumed to be constant in quarter. All UCLL connections are assumed to be Broadband connectionsNote – includes all fixed line and cable Broadband, excludes mobile Broadband

TELECOM NEW ZEALAND > Q2 FY10 6
MOBILE MARKET TRENDS
Q1 share of revenue stable at ~39%
Telecom connections up 60k in quarterPostpaid connections fell 3k
Driven by migration of CDMA Go One Bill customers to XT prepaid
Prepaid connections up 63kDriven by strong Xmas sales
2 Degrees gaining share~15% of numbers ported to 2 Degrees came from Telecom*
*Sourced from NBR which quotes 2 Degrees press release

TELECOM NEW ZEALAND > Q2 FY10 7
XT MOBILE (RETAIL & GEN-i)
NZ mobile revenue 2.5% higher than Q2 FY09
467k XT connections at 31 December
57% postpaid customers
47% new acquisition
Stimulation campaigns increased Consumer usage
Data ARPU up 19% vs Q2 09
Gen-i delivered significant transitions to XT
Roaming revenues up 111% vs Q2 09
Q2 Key Points
TELECOM NEW ZEALAND > Q2 FY10 8
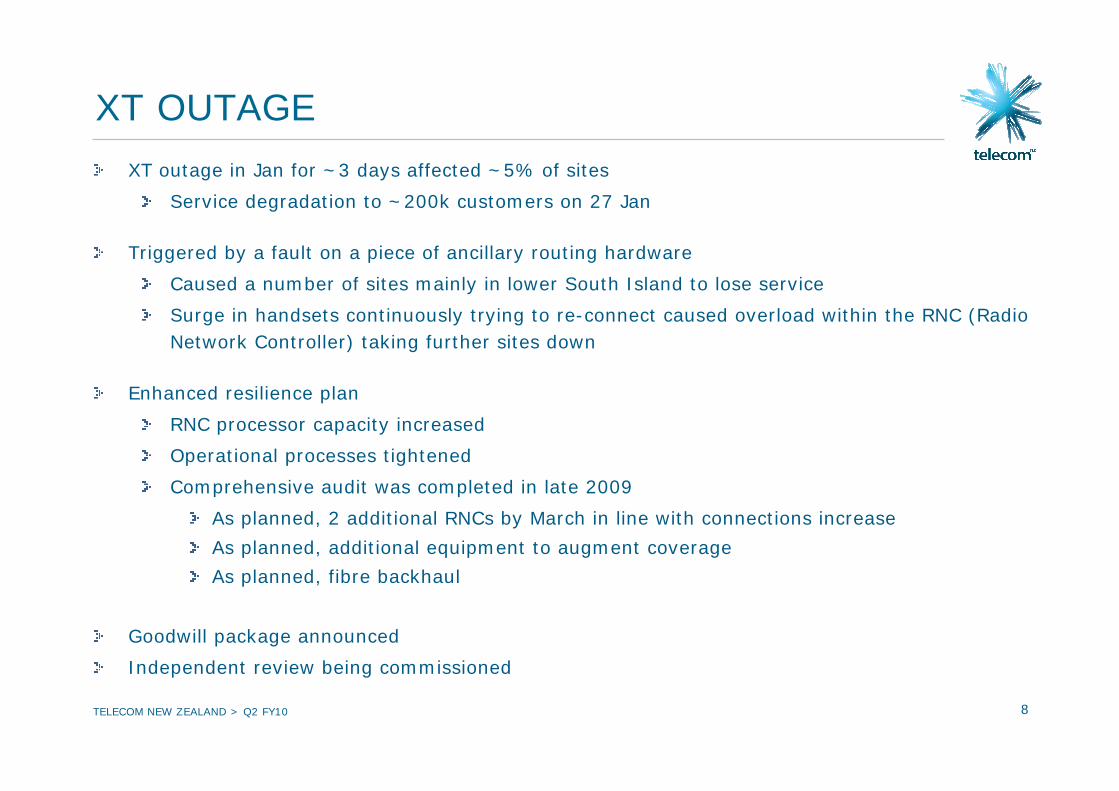
XT OUTAGE
XT outage in Jan for ~3 days affected ~5% of sites
Service degradation to ~200k customers on 27 Jan
Triggered by a fault on a piece of ancillary routing hardware
Caused a number of sites mainly in lower South Island to lose service
Surge in handsets continuously trying to re-connect caused overload within the RNC (Radio Network Controller) taking further sites down
Enhanced resilience plan
RNC processor capacity increased
Operational processes tightened
Comprehensive audit was completed in late 2009
As planned, 2 additional RNCs by March in line with connections increase
As planned, additional equipment to augment coverage
As planned, fibre backhaul
Goodwill package announced
Independent review being commissioned

TELECOM NEW ZEALAND > Q2 FY10 9
XT MOBILE (RETAIL & GEN-i)
Plan Q3/4
Network HSPA+ fully completedCoverage optimisation and network optimisationImplement XT resilience plan
RetailEnhance customer service experience New pricing innovation, offering targeted price and value New smartphone devices - Google Android phoneDrive mobile Broadband via One to One training sessions
Gen-iLaunch Gen-i mobile officeLeverage HSPA+ and new mobile Broadband pricingIncrease penetration of smart devices to deliver ARPU growth

TELECOM NEW ZEALAND > Q2 FY10 10
RETAIL HOME
Home access churn continues to improveFixed to mobile calling caps launchedRefreshed family of Total Home bundles launched
Broadband churn stable 65% of Broadband customers in contractTiVo launched
Broadband Aggregation regulatory milestone met
Renewed focus on International CallingSecure low/mid tier market with high value bundlesNGT Business trial and launch readinessDrive awareness of TiVo and expand channels
Q2 Key Points
Plan Q3/4

TELECOM NEW ZEALAND > Q2 FY10 11
RETAIL OFFICE
Contracting improving Business line access churn
Upgrades to Business Broadband driving reduced churn
Strong XT mobile acquisition
Focus on increasing whole of business sales
Further development of the Business Broadband portfolio
Pilot new channel approach
Launch further Hub services
Q2 Key Points
Plan Q3/4
TELECOM NEW ZEALAND > Q2 FY10 12
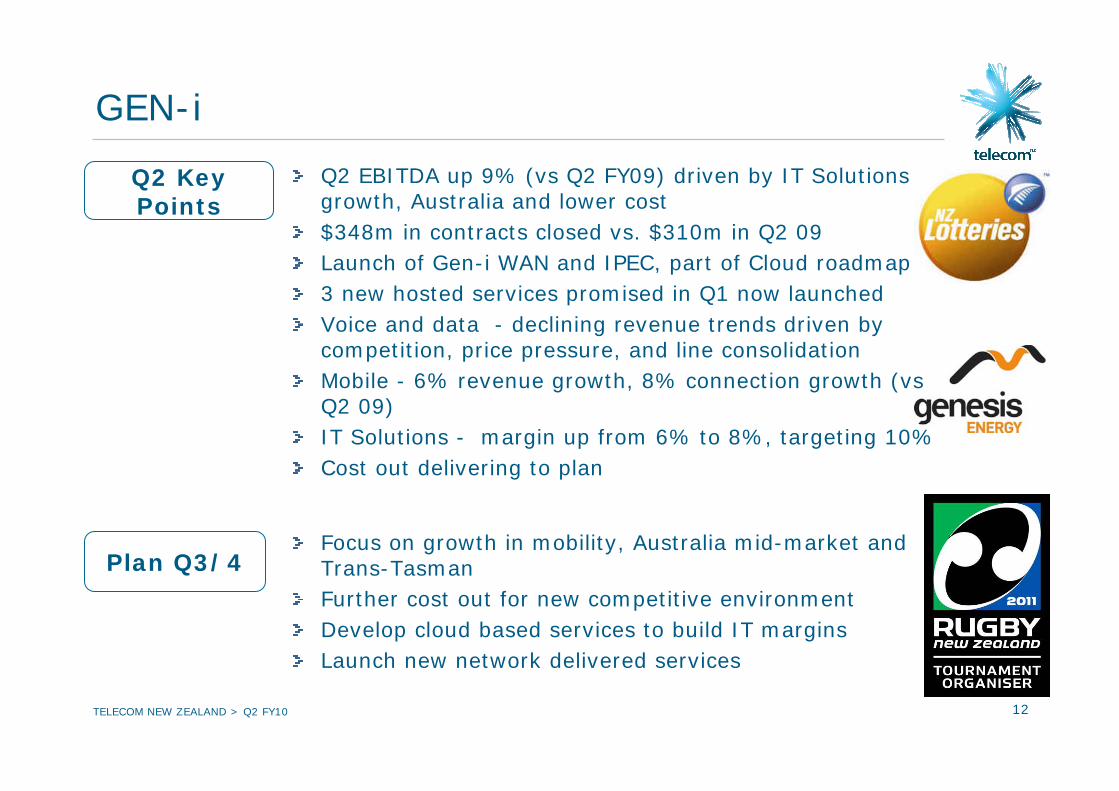
Q2 EBITDA up 9% (vs Q2 FY09) driven by IT Solutions growth, Australia and lower cost$348m in contracts closed vs. $310m in Q2 09Launch of Gen-i WAN and IPEC, part of Cloud roadmap3 new hosted services promised in Q1 now launched Voice and data - declining revenue trends driven by competition, price pressure, and line consolidationMobile - 6% revenue growth, 8% connection growth (vsQ2 09)IT Solutions - margin up from 6% to 8%, targeting 10%Cost out delivering to plan
Focus on growth in mobility, Australia mid-market and Trans-TasmanFurther cost out for new competitive environmentDevelop cloud based services to build IT marginsLaunch new network delivered services
GEN-i
Q2 Key Points
Plan Q3/4

TELECOM NEW ZEALAND > Q2 FY10 13
All service company issues resolved
Achieved all Dec 2009 enforceable Undertakings milestones
TelstraClear launched UCLL based services
970,000 customers able to access Broadband at 10Mbps +
Advertising campaign to drive awareness of FTTN programme
Continue work on the Government’s UFB Initiative
Launch of commercial field service products
Increase public awareness of FTTN programme
Support additional UCLL launches
CHORUS
Q2 Key Points
Plan Q3/4

TELECOM NEW ZEALAND > Q2 FY10 14
WHOLESALE & INTERNATIONAL
Q2 Key Points
Plan Q3/4
VDSL2 pilot – 10 additional exchangesSubstantial system and process enhancementAll enforceable undertaking milestones metEnhanced UBA service extensions deliveredCost out programs delivering to planEBITDA down 1.6% (vs Q2 09) as Chorus cabinet related input costs outpace revenue growth
International EBITDA improved via focus on costs
WCDMA Network MVNO Q4Seeking regulatory clarity post loyalty decisionSecure key growth opportunities in the ethernet and mobile backhaul marketsInternational voice and other deal developmentWholesale FMO development & undertakings commitments

TELECOM NEW ZEALAND > Q2 FY10 15
EBITDA of A$27m, underlying EBITDA flat at A$22mContinued focus on cost outStrong new sales in Business and WholesaleBusiness introduced “AAPT Applications powered by Google”Consumer contracting driving churn reduction
AAPT
Q2 Key Points
Plan Q3/4Further opex reductionContinuation of the Roadie campaignIncrease portion of consumer base on contracts Drive growth through the unlimited Broadband plansInvestment in ADSL2+ and Mid Band Ethernet coverage

Group Financials

TELECOM NEW ZEALAND > Q2 FY10 17
Economic impact up to $10m per quarter
Southern Cross dividend of $9m
Investments in HTAL and TMT Ventures re-valued following adoption of IFRS 9
Adjusted Group EBITDA and NPAT guidance maintained
Now expect to be in lower half of range
Capex on track for full year guidance
KEY FINANCIAL MESSAGES

TELECOM NEW ZEALAND > Q2 FY10 18
Impact in Q2 of up to $10m EBITDA, YTD up to $20m EBITDA
Impacts evident in market facing business units
Retail – Consumer and SME
Gen-i – affected industry segments include Finance, Real Estate, Manufacturing, Retail, Transport, IT & Telecommunications and Public Sector
Chorus – lower subdivision revenues
Unemployment has risen to 7.3%
ECONOMY

TELECOM NEW ZEALAND > Q2 FY10 19
INCOME STATEMENT - REPORTED
Six months ended 31 Dec 2009
$M
2008
$M
Change
%
Revenue 2,671 2,858 -6.5
Expenses (1,799) (2,075) -13.3
EBITDA 872 783 11.4
Depreciation & amortisation (510) (435) 17.2
EBIT 362 348 4.0
Net finance expense (85) (96) -11.5
Share of associates’ losses - - -
Income tax expense (34) (89) -61.8
Net Earnings 243 163 49.1
Net earnings attributable to shareholders 242 162 49.4
EPS 13 9 44.4
DPS 12 12 -

TELECOM NEW ZEALAND > Q2 FY10 20
INCOME STATEMENT - ADJUSTED
Six months ended 31 Dec 2009
$M
2008
$M
Change
%
Revenue 2,671 2,858 -6.5
Expenses (1,799) (1,974) -8.9
EBITDA 872 884 -1.4
Depreciation & amortisation (510) (435) 17.2
EBIT 362 449 -19.4
Net finance expense (85) (96) -11.5
Share of associates’ losses - - -
Income tax expense (34) (99) -65.7
Net Earnings 243 254 -4.3
Net earnings attributable to shareholders 242 253 -4.3
EPS 13 13 -
DPS 12 12 -

TELECOM NEW ZEALAND > Q2 FY10 21
INCOME STATEMENT - ADJUSTED
Quarter ended 31 Dec 2009
$M
2008
$M
Change
%
Revenue 1,315 1,407 -6.5
Expenses (890) (989) -10.0
EBITDA 425 418 1.7
Depreciation & amortisation (257) (219) 17.4
EBIT 168 199 -15.6
Net finance expense (49) (48) 2.1
Share of associates’ losses - - -
Income tax expense (39) (46) -15.2
Net Earnings 80 105 -23.8
Net earnings attributable to shareholders 80 105 -23.8
EPS 4 6 -33.3
DPS 6 6 -

TELECOM NEW ZEALAND > Q2 FY10 22
Q2 BUSINESS UNIT EBITDA (ADJUSTED)
425
8
(1)
28
60
82
62
186
$ M
Quarter ended 31 Dec 09Six months ended 31 Dec 09
$ M Change % Change %
Chorus 374 0.5% -
Wholesale & International 123 0.8% -1.6%
Retail 173 -11.7% -7.9%
Gen-i 100 -10.7% 9.1%
AAPT 66 29.4% -
T&SS - NM -
Corporate 36 12.5% NM
Total EBITDA 872 -1.4% 1.7%

TELECOM NEW ZEALAND > Q2 FY10 23
COST OUT - UPDATE
May 2009 Investor Day Long Term Plan FY08 to FY13
Cost increases of $782m
Cost out of $524m
Cumulative cost out programmes
FY09 $113m delivered
FY10 $244m on track

TELECOM NEW ZEALAND > Q2 FY10 24
TAX - UPDATE
New Bill before parliament
Potential impacts
Extra $20-30m tax charge FY10
Extra $20-30m tax payment FY11
We will account for it and change Guidance only if/when
“substantively enacted”

TELECOM NEW ZEALAND > Q2 FY10 25
FINANCIAL POSITION
31 Dec 09
$M
30 June 09
$M
Cash 296 261
Other current assets 785 927
Non current assets 5,543 5,848
Total Assets 6,624 7,036
Current liabilities 1,276 1,483
Non current liabilities 2,767 2,837
Minority interests 5 5
Equity attributable to shareholders 2,576 2,711
Total Liabilities & Equity 6,624 7,036
Net debt/EBITDA1 1.5x 1.5x
1 = Adjusted EBITDA calculation based on last 12 months
Standard and Poor’s A (Outlook stable)Moody’s Investor Service A3 (Outlook stable)

TELECOM NEW ZEALAND > Q2 FY10 26
CASH FLOW
Six months ended 31 Dec 2009
$M
2008
$M
Cash flows from Operating Activities 818 692
Cash flows from Investing Activities (574) (692)
Cash flows from Financing Activities (191) (551)
Foreign exchange movement (18) 82
Net movement in cash 35 (469)
TELECOM NEW ZEALAND > Q2 FY10 27
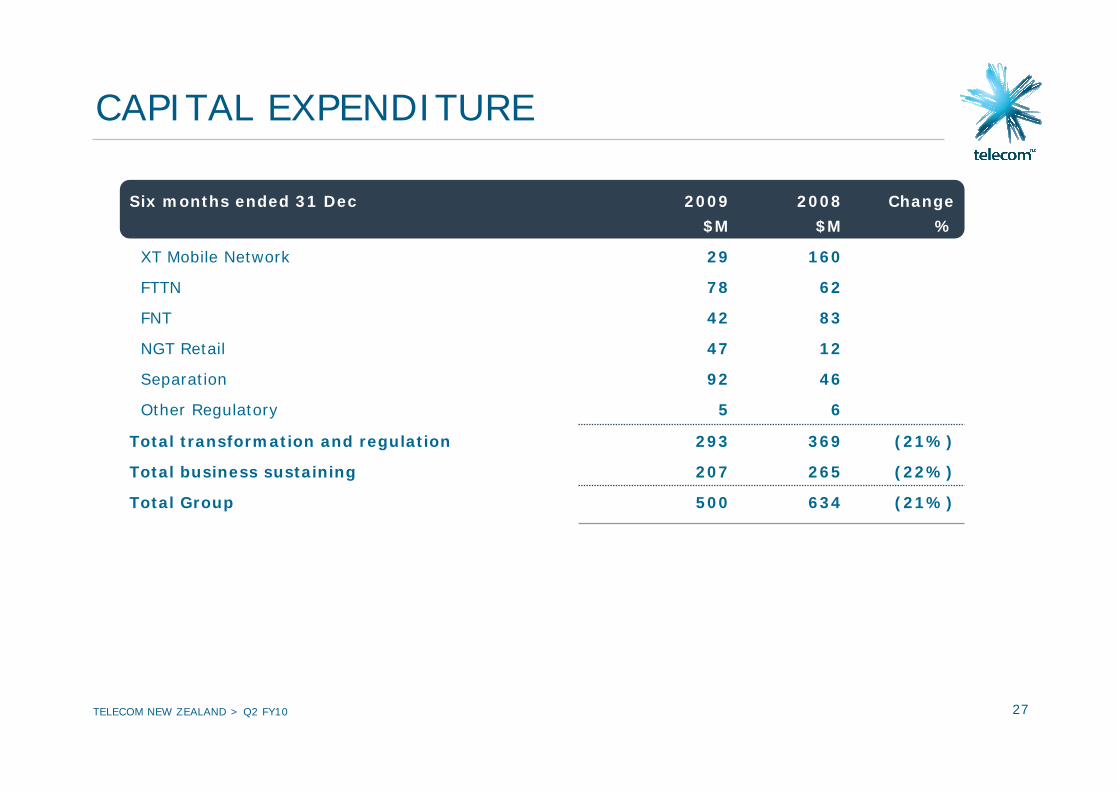
CAPITAL EXPENDITURE
Six months ended 31 Dec 2009
$M
2008
$M
Change
%
XT Mobile Network 29 160
FTTN 78 62
FNT 42 83
NGT Retail 47 12
Separation 92 46
Other Regulatory 5 6
Total transformation and regulation 293 369 (21%)
Total business sustaining 207 265 (22%)
Total Group 500 634 (21%)

TELECOM NEW ZEALAND > Q2 FY10 28
FINANCING
Net Debt / EBITDA not to exceed 1.7x
DRP – Q2 discount 2% (previously 3%)
No need to borrow long term in 2010

Transformation and Regulation

TELECOM NEW ZEALAND > Q2 FY10 30
SEPARATION TRANSFORMATION
Deliver the Separation Undertakings milestones
Q2 milestones achieved
108 Undertakings milestones delivered to date
All 13 enforceable milestones achieved in Q2
Purpose
Status
Delivered
BUBA/EUBA consumed by Telecom Business Units as input in the supply of Retail Broadband services
Telecom will offer IP Trunking service that consumes HSNS as an input
Jun 10UCLL consumed by BUBA/EUBA
Dec 09 requirements met for UCLL Backhaul
DeliveryEnforceable Milestones
UBA Backhaul consumed by Retail
Broadband resale equivalence (Access to service company schedules )
PSTN number reservation available
EUBA without POTS (50% of lines)
Resale equivalence for ISDN
BUBA/EUBA consumed by Outlier services
One Office stop sell
Stop sell Legacy Data Services
Jun 10UCLL Backhaul consumed by BUBA/EUBA
Jun 10Core FMO Capability Requirements met for BUBA/EUBA
Jun 10PSTN migration progress report
UCLL consumed by Frame Relay
Dec 09 requirements met for UCLL

TELECOM NEW ZEALAND > Q2 FY10 31
WHOLESALE FMO TRANSFORMATION
New Fault Management and Test Tools introduced
enables an improved service experience
Covers all Wholesale products (except Interconnection)
Capabilities include:
Improved fault status reporting
B2B option introduced
Integration between Wholesale and Chorus
Network test tools
Ability to book a field service call directly
Truck rolls per install base p.a.5% 2.5%
Mean Time to Repair (truck roll)2.5 days 1.5 days
‘No fault found’ truck rolls38% 10%
Repeat trouble tickets received14% 5%
Forecast Benefits

TELECOM NEW ZEALAND > Q2 FY10 32
FIXED NETWORK TRANSFORMATION
Build and migrate services to an all IP Network to support customer innovation and efficiency
Q2 milestones achieved
IPEC successfully achieved end customer trial with calls being placed to PSTN and Mobile NetworksDecember enforceable milestone met with IP Trunking services offered commercially
Purpose
Status
Delivered
Commercially offered IPEC Trunking service consuming HSNS (High Speed Network Service) (a Wholesale input)
IPEC End User Customer Network Trial complete (IP Trunking solution for Enterprises, Network Only)
Apr 10IP Centrex network design complete
External trial of PLV (to enable Retail to offer VoIP services via a Residential Gateway)
DeliveryMilestone

TELECOM NEW ZEALAND > Q2 FY10 33
NGT RETAIL TRANSFORMATION
Create a new lower cost operating model for Retail that underpins world class customer satisfaction
Q2 enforceable milestones achieved
Release 1.3 Design and Build readyAll new Broadband services offered commercially on either BUBA or EUBA
Purpose
Status
Delivered
End customer trials for Retail PLV based on EUBA and Residential Gateway (to enable Retail to offer VoIP services via a Residential Gateway)
All new Broadband moves and adds on BUBA or EUBA equivalent inputs (to provide equivalent provisioning capability)
Apr 10Business trial of final launch capability
Release 1.3 Design and Build ready (software release to improve customer management functionality)
DeliveryMilestone
TELECOM NEW ZEALAND > Q2 FY10 34
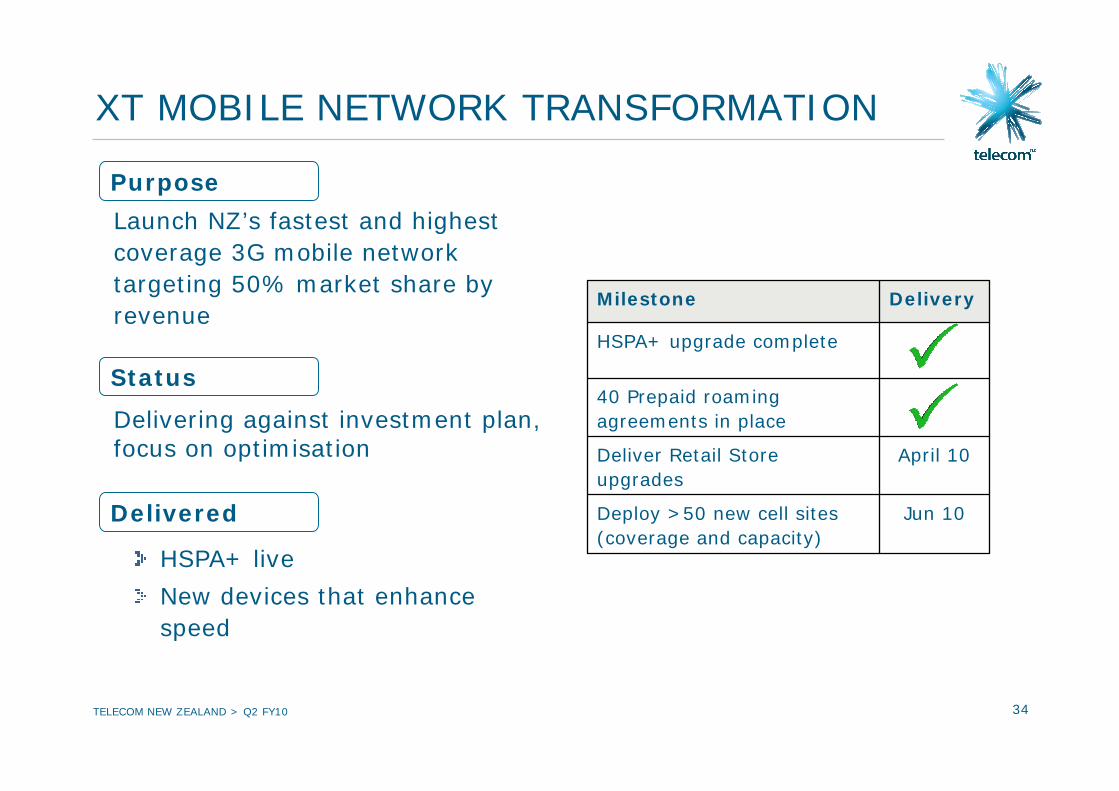
XT MOBILE NETWORK TRANSFORMATION
Launch NZ’s fastest and highest coverage 3G mobile network targeting 50% market share by revenue
Delivering against investment plan, focus on optimisation
HSPA+ live
New devices that enhance speed
Purpose
Status
Delivered
40 Prepaid roaming agreements in place
April 10Deliver Retail Store upgrades
DeliveryMilestone
HSPA+ upgrade complete
Jun 10Deploy >50 new cell sites (coverage and capacity)
TELECOM NEW ZEALAND > Q2 FY10 35
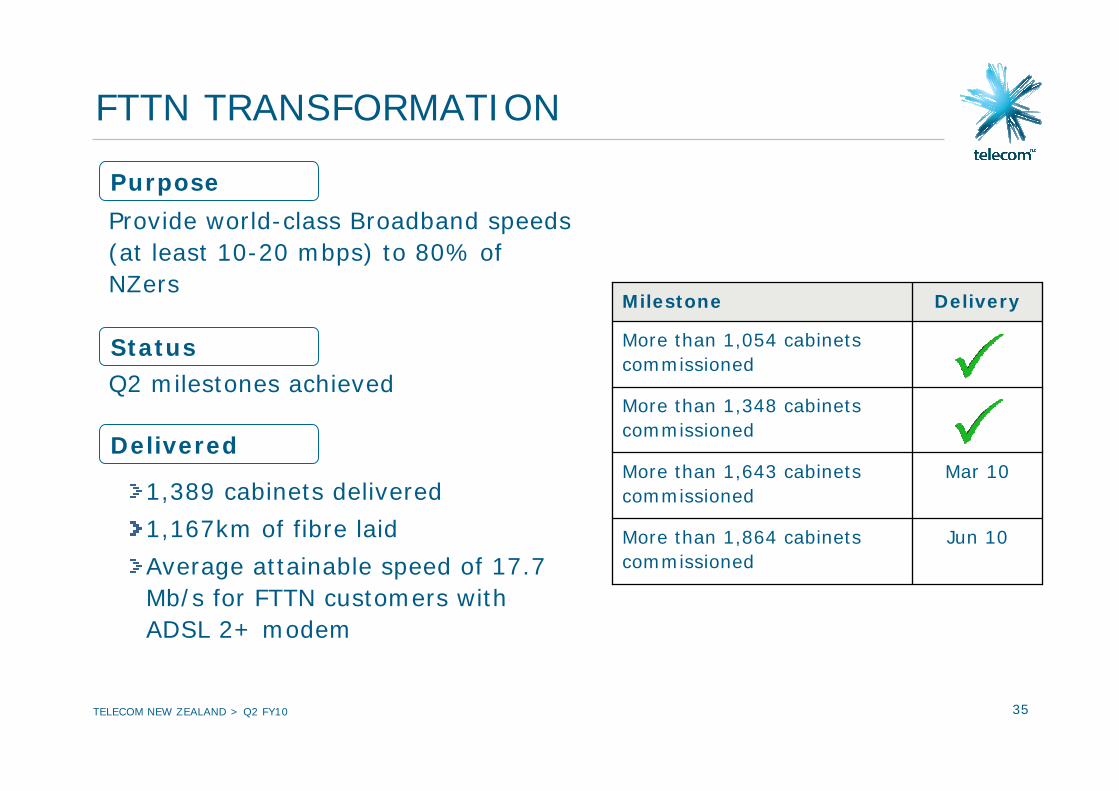
FTTN TRANSFORMATION
Provide world-class Broadband speeds (at least 10-20 mbps) to 80% of NZers
Q2 milestones achieved
1,389 cabinets delivered
1,167km of fibre laid
Average attainable speed of 17.7 Mb/s for FTTN customers with ADSL 2+ modem
Purpose
Status
Delivered
More than 1,054 cabinets commissioned
More than 1,348 cabinets commissioned
Mar 10More than 1,643 cabinets commissioned
Jun 10More than 1,864 cabinets commissioned
DeliveryMilestone

TELECOM NEW ZEALAND > Q2 FY10 36
PUBLIC POLICY AND REGULATIONConstructive engagement
Strong focus on UFB, TSO and RBI regulatory design and driving regulatory simplificationPowerful proposals submitted on UFBResolution of TSO/Rural Broadband Initiative in a form consistent with UFB Rationalisation of unnecessary existing regulation Self-regulation
Wholesale pricingPleased to see Commission consultation on guidelines for Wholesale and Chorus non-discrimination rulesFocus on achieving a set of guidelines that permits appropriate commercial differentiation in pricing offers
MTR We maintain a strong preference for a commercial resolution, outcome now expected by end of Q3 FY10
Resale regulationCommerce Commission investigation into removal of unnecessary resale regulation underway, decisions expected in FY11
VDSLRequest for Commission to clarify the application of existing layer 2 regulation to VDSL

TELECOM NEW ZEALAND > Q2 FY10 37
ULTRA FAST BROADBANDTelecom made two detailed submissions on 29 January 2010
Preferred Commercial Model proposal:Fully compliant
Alternative Commercial Model proposal:A national network using our FTTN programme as the logical springboard for the Government’s vision of fibre-to-the-home (FTTH)Leverages Chorus expertise Minimal waste
Proposals align incentives and investment plans of government and shareholders
Telecom is open to discussing alternative proposals that are in the best interests of all stakeholders
33 proposals submitted to Crown Fibre Holdings
This is a complex process and therefore the timing of a decision is uncertain

TELECOM NEW ZEALAND > Q2 FY10 38
FY10 GUIDANCE
Adjusted Group EBITDA of -1 to +2%, Now expect to be in lower half of range, reflecting continued impacts of the economic downturn and XT mobile outage
Southern Cross dividends of NZ$50m to NZ$80m
Group depreciation & amortisation approximately NZ$1.00 billion to $1.06 billion
Adjusted effective tax rate of around 25% Subject to changes in tax legislation
Adjusted Group Net Earnings NZ$400m to $440mNow expect to be in lower half of rangeSubject to changes in tax legislation
Group Capital Expenditure of $1.1 billion to $1.2 billion
TELECOM NEW ZEALAND > Q2 FY10 39
FY11 – FY13 GUIDANCE
Adjusted Group EBITDA of +4 to +6%, Subject to potential regulatory risks arising from proposals on Ultra Fast Broadband, Rural Broadband and Telecommunications Service Obligations
FY11 effective tax rate around 30-32%; and FY12 onwards effective tax rate 25-30%
FY13 Group capital expenditure of around $0.75 billionSubject to potential regulatory risks

TELECOM NEW ZEALAND > Q2 FY10 40
DISCLAIMER
Forward-Looking StatementsThis presentation includes forward-looking statements within the meaning of the U.S. Private Securities Litigation Reform Act of 1995 regarding future events and the future financial performance of Telecom. These forward-looking statements are not guarantees or predictions of future performance, and involve known and unknown risks, uncertainties and other factors, many of which are beyond Telecom’s control, and which may cause actual results to differ materially from those expressed in the statements contained in this presentation. Factors that could cause actual results or performance to differ materially from those expressed or implied in the forward-looking statements are discussed in the second quarter management commentary and in the risk factors and forward-looking statement disclaimer in Telecom’s annual report on Form 20-F for the year ended 30 June 2009 filed with the U.S. Securities and Exchange Commission. Except as required by law or the listing rules of the stock exchanges on which Telecom is listed, Telecom undertakes no obligation to update any forward-looking statements whether as a result of new information, future events or otherwise.
Non-GAAP Financial MeasuresTelecom results are reported under International Financial Reporting Standards (IFRS). The non-GAAP financial measures used in this presentation includes, but are not limited to:
Earnings before interest, tax, depreciation and amortisation (‘EBITDA’). Telecom calculates EBITDA by adding back depreciation, amortisation, finance expense, share of associates’ losses and taxation expense to net earnings/(loss) from continuing operations less finance income; andAverage Revenue per User (‘ARPU’). Telecom calculates ARPU as mobile voice and data revenue for the period divided by the average number of customers for the period. This is then divided by the number of months in the period to express the result as a monthly figure.
Telecom believes that these non-GAAP financial measures provide useful information, but that they should not be viewed in isolation, nor considered as a substitute for measures reported in accordance with IFRS.

TELECOM NEW ZEALAND
Q2 FY10 RESULT BRIEFING
Chief Executive Officer – Paul ReynoldsChief Financial Officer – Russ Houlden