Telecom Equipment Industry - Handset Manufacturing
10
Telecom Equipment Industry Introduction Indian telecom is the fastest growing telecom industry in the world Liberal Government policies Growing at an average rate of 16% per annum since 2003 Telecommunications sectors attracting a major chunk of the FDI to India 2008-09 20% growth 2007-08 24% growth 2006-07 43.5% growth
Transcript of Telecom Equipment Industry - Handset Manufacturing

8/14/2019 Telecom Equipment Industry - Handset Manufacturing
http://slidepdf.com/reader/full/telecom-equipment-industry-handset-manufacturing 1/10
Telecom Equipment Industry
IntroductionIndian telecom is the fastest growing telecom industry in the world
Liberal Government policies
Growing at an
average rate of
16% per annum
since 2003
Telecommunications sectors attracting a major chunk of the FDI to India
2008-09 20% growth
2007-08 24% growth
2006-07 43.5% growth
8/14/2019 Telecom Equipment Industry - Handset Manufacturing
http://slidepdf.com/reader/full/telecom-equipment-industry-handset-manufacturing 2/10
Top 10 Indian Telecom Equipment Players
Company Revenue (In Rs Crore) Growth (%) 07-08 Rank
FY 07-08 FY 08-09
Nokia 15000 16567 10 1
Ericsson 8000 10310 29 2
Nokia Siemens Networks 7779 9840 26 3
Alcatel Lucent 7000 8050 15 4
Wipro 5585 5692 2 5
Cisco 5046 4693 -7 6
TCS 3978 4233 6 7Infosys 3605 3926 9 8
ZTE 3000 4800 60 9
Huawei 2700 6240 131 New
Source: Cybermedia's Voice&Data Annual June 2009
8/14/2019 Telecom Equipment Industry - Handset Manufacturing
http://slidepdf.com/reader/full/telecom-equipment-industry-handset-manufacturing 3/10
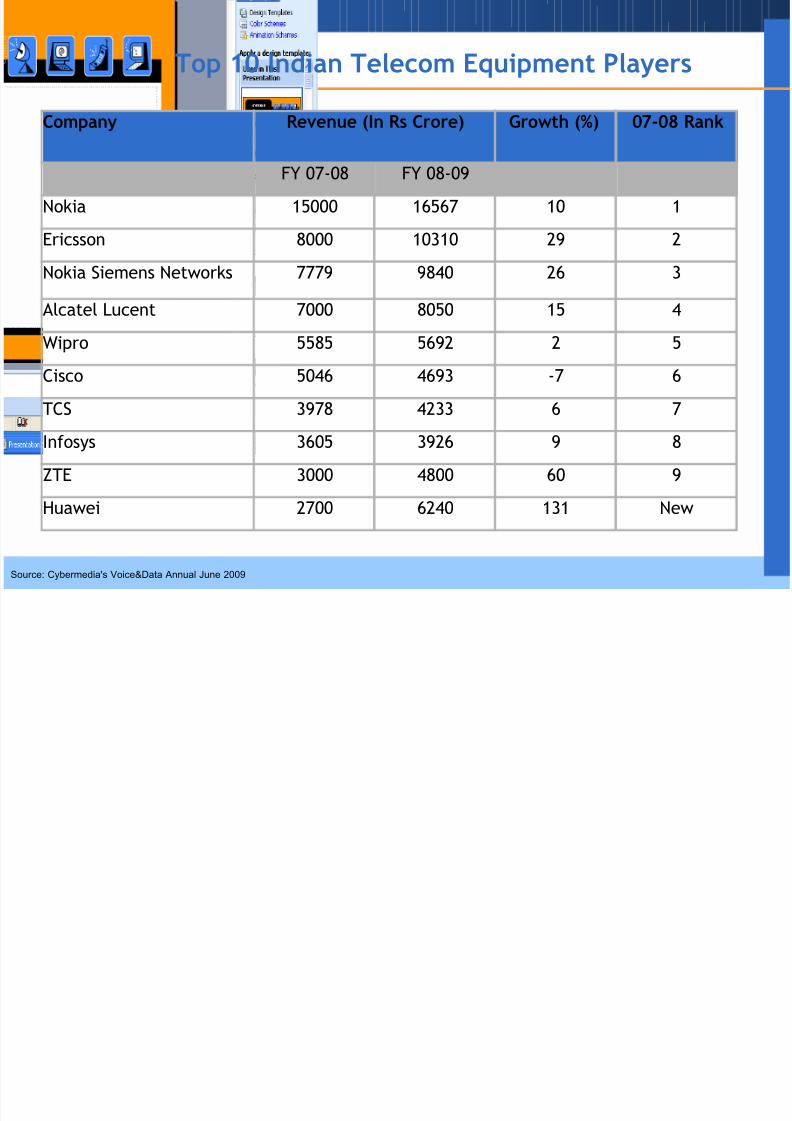
Market Segments
EnterpriseEquipment
PhonesCarrier
Equipment
Voice Solutions, Routers, Switches, Structured cabling,Modem, Audio Video Conferencing, Network Storage
Broadband infrastructureWireless infrastructureTelecom software
TransmissionCables, WiMAX
Mobile Handsets
Fixed Phones
8/14/2019 Telecom Equipment Industry - Handset Manufacturing
http://slidepdf.com/reader/full/telecom-equipment-industry-handset-manufacturing 4/10
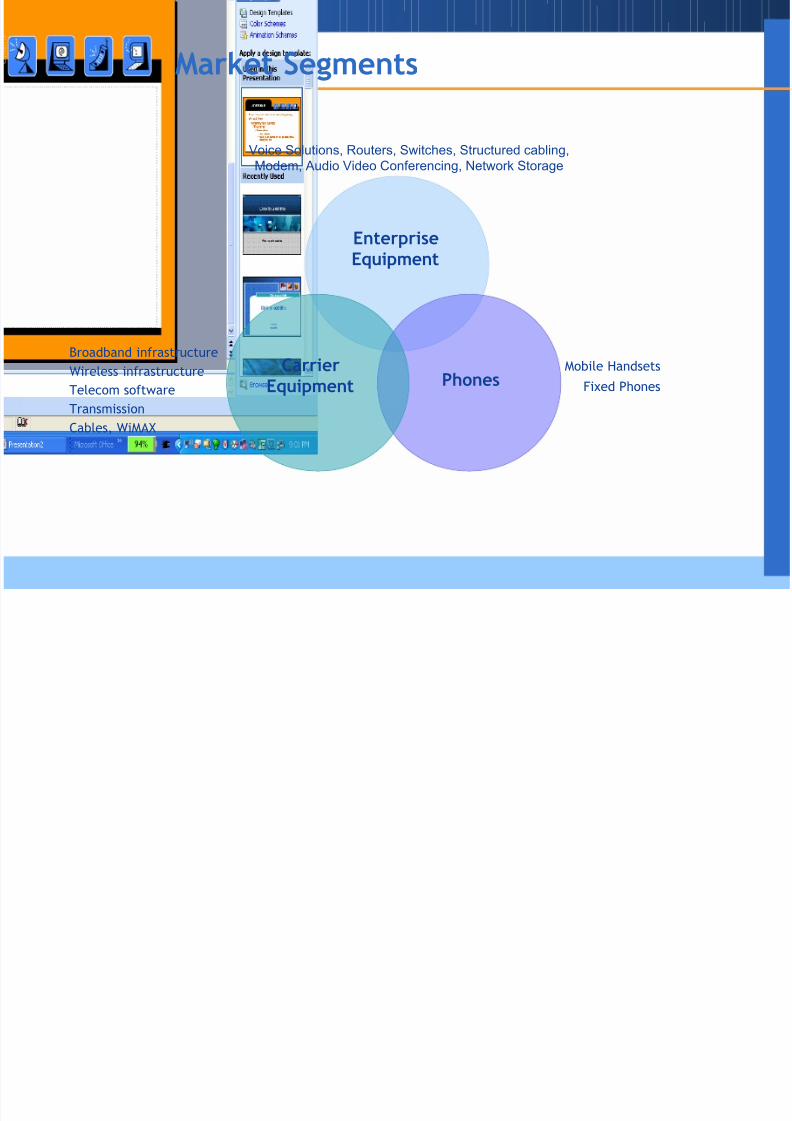
Top 10 Mobile Handset Players in 2008-09
Source: Cybermedia's Voice&Data Annual June 2009
Company FY 07-08 FY 08-09 Growth (%) Market Share
Nokia 15000 16567 10% 64
Samsung 1500 2590 73% 10
Sony Ericsson 3083 1555 -50% 6
ZTE 850 1440 69% 5.6
LG 1500 1165 -22% 4.5
Motorola 1200 906 -25% 3.5
Haier 300 388 29% 1.5
Huawei 320 360 13% 1.3
Others 250 939 275% 3.6
Total 24003 25909 8% 100
Revenues in Crores
8/14/2019 Telecom Equipment Industry - Handset Manufacturing
http://slidepdf.com/reader/full/telecom-equipment-industry-handset-manufacturing 5/10
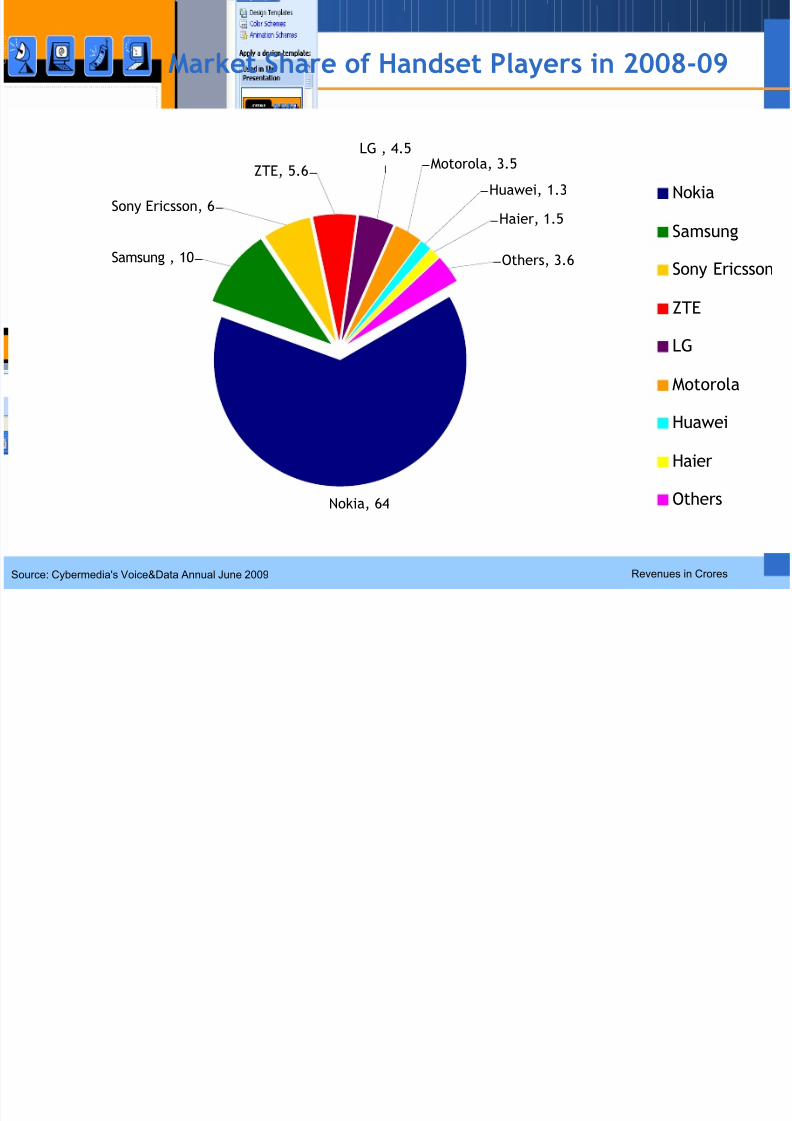
Market Share of Handset Players in 2008-09
Source: Cybermedia's Voice&Data Annual June 2009 Revenues in Crores
Nokia, 64
Huawei, 1.3
Haier, 1.5
Others, 3.6
Motorola, 3.5LG , 4.5
ZTE, 5.6
Sony Ericsson, 6
Samsung , 10
Nokia
Samsung
Sony EricssonZTE
LG
Motorola
Huawei
Haier
Others
8/14/2019 Telecom Equipment Industry - Handset Manufacturing
http://slidepdf.com/reader/full/telecom-equipment-industry-handset-manufacturing 6/10
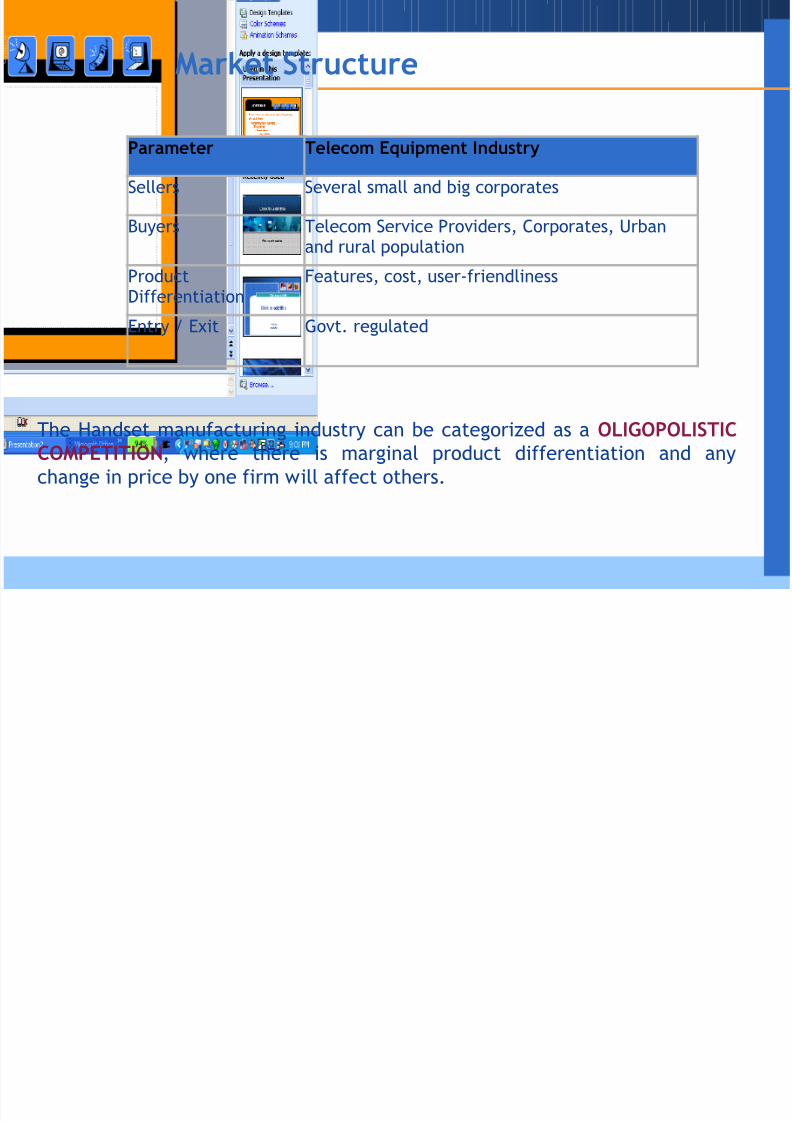
Market Structure
Parameter Telecom Equipment Industry
Sellers Several small and big corporates
Buyers Telecom Service Providers, Corporates, Urbanand rural population
ProductDifferentiation
Features, cost, user-friendliness
Entry / Exit Govt. regulated
The Handset manufacturing industry can be categorized as a OLIGOPOLISTICCOMPETITION, where there is marginal product differentiation and anychange in price by one firm will affect others.

8/14/2019 Telecom Equipment Industry - Handset Manufacturing
http://slidepdf.com/reader/full/telecom-equipment-industry-handset-manufacturing 7/10
Demand for Mobile Handsets in India
The ICA estimates the Indian handset market to have a volume of 130 million units this year worth Rs. 30,000 crores, up from 101million units in 2008 for a volume of Rs. 26,000 crores. In 2011, thehandset market is expected to touch a volume of 145 million and avalue of Rs. 35,000 crores. Source: Economic times
*ICA (The Indian Cellular Association), apex body of the range of mobileindustry players barring the mobile operators .
8/14/2019 Telecom Equipment Industry - Handset Manufacturing
http://slidepdf.com/reader/full/telecom-equipment-industry-handset-manufacturing 8/10
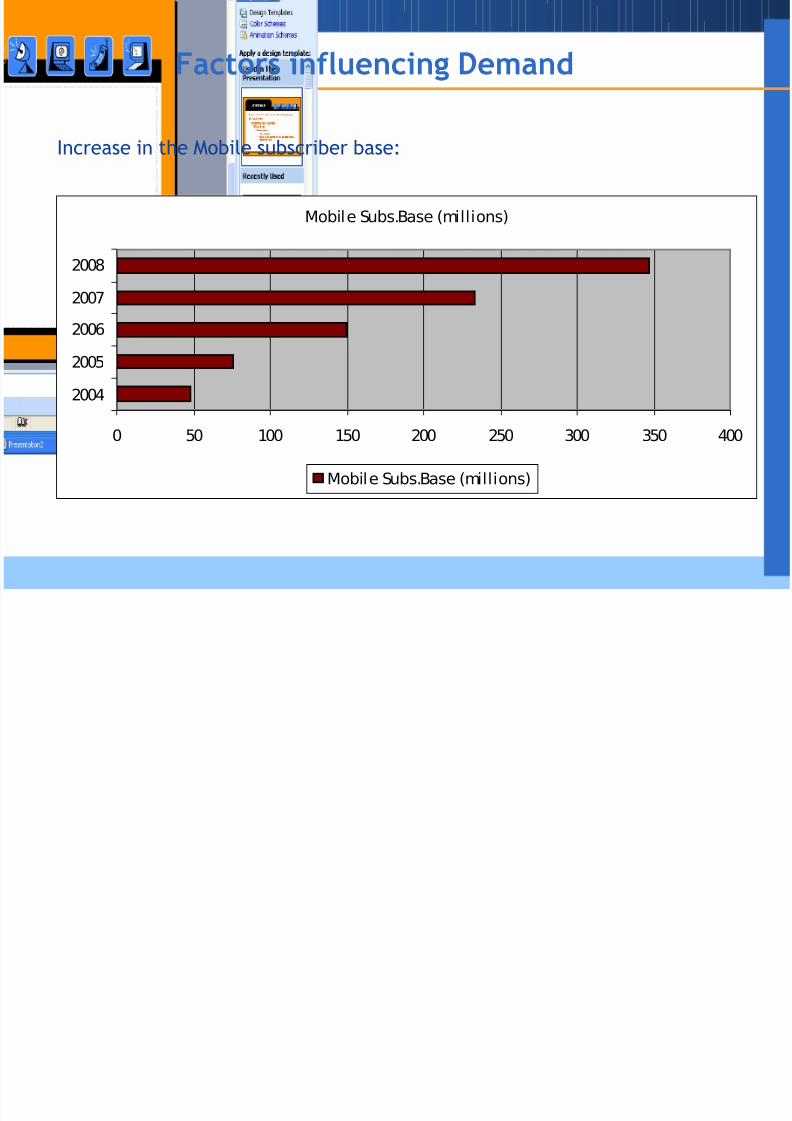
Factors influencing Demand
Increase in the Mobile subscriber base:
Mobile Subs.Base (millions)
0 50 100 150 200 250 300 350 400
2004
2005
2006
2007
2008
Mobile Subs.Base (millions)
8/14/2019 Telecom Equipment Industry - Handset Manufacturing
http://slidepdf.com/reader/full/telecom-equipment-industry-handset-manufacturing 9/10
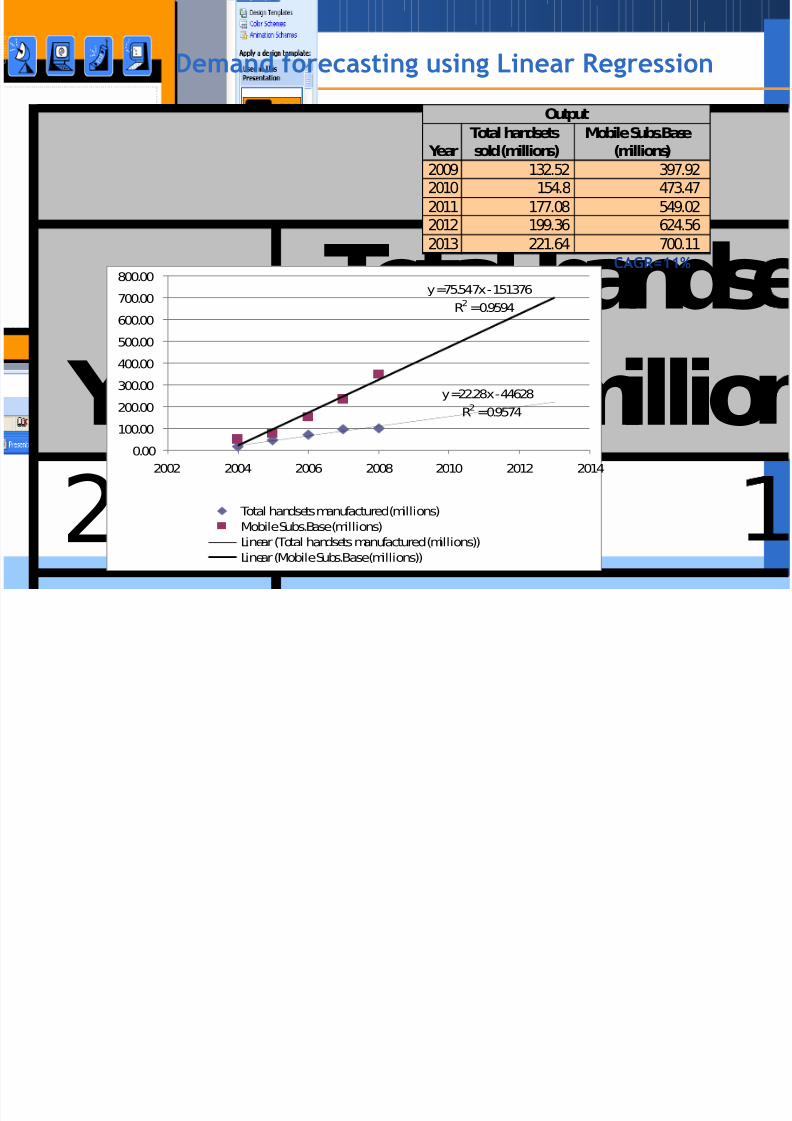
Demand forecasting using Linear Regression
Year
Total hands
sold (millio2004
Year Total handsetssold (millions) Mobile Subs.Base(millions)2009 132.52 397.92 2010 154.8 473.47 2011 177.08 549.02 2012 199.36 624.56 2013 221.64 700.11
Output
y =22.28x - 44628
R2
=0.9574
y =75.547x - 151376R2 =0.9594
0.00
100.00
200.00
300.00
400.00
500.00
600.00
700.00800.00
2002 2004 2006 2008 2010 2012 2014
Total handsets manufactured (millions)Mobile Subs.Base (millions)Linear (Total handsets manufactured (millions))Linear (Mobile Subs.Base (millions))
CAGR=11%

8/14/2019 Telecom Equipment Industry - Handset Manufacturing
http://slidepdf.com/reader/full/telecom-equipment-industry-handset-manufacturing 10/10
THANK YOU!!!