Telecom annual report 2012 newzealand
188
Embracing the future Telecom Corporation of New Zealand Limited Annual Report For the year ended 30 June 2012
-
Upload
smita-amin -
Category
Documents
-
view
1.512 -
download
1
Transcript of Telecom annual report 2012 newzealand

Embracing the future
Telecom Corporation of New Zealand LimitedAnnual ReportFor the year ended 30 June 2012
TELECOM
CORPO
RATION
OF N
EW ZEA
LAN
D LIM
ITED | A
NN
UA
L REPORT FO
R THE YEA
R END
ED 30 JU
NE 2012
investor.telecom.co.nzARBN 050 611 277

With customers at our heart we will become New Zealand’s most preferred company
OUR FY12 PERFORMANCE OUR COMPANY
OUR VISION
Our mission is:
To be number one in Mobile, Broadband, and ICT
We believe in:
People drive our successPassion for customersWorking together as oneActing with openness and integrity
Our current focus is:
Effortless customer experiences through our people, products, platforms, processes, and operational excellence
To do this we’ll:
Do the basics brilliantlyKnow what’s valuableInvest wisely
NZ$4,576mOperating revenues and other gains
NZ$1,079mEBITDA from continuing operations
NZ$1,157mNet earnings for the year
NZ$311mNet earnings from continuing operations
61cEarnings per share
20cDividends per share
NZ$528mCapital expenditure
Successful completion of Demerger
1,565kTotal XT mobile connections
60kGrowth in postpaid mobile connections
NZ$169m On-market buyback of shares
ARBN 050 611 277
Shareholder inquiries/contact details Telecom is a company incorporated with limited liability under the New Zealand Companies Act 1993 and domiciled in New Zealand (Companies Office registration number 328287 and ARBN number 050 611 277).
Registered officeLevel 2Telecom Place167 Victoria Street WestAuckland 1010
Principal administrative office in Australia Level 23 680 George StreetSydney NSW 2000Ph +61 2 9009 9009
Company secretaryTristan Gilbertson
Annual Meeting of shareholdersTelecom’s Annual Meeting of shareholders will be held in the conference centre, Level 2, Telecom Place, 167 Victoria Street West, Auckland on Friday, 28 September 2012 at 10.00am. A Notice of Annual Meeting and Proxy Form will be circulated to shareholders.
Shareholders with inquiries about transactions, changes of address or dividend payments should contact Telecom’s share registries.
New Zealand registryComputershare Investor Services Limited Private Bag 92119Auckland 1142Ph +64 9 488 8777Fax +64 9 488 8787New Zealand Toll Free 0800 737 100Email: [email protected]: www.computershare.co.nz
Australian registry Computershare Investor Services Pty LimitedGPO Box 3329, MelbourneVIC 3001, AustraliaPh +61 3 9415 4083Australia Freephone: 1 800 501 366Fax +61 3 9473 2500Email: [email protected] Website: www.computershare.co.nz
United States registry Details for Depositary Receipts, Transfer Agent, and RegistrarThe Bank of New York MellonPO Box 358516Pittsburgh, PA 15252-8516United States
Toll Free phone number for United States domestic calls:+1 888 BNY ADRS (+1 888 269 2377)
Number for international calls:+1 201 680 6825
Email: [email protected]: www.bnymellon.com/shareowner
Shareholder inquiries about Telecom’s operating and financial performance should be emailed to [email protected] or addressed to:
Head of Investor RelationsTelecom New Zealand LimitedPrivate Bag 92028Auckland 1142New Zealand
Contact phone numbers Australia 1800 123 350Canada 1800 280 0398Hong Kong 800 962 867New Zealand 0800 737 500Singapore 800 641 1013United Kingdom 0800 960 283United States 1800 208 2130
For more informationhttp://investor.telecom.co.nz
investor.telecom.co.nzARBN 050 611 277
| 185
designedbyinsight.com

| 1
IntroductIon
Overview 10
Chairman’s report 11
CEO’s report 13
our company
Board of directors 15
Executive team 18
Business operations 21
Company review 33
performance
Key Performance Indicators 48
Business review 49
Auditors’ reports 75
Financial statements 77
Notes to the financial statements 84
Governance
Governance at Telecom 135
Remuneration at Telecom 147
dIsclosures
Interests disclosures 162
Shareholder and exchange disclosures 164
Additional shareholder information 169
Forward-looking statements 181
Glossary 183
Shareholder inquiries/contact details 185
contents
Key Dates
annual Meeting
28 September 2012 Half-year result announced
22 February 2013Financial year end
30 June 2013
This report is dated 23 August 2012 and is signed on behalf of the board of Telecom Corporation of New Zealand Limited by Mark Verbiest, Chairman, and Simon Moutter, Chief Executive Officer.
mark verbiest ChAIRmAN
simon moutter ChIEF EXECUTIVE OFFICER
fInancIal calendar 2012–13
Investor centre
You can visit our online annual report atinvestor.telecom.co.nz

introduction
A significant presence in all our key markets
| 3investor.telecom.co.nz
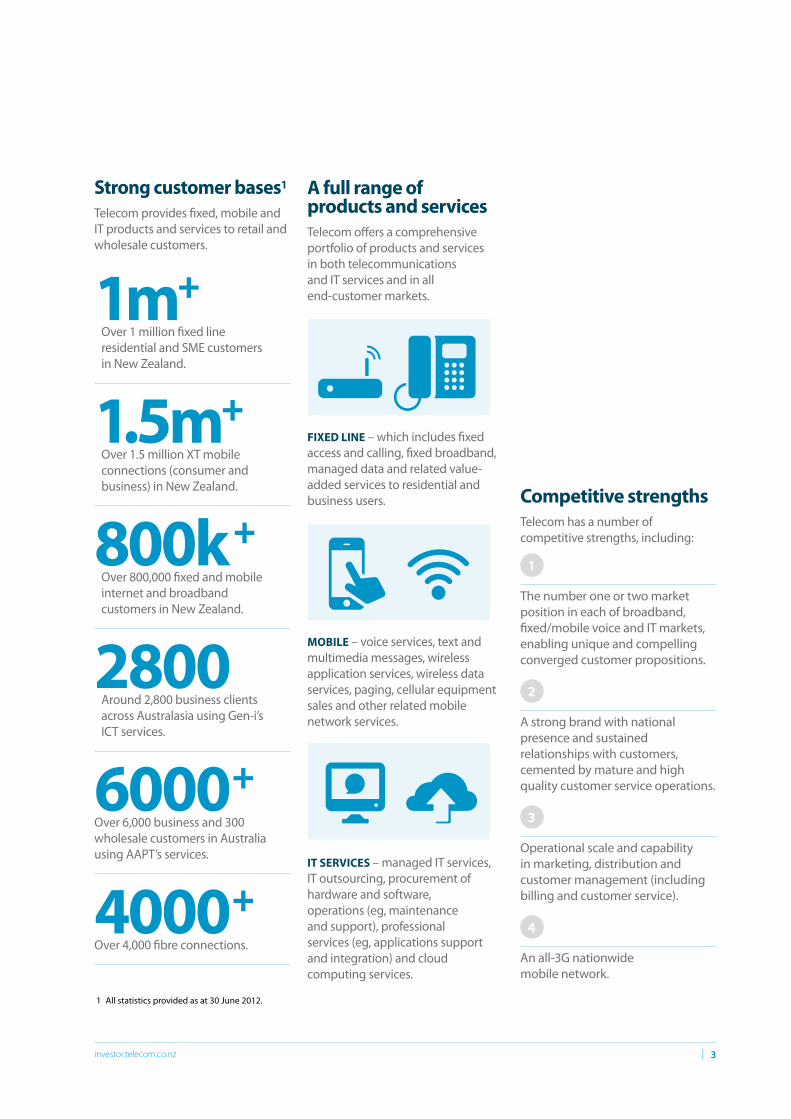
Strong customer bases1
Telecom provides fixed, mobile and IT products and services to retail and wholesale customers.
A full range of products and servicesTelecom offers a comprehensive portfolio of products and services in both telecommunications and IT services and in all end-customer markets.
FIxEd lINE – which includes fixed access and calling, fixed broadband, managed data and related value-added services to residential and business users.
MOBIlE – voice services, text and multimedia messages, wireless application services, wireless data services, paging, cellular equipment sales and other related mobile network services.
IT SERVICES – managed IT services, IT outsourcing, procurement of hardware and software, operations (eg, maintenance and support), professional services (eg, applications support and integration) and cloud computing services.
Competitive strengthsTelecom has a number of competitive strengths, including:
1
The number one or two market position in each of broadband, fixed/mobile voice and IT markets, enabling unique and compelling converged customer propositions.
2
A strong brand with national presence and sustained relationships with customers, cemented by mature and high quality customer service operations.
3
Operational scale and capability in marketing, distribution and customer management (including billing and customer service).
4
An all-3G nationwide mobile network.
1m+ Over 1 million fixed line
residential and SME customers in New Zealand.
1.5m+ Over 1.5 million XT mobile
connections (consumer and business) in New Zealand.
800k + Over 800,000 fixed and mobile internet and broadband customers in New Zealand.
2800 Around 2,800 business clients across Australasia using Gen-i’s ICT services.
6000+
Over 6,000 business and 300 wholesale customers in Australia using AAPT’s services.
4000+
Over 4,000 fibre connections.
1 All statistics provided as at 30 June 2012.

Telecom Annual Report 20124 |
introduction
We have the key resources to remain New Zealand’s largest service providerThe demerger of Telecom and Chorus last year brought a split in network assets. Telecom has maintained ownership of the assets it needs to deliver its products and services, including:
• The nationwide mobile networks
• PSTN equipment for fixed line calling
• The core national transport network
• International assets, including AAPT and a 50% stake in the Southern Cross international cable, and
• One of Australia’s most extensive fixed IP networks.
NationwideMobile Networks
NationwideMobile Networks
International Assets
Southern Cross Cable1
To international markets
AAPT
PSTN NetworkAustralian Fixed IP Network
International TransitInternet traffic is routed via the Auckland gateway and the Southern Cross Cable network to international markets
Core NetworkThe core network (or National Backhaul) is the fibre backbone that links cities to the Auckland gateway
Regional Backhaul The Regional Backhaul links the Local Exchanges to the Major exchanges or Core Network
Access Network The Access Network connects a home, business or structure to the telecommunications equipment - often a Local Exchange
FTTN
Copper
FTTP FIBRE TO THE PREMISE
FIBRE TO THE NODE
Major ExchangesE.G. WELLINGTON
Auckland GatewaysTAKAPUNA OR WHENUAPAI
Fibre Network
Copper Network
New Telecom Assets
New Chorus Assets
Fibre network
Copper network
telecom assets
Chorus assets
1 Telecom has a 50% interest in the Southern Cross international cable network.

| 5investor.telecom.co.nz
2 Auckland gateways
97% coverage to places where New Zealanders live and work – with significant mobiletower footprint: National WCDMA 3G mobile network
28,900km of submarine cable – secure bandwith for Australia, New Zealand, Hawaii and the USA
1,600kmterrestrial cable
9 cable stations
11,000km of interstate fibre, with data centres in the major capital cities
1,600 premises with fibre access
200 exchanges with mid-band Ethernet
National backhaul fibre network and service platforms for voice and data applications
30 major exchanges
INTERNATIONAl ASSETSAustralia
NEW ZEAlANd ASSETS
Telecom’s interest in Southern Cross’ international cable network1
1 Telecom has a 50% interest in the Southern Cross international cable network.

Telecom Annual Report 20126 |
introduction
Four business units deliver our products and services
Telecom now has four customer-facing business units, supported by its central product group, a network and IT unit (T&SS) and a corporate centre.
Wholesale & International
Retail Gen-i AAPT
WHolesale & InternatIonal retaIl
Central proDuCt group
t&ss
Corporate Centre
gen-I aapt
NZ$154mFy12 EBITDA
• Telecom owns significant national backhaul assets and the PSTN network
• Wholesale provides voice, mobile, interconnection, managed data and national backhaul products to approximately 70 retail service provider customers
• International delivers integrated telecommunications between New Zealand, Australia and globally
NZ$506mFy12 EBITDA
• Provides mass-market products, services and support to consumer and SME customers
• Products include fixed line calling and access, broadband, dial-up, internet, mobile and multimedia services
• 93 retail locations including 60 dealer outlets
NZ$263mFy12 EBITDA
• Provides ICT solutions to Telecom’s business customers across New Zealand and Australia
• Services focused on networked IT and managed solutions in fixed and mobile
• 2,800 business clients use Gen-i’s ICT services
NZ$88mFy12 EBITDA
• Australian telecommunications provider of voice, data, and internet services to Australian consumer, business and wholesale customers
• Network includes 11,000km of interstate fibre, data centres in major capital cities, fibre access to 1,600 premises, mid-band ethernet in 200 exchanges

| 7investor.telecom.co.nz

Telecom Annual Report 20128 |
introduction
Operational ExcellenceDelivering a superior customer experience
• Increased customer satisfaction at a lower cost
• Re-engineered key operational processes, initially within broadband and managed data
•Days from customer order to service delivery reduced by more than 40% for managed data
• Re-negotiated supplier contracts to improve service delivery and reduce costs
• Saved NZ$40m of costs
• Delivered benefits of insourcing of IT support function from hewlett Packard (hP)
• Saved NZ$28m of costs and improved service levels
Commercial ExcellenceDelivering product and pricing innovation
• Improved product contribution margins and return on investment
• Continued to drive penetration of ‘Total home’ and ‘Total Office’ bundles in the Consumer and SME market
• 95% of broadband customers on a bundled package
• Focused marketing effort and resources to target high-value mobile market segments
• Postpaid connection growth of 7% to 908,000 connections at 30 June 2012
• Continue to deliver market share growth in ICT services for business customers
• Re-signed major enterprise clients (over 1,000 @ more than NZ$160m total contract value per annum)
Enablers: ‘Match Fit’ for a Fibre and Mobile Future Designing and delivering New Telecom
• Successful execution of Demerger process
• Successful operating model change, including centralisation of corporate centre functions and creation of a new product business unit
•headcount reductions of approximately 400 full-time equivalent employees (FTEs)
• Progressing delivery of UFB fibre-based broadband into UFB-connected areas. Telecom now in a position to begin consuming fibre inputs in all UFB regions across New Zealand
• Successful residential UFB trial with Chorus UFB inputs. Signed service agreements with Enable, Northpower and Ultrafast and on track for residential trials with these local fibre companies (LFC) to resell fibre from late 2012
A Focused Market StrategyDelivering investment into growth opportunities
• Capital investment targeted to markets with higher returns and growth opportunities
• Investment directed to core markets and growth and away from non-core and low-value portfolios
• Sale of AAPT Consumer and Yahoo!Xtra in FY11 and sale of Gen-i Software Solutions in FY12
• Launched Skinny Mobile – a new low-cost mobile brand targeting growth in Prepaid market
•Distribution channels established and brand marketing under way
• Announced trial of 4G long-term evolution (LTE) mobile technology
•On track for 4G LTE trial in 2012
• Continued focus on lower and more efficient capital expenditure
• Capex-to-sales ratio reduced from 10.2% to 8.6% for Telecom’s continuing operations (excluding Chorus-related spend)
themesOUR kEy STRATEGIC THEMES
outcomesOUR TARGET OUTCOMES
Progress on our strategy

| 9investor.telecom.co.nz
Operational ExcellenceDelivering a superior customer experience
• Increased customer satisfaction at a lower cost
• Re-engineered key operational processes, initially within broadband and managed data
•Days from customer order to service delivery reduced by more than 40% for managed data
• Re-negotiated supplier contracts to improve service delivery and reduce costs
• Saved NZ$40m of costs
• Delivered benefits of insourcing of IT support function from hewlett Packard (hP)
• Saved NZ$28m of costs and improved service levels
Commercial ExcellenceDelivering product and pricing innovation
• Improved product contribution margins and return on investment
• Continued to drive penetration of ‘Total home’ and ‘Total Office’ bundles in the Consumer and SME market
• 95% of broadband customers on a bundled package
• Focused marketing effort and resources to target high-value mobile market segments
• Postpaid connection growth of 7% to 908,000 connections at 30 June 2012
• Continue to deliver market share growth in ICT services for business customers
• Re-signed major enterprise clients (over 1,000 @ more than NZ$160m total contract value per annum)
Enablers: ‘Match Fit’ for a Fibre and Mobile Future Designing and delivering New Telecom
• Successful execution of Demerger process
• Successful operating model change, including centralisation of corporate centre functions and creation of a new product business unit
•headcount reductions of approximately 400 full-time equivalent employees (FTEs)
• Progressing delivery of UFB fibre-based broadband into UFB-connected areas. Telecom now in a position to begin consuming fibre inputs in all UFB regions across New Zealand
• Successful residential UFB trial with Chorus UFB inputs. Signed service agreements with Enable, Northpower and Ultrafast and on track for residential trials with these local fibre companies (LFC) to resell fibre from late 2012
A Focused Market StrategyDelivering investment into growth opportunities
• Capital investment targeted to markets with higher returns and growth opportunities
• Investment directed to core markets and growth and away from non-core and low-value portfolios
• Sale of AAPT Consumer and Yahoo!Xtra in FY11 and sale of Gen-i Software Solutions in FY12
• Launched Skinny Mobile – a new low-cost mobile brand targeting growth in Prepaid market
•Distribution channels established and brand marketing under way
• Announced trial of 4G long-term evolution (LTE) mobile technology
•On track for 4G LTE trial in 2012
• Continued focus on lower and more efficient capital expenditure
• Capex-to-sales ratio reduced from 10.2% to 8.6% for Telecom’s continuing operations (excluding Chorus-related spend)
progressPROGRESS IN Fy12 AND INITIATIVES DELIVERED
resultsRESULTS OF ACHIEVED OUTCOMES
7%
8.6%
POSTPAID MOBILE CONNECTION GROWTh
CAPEX-TO-SALES RATIO FOR TELECOM’S CONTINUING OPERATIONS
SIGNED SERVICE AGREEMENTS WITh ALL LFCS
LAUNChED SKINNY MOBILE – A NEW LOW-COST MOBILE BRAND
2010 2011 2012
NZ$
68mSAVINGS DELIVERED IN FY12

Telecom Annual Report 201210 |
introduction
Overview
This annual report will be filed with the United States Securities and Exchange Commission on Form 20-F and is divided into five sections:
IntroDuctIon | The introduction comes from Telecom’s chairman, mark Verbiest, acting CEO, Chris Quin and incoming CEO, Simon moutter. It gives a brief overview of Telecom’s activities for FY12 and a signal of what Telecom expects to come.
our coMpany | Our company provides an overview of the Demerger, the current operating units of Telecom, the current regulatory environment and other aspects of Telecom, including resources and corporate responsibility.
perForMance | Performance gives an overview of Telecom’s financial results, as well as the results of Telecom’s current operating units. It also contains Telecom’s consolidated financial statements for FY12, as well as an assessment of risk factors that could affect the Group’s performance.
Governance | Governance presents corporate governance at Telecom and provides remuneration information.
DIsclosures | Disclosures provides additional information required by New Zealand company law, the NZX and ASX Listing Rules and additional United States SEC Form 20-F annual report (Form 20-F) requirements.
When used in this annual report, references to the ‘Company’ are references to Telecom Corporation of New Zealand Limited. References to ‘Telecom’ are to Telecom Corporation of New Zealand Limited, together with its subsidiaries and its interests in associates.
All references to financial years (eg, FY12, FY11 and FY10) in this annual report are to the financial year ended 30 June. Certain information required by the Form 20-F requirements is contained in Telecom’s FY12 consolidated financial statements, which are included in this annual report. Information required to be stated as at the most recent practicable date, is stated as at 13 August 2012 unless expressly stated otherwise. References to notes are references to notes to the consolidated financial statements.
References to US$, USD or US dollars are to United States dollars, references to A$ and AUD are to Australian dollars and references to NZ$ and NZD are to New Zealand dollars.
References to Telecom’s WCDmA mobile network, the XT Network or the Smartphone network are to Telecom’s 3G wideband 850mhz/2100mhz mobile network, which was launched in may 2009 and has now fully replaced Telecom’s CDmA mobile network. Telecom’s branded XT mobile network operates, along with other mobile virtual network operators (mVNOs), on Telecom’s WCDmA mobile network. References to Telecom’s CDmA mobile network are to Telecom’s CDmA network that carried voice traffic and data at a lower relative speed, which Telecom closed in July 2012.
Any references to documents and information included on external websites, including Telecom’s website, are provided for convenience alone and none of the documents or other information on those websites is incorporated by reference in this annual report. Reference to legislation is to New Zealand legislation and the Government is to the New Zealand Government, unless specifically stated otherwise. See Glossary for other definitions.
Information on the Demerger, which was effective 1 December 2011, is discussed under our company – Business operations, regulation and Disclosures – Material contracts. Detailed information about the Demerger can also be found in the Scheme Booklet dated 13 September 2011, which is available on Telecom’s website at http://investor.telecom.co.nz, and the NZX and ASX websites, and was furnished to the SEC under cover of Form 6-K on 13 September 2011.

| 11investor.telecom.co.nz
Chairman’s report
Dear shareholder,
Telecom finishes its 2011/12 financial year a substantially different company than it was a year earlier.
Following the approval by more than 99% of votes cast by Telecom shareholders in October 2011, the company separated its fixed line access network into an entirely stand alone new company called Chorus. The logic of the Demerger appears to have been borne out with investors pushing the combined share prices of both Telecom and Chorus higher.
With this transaction complete, I took over as Chairman of Telecom on 1 December 2011.
Post-Demerger, Telecom is subject to a number of factors that will require it to fundamentally change its business over the coming months and years.
As such, your board is focused on driving the company to reshape itself to enable it to take on the challenges and opportunities of this substantially new operating environment.
The Demerger allowed for a re-set of the regulatory environment here in New Zealand, which moved Telecom closer to competing on a level playing field with the other telecommunications providers in New Zealand.
A key benefit of this is that it allows for a single minded focus on delivering for customers, rather than meeting regulatory milestones.
however, separating the relatively stable and high margin fixed line business into an entirely stand-alone company also means that cost control and efficiency become even more important than they were before.
Along with rapid technology changes, ever-increasing consumer expectations, and an economy that remains flat, Telecom is presented with a number of challenges that it must address in order to be successful.
It is testament to the people of Telecom that the company maintained its market positions in mobile, broadband and ICT while undergoing significant change to its operations, however, we are just at the start of a new period of change for Telecom.
In our new world, Telecom faces high levels of competition in every market segment and will only deliver the results that shareholders demand by delivering for its customers and doing so as cost-efficiently as possible.
I am confident Telecom is well placed to deliver the changes that are necessary for the Company to thrive now and into the future and your board is committed to driving this change on behalf of you, our shareholders.
executive ChangesDuring the year Telecom also said farewell to its CEO Dr Paul Reynolds.
In his five years at the helm of Telecom he was instrumental in guiding the company through a significant period of challenge and change.
In just this last year Paul and the team delivered structural separation, established XT as New Zealand’s pre-eminent mobile network and strengthened Telecom’s value to New Zealand and local capital markets. I would like to thank Paul for his contribution to the Company.
The board is delighted to have secured the services of Mr Simon Moutter as Paul’s successor. Following an extensive and robust international search process, the board was unanimous that Simon is the right candidate for the role. he brings deep knowledge of telecommunications in New Zealand and a proven ability to lead customer-focused change to grow shareholder value.
Simon started as CEO on 13 August 2012 and his compensation package is closely aligned to the delivery of shareholder value.
Chris Quin took the helm as acting CEO at the beginning of June and, with the executive team, continued to execute on a plan centred on delivering for customers while simplifying operations, controlling spending and seeking a number one position in mobile, broadband and ICT.

Telecom Annual Report 201212 |
introduction
Board changesPost-Demerger, Telecom bid farewell to long-standing Chairman Wayne Boyd and directors Sue Sheldon and Ron Spithill. All individuals were instrumental through the Demerger process and I would like to thank them for the vision they brought to the table during that time and through Telecom’s growth over the past several years.
Board members Kevin Roberts and murray horn remain and they have been joined by maury Leyland, Paul Berriman, Justine Smyth, Charles Sitch and myself.
That we have an almost entirely new board and a new CEO is illustrative of the level of change that has occurred at Telecom. It also reflects the vast changes occurring in the New Zealand telecommunications market. I am confident we have the right mix of experience at the board and executive tables to position the company for the challenges ahead.
A second half dividend of 11 cents per share has produced a combined annual dividend of 20 cents per share, the same level it was prior to Demerger and a good result for a company that is now significantly smaller following Demerger.
You will be aware the company is also undertaking an on-market share buyback, having bought back NZ$169 million of shares as at 30 June 2012.
Thank you for your continued support of Telecom and I look forward to my first Annual meeting as Chairman on 28 September 2012.
Mark verbiest
“A second half dividend of 11 cents per share has produced a combined annual dividend of 20 cents per share, the same level it was prior to Demerger and a good result for a company that is now significantly smaller following Demerger.”
Chairman’s report CONTINUED

| 13investor.telecom.co.nz
Acting CEO’s report
1 Adjusted free cash flow, adjusted EBITDA, EBITDA and adjusted operating revenues are non-GAAP measures and are not comparable to the IFRS measure of net earnings. Adjusted free cash flow is defined as adjusted EBITDA less capital expenditure. See the Performance section for details of non-GAAP measures and reconciliations.
Dear shareholder,
The last 12 months have been an incredible period of change, which has fundamentally re-shaped both Telecom and the telecommunications industry in New Zealand.
I would like to thank our customers for their ongoing support and business during the year and also recognise the enormous contribution of Telecom’s people during this time as Telecom transforms to reflect its new operating environment.
We saw the establishment of Chorus as an entirely separate company and this is reflected in Telecom’s full-year results. The financial year included five months of trading with Chorus as part of Telecom and seven months post separation.
As such, FY12 has been about delivering the Demerger and focusing Telecom to succeed in its new operating environment.
In line with this, I am pleased to report that Telecom has delivered an annual result of net earnings after tax from its continuing operations of NZ$311 million in FY12, which were significantly higher than the NZ$79 million loss in FY11. Further, Telecom has delivered NZ$1,048 million of adjusted Earnings Before Interest, Tax, Depreciation and Amortisation (adjusted EBITDA1) for its continuing operations. This represents an increase in adjusted EBITDA from continuing operations of 4.8%. Unadjusted EBITDA1 from continuing operations (prior to eliminating the effects of significant one-off gains, expenses and impairments) increased by 41.8% on the previous year to NZ$1,079 million in FY12.
Reporting on continuing operations provides the most reliable view of Telecom’s performance as a separate company.
Total capital expenditure is down 42.2% to NZ$528 million (which includes NZ$136 million of Chorus-related capex) and, as a result, we have delivered strong adjusted free cash flows1 of NZ$841 million. This improvement in adjusted free cash flow has enabled the payment of the same level of dividend as we delivered in the previous financial year as an integrated company.
Due to intense competitive pressure Telecom now faces across all business lines, as well as the declines in operating revenues that were expected post-Demerger, adjusted operating revenues1 have declined by 8.9% to NZ$4,540 million. Unadjusted operating revenues fell by 8.5% to NZ$4,576 million.
It is worth noting that while adjusted operating revenues declined nearly 9%, the underlying trends are more moderate.
There have been a number of one-off changes affecting the year-on-year revenue trends, relating to the rationalisation of low-margin customers in our international business and in Australia, the impact of mobile termination rate regulation and the effect of the AAPT consumer division sale part way through the prior year.
When these declines are ring-fenced the New Zealand business revenues fell around 2% for the year. Core businesses, such as domestic fixed line, access, calling and data, continue to decline and are partially offset by growth in mobile and broadband.
In addition, the decline in revenue has been offset by reductions in operating expenses, which fell by more than 12% compared to the prior year.
Mobile, broadband and ICtPost-Demerger, Telecom has retained its focus on winning in the key markets of mobile, broadband and ICT.
During the year Telecom worked towards the closure of its 10-year-old CDMA mobile network, which was finally switched off a month after the end of the financial year.

Telecom Annual Report 201214 |
introduction
Introducing simon Moutter…
Dear shareholder,
I am excited to be returning to the company that I left four years ago, which has undergone enormous change during that time.
Given the time I have been away and the substantial change during that period, my first duty as CEO will be to listen to Telecom’s customers, its people, its shareholders and the communities across New Zealand that we serve.
I firmly believe that there are great opportunities ahead of us to improve the products and services we offer to our customers, to improve our efficiency and effectiveness and to deliver returns to our shareholders as a result.
however, none of this will happen unless Telecom is resolutely focused on delivering for customers. This will be my key focus.
I am very ambitious for New Zealand and I believe Telecom will play a vital role in New Zealand’s success on the global stage. I will be working hard to ensure we deliver both for you, our shareholders, and for the country.
simon Moutter
Incoming CEO
We lost some low-value CDmA customers as we approached the switch-off. We have welcomed 60,000 customers onto higher value postpaid plans on our newer Smartphone network during the last 12 months. As a result mobile voice and data revenues grew by 2% compared to the prior year.
Broadband and internet revenues in New Zealand increased by NZ$13 million, or 4.1%, to NZ$333 million in FY12. Despite an increase in price-based competition in the market, broadband connections of 599,000 at 30 June 2012 increased by 8,000, or 1.4%, when compared to 30 June 2011.
On the ICT front, Telecom’s Gen-i business secured and extended major contracts during the period.
customer focusAs a standalone service provider facing intense competition in all markets, winning our customers’ preference through an effortless experience and operational excellence is key and that will be how we deliver great outcomes to our shareholders.
With the pace of change accelerating, as ultra-fast fibre optic broadband is set to become more widely available, and next generation ‘4G’ mobile services are likely to emerge in New Zealand, customer preference will provide Telecom with a solid foundation to deliver for both our customers and shareholders.
Coupled with a continued focus on reducing costs and simplification, and prudent investment decisions, I believe the Company is well positioned to thrive in the new environment.
On behalf of the leadership team, it has been a privilege to be your acting CEO for three months. The passion for customers and determination of Telecom’s people should give you confidence in the future of one of New Zealand’s most important companies.
chris Quin, acting ceo (to 13 august 2012)

| 15investor.telecom.co.nz
top roW, FroM leFt
Mark verbiestChairman, Non-Executive Director, Independent
paul BerrimanNon-Executive Director, Independent
Murray HornNon-Executive Director, Independent
Maury leylandNon-Executive Director, Independent
seconD roW, FroM leFt
simon MoutterExecutive Director, Not Independent
Kevin robertsNon-Executive Director, Not IndependentKevin Roberts photo by mikko Takkunen
charles sitchNon-Executive Director, Independent
Justine smythNon-Executive Director, Independent
Board of directors
The directors of Telecom (including the CEO) are as follows:
our coMpany

Telecom Annual Report 201216 |
OUR COMPANY
Murray Horn, phD (Harvard university); MCom (First Class Hons); BCom non-executive Director, Independent
term of office Appointed director 1 July 2007 and last re-elected at the 2011 Annual Meeting.
Board committees Chair of the Audit and Risk Management Committee and a member of the Nominations and Corporate Governance Committee.
Murray chairs the Government’s National health Board and the New Zealand health Innovation hub and previously held a number of senior executive roles with ANZ Banking Group, including leading the Group’s New Zealand operations. he was Secretary to the New Zealand Treasury and has served on a number of boards, including the New Zealand Tourism Board. he has represented New Zealand at the OECD, as a governor at the World Bank and as an alternate director at the International Monetary Fund.
Murray received his doctorate from harvard University in 1989 and has been awarded a number of academic honours in both New Zealand and the United States.
Maury leyland, Be (Hons); FIpenZ; MInstD non-executive Director, Independent
term of office Appointed director 1 December 2011.
Board Committees Member of the human Resources and Compensation Committee and the Nominations and Corporate Governance Committee.
Maury has been a senior executive at Fonterra since 2005 and is currently Group General Manager Strategy. Previous roles within Fonterra have included Programme Director of a major transformation programme, General Manager New Zealand Logistics and Associate Director Strategy and Growth. Prior to joining Fonterra she spent nine years with the Boston Consulting Group as a strategy consultant working with large companies in New Zealand and Australia. Maury was previously a director at Transpower New Zealand Limited. She was also a member of both the design and sailing team for Team New Zealand during the successful 1995 America’s Cup campaign in San Diego. Maury is also a member of the Advisory Board for the Department of Engineering Science at the University of Auckland. Maury has a Bachelor of Engineering in Engineering Science, First Class honours from Auckland University.
simon Moutter, Me, Bsc executive Director, not-Independent
term of office
Appointed Executive Director and Chief Executive Officer effective 13 August 2012.
Board Committees – none
See Executive team for information on Simon Moutter.
Mark verbiest, llB; MInstD Chairman, non-executive Director, Independent
term of office Appointed director 1 December 2011.
Board Committees Chair of the Nominations and Corporate Governance Committee and a member of the human Resources and Compensation Committee.
Mark is Chairman of Transpower New Zealand Limited and Willis Bond Capital Partners Limited, a director of Freightways Limited and a board member of the Financial Markets Authority. he is also a consultant to law firm Simpson Grierson. he was a member of Telecom’s senior executive team from late 2000 through to June 2008 as Group General Counsel and executive responsible for Telecom International and Yellow Pages Group (prior to its sale) and, prior to 2000, a senior partner in Simpson Grierson, specialising in mergers and acquisitions and securities, competition and utilities-related law. Mark has a law degree from Victoria University of Wellington.
paul Berriman, Bsc (electroacoustics); MBa; FHKIoD; MIoa; Ceng non-executive Director, Independent
term of office Appointed director 1 December 2011.
Board Committees Member of the Audit and Risk Management Committee and the Nominations and Corporate Governance Committee.
Paul is the Chief Technology Officer of the hKT Trust, the telecommunications arm of PCCW, which was spun off and listed in November 2011 and is hong Kong’s largest telecommunications company. Prior to the spin-off, he was Chief Technology Officer of PCCW Group and he continues to lead the group’s product and technology roadmap and strategic developments. he has over 25 years of experience in telecommunications, especially in IPTV, mobile TV, media convergence and quadruple-play. Prior to joining PCCW in 2002 as Senior Vice President, Strategy and Marketing, he was Managing Director of management consultancy Arthur D. Little in hong Kong and was involved in telecommunications consultancy projects globally. Previously he also held executive, technical, engineering and operations management roles in Reuters and several major hong Kong service providers, including the hong Kong Telephone Company and hong Kong Telecom CSL. he holds a Bachelor of Science in Electroacoustics from the University of Salford in the United Kingdom, and a Master of Business Administration from the University of hong Kong. he is a Chartered Engineer, a member of Intel’s Communications Board of Advisors and was a member of the board of directors of the International Engineering Consortium. he has been a fellow of the hong Kong Institute of Directors since 1997 and has been a member of hong Kong Telecom Regulator, OFTA’s Technical Standards Advisory Committee for over 12 years.

| 17investor.telecom.co.nz
Justine smyth, BCom; Ca non-executive Director, Independent
term of office Appointed director 1 December 2011.
Board committees Chair of the human Resources and Compensation Committee and a member of the Audit and Risk Management Committee and the Nominations and Corporate Governance Committee.
Justine is a director of Auckland International Airport Limited, a board member of the Financial Markets Authority, Chair of the New Zealand Breast Cancer Foundation and a former Deputy Chair of New Zealand Post Limited. She is also owner and executive director of a manufacturing and wholesale clothing company. Justine is a former chair of the Finance Audit, Investment & Risk sub-committee of New Zealand Post Limited and her background includes being group finance director of Lion Nathan Limited and partner of Deloitte. She has experience in governance, mergers & acquisitions, taxation and financial performance of large corporate enterprises and the acquisition, ownership, management and sale of small and medium enterprises.
Director who retired during Fy12:paul reynolds executive Director, Ceo
Resigned as a director effective 31 May 2012.
Ceased to be CEO on 1 June 2012.
Directors who resigned on Demerger:
Wayne Boyd Chairman and non-executive Director
Resigned as director, effective 1 December 2011.
sue sheldon non-executive Director
Resigned as director, effective 1 December 2011, to take up the Chair of Chorus.
ron spithill non-executive Director
Resigned as director, effective 1 December 2011.
Kevin roberts non-executive Director, not Independent
term of office Appointed director 28 August 2008 and last re-elected at the 2011 Annual Meeting.
Board committees Member of the Nominations and Corporate Governance Committee and the human Resources and Compensation Committee.
Kevin has extensive international experience in brand, marketing and customer satisfaction and is CEO for Saatchi & Saatchi worldwide.
he is a member of the Directoire of Publicis Groupe. he is an honorary professor in the Faculty of Business and Economics at the University of Auckland and an honorary professor of creative leadership at Lancaster University. he is a private sector ambassador to the New Zealand/United States Council and in 2006 was appointed chairman of the USA Rugby Board. Previously, Kevin held senior management and marketing positions with Procter & Gamble, Pepsi-Cola and Lion Nathan. he has undertaken pro-bono work for the Antarctic heritage Trust, co-founded New Zealand Edge and served on the New Zealand Rugby Football Union board. Kevin is also a trustee of the Turn Your Life Around Trust. he has been awarded honorary doctorates by the University of Waikato, the International University of Geneva, the Peruvian University of Applied Sciences in Lima and Lancaster University.
Charles sitch, MBa, llB, BCom non-executive Director, Independent
term of office Appointed director 1 December 2011.
Board committees Member of the Audit and Risk Management Committee and the Nominations and Corporate Governance Committee.
Charles retired from the international management consulting firm McKinsey & Company in 2010. he joined McKinsey & Company in 1987 and in 2000 became a senior director, primarily working with CEOs and boards on strategy and operations turnarounds. his practice had focused on telecommunications, consumer services, retail, banking, travel and entertainment. he is an advisory director of Bkk Partners, an investment bank, and since 2006 has been involved in various new business ventures. he is a member of the board of Trinity College at Melbourne University and the Robin Boyd Foundation and a committee member of the Melbourne Cricket Club. Charles holds an MBA from Columbia Business School and an LLB, BCom from Melbourne University.

Telecom Annual Report 201218 |
OUR COMPANY
Executive team
top roW, FroM leFt
simon Moutter Chief Executive Officer
tristan gilbertson Group General Counsel & Company Secretary
alan gourdie Chief Executive Officer, Retail
David Havercroft Group Chief Technology Officer
seConD roW, FroM leFt
nick olson Chief Financial Officer
Chris Quin Chief Executive Officer, Gen-i
rod snodgrass Chief Product Officer
Members of the Executive team are as follows:

| 19investor.telecom.co.nz
Members of the Executive team are as follows:
simon Moutter Chief executive officer
responsibilities As Chief Executive Officer (CEO) and Executive Director, Simon is responsible for the leadership, strategic direction and management of the company. he was appointed as Telecom CEO in April 2012, commencing mid-August of the same year.
Background Simon is well attuned to the Telecom business having managed parts of the company in previous roles, most recently as Chief Operating Officer during the years 1999–2008.
In the intervening years, he was the CEO of Auckland International Airport for a period of four years in which the company experienced customer growth and significant uplift in its share price.
Prior to this he spent 13 years in the electricity and gas industry where he held various positions, including Chief Executive of Powerco (1992 to 1999).
Simon has a Master’s degree in Engineering from the University of Canterbury and a Bachelor’s degree in Science from Massey University.
tristan gilbertson group general Counsel & Company secretary
responsibilities Tristan was appointed Group General Counsel in July 2008.
he leads Telecom’s group legal and corporate services team and is responsible for legal services, internal audit, risk management, compliance, corporate governance, communications, government relations and regulatory affairs.
Background Tristan is a highly experienced corporate and commercial lawyer, with extensive international experience in telecommunications law and regulation. After practising law with several leading international law firms, Tristan joined Vodafone Group Plc, where he held a number of senior leadership positions, including legal and regulatory director – Asia-Pacific Region and governance director – Europe Region, before joining Telecom in 2008.
alan gourdie Chief executive officer (Ceo), retail
responsibilities Alan joined Telecom in August 2008 as CEO of Telecom Retail. he is responsible for driving Telecom’s commitment to improving the experience of Telecom consumer and SME customers, the performance of Telecom’s mobile and fixed line business with these customers and has executive responsibility for Telecom’s brand.
Background Alan has worked in senior sales and marketing roles at hume Industries and then at DB Group, eventually becoming the General Manager Sales and Marketing for the brewing business. This led to a number of roles offshore for heineken and associated companies,
including global marketing manager for heineken in Amsterdam and General Manager responsible for Singapore operations for Asia-Pacific Breweries. Immediately prior to joining Telecom, Alan was in London as Managing Director of Asia-Pacific Breweries’ UK and European operations.
Alan has resigned from Telecom effective 31 October 2012.
David Havercroft group Chief technology officer
responsibilities David joined Telecom in October 2009 and was promoted to the Telecom Executive team in April 2010 as Group Chief Technology Officer. he is responsible for Telecom’s entire network and IT operations throughout New Zealand, ensuring its information technology, infrastructure and architecture are aligned with the Group’s business objectives. he oversees the core technology teams in addition to the shared business operations, which support Telecom in provisioning, credit and billing, corporate property and information management.
Background UK born, David has more than 26 years’ experience in the telecommunications industry in Europe and Asia-Pacific, with previous executive roles in business and technology functions in major telecommunications operations and in professional services and technology organisations. David has designed and led major change programmes focused on revenue growth, cost-efficiency, network rollouts and ongoing management of insourced and outsourced operations.
nick olson Chief Financial officer
responsibilities Nick was appointed Chief Financial Officer of Telecom in October 2010. Nick is responsible for the centralised finance functions of Telecom, including: performance management, management reporting, external reporting, investor relations, treasury and capital markets, group taxation, group insurance, business unit financial support, group procurement, strategy and the shared financial functions, including accounts payable. Nick is also responsible for overall capital expenditure allocation for Telecom.
Background Nick has over 20 years’ experience in the financial arena and after 13 years in the investment banking industry, Nick joined Telecom in January 2002. Prior to his appointment as Chief Financial Officer, he held the following positions at Telecom – Treasurer, General Manager Finance and Group Controller. Nick has extensive capital markets, mergers and acquisitions and financial experience. In 2012, following the Telecom Demerger, Nick was awarded ‘CFO of the year’ at the New Zealand annual CFO Awards.

Telecom Annual Report 201220 |
OUR COMPANY
Background Rod was previously Group Strategy Director responsible for driving group strategic transformation and growth agendas. Prior to becoming Group Strategy Director, Rod was General Manager of the Wired division, including Telecom’s retail fixed line, voice, data and internet businesses. Prior to heading up Wired, Rod was General Manager of Xtra, Telecom’s online division, having held various financial, commercial and business development roles in the division.
Rod has been at Telecom for around 15 years, joining in 1998 after seven years in various strategy, business development and commercial roles in the oil and gas exploration and production industry and has been a member of the Telecom Executive team since 2008.
executives who ceased to be employed by telecom during Fy12
paul reynolds executive Director, Chief executive officer (Ceo)Resigned as a director effective 31 May 2012.
Ceased to be CEO on 1 June 2012.
Mark ratcliffe Chief executive officer (Ceo), Chorus, and executive lead telecom’s uFB programmeCeased to be employed by Telecom effective 1 December 2011 to take up the position of CEO, Chorus.
tina symmans Corporate relations DirectorCeased to be employed by Telecom effective 31 January 2012.
Chris Quin Chief executive officer (Ceo), gen-i
responsibilities Chris was promoted to the Telecom Executive team in April 2008 as CEO of Gen-i Australasia, where he has been responsible for delivering converged technology and telecommunications solutions to large and medium business customers across New Zealand and Australia. Chris was appointed Acting CEO from 1 June 2012 until 12 August 2012, when Simon Moutter’s appointment commenced.
Background Chris was General Manager of Gen-i’s New Zealand operations for four years before becoming the Gen-i CEO. Prior to that he held roles in Telecom in finance, sales and management of service delivery. Before joining Telecom in 1991, Chris was chief financial officer for Mitel and a financial accountant at Orica (formerly ICI). Chris has a BCA from Victoria University of Wellington.
Chris’ career recently has been focused on the business and corporate markets. his active participation in the ICT industry includes board positions with the New Zealand ICT Group, ICE hOUSE business incubator and New Centre for Social Innovation.
In July 2010 Chris was awarded an Emerging Leadership Award at the 2010 Sir Peter Blake Leadership Awards for his leadership achievements and contributions to New Zealand. Chris was also awarded the Chairman’s Award at the 2010 Telecommunications Users Association of New Zealand Innovation Awards.
rod snodgrass Chief product officer
responsibilities Rod was appointed Chief Product Officer in April 2011 and is responsible for leading all product and pricing activity across Telecom. Rod’s focus is on the creation of Group-wide portfolio and pricing strategy, driving world-class product lifecycle management and delivering growth through business and market development, including developing new products, services, channels and partnerships.

| 21investor.telecom.co.nz
Business operations
History and developmentTelecom Corporation of New Zealand Limited was established on 24 February 1987 as a company with limited liability. It is now incorporated under the Companies Act 1993 and is domiciled in New Zealand.
Telecom is the largest provider of telecommunications and IT services in New Zealand by revenue, customers and assets, offering a comprehensive range of products and services to consumer and business customers.
Significant milestones include:
• In 1999 Telecom acquired AAPT in Australia to expand further into the Australian telecommunications market;
• In 2004 Telecom acquired IT service companies Gen-i and Computerland to extend its IT services capabilities. Together, Gen-i and Computerland were jointly integrated into Telecom in late 2005 and now comprise a business division offering information, communication and technology (ICT) services under the Gen-i brand in both New Zealand and Australia;
• In 2007 Telecom sold its directories business, Yellow Pages Group and acquired PowerTel, an Australian fixed network infrastructure provider focused on the business and wholesale markets, which was integrated into AAPT;
• In 2008 Telecom implemented the operational separation of its business units, in accordance with undertakings finalised following the 2006 amendments to the Telecommunications Act 2001;
• In September 2010 Telecom sold AAPT’s consumer division, with AAPT focusing on the business and wholesale segments of the Australian telecommunications market;
• In May 2011 Chorus was selected by Crown Fibre holdings (CFh) as the cornerstone partner in the Government’s ultra-fast broadband (UFB) initiative; and
• On 1 December 2011 Chorus and some parts of Telecom Wholesale were demerged from Telecom.
Telecom’s products are founded upon providing connectivity to customers for local access, calling, broadband and data services on both Telecom’s PSTN fixed line network, as well as Telecom’s mobile network. These are supported by other offerings, including the provision of converged ICT solutions by Gen-i.
Telecom’s significant subsidiary and associate companies as at 30 June 2012 are set out in notes 28 and 29 to the financial statements.
The following diagram sets out the significant transactions for Telecom over recent years.
JUNE 2004
Telecom acquires Gen-i and Computerland to extend
IT services capabilities
MAy 1999
Telecom acquires AAPT Australia to expand further in Australian
telecommunications market
MARCH 2007
Telecom sells its directories business to
yellow Pages Group
JANUARy 2007
Telecom acquires PowerTel and integrates
into AAPT business
MARCH 2008
Telecom commences implementation of the
operational separation of its business units
MAy 2011
Chorus is selected by CFH as cornerstone partner for UFB
1 DECEMBER 2011
Demerger completed
SEPTEMBER 2010
Telecom sells AAPT consumer division to iiNet
Privatisation of Telecom 1990
1999 2000 2001 2002 2003 2004 2005 2006 2007 2008 2009 2010 2011 2012
Telecom Annual Report 201222 |
OUR COMPANY
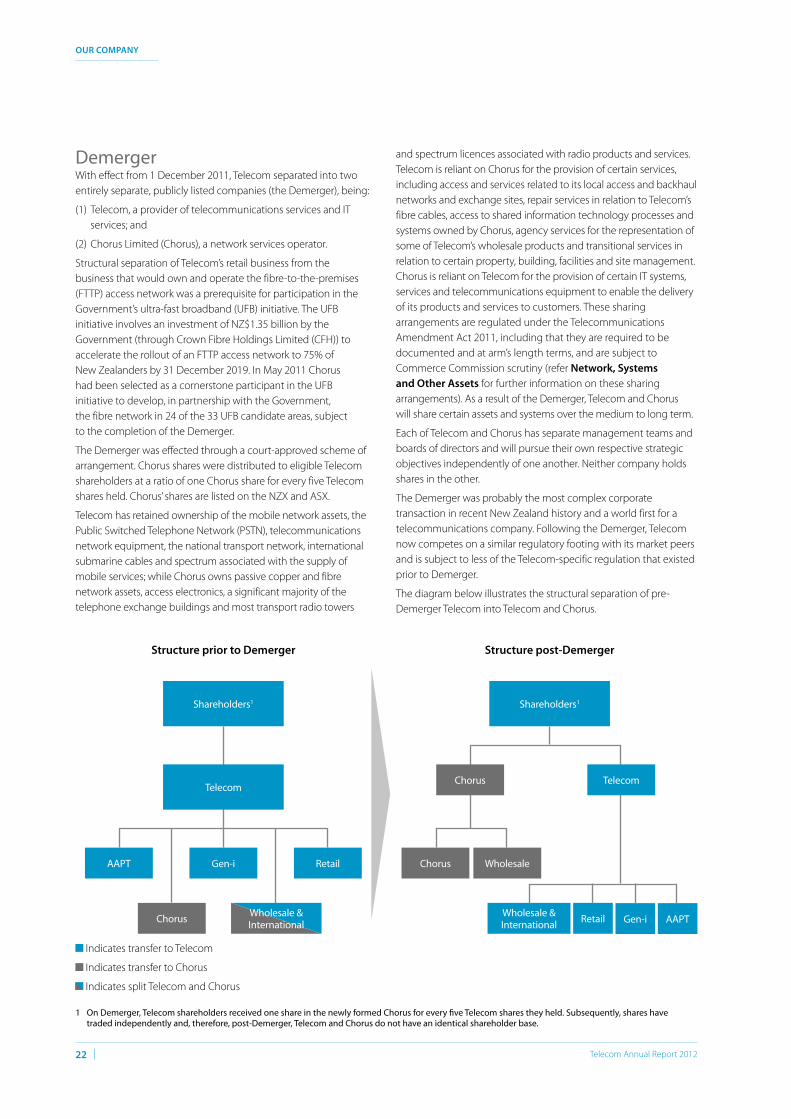
DemergerWith effect from 1 December 2011, Telecom separated into two entirely separate, publicly listed companies (the Demerger), being:
(1) Telecom, a provider of telecommunications services and IT services; and
(2) Chorus Limited (Chorus), a network services operator.
Structural separation of Telecom’s retail business from the business that would own and operate the fibre-to-the-premises (FTTP) access network was a prerequisite for participation in the Government’s ultra-fast broadband (UFB) initiative. The UFB initiative involves an investment of NZ$1.35 billion by the Government (through Crown Fibre holdings Limited (CFh)) to accelerate the rollout of an FTTP access network to 75% of New Zealanders by 31 December 2019. In May 2011 Chorus had been selected as a cornerstone participant in the UFB initiative to develop, in partnership with the Government, the fibre network in 24 of the 33 UFB candidate areas, subject to the completion of the Demerger.
The Demerger was effected through a court-approved scheme of arrangement. Chorus shares were distributed to eligible Telecom shareholders at a ratio of one Chorus share for every five Telecom shares held. Chorus’ shares are listed on the NZX and ASX.
Telecom has retained ownership of the mobile network assets, the Public Switched Telephone Network (PSTN), telecommunications network equipment, the national transport network, international submarine cables and spectrum associated with the supply of mobile services; while Chorus owns passive copper and fibre network assets, access electronics, a significant majority of the telephone exchange buildings and most transport radio towers
and spectrum licences associated with radio products and services. Telecom is reliant on Chorus for the provision of certain services, including access and services related to its local access and backhaul networks and exchange sites, repair services in relation to Telecom’s fibre cables, access to shared information technology processes and systems owned by Chorus, agency services for the representation of some of Telecom’s wholesale products and transitional services in relation to certain property, building, facilities and site management. Chorus is reliant on Telecom for the provision of certain IT systems, services and telecommunications equipment to enable the delivery of its products and services to customers. These sharing arrangements are regulated under the Telecommunications Amendment Act 2011, including that they are required to be documented and at arm’s length terms, and are subject to Commerce Commission scrutiny (refer network, systems and other assets for further information on these sharing arrangements). As a result of the Demerger, Telecom and Chorus will share certain assets and systems over the medium to long term.
Each of Telecom and Chorus has separate management teams and boards of directors and will pursue their own respective strategic objectives independently of one another. Neither company holds shares in the other.
The Demerger was probably the most complex corporate transaction in recent New Zealand history and a world first for a telecommunications company. Following the Demerger, Telecom now competes on a similar regulatory footing with its market peers and is subject to less of the Telecom-specific regulation that existed prior to Demerger.
The diagram below illustrates the structural separation of pre-Demerger Telecom into Telecom and Chorus.
Gen-i
Gen-iChorus
Chorus WholesaleRetail
Retail
AAPT
AAPT
structure prior to Demerger structure post-Demerger
Shareholders1 Shareholders1
Wholesale & International
Wholesale & International
Indicates transfer to Telecom
Indicates transfer to Chorus
Indicates split Telecom and Chorus
TelecomChorus Telecom
1 On Demerger, Telecom shareholders received one share in the newly formed Chorus for every five Telecom shares they held. Subsequently, shares have traded independently and, therefore, post-Demerger, Telecom and Chorus do not have an identical shareholder base.
| 23investor.telecom.co.nz
Operating environment Telecom is a participant in the New Zealand and Australian telecommunications and information technology industries. Broadly, the telecommunications industry can be defined as fixed and mobile calling, messaging and managed and unmanaged data services. These products are delivered across a variety of platforms. Owing to the changing nature of the underlying technologies involved, the telecommunications industry is developing significant overlaps with other previously distinct industries, such as IT services, entertainment, and information services (for example, search classifieds, online trading and display).
The telecommunications industry in New Zealand and internationally is shifting progressively from a copper network base to a fibre network base to facilitate the anticipated growth in high volume, data-intensive communications services. The Government’s UFB initiative is designed to support this shift by assisting investment in the building of certain fibre access network assets in New Zealand. While the timing and rate of uptake of New Zealand’s fibre network cannot be predicted with certainty, it is likely that over time consumer demand will shift from copper-based services to higher specification fibre-based services, in order to benefit from their higher data speeds.
While New Zealand and Australia have similar demographics, there are key differences in terms of industry structure, regulation, competition, customers, the underlying economy and long-term growth rates. These differences can be attributed partly to the larger size of the Australian market, the demographic mix of the Australian population and partly to the different approaches to regulation and privatisation in Australia and New Zealand.
CompetitionWhile the fundamental trends affecting the telecommunications and IT services markets in New Zealand are similar to those faced by incumbent telecommunications companies in mature markets, Telecom’s position up to the Demerger was unusual because major technology and regulatory changes were happening simultaneously. Following the Demerger Telecom will now compete on a similar regulatory footing with its market peers and is subject to less of the ‘Telecom-specific’ regulation (including Operational Separation Undertakings, price regulation, extensive capital investment to comply with regulated migration plans and costs associated with accounting separation) that existed prior to Demerger.
Aside from Telecom, the principal players in the New Zealand telecommunications market are affiliates of large multinational corporations with substantial resources, such as Vodafone, TelstraClear and, increasingly, large IT service companies such as hP and IBM. Recently Vodafone has announced its intention to acquire TelstraClear (subject to final regulatory approvals) and, once complete, the acquisition will result in a combined business that competes with Telecom in fixed line access, calling and broadband and in mobile. The newly combined business will have assets that include a mobile network, fibre backhaul, hybrid fibre-coaxial network in certain locations and an agreement with Telstra to continue to service trans-Tasman clients. It is also expected that
competition across sectors will continue to intensify, with the prospect of existing participants extending their activities. Smaller competitors in the telecommunications sector are also actively marketing alternative access technologies to consumer and business customers with discounted price-based offers.
Competition in the mobile market continues to increase with three primary operators, Telecom, Vodafone and 2degrees and additional MVNOs offering services over existing mobile networks. In parallel, there continues to be aggressive retail price competition, with market participants offering bundles of fixed, mobile and data services in an effort to increase market share.
Telecom Wholesale continues to face increased competition in its market as further exchanges and cabinets are unbundled. Price-based competition continues to increase in the mass-market, with copper-based services provided by several unbundled copper local loop (UCLL) players who are targeting profitable metropolitan areas, such as Auckland and other New Zealand cities. Telecom is precluded under the Telecommunications Amendment Act from directly consuming UCLL for three years post-Demerger (refer new Zealand regulation for further details) which, together with the launch of Chorus’ Baseband IP service, means that Telecom is competing for copper-based business against service providers in some areas that are currently able to purchase lower-cost inputs from Chorus to support their voice and broadband services.
While the Government’s policy of telecommunications regulation has enabled several retail service providers to successfully enter the market, Telecom, as the incumbent, still remains the market leader (by connections) in most market segments, with the exception of the mobile market where Telecom is number two.
Telecom has a number of competitive advantages, including:
• the number one or two positions in all core markets: Telecom’s financial performance is underpinned by its leading position in the New Zealand telecommunications sector, being the number one service provider in all market segments other than mobile, where Telecom is number two behind Vodafone, enabling unique and compelling converged customer propositions.
• strong brands with national presence: The Telecom brand is well established and with high recognition amongst New Zealand consumers with Telecom having been the leading telecommunications company in New Zealand for many years. The strong Telecom brand helps ensure that the business maintains its strong market position as number one or number two telecommunications service provider.
• Diversified and comprehensive product portfolio: Telecom provides retail and wholesale products and services ranging from wholesale and international products to mass-market voice and data.
• large scale, strategic assets: Telecom owns significant large scale strategic telecommunications assets encompassing an all 3G mobile network, national backhaul networks and a 50% interest in the Southern Cross international cable connecting New Zealand with international markets.

Telecom Annual Report 201224 |
OUR COMPANY
australian competitive environmentThe Australian Government has commenced a fibre deployment initiative for an estimated A$39.5 billion national broadband network (NBN). The NBN rollout is driving a significant amount of market consolidation. To create a more transparent and competitive environment before the NBN rollout is complete, Telstra is required to structurally separate.
On 27 February 2012 the Australian Competition and Consumer Commission (ACCC) accepted Telstra’s structural separation undertaking (SSU) and approved the accompanying migration plan. The SSU implements a migration model of structural separation in which Telstra will progressively decommission its own fixed line access networks and instead use the wholesale-only NBN to supply downstream services, as the NBN fibre access network is built. Due to the progressive nature of this separation, the SSU specifies a range of measures that are intended to promote equivalence and transparency in Telstra’s supply of regulated services to wholesale customers and its retail businesses. In particular, Telstra commits in the SSU to provide equivalent outcomes for wholesale customers as are achievable by Telstra’s retail businesses. Telstra continues to be vertically integrated in relation to its ownership of passive infrastructure that will be relevant to the supply of NBN-based services (which includes 111 of the 121 NBN points of interconnections (POI) sites located in Telstra exchange buildings and underground facilities, such as ducts, pits and manholes leading into those POI sites). This raised concerns that Telstra would have ongoing incentives and the ability to discriminate against access seekers. The SSU contains arrangements for AAPT and other competitors to access the passive infrastructure, including provisions to manage order queues and common construction works. however, the arrangements:
• allow Telstra to reserve space in its facilities for its own genuine anticipated requirements and to reject an order from an access seeker where such capacity has been reserved; and
• only apply for the purpose of interconnection with Telstra’s active declared services and do not extend to interconnection with the NBN.
Telstra and Optus are AAPT’s main competitors in the business and wholesale voice, data and internet market. The local calling market remains dominated by Telstra, as it owns most of the Australian domestic local loop network until that network is decommissioned in the transition to the NBN. Interconnection with Telstra’s access network is necessary for competitive carriers, including AAPT, to offer many telecommunications services and AAPT therefore relies on the Australian competition regulator to obtain access. There is significant competition in the provision of long-distance national and international voice and mobile telecommunications services and long-distance national and international data services to businesses. Price reductions, which have already been seen in the market for long-distance and local fixed line services, are expected to continue.
CustomersTelecom’s mission is to become number one in broadband, mobile and ICT in New Zealand. Telecom’s vision is to achieve this by putting customers at the heart of its business and, in doing so, become New Zealand’s most preferred company.
Telecom provides fixed, mobile and IT products and services to retail and wholesale customers with:
• over 1 million fixed line residential and SME customers in New Zealand;
• over 1.5 million XT mobile connections (consumer and business) in New Zealand;
• over 800,000 fixed and mobile internet and broadband customers in New Zealand;
• around 70 wholesale customers in New Zealand, comprising mainly retail service providers;
• 200 international wholesale and retail providers across the world, in addition to providing outsourced international calling solutions for other telecommunications providers, mobile operators globally and cable television companies in Europe and the United States;
• around 2,800 business clients across Australasia, using Gen-i’s ICT services;
• over 4,000 businesses connected with fibre; and
• over 6,000 business and 300 wholesale customers in Australia using AAPT’s services.
Telecom now has four customer-facing business units: Retail, Gen-i, Wholesale & International and AAPT, and further details on their customers can be found within these respective business unit sections in the organisational structure section below.
Details on Telecom’s key telecommunications and IT service markets can be found in the Industry and sub-sector outlook section below.
sales and marketing channels Telecom utilises a number of key channels to deliver its range of products and services to customers. These include:
• Telecom Retail’s network of more than 93 stores in New Zealand, made up of 33 Telecom-owned retail stores, as well as 60 dealer outlets dedicated to Telecom products and services. Included within the 60 dealer outlets are 30 Telecom business hubs in local regions around New Zealand to support customers with business communication needs.
• Telecom Retail’s digital platforms to communicate with its customers. Telecom’s primary website, telecom.co.nz, receives over 650,000 unique visitors every month and was revamped in FY12 to improve customer experience, particularly to make it easier for customers to research and buy mobile devices.
• Telecom Retail has approximately 1,050 service representatives staffing its New Zealand-based sales and support helpdesks (either based in contact centres or as agents at home). Phones are answered 24 hours a day, every day of the year. Telecom also uses offshore customer support services to provide diversity and technical expertise to customers. Call centres remain an
| 25investor.telecom.co.nz
important channel for customer interaction and for inbound sales inquiries and frontline sales opportunities.
• Other important and developing channels for retail customer interaction, such as online channels and on-device service functions. Customers are able to initiate a range of self-service functions on Telecom’s website, as well as on their mobile devices.
• Telecom Retail’s focus on sharing advice and insights with small business customers via social media and direct mail activities, while also participating in industry associations.
• Gen-i operates a direct client relationship model designed to foster long-term and sustained ICT relationships with clients. It appoints dedicated client teams to build and retain industry knowledge, simplify lines of communication and to offer clients expertise and accountability.
• Wholesale dealing direct with its retail service providers through its own sales and service channels but has an arrangement with Chorus for a subset of services (including PSTN resale and legacy data services) where Chorus fronts the relationship with service providers as agent for Wholesale.
• In Australia, AAPT wholesale focuses on developing alignment with key players in the market and building on existing relationships with strategic customers and partners by leveraging investment in next generation and extensive access networks. AAPT’s business teams work directly with customers, and potential customers, to develop and satisfy their requirements by building tailored solutions.
Industry trends and corporate strategyThe global telecommunications and IT industry continues to evolve rapidly, with the development of new technologies and sources of competition and further convergence with other industries. The manner in which communications, entertainment and IT services are consumed is fundamentally changing, thereby creating both opportunities and risks for existing business models in the telecommunications and IT sector.
The fundamental trends affecting the telecommunications and IT services markets in New Zealand are similar to those faced globally by incumbent telecommunications companies in mature markets and include:
• rapid growth in usage of mobile, internet and data services;
• flat revenues in the overall communications market;
• increasing competitive intensity across all telecommunications and IT services markets;
• a growing preference for internet-enabled services in each of the mass-market, SME and corporate sectors; and
• globalisation of technology manufacturers and increased focus on open platform-enabled solutions.
In response to these market conditions, and in light of the Government-led UFB initiative, pre-Demerger Telecom developed a strategy to reflect its increasingly challenging operating environment, as well as ensuring it was appropriately structured to compete in the fibre future. Known as Vision2013, this strategy was designed to bolster Telecom’s existing value retention, deliver simplification and accelerate cost reduction and growth plans.
The Vision2013 strategy is focused on four key themes, which are:
• enablers: Delivering changes to Telecom’s operating model and structural design to better enable the transition to the post-Demerger environment.
• Market strategy: Exiting non-core markets and focusing investment in new or existing markets with higher returns and growth opportunities.
• operational excellence: Reducing failure rates and simplifying the business in order to deliver improved customer experience, sustainably lower operating costs and increased returns from capital investment.
• Commercial excellence: Driving a focus on customer satisfaction, customer retention and margin improvement from the delivery of new fibre, mobile and ICT customer offerings.
Telecom’s operational excellence activities target operating expenses and capital expenditure efficiency through simplifying its products and platforms and reducing personnel costs. Operational excellence is also expected to deliver process simplification and a reduction in errors and re-work. As well as lowering costs, this is expected to drive improvements in customer experience. In FY12 Telecom re-engineered certain key operational processes, initially within broadband, managed data and mobile products, re-negotiated certain supplier contracts to improve service delivery and reduce costs and delivered cost benefits from insourcing previously outsourced support functions.
Telecom’s commercial excellence activities target improvement of margins across the product portfolio by lowering costs within its customer operations and growing revenue through new products and services. Telecom’s churn-reduction programme will be enabled by innovative commercial bundles of fixed line, mobile communication and value-added IP services packages. In FY12 Telecom has continued to drive penetration of bundled consumer and SME packages, focused its resources on targeting high-value mobile market segments and has re-signed some key ICT business customers.
These operational and commercial initiatives will be supported by further investment in Telecom’s customer satisfaction initiatives, such as ‘Right First Time’, which systematically identifies and removes sources of inefficient service delivery and customer pain points. In the longer term, Telecom aims to deliver revenue growth, possibly by exploring opportunities to enter new adjacent markets, such as entertainment, financial services or consumer payments.

Telecom Annual Report 201226 |
OUR COMPANY
Industry and sub-sector outlook This section describes Telecom’s share of the key markets in the New Zealand telecommunications and IT services industry in which Telecom competes, and provides an overview of the market trends, competitive landscape and Telecom’s performance.
Fixed access & Calling
Telecom Retail & Gen-i access lines (000s)
Other market participants access lines (000s)
Telecom Retail & Gen-i market share
As at 30 Jun 2010 As at 30 Jun 2011 As at 30 Jun 2012
1,226 1,137 1,049
545 608636
1,771 1,7451,685
69%65%
62%
Source: IDC NZ Telco Tracker for Fy10 and Fy11 and management estimates for Fy12
telecom’s nZ Calling revenues (excl aapt, transits)
0
100
200
300
400
500
600
FY10 FY11 FY12
NZ$
M
Source: Telecom Fy12 Results
Fixed access and calling continues to be a core market for Telecom, with a current market share in fixed access and calling of approximately 62% of total access lines. As with other international markets, fixed access and calling within New Zealand is in decline, as usage moves to mobile and ‘over the top’ internet-based services, such as Skype. however, in New Zealand historically the rate of decline has been slower than many offshore markets as a result of free local calling being bundled with line rental, thereby retaining a large portion of the calling volume on the fixed line.
Telecom’s principal competitors in the fixed access and calling market are generally affiliates of large multinational corporations with substantial resources, particularly Vodafone, which has recently announced its intention to acquire Telstra’s fully owned
New Zealand subsidiary, TelstraClear (subject to final regulatory approvals) thereby providing it with an increased presence in phone lines and landline broadband.
Competition within the fixed line business has continued to increase, particularly in metropolitan and urban areas of New Zealand. Retail service providers that have invested in UCLL equipment are aggressively marketing bundles of services, predominantly using price as the differentiator. The result is that in FY12 Telecom’s New Zealand fixed access revenues have decreased by around 4%, and fixed calling revenues by around 14%, when compared to FY11, in line with trends experienced by global peers.
An increased rate of decline in fixed line access and calling is one of the key risks facing Telecom. however, Telecom’s Vision2013 strategy is focused on slowing the decline through the use of bundling other services such as broadband. The Vision2013 strategy is focused on growing revenues in broadband, mobile and ICT and reducing costs in order to maintain or grow earnings.
Broadband (fixed)
Telecom Retail & Gen-i broadband lines (000s)
Other market participants broadband lines (000s)
Telecom Retail & Gen-i market share
As at 30 Jun 2010 As at 30 Jun 2011 As at 30 Jun 2012
598 610 619
497 571 615
1,0951,181
1,234
55% 52%50%
Source: IDC NZ Telco Tracker for Fy10 and Fy11 and management estimates for Fy12
telecom’s nZ Broadband revenues (excl aapt)
FY10 FY11 FY12
50
100
150
200
250
300
350
NZ$
M
Source: Telecom Fy12 Results
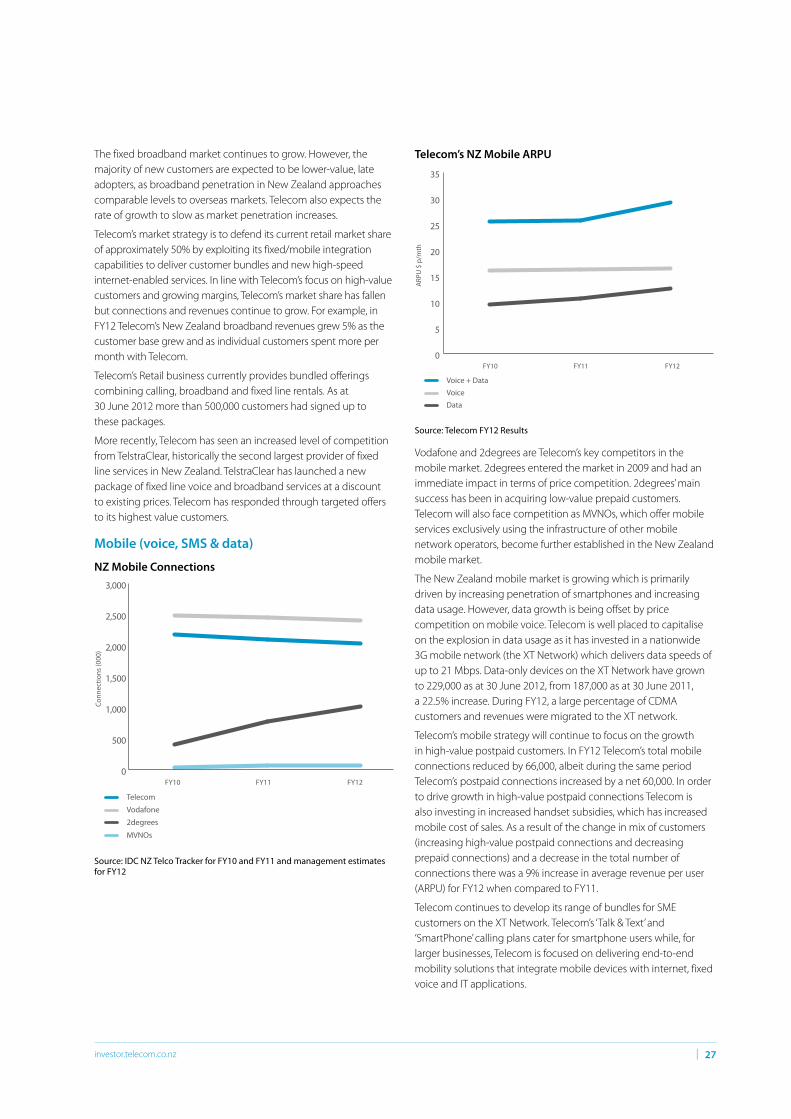
| 27investor.telecom.co.nz
The fixed broadband market continues to grow. however, the majority of new customers are expected to be lower-value, late adopters, as broadband penetration in New Zealand approaches comparable levels to overseas markets. Telecom also expects the rate of growth to slow as market penetration increases.
Telecom’s market strategy is to defend its current retail market share of approximately 50% by exploiting its fixed/mobile integration capabilities to deliver customer bundles and new high-speed internet-enabled services. In line with Telecom’s focus on high-value customers and growing margins, Telecom’s market share has fallen but connections and revenues continue to grow. For example, in FY12 Telecom’s New Zealand broadband revenues grew 5% as the customer base grew and as individual customers spent more per month with Telecom.
Telecom’s Retail business currently provides bundled offerings combining calling, broadband and fixed line rentals. As at 30 June 2012 more than 500,000 customers had signed up to these packages.
More recently, Telecom has seen an increased level of competition from TelstraClear, historically the second largest provider of fixed line services in New Zealand. TelstraClear has launched a new package of fixed line voice and broadband services at a discount to existing prices. Telecom has responded through targeted offers to its highest value customers.
Mobile (voice, sMs & data)
nZ Mobile Connections
2degrees
MVNOs
Vodafone
Telecom
FY10 FY11 FY12
Con
nect
ions
(000
)
0
500
1,000
1,500
2,000
2,500
3,000
Source: IDC NZ Telco Tracker for Fy10 and Fy11 and management estimates for Fy12
telecom’s nZ Mobile arpu
Data
Voice
Voice + Data
FY10 FY11 FY120
5
10
15
20
25
30
35
ARP
U $
p/m
th
Source: Telecom Fy12 Results
Vodafone and 2degrees are Telecom’s key competitors in the mobile market. 2degrees entered the market in 2009 and had an immediate impact in terms of price competition. 2degrees’ main success has been in acquiring low-value prepaid customers. Telecom will also face competition as MVNOs, which offer mobile services exclusively using the infrastructure of other mobile network operators, become further established in the New Zealand mobile market.
The New Zealand mobile market is growing which is primarily driven by increasing penetration of smartphones and increasing data usage. however, data growth is being offset by price competition on mobile voice. Telecom is well placed to capitalise on the explosion in data usage as it has invested in a nationwide 3G mobile network (the XT Network) which delivers data speeds of up to 21 Mbps. Data-only devices on the XT Network have grown to 229,000 as at 30 June 2012, from 187,000 as at 30 June 2011, a 22.5% increase. During FY12, a large percentage of CDMA customers and revenues were migrated to the XT network.
Telecom’s mobile strategy will continue to focus on the growth in high-value postpaid customers. In FY12 Telecom’s total mobile connections reduced by 66,000, albeit during the same period Telecom’s postpaid connections increased by a net 60,000. In order to drive growth in high-value postpaid connections Telecom is also investing in increased handset subsidies, which has increased mobile cost of sales. As a result of the change in mix of customers (increasing high-value postpaid connections and decreasing prepaid connections) and a decrease in the total number of connections there was a 9% increase in average revenue per user (ARPU) for FY12 when compared to FY11.
Telecom continues to develop its range of bundles for SME customers on the XT Network. Telecom’s ‘Talk & Text’ and ‘SmartPhone’ calling plans cater for smartphone users while, for larger businesses, Telecom is focused on delivering end-to-end mobility solutions that integrate mobile devices with internet, fixed voice and IT applications.

Telecom Annual Report 201228 |
OUR COMPANY
In the Corporate market Gen-i’s market share (according to IDC NZ Telco Tracker in January 2012) had grown to 71% driven by strong customer acquisitions.
It servicesThe IT services market in New Zealand has experienced strong growth over recent years. According to market analysis by an independent consultant, IDC, Gen-i had approximately 14% of the New Zealand IT services market in FY12, making Gen-i the domestic market leader. In particular, Gen-i holds the leading share in hosting infrastructure services and network management; key areas of adjacency to Telecom’s core business and critical components of cloud-based computing services and converged ICT solutions.
Telecom’s portfolio of IT services includes:
• cloud computing services;
• managed IT services;
• IT outsourcing;
• IT software and hardware procurement; and
• professional services to assist organisations with business and technology investments.
These products are sold to corporate clients and government agencies in conjunction with core telecommunications products.
Gen-i faces competition in the New Zealand and Australian IT services market from both global IT solutions providers (such as hewlett Packard and IBM) and also from smaller niche providers. While operating conditions in Australia are challenging, Gen-i maintains a small presence there to support trans-Tasman customers.
gen-i It services
FY10 FY11 FY12
450
475
500
525
550
Reve
nue
$M
EBIT
DA
Mar
gin
Revenue
EBITDA margin
5%
6%
7%
8%
9%
10%
Source: Telecom Fy12 Results
While margins for the IT Services business (9% in FY12) are lower than traditional telco products, this business also has relatively low capital intensity and, accordingly, provides opportunities for free cash flow growth in the future as margins improve.
Organisational structureTelecom’s organisational model is shown below. Management believes this structure will enable the organisation to operate more effectively.
New Zealand
Corporate Centre
T&SS
Central Product Group
RetailWholesale & International
AAPT
Australia
Gen-i
The objective of this organisational model is to create a simplified and more balanced structure, consisting of:
• the existing customer units, which are segment specific (ie, consumer, business and large enterprise and wholesale and international) and are accountable for commercial innovation, customer experience and segment margin leadership and migration to new converged IP and fibre services;
• centralised operational units, intended to leverage scale and manage cost and capital expenditure across networks, IT platforms and the core network product portfolio. The operational units align pricing and product management/strategy with the design, build and in-life operations of IT platforms and processes, jointly targeting standardisation and simplification efficiency opportunities; and
• centralised corporate functions, intended to remove role duplication across Telecom. Lean centres of excellence provide support to business units and external stakeholders across finance, strategy, human resources, legal and communications.
Telecom’s Corporate Centre provides finance, communications, strategy, human resources, legal, regulatory and audit and risk management support for the Telecom business units.
The Central Product Group was created as an outcome of the Vision2013 strategy. Its role is to set a consistent strategy across the product portfolio and then to design, develop and manage pricing and business process activities associated with the products across all customer-facing units. This includes activities such as business case development, business planning, product delivery and commercial and market development.
Further detail on Telecom’s primary business units is provided below.

| 29investor.telecom.co.nz
RetailTelecom Retail provides mass-market products, services and support to consumer customers as well as to the SME market in New Zealand. Telecom Retail’s services include mobile voice, SMS and data, as well as fixed line access, calling and broadband.
Telecom Retail faced competition in the market on a number of fronts in FY12. In the first half of the year, Telecom Retail gained ground in broadband through innovative propositions, supported by effective marketing campaigns, and enhanced mobile postpaid connections with its Smartphonenetwork campaign. Later in FY12 it responded to significant price-based competition in the fixed market by increasing the data caps applying to its plans in May 2012 and continued to face intense competition for mobile prepaid customers. At the same time, Telecom Retail advanced its major programmes. These included a programme focused on creating effortless customer experiences (which has resulted in an improvement in customer satisfaction levels), a digitisation programme and various initiatives aimed at reducing costs.
In the fixed market, Telecom Retail’s main focus is on packages that bundle voice, broadband and value-added services. More than 95% of Telecom Retail’s consumer broadband customers had signed up to bundled packages as at 30 June 2012 (this figure was 83% as at 30 June 2011). In terms of value-added services, Telecom Retail offers its customers email and photo storage services, pursuant to a commercial arrangement with Yahoo!7 and provides TV services pursuant to an agreement with Sky. Telecom Retail is actively exploring additional value-added services in readiness for higher-speed broadband options.
Also in FY12 Telecom commenced development of the broadband-over-fibre services that will be sold employing the UFB fibre network being rolled out by Chorus over the next seven years. As part of Telecom’s development, Telecom Retail is running a UFB fibre trial programme, the output of which will inform the design of products and processes and optimise effortless customer experience. As of May 2012 there were a number of participants on the trial network, which will be extended to cover non-Chorus areas where other local fibre companies are operating.
Telecom Retail provided landline access and calling services to around 852,000 consumer customers at 30 June 2012 (932,000 customers as at 30 June 2011) and provided broadband services to around 547,000 consumer customers (541,000 customers as at 30 June 2011). As at 30 June 2012 Telecom Retail provided broadband lines to 52,000 SME customers (50,000 lines as at 30 June 2011) and provided access lines to 124,000 SME customers (129,000 lines as at 30 June 2011).
In the mobile market, Telecom Retail has focused on revenue and margin growth. The customer demand for mobile data continues to increase, primarily stimulated by the large increase in smartphone penetration on the WCDMA mobile network and the new functions and applications available to smartphone customers. These features have also attracted customers from Telecom’s CDMA network. The voice and text elements of Telecom’s CDMA services closed in
July 2012. Limited low-speed data services remain active with a view to closing these in August 2012. During FY12, a large percentage of CDMA customers and revenues were migrated to the WCDMA network.
Smartphone penetration has been stimulated in FY12 with the launch by Telecom Retail of its Smartphonenetwork strategy, which created a differentiated smartphone experience on Telecom’s WCDMA mobile network. Some of the key elements of this strategy were to promote the benefits of the WCDMA mobile network and to provide value through acquisition and retention offers and tariff plans. A critical component of the strategy was to promote an attractive line up of smartphone devices, which included the launch of the iPhone in November 2011. The Smartphonenetwork strategy has successfully increased Telecom’s base of high-value postpaid customers, with total mobile customers shown below:
NUMBER OF MOBILE CONNECTIONS(TELECOM RETAIL, GEN-I AND TELECOM WhOLESALE)
2012(000)
2011(000)
2010(000)
2012/2011% ChANGE
2011/2010% ChANGE
Prepaid (000s) 1,123 1,249 1,312 (10.1) (4.8)
Postpaid (000s) 908 848 859 7.1 (1.3)
Total 2,031 2,097 2,171 (3.1) (3.4)
In February 2012 Telecom Retail launched its new prepaid mobile brand called ‘Skinny’ targeting New Zealand’s youth demographic. Skinny is a stand-alone operation and is based in separate premises, but reports to the CEO of Telecom Retail. Skinny is working to establish its brand in its target market by focusing on events, social media and digital marketing. It has also established a number of distribution channels in order to drive connection growth.
Intensifying competition and commoditisation in the overall New Zealand mobile market gives rise to a number of risks and challenges for Telecom Retail. The keys risks and challenges are the increasing cost of acquiring postpaid mobile connections. The potential acquisition of TelstaClear by Vodafone may enable Vodafone to offer new, converged offers.
In light of these challenges, Telecom Retail intends to continue to drive its business to deliver effortless customer experiences to its customers, on retaining high-value customers, on leveraging its whole-of-business solutions, pursuing targeted cross-selling of relevant services to customers and on continuing to invest in digital platforms that make key service information readily available for customers.
Fy12 Developments & Highlights
• EBITDA up 3% in FY12 based on mobile revenue growth and focus on cost reductions
• Broadband connections and ARPU both up in FY12 (see performance section for more detail)
• Smartphonenetwork strategy delivering desired results
• ‘Skinny’ mobile prepay brand launched
• Fibre product development advancing
• Improvements in customer satisfaction levels

Telecom Annual Report 201230 |
OUR COMPANY
Gen-iGen-i is responsible for providing innovative ICT and cloud-based solutions to large corporate and government customers across New Zealand and Australia.
Gen-i provides ICT solutions for clients across New Zealand and Australia and has around 2,800 customers across a range of industries, including banking and finance, Government, energy, rural and healthcare. Gen-i’s earnings growth is built on leadership in networked IT and managed solutions across fixed and mobile and delivering operational efficiencies and simplification as customers migrate from legacy to IP and fibre-based solutions.
Gen-i has been undertaking a major transformation programme to focus on the strategic themes under Vision2013 of simplifying its value proposition, reducing cost, retaining value in its traditional telecommunications business, targeting growth in delivering mobile and next generation cloud computing services and growth in trans-Tasman clients. In FY12 Gen-i further streamlined its organisation, including establishing a strategic alliance with Infosys, which acquired Gen-i’s Software Solutions business, centralising support roles across the wider Group and has re-organised itself around two distinct customer segments, with specific service offerings:
• Enterprise and government clients with complex needs that require integrated ICT solutions and see ICT as strategic for their businesses and are therefore willing to pay for solutions; and
• Corporate/Business customers with simpler requirements that are cost-effective and more standardised platform-based ICT solutions, including IP-based telecommunications services and hosted/cloud-based IT solutions.
Gen-i’s portfolio of services includes:
• Managed voice services: network-based voice products and services, including hosted call centre solutions, IP-based networks, IP telephony and videoconferencing, including high definition videoconferencing, known as ‘telepresence’.
• Managed data and fibre services: network delivered and managed products and services, including Gen-i WAN Services (GWS) and remote-managed LAN and WAN services.
• Managed mobile services: mobile data and ICT solutions based on Telecom’s XT mobile network and wireless-based technologies. These include Gen-i Mobile Office, which extends full PABX functionality to mobile devices to improve the productivity of a mobile workforce.
• Hosted It services: such as security, collaboration and unified communications solutions (eg, Microsoft Lync), which are managed and delivered from our data centres.
• Cloud solutions: such as its ReadyCloud Infrastructure-as-a Service (IaaS) portfolio, including ReadyCloud Server and ReadyCloud Back-up launched in FY12.
• Managed It services: managed customer infrastructure (eg, desktop and end-user devices) managed storage and security services, hosting and application development and support.
• It outsourcing: incorporating a range of the above solutions and managing them on behalf of the customer either on the customer’s or Gen-i’s premises.
• procurement of hardware and software: including software and contract management services.
• professional services: Gen-i’s professional services division operates a business consultancy under the name ‘Davanti’, offering industry expertise and practical tools to assist organisations with business and technology investments. Gen-i’s Design and Delivery team also helps clients with the implementation of new technologies, while a training operation for clients operates under the name ‘Auldhouse’.
These services are supported by access to Telecom’s infrastructure in both New Zealand and Australia.
Gen-i continues to operate in a highly competitive market in competition with telecommunications service providers and both global and local IT solution providers. This competitive pressure is likely to continue as wider availability of fibre inputs allows for further growth of converged ICT solutions.
Fy12 Developments & Highlights
• EBITDA up 11% in FY12 through growth in mobile and focus on cost reductions
• Mobile market share grown to 71% in the corporate segment, (according to IDC) as at January 2012
• Market leader in NZ IT Services with 14% market share in FY12 (as measured by IDC)
• Establishment of strategic Infosys partnership, post sale of Software Solutions business
• Transformation improved service and reduced operating costs
• Focus on mobile and fibre leadership and hosted IT services

| 31investor.telecom.co.nz
Wholesale & InternationalTelecom Wholesale and Telecom International provide a range of regulated and commercial products to service providers throughout New Zealand and the world.
Under the Demerger Asset Allocation Plan, Telecom Wholesale retains significant national backhaul telecommunications assets and the PSTN network equipment.
Telecom Wholesale’s portfolio of voice, mobile, interconnection, managed data, internet access and national backhaul products offers retail service providers the ability to create and extend their own networks to be able to provide a wide range of telecommunications services to their end-users. Telecom Wholesale also offers resale products so service providers without their own nationwide networks can offer services nationally. Following the Demerger these resale services are sold to retail service providers under an agency agreement with Chorus. This is due to the complementary nature of these services with the Chorus broadband products that are typically bundled with resold voice services. Wholesale has approximately 70 customers, which include TelstraClear, Vodafone and 2degrees, Orcon, CallPlus and Compass.
The key challenge for the Wholesale business is maintaining its resold PSTN revenue in the face of lower cost input services available to other retail service providers from Chorus and other local fibre companies.
Telecom International delivers integrated telecommunications services between New Zealand, Australia and the rest of the world, by providing international voice, mobile, value-added calling and international transit services to carriers and offshore telecommunications providers.
Telecom International’s business provides:
• traditional voice services - handling New Zealand-and Australian-originated traffic minutes plus reciprocal traffic and provides other value-added services relating to this; and
• carrier service – providing international voice service products specific to the needs of international, wholesale and retail customers across fixed line, cable and mobile operators.
Telecom International utilises these services to enable carriers and retail operators to provide voice and mobile solutions to their customers. Telecom International terminates and receives traffic to and from all countries in the world, carrying approximately 3.7 billion minutes of global traffic per annum.
Telecom International has worked through a transformation programme, resulting in changes to its personnel, customer base and its operating network and supplier relationships. The goal has been to streamline the business, focusing on key customers being serviced by a cost-efficient and modern network infrastructure. This restructure responded to the key challenge facing International, which is the increasingly commoditised nature of the international voice market resulting from a declining per minute revenue structure.
Fy12 Developments & Highlights
• EBITDA increased by NZ$9 million through lower operating costs and mobile termination rate reductions
• Simpler wholesale business with less regulatory oversight post-Demerger
• Significant restructure on Demerger with Layer 2 broadband and data portfolio and associated teams migrating to Chorus
• Strong growth in WCDMA MVNO customer base
• Customer satisfaction survey rating of 7.8/10 achieved in April 2012 survey (FY11 7.6/10)
• Resold PSTN connections growth of 8%
• International business reorganised and as at 30 June 2012 delivered 40% operating costs reduction and increased customer satisfaction
AAPT AAPT has one of Australia’s largest fibre networks and telecommunications infrastructure – it owns and operates its own carrier-grade voice, data and internet network and is Australia’s largest business-only network provider.
AAPT is an Australian telecommunications provider that owns and operates its own carrier-grade voice, data and internet network, providing coverage to 85% of businesses and up to 80% of residences in metropolitan areas across Australia. This includes over 11,000 kilometres of interstate fibre, its own data centres in major capital cities, fibre access to 1,600 premises and mid-band ethernet in over 200 exchanges. AAPT has access to DSL coverage in over 400 exchanges focused on the major Australian cities and large metropolitan areas. AAPT connects more than 210 million voice calls and delivers 6,400 terabytes of customer downloads every month.
AAPT’s strategy is focused on leveraging its own infrastructure to drive profitable on-net services. Following the upgrade of its core network, AAPT now offers a range of new IP-centric business products supporting innovative new voice and data solutions. AAPT works closely with system integrators to jointly deliver telecommunications and IT services to certain large enterprise clients that operate both in New Zealand and Australia.
AAPT recently won the 2012 CeBIT.AU Business Award for Service Distinction.
AAPT has continued to rationalise and simplify its products, operations and IT platforms. As AAPT emerges from a period of cost reduction and operational improvement, it is now focused on a revenue growth plan within business and wholesale markets, using its IP network capabilities supported by a lower cost and online centric customer service and billing capabilities.
See our company – australian regulatory environment for an overview of the Australian national broadband network (NBN) and Telstra’s Structural Separation Undertaking.

Telecom Annual Report 201232 |
OUR COMPANY
Fy12 Developments & Highlights
• Adjusted EBITDA of A$67 million for FY12, down A$4 million compared to FY11, which included three months of the Consumer Division results prior to its sale in September 2010
• Adjusted free cash flow1 of A$36 million for FY12, up A$9 million compared to FY11
• Launched the first commercially available 100GB intercapital network link between Melbourne and Sydney in April 2012
• National Wholesale Broadband product launched and first customers and tolling commenced in FY12. This is a precursor to AAPT’s NBN aggregator positioning that provides access network aggregation, including NBN, for traditional and new customers
• Developed new partnerships with system integrators seeking data services from an independent network provider
• Launched Cloud services, including Solaris as a Service, content delivery network services and virtual data centres
• Won the 2012 Service Distinction award at CeBIT – recognising outstanding service delivery in the information and communications technology industry, in particular for AAPT’s Customer Charter initiative
• AAPT joined the Asia Pacific Cloud Alliance with Oracle, VADS (division of Telecom Malaysia), LG (Korea), hutchison Telecom (hong Kong and China) and Telstra as a founding member. The group will work to promote carrier-grade cloud solutions across Asia Pacific
1 Adjusted EBITDA and adjusted free cash flow are non-GAAP measures and are not comparable to the IFRS measure of net earnings. Adjusted free cash flow is calculated as adjusted EBITDA less capital expenditure. See the performance section for details of non-GAAP measures and a reconciliation.
Technology & Shared ServicesTelecom’s Technology & Shared Services (T&SS) division operates Telecom’s New Zealand shared business processes; develops, maintains and operates the New Zealand IT systems and networks; and aligns systems, platforms and processes with Telecom’s business objectives.
T&SS provides support for key products and services, examples of which include:
• Fixed and pstn life cycle management: T&SS operates and supports the PSTN platform, which is the platform that supports traditional fixed-voice telephony and is the key platform for sustaining Telecom’s current fixed line revenues. An intensive programme is under way to sustain this PSTN platform, much of which dates from the 1980s, in conjunction with the development of IP-based technologies. This programme consists of support agreements with vendors, securing equipment and ensuring key PSTN resources, skills and capabilities are retained within Telecom’s business units. T&SS develops, operates and
invests in architecture and support systems capabilities (including fulfil, assure and bill) for fixed line products and services.
• Mobile network: T&SS is responsible for supporting Telecom’s mobile network. T&SS continues to develop, operate and invest in network architecture and support systems capabilities (including fulfil, assure and bill) for mobile products and services.
• provisioning: T&SS processes requests for data and voice services from Telecom’s customer-facing operations, the Telecom website and Chorus customers, including allocating network resources and activating and commissioning services that require access to shared IT and network resources. T&SS facilitates the billing of nearly 1.6 million customer accounts each month, credit management, fraud management and information management services.
Since the Demerger, T&SS provides certain transitional and shared services to Chorus (see Company review – network, systems and other assets for more detail on Telecom’s transitional and shared service arrangements with Chorus).
Central Product GroupThe Central Product Group was set up through Vision2013 to set portfolio strategy and then design, develop and manage all network-delivered products and services and related pricing, including Retail voice, broadband, data, mobile, VAS and hosted IT services and commercial Wholesale & International, fixed and mobile voice and data services.
The key focus of the group is to deliver improved customer, financial and operational outcomes through world-class product lifecycle management. To support this the Central Product Group is also responsible for delivering related business and market insight, product analysis and economics, portfolio and product strategy, business and market development and partnering to support key outcomes including Telecom’s growth agenda.

| 33investor.telecom.co.nz
Company review
Network, systems and other assetsTelecom is New Zealand’s largest provider of telecommunications and IT services, by revenue, customers and assets. It has significant operational scale and scope, with assets including:
• the PSTN network equipment for fixed line calling;
• the WCDMA 3G mobile network;
• New Zealand-wide backhaul networks;
• a 50% ownership interest in the Southern Cross international cable; and
• one of Australia’s most extensive fixed IP networks.
network assets
telecom post-DemergerFollowing the Demerger the assets of Telecom were divided between Telecom and Chorus. The Telecommunications Amendment Act required Telecom to prepare an asset allocation plan. The asset allocation plan had to specify how each asset or category of assets was to be used to provide telecommunications services to the market, as well as the key terms of all the intended material sharing agreements between Telecom and Chorus.
The split is shown below:
Group assets that are split between Telecom and Chorus
Other assets including software and IT
Passive copper network
All access network and some backhaul fibre
Most ducts and manholes
Majority of exchange buildings
key Chorus assets
Mobile network towers, base stations, hardware and software
PSTN hardware and software
National transport fibre
International overseas companies, including AAPT and interests in the
Southern Cross Cable Network
Access electronics including DSLAMs and some Ethernet Aggregation switches
30 exchange buildings
key Telecom assets
Telecom Corporation of New Zealand Ltd
Other assets including software and IT

Telecom Annual Report 201234 |
OUR COMPANY
The former Telecom assets that became part of Chorus on Demerger included:
• local access, fibre, copper and physical infrastructure and majority of buildings throughout New Zealand;
• local access electronics and aggregation; and
• operational support systems and business support systems for managing wholesale service provider customers.
As a result of this split of assets, and in order to ensure efficient use of resources and investment, Telecom and Chorus have entered into various sharing arrangements and commercial agreements, which are on arm’s length terms as follows:
Commercial service agreements for products/services provided by Chorus
Chorus supplies various products and services on commercial terms to all retail service providers, including Telecom. These products and services broadly comprise:
• Copper Access Products – customer premise to exchange or cabinet;
• Fibre Access Products – customer premise to exchange or cabinet;
• Backhaul Products – exchange or cabinet to customer handover point;
• Co-location Products – rental of space in an exchange or cabinet; and
• Field Services Products – activity-based services supporting the provisioning, maintenance and build of the above products.
These products and services are provided by Chorus to Telecom under one of three umbrella services agreements: the Chorus UFB Services Agreement, the Chorus Services Agreement or the Wholesale Commercial Services Agreement (see Disclosures – Material contracts for further detail relating to these agreements).
The Wholesale Commercial Services Agreement and the Chorus Services Agreement govern the supply of services that the legacy Telecom Wholesale and Chorus business units supplied to customers prior to Demerger and Chorus now supplies to Telecom following the Demerger. The Chorus UFB services Agreement governs the supply of CFh-funded fibre products to Telecom (as it does to all retail service providers). Consistent with the draft Copper Undertakings, the legacy copper bitstream services will not be available to other retail service providers. Services that supersede those legacy copper services are available to other retail service providers.
Where Telecom has particular requirements in order to meet its obligations under the Telecommunications Service Obligation (TSO), these have been reflected in appropriate detail in the relevant commercial agreement between Chorus and Telecom. This is most relevant to the Baseband service but also applies to some backhaul, co-location and field services agreements.
Chorus also supplies regulated products to Telecom under the applicable Standard Terms Determinations.
shared systems agreement
Telecom’s Technology and Shared Services (T&SS) business unit provides a range of services to Chorus including:
• shared business processes (eg, fulfil, assure and bill);
• technology operational management of shared IT infrastructure and systems; and
• consultation, design and build services related to shared IT infrastructure and systems.
In order to minimise customer impact, migrations (and associated risk) industry cost and investment in legacy products, Chorus continues to use existing shared capability. Over time, Chorus will develop its own independent IT systems and processes to support its structural separation and will migrate away from shared systems and processes.
The ownership of shared systems assets is reflected in the Asset Allocation Plan and is driven by an overarching cost-recovery pricing principle for these services. Costs and allocation proportions for most services are reviewed from 30 June 2012 on six- or 12-month cycles depending on service type. Ad hoc cost reviews are available for major changes that have a material effect on the costs of providing services.
Chorus also provides Telecom with technology and operations management services (access to and use of Chorus-owned shared systems) and business operations services. Chorus uses existing systems, including systems developed to support the Operational Separation Undertakings, to help develop its fibre product capability and to support its current customers. Some of these systems are owned by Chorus.
network electronics sharing arrangement
Both Telecom and Chorus have agreed on the right to use certain network electronics for the life of that equipment (which is expected to vary from several months to up to ten years). The equipment covered by the Network Electronics Sharing Agreement includes:
• dense wavelength-division multiplexing (DWDM) transport equipment;
• transport radio antennas and feeders;
• network routers;
• data over digital transport equipment systems (PDh and SDh) and;
• spare ATM equipment.
The network electronic equipment included in this sharing arrangement excludes any equipment relating to Telecom’s mobile network.
property Co-location agreements (including a commercial co-location agreement and a wireless co-location agreement) Master leases agreement and leases for employees
Some exchanges have been retained by Telecom, with a majority being owned by Chorus. Access to these exchanges is needed by each party so that they can continue to access their assets and equipment to provide services to their customers and meet the appropriate service levels. Master lease and co-location agreements have been set up to provide access to each party as required and these are accounted for by Telecom as a finance lease.

| 35investor.telecom.co.nz
Fibre arrangements
In accordance with the Asset Allocation Plan, ownership of Telecom’s existing fibre (excluding fibre associated with international services) was split as part of the Demerger so that Telecom will retain ownership of the fibre capacity on certain national transport fibre links and backhaul links that are needed by Telecom in order to continue to provide telecommunications services to its customers. Chorus owns the remaining fibre.
Telecom and Chorus have entered into a Master Fibre Repair Agreement that requires Chorus to repair Telecom’s fibre to agreed minimum specifications where that fibre is damaged or suffers degradation over its life.
After the later of 25 years from the date of installation of the relevant fibre or 90 months from the Demerger Date (a sunset period) Chorus will no longer be obliged to contribute (on a proportional basis) to the cost of repairs/replacement of degraded fibre to bring such fibre up to a ‘minimum specification’, where Chorus itself does not also require such repairs to its own fibres. There is no sunset period relating to the cost sharing of repair/replacement of fibre damaged by an event (such as a digger cutting through a cable). In these cases the costs of repair/replacement shall be shared (on a proportional basis) for as long as the fibre has a ‘useable life’.
The Master Fibre Repair Agreement shall continue until Telecom ceases to hold any interests in the Telecom fibre or it is otherwise terminated in accordance with its terms. There is a reciprocal mechanism for each party to give written notice if it relinquishes its fibre or that its interest in specified fibre has been extinguished.
transitional services agreement
Telecom and Chorus entered into a Transitional Services Agreement that enables each company to continue to receive certain corporate and enterprise capabilities that were provided centrally prior to Demerger, while each party is given sufficient opportunity to independently develop its own capabilities or to engage third parties to provide those services.
The majority of the services supplied under the Transitional Service Agreement will be provided from the Demerger Date until 30 June 2014 unless specified otherwise or the customer elects early termination of the service.
The pricing principle for these services is cost recovery. Some services have a non-adjusting fixed cost basis, while other service charges and the allocation of cost proportions between the parties are reviewed from 30 June 2012 on six- or 12-month cycles depending on the type of cost or proportion. Ad hoc cost reviews are available for major changes that have a material effect on the costs of providing services.
agency agreement
In order to meet industry preference and to satisfy Chorus’ open access deeds of undertaking to provide UBA services bundled with a local access and calling service, Telecom has appointed Chorus to sell and manage agreed parts of Telecom’s wholesale services portfolio (in addition to the local access and calling service) on Telecom’s behalf.
Other retail service providers have specifically requested that certain wholesale services be available from Chorus as a ‘one-stop-shop’ avoiding the need for these retail service providers to deal with both Chorus and Telecom in relation to the relevant wholesale product set. The Agency Agreement is non-exclusive and Telecom is able to develop its own separate channel for these products.
The services provided by Chorus under this sharing arrangement include:
• PSTN resale services (including homeline and Business Line, smartphone services and NCA Activation);
• PSTN and IP interconnection;
• international data products;
• legacy data services, including grandfathered bitstream services; and
• commercial wholesale services.
Telecom remains responsible for retaining the commercial (contractual) relationship with the service provider, owns all products and delivers the product/service.
Telecom and Chorus have limited rights to terminate the Agency Agreement, while Chorus is still subject to a regulatory requirement to provide UBA services bundled with a local access and calling service.
Telecom pays Chorus a cost-based agency fee plus a margin, which is at risk for failure to meet certain service levels. The service fee was fixed to 30 June 2012 and thereafter reviewed annually.
gen-i Business agreement
Telecom provides mobile and fixed telephony products to Chorus under the Gen-i Business Agreement. The term of this agreement is up to 36 months or until such time that either party terminates the service (with three months’ written notice and payment of any early termination charges) or until Gen-i provides notice of the cessation of any service.
telecom’s new Zealand assetsTherefore, following the Demerger, Telecom’s New Zealand assets include:
• service platforms for voice and data applications: Telecom provides fixed line and value-added fixed line voice services over the PSTN. The PSTN provides analogue lines, ISDN lines and centrex lines. Smartphone services (or value-added fixed line voice services) which include call waiting and calling line identification, are available in most areas. Telecom’s ISDN is a digital switched service and is capable of transmitting voice, video and data from one location to another. Telecom’s ISDN lines have the flexibility of the standard telephone network, with additional high quality, fast and reliable digital transmission. Telecom continues to build IP-based solutions that are replacing the ISDN network and associated services. Telecom operates a high-speed internet access service using both copper-based DSL and fibre-based technologies. The Telecom broadband network is available to approximately 95% of Telecom’s customers. Telecom is trialling VDSL services that support voice and broadband applications and UFB bitstream services to deliver broadband over fibre. Significant resource is being deployed to

Telecom Annual Report 201236 |
OUR COMPANY
enable the consumption of UFB inputs from Chorus and the other local fibre companies to support Telecom’s fibre-based services. Telecom has also built a national IP/MPLS-based network that provides the connectivity backbone for virtually all of Telecom’s current data services, with an extensive service footprint. Telecom continues to invest in expanding its IP/MPLS-based network capacity and capability and in the underlying transport and information systems needed to ensure that customer service demands are met. This network provides the capability to deliver Telecom’s flagship IP-VPN data services for corporate customers and wholesale backhaul services for other service providers and is used for backhaul of core data traffic for other services, such as broadband and dial-up. Further investment is being made to deliver end-to-end quality of service and to support multi-service single access delivery models, whereby multiple services will be delivered over a single physical access, including voice, data, internet and other services.
• Mobile network: Telecom currently operates a 3G WCDMA network that operates at 850Mhz nationally and at 2100Mhz in certain metropolitan centres. All revenue-generating activities from Telecom’s CDMA network services ended in July 2012. Further decommissioning activity will continue over the next few months, including the closure of a small number of specialist data connections that remained open after 31 July. The WCDMA mobile network provides a coverage footprint of 97% of the places where New Zealanders live and work. The network offers both prepaid and postpaid mobile phone services, with a range of voice, packet data and content-based services available.
• national backhaul fibre network: the core network, or national backhaul, is the fibre backbone that links cities to the Auckland gateway.
• some exchange buildings: post-Demerger, Telecom owns 30 exchanges and Chorus own 632 exchanges. Telecom and Chorus both require space in the majority of these exchanges and have entered into lease arrangements in order to meet their specific business requirements.
• operating support systems and business support systems: Telecom has a programme of major initiatives to modernise its internal systems portfolio through adoption of enterprise architecture, the coordinated deployment of new systems and the retirement of old systems. Telecom is upgrading to a new customer relationship management system and has launched a new inventory and order management system. Investment in Telecom’s billing systems and network management systems continues to be extended. These initiatives will provide customers with self-service capabilities and customer service representatives improved access to the information and systems they need.
• sales/distribution channels and brand: outlined in our company – sales and marketing channels above.
Telecom also leases, but does not own, multiple office buildings, primarily in Auckland and Wellington, which house Telecom’s corporate, T&SS and business unit offices. Telecom’s corporate office, which is its principal executive office, is based in Auckland. The majority of Telecom’s Auckland offices were consolidated in late 2010 into a newly constructed building, ‘Telecom Place’, which at 28,877 square metres is the largest single-occupancy corporate
campus in New Zealand and is leased entirely by Telecom. Telecom has multiple leases over the four separate buildings for 12 years, with further rights of renewal once the initial 12-year lease term has expired. Most of Telecom’s offices in Wellington were also consolidated in FY12 into 19,000 square metres of a 26,000 square metre building. As with Auckland, Telecom has multiple leases over the 19,000 square metres of space in Wellington. The multiple lease model offers protection and risk mitigation should future business volumes require less accommodation. These new buildings enable Telecom to rationalise its property portfolio and bring together more of Telecom’s employees. Since the February 2011 Canterbury earthquake, Telecom has had to re-establish its office accommodation for approximately 1,200 staff in Christchurch in multiple leased sites away from the Red Zone cordoned area most impacted by the earthquake. Prior to the February 2011 earthquake, Telecom accommodated almost all Christchurch staff in a mix of owned and leased properties in the CBD area. These properties are subject to limited access only and are currently being assessed. The Grant Thorton building, a 13-story tower, in which Telecom leased three floors, has not been demolished, although final site tidy-up is under way. The other two leased sites have been terminated.
telecom’s australian assets AAPT operates a large national voice, data and internet telecommunications network, with its key network assets including:
• high-bandwidth transmission capacity linking Cairns, Brisbane, Sydney, Canberra, Melbourne, Adelaide and Perth. AAPT has exercised its option to upgrade the capacity by deploying dense wavelength division multiplexing (DWDM) on existing fibre pairs under a contract with Optus. The remaining term of the contract for dark fibre pairs is 15 years.
• Additional owned transmission of approximately 2,100 km of inland fibre between Brisbane, Sydney, Canberra and Melbourne that has been upgraded to DWDM.
• IP/MPLS network used for delivery of both internet services and IP-based services, such as IP-VPN, internet, carrier-grade ethernet and VoIP. The legacy networks are steadily being decommissioned.
• Access infrastructure, including ADSL2+ based voice, data and internet in over 400 exchanges across key capital cities in Australia, plus 200 key exchanges deployed with mid-band ethernet.
• Large central business district and metropolitan fibre networks in all major Australian capital cities, together with its national inter-capital backbone, which provides high-speed access to exchanges, data centres, wireless towers and to more than 1,300 buildings.
• Voice network comprising switching sites and large media gateways deployed in major capital cities to support VoIP services. AAPT has extensive interconnection to all major domestic carriers and has call collection across Australia.
• An intelligent network that uses service control points in Sydney and Melbourne and provides toll-free numbers and local rate numbers and presence in the form of mobile number portability and inbound number portability services. AAPT uses a signal transfer point system for signalling within AAPT’s PSTN intelligent

| 37investor.telecom.co.nz
network and for signalling to other carriers’ networks. AAPT’s intelligent network similarly provides toll-free services, and advanced interactive voice response capacity is provided via platforms that are deployed across both Sydney and Melbourne.
telecom’s international assets Telecom’s international network has been designed to maximise the performance and delivery of telecommunications services from its customers in New Zealand and Australia to the rest of the world. Telecom is connected to approximately 200 international telecommunications operators. The international network is 100% digital.
Telecom has a 50% equity investment in the Southern Cross Group, which owns and operates the Southern Cross trans-Pacific submarine fibre cable, linking New Zealand, Australia, Fiji, hawaii and the west coast of the United States. The Southern Cross cable provides international capacity for the growth of traffic generated by data services, including internet traffic, and commenced operations in November 2000. Southern Cross sells capacity to a small number of telecommunications companies, including Telecom.
In addition to the use of the Southern Cross cable, Telecom also uses the following third-party cable systems:
• TASMAN 2, linking Australia and New Zealand;
• SEAMEWE 3, linking Japan through South-East Asia, via the Middle East to Western Europe, with a link from Singapore to Australia;
• China-US, linking China and the United States;
• A-PNG-2, linking Papua New Guinea and Australia; and
• Atlantic Crossing, linking the United States and the United Kingdom.
Telecom owns satellite earth stations at Warkworth and Waitangi in the Chatham Islands, which are operated and maintained by Kordia, and Scott Base in Antarctica, which is operated and maintained by Downer (with technical support as required from Kordia). These satellite earth stations provide telecommunications services via Intelsat, Asiasat, Optus and SES Worldskies to destinations not generally served by international submarine cable systems.
Global Gateway Internet Service is Telecom’s managed IP transit service enabling access for New Zealand and Australian wholesale and retail customers to global internet services, via its international links and overseas transit and peering arrangements.
Telecom operates points of presence in Los Angeles, Singapore, London, Sydney and Auckland to obtain better options for its Australian and New Zealand retail customers, while generating new business with carriers seeking competitive wholesale pricing into Australia, New Zealand and the rest of the world. Telecom supports a wide range of traditional and IP-based voice and other services on its network to meet customers’ needs.
Key supplier relationships
strategic suppliers
Alcatel-Lucent is the major strategic supplier to Telecom of network equipment in New Zealand and manages Telecom’s fixed and mobile network through an outsourcing contract. Telecom and
Alcatel-Lucent have re-negotiated their contractual terms to simplify the way Telecom purchases network equipment and services from Alcatel-Lucent.
other
Telecom’s main external purchases include the acquisition of hardware for resale purposes, such as telephone handsets, modems and IT computing equipment. Telecom also purchases equipment for internal use in operating or building its networks or providing ICT offerings, such as fibre optic cabling and roadside cabinets or computers, servers and other related IT equipment. The majority of this equipment is sourced, either directly or indirectly, from overseas, with Telecom’s costs usually subject to the prevailing foreign exchange rates.
The operation of Telecom’s networks, as referred to above, is dependent upon the supply of electricity from electricity companies. In the instance of an electricity supply failure, Telecom has back-up generators in key exchanges that it is able to utilise.
Telecom continues its logistics outsourcing with Brightstar, an external logistics operator, which delivers mobile devices and supply chain services.
Chorus has taken on a supplier role to Telecom post-Demerger as set out above.
New Zealand RegulationThe telecommunications sector in New Zealand is governed principally by the Telecommunications Act 2001 (the ‘Act’). The Act provides for certain telecommunications services to be regulated by the Commerce Commission. Most services can be regulated under the Act on price and non-price terms, while other services may only have non-price terms determined.
previous regulatory regimeOver the last ten years Telecom has operated in the context of increasing Government regulation and has incurred significant costs, most recently associated with complying with the Operational Separation Undertakings (which required the operational separation of Telecom into network (pre-Demerger Chorus) wholesale and retail business units in accordance with a number of associated migration milestones). Telecom has also undertaken extensive capital investment to comply with the migration plans within the Operational Separation Undertakings, expended significant resources to maintain accounting separation and devoted considerable management attention and time to compliance.
new regulatory regime post-Demerger The Telecommunications (TSO, Broadband and other matters) Amendment Act 2011 (Telecommunications Amendment Act) was enacted on 30 June 2011 and made significant amendments to the Act; importantly it established a substantially revised regulatory regime that applied to Telecom and Chorus upon Demerger. The changes made removed many of the most onerous elements of Telecom’s significant regulatory burden and were a key advantage of the Demerger for Telecom.

Telecom Annual Report 201238 |
OUR COMPANY
The key changes to the regulatory regime have included:
• transfer of regulatory obligations in relation to key wholesale and access services to Chorus, including UCLL services, sub-loop unbundling services and UBA services;
• removal of the Operational Separation Undertakings;
• removal of the Independent Oversight Group that monitored Telecom’s compliance with respect to the Operational Separation Undertakings;
• removal of the ownership restrictions on existing or prospective Telecom shareholders (equivalent ownership restrictions were put in place for Chorus’ shareholders);
• a split of the obligations under the TSO between Telecom and Chorus to ensure that the appropriate demerged entity is responsible for providing the relevant services and products, such that residential telephone access remains available for all New Zealanders;
• introduction of oversight of the transitional and long-term commercial arrangements between Telecom and Chorus to ensure that these arrangements are on arm’s length terms, unlikely to harm competition and ensure the protection of confidential commercial and customer information;
• removal of the requirement for accounting separation, which required Telecom to publish regulatory financial statements as if its business units were operated as independent and unrelated companies;
• provision for a review of the obligations under the TSO in 2013; and
• provision for a review of the telecommunications regulatory framework to be commenced no later than September 2016, with best endeavours to complete the review no later than 31 March 2019.
The table below highlights the key regulatory changes.
regulatIon pre-DeMerger regulatIon post-DeMergerpre-DeMerger teleCoM teleCoM CHorus
Operational Separation Undertakings Yes N/A N/A
Accounting separation Yes No No
Independent Oversight Group Yes No No
Ownership restrictions Yes No Yes
Open access undertakings1 N/A No Yes
Obligations under the TSO2 Yes Yes Yes
Line of business restrictions3 No No Yes
Oversight of transitional and long-term sharing and
commercial arrangements between Chorus and Telecom
N/A Yes Yes
Notes:
1 The new open access undertakings are primarily directed to the principles of non-discrimination and equivalence of inputs (ie, all telecommunications providers are treated equally and on the same terms and conditions).
2 The Telecommunications Amendment Act requires a review of the TSO in 2013.
3 There is a transitional line of business restriction prohibiting Telecom from purchasing UCLL for three years.
The new regulatory environment significantly simplifies regulatory compliance and reduces compliance costs.
Current regulatory regimeFollowing the Demerger the key regulation that Telecom is subject to includes:
• a restriction on purchasing UCLL for three years after the Demerger date;
• certain TSO obligations (subject to any changes that may arise under the 2013 review);
• continued mobile and number portability regulation;
• resale of certain retail services; and
• any further regulation implemented.
In addition, Telecom (and Chorus) are subject to oversight of the arm’s length commercial sharing arrangements between Telecom and Chorus post-Demerger. Telecom is also subject to other legislative requirements, such as the Commerce Act 1986, the Fair Trading Act 1986, the Copyright Act 1994, as well as the Telecommunications Carrier Forum Codes of Conduct.
telecom as a purchaser of regulated services and restrictions on purchasing uCllTelecom is now a purchaser directly (in the case of UBA) and indirectly (in the case of UCLL) of regulated services.
Telecom purchases UBA directly from Chorus but is precluded from being an access seeker of the regulated UCLL service until 1 December 2014.

| 39investor.telecom.co.nz
In order to ensure that Telecom continues to be able to provide voice and other services to its retail and wholesale customers, and meet its TSO obligations, the Telecommunications Amendment Act introduced a new regulated service, namely the Unbundled Copper Low Frequency Service (UCLFS).
The initial pricing for UCLFS is the geographically averaged price for Chorus’ full UCLL service if it is taken on a standalone basis or, in the case where a person is also purchasing Chorus’ UBA service for that line, the cost of any additional elements of Chorus’ local loop network that are not recovered in the price for Chorus’ UBA service. The final pricing principle is the same except the cost of any additional elements of Chorus’ local loop network that are not recovered in the price for Chorus’ UBA service are calculated using a TSLRIC (forward-looking costing) methodology.
The New Zealand Commerce Commission (the Commission), of which the Telecommunications Commissioner is a member, is responsible for setting the regulated terms and conditions of supply for all of these services. It is currently consulting on the appropriate price for Chorus’ UCLL service. It is also required by the Telecommunications Amendment Act to use reasonable efforts to calculate the cost-based price for Chorus’ UBA service (which will apply from 1 December 2014) by 1 December 2012. Telecom expects that both of these pricing decisions may be subject to final pricing reviews on application by an interested party.
On 26 July 2012 the Commission issued a description paper inviting views on the approach it should take to implementing the benchmarking to set the Initial Pricing Principle for the Chorus UBA service. The Commission has also set out its timetable for the review which culminates in a final decision on 30 November 2012 for that service.
In the course of the Commission’s UCLL price review, it has also indicated that it may re-examine the relationship between the UCLFS and UCLL prices in the UCLL price review. All of these reviews have the potential to alter (including in a materially adverse manner) the input costs Telecom pays to Chorus. Given that Telecom is precluded from being an access seeker of the regulated UCLL service until 1 December 2014, it is potentially exposed to fluctuations in regulated input service costs in a different way from its competitors, which can purchase all of those services. A decision, for example, to de-link the UCLFS price from the UCLL price could result in Telecom facing an increase in its input costs relative to its retail service provider competitors until such time as it is able to purchase UCLL services.
universal service obligations – tsoThe TSO is the regulatory mechanism by which universal service obligations for residential, local access and calling services are imposed and administered.
The TSO obligations (ie, residential access continues to be made widely available, free local and emergency calling and price increases limited to CPI) have been retained post-Demerger but split between Telecom and Chorus as follows:
• Chorus will be required to maintain lines and coverage obligations; and
• Telecom will be required to provide retail services at the capped prices.
The Government is scheduled to commence a comprehensive review of the TSO in 2013, as required by the Act. It is expected that this review will take into account the effect of separation; compensation and funding; implementation of a Universal Service Obligation (USO) binding on all retail service providers; and enabling the TSO to be contestable. The review is expected to be completed in 2013 and there is no guarantee or certainty of the outcome with respect to any of the items covered within the regulatory framework review.
The Telecommunications Amendment Act also introduced the Telecommunications Development Levy (TDL), which is an industry levy of NZ$50 million per year between FY10 and FY16 and NZ$10 million each year thereafter (adjusted for CPI) to be paid by certain market participants (termed liable persons) annually in arrears. The levy can be used to pay for any TSO charges, non-urban telecommunications infrastructure, upgrades to emergency calling and other wider purposes, as long as a consultation process is followed.
The amount payable by each liable person (including Telecom) will be determined by the Commission based on the proportion of revenue that each liable person receives from telecommunications services offered by means of a public telephone network. The Commission has released its classification list of liable persons, which now also includes Chorus, but a decision on what should be classified as ‘qualified revenue’, which drives the calculation basis of the levy, remains outstanding with a final decision expected later in 2012.
The Government is also currently undertaking a review of the 111 emergency calling service arrangements and obligations to ensure that the 111 service operates in a framework that accommodates changing technologies, practices and industry structures, while providing certainty about the governance framework. New Zealand’s Ministry of Economic Development (MED), now a part of the Ministry of Business, Innovation and Employment, released a discussion paper on 10 February 2012 and received submissions on it in March 2012.
Continued Mobile, resale and number portability regulationTelecom continues to provide a number of regulated services. Standard Terms Determinations, which set detailed and enforceable terms and conditions of supply, are currently in place for Mobile Termination Access Services and Local and Mobile Number Portability. Telecom is also a named provider of the following regulated services, although there are no regulated determinations setting the detailed terms and conditions of supply of any of these services in operation today:
• interconnection with Telecom’s PSTN;
• resale of retail price-capped local calling and access services;
• resale of retail non-price capped local calling and access services;
• resale of retail services offered as part of a bundle of services; and
• fixed to mobile pre-selection service.
Investigation into trans-tasman mobile roamingIn May 2010 MED and Australia’s Department of Broadband, Communications and the Digital Economy released a discussion

Telecom Annual Report 201240 |
OUR COMPANY
paper on trans-Tasman mobile roaming rates and pricing transparency. Telecom made submissions on the discussion document in July 2010. On 28 April 2011 the Ministries announced a joint investigation into trans-Tasman mobile roaming pricing. The Ministries will prepare a draft decision, expected to be released sometime in the first half of FY13, that outlines their market assessment and the options for joint action in the event of a market failure being determined. These options may include regulatory intervention.
other regulationTelecom is also subject to the Telecommunications (Interception Capability) Act 2004, which requires network operators to ensure that every public telecommunications network that they own, control or operate, and every telecommunications service that they provide in New Zealand, has interception capability meeting the specifications set out in that Act. These requirements, which are currently under review by the Government, have the potential to drive significant compliance costs.
Similarly, Telecom remains subject to the Radiocommunications Act 1989, which governs the allocation and use of spectrum in New Zealand. Telecom maintains significant spectrum holdings in New Zealand. The Government is also consulting on the design of a future auction of spectrum in the 700Mhz range with the auction likely to take place in early 2013.
Telecom also continues to be subject to other legislative requirements, such as the requirements of the Commerce Act 1986, Fair Trading Act 1986, Copyright Act 1994 and the Telecommunications Carriers Forum codes of conduct. Any significant proceedings involving Telecom, in relation to these legislative requirements and any other litigation, are detailed in note 27 to the financial statements.
telecommunications regulatory framework reviewThe Telecommunications Amendment Act provides for a review of the telecommunications regulatory framework commencing before September 2016 and, with best endeavours, to complete the review by no later than 31 March 2019. The review must take into account the market structure and technology developments and competitive conditions in the industry at the time of the review, including the impact of fibre, copper, wireless and other telecommunications network investment. This review must consider whether the existing regulatory framework is most effective to promote competition and the legitimate commercial interests of access providers and seekers, to support innovation and to encourage efficient investment.
australian regulatory environment
overviewThe principal legislation in Australia in relation to telecommunications is the Telecommunications Act 1997 (the Australian Telecoms Act). This Act aims to provide a regulatory framework that promotes the long-term interests of end-users and the efficiency and international competitiveness of the Australian telecommunications industry.
regulatory bodiesThe Australian Communications and Media Authority (ACMA) regulates the industry in respect of industry-specific technical and consumer matters. ACMA is the regulator responsible for radiocommunications and telecommunications standards and is responsible for managing radio frequency spectrum (under the Radiocommunications Act) managing carrier and carriage service provider licensing and for enforcing the Australian Telecoms Act.
The Australian Competition and Consumer Commission (ACCC) is the regulator responsible under the Competition and Consumer Act 2010 (CCA) (formerly the Trade Practices Act) for administering the:
• general competition law regime;
• general consumer protection regime;
• telecommunications industry-specific access regime; and
• anti-competitive conduct and record keeping rule regimes.
The Australian Telecommunications Industry Ombudsman (TIO) is an industry body established to provide a dispute resolution forum for complaints from consumers and small business users. All carriers, as well as carriage service providers that supply a standard telephone service, are required to be members of the TIO, which is funded through charges levied on its members.
Industry self-regulation is also encouraged. The key self-regulatory body is the Communications Alliance, which develops industry codes of practice. Codes may be registered with the ACMA. The ACMA may enforce registered industry codes and may impose industry standards if self-regulation fails.
regulation of industry participantsA carrier licence must be held by the owner of the network unit that is used to supply carriage services. There is no limit on the number of carrier licences that may be issued by the ACMA. As a general rule, there is no time limit on a licence. Subject to the payment of an annual charge, a licence will continue to be in force until it is surrendered or cancelled. Among other things, carriers are obliged to comply with licence conditions, obligations under the Australian Telecoms Act, the telecommunications access regime and related obligations concerning access to carriers’ communications facilities.
As an alternative to being a carrier and obtaining a carrier licence, an industry participant may choose to be a Carriage Service Provider (CSP). A CSP is a provider of listed carriage services (that is, carriage services between two or more points, at least one of which is located in Australia) to the public using either network units owned by a carrier or its own network units that are covered by a nominated carrier declaration.
CSPs are not required to be individually licensed or registered but they must comply with the service provider rules under a class licence contained in the telecommunications legislation. Under these rules, CSPs must comply with minimum standards and, where they supply the standard telephone service, they must provide untimed local calls and directory assistance and be members of the TIO scheme.
AAPT has held a carrier licence since 1 July 1997 and is also a carriage service provider.
AAPT also holds spectrum licences within the 28 / 31 Ghz band under the Radiocommunications Act 1992, which were previously

| 41investor.telecom.co.nz
used for Local Multipoint Distribution Service (LMDS). These licences are due to expire on 31 January 2014.
A number of other regulations apply specifically to Telstra but have an impact on the remainder of the industry. Under the Telecommunications (Consumer Protection and Service Standards) Act 1999, Telstra can be subject to price controls made by the Minister for Broadband, Communications and the Digital Economy. In June 2012, following a public consultation process, the Minister extended the existing price control arrangements until 30 June 2014 with some amendments. Among other things, the amendments exempt services supplied by Telstra over the National Broadband Network or other similar networks from the price control arrangements but retain the price cap on untimed local calls, and charges for directory assistance services continue to be subject to disallowance by the minister.
CompetitionAnti-competitive practices in the telecommunications industry are subject to a general anti-competitive regime and also to a telecommunications-specific regime contained in the CCA. Under the telecommunications-specific regime, a carrier or CSP will be held to have engaged in anti-competitive conduct if it has a substantial degree of power in a telecommunications market and takes advantage of that power with the effect, or likely effect, of substantially lessening competition in that, or any other, telecommunications market or breaches certain other of the general competition law prohibitions. A competition notice may be issued by the ACCC stating that a particular carrier or CSP has contravened, or is contravening, the competition rule. Substantial financial penalties apply to breaches of the competition rule when a competition notice is in force.
telstra’s structural separation undertakingOn 27 February 2012 the ACCC accepted Telstra’s structural separation undertaking (SSU) and approved the accompanying migration plan. The SSU implements a migration model of ‘structural’ separation in which Telstra will progressively decommission its own fixed line access networks and instead use the wholesale-only national broadband network (NBN) to supply downstream services, as the NBN fibre access network is built.
Due to the progressive nature of this ‘separation’, the SSU specifies a range of measures that are intended to promote equivalence and transparency in Telstra’s supply of regulated services to wholesale customers and retail businesses. In particular, Telstra commits in the SSU to provide equivalent outcomes for wholesale customers as are achievable by Telstra’s retail businesses.
Telstra continues to be vertically integrated in relation to its ownership of passive infrastructure that will be relevant to the supply of NBN-based services.
Declared servicesThe CCA contains an industry-specific regime for access to declared telecommunications services, which is administered by the ACCC. There are generally two ways for a service to become declared:
1. services can be declared by the ACCC following a public inquiry; or
2. the ACCC can also accept a special access undertaking from the provider of a service that has the effect of declaring the services to which the special access undertaking applies.
For services that are being supplied or intended to be supplied by NBN Co Ltd (NBN Co) there is a third method for declaration whereby an NBN Co service will become declared once NBN Co publishes a Standard Form of Access Agreement for that service on its website.
All services supplied over the NBN will be declared services. The ACCC is currently considering a special access undertaking lodged by the NBN Co and NBN Tasmania Ltd, which, if accepted, will form part of the regulatory framework for access to the NBN.
Once a service is declared:
• the access provider becomes subject to standard access obligations and is obliged to supply the service to an access seeker upon request; and
• the ACCC is required to make an access determination for each declared service, which can include price and non-price terms of access to the declared service.
An access determination is intended to create a benchmark that access seekers can fall back on while still allowing parties to negotiate different terms of access. In addition, the ACCC can, in urgent circumstances, make binding rules of conduct to specify access terms and conditions or require a carrier or CSP to comply with its applicable standard access obligations in a specified manner.
An access determination or binding rules of conduct will only apply to the extent that it is consistent with an existing commercial agreement between an access seeker and an access provider.
aCCC pricing of declared servicesTo date the ACCC has made final access determinations setting out regulated pricing for each of the following declared fixed line services:
• unconditioned local loop service;
• wholesale line rental;
• line sharing services;
• public switched telephone network originating access;
• public switched telephone network terminating access; and
• local carriage service.
In December 2011 the ACCC varied the fixed line services final access determinations to remove the geographic exemption provisions for the wholesale line rental, local carriage service and public switched telephone network originating access services.
In June 2012 the ACCC made a final access determination for the domestic transmission capacity service, which includes both price and non-price terms. The price terms are based on a domestic benchmark of prices in competitive areas and on competitive routes.
In February 2012 the ACCC commenced a public inquiry and issued a discussion paper into the making of a final access determination for the declared wholesale ADSL service and the local bitstream access service. These processes are still ongoing.
Local number portability has been available to all carriers since 1999. Customers can keep their local numbers when changing service providers. Mobile number portability has been available since 2001 and the portability of Freephone (1800) and local Rate (13) numbers has been available since 2000.

Telecom Annual Report 201242 |
OUR COMPANY
other recent reformsLevel playing field arrangements under the Australian Telecoms Act and the CCA now apply to non-NBN fixed networks, which are supplying, or will supply, a Layer 2 bitstream service principally to residential or small business customers that were built, upgraded, altered or extended from 1 January 2011 to be a ‘superfast network’ capable of download transmission speed of, or greater than, 25 mgbps. In general, the level playing field arrangements mean that such ‘superfast networks’ must be wholesale-only and that the operator of such networks must supply a Layer 2 bitstream service on an open-access and non-discriminatory basis.
Non-discrimination provisions have been introduced into the CCA as part of the NBN reforms. The non-discrimination provisions apply to NBN corporations (such as NBN Co) and providers of Layer 2 bitstream services over designated superfast telecommunications networks (collectively referred to as ‘network access providers’). The non-discrimination provisions prohibit network access providers from discriminating between access seekers or in favour of themselves, in complying with their applicable standard access obligations.
Corporate ResponsibilityDuring FY12 Telecom further developed its approach to corporate responsibility. Some of the initiatives underway are described in more detail below.
The following table sets out key corporate responsibility measures for Telecom over the last three years. Prior year metrics have not been re-presented to give effect to the Demerger unless otherwise stated:
MEASURE
ADDITIONAL INFORMATION/SOURCE
Fy12
Fy11
Fy10
Fy12% ChANGE
Fy11% ChANGE
our business and economic impact:Net earnings before income tax (NZ$m) From continuing operations (excluding
Chorus), per the financial statements 423 (83) 16 NM NM
Corporate taxes paid/(refunded) (NZ$m) Values of all income taxes paid per the
financial statements 120 127 (1) (5.5) NM
Labour costs (NZ$m) Value of total labour costs, including costs
that are capitalised 876 1,005 1,035 (12.8) (2.9)
Group capital expenditure (NZ$m) Annual purchases 528 914 1,183 (42.2) (22.7)
Dividends paid (NZ$m) Per the financial statements 340 313 327 8.6 (4.3)
our people and community:Total employees Total number of full-time-equivalent (FTE)
employees and insourced contractors. For
continuing operations (excluding Chorus) 7,866 8,315 8,717 (5.4) (4.6)
Injury rate1 Number of injuries per 100 permanent
employees 0.31 0.34 0.32 (8.8) 6.3
Sickness absence rates Percentage of calendar days lost to sickness 2.0% 1.9% 2.0% 0.1 (0.1)
Learning and development investment
(NZ$m)
NZ$ amount directly invested in employee
learning and development 15 20 21 (25.0) (4.8)
Employee volunteering3 Percentage of employees who have taken
volunteer leave 30.0% n/a n/a n/a n/a
Payroll giving3 Percentage of employees who have donated
through the payroll giving system 13.7% n/a n/a n/a n/a
Donations to the Telecom Foundation
(NZ$m)
Total donations to the Telecom Foundation
(see note 5 in the financial statements) 5 n/a n/a n/a n/a
our environment and resources1&2 Electricity consumption Total electricity consumed off national grid
(Gigawatt hours) 188 252 244 (25.4) 3.3
Electricity savings Measure of effectiveness of National Power
Savings Programme (Gigawatt hours) 5.2 11.0 5.2 (52.7) NM
Renewable electricity Percentage of total electricity consumption
from renewable sources 71% 77% 74% (6) 3
Greenhouse gas emissions Total emissions in carbon dioxide-
equivalents (Co2e) (kilotonnes) 44 48 54 (8.3) (11.1)
Waste to landfill Total residual waste (tonnes) 131 185 202 (29.2) (8.4)
Recycling Percentage of overall office waste recycled 53% 59% 58% (6) 1
1 The environmental and lost-time injury rate measures include results only from Telecom’s New Zealand operations.
2 Greenhouse (GHG) emission information is based on the best available data at the time of publication and are estimated data in advance of the Government’s release of official data for the year. Prior years’ carbon information has been restated based on the most recently available official data.
3 These initiatives are administered by the Telecom Foundation.

| 43investor.telecom.co.nz
our business and economic impactTelecom contributes to the local economies in which it operates in a variety of ways, including through paying taxes, wages, salaries and investing in capital. As one of New Zealand’s largest companies, the economic impact of Telecom’s business activities is substantial and in FY12 net earnings before income tax from continuing operations were NZ$423 million, which was up from a net loss before tax of NZ$83 million in FY11. In FY12 Telecom paid corporate taxes of NZ$120 million. Telecom is also an employer of over 7,800 people and had recognised labour costs of NZ$876 million in FY12 (down NZ$129 million from FY11). Group capital expenditure, which includes the investment in network infrastructure, was NZ$528 million in FY12, a decrease of NZ$386 million when compared to FY11. Dividends paid in FY12 were NZ$340 million. See performance for a discussion and analysis of our FY12 results compared with FY11.
our peopleFY12 was a big year for our people with an unprecedented amount of change related to the Demerger and establishment of a new operating model. We supported our people during this period through a change communications initiative, which focused on building the capability and confidence of our leaders to communicate in a way that inspired and connected their people. Workshops covering how to manage through change and personal resilience were also offered to our people.
Our people are critical to our success. We link our strategy through to our people’s individual objectives through our performance management process, creating connection between what our employees do on a day-to-day basis and our strategic goals. Telecom’s values, and the behaviours that underpin them, also play a critical part in our performance and reward framework. These make up 30% of employees’ individual performance measurements.
Telecom continues to focus on employee engagement and seeking ways to increase our people’s emotional and intellectual commitment to Telecom. In FY12 Telecom reinforced people leader accountability for local, team-based engagement action planning. Insights from our people on engagement drivers were gathered from a variety of means, including focus groups and an engagement questionnaire.
DiversityDiversity of thought is a business imperative to reach our goals and deliver our strategy. Diverse backgrounds, experience and perspectives are critical to build a leading-edge business and to deliver for Telecom’s customers. Telecom is committed to attracting, recruiting, developing, promoting and retaining a diverse group of talented individuals who will help drive Telecom’s business performance.
In FY12 Telecom launched the Telecom Women in Leadership Programme – a three-month programme focused on high potential women who would benefit from building a network of like-minded women, gaining insight into themselves and developing critical behaviours to enable their success.
Telecom also introduced the Women’s Leadership Forums. The inaugural Women’s Leadership Forum was held in November 2011,
led by former Telecom Director, Sue Sheldon, on the eve of the Demerger. By aiming to create opportunities to learn and reflect on diversity issues and provide both male and female employees with access to inspirational role models, we are enhancing our culture of inclusion. Subsequent sessions have been led by Claudia Batten, COO of Victors & Spoils, as well as Telecom board member, Justine Smyth.
Addressing gender diversity is merely one aspect of Telecom’s approach to diversity so in FY12 around 7,400 employees were invited to participate in an online census to gain a more comprehensive picture of our current make up. This will help us better understand how well we reflect our customer and community base and help us build deeper insights of how inclusive we are as an organisation. The results guide reviews and design of our policies and programmes so they better meet the needs of our people.
Ways of workingA collaborative work environment is a critical enabler for Telecom. In September 2011, 1,700 of our people relocated into a dynamic work environment at Telecom Central in Wellington and adopted a mixture of free, fixed, fluid and flexible working styles. This followed an earlier move into a similar work environment at ‘Telecom Place’ in Auckland in December 2010.
Across Telecom, employees are enabled to adopt flexible working arrangements ranging from flexi-hours, part-time work and job sharing, to working from home, remote working and special leave arrangements to accommodate personal commitments and changing life circumstances.
Telecom now has over 135 employees working remotely in New Zealand as ‘Agents @ home’, working across seven different customer ‘queues’ from the comfort of their own homes. The significant changes to their working styles better suits their personal needs, and the needs of Telecom, by eliminating travel time for the ‘Agents’ and allowing for split shifts, which allows for correct scheduling of customer call demand and allows the Agents to have flexibility of time throughout the working day.
Telecom continues to actively support our employees in Christchurch. Within fewer than six months following the February 2011 earthquake, all Christchurch-based employees were accommodated in properties around the periphery of the city. Being able to return to work assisted in the healing process for many of our staff by restoring a semblance of normality. A ‘hub’ working environment was established to allow our people to work closer to their homes and families; creating greater peace of mind should another significant event occur. We continue to provide other support to our Christchurch-based staff, including one-on-one assistance to help with claims processes for homes affected by the earthquake, seminars covering stress, resilience and managing change and counselling support via our Employee Assistance Programme.
Telecom recognises that the health and wellbeing of our people is critical to the maintenance of healthy work/life balance and experiencing a happy and fulfilled career at Telecom. In FY12 Telecom continued with a Telecom-wide wellness programme called ‘Feel Good Inc’. This saw a large number of our people

Telecom Annual Report 201244 |
OUR COMPANY
participate in Telecom-wide team challenge programme over four weeks, as well as participate in other wellness initiatives including receiving influenza immunisations, completing health assessments and participating in a touch rugby tournament.
leading and growing people Great leadership at all levels of Telecom is critical to drive transformation and help to achieve Telecom’s goals. Telecom has implemented a leadership framework linked to Telecom’s core leadership competencies. Telecom’s leadership programmes within this framework are designed to articulate, improve, measure and develop the leadership skills of our people leaders. A series of self-paced, collaborative learning and work-based activities is focused on career growth and development, as Telecom focuses on developing great leaders right across the business.
This year Telecom continued to invest in its graduate development programmes to build a pipeline of talent for the future. Telecom operates a finance graduate programme, which includes rotations to different divisions over a period of three years supporting their practical experience to be able to join the New Zealand Institute of Chartered Accountants. Telecom also continued to support graduates in their final year of a 24-month intensive leadership development programme made up of structured rotations through different parts of the business and supported by regular development days and a senior mentoring programme.
Telecom’s Leadership Development Programme is now in its ninth year. This year-long course has been specifically designed for Telecom in conjunction with Waikato University in New Zealand and the University of Queensland Business School in Australia. The programme is designed to enhance the leadership skills of experienced managers to develop and enhance self-awareness, strategic thinking and networking skills, as well as sharing the latest thinking in leadership strategies.
Health and safety Telecom is committed to providing a safe and healthy environment for employees, customers and suppliers at all work places and in its work practices. Telecom has a comprehensive ongoing health and safety programme and maintains a good record for safety.
Telecom has been an Accredited Employer under the Accident Compensation Corporation (ACC) ‘Partnership Programme’ since 2000. This entitles Telecom to take responsibility for managing workplace injuries in return for it bearing the costs. Telecom’s health and Safety Programme, together with its membership of the Partnership Programme, has produced impressive results, as evidenced by the following statistics:
• The number of work-related injuries per 100 employees has continued to reduce and is approximately 3% less than two years ago;
• Lost-time injuries also continue to reduce and are approximately 8% less than they were two years ago; and
• Absences as a result of work-related injuries are down approximately 10% from two years ago.
our Community – the telecom FoundationIn FY12 Telecom strengthened its commitment to the communities in which it operates through the establishment of the Telecom Foundation (the Foundation). On 15 July 2011 Prime Minister Rt hon John Key officially launched the Foundation as the home of Telecom’s philanthropy, community and charitable activities. Although Telecom has a past of contributing widely and generously to the communities in which it operates, the Foundation signalled a strategic change to bring these activities into one place.
The Foundation is registered with the Charities Commission as a charitable trust and is governed through a board of trustees. The independent board is chaired by Bob harvey, former Waitakere City Mayor, and comprises both internal and external members. External board members were chosen for their contribution to communities, the not-for-profit sector and alignment with the Foundation’s strategic focus. The internal board members were selected for their skills and knowledge demonstrated through their roles with Telecom.
The Foundation has two key objectives: firstly, encouraging generosity; and secondly, Building a Better Future for Kiwi Kids. For the first year of the Foundation’s operation, encouraging generosity has been internally focused. At the launch of the Foundation, four programmes that enabled and encouraged Telecom staff to be generous were announced and implemented. These programmes are outlined below in conjunction with their FY12 uptake and overall results:
• payroll giving: Telecom was extremely proud to be the first New Zealand corporate to launch a universal scheme of payroll giving. A universal scheme ensured that Telecom employees were free to give to any school, not-for-profit or community group important and relevant to them, provided the organisation holds donee status with Inland Revenue. To encourage this form of generosity, Telecom set aside NZ$1 million to match donations, up to a maximum of NZ$1,000 per employee. In FY12 a total of 421 schools, charities and community groups received donations, sharing an amount of NZ$575,990. Donations were comprised of NZ$321,238 coming directly from Telecom people and NZ$254,752 donated from Telecom’s matching fund. In FY12, 939 people, equating to 13.7% of Telecom people eligible to use payroll giving, engaged in the initiative making an average donation of NZ$69 (excluding outliers that are defined as single donations of NZ$1,000 or over).
• volunteer days: Telecom people were given one paid day per annum to work in the community. Autonomy was granted to employees in deciding what mattered most to them and how they wanted to utilise their day. In FY12, 2,056 people, representing 30.0% of eligible Telecom employees, took volunteer leave. Volunteer days saw Telecom people invest back into the local communities in the form of time and expertise.
• leadership grants: The Foundation recognised the leadership of the many generous Telecom people who play important roles in their communities. To encourage generosity of skills and expertise, leadership grants of NZ$1,000 were made available to employees involved in charities, schools or donee organisations in a leadership, board or trustee capacity. In FY12,

| 45investor.telecom.co.nz
52 leadership grants were awarded, contributing a total of NZ$52,000 in support.
• text-to-donate: The Foundation offered free text-to-donate services to registered charities. In FY12, five text-to-donate campaigns were awarded to charities, thus enabling those organisations to receive donations from the general public.
The Telecom Trees are Telecom’s annual Christmas gift to the community. The trees are sculptures of 375,000 LED lights, assembled to depict a traditional Christmas tree. In December 2011 Telecom Trees were erected in Auckland and Wellington and, for the first time, Christchurch. Electricity usage associated with the assembly and lighting of the trees was offset with carbon credits to reduce the environmental impact. In total, the Trees attracted approximately 255,000 visitors and provided heart-warming experiences for families up and down New Zealand. A generosity campaign saw 2,381 gifts, which were either donated by Telecom people or left at the Telecom Trees by the public, distributed to children in need via the Telecom Foundation’s relationships with charities, community groups, schools and hospitals. The 0800 Santaline, a Telecom-owned tradition since 1993, received more than 580,000 calls during the 2011 festive season with kids (young and old) calling Santa with their wishes.
The second focus of the Foundation’s work is on the next generation of New Zealanders, with a vision of ‘Building a Better Future for Kiwi Kids’. The period since the Foundation’s launch has been marked by consultation and engagement with children, stakeholders, Telecom people and experts around a social issue facing New Zealand children. The Foundation anticipates being able to announce its plans in this space in coming months.
To mark the first year anniversary of the 22 February 2011 Christchurch earthquake, the Foundation released monarch butterflies in a public ceremony held in hagley Park, Christchurch. 185 butterflies were released by children of Telecom employees affected by the disaster; one butterfly for every life lost in the event. The Foundation made a donation to the Monarch Butterfly Trust to enable the butterfly release.
More information on the Foundation is available at www.telecomfoundation.org.nz
Other community initiatives outside the Foundation included external mentoring with organisations such as Omega Trust and Springboard Trust, which provide leadership development opportunities and at the same time give back to our communities.
our environment
new Zealand environmental managementTo ensure successful day-to-day operations, Telecom must comply with current environmental legislation and regulation requirements. These requirements pertain to the installation, operation, maintenance and upgrade of Telecom’s infrastructure with compliance monitored using Telecom’s network environmental compliance system. This internal system is audited on an annual basis to ensure Telecom continually meets or exceeds requirements. The key areas of environmental legislation and regulation that Telecom’s compliance generally includes are:
• the storage and transportation of dangerous substances;
• noise levels from equipment (eg, roadside cabinets);
• visual impact of network structures;
• radio frequency emissions from mobile and radio communication sites; and
• emissions from backup generators.
telecom’s environmental and sustainability strategyTelecom’s environmental and sustainability strategy, which was approved by the Telecom Executive team in February 2011, continued to be implemented throughout FY12. Telecom’s five principles of environmental commitment, environmental management, sustainability, climate change and advocacy build the foundation of the environmental and sustainability strategy. The strategy’s overall objective is to consciously manage the four key elements that drive Telecom’s carbon footprint, by making small differences each day in everything we do at work.
This strategy aligns to the Vision2013 objectives of reducing our costs and simplifying our business by prioritising efforts to:
• reduce power consumption;
• reduce, reuse and recycle waste;
• reduce travel; and
• eliminate ozone-depleting substances in our operations by 2017.
Integrating sustainability into business as usualMaking a difference each day and integrating sustainability into everyday business activity underpins Telecom’s Environmental and Sustainability strategy. The ways in which Telecom has continued to integrate sustainability in FY12 include:
• Occupying corporate offices in Auckland and Wellington designed around the comfort of our people, as well as their community and environmental friendliness. Both Telecom Place in Auckland and Telecom Central in Wellington focus on being sustainable and green in design, material and occupancy and as a result were awarded Five Green Stars by the New Zealand Green Building Council. Although the majority of Telecom employees had moved into the Auckland building in FY11, Telecom people in Wellington completed their move to Telecom Central in FY12. Both buildings are designed to reduce electricity usage through maximising the usage of natural cooling, heating and lighting, using techniques such as solar reflective glazing and a thermally active exterior. Water consumption is reduced through rainwater harvesting with the captured water flushing toilets. Through integrating recycling systems into both buildings, recycling is promoted, which in turn helps to reduce our waste to landfill.
• Reducing both air and vehicle travel is encouraged through smart meeting room use being promoted, as an alternative to air travel with the Auckland and Wellington buildings allowing facilitation of this. Additionally, taxi journeys have been reduced through the use of dedicated shuttles between office and airport.
• Integrating sustainability considerations into the supplier ‘request for proposal’ process. Reviews of standard supplier contracts continued occurring throughout FY12 to manage current arrangements in place with sustainability in mind.

Telecom Annual Report 201246 |
OUR COMPANY
• Proactively managing and coordinating the removal and recycling of waste, as described further below.
• Providing our customers with infrastructure services, procurement services, software solutions, training services, consulting and partnering that assist them in meeting their own sustainability objectives. Our technologies can enable customers to realise cost reductions and environmental benefits, for example, through measuring, managing and reducing carbon emissions, achieving efficiencies, minimising compliance costs, reducing travel through videoconferencing and Telepresence solutions and by helping to reduce and manage ICT energy consumption.
• Allowing customers to return unwanted mobile devices to us. This scheme aims to divert phones from landfill, with working devices on-sold to emerging markets and unusable handsets recycled through the correct environmental channels. The proceeds of this initiative support the Starship Children’s hospital.
• Turning off old network equipment, which facilitates electricity reductions, and a decrease of waste to landfill material through the promotion of recycling where appropriate. For example, Telecom has shut down the EVDO network now that it is no longer required, which has produced an estimated annualised power saving of 4.8GWhr. The consolidation of Telecom’s NEAX switch is estimated to result in an annual power saving of 1.3 Gigawatt hours (GWh).
Waste management The ‘One Telecom’ waste management strategy was approved in April 2011 to proactively manage and coordinate the removal and recycling of all waste. The strategy ensures waste is processed in an efficient, cost-effective and environmentally friendly manner by expanding on the waste management processes already established with T&SS, the spares management programme and Chorus. Each business unit manages and processes its own waste, with a centralised recycling team (excluding corporate waste) overseeing and directing operations. The strategy and recycling team covers both Telecom and Chorus operations, with waste continuing to be processed on a centralised basis post-Demerger. The programme utilises a 4 ‘R’ concept where prioritisation is given to recovering, reusing, reselling and recycling waste in the first instances. Waste is sorted into a number of waste streams, which are then processed appropriately. The continued implementation of the ‘One Telecom’ waste management strategy yielded the following outcomes in each waste stream for FY12:
• Metals, cables and batteries – recovery of over 577 tonnes of metal, cable copper/fibre and batteries from around the country, which in turn generated income through the resale of materials;
• Non-office electronic waste (eg, exchange equipment and cards) – recovery of items improved the quantity and quality of spare equipment available to Telecom, whilst surplus or redundant materials were recycled. A proportion of this equipment was generated through the Exchange/Power Grooming project that began in 2011, with the objective of the project to switch off and remove equipment from exchanges that was no longer required. Additional benefits of recycling redundant equipment include power saving and reducing the footprint of infrastructure within
exchanges. The Exchange Grooming Programme assesses all exchange sites, with equipment removed and recycled where necessary;
• Office electronic waste (eg, computer screens, keyboards) – these materials are subject to the ‘4R’ concept to ensure appropriate handling of the unit;
• Packaging waste (eg, crates, plastics, foil, wooden cable drums and ribbonet offcuts) – trials have commenced to determine the most appropriate ways to apply the ‘4R’ concept to these materials; and
• Mobiles and customer electronic assets – efforts have continued to ensure that all New Zealanders are able to recycle their mobile phones, modems and landline phones by dropping them into any Telecom store or major Telecom corporate office. In FY12, 54,865 mobile devices were recycled through Telecom with the proceeds of this scheme benefiting the Starship Children’s hospital.
Carbon emissions managementTelecom has been measuring its carbon emissions in detail since 2006. In that time it has reduced its emission flows by 26 kilotonnes, or 37.1%, to 44 kilotonnes of carbon dioxide equivalents in FY12.
In FY12 Telecom reduced its carbon footprint by 8.3% with negative emission flows of four kilotonnes. Emission flows from all sources declined this year with the exception of refrigerant emissions, which increased by 10.0% in FY12 principally due to higher R22 refrigerant (R22) leakage. Telecom has generally improved its R22 leakage rate since FY06 and is committed to removing R22 from network cooling units by 2017.
Telecom’s other sources of greenhouse gas (GhG) emissions include electricity (being the major contributor) diesel, natural gas, air travel, vehicle fuel and waste. Telecom has a detailed profile of these sources that the business leverages in improving cost and operational efficiency.
Telecom’s electricity emissions reduced by one kilotonne, or 4.0%, in FY12 when compared to FY11. The National Power Savings Programme delivered annualised electricity savings of 5.2GWh in FY12, predominantly driven by the following:
• Realising power savings at the Auckland Mayoral Drive exchange building through the chiller replacement programme and the implementation of a building management system to aid power management and deliver efficiency. By FY12 the Mayoral Drive building accounted for 16.0% of Telecom’s overall power consumption, down from 20.0% in FY11;
• Consolidation of Wellington offices into the Five Green Star Telecom Central Building in Willis Street estimated at 1.8GWh annualised power savings;
• PSTN Node Consolidation project estimated at 1.28 GWh of annualised savings;
• Replacement and upgrade of air conditioners and rectifiers across our operations; and
• The Exchange Grooming Programme which focused on powering down and recycling old telecommunications equipment from our exchanges and network.

| 47investor.telecom.co.nz
Despite 25.4% lower electricity consumption with the Demerger of Chorus, emission reductions were modest, as grid electricity supply became more carbon-intensive during the year as the result of low inflows into the country’s hydro storage lakes. Renewable generation’s share of total New Zealand electricity supply reduced from 77.0% to 71.0% with a lower contribution from hydropower offset by fossil fuel sources. Low-carbon electricity supply continues to be a key driver of Telecom’s higher carbon performance when benchmarked internationally.
The other stationary energy emission sources are diesel and natural gas, which both approximately halved in FY12 due to the Demerger of Chorus.
In FY12 air travel emissions reduced by one kilotonne with 19.0% less travel also driving a significant reduction in emissions from rental cars and taxis. Fleet emissions reduced by 18.0% with a reduction in the fleet from 448 to 383 vehicles. Emissions from waste to landfill reduced by 29.2% this year.
As emission flows reduce, carbon intensity continues to steadily improve with a 3.0% decline in emissions per revenue dollar and a 2.0% decline per customer connection in FY12.
Telecom’s carbon intensity is one of the lowest in the telecommunications industry worldwide and the FY12 results further demonstrate world-class carbon performance.
australian operations – community and environment Telecom’s Australian operations take part in a wide range of activities that aim to assist those who need it most.
CommunityUnder its Corporate Social Responsibility programme, AAPT undertakes a number of initiatives to reach out to the community across a broad spectrum of not-for-profit industries.
AAPT is a platinum partner for the National Breast Cancer Foundation, offering an array of telecommunications and community services. This includes participation in events such as Pink Ribbon Day, as well as the Mothers’ day Classic 2012 Fun Run.
AAPT is an extremely proud sponsor of ACMF (Australian Children’s Music Foundation). This partnership annually culminates in the stunning ‘Dueting It For The Kids’ concert, an event that stars many of Australia’s finest performers and raises funds for the very worthy ACMF cause.
World visionAAPT is proud of its association with one of the world’s largest charitable groups, World Vision Australia (WVA). The partnership with WVA stems from both a telecommunications and community perspective. The association includes sponsoring children from impoverished areas, as well as writing letters and other correspondence. AAPT continues to look to leverage its own resources to promote the WVA brand.
Make a Difference DayMake A Difference Day gives our employees the opportunity to give back to our community in a hands-on, interactive and positive way. Each employee is encouraged to dedicate their services during work hours on one day in each calendar year to one of our pre-approved charities.
environmentAAPT is dedicated to minimising waste and ensuring the best possible use of resources. It is a philosophy reflected both internally and externally. It is also something we encourage our stakeholders to participate in. Two particular projects of note are:
• Earth hour 2011 – since 2007 AAPT has joined thousands of businesses and households around the world in turning off our lights as a symbol of our commitment to a sustainable future.
• Waste Management – all AAPT offices operate paper recycling facilities and paper for printing is produced from a percentage of post-consumer waste. AAPT promotes electronic invoicing and bill payment, cutting down both paper usage and the accompanying resources needed to transport a physical invoice.

Telecom Annual Report 201248 |
performance
key Performance Indicators The following key performance indicators (KPIs) set out key measures assessed by management:
Fy12 %INCREASE /
(DECREASE)
Fy12
Fy11
Fy10
Revenue and other gains – continuing operations1 NZ$M (8.6)% 4,576 5,004 5,177
Adjusted revenue and other gains – continuing operations1,2 NZ$M (8.9)% 4,540 4,986 5,177
EBITDA – continuing operations2 NZ$M 41.8% 1,079 761 916
Adjusted EBITDA – continuing operations2 NZ$M 4.8% 1,048 1,000 916
Depreciation and amortisation expense – continuing operations1 NZ$M (18.6)% 576 708 772
Net earnings – continuing operations1 NZ$M NM6 311 (79) 6
Adjusted net earnings – continuing operations1, 2 NZ$M NM6 281 88 6
Capital expenditure3 NZ$M (42.2)% 528 914 1,183
Adjusted free cash flow2, 3 NZ$M (5.2)% 841 887 581
Access lines4 (000)s (4.0)% 1,489 1,551 1,600
Broadband connections4 (000)s 1.5% 619 610 598
XT mobile connections4 (000)s 32.3% 1,565 1,183 712
Mobile data only devices4 (000)s 21.4% 227 187 144
Employee numbers5 (FTE incl contractors) (000)s (5.4)% 7,866 8,315 8,717
1 Telecom’s continuing operations represents the ongoing business post-Demerger.
2 EBITDA, adjusted EBITDA, adjusted revenue, adjusted net earnings and adjusted free cash flow are all non-Generally Accepted Accounting Principles (GAAP) measures and are not comparable to the International Financial Reporting Standards (IFRS) measure of performance. These measures are defined and reconciled in the discussion on pages 54 and 55.
3 Capital expenditure and adjusted free cash flow represents the total of continuing and discontinued operations for all periods presented.
4 Measure as at 30 June.
5 Measure as at 30 June – FTEs re-presented for Fy11 and Fy10 to exclude Chorus-related employees.
6 NM – not meaningful.
perForManCe

yEAR ENDED 30 JUNE 2012 2011 2010 2009 2008(DOLLARS IN MILLIONS, EXCEPT PER ShARE AND PER AMERICAN DEPOSITARY ShARE (ADS) AMOUNTS)
NZ$M NZ$M NZ$M NZ$M NZ$M
Income statement data Operating revenues and other gains from continuing operations
Local service 905 955 1,004 1,039 1,051
Calling 754 928 1,003 1,239 1,291
Interconnection 104 195 178 177 178
Mobile 904 825 826 822 875
Data 527 574 626 635 629
Broadband and internet 454 487 511 535 486
IT services 544 561 486 516 439
Resale 143 235 278 337 370
Other operating revenue 187 199 238 250 346
Other gains 54 45 27 12 7
total operating revenues and other gains from continuing operations 4,576 5,004 5,177 5,562 5,672Operating expenses
Labour 797 832 858 876 867
Intercarrier costs 1,160 1,559 1,594 1,867 1,884
Asset impairments – 215 – 101 –
Other operating expenses 1,535 1,595 1,809 1,890 1,905
Other expenses 5 42 – – –
Depreciation 363 468 527 484 398
Amortisation 213 240 245 216 175
total operating expenses from continuing operations 4,073 4,951 5,033 5,434 5,229Net earnings/(loss) from continuing operations 311 (79) 6 (8) 268
Net earnings from discontinued operations 846 245 376 408 445
Net earnings/(loss) attributable to shareholders 1,155 164 380 398 710
earnings/(loss) per share/aDs from continuing operations Basic per share 0.16 (0.04) 0.00 (0.01) 0.14
Diluted per share 0.16 (0.04) 0.00 (0.01) 0.14
Basic per ADS 0.80 (0.19) 0.01 (0.03) 0.71
Diluted per ADS 0.80 (0.19) 0.01 (0.03) 0.71
earnings per share/aDs from discontinued operationsBasic per share 0.44 0.13 0.20 0.22 0.24
Diluted per share 0.44 0.13 0.20 0.22 0.24
Basic per ADS 2.20 0.64 0.99 1.11 1.19
Diluted per ADS 2.20 0.64 0.99 1.11 1.19
net earnings/(loss) per share/aDsBasic per share 0.60 0.09 0.20 0.22 0.38
Diluted per share 0.60 0.09 0.20 0.22 0.38
Basic per ADS 3.00 0.45 1.00 1.08 1.90
Diluted per ADS 3.00 0.45 1.00 1.08 1.90
Balance sheet dataProperty, plant and equipment 1,515 3,892 4,066 4,021 3,984
Total assets 3,667 6,392 6,865 6,765 7,405
Debt due within one year 407 397 184 385 958
Long-term debt 605 1,700 2,137 2,281 1,830
Total liabilities 2,041 4,081 4,320 4,320 4,669
Total equity 1,621 2,306 2,545 2,445 2,736
Contributed capital 990 1,528 1,515 1,384 1,297
Weighted average number of ordinary shares outstandingBasic (in millions) 1,918 1,924 1,891 1,837 1,871
Diluted (in millions) 1,922 1,928 1,895 1,839 1,873
| 49investor.telecom.co.nz
Business review
Results

Telecom Annual Report 201250 |
performance
Principal factors impacting Telecom’s results and key trendsTelecom’s operating environment and industry outlook has remained challenging as a result of intense price competition and regulation. These factors, as well as a continued focus on the reduction of operating and capital expenditure, are reflected in Telecom’s FY12 financial performance. Telecom’s financial results for FY12 also reflect the impacts arising from transactions relating to effecting the Demerger, costs and insurance recoveries relating to the Canterbury earthquakes, a non-cash foreign exchange gain and their related tax effects.
FY12 saw continued operating cost reductions and capital expenditure interventions, as well as further focus on customer retention and targeted growth. The FY12 capital expenditure of NZ$528 million was lower than the FY11 capital expenditure of NZ$914 million, due to the Demerger and continued tightening of control of project costs. Operating expenses in FY12 declined by NZ$494 million, or 12.4%, to NZ$3,492 million when compared to NZ$3,986 million in FY11 (excluding the impact of NZ$215 million of asset impairment charges and other non-recurring expenses).
Increasing competition and price pressureTelecom continues to face increasing competition and price pressure in all markets. Telecom has responded to this with more bundled deals giving more value to end-customers.
Telecom’s combined local service and calling revenues declined by 11.9% in FY12 and 6.2% in FY11. The fixed line market continues to face increased competition, as well as the unbundling of local exchanges and cabinets, which enables access seekers to choose to compete in profitable regions. The fixed line market is also subject to substitution by the competitive mobile market offerings. however, Telecom believes the rate of fixed to mobile substitution to date for Telecom has been modest when compared to global trends, which Telecom believes is partly due to Telecom’s TSO obligations to provide free local calling. At AAPT, revenue declines were impacted by the sale of AAPT’s Consumer division in FY11, as well as the competitive nature of the Australian market in the wholesale and business sectors, and AAPT’s continued focus on acquiring and maintaining higher margin business.
Telecom’s mobile revenues increased by 9.6% in FY12, due to increased device revenues and a change in mobile terms and conditions, compared to a decrease of 0.1% in FY11. Prior to the launch of Telecom’s XT mobile network in late FY09, Telecom faced declining mobile revenues from its existing CDMA mobile network. Furthermore, the New Zealand mobile market saw the entry of a third independent operator, 2degrees, during FY09, as well as the establishment of further competitors operating as MVNOs. The increase of competitors as well as regulation, has limited Telecom’s mobile revenue growth. During the year Telecom has migrated customers from its CDMA mobile network, which closed in July 2012, to its XT mobile network. Mobile revenues at AAPT declined as well due to the sale of its Consumer business during FY11.
Data revenues of NZ$527 million in FY12 declined by 8.2% when compared to FY11 (FY11: 8.3% decrease compared to FY10) as the data market has seen the entry over recent years of many smaller operators, including electricity companies, offering connectivity using fibre, while the IT service market has been impacted by both price competition and the consolidation of key competitors.
Overall, the competitive sub-sectors of the telecommunications market in which Telecom operates continue to experience declining revenues and profits, especially for existing fixed line operators, such as Telecom. For these reasons Telecom’s Vision2013 initiative includes the focus on reducing operating expenditure.
DemergerTelecom was required to demerge its fixed line access infrastructure business in order for the demerged business to take the corner-stone role in the Government’s ultra-fast broadband initiative. Telecom successfully completed the Demerger of Chorus Limited effective on 1 December 2011. This has had a significant impact on Telecom’s income statement for FY12, which has been re-presented to show the Chorus results to 30 November 2011 as a discontinued operation, disclosed separately from Telecom’s continuing operations. Up to the Demerger, certain revenues were charged internally to the discontinued operations by Telecom’s continuing operations and certain costs, including intercarrier costs, were charged internally from the discontinued operations to Telecom’s continuing operations. To enable comparability of financial information, certain internal revenues and costs have been reclassified in prior periods to align with post-Demerger reporting. Please see notes 1 to 5 and note 9 of the financial statements for more information on the impact of these re-presentations. however, while Telecom has re-presented its comparative segment results to reflect the impact of the Demerger, there is no change to the overall Group reported result for prior years. The Demerger also crystallised a number of one-off items that have a significant impact on the FY12 results and these are set out in the Executive Summary below.
government regulationOver the last few years, prior to Demerger, Telecom has been required to maintain high levels of operating expenditure and investment to meet its regulatory obligations.
Regulation had a significant impact on Telecom’s earnings for FY11, with continued price regulation, operational costs of running separate business units, as well as capital expenditure requirements for operational separation-related projects. however, post-Demerger, the regulatory burden is expected to reduce significantly (see our company – regulation) and there are expected to be additional cost savings for Telecom going forward as there will be significantly fewer regulatory requirements compared to what Telecom has experienced over recent years.
As a consequence of the Government’s UFB initiative and shift in policy from a copper-based network to a fibre-based network and other regulatory developments, Telecom recognised impairment

yEAR ENDED 30 JUNE 2012 2011 2010 2012/2011 2011/2010NZ$M NZ$M NZ$M % ChANGE % ChANGE
Continuing operations:
Operating revenues and other gains 4,576 5,004 5,177 (8.6) (3.3)
Labour costs (797) (832) (858) (4.2) (3.0)
Intercarrier costs (1,160) (1,559) (1,594) (25.6) (2.2)
Other operating expenses (1,535) (1,595) (1,809) (3.8) (11.8)
Other expenses (5) (42) – (88.1) NM
Asset impairments – (215) – NM NM
eBItDa1 1,079 761 916 41.8 (16.9)
Depreciation (363) (468) (527) (22.4) (11.2)
Amortisation (213) (240) (245) (11.3) (2.0)
Finance income 26 15 22 73.3 (31.8)
Finance expense (106) (152) (151) (30.3) 0.7
Share of associates’ net profits – 1 1 NM NM
net earnings/(loss) before income tax 423 (83) 16 nM nM
Income tax (expense)/benefit (112) 4 (10) NM NM
net earnings/(loss) for the year – continuing operations 311 (79) 6 nM nM
net earnings/(loss) for the year – discontinued operations 846 245 376 nM (34.8)
net earnings for the year 1,157 166 382 nM (56.5)
Net earnings attributable to shareholders 1,155 164 380 NM (56.8)
Net earnings attributable to non-controlling interests 2 2 2 – –
1 EBITDA is a non-GAAP measure and is not comparable to the IFRS measure of net earnings. EBITDA is defined and reconciled in the discussion below.
| 51investor.telecom.co.nz
charges of NZ$215 million (for continuing operations) on copper-based regulatory assets in FY11.
economic conditionsThe New Zealand economy has remained relatively flat in FY12, with Gross Domestic Product (GDP) growth of 1.7% (Source: Statistics NZ GDP Update for March 2012). In FY11 the economy was impacted by the Canterbury earthquakes. Rebuilding of damaged infrastructure has been delayed by ongoing aftershocks but is now under way and is expected to deliver additional growth to New Zealand’s economy over the coming years.
Investment in capital programmesTelecom continued to reduce its capital expenditure during FY12, with capital expenditure of NZ$528 million in FY12, NZ$386 million, or 42.2%, lower than the NZ$914 million in FY11. however, FY12 total capital expenditure of NZ$528 million included approximately NZ$136 million of Chorus-related spend compared to NZ$404 million in FY11, as the Demerger meant that FY12 included five
months of Chorus-related spend compared to 12 months in FY11. Removing this Chorus-related spend results in an underlying capital expenditure for Telecom’s continuing operations of NZ$392 million for FY12 compared to NZ$510 million in FY11, representing a reduction of NZ$118 million, or 23.1%, and improving the capital expenditure to sales ratio from 10.2% in FY11 to 8.6% in FY12. Telecom’s capital expenditure included transformation and regulatory initiatives of NZ$133 million in FY12 (FY11: NZ$305 million) as Telecom continued to invest in the WCDMA mobile network and incurred Chorus-related spend up to Demerger. During FY11 Telecom was also subject to regulatory capital expenditure as required in the Undertakings, where key expenditure included NZ$136 million on FTTN and NZ$91 million on operational separation, which reduced to NZ$40 million and NZ$12 million respectively in FY12 as the regulatory burden reduced with the Demerger. The overall reduction in capital expenditure over the course of the past two financial years has been driven by reduced spend in low growth markets, re-validation of investment needs and tighter control of project costs.
Group result
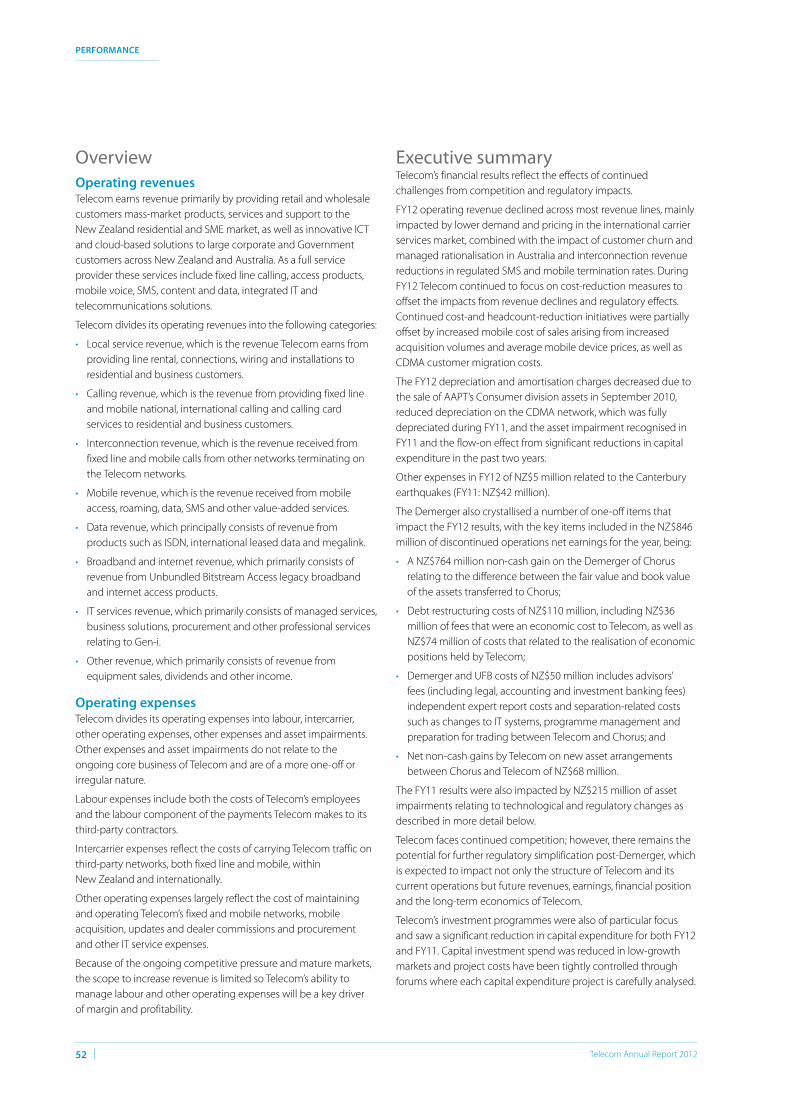
Telecom Annual Report 201252 |
performance
Overviewoperating revenuesTelecom earns revenue primarily by providing retail and wholesale customers mass-market products, services and support to the New Zealand residential and SME market, as well as innovative ICT and cloud-based solutions to large corporate and Government customers across New Zealand and Australia. As a full service provider these services include fixed line calling, access products, mobile voice, SMS, content and data, integrated IT and telecommunications solutions.
Telecom divides its operating revenues into the following categories:
• Local service revenue, which is the revenue Telecom earns from providing line rental, connections, wiring and installations to residential and business customers.
• Calling revenue, which is the revenue from providing fixed line and mobile national, international calling and calling card services to residential and business customers.
• Interconnection revenue, which is the revenue received from fixed line and mobile calls from other networks terminating on the Telecom networks.
• Mobile revenue, which is the revenue received from mobile access, roaming, data, SMS and other value-added services.
• Data revenue, which principally consists of revenue from products such as ISDN, international leased data and megalink.
• Broadband and internet revenue, which primarily consists of revenue from Unbundled Bitstream Access legacy broadband and internet access products.
• IT services revenue, which primarily consists of managed services, business solutions, procurement and other professional services relating to Gen-i.
• Other revenue, which primarily consists of revenue from equipment sales, dividends and other income.
operating expensesTelecom divides its operating expenses into labour, intercarrier, other operating expenses, other expenses and asset impairments. Other expenses and asset impairments do not relate to the ongoing core business of Telecom and are of a more one-off or irregular nature.
Labour expenses include both the costs of Telecom’s employees and the labour component of the payments Telecom makes to its third-party contractors.
Intercarrier expenses reflect the costs of carrying Telecom traffic on third-party networks, both fixed line and mobile, within New Zealand and internationally.
Other operating expenses largely reflect the cost of maintaining and operating Telecom’s fixed and mobile networks, mobile acquisition, updates and dealer commissions and procurement and other IT service expenses.
Because of the ongoing competitive pressure and mature markets, the scope to increase revenue is limited so Telecom’s ability to manage labour and other operating expenses will be a key driver of margin and profitability.
Executive summaryTelecom’s financial results reflect the effects of continued challenges from competition and regulatory impacts.
FY12 operating revenue declined across most revenue lines, mainly impacted by lower demand and pricing in the international carrier services market, combined with the impact of customer churn and managed rationalisation in Australia and interconnection revenue reductions in regulated SMS and mobile termination rates. During FY12 Telecom continued to focus on cost-reduction measures to offset the impacts from revenue declines and regulatory effects. Continued cost-and headcount-reduction initiatives were partially offset by increased mobile cost of sales arising from increased acquisition volumes and average mobile device prices, as well as CDMA customer migration costs.
The FY12 depreciation and amortisation charges decreased due to the sale of AAPT’s Consumer division assets in September 2010, reduced depreciation on the CDMA network, which was fully depreciated during FY11, and the asset impairment recognised in FY11 and the flow-on effect from significant reductions in capital expenditure in the past two years.
Other expenses in FY12 of NZ$5 million related to the Canterbury earthquakes (FY11: NZ$42 million).
The Demerger also crystallised a number of one-off items that impact the FY12 results, with the key items included in the NZ$846 million of discontinued operations net earnings for the year, being:
• A NZ$764 million non-cash gain on the Demerger of Chorus relating to the difference between the fair value and book value of the assets transferred to Chorus;
• Debt restructuring costs of NZ$110 million, including NZ$36 million of fees that were an economic cost to Telecom, as well as NZ$74 million of costs that related to the realisation of economic positions held by Telecom;
• Demerger and UFB costs of NZ$50 million includes advisors’ fees (including legal, accounting and investment banking fees) independent expert report costs and separation-related costs such as changes to IT systems, programme management and preparation for trading between Telecom and Chorus; and
• Net non-cash gains by Telecom on new asset arrangements between Chorus and Telecom of NZ$68 million.
The FY11 results were also impacted by NZ$215 million of asset impairments relating to technological and regulatory changes as described in more detail below.
Telecom faces continued competition; however, there remains the potential for further regulatory simplification post-Demerger, which is expected to impact not only the structure of Telecom and its current operations but future revenues, earnings, financial position and the long-term economics of Telecom.
Telecom’s investment programmes were also of particular focus and saw a significant reduction in capital expenditure for both FY12 and FY11. Capital investment spend was reduced in low-growth markets and project costs have been tightly controlled through forums where each capital expenditure project is carefully analysed.

| 53investor.telecom.co.nz
group result
year ended 30 June 2012Operating revenue and other gains for Telecom’s continuing operations of NZ$4,576 million in FY12 reduced by NZ$428 million, or 8.6%, in FY12. The three key drivers of this revenue trend were:
• mobile revenue increases driven by increased device and mobile data revenues and a change in mobile terms and conditions; offset by
• calling revenue declines due to lower demand and pricing in the international carrier services market, combined with the impact of customer churn and managed rationalisation in Australia (which also affected resale revenues); and
• interconnection revenue reductions from lower SMS and mobile termination rates.
Other gains of NZ$54 million in FY12 comprised NZ$8 million interim insurance recoveries relating to the Canterbury earthquakes; NZ$28 million in relation to a one-off non-cash foreign exchange gain; a NZ$4 million gain on the sale of Gen-i’s Software Solutions business; NZ$8 million from settlement arrangements; and NZ$6 million of other gains on sale. Some of these gains are treated as adjusting items as detailed below.
The decline in operating revenues from continuing operations was more than offset by reductions in operating expenses (excluding non-recurring other expenses) which fell by NZ$494 million, or 12.4%, to NZ$3,492 million in FY12.
Labour costs of NZ$797 million were NZ$35 million, or 4.2%, lower in FY12 when compared to FY11 due to continued headcount reduction initiatives.
Intercarrier costs of NZ$1,160 million were NZ$399 million, or 25.6%, lower in FY12 when compared to FY11 due to lower overall pricing, including lower mobile termination rates.
Other operating expenses of NZ$1,535 million were NZ$60 million, or 3.8%, lower in FY12 when compared to FY11 due to the impacts of a lower head count, ongoing focus on cost reductions, the impact of a strong New Zealand dollar and FY11 including three months of costs for AAPT’s Consumer division, preceding its sale in September 2010, combined with the impact of the change in trading arrangements. The reductions in other operating expenses were partially offset by increased mobile cost of sales arising from both increased demand and average mobile device prices, as well as CDMA migration costs.
Other expenses of NZ$5 million in FY12 relate to further costs arising in relation to the Canterbury earthquakes.
Combined depreciation and amortisation charges of NZ$576 million decreased by NZ$132 million, or 18.6%, in FY12 when compared to NZ$708 million in FY11, due to the sale of AAPT’s Consumer division assets in September 2010, reduced depreciation on the CDMA network, which was fully depreciated during FY11, the asset impairment recognised in FY11 and the flow-on effect from significant reductions in capital expenditure in the past two years.
The net finance expense in FY12 of NZ$80 million was NZ$57 million, or 41.6% lower than in FY11 primarily due to the debt restructuring as a result of the Demerger.
The FY12 tax expense of NZ$112 million was NZ$116 million higher than the NZ$4 million tax credit recognised in FY11. The movement is principally due to a NZ$142 million increase arising from higher FY12 taxable earnings, partially offset by an NZ$18 million impact in FY11 as a result of a reduction in the value of certain tax credits following legislative changes, the tax effect of the non-cash foreign exchange gain and a number of other items, including the change in tax rate from the FY11 rate of 30% to the FY12 rate of 28% and prior period adjustments.
Net earnings after tax from continuing operations of NZ$311 million in FY12 were significantly higher than the NZ$79 million loss in FY11, primarily due to the reductions in depreciation and amortisation charges and the asset impairments in FY11.
Net earnings after tax from discontinued operations of NZ$846 million in FY12 were significantly higher than the NZ$245 million in the comparative period, primarily due to the gain on disposal of Chorus. Included in the discontinued operations result are transaction and refinancing costs of NZ$160 million, which included economic Demerger transaction costs of NZ$86 million, being NZ$36 million of financing and consent fees and NZ$50 million of other transaction costs. There were also NZ$10 million of financing costs that were met by Chorus.
year ended 30 June 2011 Operating revenue and other gains for Telecom’s continuing operations of NZ$5,004 million in FY11 decreased by NZ$173 million, or 3.3%, when compared to FY10. Operating revenue declines were experienced in most revenue lines, with only interconnection revenues (mainly in mobile and SMS traffic) and IT services (due to strong managed services revenues in Gen-i) experiencing gains. Resale revenues declined due to AAPT’s disposal of its Consumer division, as well as the continued managed reduction of lower-margin customers and the overall calling and local service revenues also declined year on year. Data revenue decreased due to the competitive environment, changes in technology and increased price pressures driving Gen-i’s customers to lower cost options. Mobile revenues in FY11 of NZ$825 million were relatively stable compared with FY10, while FY10 included higher revenues than FY09, arising from handset sales following the launch of the XT network. During FY11 Telecom saw growth in the high ARPU smartphone users market, as they took advantage of performance capabilities of Telecom’s new mobile network. Broadband and internet revenue increased in New Zealand, where Telecom Retail and Wholesale & International (where customer connections continued to grow) were more than offset by declines arising from the AAPT Consumer division sale. Other operating revenue was also affected by the loss of TSO revenue due to regulatory changes.

Telecom Annual Report 201254 |
performance
Other gains of NZ$45 million in FY11 compared to NZ$27 million in FY10. In FY11 these gains included: NZ$18 million arising from the sale of the AAPT Consumer division; NZ$5 million relating to the sale of Telecom’s share of Yahoo!Xtra; and NZ$22 million of various resolutions and settlements reached with a supplier. The gains in FY10 related to supplier settlements.
Labour costs of NZ$832 million were NZ$26 million, or 3.0%, lower in FY11 when compared to FY10 largely as a result of continued cost-and headcount-reduction initiatives, partially offset by bringing back in-house previously outsourced IT functions from hP.
Intercarrier costs of NZ$1,559 million were NZ$35 million, or 2.2%, lower in FY11 when compared to FY10 due to AAPT’s focus on higher margin data and internet sales, partially offset by International trading in more expensive destinations.
Other operating expenses of NZ$1,595 million were NZ$214 million, or 11.8%, lower in FY11 compared to FY10 as a result of the reduction in mobile cost of sales, due to a reduced volume of handset sales relative to FY10 following the launch of the XT network, lower advertising expenditure, ongoing cost-reduction initiatives and intervention and bringing back in-house the IT function from hP noted above. These declines were partially offset by higher IT services cost of sales in FY11 as a result of increased customer demand especially in procurement at Gen-i, together with the FY11 cost of the TDL arrangements.
Other expenses of NZ$42 million in FY11 related to the Canterbury earthquakes, consisting of incremental operational costs, customer credits and asset impairments. At 30 June 2011 Telecom was not able to recognise the benefit of its insurance proceeds arising from the earthquakes as its claim was still being assessed.
The FY11 impairment charges of NZ$215 million resulted from the write-off of certain copper-based regulatory assets due to the combined effects of the move to a fibre-oriented environment and regulatory developments (see note 6 to the financial statements for more details).
The FY11 combined depreciation and amortisation charges decreased by NZ$64 million, or 8.2%, to NZ$708 million as a result of lower depreciation arising from the CDMA network, which was fully depreciated in FY11 and only including three months of depreciation on AAPT’s Consumer business division assets up to the date of sale in September 2010. These decreases were partially offset by the impacts of the higher asset base as a result of the high levels of capital expenditure in FY10.
The net finance expense in FY11 of NZ$137 million was NZ$8 million, or 6.3%, higher than in FY10 due to additional interest received from Inland Revenue in the prior comparative period.
The FY11 tax credit of NZ$4 million was lower when compared to the tax expense of NZ$10 million recognised in FY10. This movement was principally due to:
• A decrease in the tax charge in FY11 as a result of the tax effect of lower earnings before income tax;
• A number of changes in New Zealand tax legislation being:
• a NZ$43 million reduction in the prior year tax charge following the abolition of the conduit relief regime in FY10, which resulted in the recognition of certain tax credits arising
from tax paid in New Zealand and overseas in respect of offshore companies;
• a NZ$18 million increase in the tax charge in FY11 following the passing of the Taxation (Annual Rates, Trans-Tasman Savings Portability, KiwiSaver, and Remedial Matters) Bill, which resulted in some of the tax credits recognised in FY10 having to be written down; and
• a NZ$38 million increased tax charge in FY10 following the enactment of the Taxation (Budget Measures) Act 2010 (being a NZ$56 million increase relating to the future removal of tax depreciation on certain buildings partially offset by an NZ$18 million decrease from the future reduction in the New Zealand company tax rate from 30% to 28%).
• A number of offsetting other items, including fewer Australian tax losses, which do not give rise to a tax impact, a greater number of expenses that are not deductible for tax and the impact of Southern Cross dividends not subject to tax.
Net loss after tax from continuing operations of NZ$79 million in FY11 was significantly lower than the NZ$6 million profit in FY10, primarily due to the reduction in EBITDA referred to above, partially offset by reduced depreciation and amortisation charges.
Net earnings after tax from discontinued operations of NZ$245 million in FY11 were lower than the NZ$376 million in the comparative period primarily due to NZ$71 million of significant costs incurred, comprising NZ$42 million of asset impairments, relating to certain assets considered stranded based on Telecom seeking exemptions under the operational separation Undertakings, and NZ$29 million of costs in relation to Telecom’s UFB proposal.
non-gaap measuresTelecom uses EBITDA, adjusted EBITDA, free cash flow, adjusted free cash flow, adjusted revenues, adjusted net earnings and ARPU when discussing financial performance. These are non-GAAP financial measures and are not prepared in accordance with IFRS.
They are not uniformly defined or utilised by all companies in the telecommunications industry. Accordingly, these measures may not be comparable with similarly titled measures used by other companies. Non-GAAP financial measures should not be viewed in isolation nor considered as a substitute for measures reported in accordance with IFRS.
Management believes that these measures provide useful information as they are used internally to evaluate performance of business units, to analyse trends in cash-based expenses, to establish operational goals and allocate resources.
Telecom calculates EBITDA by adding back depreciation, amortisation, finance expense, share of associates’ (profits)/losses and taxation expense to net earnings less finance income.
Adjusted EBITDA is the segment result reported, plus the net result of Corporate revenue and expenses, in the financial statements. It excludes significant one-off gains, expenses and impairments that are also excluded from the segmental result to provide an indication of the underlying earnings of that segment. The sum of the segments’ results is reconciled to net earnings before income tax in note 2 to the financial statements.

yEAR ENDED 30 JUNE 2012 2011 2010 2012/2011 2011/2010NZ$M NZ$M NZ$M % ChANGE % ChANGE
yEAR ENDED 30 JUNE 2012 2011 2010 2012/2011 2011/2010NZ$M NZ$M NZ$M % ChANGE % ChANGE
yEAR ENDED 30 JUNE 2012 2011 2010 2012/2011 2011/2010NZ$M NZ$M NZ$M % ChANGE % ChANGE
Continuing operations
Net earnings 311 (79) 6 NM NM
Add back: depreciation 363 468 527 (22.4) (11.2)
Add back: amortisation 213 240 245 (11.3) (2.0)
Less: finance income (26) (15) (22) 73.3 (31.8)
Add back: finance expense 106 152 151 (30.3) 0.7
Add back: share of associates’ net profits – (1) (1) NM NM
Add back: taxation expense/(credit) 112 (4) 10 NM NM
eBItDa from continuing operations 1,079 761 916 41.8 (16.9)
Less: gains on sale1 – (18) – NM NM
Less: insurance proceeds2 (8) – – NM NM
Less: non-cash foreign exchange gain3 (28) – – NM NM
Add: natural disaster costs4 5 42 – NM NM
Add: asset impairments5 – 215 – NM NM
adjusted eBItDa from continuing operations 1,048 1,000 916 4.8 9.2
EBITDA from discontinued operations (refer note 9 of financial statements) 321 801 848 (59.9) (5.5)
total adjusted eBItDa 1,369 1,801 1,764 (24.0) 2.1
Total adjusted EBITDA 1,369 1,801 1,764 (24.0) 2.1
Less: capital expenditure (528) (914) (1,183) (42.2) (22.7)
adjusted free cash flow 841 887 581 (5.2) 52.7
Net earnings from continuing operations 311 (79) 6 NM NM
Less: gains on sale1 – (18) – NM NM
Less: insurance proceeds2 (8) – – NM NM
Less: non–cash foreign exchange gain3 (28) – – NM NM
Add:natural disaster costs4 5 42 – NM NM
Add: asset impairments5 – 215 – NM NM
Add/(less): taxation effect on items above 1 (72) – NM NM
adjusted net earnings from continuing operations 281 88 6 nM nM
1 The Consumer division of AAPT’s operations was sold to iiNet for A$60 million in Fy11. This sale resulted in a gain of NZ$18 million.
2 Other income of NZ$8 million in relation to insurance proceeds from the Canterbury earthquakes.
3 One-off gain of NZ$28 million in relation to the non-cash foreign exchange gain.
4 Costs incurred in relation to the Canterbury earthquakes, comprised of incremental operational costs incurred, customer credits and asset impairments (Fy12: NZ$5 million; Fy11: NZ$42 million).
5 NZ$215 million of asset impairment charges on copper-based regulatory assets due to the effect of the move to a fibre-oriented world.
| 55investor.telecom.co.nz
Adjusted net earnings are net earnings for the year adjusted by the same items to determine adjusted EBITDA, together with any adjustments to depreciation, amortisation and financing costs, whilst also allowing for any tax impact of those items.
Adjusted revenues are revenues excluding significant one-off gains that are also excluded from the segmental result to provide an indication of the underlying revenues of that segment.
Telecom calculates free cash flow as EBITDA less capital expenditure (see Capital expenditure below). Adjusted free cash flow uses adjusted EBITDA as defined above.
Telecom uses Average Revenue Per User (ARPU) as a measure of the average monthly service revenue on a per customer basis. Telecom believes that this measure provides useful information about the usage of Telecom’s products and the Company’s ability to attract and retain high-value customers.
Management uses adjusted information to measure underlying trends of the business and monitor performance.
Reconciliations from the IFRS measure of net earnings to Telecom’s adjusted net earnings, EBITDA, adjusted EBITDA and adjusted free cash flow are shown below.

yEAR ENDED 30 JUNE 2012 2011 2010 2012/2011 2011/2010NZ$M NZ$M NZ$M % ChANGE % ChANGE
telecom retail
yEAR ENDED 30 JUNE 2012 2011 2010 2012/2011 2011/2010NZ$M NZ$M NZ$M % ChANGE % ChANGE
Telecom Retail 506 493 406 2.6 21.4
Gen-i 263 237 223 11.0 6.3
Wholesale & International 154 145 164 6.2 (11.6)
AAPT 88 90 136 (2.2) (33.8)
T&SS – 4 (2) NM NM
segmental eBItDa 1,011 969 927 4.3 4.5
operating revenues and other gains
Local service 581 625 678 (7.0) (7.8)
Calling 260 302 328 (13.9) (7.9)
Mobile 672 609 594 10.3 2.5
Data 18 19 22 (5.3) (13.6)
Broadband and internet 315 300 289 5.0 3.8
IT services 9 11 14 (18.2) (21.4)
Other operating revenues 25 27 22 (7.4) 22.7
Internal revenue 45 122 116 (63.1) 5.2
Other gains 3 – 13 NM NM
total operating revenues and other gains 1,928 2,015 2,076 (4.3) (2.9)
operating expenses
Labour (133) (147) (162) (9.5) (9.3)
Intercarrier (329) (344) (368) (4.4) (6.5)
Other operating expenses (541) (342) (434) 58.2 (21.2)
Internal operating expenses (419) (689) (706) (39.2) (2.4)
total operating expenses (1,422) (1,522) (1,670) (6.6) (8.9)
eBItDa 506 493 406 2.6 21.4
Telecom Annual Report 201256 |
performance
Segmental resultsAn analysis of the results by business unit is presented below:
Telecom has four customer-facing business units supported by T&SS and a Corporate centre. Telecom currently allocates substantially all the costs from T&SS and certain corporate costs to customer-facing business units, as well as a number of external interconnection revenues and costs, which are initially recognised in Wholesale & International and then allocated to other business units.
The segment results exclude significant one-off gains, expenses and impairments. These items are excluded from the segment results to enable an analysis of the underlying earnings of the segment when the financial results are presented to Telecom’s CEO.

NUMBER OF MOBILE CONNECTIONS 2012 2011 2010 2012/2011 2011/2010(TELECOM RETAIL, GEN-I AND TELECOM WHOLESALE) (000) (000) (000) % ChANGE % ChANGE
| 57investor.telecom.co.nz
Fy12 vs. Fy11
operating revenuesRetail’s operating revenues in FY12 of NZ$1,928 million decreased by NZ$87 million, or 4.3%, when compared to FY11. Local service, calling, data and IT services revenue declines in FY12 of NZ$89 million were largely offset by NZ$78 million of growth in mobile and broadband and internet revenues.
Local service and calling revenues declined in FY12 by a combined NZ$86 million, or 9.3%, to NZ$841 million when compared to FY11 due to continued fixed access customer churn and a reduction in international calling prices.
Retail access lines decreased by 8.0% from 1.061 million at 30 June 2011 to 0.976 million at 30 June 2012. The second half of FY12 reflected a period of increased competitor activity at entry-level price points. however, Retail continued to focus on maintaining ARPU growth, by retaining high-value existing customers and remaining competitive at entry-level bundle price points, thereby providing greater value to customers with multiple product holdings.
Calling revenues decreased by NZ$42 million, or 13.9%, in FY12 primarily due to the lower access line base, as well as the re-pricing
of key calling categories following regulatory mobile termination rate adjustments. International and fixed-to-mobile price reductions in FY12 have partly mitigated the calling churn.
Broadband and internet revenues increased by NZ$15 million, or 5.0%, to NZ$315 million in FY12. FY12 saw price-based competitor activity similar to that experienced by the access lines. Despite an increase in price-based competition in the market, broadband connections of 599,000 at 30 June 2012 increased by 8,000, or 1.4%, when compared to 30 June 2011.
Mobile revenues (including Retail and Gen-i) increased by NZ$89 million, or 11.1%, to NZ$890 million in FY12 when compared to FY11, due to increased device revenues (which include the impact of a change in mobile terms and conditions) and mobile data revenues, which more than offset declines in mobile voice revenues.
Telecom’s mobile customer base (including Retail, Gen-i, and Wholesale connections) decreased by 3.1% to 2.031 million customers at 30 June 2012 from 2.097 million customers at 30 June 2011. This decline is largely attributable to the closure of the CDMA network in July 2012 and associated churn of predominantly low-value prepaid customers. Consequently, the prepaid base has decreased by 126,000, or 10.1%, since 30 June 2011.
The following table sets out Telecom’s New Zealand mobile connections:
XT connections 1,565 1,183 712 32.3 66.2
CDMA connections 466 914 1,459 (49.0) (37.4)
total 2,031 2,097 2,171 (3.1) (3.4)
Postpaid connections 908 848 859 7.1 (1.3)
Prepaid connections 1,123 1,249 1,312 (10.1) (4.8)
total 2,031 2,097 2,171 (3.1) (3.4)
Retail’s continued focus on smartphone penetration and acquisition of high-value customers, together with further migration of customers from prepaid to postpaid plans, has delivered significant growth in the postpaid base during FY12, with a net increase of 60,000, or 7.1%, in connections since 30 June 2011. The launch of the iPhone 4S late in the first half of FY12 was a significant driver of the strong postpaid growth in FY12.
At 30 June 2012, 1.565 million customers were on the XT network, with XT connections up by 382,000, or 32.3%, from 30 June 2011. 466,000 customers, or 22.9% of the mobile base, remained on the CDMA network at 30 June 2012 compared to 43.6% of the base as at 30 June 2011. The voice and text elements of Telecom’s CDMA services closed in July 2012. Limited low-speed data services remain active with a view to closing these in August. During FY12, a large percentage of CDMA customers and revenues were migrated to the WCDMA network.
Mobile ARPU increased by 9.4% to NZ$29.14 in FY12 when compared to NZ$26.64 in FY11. While mobile voice revenues declined by NZ$18 million, or 4.3%, in FY12 compared to FY11, this was more than offset by NZ$31 million, or 11.4%, growth in data revenues over the same period. The strong data revenue
growth was driven by the increased number of higher-value customers acquired and continued acceleration of data use and smartphone penetration.
Internal revenue decreased by NZ$77 million, or 63.1%, to NZ$45 million in FY12 when compared to FY11 due to reduced interconnection revenues following the reduction in regulated mobile termination rates.
operating expenses
Continued focus on cost-efficiency has driven operating costs to the lowest levels in recent periods, with FY12 seeing a NZ$100 million, or 6.6%, reduction compared to NZ$1,422 million in FY11.
Labour expenses of NZ$133 million in FY12 decreased by NZ$14 million, or 9.5%, when compared to FY11, driven by headcount reductions and an internal centralisation of support functions in FY12.
Intercarrier costs of NZ$329 million are NZ$15 million, or 4.4%, lower than in FY11 due to new trading agreements and pricing on arrangements with Chorus previously charged via internal operating expenses. Cost-efficiencies have been realised in part through the avoidance of unnecessary provisioning and maintenance activities.

Telecom Annual Report 201258 |
performance
Other operating costs have increased by NZ$199 million, or 58.2%, to NZ$541 million when compared to FY11 primarily due to mobile cost of sales increasing as a result of increased sales of higher-cost smartphone devices, increased device volumes during the CDMA closure and upgrade activity following the two-year XT launch anniversary in FY12 and related customer contract expiry.
Internal expenses have decreased by NZ$270 million, or 39.2%, to NZ$419 million when compared to FY11, primarily due to interconnect costs reducing in line with the corresponding decline in interconnect revenues and internal trade cost reductions as new trading arrangements were implemented.
Fy11 vs. Fy10
operating revenuesTelecom Retail’s operating revenues and other gains of NZ$2,015 million in FY11 decreased by NZ$61 million, or 2.9%, when compared to FY10.
Local service and calling revenues declined in FY11 by a combined NZ$79 million, or 7.9%, to NZ$927 million when compared to FY10 due to continued customer churn. The rate of the year on year declines in local service and calling revenues improved slightly in FY11 when compared to prior years, notwithstanding slightly higher access line churn, which was impacted earlier in FY11 by the withdrawal from market of an uncapped broadband plan. These impacts were partially offset by annual CPI increases for some local services.
As at 30 June 2011, the number of Telecom Retail access lines was 7.4% lower than 30 June 2010, with local service revenue falling 7.8%. The retail mass-market remained competitive given the range of offers by other market participants.
Mobile revenues increased by NZ$15 million, or 2.5%, to NZ$609 million in FY11 when compared to FY10. The increase resulted from uptake in higher-value mobile offerings, driven by the XT network’s data and roaming capabilities, continued growth in smartphone penetration and growth in mobile broadband and data-only devices and a favourable impact arising on a change of customer terms and conditions.
During the second half of FY11, there was an increase in postpaid mobile and higher-value customers on the XT network. Mobile demand and revenue, especially by these customers, was stimulated by the use of smartphones and increased availability, functionality and content for devices.
Data revenues in FY11 decreased by NZ$3 million, or 13.6%, to NZ$19 million when compared to FY10 reflecting a reduction in ISDN usage as a result of lower customer numbers and calling minutes.
While access and calling revenue declined, broadband and internet revenue increased by NZ$11 million, or 3.8%, to NZ$300 million in FY11 compared to FY10. Broadband net connection growth in FY11 was limited in the first half due to the withdrawal of the uncapped broadband plan noted above, while broadband connection growth regained momentum in the second half of FY11 with the introduction of additional ‘Total home’ broadband bundled offers. The Telecom Retail broadband customer base at 30 June 2011 increased by 2.1% to 591,000 connections compared to 30 June 2010 as customers continued to migrate from dial-up to broadband following the continued attraction of bundled fixed access calling and broadband offers. Product bundling remains a key strategy for Telecom Retail, providing greater value to customers with multiple product offerings while delivering overall ARPU growth of the existing base.
Internal revenue increased by NZ$6 million, or 5.2%, to NZ$122 million in FY11 when compared to FY10 as incremental interconnection revenues were partially offset by the removal of TSO revenue.
operating expensesTelecom Retail’s operating expenses of NZ$1,522 million in FY11 decreased by 8.9%, or NZ$148 million, compared to FY10 primarily due to improved direct input costs of fixed data products and continued focus on operating efficiencies. Total labour expenses declined by NZ$15 million, or 9.3%, to NZ$147 million for FY11 when compared with FY10 due to a continued focus on cost-efficiency and restructuring activities. Retail headcount was 14.3% lower at 30 June 2011 when compared to 30 June 2010.
Other operating expenses decreased by NZ$92 million, or 21.2%, to NZ$342 million in FY11 when compared with FY10, largely as a result of FY10 containing higher mobile cost of sales for the XT mobile network launch, as well as higher XT-related advertising activity in FY10. FY11 was also positively impacted by favourable movements in foreign exchange rates on US$ mobile handset purchases relative to FY10.
Internal operating expenses and intercarrier costs (now charged externally by Chorus post-Demerger) decreased by NZ$17 million, or 2.4%, to NZ$689 million in FY11 when compared to FY10, largely as a result of wholesale broadband input price reductions, a declining fixed access base, as well as continued reductions in avoidable site visits impacted by Telecom’s ‘Right First Time’ initiatives, partially offset by the new TDL costs that in FY11 were recharged by the Corporate business unit under FCA.
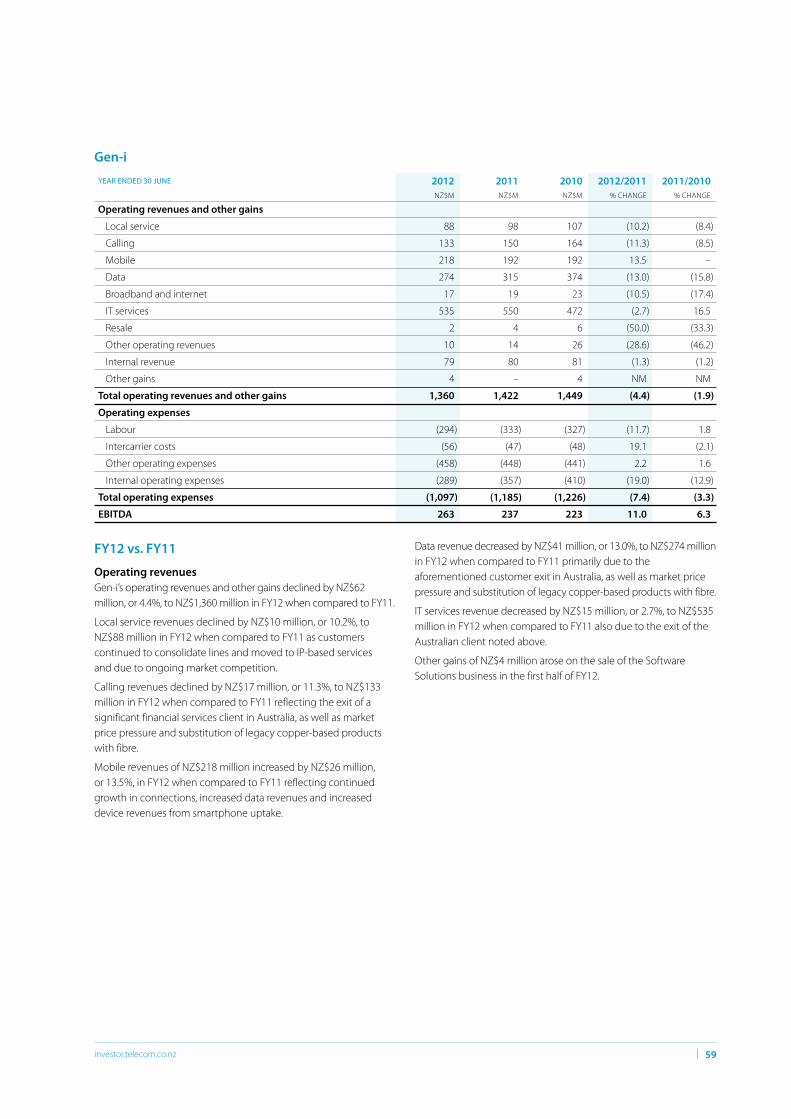
gen-i
yEAR ENDED 30 JUNE 2012 2011 2010 2012/2011 2011/2010NZ$M NZ$M NZ$M % ChANGE % ChANGE
operating revenues and other gains
Local service 88 98 107 (10.2) (8.4)
Calling 133 150 164 (11.3) (8.5)
Mobile 218 192 192 13.5 –
Data 274 315 374 (13.0) (15.8)
Broadband and internet 17 19 23 (10.5) (17.4)
IT services 535 550 472 (2.7) 16.5
Resale 2 4 6 (50.0) (33.3)
Other operating revenues 10 14 26 (28.6) (46.2)
Internal revenue 79 80 81 (1.3) (1.2)
Other gains 4 – 4 NM NM
total operating revenues and other gains 1,360 1,422 1,449 (4.4) (1.9)
operating expenses
Labour (294) (333) (327) (11.7) 1.8
Intercarrier costs (56) (47) (48) 19.1 (2.1)
Other operating expenses (458) (448) (441) 2.2 1.6
Internal operating expenses (289) (357) (410) (19.0) (12.9)
total operating expenses (1,097) (1,185) (1,226) (7.4) (3.3)
eBItDa 263 237 223 11.0 6.3
| 59investor.telecom.co.nz
Fy12 vs. Fy11
operating revenuesGen-i’s operating revenues and other gains declined by NZ$62 million, or 4.4%, to NZ$1,360 million in FY12 when compared to FY11.
Local service revenues declined by NZ$10 million, or 10.2%, to NZ$88 million in FY12 when compared to FY11 as customers continued to consolidate lines and moved to IP-based services and due to ongoing market competition.
Calling revenues declined by NZ$17 million, or 11.3%, to NZ$133 million in FY12 when compared to FY11 reflecting the exit of a significant financial services client in Australia, as well as market price pressure and substitution of legacy copper-based products with fibre.
Mobile revenues of NZ$218 million increased by NZ$26 million, or 13.5%, in FY12 when compared to FY11 reflecting continued growth in connections, increased data revenues and increased device revenues from smartphone uptake.
Data revenue decreased by NZ$41 million, or 13.0%, to NZ$274 million in FY12 when compared to FY11 primarily due to the aforementioned customer exit in Australia, as well as market price pressure and substitution of legacy copper-based products with fibre.
IT services revenue decreased by NZ$15 million, or 2.7%, to NZ$535 million in FY12 when compared to FY11 also due to the exit of the Australian client noted above.
Other gains of NZ$4 million arose on the sale of the Software Solutions business in the first half of FY12.

Telecom Annual Report 201260 |
performance
operating expensesLabour costs decreased by NZ$39 million, or 11.7%, to NZ$294 million in FY12 and when compared with FY11 due to reduced headcount, business transformation savings and the centralisation of, and cost savings in, support functions that are now charged to Gen-i through internal cost allocation.
Intercarrier costs of NZ$56 million in FY12 represented new trades with Chorus post-Demerger that had previously been charged via internal operating expenses.
Other operating expenses increased by NZ$10 million, or 2.2%, to NZ$458 million in FY12 when compared to FY11, due to increased volumes of purchasing being partially offset by lower cost of sales on other business and support costs, due in part to the exit of the aforementioned Australian client and reduced expenses relating to the reduced headcount.
Internal expenses declined by NZ$68 million, or 19.0%, to NZ$289 million when compared to FY11 due to the movement of costs from internal to external intercarrier costs arising from the new post-Demerger trading arrangements and a decrease in termination cost recharges from other Telecom business units, as a result of the reduction in SMS, voice and mobile termination rates.
Fy11 vs. Fy10
operating revenuesGen-i’s operating revenues and other gains declined by NZ$27 million, or 1.9%, to NZ$1,422 million in FY11 when compared to FY10.
Local service revenues declined by NZ$9 million, or 8.4%, to NZ$98 million in FY11 when compared to FY10. Calling revenues declined by NZ$14 million, or 8.5%, in FY11 when compared to FY10. The year on year reductions in local service and calling revenues primarily reflect reductions in price due to increased competition and lower termination rates, with some reductions in calling volumes due to customer churn in the highly competitive market.
Mobile revenues in FY11 remained consistent with FY10 at NZ$192 million. The second half of FY11 saw growth in connections and usage revenues (especially in mobile data, text, roaming and international) which offset declines earlier in the year.
Data revenues declined by NZ$59 million, or 15.8%, to NZ$315 million in FY11 when compared to FY10. The decline across the year reflected the continued change in the competitive environment and economic conditions where customers move towards lower-cost options. In New Zealand these conditions have resulted in increased price and volume pressure.
Revenue from IT services increased by NZ$78 million, or 16.5%, to NZ$550 million in FY11 when compared with FY10 due to strong managed services growth, combined with further procurement revenue increases, while traditional calling, local services and data revenues continued to reduce in line with industry trends as increased competition, regulation and technology drove down pricing.
Resale and broadband and internet revenues declined year on year from a combined NZ$29 million in FY10 to NZ$23 million in FY11.
Other operating revenue declined by NZ$12 million, or 46.2%, to NZ$14 million in FY11 when compared to FY10. The decrease across the year reflected lower revenue in Australia, primarily driven through continued declines in revenues from a significant financial services client in Australia, more than offsetting the growth experienced in the Australian mid-market sector.
Internal revenue remained relatively stable in FY11 at NZ$80 million when compared to FY10. These revenues relate to IT procurement supplied to other Telecom business units and are driven off demand for IT equipment.
operating expensesLabour costs increased by NZ$6 million, or 1.8%, to NZ$333 million in FY11 when compared to FY10, primarily due to increased headcount incurred in FY11 to deliver additional professional services and IT solutions outsourcing.
Other operating expenses increased by NZ$7 million, or 1.6%, to NZ$448 million in FY11 when compared to FY10 as a result of increased costs to support revenue growth in IT services and higher volumes in the procurement line of business.
Internal operating expenses and intercarrier costs (the latter now charged externally by Chorus post-Demerger) declined by NZ$54 million, or 11.8%, to NZ$404 million in FY11 when compared to FY10 as Gen-i experienced a reduction due to lower customer demand in the number of lines and volume of services purchased from other Telecom business units.

Wholesale & International
yEAR ENDED 30 JUNE 2012 2011 2010 2012/2011 2011/2010NZ$M NZ$M NZ$M % ChANGE % ChANGE
operating revenues and other gains
Local service 236 218 192 8.3 13.5
Calling 194 262 240 (26.0) 9.2
Interconnection 68 158 139 (57.0) 13.7
Mobile 4 6 10 (33.3) (40.0)
Data 98 91 85 7.7 7.1
Broadband and internet 1 1 2 0.0 (50.0)
Other operating revenues 19 24 25 (20.8) (4.0)
Internal revenue 119 268 271 (55.6) (1.1)
Other gains 6 – – NM NM
total operating revenues 745 1,028 964 (27.5) 6.6
operating expenses
Labour (22) (38) (41) (42.1) (7.3)
Intercarrier costs (383) (549) (492) (30.2) 11.6
Other operating expenses (27) (40) (34) (32.5) 17.6
Internal operating expenses (159) (256) (233) (37.9) 9.9
total operating expenses (591) (883) (800) (33.1) 10.4
eBItDa 154 145 164 6.2 (11.6)
| 61investor.telecom.co.nz
Fy12 vs. Fy11
operating revenuesWholesale & International’s operating revenue decreased by NZ$283 million, or 27.5%, to NZ$745 million in FY12 when compared to FY11.
Local service revenues increased by NZ$18 million, or 8.3%, to NZ$236 million in FY12, primarily reflecting growth in the number of fixed access lines, with connections increasing by 6.3% from 414,000 lines at 30 June 2011 to 440,000 lines at 30 June 2012. The increase in connections was driven by increased promotional activity by service providers.
Calling revenues decreased by NZ$68 million, or 26.0%, to NZ$194 million in FY12 as a result of the competition in the international market causing a fall in the average price per minute, as well as exiting low-margin customer arrangements.
Interconnection revenues decreased by NZ$90 million, or 57.0%, to NZ$68 million in FY12, primarily due to decreases in SMS rates and mobile termination rates.
Mobile revenues decreased by NZ$2 million, or 33.3%, to NZ$4 million in FY12 predominantly due to a migration of customers from a CDMA network Mobile Virtual Network Operator (MVNO) to a competitor at the end of FY11.
Data revenues increased by NZ$7 million, or 7.7%, to NZ$98 million in FY12 driven by growth with existing customers.
Internal revenues decreased by NZ$149 million to NZ$119 million in FY12 due primarily to the reduction in SMS and mobile termination rates, which reduced termination cost recharges to other Telecom business units. New internal trading arrangements with other business units, combined with calling volume declines, as users switched from traditional voice to internet-based forms of communication, also contributed to the decline.
Other gains of NZ$6 million in FY12 arose on the sale of cable capacity.
operating expensesWholesale & International’s operating expenses decreased by NZ$292 million, or 33.1%, to NZ$591 million in FY12 when compared to FY11.
Labour costs decreased by NZ$16 million, or 42.1%, to NZ$22 million in FY12 reflecting lower employee numbers (with a number of employees transferring to Chorus or leaving on Demerger) and cost-saving initiatives.
Intercarrier costs decreased by NZ$166 million, or 30.2%, to NZ$383 million in FY12 primarily due to lower costs per minute in the carrier services market, exiting low-margin customer arrangements and decreases in SMS and mobile termination rates.
Other operating expenses decreased by NZ$13 million, or 32.5%, to NZ$27 million due to the effect of cost-savings initiatives in the carrier services business and a favourable foreign exchange impact arising from the strength of the NZ dollar.
Internal expenses decreased by NZ$97 million, or 37.9%, to NZ$159 million in FY12 due to lower internal costs as a result of a lower allocation of interconnect revenue following the decrease in SMS and mobile termination rates.
Fy11 vs. Fy10
operating revenuesWholesale & International’s operating revenue increased by NZ$64 million, or 6.6%, to NZ$1,028 million in FY11 when compared to FY10.
Local service revenues increased by NZ$26 million, or 13.5%, to NZ$218 million in FY11 when compared to FY10. The increases across the year mainly reflected growth in the number

aapt
yEAR ENDED 30 JUNE 2012 2011 2010 2012/2011 2011/2010NZ$M NZ$M NZ$M % ChANGE % ChANGE
yEAR ENDED 30 JUNE 2012 2011 2010 2012/2011 2011/2010NZ$M NZ$M NZ$M % ChANGE % ChANGE
operating revenues
Local service – 14 27 NM (48.1)
Calling 167 214 271 (22.0) (21.0)
Interconnection 36 37 39 (2.7) (5.1)
Mobile 10 18 30 (44.4) (40.0)
Data 137 149 145 (8.1) 2.8
Broadband and internet 121 167 197 (27.5) (15.2)
Resale 141 231 272 (39.0) (15.1)
Other operating revenues 6 4 30 50.0 (86.7)
Internal revenue 46 66 98 (30.3) (32.7)
total operating revenues 664 900 1,109 (26.2) (18.8)
operating expenses
Labour (129) (149) (172) (13.4) (13.4)
Intercarrier costs (342) (505) (573) (32.3) (11.9)
Other operating expenses (68) (102) (167) (33.3) (38.9)
Internal operating expenses (37) (54) (61) (31.5) (11.5)
total operating expenses (576) (810) (973) (28.9) (16.8)
eBItDa 88 90 136 (2.2) (33.8)
Reported NZ$ results from AAPT are impacted by movements in exchange rates. The average NZ$:A$ foreign exchange rates for the last three years are shown in the table below.
Average NZ$:A$ foreign exchange rate 0.7813 0.7685 0.7967 1.7 (3.5)
Telecom Annual Report 201262 |
performance
of fixed access lines, with connections increasing by 10.7% in FY11. Revenue also increased when compared to the prior year due to annual CPI increases.
Calling revenues increased by NZ$22 million, or 9.2%, to NZ$262 million in FY11 when compared to FY10 primarily as a result of international carrier services to higher-value destinations, partially offset by the high value of the NZ$ on US$ denominated revenues.
Interconnection revenues increased by NZ$19 million, or 13.7%, to NZ$158 million in FY11 when compared to FY10 primarily due to an increase in inbound SMS volumes across the portfolio due to increasing presence and activity to off-net carriers. however, this was partially offset by the impact of mobile termination rate decreases from May 2011.
Mobile revenue decreased by NZ$4 million, or 40.0%, to NZ$6 million in FY11 when compared to FY10 mainly due to the migration of customers from a CDMA network MVNO to a competitor. The impact of this was partially offset by a one-off retrospective pricing adjustment.
Data revenues increased by NZ$6 million, or 7.1%, to NZ$91 million in FY11 when compared to FY10 primarily due to volume growth with existing customers.
Internal revenues decreased by NZ$3 million, or 1.1%, to NZ$268 million in FY11 when compared to FY10 due primarily to decreases
in mobile termination rates, impacting termination cost recharges to other Telecom business units, being partially offset by interconnection revenue growth from the allocation of interconnect expenses to other business units, driven by higher traffic volumes.
operating expensesWholesale & International’s operating expenses increased by NZ$83 million, or 10.4%, to NZ$883 million in FY11 when compared with FY10.
Labour costs decreased by NZ$3 million, or 7.3%, to NZ$38 million in FY11 when compared with FY10, reflecting lower employee numbers and lower project labour costs.
Intercarrier costs increased by NZ$57 million, or 11.6%, to NZ$549 million in FY11 when compared with FY10 due to a combination of international trading in higher-value but more expensive destinations in the global carrier services market and an increase in interconnection outbound SMS volumes.
Internal operating expenses increased by NZ$23 million, or 9.9%, to NZ$256 million in FY11 when compared to FY10. The increase across the year was due to higher interconnect volumes increasing the internal cost resulting from the allocation of interconnect revenue (despite the mobile terminal rate reductions) as well as an increased allocation of costs from other business units.

| 63investor.telecom.co.nz
The FY12 average NZ$:A$ foreign exchange rate was higher than the preceding financial year, resulting in an equivalent decrease in reported NZ$ revenues, expenses and EBITDA for AAPT in FY12.
The following analysis is based on the underlying Australian dollar (A$) results in order to remove the impact of foreign exchange movements.
Until September 2010 AAPT had three customer segments: Wholesale, Business and Consumer. Wholesale focuses on leveraging AAPT’s network reach particularly within the ‘on-net’ data and internet sales to the carrier, partner and reseller channels. Business addresses the Corporate, Medium and Small Enterprise segments and is focused on selling ‘on-net’ data and internet. The Consumer division was sold on 30 September 2010 for A$60 million. The gain on the sale of the Consumer division is excluded from Telecom’s analysis of its segment results (see note 2 to the financial statements).
Fy12 vs. Fy11
operating revenuesOperating revenues decreased by A$177 million, or 25.5%, to A$516 million in FY12 as revenue declined in all categories.
A$92 million of the revenue decline was attributable to the net reduction in revenue due to the sale of the Consumer division, which has affected calling, local service, broadband and internet and resale revenues. The Business Solutions and Wholesale divisions also experienced an A$87 million decrease in revenue when compared to FY11. This was primarily driven by wholesale customer consolidation, prior to NBN going live, and the continued rationalisation of low-margin resale revenue. Additionally, pricing erosion in internet bandwidth continues but volumes continue to grow. Internal revenue has decreased by A$16 million to A$35 million, which is driven by lower sales to Gen-i.
operating expensesLabour costs decreased in FY12 by A$12 million, or 10.6%, to A$101 million when compared to FY11, primarily due to the 3.2% lower headcount, which was driven by restructuring to align to the new business structure.
Intercarrier costs reduced by A$123 million, or 31.6%, to A$266 million in FY12 when compared to FY11 in line with reduced revenue, reflecting the focus on higher margin data and internet sales, partially offset by less favourable terms agreed with Telstra in FY12.
Other operating expenses reduced by A$25 million, or 32.1%, to A$53 million in FY12 when compared to FY11. The reduction was driven by cost savings through the sale of the Consumer division, exiting contracts, billing system rationalisation and the exit of CBD office space.
Internal expenses relate mainly to intercarrier costs and the decline was driven by the decline in revenue volumes.
Fy11 vs. Fy10
operating revenuesIn FY11 operating revenues decreased by A$189 million, or 21.4%, to A$693 million when compared to FY10. A$100 million of the revenue decline was attributable to the net reduction in revenue due to the sale of the Consumer division, which has affected calling, local service, broadband and internet and resale revenues. Business Solutions and Wholesale also experienced an A$84 million decrease in revenue when compared to FY10 primarily due to pricing pressure and continued churn of low-margin customers.
operating expensesLabour costs decreased by A$23 million, or 16.9%, to A$113 million in FY11 when compared to FY10 mainly due to 31.9% lower headcount driven by restructuring after the sale of the Consumer division.
Intercarrier costs decreased by A$66 million, or 14.5%, to A$389 million in FY11 when compared to FY10 in line with reduced revenue following the sale of the Consumer division, and the ongoing savings arising from moving customers ‘on-net’, partially offset by less favourable terms agreed with another commercial operator.
Other operating expenses decreased by A$57 million, or 42.2%, to A$78 million in FY11 when compared to FY10. The reduction across the year was driven by the sale of the Consumer division, significant data storage cost reductions, an IT support contract renegotiation and lower bad debt expenses.
Internal operating expenses decreased by A$6 million, or 12.5%, to A$42 million in FY11 when compared to FY10. The FY11 reduction in internal operating expenses was mostly due to price and volume decreases for international usage and volume declines.
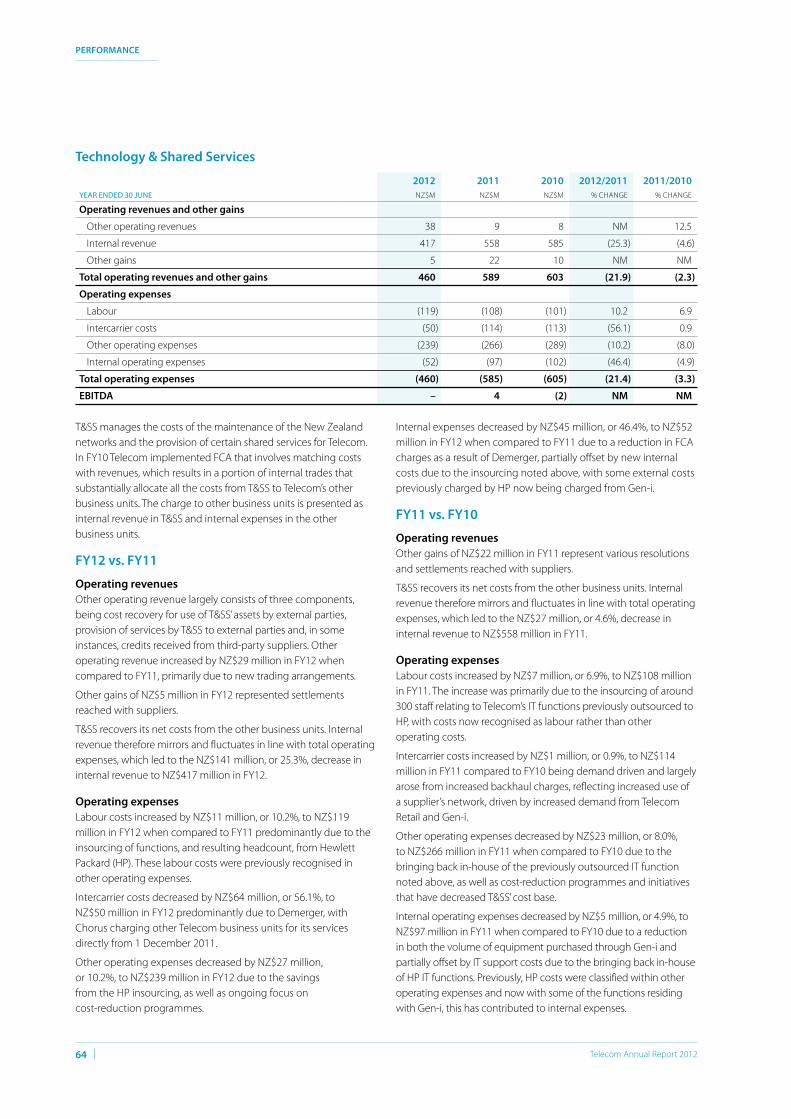
technology & shared services
2012 2011 2010 2012/2011 2011/2010yEAR ENDED 30 JUNE NZ$M NZ$M NZ$M % ChANGE % ChANGE
operating revenues and other gains
Other operating revenues 38 9 8 NM 12.5
Internal revenue 417 558 585 (25.3) (4.6)
Other gains 5 22 10 NM NM
total operating revenues and other gains 460 589 603 (21.9) (2.3)
operating expenses
Labour (119) (108) (101) 10.2 6.9
Intercarrier costs (50) (114) (113) (56.1) 0.9
Other operating expenses (239) (266) (289) (10.2) (8.0)
Internal operating expenses (52) (97) (102) (46.4) (4.9)
total operating expenses (460) (585) (605) (21.4) (3.3)
eBItDa – 4 (2) nM nM
Telecom Annual Report 201264 |
performance
T&SS manages the costs of the maintenance of the New Zealand networks and the provision of certain shared services for Telecom. In FY10 Telecom implemented FCA that involves matching costs with revenues, which results in a portion of internal trades that substantially allocate all the costs from T&SS to Telecom’s other business units. The charge to other business units is presented as internal revenue in T&SS and internal expenses in the other business units.
Fy12 vs. Fy11
operating revenuesOther operating revenue largely consists of three components, being cost recovery for use of T&SS’ assets by external parties, provision of services by T&SS to external parties and, in some instances, credits received from third-party suppliers. Other operating revenue increased by NZ$29 million in FY12 when compared to FY11, primarily due to new trading arrangements.
Other gains of NZ$5 million in FY12 represented settlements reached with suppliers.
T&SS recovers its net costs from the other business units. Internal revenue therefore mirrors and fluctuates in line with total operating expenses, which led to the NZ$141 million, or 25.3%, decrease in internal revenue to NZ$417 million in FY12.
operating expensesLabour costs increased by NZ$11 million, or 10.2%, to NZ$119 million in FY12 when compared to FY11 predominantly due to the insourcing of functions, and resulting headcount, from hewlett Packard (hP). These labour costs were previously recognised in other operating expenses.
Intercarrier costs decreased by NZ$64 million, or 56.1%, to NZ$50 million in FY12 predominantly due to Demerger, with Chorus charging other Telecom business units for its services directly from 1 December 2011.
Other operating expenses decreased by NZ$27 million, or 10.2%, to NZ$239 million in FY12 due to the savings from the hP insourcing, as well as ongoing focus on cost-reduction programmes.
Internal expenses decreased by NZ$45 million, or 46.4%, to NZ$52 million in FY12 when compared to FY11 due to a reduction in FCA charges as a result of Demerger, partially offset by new internal costs due to the insourcing noted above, with some external costs previously charged by hP now being charged from Gen-i.
Fy11 vs. Fy10
operating revenuesOther gains of NZ$22 million in FY11 represent various resolutions and settlements reached with suppliers.
T&SS recovers its net costs from the other business units. Internal revenue therefore mirrors and fluctuates in line with total operating expenses, which led to the NZ$27 million, or 4.6%, decrease in internal revenue to NZ$558 million in FY11.
operating expensesLabour costs increased by NZ$7 million, or 6.9%, to NZ$108 million in FY11. The increase was primarily due to the insourcing of around 300 staff relating to Telecom’s IT functions previously outsourced to hP, with costs now recognised as labour rather than other operating costs.
Intercarrier costs increased by NZ$1 million, or 0.9%, to NZ$114 million in FY11 compared to FY10 being demand driven and largely arose from increased backhaul charges, reflecting increased use of a supplier’s network, driven by increased demand from Telecom Retail and Gen-i.
Other operating expenses decreased by NZ$23 million, or 8.0%, to NZ$266 million in FY11 when compared to FY10 due to the bringing back in-house of the previously outsourced IT function noted above, as well as cost-reduction programmes and initiatives that have decreased T&SS’ cost base.
Internal operating expenses decreased by NZ$5 million, or 4.9%, to NZ$97 million in FY11 when compared to FY10 due to a reduction in both the volume of equipment purchased through Gen-i and partially offset by IT support costs due to the bringing back in-house of hP IT functions. Previously, hP costs were classified within other operating expenses and now with some of the functions residing with Gen-i, this has contributed to internal expenses.

Capital management and dividend policy Cash flowsThe following table sets out information regarding Telecom’s cash flows from FY10 to FY12:
2012 2011 2010 2012/2011 2011/2010yEAR ENDED 30 JUNE NZ$M NZ$M NZ$M % ChANGE % ChANGE
net cash from
Operating activities 985 1,349 1,761 (27.0) (23.4)
Investing activities (663) (835) (1,091) (20.6) (23.5)
Financing activities (462) (520) (576) (11.2) (9.7)
Foreign exchange movement 1 (9) (16) NM NM
net increase/(decrease) in cash (139) (15) 78 nM nM
| 65investor.telecom.co.nz
Critical accounting policies and recently issued accounting standardsSee note 1 to the financial statements for Telecom’s critical accounting policies. Telecom’s critical accounting policies have been reviewed by Telecom’s Audit and Risk Management Committee. See note 33 to the financial statements for the potential impact of recently issued accounting standards.
Sharemarket review Telecom’s share price opened the year at NZ$2.52 on 1 July 2011 and closed at NZ$2.39 on 30 June 2012, a decrease of 5% for 2012. however, this does not make allowance for the Demerger of Chorus, which became effective on 1 December 2011. When adjusted to reflect the Demerger, the share price has increased from NZ$1.92, to NZ$2.39, an increase of 25%. Over the same period, the NZX50 fell by 2%, meaning that Telecom has significantly outperformed the NZX50 during the period. Telecom believes the increase in the share price reflects positive sentiment towards the Demerger, which has resulted in a simplified regulatory regime and allows Telecom to compete on a similar regulatory footing with its competitors. Telecom’s focus on growing free cash flow by reducing costs and more controlled capital management has also been a positive catalyst for the share price.
global financial markets Global markets remain volatile with investors concerned about sovereign debt issues in Europe and an economic slow-down in the US and China. This volatility has seen investors move money away from equities and into bonds and cash. Telecom believes that the markets will remain volatile for some time as these macroeconomic issues play out.
1/07
/201
1
1/08
/201
1
1/09
/201
1
1/10
/201
1
1/11
/201
1
1/12
/201
1
1/01
/201
2
1/02
/201
2
1/03
/201
2
1/04
/201
2
1/05
/201
2
1/06
/201
2
$0.00
$0.50
$1.00
$1.50
$2.00
$2.50
$3.00
Incl. Chorus
Excl. Chorus
Figure 1: Telecom’s share price on the NZX for the year ended 30 June 2012
Fy12 vs. Fy11
Cash flows from operating activitiesNet cash from operating activities decreased in FY12 by NZ$364 million to NZ$985 million when compared to FY11. This is primarily due to Telecom now having to pay Chorus for services previously treated as internal (non cash) trading and Telecom no longer receiving Chorus-related cash received from customers. Cash received from customers decreased by NZ$440 million and SX dividends received decreased by NZ$13 million, which were partially offset by a NZ$19 million reduction in payments to suppliers and employees, an increase in interest receipts of NZ$11 million and a NZ$52 million reduction in interest payments due to lower debt levels after Demerger. As well as Demerger impacts, the decline in cash received from customers follows the overall declining revenue trend and was also affected by other working capital requirements.
Supplier and employee payments have reduced due to cost saving initiatives but were mostly offset by Demerger impacts. Tax payments of NZ$120 million in FY12 decreased by NZ$7 million when compared to the prior comparative period.
net cash from investing activitiesThe net cash outflow on investing activities of NZ$663 million in FY12 was NZ$172 million, or 20.6%, lower than the NZ$835 million outflow in FY11 largely due to a NZ$342 million reduction in capital expenditure payments in FY12, as a result of management’s capital interventions, combined with NZ$5 million of proceeds from the sale of the Software Solutions business. This was partially offset by the one-off NZ$180 million of proceeds in FY11 from the sale of the AAPT Consumer division, Telecom’s stakes in iiNet and Macquarie Telecom and the proceeds from the Yahoo!Xtra sale.

Telecom Annual Report 201266 |
performance
net cash from financing activitiesTelecom’s outflows from financing activities largely reflect borrowing activities and dividend payments to shareholders. The net cash outflow for financing activities in FY12 was NZ$462 million, compared to a cash outflow of NZ$520 million in FY11. FY12 comprises NZ$340 million of dividend payments compared to NZ$313 million in FY11. Telecom also repurchased share capital totalling NZ$165 million in FY12. During FY12 Telecom repaid net NZ$1,302 million of long-term debt and derivatives compared to NZ$783 million in FY11. The repayment was offset by a net receipt on short-term and long-term debt of NZ$1,427 million, of which NZ$1,106 million was included in the net assets transferred to Chorus. One-off debt restructuring costs of NZ$205 million were paid in FY12. Telecom also received NZ$110 million of released collateral funds compared to payments of NZ$89 million in FY11 and net NZ$13 million receipts from finance lease arrangements.
Fy11 vs. Fy10
net cash from operating activitiesNet cash from operating activities decreased in FY11 by NZ$412 million, or 23.4%, to NZ$1,349 million when compared to FY10. This was primarily due to the NZ$249 million reduction in cash received from customers, combined with a NZ$32 million increase in payments to suppliers and employees. The decline in cash received from customers follows the overall declining revenue trend and was also affected by one-off items, including: TSO receipts in the prior comparative period not repeated in FY11; the impact of the Consumer division sale by AAPT; and other working capital requirements. The increase in payments to suppliers and employees was a result of the reduction in labour and other operating costs being more than offset by one-off expenses and the timing differences of payments. Tax payments of NZ$127
million in FY11, largely relating to provisional tax payments in FY11, as well as supplementary dividends paid to non-residents, compared with a net refund of NZ$1 million in FY10 due to higher prepayments of tax in FY09, which were then refunded.
net cash from investing activities The net cash outflow on investing activities of NZ$835 million in FY11 was NZ$256 million, or 23.5%, lower than the NZ$1,091 million outflow in FY10, largely due to NZ$180 million of proceeds received in FY11 from the sale of the AAPT Consumer division, Telecom’s stakes in iiNet and Macquarie Telecom and from the Yahoo!Xtra sale. In addition, a reduction in payments for property, plant and equipment and intangible assets (capital expenditure) in FY11 due to management’s interventions on this spend, contributed to the year on year improvement.
net cash from financing activitiesTelecom’s outflows from financing activities largely reflect borrowing activities and dividend payments to shareholders.
The net cash outflow for financing activities in FY11 was NZ$520 million, compared to NZ$576 million in FY10. FY11 comprises NZ$313 million of dividend payments, NZ$783 million relating to the repayment of debt and derivatives and NZ$89 million of increased payments for collateral funds; partially offset by NZ$665 million of proceeds from issuing short-term debt and derivatives. This compared to NZ$327 million of dividend payments in FY10, NZ$1,391 million for the repayment of debt and derivatives and NZ$21 million of increased payments for collateral funds; partially offset by NZ$1,091 million of proceeds from issuing short-term debt and derivatives.
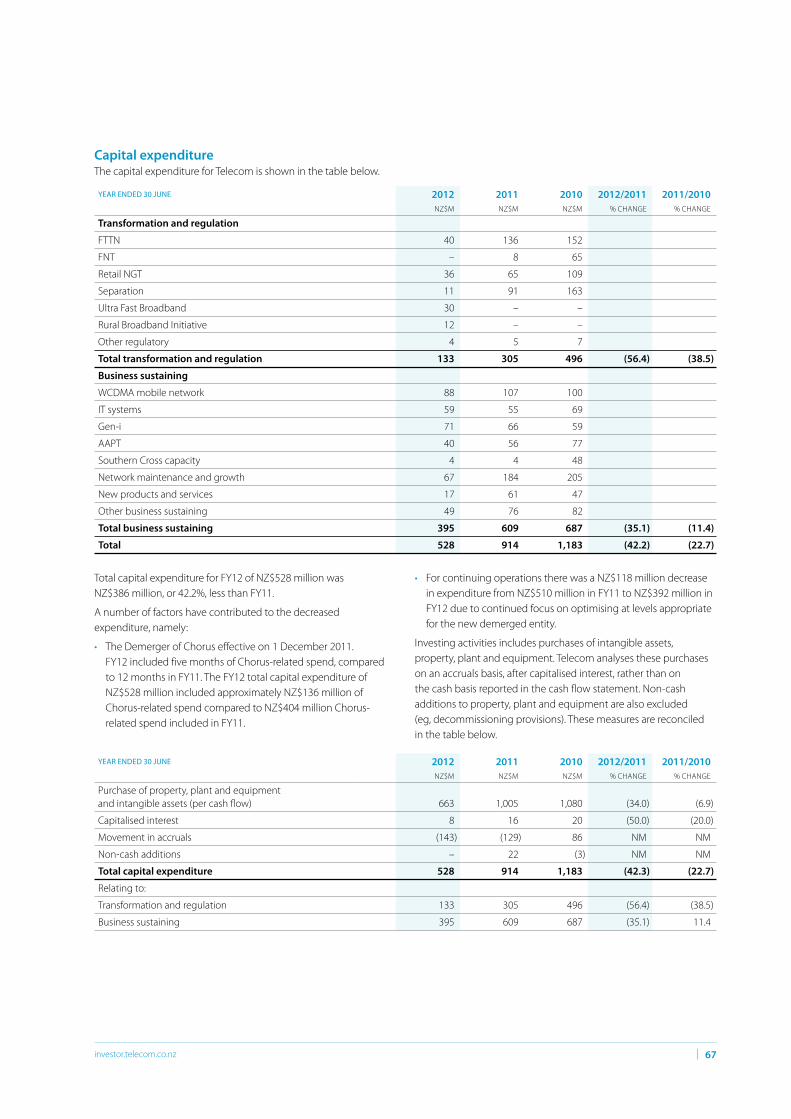
yEAR ENDED 30 JUNE 2012 2011 2010 2012/2011 2011/2010NZ$M NZ$M NZ$M % ChANGE % ChANGE
Capital expenditure The capital expenditure for Telecom is shown in the table below.
yEAR ENDED 30 JUNE 2012 2011 2010 2012/2011 2011/2010NZ$M NZ$M NZ$M % ChANGE % ChANGE
Purchase of property, plant and equipment and intangible assets (per cash flow) 663 1,005 1,080 (34.0) (6.9)
Capitalised interest 8 16 20 (50.0) (20.0)
Movement in accruals (143) (129) 86 NM NM
Non-cash additions – 22 (3) NM NM
total capital expenditure 528 914 1,183 (42.3) (22.7)
Relating to:
Transformation and regulation 133 305 496 (56.4) (38.5)
Business sustaining 395 609 687 (35.1) 11.4
transformation and regulation
FTTN 40 136 152
FNT – 8 65
Retail NGT 36 65 109
Separation 11 91 163
Ultra Fast Broadband 30 – –
Rural Broadband Initiative 12 – –
Other regulatory 4 5 7
total transformation and regulation 133 305 496 (56.4) (38.5)
Business sustaining
WCDMA mobile network 88 107 100
IT systems 59 55 69
Gen-i 71 66 59
AAPT 40 56 77
Southern Cross capacity 4 4 48
Network maintenance and growth 67 184 205
New products and services 17 61 47
Other business sustaining 49 76 82
total business sustaining 395 609 687 (35.1) (11.4)
total 528 914 1,183 (42.2) (22.7)
| 67investor.telecom.co.nz
Total capital expenditure for FY12 of NZ$528 million was NZ$386 million, or 42.2%, less than FY11.
A number of factors have contributed to the decreased expenditure, namely:
• The Demerger of Chorus effective on 1 December 2011. FY12 included five months of Chorus-related spend, compared to 12 months in FY11. The FY12 total capital expenditure of NZ$528 million included approximately NZ$136 million of Chorus-related spend compared to NZ$404 million Chorus-related spend included in FY11.
• For continuing operations there was a NZ$118 million decrease in expenditure from NZ$510 million in FY11 to NZ$392 million in FY12 due to continued focus on optimising at levels appropriate for the new demerged entity.
Investing activities includes purchases of intangible assets, property, plant and equipment. Telecom analyses these purchases on an accruals basis, after capitalised interest, rather than on the cash basis reported in the cash flow statement. Non-cash additions to property, plant and equipment are also excluded (eg, decommissioning provisions). These measures are reconciled in the table below.
Telecom Annual Report 201268 |
performance
Fy12 vs. Fy11
transformation and regulationThe Chorus-related FTTN investment in FY12 of NZ$40 million was NZ$96 million lower than FY11, with the programme winding down as planned up to Demerger.
Retail NGT investment of NZ$36 million was NZ$29 million less in FY12 due to the timing of higher spend on NGT capability in FY11 compared to programme requirements in FY12.
Capital expenditure relating to operational separation decreased to NZ$11 million in FY12, compared with NZ$91 million in FY11, due to Chorus operational separation commitments being met during FY11.
There were two new capital expenditure initiatives in FY12. UFB-related capital expenditure was NZ$30 million and spend on RBI was NZ$12 million. The majority of spend was incurred by Chorus prior to Demerger.
Business sustainingSpend on the XT network decreased to NZ$88 million in FY12 from NZ$107 million in FY11, due to significantly high levels of mobile network spending in the past leading to lower spend required in FY12.
Expenditure on IT systems of NZ$59 million was NZ$4 million higher in FY12 than FY11 primarily due to additional process improvement projects being completed in FY12.
Gen-i spend in FY12 of NZ$71 million was NZ$5 million higher than FY11, primarily due to h2 FY12 spend relating to a new client data centre in Auckland.
AAPT spend of NZ$40 million in FY12 was NZ$16 million lower than FY11 due to continued focus and prioritisation of investment needs. Key spend for FY12 is customer and capacity related.
Network maintenance and growth spend of NZ$67 million was NZ$117 million lower than FY11 due to this being predominantly Chorus-related requirements. With regard to continuing operations, the NZ$17 million reduction in spend in FY12 is due to key capacity projects being completed in FY11, together with a continued focus on improving network utilisation.
New products and services spend of NZ$17 million was NZ$44 million lower than FY11 due to the high level of investment in FY11 on backhaul services infrastructure, the majority of which was Chorus related.
Other business sustaining spend of NZ$49 million was NZ$27 million lower than FY11 due to key power and building projects being completed in FY11.
Fy11 vs. Fy10
transformation and regulationSpend on Telecom’s transformation and regulation programmes of NZ$305 million, decreased by NZ$191 million, or 38.5%, in FY11 when compared to FY10. The decrease in spending was across all categories. FTTN investment for FY11 continued as planned and the FNT spend in FY11 reduced to NZ$8 million from NZ$65 million in FY10, as the development of the Primary Line Voice service was completed.
Retail NGT investment of NZ$65 million was NZ$44 million less in FY11 when compared to FY10 as broadband aggregation was completed and is now in the migration activity phase at a lower capital cost.
Operational separation-driven investment in FY11 decreased to NZ$91 million compared with NZ$163 million in FY10 due to the majority of operational separation commitments being met or developed, during FY10.
Business sustainingSpend on Telecom’s business sustaining programmes of NZ$609 million decreased by NZ$78 million, or 11.4%, in FY11 when compared to FY10. AAPT spend of NZ$56 million in FY11 was NZ$21 million lower than FY10 due to lower capital requirements following the sale of the Consumer division. Network maintenance and growth spend of NZ$184 million in FY11 was NZ$21 million lower than FY10 due to lower volumes of new residential and business connections requiring capital investment. New products and services spend in FY11 of NZ$61 million was higher than the NZ$47 million in FY10 in order to meet the requirements of new customer deals, while spend on the XT mobile network was NZ$7 million higher in FY11 than in FY10.
liquidity and capital resourcesTelecom’s principal sources of liquidity are operating cash flows and external borrowing primarily from existing debt facilities and financing programmes.
Credit ratingsThe Telecom board continues to be committed to maintaining ‘single A Band’ credit ratings from Moody’s Investors Service and Standard & Poor’s and its capital management policies are designed to ensure this objective is met. Relevant factors include Telecom’s debt profile, operating outlook, cash flow and cost of capital.
Following the Demerger Telecom adopted capital structure policies consistent with maintaining ‘A Band’ credit ratings from Moody’s Investors Service and Standard & Poor’s.
As part of this commitment Telecom manages its debt levels to ensure that the ratio of net interest-bearing debt (inclusive of associated derivatives) to EBITDA does not materially exceed 1.1 times on a long-run basis, which for credit ratings agency purposes equates approximately to net debt to EBITDA of 1.5 times. The difference between these two ratios is primarily due to the capitalisation of operating leases by credit ratings agencies.

| 69investor.telecom.co.nz
FundingAs detailed in note 25 to the financial statements, Telecom evaluates its liquidity requirements on an ongoing basis. In general, Telecom has generated sufficient cash flows from its operating activities to meet its financial liabilities. In the event of any shortfalls, Telecom has short-and long-term financing programmes in place:
• Short term consisting of a US$1 billion European Commercial Paper programme and a NZ$500 million note facility; and
• Long term consisting of a US$2 billion Euro Medium Term Note Programme, a Telebond Programme and a NZ$400 million committed bank facility.
In addition, Telecom has a committed stand-by facility of NZ$600 million with a number of creditworthy banks and committed overdraft facilities of NZ$20 million with New Zealand banks and A$5 million with Australian banks. There are no compensating balance requirements associated with these facilities.
Debt reorganisation programmeImmediately prior to Demerger Telecom repaid the US$250 million, CAD275 million and ChF200 million bonds, including the related derivatives. As part of the Demerger, Telecom bondholders elected to exchange GBP235 million (NZ$626 million at hedged rates) of Telecom GBP EMTN bonds to Chorus GBP EMTN bonds, issued by Chorus under the Chorus EMTN Programme. Bondholders representing GBP40 million (NZ$110 million at hedged rates) did not elect to exchange to Chorus bonds and, consequently, these bonds remained obligations of Telecom. The related cross-currency swaps were split and partially novated to Chorus, along with the exchanged bonds. Prior to Demerger, the interest rate swaps relating to the Telecom GBP bonds were closed out. New interest rate swaps have since been entered into, hedging the GBP bonds that remain in Telecom.
Immediately prior to Demerger Telecom also drew NZ$1,106 million under a new syndicated facility. This drawn facility was included in the net assets transferred to Chorus and, from the date of Demerger, was no longer part of Telecom’s facilities.
The costs associated with the debt restructuring above have been included in discontinued operations and are summarised in note 9 to the financial statements.
In the second half of FY12 Telecom began a programme to further reorganise its capital structure. This included renewal of the existing committed standby-facility to a reduced NZ$600 million (undrawn at 30 June 2012) and establishing new two-and three-year bank funding totalling NZ$400 million (NZ$300 million drawn at 30 June 2012).
See note 25 to the financial statements for further details of Telecom’s financial instruments and risk management.
Telecom’s debt arrangements contain certain triggers in the event of default, as defined in the various debt agreements.
Telecom is also required to post collateral to support the value of certain derivatives. As at 30 June 2012 no collateral was posted (30 June 2011: NZ$110 million). In the event of a downgrade of Telecom’s credit rating to either Baa1 (Moody’s Investors Service) or BBB+ (Standard & Poor’s) US$3 million of additional collateral would be required to be posted.
on-market buybackTelecom commenced an on-market capital buyback to acquire a maximum of 200 million ordinary shares for an aggregate purchase price of not more than NZ$300 million to return surplus capital to shareholders and will result in a gearing ratio that is more consistent with Telecom’s long-term capital management policies. As at 30 June 2012 NZ$169 million of shares had been repurchased.
Dividend policyTelecom pays dividends on a semi-annual basis. Telecom will continue with its existing dividend policy to target a payout ratio of approximately 90% of adjusted net earnings, subject to there being no material adverse changes in circumstances or operating outlook.
The Dividend Reinvestment Plan has been retained. Shares issued under the Dividend Reinvestment Plan are issued at or around the prevailing market price of ordinary shares. For the FY12 interim dividend paid in April 2012 Telecom acquired an equivalent number of ordinary shares on-market in order to avoid an increase in capital arising from the plan. Telecom does not intend to acquire the equivalent number of shares for the final FY12 dividend, which will be paid in October 2012. These mechanisms will be reviewed at each dividend date.

yEAR ENDED 30 JUNE 2012 2011 2010 2012/2011 2011/2010NZ$M NZ$M NZ$M % ChANGE % ChANGE
AS AT 30 JUNE 2012 2011 2010
PAYMENTS DUE BY PERIOD
total
less tHan 1 year
1–3 years
3–5 years
aFter 5 years
CONTRACTUAL OBLIGATIONS NZ$M NZ$M NZ$M NZ$M NZ$M
Working capital and net tangible assets per shareTelecom defines its working capital as the difference between current assets and current liabilities. Telecom’s working capital position is shown in the table below. Telecom’s current liabilities exceeded current assets, however, Telecom has positive cash flows that enable working capital to be managed to meet short-term liabilities as they fall due.
Current assets 972 1,197 1,127 (18.8) 6.2
Current liabilities (1,204) (1,790) (1,411) (32.7) 26.9
(Deficit)/surplus in working capital (232) (593) (284) nM nM
net tangible assetsAs at 30 June 2012 the consolidated net tangible assets per share was NZ$0.39. Net tangible assets per share is a non-GAAP financial measure and is not prepared in accordance with NZ IFRS. It is required to be disclosed by NZX listing requirements.
The calculation of Telecom’s consolidated net tangible assets ratio and its reconciliation to the consolidated balance sheet is presented below:
Total assets (NZ$m) 3,667 6,392 6,865
Less intangible assets (NZ$m) (900) (1,094) (1,314)
Less total liabilities (NZ$m) (2,041) (4,081) (4,320)
net tangible assets (nZ$m) 726 1,217 1,231
Number of shares outstanding (in millions) 1,857 1,925 1,921
net tangible assets per share (nZ$) 0.39 0.63 0.64
Contractual obligations and commitmentsTelecom’s contractual obligations and other commercial commitments as at 30 June 2012 are set out in the table below.
Short-term debt 95 95 – – –
Long-term debt1 1,037 660 117 172 88
Derivative liabilities 44 6 4 1 33
Operating leases 646 91 161 119 275
Capital expenditure 110 110 – – –
Operating expenditure commitments2 393 238 124 31 –
total contractual cash obligations 2,325 1,200 406 323 396
1 Includes interest payments based on borrowing drawn at 30 June 2012.
2 Telecom has issued a guarantee in respect of a lease of certain telecommunications equipment totalling NZ$29 million.
Telecom Annual Report 201270 |
performance

| 71investor.telecom.co.nz
off-balance sheet arrangementsTelecom does not have any off-balance sheet arrangements, as the term is defined for the purposes of Item 5.E of the Form 20-F, that have or are reasonably likely to have a current or future effect on Telecom’s financial condition, changes in financial condition, revenues or expenses, results of operations, liquidity, capital expenditures or capital resources that are material to investors.
treasury and interest rate managementTelecom manages its treasury activities through a board-approved treasury constitution consisting of treasury governance and policy frameworks. Telecom is exposed to foreign currency fluctuations through borrowing in foreign currencies, making capital and operating expenditure purchases in foreign currencies and operating in the wholesale international telecommunications market, as well as through the impact that foreign currency fluctuations have on reported results of foreign subsidiaries.
Other than borrowings that remain in foreign currencies and are matched against foreign denominated assets, foreign currency borrowings are hedged at inception into NZ dollars using cross-currency interest rate swaps. Telecom also hedges a portion of its foreign currency purchases forecast for the next 12 months and hedges a portion of the net balance sheet position of its international operations.
The objectives of interest rate risk management are to minimise the cost of net borrowings and to minimise the impact of interest rate movements on Telecom’s interest expense and net earnings within policies approved by the Telecom board.
For further details of Telecom’s exposure to interest rate risk, foreign currency risk and its related use of derivatives see note 25 to the financial statements.
Below is certain information concerning exchange rates between NZ dollars and US dollars (expressed in US$ per NZ$1.00) based on the noon buying rate in New York City for cable transfers in NZ$ as reported by the Federal Reserve Bank of New York (Exchange Rate).
On 13 August 2012 the exchange rate was 0.8082.
The high and low exchange rates for each month during the previous six months were as follows:
MontH HIgH loW
February 2012 0.8404 0.8283
March 2012 0.8399 0.8081
April 2012 0.8270 0.8113
May 2012 0.8156 0.7470
June 2012 0.8027 0.7537
July 2012 0.8115 0.7859
The average exchange rates, determined by averaging the exchange rates on the last day of each month during the year for the financial periods specified below were as follows:
year enDeD 30 June average
FY08 0.7698
FY09 0.6039
FY10 0.7041
FY11 0.7652
FY12 0.8106
Controls and proceduresTelecom’s management, with the participation of Telecom’s chief executive officer and Telecom’s chief financial officer, evaluated the effectiveness of Telecom’s disclosure controls and procedures as of 30 June 2012. In designing and evaluating the disclosure controls and procedures, management recognised that any controls and procedures, no matter how well designed and operated, can provide only reasonable, rather than absolute, assurance of achieving the desired control objectives and management necessarily was required to apply its judgement in evaluating the cost-benefit relationship of possible controls and procedures.
Based upon that evaluation and taking into account the foregoing, Telecom’s chief executive officer and Telecom’s chief financial officer concluded that, as of 30 June 2012, Telecom’s disclosure controls and procedures are effective in providing reasonable assurance that information required to be disclosed by Telecom in the reports that it files or submits under the United States Securities Exchange Act is recorded, processed, summarised and reported on a timely basis and are effective in ensuring that information required to be disclosed by Telecom in the reports it files or submits under the United States Securities Exchange Act 1934 is accumulated and communicated to Telecom’s management, including its principal financial and executive officers, or persons performing similar functions, as appropriate, to allow timely decisions regarding required disclosure.
Management’s report on internal control over financial reportingTelecom’s management is responsible for establishing and maintaining adequate internal control over financial reporting. Telecom’s internal control over financial reporting is designed to provide reasonable assurance regarding the reliability of financial reporting and the preparation of financial statements for external purposes.
Under the supervision, and with the participation of Telecom’s chief executive officer and Telecom’s chief financial officer, Telecom’s management evaluated the effectiveness of Telecom’s internal control over financial reporting as of 30 June 2012 based upon the framework in ‘Internal Control – Integrated Framework’ issued by the Committee of Sponsoring Organisations of the Treadway Commission.
Based upon that evaluation, Telecom’s management has concluded that, as of 30 June 2012, Telecom’s internal control over financial reporting is effective.
Telecom Annual Report 201272 |
performance
KPMG, Telecom’s independent registered public accounting firm, has audited the consolidated financial statements included in this annual report and, as a part of the audit, has reported on the effectiveness of Telecom’s internal control over financial reporting.
Changes in internal control over financial reportingThere have been no changes in Telecom’s internal control over financial reporting during the year ended 30 June 2012 that have materially affected, or are reasonably likely to materially affect, Telecom’s internal control over financial reporting.
Group risk factors Competition risks impact telecom’s ability to achieve profitable revenue growthTelecom operates in markets that are characterised by high levels of competition and price pressure, including regulatory intervention, declining prices, technology substitution, market and service convergence, customer churn, declining rates of market growth and new entrants.
A significant proportion of Telecom’s revenue and profit is generated in the New Zealand telecommunications market which is experiencing limited growth in revenue terms. Revenue from Telecom’s fixed line access, calling and broadband services continues to decline. This decline is being driven by competitors’ use of Chorus’ unbundled copper local loop (UCLL) inputs, which provide Telecom’s competitors with an input cost advantage relative to the unbundled copper low frequency (UCLF) inputs, which Telecom purchases from Chorus. Telecom is restrained from consuming UCLL for three years following the Demerger.
Telecom has also experienced increased competitive intensity in the mobile market since the arrival of a third mobile operator, 2degrees, in 2009. In addition, Telecom has experienced higher levels of customer churn associated with customers transitioning off Telecom’s CDMA network prior to its closure in July 2012.
New mobile competition from non-traditional sources is causing substitution of billable customer calling and SMS to mobile applications using customers’ data caps for free voice calling and instant messaging. These may place further pressure on mobile revenues and margins.
Telecom may face additional competition from non-traditional competitors, such as entertainment or content providers, who may choose to leverage their large retail bases to offer broadband services directly to their customers.
Telecom’s enterprise customers, particularly the public sector, may continue to leverage their purchasing power to create more syndicated supplier panels that use competition between suppliers to ratchet down price, further reducing Telecom’s margins.
telecom’s ability to innovate and compete is key to achieving profitable revenue growthIn addition to the competition risks above, Telecom’s ability to deliver profitable revenue growth depends on its ability to innovate and develop the customer, product and service capabilities of a retail service provider. This will require systems flexibility to meet or beat competitor offerings, deliver value-added services and an effortless customer experience. Failure to effect this transition successfully and in a timely manner may lead to a continued decline in revenue, erosion of its competitive position, a reduction in future profitability and cash flow, and to a diminution in shareholder value.
ongoing regulatory interventions have potential to impact telecom’s profitability riskDespite the unwinding of much of the industry regulation that Telecom was subject to prior to the Demerger, regulatory uncertainty still exists and industry interventions by the Government or its regulatory agencies have the potential to materially impact Telecom’s future financial performance. The most significant areas of regulatory uncertainty for Telecom at present include outcomes from the Commerce Commission’s ongoing involvement in copper pricing (refer our Company – new Zealand regulation for more on the Commerce Commission’s proposed decoupling of UCLL and UCLF pricing) and the Government’s arrangements for allocating its 700Mhz radio spectrum for use by new mobile network technologies such as LTE.
The Government may elect to allocate spectrum unevenly between the three New Zealand mobile operators creating network performance and economic advantages for the operator acquiring the largest share of spectrum. Operators with less spectrum may need to invest further in their networks to obtain network performance to remain competitive. These investments may increase their ongoing operating costs, reduce their margins and lower their returns on mobile network invested capital.
operational risks
Failure to deliver cost base reductions could impact telecom’s profitabilityA succession of industry and regulatory changes within Telecom’s operating environment have made it harder to maintain acceptable levels of year on year earnings performance. Consequently, the reliance on cost reduction as an earnings driver remains an important focus for Telecom in the near term.
The ability of Telecom to achieve ongoing cost removal is made more challenging by the legacy of previous initiatives that have already achieved large, ‘one-off’ cost reduction opportunities. Increasingly, removing cost from Telecom’s businesses relies on the implementation of larger numbers of smaller cost reduction opportunities, increasing implementation risk and potentially making cost reduction harder to achieve.
Telecom’s ability to reduce costs in order to maintain or improve its profitability may be further impaired by a combination of factors, such as increases in costs of sales supporting revenue growth targets (particularly mobile and IT services) inability to reduce regulated prices for many of the product inputs required for its key

| 73investor.telecom.co.nz
markets, increased future operational complexity associated with consuming inputs from new local fibre companies, investing in emerging new technologies such as 4G mobile and the Government’s UFB fibre network, re-platforming itself with the infrastructure and capabilities required to operate successfully as a retail services provider and implementing the rationalisation and closure of a number of its legacy IT platforms.
Collectively, these factors may prevent Telecom from reducing its operating costs, placing pressure on its ongoing profitability.
telecom may be unable to contain its capital spending in connection with operating and growing its business Following the Demerger Telecom is required to maintain significant annual capital investment to operate and grow its businesses in areas such as:
• maintenance of its existing mobile networks and PSTN network and information systems and operations; investment in operational improvement initiatives such as operational support systems to complement new business models;
• investment to continue to support and grow broadband, mobile and ICT market share; and
• investment in assets required to meet its residual regulatory obligations.
Competitive or regulatory drivers may accelerate the need for capital expenditure in some areas. Additionally, the ability to contain capital spending is under continual pressure from the increased complexity inherent in the delivery of new and emerging technologies in response to market changes.
Accordingly, Telecom’s capital spending requirements may exceed management’s expectations, negatively impacting Telecom’s return on investment, future profitability and its ability to raise future capital funds on acceptable terms.
Failure to effectively operate Chorus sharing arrangements could affect telecom’s financial position and performance Telecom and Chorus continue to share certain assets and systems over the medium to long term post-Demerger. Telecom will be reliant on Chorus for the provision of certain services, including access and services related to its local access and backhaul networks and exchange sites, repair services in relation to Telecom’s fibre cables, access to shared information technology processes and systems owned by Chorus, agency services for the representation of some of Telecom’s wholesale products and transitional services in relation to property, building, facilities and site management. Failure to operate the sharing arrangements effectively on an ongoing basis could affect Telecom’s financial position and performance.
The Commerce Commission is responsible for monitoring the sharing arrangements in place between Telecom and Chorus. If the Commerce Commission considers that a sharing arrangement contravenes the requirements set out in the Telecommunications Amendment Act (including that sharing arrangements must be unlikely to harm competition in any telecommunications market) the Commerce Commission may give a notice of non-compliance to each party. If the non-compliance persists, the Commerce
Commission may decide on appropriate enforcement action, including requiring the parties to amend the sharing arrangement or seeking an injunction or a pecuniary penalty from the high Court.
network and system failures could damage telecom’s reputation and earningsTelecom’s network infrastructure is vulnerable to damage or interruption from a range of risks, including equipment failure, cable cuts, power failures, weather, earthquake, fire and intentional damage. A number of Telecom’s facilities, information systems and network systems are crucial to supporting its ability to provide reliable, uninterrupted customer service and a failure of any of these could have widespread effects across Telecom’s networks.
Divestment of Telecom’s former access network assets to Chorus exposes Telecom to interruptions in service continuity attributable to Chorus, which Telecom depends on to maintain and restore a number of its network services.
Continued use of legacy technologies as major components of network and IT systems, in combination with a trend towards greater concentration of infrastructure supporting new technologies, may increase potential for service disruptions or cause increased loss from service-disrupting events, resulting in customer churn or reparations. Growth in new products and service lines may also create capacity problems, particularly in mobile and data network infrastructure.
Following introduction of the Government’s UFB fibre network, Telecom may face increased operational complexity when consuming inputs from new suppliers, such as the Local Fibre Companies (LFCs). The current lack of ubiquitous technology standards and operating processes, combined with establishing new commercial and operational relationships with new suppliers, may increase the opportunity for future disruptions to service.
A serious service failure could result in lost revenue, additional capital expenditure requirements, higher operating costs, damage to Telecom’s reputation and, consequently, could adversely impact Telecom’s financial performance and company reputation and may attract additional industry regulation.
telecom’s products, services and infrastructure may be susceptible to It security breachesTelecom is dependent on the secure operation and resilience of its information systems, networks and data. The introduction of new products, services and online or automated customer self-service capabilities, in particular, exposes Telecom to IT security risks and vulnerabilities that were less applicable to its legacy IT and network systems.
Unauthorised users may exploit security vulnerabilities in Telecom’s product offerings, service platforms or enterprise information systems compromising service continuity and/or the security of customer and company information and assets. This could result in:
• service or product failures resulting in financial loss and customer churn;
• reputation damage;
• legal or regulatory breaches resulting in financial penalties or damages claims; or
• fraudulent misappropriation of funds.

Telecom Annual Report 201274 |
performance
A serious security incident or breach could adversely impact Telecom’s reputation and lead to a loss of customer confidence, termination of contracts and financial loss and may impair plans to migrate customers to online service and product models.
any failure in supplier relationships has potential to impact telecom’s customer service and earningsTelecom will continue to have a number of outsourcing and partnering relationships with external suppliers upon which it depends to operate and build its technology platforms and provide service to its customers. Failure by Telecom’s key suppliers to supply equipment, services or required deliverables within acceptable cost, time and quality parameters could affect Telecom’s financial position and performance.
other risks
Financing availability costs may increase should telecom fail to meet performance thresholdsTelecom’s credit rating following Demerger remained within the ‘A band’ and it retained a certain amount of debt on its balance sheet, such that it expects to meet its capital commitments and be supported by cash flows of Telecom’s businesses. Telecom’s ability to maintain an appropriate capital structure for its financial profile going forward, either by refinancing debt on favourable terms or by raising new debt, may be adversely affected if financial market conditions are volatile, if Telecom experiences a decline in its operating performance or if Telecom is unable to operate within the credit metric thresholds applicable to its rating.
Telecom’s key sources of liquidity in the foreseeable future are likely to be cash generated from operations and borrowings through long-term and short-term issuances in the capital markets, as well as committed bank facilities. Future issues of debt securities may not experience strong demand. Adverse changes in credit markets or Telecom’s credit ratings could increase the cost of borrowing and banks may be unwilling to renew credit facilities on existing terms. Any of these factors could have a negative impact on Telecom’s access to finance.
Changes in assumptions that support the carrying value of telecom’s goodwill may lead to future impairmentAs at 30 June 2012 Telecom had NZ$106 million of goodwill on its balance sheet. Telecom assesses the carrying value of its goodwill on a regular basis. As detailed in critical accounting policies in note 1 to the financial statements within this annual report, this assessment is based on a number of assumptions, including expected rate of growth of revenues, margins expected to be achieved, the level of future capital expenditure required to support these outcomes and the appropriate discount rate to apply when valuing future cash flows. Any future adverse impacts arising in assessing the carrying value of Telecom’s goodwill could lead to future impairment that would affect future earnings and financial position.
Dividends from southern Cross Cable can be highly variable Telecom has a 50% equity investment in Southern Cross, which owns and operates the Southern Cross trans-pacific submarine fibre cable, linking Australia, New Zealand, Fiji, hawaii and the west coast of the United States.
The long-term performance of Southern Cross is dependent on demand for international bandwidth, primarily from Australia, and to a lesser extent, New Zealand. Southern Cross sells capacity to a small number of telecommunications companies, including Telecom. As such, it has significant customer concentration risk. In addition, capacity is normally purchased by customers ahead of actual demand. There are numerous sub-sea cable operators that compete with Southern Cross and this, coupled with the finite life of the Southern Cross network, has caused year on year declines in the price of capacity. Therefore, it can be difficult to predict the level of Southern Cross sales in any particular year and as a consequence the quantum of dividends paid by Southern Cross to its shareholders can be highly variable.
Delisting of telecom’s aDss from the nyse may influence trading opportunities for its aDss and shares Telecom voluntarily delisted trading of its ADSs on the NYSE, effective 19 July 2012. Telecom remains subject to all SEC requirements, however, it intends to terminate the SEC registration of its ADSs and underlying ordinary shares if and when it meets the criteria for doing so. Following the delisting of Telecom’s ADSs from the NYSE, its ADSs have traded in the United States in the over-the-counter (OTC) market. The OTC market is a significantly more limited market than the NYSE, and, as a result, trading volume in Telecom’s ADSs may be limited and investors may not have sufficient liquidity, which may make it more difficult for holders of its ADSs to sell their securities. In addition, delisting may result in holders of Telecom’s ADSs withdrawing the ordinary shares underlying their ADSs from the program and selling them on the NZX or ASX, which could affect Telecom’s ordinary share price on those markets.

| 75investor.telecom.co.nz
Independent Auditor’s Report based on New Zealand Auditing StandardsTo the Shareholders of Telecom Corporation of New Zealand Limited
Report on the Company and Group Financial StatementsWe have audited the accompanying financial statements of Telecom Corporation of New Zealand Limited (‘’the company’’) and group, comprising the company and its subsidiaries, on pages 77 to 134. The financial statements comprise the statement of financial position of the company and group as at 30 June 2012, the income statement and statements of comprehensive income, changes in equity and cash flows of the company and group for the year then ended, and a summary of significant accounting policies and other explanatory information.
Directors’ Responsibility for the Company and Group Financial StatementsThe directors are responsible for the preparation of company and group financial statements in accordance with generally accepted accounting practice in New Zealand and International Financial Reporting Standards that give a true and fair view of the matters to which they relate, and for such internal control as the directors determine is necessary to enable the preparation of company and group financial statements that are free from material misstatement whether due to fraud or error.
Auditor’s ResponsibilityOur responsibility is to express an opinion on these company and group financial statements based on our audit. We conducted our audit in accordance with International Standards on Auditing (New Zealand) and International Standards on Auditing. Those standards require that we comply with ethical requirements and plan and perform the audit to obtain reasonable assurance about whether the company and group financial statements are free from material misstatement.
An audit involves performing procedures to obtain audit evidence about the amounts and disclosures in the company and group financial statements. The procedures selected depend on the auditor’s judgement, including the assessment of the risks of material misstatement of the financial statements, whether due to fraud or error. In making those risk assessments, the auditor considers internal control relevant to the company and group’s preparation of the financial statements that give a true and fair view of the matters to which they relate in order to design audit procedures that are appropriate in the circumstances, but not for the purpose of expressing an opinion on the effectiveness of the company and group’s internal control. An audit also includes evaluating the appropriateness of accounting policies used and the reasonableness of accounting estimates, as well as evaluating the presentation of the financial statements.
We believe that the audit evidence we have obtained is sufficient and appropriate to provide a basis for our audit opinion.
We carry out other assignments on behalf of the company and group in the areas of other audit and assurance related services and advisory services. The firm, partners and employees of our firm also deal with the company and group on normal terms within the ordinary course of trading activities of the business of the company and group. These matters have not impaired our independence as auditors of the company and group. The firm has no other relationship with, or interest in, the company and group.
OpinionIn our opinion the financial statements of the company and group on pages 77 to 134:
• comply with generally accepted accounting practice in New Zealand;
• comply with International Financial Reporting Standards; and
• give a true and fair view of the financial position of the company and group as at 30 June 2012 and of the financial performance and cash flows of the company and group for the year ended on that date.
Report on Other Legal and Regulatory RequirementsIn accordance with the requirements of sections 16(1)(d) and 16(1)(e) of the Financial Reporting Act 1993, we report that:
• we have obtained all the information and explanations that we have required; and
• in our opinion, proper accounting records have been kept as far as appears from our examination of those records.
23 August 2012
Auckland, New Zealand

performance
Telecom Annual Report 201276 |
Auditor’s Report based on PCAOB Standards – Report of Independent Registered Public Accounting FirmThe Board of Directors and Shareholders of Telecom Corporation of New Zealand LimitedWe have audited the accompanying consolidated statements of financial position of Telecom Corporation of New Zealand Limited (the “Company”) and subsidiaries as of 30 June 2012 and 2011, and the related consolidated income statements, consolidated statements of comprehensive income, consolidated statements of changes in equity, and consolidated cash flow statements for each of the years in the three year period ended 30 June 2012. We also have audited the Company’s internal control over financial reporting as of 30 June 2012, based on criteria established in Internal Control – Integrated Framework issued by the Committee of Sponsoring Organizations of the Treadway Commission. The Company’s management is responsible for these consolidated financial statements, for maintaining effective internal control over financial reporting, and for its assessment of the effectiveness of internal control over financial reporting, included in the accompanying Management’s Report on Internal Control Over Financial Reporting. Our responsibility is to express an opinion on these consolidated financial statements and an opinion on the Company’s internal control over financial reporting based on our audits.
We conducted our audits in accordance with the standards of the Public Company Accounting Oversight Board (United States). Those standards require that we plan and perform the audits to obtain reasonable assurance about whether the financial statements are free of material misstatement and whether effective internal control over financial reporting was maintained in all material respects.
Our audits of the consolidated financial statements included examining, on a test basis, evidence supporting the amounts and disclosures in the financial statements, assessing the accounting principles used and significant estimates made by management, and evaluating the overall financial statement presentation. Our audit of internal control over financial reporting included obtaining an understanding of internal control over financial reporting, assessing the risk that a material weakness exists, and testing and evaluating the design and operating effectiveness of internal control based on the assessed risk. Our audits also included performing such other procedures as we considered necessary in the circumstances. We believe that our audits provide a reasonable basis for our opinions.
A company’s internal control over financial reporting is a process designed to provide reasonable assurance regarding the reliability of financial reporting and the preparation of financial statements for external purposes in accordance with generally accepted accounting principles. A company’s internal control over financial reporting includes those policies and procedures that (1) pertain to the maintenance of records that, in reasonable detail, accurately and fairly reflect the transactions and dispositions of the assets of the company; (2) provide reasonable assurance that transactions are recorded as necessary to permit preparation of financial statements in accordance with generally accepted accounting principles, and that receipts and expenditures of the company are being made only in accordance with authorisations of management and directors of the company; and (3) provide reasonable assurance regarding prevention or timely detection of unauthorised acquisition, use, or disposition of the company’s assets that could have a material effect on the financial statements.
Because of its inherent limitations, internal control over financial reporting may not prevent or detect misstatements. Also, projections of any evaluation of effectiveness to future periods are subject to the risk that controls may become inadequate because of changes in conditions, or that the degree of compliance with the policies or procedures may deteriorate.
In our opinion, the consolidated financial statements referred to above present fairly, in all material respects, the financial position of Telecom Corporation of New Zealand Limited and subsidiaries as of 30 June 2012 and 2011, and the results of its operations and its cash flows for each of the years in the three year period ended 30 June 2012, in conformity with International Financial Reporting Standards as issued by the International Accounting Standards Board. Also in our opinion, the Company maintained, in all material respects, effective internal control over financial reporting as of 30 June 2012, based on criteria established in Internal Control – Integrated Framework issued by the Committee of Sponsoring Organizations of the Treadway Commission.
As discussed in notes 1 and 9 to the consolidated financial statements, the Company completed the demerger for Chorus Limited effective from 1 December 2011. Consequently the business and operations that formed Chorus Limited is presented as a discontinued operation in the Company’s consolidated financial statements for the five month period ended 30 November 2011. The Company’s consolidated income statements and consolidated statements of comprehensive income for the years ended 30 June 2011 and 2010 have been revised to retrospectively present Chorus Limited as a discontinued operation.
Auckland, New Zealand
23 August 2012
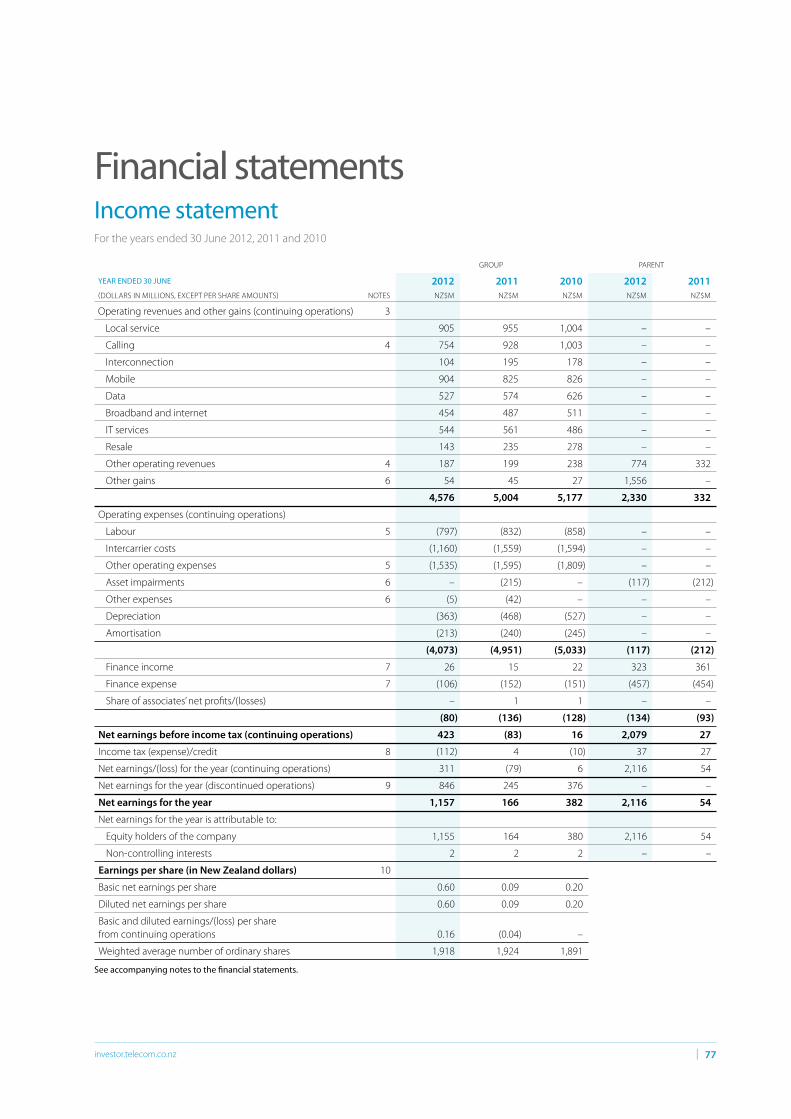
GROUP PARENT
YEAR ENDED 30 JUNE 2012 2011 2010 2012 2011(DOLLARS IN MILLIONS, EXCEPT PER SHARE AMOUNTS) NOTES NZ$M NZ$M NZ$M NZ$M NZ$M
Income statementFor the years ended 30 June 2012, 2011 and 2010
Operating revenues and other gains (continuing operations) 3
Local service 905 955 1,004 – –
Calling 4 754 928 1,003 – –
Interconnection 104 195 178 – –
Mobile 904 825 826 – –
Data 527 574 626 – –
Broadband and internet 454 487 511 – –
IT services 544 561 486 – –
Resale 143 235 278 – –
Other operating revenues 4 187 199 238 774 332
Other gains 6 54 45 27 1,556 –
4,576 5,004 5,177 2,330 332
Operating expenses (continuing operations)
Labour 5 (797) (832) (858) – –
Intercarrier costs (1,160) (1,559) (1,594) – –
Other operating expenses 5 (1,535) (1,595) (1,809) – –
Asset impairments 6 – (215) – (117) (212)
Other expenses 6 (5) (42) – – –
Depreciation (363) (468) (527) – –
Amortisation (213) (240) (245) – –
(4,073) (4,951) (5,033) (117) (212)
Finance income 7 26 15 22 323 361
Finance expense 7 (106) (152) (151) (457) (454)
Share of associates’ net profits/(losses) – 1 1 – –
(80) (136) (128) (134) (93)
Net earnings before income tax (continuing operations) 423 (83) 16 2,079 27
Income tax (expense)/credit 8 (112) 4 (10) 37 27
Net earnings/(loss) for the year (continuing operations) 311 (79) 6 2,116 54
Net earnings for the year (discontinued operations) 9 846 245 376 – –
Net earnings for the year 1,157 166 382 2,116 54
Net earnings for the year is attributable to:
Equity holders of the company 1,155 164 380 2,116 54
Non-controlling interests 2 2 2 – –
Earnings per share (in New Zealand dollars) 10
Basic net earnings per share 0.60 0.09 0.20
Diluted net earnings per share 0.60 0.09 0.20
Basic and diluted earnings/(loss) per share from continuing operations 0.16 (0.04) –
Weighted average number of ordinary shares 1,918 1,924 1,891
See accompanying notes to the financial statements.
Financial statements
| 77investor.telecom.co.nz

GROUP PARENT
YEAR ENDED 30 JUNE 2012 2011 2010 2012 2011(DOLLARS IN MILLIONS,) NOTES NZ$M NZ$M NZ$M NZ$M NZ$M
Statement of comprehensive income For the years ended 30 June 2012, 2011 and 2010
Net earnings for the year 1,157 166 382 2,116 54
Other comprehensive income/(loss)1
Translation of foreign operations (13) (8) (6) – –
Hedge of net investment 25 (3) (11) 10 – –
Reclassified to income statement on disposal of foreign operation 6 (28) – – – –
Revaluation of long-term investments 15 (68) (48) 30 – –
Cash flow hedges 25 53 (27) 9 – –
Other comprehensive income/(loss) for the year (59) (94) 43 – –
Total comprehensive income for the year 1,098 72 425 2,116 54
Total comprehensive income attributable to equity holders of the company 1,096 70 423 2,116 54
Total comprehensive income attributable to non-controlling interests 2 2 2 – –
1,098 72 425 2,116 54
See accompanying notes to the financial statements.
1 Other comprehensive income/(loss) components are shown net of tax, with the differences between gross and net detailed in note 8.
performance
Telecom Annual Report 201278 |

GROUP
YEAR ENDED 30 JUNE 2012 SHA
RE C
API
TAL
RETA
INED
EA
RNIN
GS
HED
GE
RESE
RVE
SHA
RE B
ASE
D
DEF
ERRE
D
CO
MPE
NSA
TIO
N
RESE
RVE
REVA
LUAT
ION
RE
SERV
E
FORE
IGN
C
URR
ENC
Y TR
AN
SLAT
ION
RE
SERV
E
TOTA
L EQ
UIT
Y H
OLD
ERS
OF
THE
CO
MPA
NY
NO
N-
CO
NTR
OLL
ING
IN
TERE
STS
TOTA
L EQ
UIT
Y
(DOLLARS IN MILLIONS) NZ$M NZ$M NZ$M NZ$M NZ$M NZ$M NZ$M NZ$M NZ$M
Statement of changes in equity – GroupFor the years ended 30 June 2012, 2011 and 2010
Balance at 1 July 2011 1,528 1,207 (59) 14 (345) (39) 2,306 5 2,311
Net earnings for the year – 1,155 – – – – 1,155 2 1,157
Other comprehensive income/(loss) – – 53 – (68) (44) (59) – (59)
Total comprehensive income/(loss) for the year – 1,155 53 – (68) (44) 1,096 2 1,098
Contributions by and distributions to owners:
Dividends – (355) – – – – (355) (2) (357)
Supplementary dividends – (47) – – – – (47) – (47)
Tax credit on supplementary dividends – 47 – – – – 47 – 47
Shares repurchased for dividend reinvestment plan (16) – – – – – (16) – (16)
Dividend reinvestment plan 16 – – – – – 16 – 16
Issuance of shares under share scheme 14 – – (7) – – 7 – 7
Distribution of Chorus shares to shareholders (see note 9, 23) (383) (881) – – – – (1,264) – (1,264)
Shares repurchased (169) – – – – – (169) – (169)
Total transactions with owners (538) (1,236) – (7) – – (1,781) (2) (1,783)
Balance at 30 June 2012 990 1,126 (6) 7 (413) (83) 1,621 5 1,626
See accompanying notes to the financial statements.
| 79investor.telecom.co.nz

GROUP
YEAR ENDED 30 JUNE 2011 SHA
RE C
API
TAL
RETA
INED
EA
RNIN
GS
HED
GE
RESE
RVE
SHA
RE B
ASE
D
CO
MPE
NSA
TIO
N
RESE
RVE
REVA
LUAT
ION
RE
SERV
E
FORE
IGN
C
URR
ENC
Y TR
AN
SLAT
ION
RE
SERV
E
TOTA
L EQ
UIT
Y H
OLD
ERS
OF
THE
CO
MPA
NY
NO
N-
CO
NTR
OLL
ING
IN
TERE
STS
TOTA
L EQ
UIT
Y
(DOLLARS IN MILLIONS) NZ$M NZ$M NZ$M NZ$M NZ$M NZ$M NZ$M NZ$M NZ$M
GROUP
YEAR ENDED 30 JUNE 2010 SHA
RE C
API
TAL
RETA
INED
EA
RNIN
GS
HED
GE
RESE
RVE
SHA
RE B
ASE
D
DEF
ERRE
D
CO
MPE
NSA
TIO
N
RESE
RVE
REVA
LUAT
ION
RE
SERV
E
FORE
IGN
C
URR
ENC
Y TR
AN
SLAT
ION
RE
SERV
E
TOTA
L EQ
UIT
Y H
OLD
ERS
OF
THE
CO
MPA
NY
NO
N-
CO
NTR
OLL
ING
IN
TERE
STS
TOTA
L EQ
UIT
Y(DOLLARS IN MILLIONS) NZ$M NZ$M NZ$M NZ$M NZ$M NZ$M NZ$M NZ$M NZ$M
Statement of changes in equity – GroupFor the years ended 30 June 2012, 2011 and 2010
Balance at 1 July 2010 1,515 1,296 (32) 13 (233) (20) 2,539 6 2,545
Net earnings for the year – 164 – – – – 164 2 166
Other comprehensive income – – (27) – (48) (19) (94) – (94)
Transfer to retained earnings on disposal of long-term investments – 64 – – (64) – – – –
Total comprehensive income/(loss) for the year – 228 (27) – (112) (19) 70 2 72
Contributions by and distributions to owners:
Dividends – (317) – – – – (317) (3) (320)
Supplementary dividends – (28) – – – – (28) – (28)
Tax credit on supplementary dividends – 28 – – – – 28 – 28
Dividend reinvestment plan 7 – – – – – 7 – 7
Issuance of shares under share scheme 6 – – 1 – – 7 – 7
Total transactions with owners 13 (317) – 1 – – (303) (3) (306)
Balance at 30 June 2011 1,528 1,207 (59) 14 (345) (39) 2,306 5 2,311
See accompanying notes to the financial statements.
Balance at 1 July 2009 1,384 1,369 (41) 11 (263) (24) 2,436 5 2,441
Net earnings for the year – 380 – – – – 380 2 382
Other comprehensive income – – 9 – 30 4 43 – 43
Total comprehensive income for the year – 380 9 – 30 4 423 2 425
Contributions by and distributions to owners:
Dividends – (453) – – – – (453) (1) (454)
Dividend reinvestment plan 128 – – – – – 128 – 128
Issuance of shares under share schemes 3 – – 2 – – 5 – 5
Total transactions with owners 131 (453) – 2 – – (320) (1) (321)
Balance at 30 June 2010 1,515 1,296 (32) 13 (233) (20) 2,539 6 2,545
See accompanying notes to the financial statements.
performance
Telecom Annual Report 201280 |

2012 2011
PARENT
YEAR ENDED 30 JUNESHARE
CAPITALRETAINED EARNINGS
SHARE BASED DEFERRED
COMPENSATION RESERVE
TOTAL EQUITY
SHARE CAPITAL
RETAINED EARNINGS
SHARE BASED DEFERRED
COMPENSATION RESERVE
TOTAL EQUITY
(DOLLARS IN MILLIONS) NZ$M NZ$M NZ$M NZ$M NZ$M NZ$M NZ$M NZ$M
Statement of changes in equity – ParentFor the years ended 30 June 2012 and 2011
Balance at 1 July 1,528 130 14 1,672 1,515 393 13 1,921
Net earnings for the year – 2,116 – 2,116 – 54 – 54
Total comprehensive income for the year – 2,116 – 2,116 – 54 – 54
Contributions by and distributions to owners:
Dividends – (355) – (355) – (317) – (317)
Supplementary dividends – (47) – (47) – (28) – (28)
Tax credit on supplementary dividends – 47 – 47 – 28 – 28
Dividend reinvestment plan 16 – – 16 7 – – 7
Shares repurchased for dividend reinvestment plan (16) – – (16) – – – -
Issuance of shares under share schemes 14 – (7) 7 6 – 1 7
Share buyback (169) – – (169) – – – –
Distribution of Chorus Shares (383) (881) – (1,264) – – – –
Total transactions with owners (538) (1,236) (7) (1,781) 13 (317) 1 (303)
Balance at 30 June 990 1,010 7 2,007 1,528 130 14 1,672
See accompanying notes to the financial statements.
| 81investor.telecom.co.nz

GROUP PARENT
AS AT 30 JUNE 2012 2011 2012 2011(DOLLARS IN MILLIONS) NOTES NZ$M NZ$M NZ$M NZ$M
Statement of financial positionAs at 30 June 2012 and 2011
Current assets:Cash 185 324 – –
Collateral funds 25 – 110 – –
Short-term derivative assets 12 1 2 – –
Receivables and prepayments 13 684 701 85 1,611
Taxation recoverable 53 – – –
Inventories 14 49 60 – –
Total current assets 972 1,197 85 1,611
Non-current assets:Long-term investments 15 57 125 8,129 8,756
Long-term receivables and prepayments 13 222 44 – –
Long-term derivative assets 12 1 40 – –
Intangible assets 16 900 1,094 – –
Property, plant and equipment 17 1,515 3,892 – –
Total non-current assets 2,695 5,195 8,129 8,756
Total assets 3,667 6,392 8,214 10,367
Current liabilities:Accounts payable and accruals 18 775 991 69 30
Taxation payable 6 31 – –
Short-term derivative liabilities 12 3 333 – –
Short-term provisions 19 13 38 – –
Debt due within one year 20 407 397 4,241 5,924
Total current liabilities 1,204 1,790 4,310 5,954
Non-current liabilities:Deferred tax liabilities 21 159 226 – –
Long-term derivative liabilities 12 23 330 – –
Long-term payables and accruals 18 30 – – –
Long-term provisions 19 20 35 1,897 2,741
Long-term debt 22 605 1,700 – –
Total non-current liabilities 837 2,291 1,897 2,741
Total liabilities 2,041 4,081 6,207 8,695
Equity:Share capital 23 990 1,528 990 1,528
Reserves 23 (495) (429) 7 14
Retained earnings 1,126 1,207 1,010 130
Total equity attributable to equity holders of the Company 1,621 2,306 2,007 1,672
Non-controlling interests 5 5 – –
Total equity 1,626 2,311 2,007 1,672
Total liabilities and equity 3,667 6,392 8,214 10,367
See accompanying notes to the financial statements.
On behalf of the board
Mark Verbiest, Chairman Simon Moutter, Chief Executive Officer
Authorised for issue on 23 August 2012
performance
Telecom Annual Report 201282 |

GROUP PARENT
YEAR ENDED 30 JUNE 2012 2011 2010 2012 2011(DOLLARS IN MILLIONS) NOTES NZ$M NZ$M NZ$M NZ$M NZ$M
Statement of cash flowsFor the years ended 30 June 2012, 2011 and 2010
Cash flows from operating activities
Cash was provided from/(applied to):
Cash received from customers 4,568 5,008 5,257 – –
Interest income 26 15 21 – –
Dividend income 58 71 66 – –
Dividends received from subsidiary companies – – – 774 331
Payments to suppliers and employees (3,402) (3,421) (3,389) – –
Income tax refunded/(paid) (120) (127) 1 – –
Interest expense (145) (197) (195) – –
Net cash flows from operating activities 30 985 1,349 1,761 774 331
Cash flows from investing activities
Cash was provided from/(applied to):
Sale of property, plant and equipment 2 3 3 – –
Sale of business 5 76 – – –
Sale of and proceeds from long-term investments 1 107 6 – –
Purchase of property, plant and equipment and intangibles (663) (1,005) (1,080) – –
Capitalised interest paid (8) (16) (20) – –
Net cash flows from investing activities (663) (835) (1,091) – –
Cash flows from financing activities
Cash was provided from/(applied to):
Debt restructuring costs (205) – – – –
Proceeds from long-term debt 300 – – – –
Repayment of derivatives (1,299) (13) (34) – –
Proceeds from derivatives 961 2 12 – –
Payments on finance leases (7) – – – –
Receipts on finance leases 20 – – – –
Decrease/(increase) in collateral funds 25 110 (89) (21) – –
Repayment of long-term debt (964) (21) (15) – –
Proceeds from short-term debt 2,638 663 1,079 – –
Repayment of short-term debt (1,511) (749) (1,270) (434) (21)
Dividends paid (340) (313) (327) (340) (310)
Share repurchase – buyback (149) – – – –
Share repurchase – dividend reinvestment plan (16) – – – –
Net cash flows from financing activities (462) (520) (576) (774) (331)
Net cash flow (140) (6) 94 – –
Opening cash position 324 339 261 – –
Foreign exchange movements 1 (9) (16) – –
Closing cash position 185 324 339 – –
See accompanying notes to the financial statements.
| 83investor.telecom.co.nz

Notes to the financial statements
references to ‘US$’ and ‘USD’ are to US dollars, references to ‘A$’ and ‘AUD’ are to Australian dollars, references to ‘EUR’ are to Euros, references to ‘CAD’ are to Canadian dollars, references to ‘CHF’ are to Swiss Francs and references to ‘GBP’ are to Pounds Sterling. All financial information has been rounded to the nearest million, unless otherwise stated.
Measurement basisThe measurement basis adopted in the preparation of these financial statements is historical cost, modified by the revaluation of certain investments and financial instruments as identified in the specific accounting policies below and the accompanying notes.
Specific accounting policiesAs described below, these accounting policies have been applied consistently to all periods presented in these financial statements. In addition, the comparative income statements have been re-presented to reflect Chorus as a discontinued operation.
Basis of consolidation
Subsidiaries
Subsidiaries are entities controlled directly or indirectly by the Telecom Group. All significant intercompany accounts and transactions are eliminated on consolidation. Where an entity becomes or ceases to be a subsidiary during the year, the results of that entity are included in the net earnings of the Telecom Group from the date that control or significant influence commenced or until the date that control or significant influence ceased.
Associates
Associates are entities in which the Telecom Group has significant influence, but not control, over the operating and financial policies.Associates are accounted for in the consolidated financial statements using the equity method, whereby Telecom’s share of the post-acquisition net earnings of associates is included in consolidated earnings before income tax. Where the equity accounted carrying amount of an investment in an entity falls below zero, the equity method of accounting is suspended and the investment recorded at zero, except where there is a legal or constructive obligation to fund those losses, in which case losses are recorded and a liability is recognised. If this occurs, the equity method of accounting is not resumed until such time as Telecom’s share of losses and reserves not recognised during the financial years in which the equity method was suspended, are offset by the current share of earnings and reserves.
Jointly controlled assets
When Telecom shares the control of an asset with another entity, Telecom recognises its share of assets as property, plant and equipment. In addition, the Telecom Group recognises its share of liabilities, expenses and income from the use and output of the jointly controlled asset.
Note 1 Statement of accounting policiesReporting entity and statutory baseTelecom Corporation of New Zealand Limited is a profit-oriented company registered in New Zealand under the Companies Act 1993 and is an issuer for the purposes of the Financial Reporting Act 1993.
The financial statements presented are those of Telecom Corporation of New Zealand Limited (the Company, Parent or the Parent Company) its subsidiaries and interests in associates (the Telecom Group, Group or Telecom). The Parent Company financial statements are presented alongside the consolidated financial statements in accordance with the requirements of the Financial Reporting Act 1993.
Telecom successfully demerged Chorus Limited (Chorus) effective from 1 December 2011 after 99.8% of all votes cast by the Company’s shareholders were in favour of the Demerger proposal. With effect from 1 December 2011, Chorus became a stand-alone, separately listed company taking on the cornerstone role in the Government’s ultra-fast broadband (UFB) initiative.
Consequently, Telecom has separated the Chorus pre-Demerger results and presented these results, including comparatives, as ‘discontinued operations’ in accordance with NZ IFRS 5: Non-current Assets Held for Sale and Discontinued Operations (IFRS 5) (refer to note 9). Telecom has also re-presented its comparative segment results to reflect the impact of the Demerger. There is no change to the overall Group reported prior year result. Certain other comparative information has also been reclassified to conform with the current period’s presentation.
Nature of operationsTelecom is a major supplier of telecommunications and information, communications and technology (ICT) services in New Zealand and Australia. Telecom provides a full range of telecommunications and ICT products and services, including: local, national, international and value-added telephone services; mobile services, data, broadband and internet services; IT consulting, implementation and procurement, equipment sales; and installation services.
Basis of preparationThese financial statements comply with International Financial Reporting Standards as issued by the International Accounting Standards Board. They have been prepared in accordance with the Financial Reporting Act 1993, which requires compliance with New Zealand generally accepted accounting practice. They comply with New Zealand equivalents to International Financial Reporting Standards as appropriate for profit-oriented entities.
These financial statements are expressed in New Zealand dollars, which is the Company’s functional currency. References in these financial statements to ‘$’ and ‘NZ$’ are to New Zealand dollars,
performance
Telecom Annual Report 201284 |

Foreign currency transactions
Transactions denominated in a foreign currency are converted at the functional currency exchange rate at the date of the transaction. Foreign currency receivables and payables at balance date are translated at exchange rates existing at the balance date. Exchange differences arising on the translation of monetary assets are liabilities, including foreign currency accounts payable and receivable, are recognised in the income statement. Non-monetary items that are measured in terms of historical cost in a foreign currency are translated using the exchange rate at the date of the initial transaction.
Exchange gains and losses arising on contracts entered into as qualifying hedges of highly probable forecast transactions are recognised in other comprehensive income and subsequently included in the initial measurement of the cost of the asset or liability.
Where capital project commitments are hedged against foreign currency risk, the exchange difference on the qualifying hedging transaction up to the date of purchase are initially recognised in other comprehensive income and subsequently capitalised as part of the completed asset.
Other derivative transactions that provide effective economic hedges under the risk management policies of the Group, but which do not qualify for hedge accounting, are recognised immediately in the income statement.
Translation of foreign group entities
The financial statements of each of the Telecom Group’s subsidiaries are prepared in the functional currency of that entity. Functional currency is determined for each entity based on factors such as the principal trading or financing currency. Assets and liabilities of these entities are translated at exchange rates existing at balance date. Revenue and expenses are translated at rates approximating the exchange rates ruling at the dates of the transactions. The exchange gain or loss arising on translation is recorded in the foreign currency translation reserve in equity.
Revenue recognition
Telecom recognises revenues as it provides services or delivers products to customers. Billings for telecommunications services (including fixed line, mobile, broadband and internet access billings) are made on a monthly basis. Unbilled revenues from the billing cycle date to the end of each month are recognised as revenue during the month the service is provided. Revenue is deferred in respect of the portion of fixed monthly charges that have been billed in advance. Revenue from the sale of prepaid mobile credit is initially deferred, with recognition occurring when the prepaid credit is used by the customer. Revenue from installations and connections is recognised upon completion of the installation or connection. Revenue from equipment sales is recognised upon delivery of equipment to the customer.
Where multiple products or services are bundled together on sale, revenue is allocated to each element in proportion to its fair value and recognised as appropriate for that element. Revenue is recognised to the extent that it is not contingent on the provision or delivery of a future service.
Revenue from contractual arrangements, including contracts to design and build ICT solutions, is recognised by reference to the
stage of completion method, when the outcome of the arrangement can be estimated reliably. Telecom uses appropriate measures of the stage of completion, such as services performed to date as a percentage of total services to be performed or the proportion that costs incurred to date bear to the estimated total costs of the transaction. When the outcome of a transaction, or achievement of milestones, cannot be estimated reliably and it is not probable that the costs incurred will be recovered, revenue is not recognised and the costs incurred are recognised as an expense.
For long-term IT services contracts that equate to the provision of an indeterminate number of acts over a specified period of time for an agreed price, revenue is recognised on a straight-line basis over the term of the arrangement. Where the contract allows for billing as services are delivered then revenue is recognised as those services or materials are delivered.
Revenue from interconnect fees is recognised at the time the services are performed. In the course of its normal business operations, Telecom interconnects its networks with other telecommunications operators. In some instances management may be required to estimate levels of traffic flows between networks in order to determine amounts receivable or payable for interconnection. The terms of interconnection, including pricing, are subject to regulation in some instances. Pricing may be subject to retrospective adjustment, in which case estimates of the likely effect of these adjustments are required in order to determine revenues and expenses. Likewise, where interconnection rates are in dispute with another carrier, estimates of the likely outcome of disputes are required to determine financial results. Telecom bases these estimates on management’s interpretation of material facts, as well as independent advice.
Provision for doubtful debts
Telecom maintains a provision for doubtful debts when there is objective evidence that the customer will not make required payments. This provision takes into account known commercial factors impacting specific customer accounts, as well as the overall profile of Telecom’s debtor portfolio. In assessing the provision factors such as past collection history, the age of receivable balances, the level of activity in customer accounts and general macro-economic trends are taken into account. Bad debts are written off against the provision for doubtful debts in the period in which it is determined that the debts are uncollectible. If those debts are subsequently collected then a gain is recognised in the income statement.
Share-based compensation
Telecom operates a number of share-based compensation plans that are equity settled (see note 24 for details). The fair value of the employee services received in exchange for the grant of equity instruments is recognised as an expense with a corresponding entry in equity. The total amount to be expensed over the vesting period is determined by reference to the fair value of the equity instruments on grant date, excluding the impact of any non-market vesting conditions. Non-market vesting conditions are included in assumptions about the number of equity instruments that are expected to become exercisable. At each balance sheet date
| 85investor.telecom.co.nz

Telecom revises its estimates of the number of equity instruments that are expected to vest. Telecom recognises the impact of the revision of original estimates, if any, in the income statement.
The proceeds received, net of any directly attributable transaction costs, are credited to contributed capital when equity instruments are exercised.
Research costs
Research costs are expensed as incurred.
Advertising costs
Advertising costs are expensed as incurred.
Government grants
Government grants are recognised in earnings on a systematic basis that matches them with the related costs that they are intended to compensate. To achieve this, grants that were made for Telecom to acquire assets are netted off against the cost of that asset.
Taxation
The taxation expense charged to earnings includes both current and deferred tax and is calculated after allowing for non-temporary differences. Current tax is calculated on the basis of the tax laws enacted or substantively enacted at the balance sheet date.
Deferred taxation is recognised using the liability method on temporary differences between the tax bases of assets and liabilities and their carrying amounts in the financial statements except for temporary differences arising on initial recognition of an asset or liability (unless arising in a business combination or impacting profit or loss). Future tax benefits are recognised where realisation of the asset is probable. Deferred tax is determined based on tax rates and laws that have been enacted or substantively enacted at the balance sheet date.
Current and deferred tax is recognised in the income statement, except when the tax relates to items charged or credited directly in equity or other comprehensive income, in which case the tax is also recognised in equity and other comprehensive income.
Earnings per share
The Group presents basic and diluted earnings per share for its ordinary shares. Basic earnings per share is calculated by dividing the profit or loss attributable to ordinary shareholders of the Company by the weighted average number of ordinary shares outstanding during the period. Diluted earnings per share is determined by adjusting the profit or loss attributable to ordinary shareholders of the Company and the weighted average number of ordinary shares outstanding for the effects of all dilutive potential ordinary shares, which comprise share options and restricted shares granted to employees. Separate earnings per share for discontinued operations are presented in note 9.
Inventories
Inventories are stated at the lower of cost and net realisable value after consideration for excess and obsolete items. The cost is determined on a weighted average cost basis and amounts are removed from inventory on this basis. The cost of inventories
includes the transfer from equity of any foreign exchange gains or losses on qualifying cash flow hedges related to inventories. Cash flows from the sale of inventories are included in amounts received from customers in the cash flow statement.
Property, plant and equipment
The value of property, plant and equipment purchased from the Government was determined using deemed cost as at 1 April 1987.
Subsequent additions are recognised at cost. The cost of additions to plant and equipment and other assets constructed by Telecom consists of all appropriate costs of development, construction and installation, comprising material, labour, direct overhead and transport costs.
For each qualifying asset project directly attributable interest costs incurred during the period required to complete and prepare the property, plant or equipment for its intended use are capitalised as part of the total cost.
On the statement of financial position, property, plant and equipment is stated at cost less accumulated depreciation and impairments.
Depreciation is charged on a straight-line basis to write down the cost of property, plant and equipment to its estimated residual value over its estimated useful life. Estimated useful lives are as follows:
Junctions and trunk transmission systems 10 – 50 years
Switching equipment 5 – 12 years
Customer premises equipment 3 – 5 years
Other network equipment 2 – 25 years
Buildings 9 – 50 years
Motor vehicles 6 years
Furniture and fittings 2–25 years
Computer equipment 3 – 5 years
Where the remaining useful lives or recoverable values have diminished due to technological, regulatory or market condition changes, depreciation is accelerated.
Land and capital work in progress are not depreciated. Where property, plant or equipment is disposed of the profit or loss recognised in the income statement is calculated as the difference between the sale price and the carrying value of the asset.
Leased assets
Telecom is a lessor of assets and such leases are considered operating leases where substantially all the risks and rewards incidental to ownership remain with the owner. Rental income is taken to the income statement on a straight-line basis over the lease term. Leases are classified as finance leases where substantially all the risks and rewards of ownership transfer to the lessee. Amounts due from lessees under finance leases are recorded as receivables at Telecom’s net investment in the leases. Finance lease income is allocated to accounting periods so as to reflect a constant periodic rate of return on the net investment outstanding in respect of the leases.
performance
Telecom Annual Report 201286 |

Telecom is a lessee of certain plant, equipment, land and buildings under both operating and finance leases. Lease costs relating to operating leases are recognised on a straight-line basis over the life of the lease. Finance leases, which effectively transfer to Telecom substantially all the risks and benefits of ownership of the leased assets, are capitalised at the lower of the leased asset’s fair value or the present value of the minimum lease payments at inception of the lease. The leased assets and corresponding liabilities are recognised and the leased assets are depreciated over their estimated useful lives.
Intangible assets
The cost of acquiring an intangible asset with a finite life is amortised from the date the underlying asset is held ready for use on a straight-line basis over its estimated useful life, which is as follows:
Software 2 – 8 years
Capacity purchases 15 – 25 years
Spectrum licences 20 years
Other intangibles 5 – 80 years
Where estimated useful lives or recoverable values have diminished due to technological change or market conditions, amortisation is accelerated.
Telecom capitalises the direct costs associated with the development of network and business software for internal use where project success is regarded as probable. Capitalised costs include external direct costs of materials and services consumed, payroll and direct payroll-related costs for employees (including contractors) directly associated with the project and interest costs incurred while developing the software. Software developed for internal use is amortised over its estimated useful life.
Goodwill represents the excess of purchase consideration over the fair value of net assets acquired at the time of acquisition of a business or shares in a subsidiary. Goodwill is allocated to cash-generating units and assessed annually for impairment. An impairment is recognised if it is no longer probable that the value will be recovered from future economic benefits of the related cash-generating unit.
Impairment of assets
Goodwill
Goodwill is not subject to amortisation but is tested for impairment annually or whenever there is an indication that the asset may be impaired. For the purpose of impairment testing, assets are grouped at the lowest levels for which there are separately identifiable cash flows, known as cash-generating units. If the recoverable amount of the cash-generating unit is less than the carrying amount of the unit, the impairment loss is allocated first to reduce the carrying amount of any goodwill allocated to the unit and then to the other assets. Impairment losses recognised for goodwill are not reversed in a subsequent period. The recoverable amount is the higher of fair value less costs to sell and value in use. In assessing value in use, the estimated future cash flows are discounted to their present value using a pre-tax discount rate.
Property, plant and equipment and finite-life intangible assets
At each reporting period date, Telecom reviews the carrying amounts of its property, plant and equipment and finite-life intangible assets to determine whether there is any indication that those assets have suffered an impairment loss. If any such indication exists, the recoverable amount of the asset is estimated in order to determine the extent, if any, of the impairment loss. Where it is not possible to estimate the recoverable amount of an individual asset, Telecom estimates the recoverable amount of the cash-generating unit to which the asset belongs. If the recoverable amount of an asset or cash-generating unit is estimated to be less than its carrying amount, the carrying amount of the asset or cash-generating unit is reduced to its recoverable amount. An impairment loss is recognised immediately in the income statement. Where an impairment loss subsequently reverses, the carrying amount of the asset or cash- generating unit is increased to the revised estimate of its recoverable amount, a level that will not exceed the carrying amount that would have been determined had no impairment loss been recognised. A reversal of an impairment loss is then recognised immediately in the income statement.
Financial instruments
Telecom has derivative and non-derivative financial instruments. Telecom’s non-derivative financial instruments comprise investments in equity and debt securities, trade receivables and payables, other receivables and payables, cash, loans and borrowings and finance lease receivables and payables.
Non-derivative financial instruments are recognised initially at fair value plus, for instruments not at fair value through profit and loss, any directly attributable transaction costs. Subsequent to initial recognition, non-derivative financial instruments are measured as described below.
A financial instrument is recognised if Telecom becomes a party to the contractual provisions of the instrument. Financial assets are de-recognised if Telecom’s contractual rights to the cash flows from the financial assets expire or if Telecom transfers the financial asset to another party without retaining control or substantially all of the risks and rewards of the asset. Purchases and sales of financial assets are accounted for at trade date (ie, the date Telecom commits itself to purchase or sell the asset). Financial liabilities are de-recognised if Telecom’s obligations specified in the contract expire or are discharged or cancelled.
Cash comprises cash balances and highly liquid call deposits. Cash excludes collateral pledged, discussed in note 25, which is separately disclosed as collateral funds. Bank overdrafts that are repayable on demand and form an integral part of Telecom’s cash management are included as a component of cash for the purpose of the statement of cash flows.
Financial assets at amortised cost
Non-derivative financial assets are classified and measured at amortised cost when the asset is held within a business model whose objective is to collect the contractual cash flows and those contractual cash flows consist solely of payments of principal and interest on specified dates. Assets measured at amortised cost are initially measured at fair value and subsequently measured at
| 87investor.telecom.co.nz

amortised cost using the effective interest method less any impairment losses. Trade accounts receivable are recorded initially at fair value and subsequently measured at amortised cost using the effective interest method, less any provision for impairment loss due to doubtful accounts. The amount of the provision is the difference between the asset’s unamortised cost and the present value of estimated future cash flows, discounted at an effective interest rate.
Financial assets at fair value through other comprehensive income
Investments in equity instruments that are not held for trading can be held at fair value through other comprehensive income when an irrevocable election to do so is made at initial recognition. Such assets are measured upon initial recognition at fair value. Subsequent fair value movements are presented in other comprehensive income and accumulated in the revaluation reserve. Dividends on investments held at fair value through other comprehensive income are recognised in the income statement when the right to receive payment is established, unless the dividend represents a return of capital. If the investment is de-recognised the cumulative gain or loss may be transferred within equity reserves.
Financial assets at fair value through profit and loss
Financial assets that are not classified and measured at amortised cost, or fair value through other comprehensive income, are classified at fair value through profit and loss.
Financial liabilities at fair value through profit or loss
A financial liability is classified at fair value through profit or loss if it is held for trading or is designated as such upon initial recognition. Telecom’s financial liabilities measured at fair value through profit and loss are mandatorily measured as such. Derivatives are also categorised as held for trading unless they are designated as hedges. Upon initial recognition, attributable transaction costs are recognised in profit or loss when incurred. Subsequent to initial recognition, financial liabilities are measured at fair value through profit or loss, with subsequent changes recognised in the income statement.
Financial liabilities measured at amortised cost
Financial liabilities not classified and measured at fair value through profit or loss are classified and measured at amortised cost. Financial liabilities classified and measured at amortised cost are initially measured at fair value plus directly attributable transaction costs and subsequently measured at amortised cost using the effective interest method.
Debt
Debt is classified and measured at amortised cost and is recognised initially at fair value less attributable transaction costs. Subsequent to initial recognition, debt is stated at amortised cost with any difference between cost and redemption value being recognised in the income statement over the period of the borrowings using the effective interest rate method.
Derivative financial instruments
Telecom uses derivative financial instruments to reduce its exposure to fluctuations in foreign currency exchange rates and interest rates.
Each derivative that is designated as a hedge is classified as either:
• a hedge of the fair value of recognised assets or liabilities (a fair value hedge); or
• a hedge of the variability in cash flow of a recognised liability (a cash flow hedge); or
• a hedge of a highly probable forecast transaction (a cash flow hedge); or
• a hedge of a net investment in a foreign operation.
Gains and losses on fair value hedges are included in the income statement, together with any changes in the fair value of the hedged asset or liability.
The effective portion of changes in the fair value of derivatives that are designated and qualify as cash flow hedges are initially recognised in other comprehensive income and accumulated in the hedge reserve in equity. The gain or loss relating to the ineffective portion is recognised immediately in the income statement. Amounts accumulated in equity are recycled in the income statement in the periods when the hedged item will affect profit or loss. Alternatively, when the forecast transaction that is hedged results in a non-financial asset or liability, the gains and losses previously accumulated in equity are transferred from equity and included in the initial measurement of the cost of the asset or liability. When a hedging instrument expires or is sold, or a hedge no longer meets the criteria for hedge accounting, any cumulative gain or loss existing in equity at that time remains in equity until the underlying physical exposure occurs. When a forecast transaction is no longer expected to occur, the cumulative gain or loss that was reported in equity is immediately transferred to the income statement.
The effective portion of any gain or loss on hedges of net investments in foreign operations is recognised in other comprehensive income and accumulated in equity. The gain or loss relating to any ineffective portion is recognised immediately in the income statement. Gains and losses included in equity are included in the income statement when the foreign operation is disposed of or wound up.
For an instrument to qualify as a hedge, the relationship between hedging instruments and hedged items is documented, as well as Telecom’s risk management objective and strategy for undertaking various hedge transactions. On an ongoing basis, Telecom documents if the hedges are highly effective in offsetting changes in fair values or cash flows of hedged items.
Derivative financial instruments that do not qualify or no longer qualify as hedges are stated at fair values and any resultant gain or loss is recognised in the income statement.
The foreign exchange gains and losses on the principal value of cross-currency interest rate swaps are reflected in the income statement using the spot rate, which offsets the foreign exchange gains and losses recorded on the underlying debt.
Cash flows from derivatives in cash flow and fair value hedge relationships are recognised in the cash flow statement in the same category as that of the hedged item.
performance
Telecom Annual Report 201288 |

Investment in subsidiaries
The Parent Company holds its investments in subsidiaries at cost, less any impairment.
Discontinued operations
A discontinued operation (or assets held for distribution) is a component of the Group’s business that represents a separate major line of business or geographical area of operations that has been disposed of or is held for sale or is a subsidiary acquired exclusively with a view to resale. Classification as a discontinued operation occurs upon disposal or when the operation meets the criteria to be classified as held for sale, if earlier. For an operation to be held for sale it must be available for sale in its current condition and its sale must be highly probable. When an operation is classified as a discontinued operation, the comparative income statement is re-presented as if the operation had been discontinued from the start of the comparative period.
Statement of cash flows
For the purposes of the statement of cash flows, cash is considered to be cash on hand, in banks and cash equivalents, net of bank overdrafts and highly liquid investments that are readily convertible to known amounts of cash that are subject to an insignificant risk of changes in values.
Cash flows from certain items are disclosed net due to the short-term maturities and volume of transactions involved.
Collateral funds represent funds deposited by Telecom with derivative counterparties in accordance with the terms of certain bilateral credit support agreements. These funds are held in accounts to which access is restricted and are shown separately from cash. The net external cash flows attributable to discontinued operations are presented in note 9.
Segment reporting
The determination of Telecom’s operating segments and the information reported for the operating segments is based on the management approach as set out in NZ IFRS 8, ‘Operating Segments’ (IFRS 8) (as revised). Telecom’s CEO has been identified as Telecom’s chief operating decision-maker for the purpose of applying IFRS 8.
Changes in accounting policies
Telecom has adopted the amendment to NZ IFRS 7 ‘Amendments to financial instruments: disclosures’ with effect from 1 July 2011, but it has had no impact on the financial statements.
Telecom has adopted the revised standard NZ IAS 24 ‘Related party disclosures’ ‘IAS 24’ with effect from 1 July 2011. The revised standard adds disclosure requirements for commitments (including executory contracts) with related parties.
Telecom has adopted FRS 44 ‘New Zealand additional disclosures’ with effect from 1 July 2011. The standard relocates the New Zealand-specific disclosures from the topic-based standards into a separate disclosure standard and revised certain disclosures.
Critical accounting policiesThe preparation of these financial statements in conformity with IFRS requires management to make estimates and assumptions that affect the reported amounts of assets and liabilities at the date of the financial statements and the reported amounts of revenues and expenses during the period. Actual results could differ from those estimates. The principal areas of judgement in preparing these financial statements are set out below.
Valuation of goodwillThe recoverability of the carrying value of goodwill is assessed at least annually to ensure that it is not impaired. Performing this assessment generally requires management to estimate future cash flows to be generated by the related investment or cash-generating unit, which entails making judgements, including the expected rate of growth of revenues, margins expected to be achieved, the level of future capital expenditure required to support these outcomes and the appropriate discount rate to apply when valuing future cash flows.
At 30 June 2012 Telecom had NZ$106 million of goodwill on its balance sheet (30 June 2011: NZ$106 million). The composition of this balance, by cash-generating unit, is set out in note 16 of these financial statements. No goodwill impairment arose as a result of the impairment review for the years ended 30 June 2012, 30 June 2011 and 30 June 2010.
Any future adverse impacts arising in assessing the carrying value of Telecom’s goodwill could lead to future goodwill impairment that could affect future earnings.
Revenue recognition All areas of revenue recognition referred to in note 1 are assessed as critical accounting policies by management, as estimates and assumptions made can materially affect the financial statements. Examples of the key revenue lines subject to management’s judgement include:
• Mobile (including subsidy recognition), local service, calling and broadband revenues – in revenue arrangements, including multiple deliverables, the deliverables are assigned to separate units of accounting and the consideration is allocated based on its relative fair value. Determining these fair values can be complex and is subject to judgement
• IT services and certain data revenues – the revenue recognition on contracts that span more than one accounting period may be impacted by estimates of the total costs, ultimate profitability or other appropriate inputs. Assessing contracts on a percentage of completion basis requires judgement to be exercised over future costs, profitability or other milestones. These revenues are also subject to ongoing profitability reviews of underlying contracts in order to determine whether the latest estimates applied remain appropriate.
Accounting for property, plant and equipment and finite-life intangible assetsIn accounting for items of property, plant and equipment and finite-life intangible assets, judgements must be made about whether costs incurred relate to bringing an asset to working condition for its intended use and therefore are appropriate for
| 89investor.telecom.co.nz

capitalisation as part of the cost of the asset or whether they should be expensed as incurred. In capitalising costs for internally constructed assets, judgements must be made about the likelihood of project success. Such judgements can be difficult where the project involves the application of unproven technology.
The determination of the appropriate useful life for a particular asset requires management to make judgements about, among other factors, the expected period of service potential of the asset, the likelihood of the asset becoming obsolete as a result of technological advances, the likelihood of Telecom ceasing to use the asset in its business operations and the effect of government regulation.
The determination of any impairment of assets is based on a large number of factors, such as those referred to above, as well as changes in current competitive conditions, expectations of growth in the telecommunications industry, discontinuance of services and other changes in circumstances that indicate an impairment exists.
Assessing whether an asset is impaired may involve estimating the future cash flows that the asset is expected to generate. The key judgements include rates of expected revenue growth or decline, expected future margins and the selection of an appropriate discount rate for valuing future cash flows. Further, judgements have to be made regarding the expected utilisation period, which is closely linked to the regulatory environment.
At 30 June 2012 Telecom’s balance sheet had a carrying value of NZ$2,309 million in relation to property, plant and equipment and finite-life intangible assets (30 June 2011: NZ$4,880 million). No impairment arose as a result of the review of the carrying value of Telecom’s assets for the years ended 30 June 2012 and 30 June 2010. During the year ended 30 June 2011 Telecom recognised an impairment charge totalling NZ$257 million (NZ$42 million of which related to discontinued operations) due to the combined effect of the move to a fibre-oriented world and regulatory developments. Any future adverse impacts arising in assessing the carrying value or lives of Telecom’s property, plant and equipment and finite-life intangible assets could lead to future impairments or increases in depreciation and amortisation charges that could affect future earnings.
Any future adverse impacts arising in assessing the carrying value or lives of Telecom’s property, plant and equipment and finite-life intangible assets could lead to future impairments or increases in depreciation and amortisation charges that could affect future earnings.
Accounting for income taxesPreparation of financial statements requires management to make estimates as to the amount of tax that will ultimately be payable, the availability of losses to be carried forward and the amount of foreign tax credits that Telecom will receive. Actual results may differ from these estimates as a result of reassessment by management or taxation authorities.
At 30 June 2012 Telecom had taxation recoverable of NZ$55 million and tax payable of NZ$6 million (30 June 2011: payable NZ$31 million). At 30 June 2012 Telecom had no recognised deferred tax assets in relation to tax loss carry forwards (30 June 2011: nil). At
30 June 2012 Telecom had NZ$375 million of unrestricted tax losses and other temporary differences not currently recognised (30 June 2011: NZ$435 million). An increase in Telecom’s expected future taxable profits in certain jurisdictions or a change in tax law relating to these unrecognised losses could result in additional deferred tax assets being recognised.
Changes in tax laws may have a profound impact on Telecom’s taxation charges, assets, liabilities and cash flows.
Provisions and contingent liabilities Management consults with legal counsel on matters related to litigation, as well as other experts both within and outside the Group with respect to matters in the ordinary course of business. In respect of all claims, litigation and regulatory risks, Telecom provides for anticipated costs where an outflow of resources is considered probable and a reasonable estimate can be made of the likely outcome. The ultimate liability due may vary from the amounts provided and will be dependent upon the eventual outcome of any settlement. As at 30 June 2012 Telecom was involved in various litigation matters, investigations and inquiries as disclosed in note 27.
Note 2 Segmental reportingTelecom’s operating segments currently consist of the following:
• Telecom Retail – provider of fixed line, mobile and internet services to consumers and the small/medium business market;
• Wholesale & International – provider of voice, mobile, interconnect, managed data and international products and services to telecommunications service providers;
• Gen-i – integrates IT and telecommunications services to provide converged ICT solutions for clients across New Zealand and Australia;
• AAPT – provider of telecommunications services to business and wholesale customers in Australia; and
• Technology & Shared Services (T&SS) – maintains and develops Telecom’s New Zealand shared IT and network operations and other shared services.
Chorus, certain parts of Wholesale & International and T&SS comprise discontinued operations and have been removed from all segmental information presented below, with comparative segment results re-presented accordingly.
Telecom’s segments offer different products and services to different customers. In addition to Telecom’s operating segments, Telecom has a corporate centre that contains income and costs not associated with the operating segments, such as dividends from investments and costs of providing corporate services such as communications, legal, finance and human resources. These costs are allocated to each segment for reporting purposes. Telecom also has a central product group, although for reporting purposes its results are included in the reporting segments set out above and are not separately reported to Telecom’s CEO.
Telecom operates Full Cost Apportionment (FCA) which aims to match costs with revenues and has resulted in a portion of internal trades that allocate substantially all the costs from T&SS and certain
performance
Telecom Annual Report 201290 |

YEAR ENDED 30 JUNE 2012WHOLESALE &
INTERNATIONALTELECOM
RETAIL GEN-1 T&SS AAPT
TOTAL OPERATING SEGMENTS
(DOLLARS IN MILLIONS) NZ$M NZ$M NZ$M NZ$M NZ$M NZ$M
YEAR ENDED 30 JUNE 2011WHOLESALE &
INTERNATIONALTELECOM
RETAIL GEN-1 T&SS AAPT
TOTAL OPERATING SEGMENTS
(DOLLARS IN MILLIONS) NZ$M NZ$M NZ$M NZ$M NZ$M NZ$M
corporate costs to customer-facing business units, as well as a number of external interconnection revenues and costs currently recognised in Wholesale & International being allocated to other business units. All internal transactions are eliminated on consolidation.
The segment results disclosed are based on those reported to Telecom’s CEO and are how Telecom analyses its business results. Segment results are measured based on net earnings before depreciation, amortisation, impairment, finance income and costs, associates’ profits/losses and taxation expense. None of these items are assessed on a segment basis by Telecom’s CEO. Furthermore, segment assets, liabilities and additions to non current assets, are not reported to Telecom’s CEO.
The financial information of each segment is set out below:
Operating revenue: From external customers:
Local service 236 581 88 – – 905
Calling 194 260 133 – 167 754
Interconnection 68 – – – 36 104
Mobile 4 672 218 – 10 904
Data 98 18 274 – 137 527
Broadband and internet 1 315 17 – 121 454
IT services – 9 535 – – 544
Resale – – 2 – 141 143
Other operating revenues 19 25 10 38 6 98
From external customers 620 1,880 1,277 38 618 4,433
From internal customers 119 45 79 417 46 706
Other gains 6 3 4 5 – 18
Total operating revenue and other gains 745 1,928 1,360 460 664 5,157
Segment result 154 506 263 – 88 1,011
Operating revenue: From external customers:
Local service 218 625 98 – 14 955
Calling 262 302 150 – 214 928
Interconnection 158 – – – 37 195
Mobile 6 609 192 – 18 825
Data 91 19 315 – 149 574
Broadband and internet 1 300 19 – 167 487
IT services – 11 550 – – 561
Resale – – 4 – 231 235
Other operating revenues 24 27 14 9 4 78
From external customers 760 1,893 1,342 9 834 4,838
From internal customers 268 122 80 558 66 1,094
Other gains – – – 22 – 22
Total operating revenue and other gains 1,028 2,015 1,422 589 900 5,954
Segment result 145 493 237 4 90 969
| 91investor.telecom.co.nz

YEAR ENDED 30 JUNE 2010WHOLESALE &
INTERNATIONALTELECOM
RETAIL GEN-1 T&SS AAPT
TOTAL OPERATING SEGMENTS
(DOLLARS IN MILLIONS) NZ$M NZ$M NZ$M NZ$M NZ$M NZ$M
YEAR ENDED 30 JUNE 2012 2011 2010(DOLLARS IN MILLIONS) NZ$M NZ$M NZ$M
YEAR ENDED 30 JUNE 2012 2011 2010(DOLLARS IN MILLIONS) NZ$M NZ$M NZ$M
Operating revenue: From external customers:
Local service 192 678 107 – 27 1,004
Calling 240 328 164 – 271 1,003
Interconnection 139 – – – 39 178
Mobile 10 594 192 – 30 826
Data 85 22 374 – 145 626
Broadband and internet 2 289 23 – 197 511
IT services – 14 472 – – 486
Resale – – 6 – 272 278
Other operating revenues 25 22 26 8 30 111
From external customers 693 1,947 1,364 8 1,011 5,023
From internal customers 271 116 81 585 98 1,151
Other gains – 13 4 10 – 27
Total operating revenue and other gains 964 2,076 1,449 603 1,109 6,201
Segment result 164 406 223 (2) 136 927
Reconciliation from segment operating revenue to consolidated operating revenues and other gains
Segment operating revenue and other gains 5,157 5,954 6,201
Less operating revenue from internal customers (706) (1,094) (1,151)
Other gains not allocated for segmental reporting (note 6) 36 23 –
Dividends (note 3) 58 71 66
Other revenue not allocated for segmental reporting 31 50 61
Operating revenues and other gains 4,576 5,004 5,177
Reconciliation from segment result to consolidated net earnings before income tax
Segment result 1,011 969 927
Net result of corporate revenue and expenses 37 26 (11 )
Other gains not allocated for segmental reporting (note 6) 36 23 –
Asset impairments not allocated for segmental reporting (note 6) – (215) –
Other expenses not allocated for segmental reporting (note 6) (5) (42) –
Finance income (note 7) 26 15 22
Finance expense (note 7) (106) (152) (151)
Depreciation (363) (468) (527)
Amortisation (213) (240) (245)
Share of associates’ net profit/(losses) – 1 1
Net earnings/(loss) before income tax – continuing operations 423 (83) 16
performance
Telecom Annual Report 201292 |

AS AT AND FOR THE YEAR ENDED 30 JUNE 2012 NEW ZEALAND AUSTRALIA OTHER TOTAL
(DOLLARS IN MILLIONS) NZ$M NZ$M NZ$M NZ$M
AS AT AND FOR THE YEAR ENDED 30 JUNE 2011 NEW ZEALAND AUSTRALIA OTHER TOTAL
(DOLLARS IN MILLIONS) NZ$M NZ$M NZ$M NZ$M
AS AT AND FOR THE YEAR ENDED 30 JUNE 2010 NEW ZEALAND AUSTRALIA OTHER TOTAL
(DOLLARS IN MILLIONS) NZ$M NZ$M NZ$M NZ$M
GROUP PARENT
YEAR ENDED 30 JUNE 2012 2011 2010 2012 2011(DOLLARS IN MILLIONS) NZ$M NZ$M NZ$M NZ$M NZ$M
Geographic informationTelecom’s principal geographical regions are New Zealand and Australia. The operating revenue by region is based on where services are provided.
Operating revenue from external customers1 3,594 694 213 4,501
Property, plant and equipment 1,189 323 3 1,515
Intangible assets 853 22 25 900
1 Operating revenue from external customers excludes revenues from discontinued operations of NZ$21 million.
Operating revenue from external customers1 3,654 968 286 4,908
Property, plant and equipment 3,494 373 25 3,892
Intangible assets 1,058 29 7 1,094
1 Operating revenue from external customers excludes revenues from discontinued operations of NZ$51 million.
Operating revenue from external customers1 3,651 1,189 264 5,104
1 Operating revenue from external customers excludes revenues from discontinued operations of NZ$46 million.
Note 3 Operating revenues and other gainsThis note should be read in conjunction with note 9, discontinued operations. The numbers below include operating revenue and other gains from continuing operations excluding the revenues and other gain of Chorus for the current and comparative periods.
Sale of goods 190 124 134 – –
IT procurement revenues 216 222 196 – –
Rendering of services1 4,058 4,542 4,754 – 1
Dividends 58 71 66 774 331
Other gains (note 6) 54 45 27 1,556 –
Total operating revenues and other gains 4,576 5,004 5,177 2,330 332
1 Included in rendering of services are revenues that continuing operations received from discontinued operations of NZ$21 million (2011: NZ$51 million; 2010: NZ$46 million).
| 93investor.telecom.co.nz

GROUP PARENT
YEAR ENDED 30 JUNE 2012 2011 2010 2012 2011(DOLLARS IN MILLIONS) NZ$M NZ$M NZ$M NZ$M NZ$M
GROUP
YEAR ENDED 30 JUNE 2012 2011 2010(DOLLARS IN MILLIONS) NZ$M NZ$M NZ$M
Note 4 Calling and other operating revenuesThis note should be read in conjunction with note 9, discontinued operations. The numbers below include calling and other operating revenue and other gains from continuing operations excluding the calling revenues of Chorus for the current and comparative periods.
Calling revenues
National 463 544 623 – –
International 259 345 335 – –
Other 32 39 45 – –
754 928 1,003 – –
Other operating revenues
Sale of equipment 10 18 36 – –
Miscellaneous other1 119 110 136 – 1
Dividend income 58 71 66 774 331
187 199 238 774 332
1 Included in Miscellaneous other are revenues that continuing operations received from discontinued operations of NZ$21 million (30 June 2011: NZ$51 million; 30 June 2010: NZ$46 million).
Note 5 Operating expensesThis note should be read in conjunction with note 9, discontinued operations. Unless otherwise stated, the numbers below include operating expenses from continuing operations excluding the external operating expenses of Chorus.
LabourIncluded in labour costs are pension contributions of NZ$11 million on behalf of Australian employees as required by the Superannuation Guarantee (Administration) Act 1992 (30 June 2011 NZ$14 million; 30 June 2010: NZ$15 million). Telecom also made employer contributions of NZ$7 million under the KiwiSaver and Company Tax Rate Amendments Act 2007 in the year ended 30 June 2012 (30 June 2011: NZ$6 million; 30 June 2010: NZ$4 million). Telecom has no other significant obligations to provide pension benefits in respect of employees.
Other operating expenses
Other operating expenses1
Direct costs 105 122 117
Mobile acquisition, updates and dealer commissions 336 244 295
Procurement and IT services expenses 317 337 292
Computer costs 89 158 197
Advertising costs 65 68 96
Broadband, internet and other 279 277 315
Accommodation and co-location 152 178 171
Outsourcing 20 22 36
Provision for doubtful debts 9 18 17
Equipment – lease and rental costs 3 12 10
Research costs 4 8 8
Movement in provision for inventory obsolescence (see note 14) (4) (3) (3)
Directors’ fees 1 1 1
Foreign exchange (gains)/losses (5) 4 10
Field service costs 51 53 56
Other 113 96 191
1,535 1,595 1,809
1 Other operating expenses includes NZ$115 million of pre-Demerger internal costs charged by discontinued operations that has been re-presented as external costs (30 June 2011: NZ$343 million, 30 June 2010: NZ$377 million).
performance
Telecom Annual Report 201294 |

GROUP 2012 2011 2010YEAR ENDED 30 JUNE NZ$000s NZ$000s NZ$000s
GROUP 2012 2011 2010YEAR ENDED 30 JUNE NZ$000s NZ$000s NZ$000s
Key management personnel costs Key management and personnel costs are included in labour costs of continuing and discontinued operations (excluding director fees).
Directors’ remuneration 1,200 1,491 1,289
Salary and other short-term benefits1 11,396 15,980 14,965
Redundancy and termination payments2 2,319 568 132
Long-term incentive and share-based compensation 1,794 5,595 5,582
16,709 23,634 21,968
1 Includes short-term benefits paid on termination.
2 This figure does not include long-term incentives vesting during the year ended 30 June 2012 as such incentives were accounted for in the financial year in which they were granted. This figure does not include long-term incentives granted to Mark Ratcliffe during the year ended 30 June 2012 as liability for payment at vesting transferred to Chorus upon Demerger. This figure does not include long-term incentives granted to Dr Reynolds during the year ended 30 June 2012 that subsequently lapsed in full upon his termination.
The table above includes remuneration of the CEO and the members of the Executive team. The aggregate Executive compensation include amounts paid to Executives who left during the year ended 30 June 2012 or were in acting Executive positions.
Auditors’ remuneration
Fees billed by principal accountants:
Audit fees 3,074 3,066 3,318
Audit-related fees 1,943 2,851 1,168
Other 1,127 – –
6,144 5,917 4,486
Audit-related fees for the year ended 30 June 2012 primarily relate to the audit of Demerger-related activities. Other fees for the year ended 30 June 2012 relate to work done on process improvement activities for AAPT. Audit remuneration is included in discontinued and continuing operations.
DonationsThe donation expense for the year ended 30 June 2012 was NZ$4,869,000 (30 June 2011: NZ$588,000; 30 June 2010: NZ$86,000) which included Telecom’s donation to the Telecom Foundation of NZ$4,570,000 and payroll giving matching of NZ$255,000. No donations were made to political parties in New Zealand for the year ended 30 June 2012 (30 June 2011: nil; 30 June 2010: nil).
| 95investor.telecom.co.nz

GROUP PARENT
YEAR ENDED 30 JUNE 2012 2011 2010 2012 2011(DOLLARS IN MILLIONS) NZ$M NZ$M NZ$M NZ$M NZ$M
Other gains
Gain on saleIn the year ended 30 June 2012, the gain on sale of NZ$10 million comprised:
• NZ$4 million gain on the sale of the Gen-i Software Solutions business to Infosys for NZ$5 million; and
• NZ$6 million gain on the sale of cable capacity.
In the year ended 30 June 2011, the gain on sale of NZ$23 million comprised:
• NZ$18 million (A$15 million) gain on the sale of AAPT’s consumer division to iiNet Limited for NZ$76 million (A$60 million); and
• NZ$5 million (A$4 million) gain on the sale of Telecom’s share in Yahoo!Xtra New Zealand Limited to Yahoo!7 Pty Limited for NZ$5 million (A$4 million).
Other gainsIn the year ended 30 June 2012 other gains of NZ$8 million (30 June 2011: NZ$22 million, 30 June 2010: NZ$27 million) represented various resolutions and settlements reached with a supplier.
Gain on winding up of foreign operationIn the year ended 30 June 2012 a gain of NZ$28 million was recycled from the foreign currency translation reserve on the winding up of the Australian branch of TCNZ Finance Limited.
Interim settlement on insuranceIn the year ended 30 June 2012 NZ$8 million was received from insurers in relation to the February 2011 Canterbury earthquake claim.
Asset impairmentsIn the year ended 30 June 2011 there was a non-cash impairment charge totalling NZ$215 million of the carrying value of certain property, plant and equipment and intangible assets from continuing operations. NZ$42 million impairment has been re-presented to discontinued operations (see note 9). Total impairment recognised in the year ended 30 June 2011 was NZ$257 million.
These impairments arose following Telecom’s assessment of the Government’s May 2011 announcement of the selected parties for the FTTP UFB programme and the subsequent passing of the Telecommunications Amendment Act (the Act) in June 2011. Management concluded that it was appropriate to impair certain assets that were expected to be stranded as a result of these long-term changes.
Certain material assets from the following programmes were assessed as being impaired at 30 June 2011:
• FNT – a regulatory programme to replace traditional PSTN voice with a VoIP service over copper broadband, which is no longer appropriate in a fibre-oriented world and is not expected to be launched to market; and
• Retail NGT Stage 1 – Telecom’s Retail NGT programme related to the delivery of a new customer relationship management and billing capability system. The stage 1 systems and processes were intended to allow customers to utilise the Primary Line VoIP service and were delivered by FNT.
Note 6 Other gains, expenses and impairmentThis note should be read in conjunction with note 9, discontinued operations. Unless otherwise stated, the numbers below include other gains, expenses and impairments from continuing operations.
Other gains
Gain on sale 10 23 – – –
Other gains 8 22 27 – –
Gain on distribution of Chorus shares – – – 726 –
Gain on winding up of foreign operation 28 – – – –
Interim settlement on insurances 8 – – – –
Adjustment to provision for intercompany balances – – – 830 –
54 45 27 1,556 –
Asset impairments
Impairment of telecommunications equipment and plant – 61 – – –
Impairment of software – 154 – – –
Adjustment to provision for intercompany balances – – – – 182
Impairment of intercompany balances – – – 117 30
– 215 – 117 212
Other expenses
Natural disaster costs 5 42 – – –
5 42 – – –
performance
Telecom Annual Report 201296 |

GROUP PARENT
YEAR ENDED 30 JUNE 2012 2011 2010 2012 2011(DOLLARS IN MILLIONS) NZ$M NZ$M NZ$M NZ$M NZ$M
Other than these impaired assets that were fully written off, the remaining assets in these programmes were identified for ongoing use or reuse by Telecom.
No impairment arose as a result of impairment reviews for the years ended 30 June 2012 or 30 June 2010.
Other expenses
Natural disaster costsIn the year ended 30 June 2012 NZ$5 million (30 June 2011: NZ$42 million) of costs were recognised in relation to the Canterbury earthquakes. These costs were comprised of incremental operational costs incurred, customer credits and asset impairments.
Parts of these costs are covered by Telecom’s insurance arrangements. In the year ended 30 June 2012 Telecom received an interim settlement on insurances of NZ$8 million; however, no further receivable from Telecom’s insurers has been able to be recognised due to these proceeds not yet being virtually certain.
Parent Company
Intercompany balances A NZ$726 million non-cash gain recognised on the Demerger of Chorus effective on 1 December 2011 relating to the difference between the fair value of Chorus and the book value of the assets the parent derecognised on distribution of Chorus shares to shareholders as required by NZIFRIC 17: Distributions of Non-cash Assets to Owners.
The NZ$830 million gain (30 June 2011: NZ$182 million expense) represents the movement in the value of a provision reflecting intercompany obligations of subsidiary companies assumed by the Parent Company (refer to note 19 for further information). This gain arose due to the decrease in obligations assumed by the Parent Company under a letter of support over subsidiary intercompany debts.
In the year ended 30 June 2012 the Parent Company wrote down its investments in subsidiaries by NZ$117 million (30 June 2011: NZ$30 million).
Note 7 Finance income and expenseThis note should be read in conjunction with note 9, discontinued operations. Unless otherwise stated, the numbers below include interest income and expense from continuing operations. Interest expense on Euro Medium Term Notes that transferred to Chorus is included in note 9.
Finance income:
Interest income from cash and deposits 11 8 8 – –
Other interest income 1 3 13 – –
Finance lease income 14 4 1 – –
Interest income on loans to subsidiary companies – – – 323 361
Finance income 26 15 22 323 361
Finance expense:
Finance expense on long-term debt:
– Euro Medium Term Notes (EMTN)1 48 106 103 – –
– TeleBonds 40 41 42 – –
Revaluation of interest rate derivatives 3 – 2 – –
Other interest and finance expenses 23 21 24 – –
Interest expense on loans from subsidiary companies – – – 457 454
114 168 171 457 454
Less interest capitalised (8) (16) (20) – –
Finance expense 106 152 151 457 454
1 Includes NZ$19 million recycled from the cash flow hedge reserve for the year ended 30 June 2012 (30 June 2011: NZ$73 million; 30 June 2010: NZ$68 million).
Interest is capitalised on property, plant and equipment and intangible assets under development at an annualised rate of 7.7% (30 June 2011: 7.7%; 30 June 2010: 7.8%).
| 97investor.telecom.co.nz

GROUP PARENT
YEAR ENDED 30 JUNE 2012 2011 2010 2012 2011(DOLLARS IN MILLIONS) NZ$M NZ$M NZ$M NZ$M NZ$M
Note 8 Income taxThis note should be read in conjunction with note 9, discontinued operations. Unless otherwise stated, the numbers below include income tax expense from continuing operations. Income tax relating to discontinued operations is included in note 9.
The income tax credit/(expense) for continuing operations is determined as follows:
Income statement
Current income tax
Current year income tax credit/(expense) (228) (34) 94 37 27
Adjustments in respect of prior periods 28 (8) – – –
Deferred income tax
Depreciation 124 50 (45) – –
Provisions, accruals, tax losses and other1 (14) (9) (14) – –
Adjustments in respect of prior periods (22) 6 (7) – –
Reduction in tax rate2 – (1) 18 – –
Effects of other changes in tax legislation3 – – (56) – –
Income tax credit/(expense) recognised in income statement (continuing operations) (112) 4 (10) 37 27
Statement of comprehensive income
Current income tax
Current year income tax credit 5 17 – – –
Fair value of derivative financial instruments (21) 13 (4) – –
Revaluation of listed investments – – 9 – –
Income tax credit/(expense) recognised in other comprehensive income (16) 30 5 – –
1 Tax changes enacted in September 2010 resulted in the write down in the year ended 30 June 2011 of NZ$18 million of recognised tax credits.
2 The company tax rate changed in New Zealand from 30% to 28%, effective for Telecom from 1 July 2011. An NZ$18 million tax credit in relation to the reduction in the company tax rate in New Zealand was recognised in the year ended 30 June 2010.
3 Tax changes announced in May 2010 from the Government’s 2010 Budget resulted in a NZ$56 million increased tax expense in the year ended 30 June 2010 relating to the prospective removal of tax depreciation on certain buildings.
performance
Telecom Annual Report 201298 |

GROUP PARENT
YEAR ENDED 30 JUNE 2012 2011 2010 2012 2011(DOLLARS IN MILLIONS) NZ$M NZ$M NZ$M NZ$M NZ$M
2012 2011 2010
GROUP
YEAR ENDED 30 JUNEBEFORE
TAX
TAX CREDIT/
EXPENSENET OF
TAXBEFORE
TAX
TAX CREDIT/
EXPENSENET OF
TAXBEFORE
TAX
TAX CREDIT/
EXPENSENET OF
TAX
(DOLLARS IN MILLIONS) NZ$M NZ$M NZ$M NZ$M NZ$M NZ$M NZ$M NZ$M NZ$M
Reconciliation of income tax expense (continuing operations)
Net earnings/(loss) for the year (continuing operations) 311 (79) 6 2,116 54
Total income tax credit/(expense) (continuing operations) (112) 4 (10) 37 27
Net earnings before income tax 423 (83) 16 2,079 27
Tax at current rate of 28% (2011/2010: 30%) (118) 25 (5) (582) (8)
Adjustment to taxation
Non-deductible items (1) (3) – 402 (64)
Tax effects of non-New Zealand profits1 2 (11) 54 – –
Non-taxable intercompany dividends – – – 217 99
Reduction in tax rate2 – (1) 18 – –
Effects of other changes in tax legislation3 – – (56) – –
Adjustments in respect of prior periods 6 (2) (7) – –
Benefit of current year losses not recognised (7) (5) (14) – –
Other 6 1 – – –
Total income tax credit/(expense) (continuing operations) (112) 4 (10) 37 27
1 Tax changes enacted in September 2010 resulted in the write down in the year ended 30 June 2011 of NZ$18 million of recognised tax credits.
2 The company tax rate changed in New Zealand from 30% to 28%, effective for Telecom from 1 July 2011. An NZ$18 million tax credit in relation to the reduction in the company tax rate in New Zealand was recognised in the year ended 30 June 2010.
3 Tax changes announced in May 2010 from the Government’s 2010 Budget resulted in a NZ$56 million increased tax expense in the year ended 30 June 2010 relating to the prospective removal of tax depreciation on certain buildings.
Income tax effects relating to each component of other comprehensive income
Translation of foreign operations (16) 3 (13) (20) 12 (8) (10) 4 (6)
Hedge of net investment (5) 2 (3) (16) 5 (11) 14 (4) 10
Reclassified to the income statement on disposal of foreign operation (28) – (28) – – – – – –
Revaluation of long-term investments (68) – (68) (48) – (48) 21 9 30
Cash flow hedges (see note 25) 74 (21) 53 (40) 13 (27) 13 (4) 9
Total other comprehensive income/(loss) for the year (43) (16) (59) (124) 30 (94) 38 5 43
| 99investor.telecom.co.nz

YEAR ENDED 30 JUNE1 2012 2011 2010(DOLLARS IN MILLIONS, EXCEPT PER SHARE AMOUNTS) NZ$M NZ$M NZ$M
Note 9 Discontinued operations As detailed in note 1, Telecom successfully completed the Demerger of Chorus effective from 1 December 2011. The Group Income statement and comparatives have been re-presented to show the Chorus results to 30 November 2011 as a discontinued operation, separately from Telecom’s continuing operations. The discontinued operation results for the periods presented in the Income statement are as follows:
Operating revenues and other gains
Local service 13 26 22
Data 9 18 12
Broadband and internet 44 94 83
Other operating revenues 13 31 23
Internal revenues from Telecom continuing operations 417 963 1,014
496 1,132 1,154
Operating expenses
Labour (17) (37) (35)
Other operating expenses (137) (243) (225)
Internal costs with Telecom continuing operations (21) (51) (46)
Asset impairments – (42) –
Depreciation (84) (265) (230)
Amortisation (21) (54) (30)
Net finance costs (20) (51) (51)
Net earnings before income tax 196 389 537
Income tax expense (55) (115) (161)
Net earnings for the period – before Demerger-related items 141 274 376
Demerger-related items:
Gain on distribution of Chorus shares 764 – –
Debt restructuring costs (110) – –
Demerger and UFB costs (50) (29) –
Net gain on asset arrangements between Chorus and Telecom 68 – –
Tax benefit on Demerger-related items 33 – –
Total Demerger-related items 705 (29) –
Earnings from discontinued operations attributable to equity 846 245 376
Basic earnings per share (in cents) 44 13 20
Diluted earnings per share (in cents) 44 13 20
1 Year ended 30 June 2012 includes operations to 30 November 2011.
The NZ$764 million non-cash gain on Demerger of Chorus relates to the difference between the fair value (NZ$1,264 million) and book value (NZ$500 million) of the net assets derecognised on distribution of Chorus shares to shareholders (refer to note 23 for further information), as required by NZ IFRIC 17: Distribution of Non-cash Assets to Owners.
Debt restructuring costs of NZ$110 million comprise NZ$36 million of fees (including consent and new facility fees) that are an economic cost to Telecom, and NZ$74 million of costs that relate to the realisation of economic positions held by Telecom. These economic positions had previously either been accumulating in the cash flow hedge reserve, or not recognised due to debt instruments being measured at amortised cost. These positions would have been recognised in the income statement over time had the instruments been held to maturity.
Demerger and UFB costs of NZ$50 million (30 June 2011: NZ$29 million, 30 June 2010: nil) include advisors’ fees (including legal, accounting, investment banking fees and independent expert report costs) and separation-related costs, such as changes to IT systems, programme management employee costs and preparation for trading arrangements between Telecom and Chorus.
Net non-cash gains by Telecom on asset arrangements between Chorus and Telecom of NZ$68 million represented:
• NZ$63 million of net gains on entering into new finance lease arrangements with Chorus on Demerger; and
• NZ$5 million gains on jointly controlled asset arrangements with Chorus;
performance
Telecom Annual Report 2012100 |

YEAR ENDED 30 JUNE 2012 2011 2010(DOLLARS IN MILLIONS) NZ$M NZ$M NZ$M
AS AT 30 NOVEMBER 2011
(DOLLARS IN MILLIONS) NZ$M
These non-cash gains arise due to the difference in the carrying value of assets covered under finance lease and jointly controlled assets arrangements being different from the present value of the future cash payments /receipts under the arrangements with Chorus.
The NZ$42 million asset impairment in the year ended 30 June 2011 related to Wholesale FMO assets based on Telecom’s expectation that the service improvement programme proposal under Variation Four would proceed, and therefore certain regulatory assets were considered stranded.
The carrying value of assets and liabilities derecognised on the demerger were:
Assets
Receivables and prepayments 4
Short-term derivative assets 1
Current tax receivable 2
Inventories 6
Intangible assets and property, plant and equipment 2,352
Total assets 2,365
Liabilities
Accounts payable and accruals 48
Short-term debt 1
Deferred tax liability 178
Long-term debt 1,582
Long-term derivatives and liabilities 56
Total liabilities 1,865
Net assets of discontinued operations at date of Demerger 500
The cash flows of the discontinued operations are as follows:
Net cash flows from operating activities1 (174) (274) (171)
Net cash flows from investing activities (146) (407) (418)
Net cash flows from financing activities 234 – –
Net cash flows from discontinued operations (86) (681) (589)
1 Pre-Demerger revenue received and expenses paid between the discontinued operations and continuing operations was not settled in cash and is therefore excluded from the cash flows from discontinued operations above.
| 101investor.telecom.co.nz

PARENT
YEAR ENDED 30 JUNE 2012 2011(DOLLARS IN MILLIONS, EXCEPT FOR PER SHARE AMOUNTS) NZ$M NZ$M
GROUP 2012 2011 2010YEAR ENDED 30 JUNE NZ$M NZ$M NZ$M
Note 10 Earnings per share
Basic earnings per share
Numerator:
Net earnings for the year (NZ$m) 1,157 166 382
Less net earnings attributable to non-controlling interests (2) (2) (2)
Net earnings attributable to equity holders (NZ$m) 1,155 164 380
Denominator – weighted average ordinary shares (in millions) 1,918 1,924 1,891
Basic earnings per share (in New Zealand dollars):
From net earnings attributable to equity holders 0.60 0.09 0.20
Diluted earnings per share
Denominator (in millions)
Ordinary shares 1,918 1,924 1,891
Options 4 4 4
1,922 1,928 1,895
Diluted earnings per share (in New Zealand dollars):
From net earnings attributable to equity holders 0.60 0.09 0.20
Anti-dilutive potential shares (in millions)
Options 1 1 3
Basic and diluted earnings per share – continuing operations
Numerator:
Net earnings for the year (NZ$m) – continuing operations 311 (79) 6
Less net earnings attributable to non-controlling interests (2) (2) (2)
Net earnings attributable to equity holders (NZ$m) – continuing operations 309 (81) 4
Denominator – weighted average ordinary shares (in millions) 1,918 1,924 1,891
Basic earnings per share (in New Zealand dollars) – continuing operations:
From net earnings attributable to equity holders 0.16 (0.04) –
Diluted earnings per share (in New Zealand dollars) – continuing operations:
Denominator (in millions) 1,922 1,928 1,895
Diluted earnings per share – continuing operations 0.16 (0.04) –
Note 11 DividendsDividends declared and provided by the Parent Company are as follows:
Previous year fourth quarter dividend paid 182 115
Supplementary dividend 24 –
First quarter dividend paid – 67
Supplementary dividend – 10
First half year dividend paid (2011: second quarter) 173 67
Supplementary dividend 23 9
Third quarter dividend paid – 68
Supplementary dividend – 9
402 345
Second half year dividend (2011: fourth quarter) declared subsequent to balance date not provided for (see note 32) 204 144
Additional second half year dividend (2011: fourth quarter) declared subsequent to balance date not provided for (see note 32) – 38
Dividends per share paid in the year (excluding supplementary dividends) NZ$0.185 NZ$0.165
performance
Telecom Annual Report 2012102 |
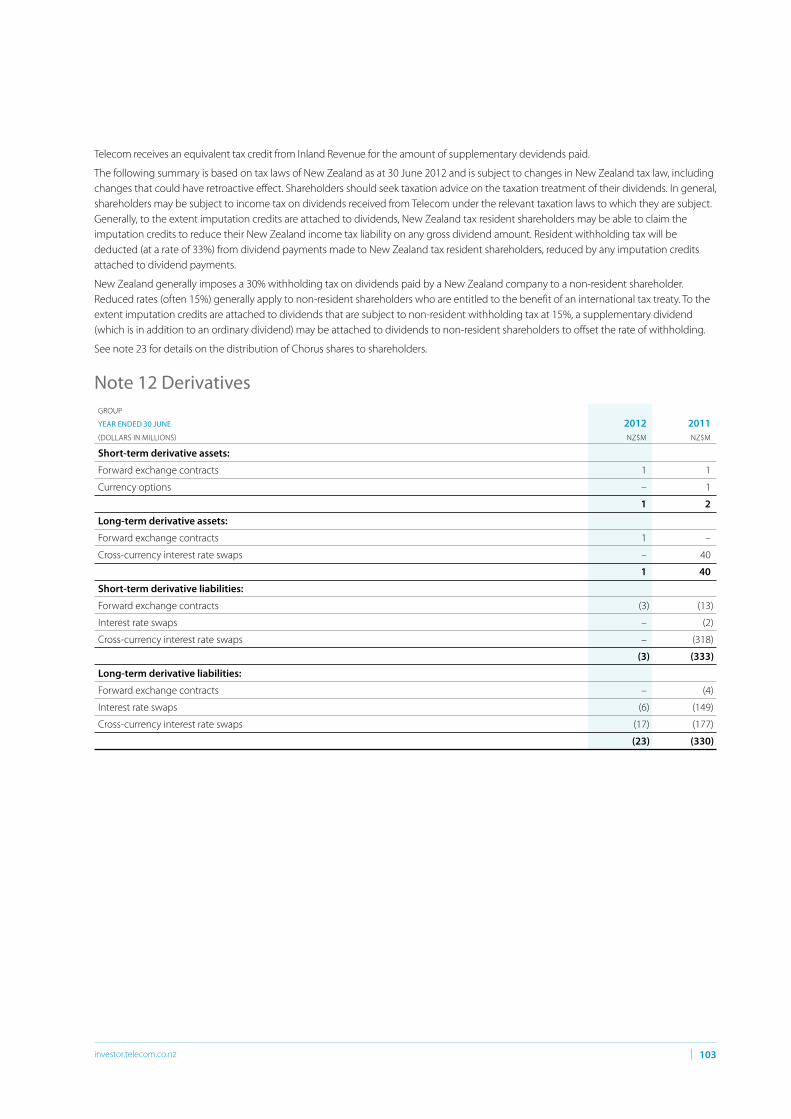
GROUP
YEAR ENDED 30 JUNE 2012 2011(DOLLARS IN MILLIONS) NZ$M NZ$M
Telecom receives an equivalent tax credit from Inland Revenue for the amount of supplementary devidends paid.
The following summary is based on tax laws of New Zealand as at 30 June 2012 and is subject to changes in New Zealand tax law, including changes that could have retroactive effect. Shareholders should seek taxation advice on the taxation treatment of their dividends. In general, shareholders may be subject to income tax on dividends received from Telecom under the relevant taxation laws to which they are subject. Generally, to the extent imputation credits are attached to dividends, New Zealand tax resident shareholders may be able to claim the imputation credits to reduce their New Zealand income tax liability on any gross dividend amount. Resident withholding tax will be deducted (at a rate of 33%) from dividend payments made to New Zealand tax resident shareholders, reduced by any imputation credits attached to dividend payments.
New Zealand generally imposes a 30% withholding tax on dividends paid by a New Zealand company to a non-resident shareholder. Reduced rates (often 15%) generally apply to non-resident shareholders who are entitled to the benefit of an international tax treaty. To the extent imputation credits are attached to dividends that are subject to non-resident withholding tax at 15%, a supplementary dividend (which is in addition to an ordinary dividend) may be attached to dividends to non-resident shareholders to offset the rate of withholding.
See note 23 for details on the distribution of Chorus shares to shareholders.
Note 12 Derivatives
Short-term derivative assets:
Forward exchange contracts 1 1
Currency options – 1
1 2
Long-term derivative assets:
Forward exchange contracts 1 –
Cross-currency interest rate swaps – 40
1 40
Short-term derivative liabilities:
Forward exchange contracts (3) (13)
Interest rate swaps – (2)
Cross-currency interest rate swaps – (318)
(3) (333)
Long-term derivative liabilities:
Forward exchange contracts – (4)
Interest rate swaps (6) (149)
Cross-currency interest rate swaps (17) (177)
(23) (330)
| 103investor.telecom.co.nz

GROUP PARENT
YEAR ENDED 30 JUNE 2012 2011 2012 2011(DOLLARS IN MILLIONS) NZ$M NZ$M NZ$M NZ$M
GROUP
YEAR ENDED 30 JUNE 2012 2011(DOLLARS IN MILLIONS) NZ$M NZ$M
GROUP
YEAR ENDED 30 JUNE 2012 2011(DOLLARS IN MILLIONS) CURRENCY MATURITIES NZ$M NZ$M
Telecom uses derivative financial instruments to reduce its exposure to fluctuations in foreign currency exchange rates and interest rates. The notional values of contract amounts outstanding are as follows:
Cross-currency interest rate swaps AUD:USD 2011 – 624
NZD:GBP 2018 – 2020 110 736
NZD:CAD 2013 – 378
NZD:CHF 2012 – 258
Interest rate swaps AUD 2011 – 482
NZD 2012 – 2020 110 1,428
Forward exchange contracts NZD:AUD 2011 – 2012 34 320
NZD:USD 2011 – 2013 95 193
NZD:EUR 2011 – 2012 27 41
Other 2012 – 2013 47 29
Currency options NZD:EUR 2011 – 2012 19 43
NZD:USD 2011 – 2012 24 63
NZD:AUD 2011 – 2012 9 21
Note 13 Receivables and prepayments
Short-term receivables and prepayments:
Trade receivables 422 495 – –
Less allowance for doubtful accounts receivable (18) (25) – –
404 470 – –
Unbilled rentals and tolls 84 106 – –
Finance lease receivable (see note 26) 39 22 – –
Prepaid expenses and other receivables 157 103 84 –
Due from subsidiaries – – 1 1,611
684 701 85 1,611
Long-term receivables and prepayments:
Finance lease receivable (see note 26) 146 29 – –
Prepaid spectrum licences 55 – – –
Other receivables 21 15 – –
222 44 – –
Bad debts of NZ$16 million (30 June 2011: NZ$17 million) were written off against the allowance for doubtful accounts during the year.
Note 14 Inventories
Maintenance materials and consumables 2 8
Goods held for resale 35 34
Work in progress 12 18
49 60
Total net of allowance for inventory obsolescence
Balance at beginning of the period (9) (12)
(Charged)/credited to the income statement 4 3
Balance at end of the period (5) (9)
performance
Telecom Annual Report 2012104 |
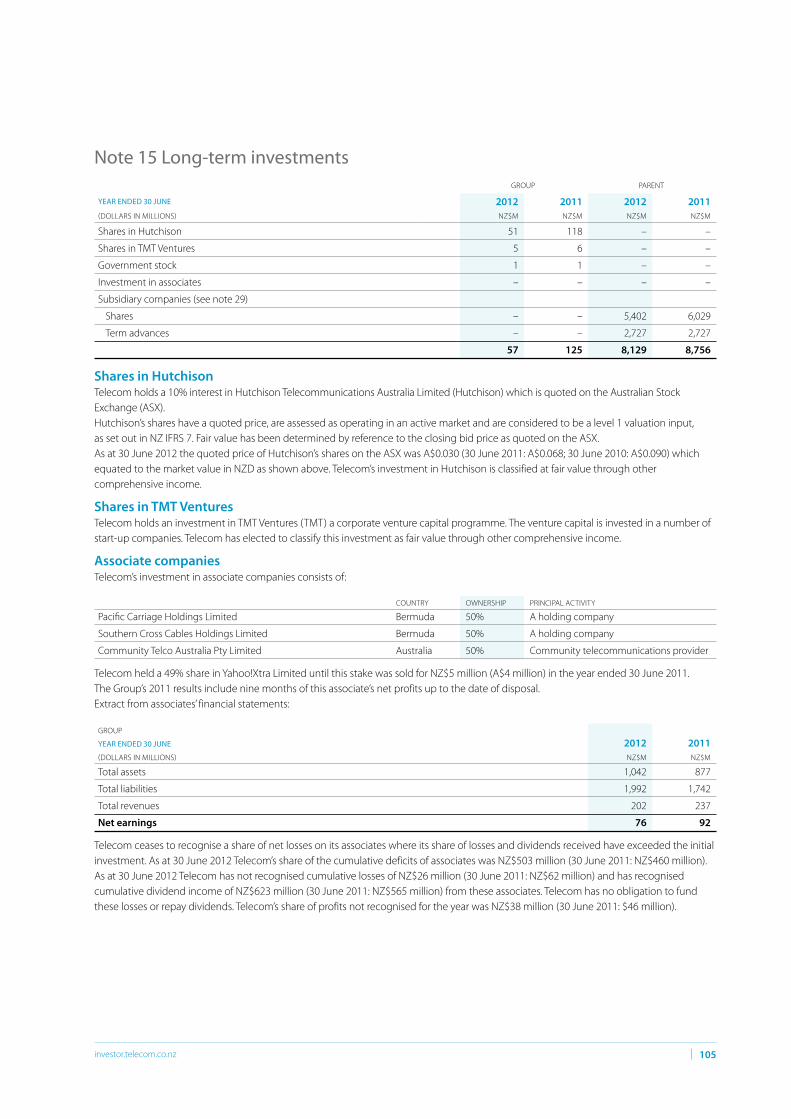
GROUP PARENT
YEAR ENDED 30 JUNE 2012 2011 2012 2011(DOLLARS IN MILLIONS) NZ$M NZ$M NZ$M NZ$M
GROUP
YEAR ENDED 30 JUNE 2012 2011(DOLLARS IN MILLIONS) NZ$M NZ$M
COUNTRY OWNERSHIP PRINCIPAL ACTIVITY
Note 15 Long-term investments
Shares in Hutchison 51 118 – –
Shares in TMT Ventures 5 6 – –
Government stock 1 1 – –
Investment in associates – – – –
Subsidiary companies (see note 29)
Shares – – 5,402 6,029
Term advances – – 2,727 2,727
57 125 8,129 8,756
Shares in Hutchison Telecom holds a 10% interest in Hutchison Telecommunications Australia Limited (Hutchison) which is quoted on the Australian Stock Exchange (ASX).Hutchison’s shares have a quoted price, are assessed as operating in an active market and are considered to be a level 1 valuation input, as set out in NZ IFRS 7. Fair value has been determined by reference to the closing bid price as quoted on the ASX. As at 30 June 2012 the quoted price of Hutchison’s shares on the ASX was A$0.030 (30 June 2011: A$0.068; 30 June 2010: A$0.090) which equated to the market value in NZD as shown above. Telecom’s investment in Hutchison is classified at fair value through other comprehensive income.
Shares in TMT VenturesTelecom holds an investment in TMT Ventures (TMT) a corporate venture capital programme. The venture capital is invested in a number of start-up companies. Telecom has elected to classify this investment as fair value through other comprehensive income.
Associate companiesTelecom’s investment in associate companies consists of:
Pacific Carriage Holdings Limited Bermuda 50% A holding company
Southern Cross Cables Holdings Limited Bermuda 50% A holding company
Community Telco Australia Pty Limited Australia 50% Community telecommunications provider
Telecom held a 49% share in Yahoo!Xtra Limited until this stake was sold for NZ$5 million (A$4 million) in the year ended 30 June 2011. The Group’s 2011 results include nine months of this associate’s net profits up to the date of disposal. Extract from associates’ financial statements:
Total assets 1,042 877
Total liabilities 1,992 1,742
Total revenues 202 237
Net earnings 76 92
Telecom ceases to recognise a share of net losses on its associates where its share of losses and dividends received have exceeded the initial investment. As at 30 June 2012 Telecom’s share of the cumulative deficits of associates was NZ$503 million (30 June 2011: NZ$460 million). As at 30 June 2012 Telecom has not recognised cumulative losses of NZ$26 million (30 June 2011: NZ$62 million) and has recognised cumulative dividend income of NZ$623 million (30 June 2011: NZ$565 million) from these associates. Telecom has no obligation to fund these losses or repay dividends. Telecom’s share of profits not recognised for the year was NZ$38 million (30 June 2011: $46 million).
| 105investor.telecom.co.nz

GROUP
YEAR ENDED 30 JUNE 2012 SOFTWARE CAPACITYSPECTRUM
LICENCESOTHER
INTANGIBLES GOODWILLWORK IN
PROGRESS TOTAL
(DOLLARS IN MILLIONS) NZ$M NZ$M NZ$M NZ$M NZ$M NZ$M NZ$M
GROUP
YEAR ENDED 30 JUNE 2011 SOFTWARE CAPACITYSPECTRUM
LICENCESOTHER
INTANGIBLES GOODWILLWORK IN
PROGRESS TOTAL
(DOLLARS IN MILLIONS) NZ$M NZ$M NZ$M NZ$M NZ$M NZ$M NZ$M
Note 16 Intangible assets
Cost
Balance as at 1 July 2011 2,222 594 60 60 1,139 177 4,252
Additions1 68 4 – 1 – 147 220
Distributed on Demerger (see note 9) (355) – – (5) – (16) (376)
Disposals (338) (15) – – – (47) (400)
Jointly controlled assets recognised 32 – – – – – 32
Jointly controlled assets derecognised (22) – – – – – (22)
Transfers 115 – – – – (115) –
Currency movements (2) – – – – – (2)
Balance as at 30 June 2012 1,720 583 60 56 1,139 146 3,704
Accumulated amortisation and impairment losses
Balance as at 1 July 2011 (1,688) (324) (33) (33) (1,033) (47) (3,158)
Amortisation (209) (18) (3) (4) – – (234)
Distributed on Demerger (see note 9) 181 – – 1 – – 182
Disposals 342 15 – – – 47 404
Currency movements 2 – – – – – 2
Balance as at 30 June 2012 (1,372) (327) (36) (36) (1,033) – (2,804)
Net book value at 30 June 2012 348 256 24 20 106 146 900
1 Total software acquisitions in the year ended 30 June 2012 include NZ$21 million of internally generated assets (30 June 2011: NZ$11 million).
Cost
Balance as at 1 July 2010 2,020 595 60 57 1,088 208 4,028
Additions 117 4 – 3 – 177 301
Disposals (145) (1) – – – – (146)
Transfers 209 – – – – (209) –
Currency movements 21 (4) – – 51 1 69
Balance as at 30 June 2011 2,222 594 60 60 1,139 177 4,252
Accumulated amortisation and impairment losses
Balance as at 1 July 2010 (1,378) (296) (30) (28) (982) – (2,714)
Amortisation (254) (32) (3) (5) – – (294)
Disposals 106 1 – – – – 107
Impairment (note 6) (147) – – – – (47) (194)
Currency movements (15) 3 – – (51) – (63)
Balance as at 30 June 2011 (1,688) (324) (33) (33) (1,033) (47) (3,158)
Net book value at 30 June 2011 534 270 27 27 106 130 1,094
performance
Telecom Annual Report 2012106 |

GROUP
YEAR ENDED 30 JUNE 2012 2011(DOLLARS IN MILLIONS) NZ$M NZ$M
Jointly controlled assetsTelecom shares a number of IT systems with Chorus with some systems owned by Telecom and some owned by Chorus. Due to the terms of the governance framework in place, these systems are deemed to be jointly controlled assets, as defined in NZ IAS 31: Interests in Joint Ventures. For assets that it does not own, Telecom recognises its share of the jointly controlled assets, as well as a liability for the future payments due, akin to a finance lease. The share of assets recognised varies from 5% to 69% of each asset. For assets that it does own, Telecom derecognised the share of the asset used by Chorus, as well as recognising a receivable for the future receipts due. The share of the assets derecognised varies from 1% to 67%. As at 30 June 2012 Telecom has recognised jointly controlled system assets owned by Chorus of NZ$25 million.
GoodwillTelecom’s operating segments are determined to be cash-generating units, being the lowest level of asset for which there are separately identifiable cash flows. Goodwill by operating segment is presented below:
Gen-i 81 81
Telecom Retail 25 25
106 106
Impairment testingThe recoverable amount of each segment, or cash-generating unit (CGU), was calculated on the basis of value in use using a discounted cash flow model. Future cash flows were projected out two years, based on board-approved business plans, with key assumptions being segment earnings and capital expenditure for the segment based on individual business unit forecasts on expected future performance.
Nil terminal growth was applied and a pre-tax discount rate of 12% (30 June 2011: 12%) was utilised. The terminal growth rates are determined based on the long-term historical growth rates of the sectors in which the CGU operates. The growth rates have been benchmarked against external data for the relevant sectors. None of the growth rates applied exceed the observed long-term historical average growth rates for those markets/sectors.
The forecasted financial information is based on both past experience and future expectations of CGU performance. The major inputs and assumptions used in performing an impairment assessment that require judgement include revenue forecasts, operating cost projections, customer numbers and customer churn, interest rates, discount rates and future technology paths.
During the years ended 30 June 2012 and 30 June 2011 no impairment arose as a result of the review of goodwill.
Significant headroom currently exists in each CGU and, based on sensitivity analysis performed, no reasonably possible changes in the assumptions would cause the carrying amount of the CGUs to exceed their recoverable amount. An increase in the discount rate to 27%, or a negative growth rate of 11% applied from FY14, would be required before the recoverable amount would fall below the carrying value of Gen-i. For Telecom Retail, the discount rate would need to exceed 34% or a negative growth rate of 15% be applied before an impairment occurred.
| 107investor.telecom.co.nz

GROUP
YEAR ENDED 30 JUNE 2011TELECOMMUNICATIONS EQUIPMENT AND PLANT
FREEHOLD LAND BUILDINGS OTHER ASSETS
WORK IN PROGRESS TOTAL
(DOLLARS IN MILLIONS) NZ$M NZ$M NZ$M NZ$M NZ$M NZ$M
GROUP
YEAR ENDED 30 JUNE 2012TELECOMMUNICATIONS EQUIPMENT AND PLANT
FREEHOLD LAND BUILDINGS OTHER ASSETS
WORK IN PROGRESS TOTAL
(DOLLARS IN MILLIONS) NZ$M NZ$M NZ$M NZ$M NZ$M NZ$M
Note 17 Property, plant and equipment
Cost
Balance as at 1 July 2011 11,670 94 680 637 170 13,251
Additions 153 – 42 52 61 308
Transfers 114 – – – (114) –
Recognised under finance lease with Chorus – – 20 – – 20
Derecognised under finance lease with Chorus (53) – (66) – – (119)
Jointly controlled assets derecognised (31) – – – – (31)
Distributed on Demerger (see note 9) (5,562) (32) (174) (21) (57) (5,846)
Disposals – other (490) – (11) (90) – (591)
Currency movements (19) – (1) – – (20)
Balance as at 30 June 2012 5,782 62 490 578 60 6,972
Accumulated depreciation and impairment losses
Balance as at 1 July 2011 (8,489) – (388) (479) (3) (9,359)
Depreciation charge (346) – (31) (70) – (447)
Transfers (1) – – 1 – –
Derecognised under finance lease with Chorus 20 – 26 – – 46
Jointly controlled assets derecognised 15 – – – – 15
Distributed on Demerger (see note 9) 3,574 – 100 14 – 3,688
Disposals 501 – 10 70 3 584
Currency movements 15 – 1 – – 16
Balance as at 30 June 2012 (4,711) – (282) (464) – (5,457)
Net book value at 30 June 2012 1,071 62 208 114 60 1,515
Cost
Balance as at 1 July 2010 11,114 94 644 603 271 12,726
Additions 329 – 56 58 170 613
Transfers 269 – – 1 (270) –
Disposals (120) – (23) (31) – (174)
Currency movements 78 – 3 6 (1) 86
Balance as at 30 June 2011 11,670 94 680 637 170 13,251
Accumulated depreciation and impairment losses
Balance as at 1 July 2010 (7,878) – (365) (417) – (8,660)
Depreciation charge (611) – (37) (85) – (733)
Impairments (note 6) (60) – – – (3) (63)
Disposals 128 – 17 28 – 173
Currency movements (68) – (3) (5) – (76)
Balance as at 30 June 2011 (8,489) – (388) (479) (3) (9,359)
Net book value at 30 June 2011 3,181 94 292 158 167 3,892
performance
Telecom Annual Report 2012108 |

GROUP PARENT
YEAR ENDED 30 JUNE 2012 2011 2012 2011(DOLLARS IN MILLIONS) NZ$M NZ$M NZ$M NZ$M
Values ascribed to land and buildingsTelecom’s properties consist primarily of special-purpose network buildings, which form an integral part of the telecommunications network.
Finance leases – with ChorusTelecom has entered into leases to occupy space in exchanges owned by Chorus and to allow Chorus to occupy space in Telecom exchanges. These leases are accounted for as finance leases with the lessor derecognising the leased proportion of the asset and the lessee recognising their share. Included in buildings is NZ$18 million leased under finance leases.
Jointly controlled assetsTelecom shares certain telecommunications equipment owned by Telecom with Chorus that are deemed to be jointly controlled assets. Telecom has derecognised the share of the assets used by Chorus, as well as recording a receivable for the future receipts due. During the year Telecom derecognised NZ$16 million of telecommunications equipment.
Land claimsUnder the Treaty of Waitangi Act 1975, all interests in land included in the assets purchased from the Government may be subject to claims to the Waitangi Tribunal, which has the power to recommend, in appropriate circumstances, with binding effect, that the land be resumed by the Government in order that it be returned to Māori claimants. In the event that the Government resumes land, compensation will be paid to Telecom under the provisions of the Public Works Act 1981. If this is insufficient to cover the loss, certain additional compensation is payable under the provisions of the sale and purchase agreement between the Company and the Government.
Under the State-Owned Enterprises Act 1986, the Governor-General of New Zealand, if satisfied that any land or interest in land held by Telecom is wāhi tapu (being land of special spiritual, cultural or historical tribal significance) may declare by Order in Council that the land be resumed by the Government, with compensation payable to Telecom under the provisions of the Public Works Act 1981. Telecom would expect to negotiate with the new Māori owners for continued occupancy rights of any sites resumed by the Government.
Note 18 Accounts payable and accruals
Short-term payables & accruals
Trade accounts payable 443 597 – –
Accrued personnel costs 149 162 – –
Revenue billed in advance 130 139 – –
Accrued interest 8 36 – –
Finance lease payable 6 – – –
Other accrued expenses 39 57 69 30
775 991 69 30
Long-term payables & accruals
Finance lease payable 4 – – –
Other payables & accruals 26 – – –
30 – – –
| 109investor.telecom.co.nz

GROUP
YEAR ENDED 30 JUNE 2012 COMMERCIAL RESTRUCTURING PROPERTY OTHER TOTAL
(DOLLARS IN MILLIONS) NZ$M NZ$M NZ$M NZ$M NZ$M
GROUP PARENT
YEAR ENDED 30 JUNE 2012 2011 2012 2011(DOLLARS IN MILLIONS) NZ$M NZ$M NZ$M NZ$M
Note 19 Provisions
Balance at 1 July 2011 1 11 28 33 73
Provisions made during the year 5 4 – 15 24
Provisions utilised during the year – (9) (1) (24) (34)
Provisions released during the year – (4) (16) (10) (30)
Balance as at 30 June 2012 6 2 11 14 33
Current 2 2 2 7 13
Non-current 4 – 9 7 20
CommercialThese provisions relate to disputes with customers and suppliers.
RestructuringThese provisions relate to restructuring activities previously undertaken or announced and are expected to be completed by the year ended 30 June 2013.
PropertyProperty provisions relate primarily to make-good requirements under property leases and onerous leases. NZ$2 million is expected to be utilised during the year ended 30 June 2013. The remainder, disclosed as non-current, is expected to be utilised beyond one year.
OtherOther provisions include various matters that are uncertain in amounts or timing. NZ$7 million is expected to be utilised by the year ended 30 June 2013. The remainder are ongoing.
ParentAs at 30 June 2012 the Parent’s obligation under a letter of support over subsidiary intercompany debts was NZ$1,897 million (30 June 2011: NZ$2,741 million).
Note 20 Debt due within one year
Long-term debt maturing within one year (see note 22) 312 304 – –
Short-term debt 95 93 – –
Due to subsidiaries – – 4,241 5,924
407 397 4,241 5,924
performance
Telecom Annual Report 2012110 |

GROUP
YEAR ENDED 30 JUNE 2012TAX
DEPRECIATIONPROVISIONS
AND ACCRUALS TAX LOSSES OTHER TOTAL
(DOLLARS IN MILLIONS) NZ$M NZ$M NZ$M NZ$M NZ$M
GROUP
YEAR ENDED 30 JUNE 2011TAX
DEPRECIATIONPROVISIONS
AND ACCRUALS TAX LOSSES OTHER TOTAL
(DOLLARS IN MILLIONS) NZ$M NZ$M NZ$M NZ$M NZ$M
Note 21 Deferred tax
Assets/(liabilities)
Balance at beginning of the year (289) 42 – 21 (226)
Amounts recognised in earnings
Relating to the current period 1241 (12) – (2) 110
Adjustments in respect of prior periods (24) 1 – 1 (22)
Amounts recognised in equity
Relating to the current period – – – (21) (21)
(189) 31 – (1) (159)
1 Includes the impact of NZ$178 million relating to assets transferred to Chorus.
Assets/(liabilities)
Balance at beginning of the year (338) 44 – 9 (285)
Amounts recognised in earnings
Relating to the current period 47 (5) – (2) 40
Adjustments in respect of prior periods 2 3 – 1 6
Amounts recognised in equity
Relating to the current period – – – 13 13
(289) 42 – 21 (226)
Telecom has not recognised the tax effect of accumulated unrestricted losses and temporary differences amounting to NZ$375 million at 30 June 2012 (30 June 2011: NZ$435 million) based on the relevant corporation tax rate of the applicable tax jurisdiction. These losses and temporary differences may be available to be carried forward to offset against future taxable income. However, utilisation is contingent on the relevant subsidiaries producing taxable profits over a significant period of time and is subject to compliance with the relevant taxation authority requirements. At 30 June 2012 a further NZ$133 million (30 June 2011: NZ$37 million) of tax effected accumulated losses are considered to be restricted as to their use and cannot be utilised against future taxable operating profits.
As at 30 June 2012 the aggregate amount of temporary differences associated with undistributed earnings of subsidiaries for which deferred tax liabilities have not been recognised is nil (30 June 2011: nil).
On 27 May 2010 the New Zealand Government enacted the Taxation (Budget Measures) Act 2010, which changed the effective rate at which Telecom’s temporary differences reversed, from 30% to 28%, effective from the year beginning 1 July 2011. Deferred tax assets and liabilities that reversed on or after this date were remeasured accordingly.
| 111investor.telecom.co.nz

GROUP
YEAR ENDED 30 JUNE 2012 2011(DOLLARS IN MILLIONS) NZ$M NZ$M
GROUP
YEAR ENDED 30 JUNE 2012 2011(DOLLARS IN MILLIONS)
FACE VALUE DUE INTEREST RATE1 NZ$M NZ$M
Note 22 Long-term debt
EMTN 79 1,468
TeleBonds 539 542
Bank funding 300 –
918 2,010
Less unamortised discount (1) (6)
917 2,004
Less long-term debt maturing within one year (see note 20) (312) (304)
605 1,700
Schedule of maturities
Due 1 to 2 years 103 601
Due 2 to 3 years 273 346
Due 3 to 4 years 150 73
Due 4 to 5 years – 150
Due over 5 years 79 530
Total due after one year 605 1,700
None of Telecom’s debt is secured and all rank equally with other liabilities. There are no financial covenants over Telecom’s debt, however, there are certain triggers in the event of default, as defined in the various debt agreements. There have been no events of default over Telecom’s debt in the years ended 30 June 2012 and 30 June 2011.
Immediately prior to the Demerger, Telecom drew NZ$1,106 million under a new syndicated and bridge facility. This drawn facility included in the statement of cash flows as proceeds from short-term debt and was included in the net assets transferred to Chorus and from the date of Demerger, was no longer part of Telecom’s facilities.
As part of the Demerger, Telecom bondholders elected to exchange GBP235 million (NZ$637 million at hedged rates, NZ$476 million at amortised cost) of Telecom GBP EMTN bonds to Chorus GBP EMTN bonds, issued by Chorus under the Chorus EMTN Programme. Bondholders representing GBP40 million (NZ$110 million at hedged rates) did not elect to exchange to Chorus bonds and consequently these bonds remain in Telecom. The related cross currency swaps were split and partially novated to Chorus along with the exchanged bonds. Prior to Demerger, the interest rate swaps relating to the Telecom GBP bonds were closed out. New interest rate swaps have since been entered into, hedging the GBP bonds that remain with Telecom. The costs associated with the debt restructuring above have been included in discontinued operations and are summarised in note 9.
Euro Medium Term Notes
250m USD 14 Dec 20112 6.8% – 302
200m CHF 6 Aug 20122 4.4% – 290
275m CAD 11 Oct 20132 4.8% – 343
125m GBP 14 May 2018 5.6% 44 242
150m GBP 6 Apr 2020 5.8% 35 291
79 1,468
1 Before hedging instruments.
2 EMTNs repaid prior to Demerger.
During the year Telecom repaid the USD250 million, CAD275 million and CHF200 million bonds, including the related derivatives. Cross-currency interest rate swaps and interest rate swaps have been entered into to manage EMTN currency and interest rate risk exposures (see note 25).
performance
Telecom Annual Report 2012112 |

GROUP AND PARENT 2012 2011YEAR ENDED 30 JUNE
(DOLLARS IN MILLIONS) NUMBER NZ$M NUMBER NZ$M
TeleBonds
Telecom has issued bonds (TeleBonds) to institutional and retail investors. These have been issued as compounding, income or zero coupon bonds. TeleBonds have effective interest rates ranging from 6.9% to 8.7% and maturity dates between March 2013 and March 2016. During the year ended 30 June 2012 NZ$3 million of TeleBonds matured and were repaid (30 June 2011: NZ$21 million).
Bank fundingDuring the financial year Telecom entered into a bank funding agreement with Westpac New Zealand Limited. This facility is unsecured and has two tranches. One tranche can draw up to NZ$100 million through to 2014 and the other tranche can draw up to NZ$300 million through to 2015. As at 30 June 2012 the Group has drawn down NZ$300 million.
Note 23 EquityContributed capitalMovements in the Company’s issued ordinary shares were as follows:
Balance at the beginning of the year 1,924,678,136 1,528 1,920,694,831 1,515
Dividend reinvestment plan (4,915) – 3,388,197 7
Employee shares 749,460 14 595,108 6
Distribution of Chorus shares to shareholder – (383) – –
Shares repurchased (68,677,468) (169) – –
Balance at the end of the year1 1,856,745,213 990 1,924,678,136 1,528
1 The 1,856,745,213 shares recorded in the financial statements differs from the 1,872,032,114 shares recorded on the share register at 30 June 2012, as the former takes into account the contractual share buyback transactions entered into in the three days of trading prior to the financial year-end (which were legally settled and entered into the share register after 30 June 2012).
All issued shares are fully paid and have no par value. Shareholders of ordinary shares have the right to vote at any general meeting of the Company.
A special rights convertible preference share (the Kiwi Share) was created on 11 September 1990 and was registered in the name of, and could only be held by, the Minister of Finance on behalf of the Crown. As part of the Demerger of Chorus the Kiwi Share was converted to an ordinary share in the Company prior to 1 December 2011. The consent of the holder of the Kiwi Share is no longer required for the amendment, removal or alteration of the effect of certain provisions of the Company’s constitution.
Dividend reinvestment plan Telecom has a dividend reinvestment plan. Under the plan, shareholders can elect to receive dividends in additional shares. In respect of the year ended 30 June 2012, 6,866,385 shares with a total value of NZ$16 million (30 June 2011: 3,388,197 shares with a total value of NZ$7 million) were issued in lieu of dividends. During the year ended 30 June 2012, 6,871,300 shares were repurchased and cancelled to neutralise the dilution effect of the dividend reinvestment plan to non-participants. Shares issued in lieu of dividends are excluded from dividends paid in the statement of cash flows.
Restricted share scheme, share rights scheme and exercise of optionsSee note 24 for details of Telecom’s employee share schemes.
Distribution of Chorus shares to shareholderIFRIC 17: Distributions of Non-cash Assets to Owners, required the Demerger of Chorus to be recognised at fair value. Telecom recognised the fair value reduction in equity as a) a return of capital and b) a distribution of retained earnings. The return of capital of NZ$383 million was calculated by dividing the market capitalisation of Chorus shares around Demerger by the market capitalisation of Chorus and Telecom around Demerger and multiplying the result by the balance of Telecom’s share capital account. The part of the distribution that was not a return of capital is treated as a distribution of retained earnings.
| 113investor.telecom.co.nz

Shares repurchasedIn February 2012 Telecom announced an on-market buyback of shares to return surplus capital to shareholders. The planned buyback and cancellation consists of up to 200 million shares for an aggregate purchase price of up to NZ$300 million. As at 30 June 2012, 68,677,468 shares at a cost of NZ$169 million had been repurchased. This represents an average price per share of NZ$2.46. The total cost of the share buyback including transaction costs has been deducted from contributed capital. Shares repurchased are cancelled immediately on acquisition.
Shares held in trustAs detailed in note 24, prior to vesting restricted shares granted under the restricted shares scheme are held in trust before they are allocated to employees under the Telecom restricted share scheme. As at 30 June 2012, 96,649 shares were held in trust (30 June 2011: 2,222,907).
Hedge reserveMovements in the fair value of derivatives are recognised directly in the hedge reserve when the derivative is in an effective cash flow hedge relationship. Cash flow hedge relationships are established at the point the derivative is recognised by Telecom and documentation details the relationship and how effectiveness will be measured. The fair value of derivatives is removed from the hedge reserve and recognised in the carrying value of the hedged item or recognised in the income statement as appropriate.
Non-controlling interestNon-controlling interest (also known as minority interest) consists of the share of the net earnings less dividends of subsidiaries controlled by Telecom but not attributable to the Group.
Share based deferred compensation reserveDeferred compensation relating to restricted shares or share options is recognised over the related vesting period. Amounts are transferred from the deferred compensation reserve to share capital upon the vesting of the share or the option.
Revaluation reserveThe revaluation reserve is used to record the cumulative fair value gains and losses recognised on financial assets that are recognised at fair value through other comprehensive income. In accordance with IFRS 9, gains and losses are recorded in other comprehensive income.
Foreign currency translation reserveTranslation differences arising on the results and net assets of subsidiaries with functional currencies other than New Zealand dollars are recognised in the foreign currency translation reserve. Movements in the fair value of derivative financial instruments that are effective hedges of Telecom’s net investment in subsidiaries subject to these translation differences are also recognised directly in the foreign currency translation reserve. The cumulative amounts are released to the income statement upon disposal or unwinding up of these subsidiaries.
Note 24 Employee share schemesTelecom incentive schemesTelecom has operated a number of incentive schemes, which include a share option scheme, a restricted share scheme, share rights schemes and a CEO performance rights scheme. The total charge recognised for these schemes during the year ended 30 June 2012 was NZ$3 million (30 June 2011: NZ$8 million; 30 June 2010: NZ$11 million). The awards under the schemes are settled with ordinary shares of the Parent Company.
Telecom share option schemeTelecom operated a share option scheme (SOS) from 1994 to 2005 whereby certain employees were granted options to purchase ordinary shares in the Parent Company. Each option granted converts to one ordinary share on exercise. A participant may exercise their options (subject to employment conditions) at any time during a prescribed period from the vest date to the date the option lapses. For these options to be exercised Telecom’s share price must exceed the option exercise price escalated by the cost of equity less dividends paid, within the applicable period. External advisers calculate the cost of equity annually and achievement of the performance hurdle is independently verified. No options were issued to, or exercised by, employees under the share option scheme during the years ended 30 June 2012, 2011 or 2010.
In prior years, options have been issued with a maximum term of six years. New ordinary shares are issued in accordance with the constitution upon the exercise of options. The price payable on exercise will be equivalent to the average daily closing price of Telecom shares reported on the New Zealand Stock Exchange for the business days in the month immediately preceding the date on which options are granted (subject to adjustment if the shares traded ‘cum dividend’). The number of options granted under the SOS is determined by a committee of the board of directors pursuant to the SOS. The average share price during the year was NZ$2.41 (30 June 2011: NZ$2.14) and no options were exercised (30 June 2011: nil). The intrinsic value of options outstanding and exercisable as at 30 June 2012 is nil (30 June 2011: nil).
Information regarding options granted under the SOS is as follows:
OPTION PRICE1
NZ$ NUMBER OF OPTIONS
30 June 2010 6.02 1,675,391
Lapsed 5.96 (1,088,052)
30 June 2011 6.11 587,339
Lapsed 6.11 (587,339)
30 June 2012 – –
1 Weighted average.
performance
Telecom Annual Report 2012114 |
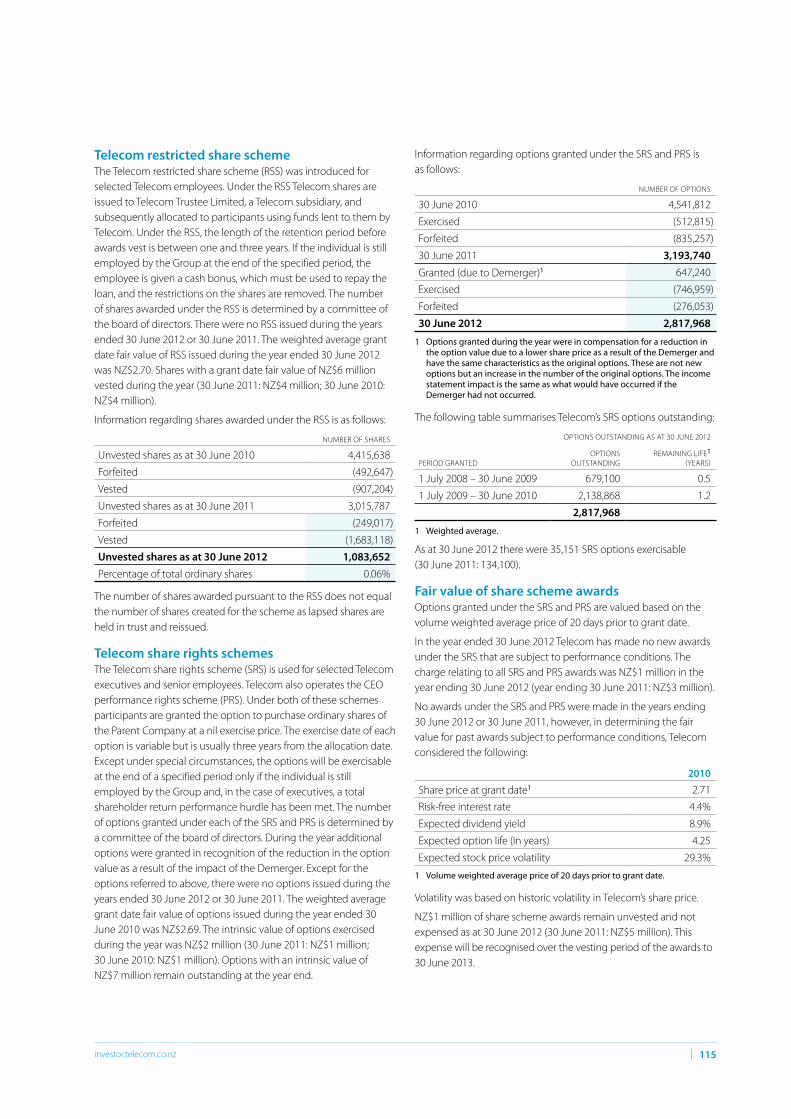
Telecom restricted share schemeThe Telecom restricted share scheme (RSS) was introduced for selected Telecom employees. Under the RSS Telecom shares are issued to Telecom Trustee Limited, a Telecom subsidiary, and subsequently allocated to participants using funds lent to them by Telecom. Under the RSS, the length of the retention period before awards vest is between one and three years. If the individual is still employed by the Group at the end of the specified period, the employee is given a cash bonus, which must be used to repay the loan, and the restrictions on the shares are removed. The number of shares awarded under the RSS is determined by a committee of the board of directors. There were no RSS issued during the years ended 30 June 2012 or 30 June 2011. The weighted average grant date fair value of RSS issued during the year ended 30 June 2012 was NZ$2.70. Shares with a grant date fair value of NZ$6 million vested during the year (30 June 2011: NZ$4 million; 30 June 2010: NZ$4 million).
Information regarding shares awarded under the RSS is as follows:
NUMBER OF SHARES
Unvested shares as at 30 June 2010 4,415,638
Forfeited (492,647)
Vested (907,204)
Unvested shares as at 30 June 2011 3,015,787
Forfeited (249,017)
Vested (1,683,118)
Unvested shares as at 30 June 2012 1,083,652Percentage of total ordinary shares 0.06%
The number of shares awarded pursuant to the RSS does not equal the number of shares created for the scheme as lapsed shares are held in trust and reissued.
Telecom share rights schemes The Telecom share rights scheme (SRS) is used for selected Telecom executives and senior employees. Telecom also operates the CEO performance rights scheme (PRS). Under both of these schemes participants are granted the option to purchase ordinary shares of the Parent Company at a nil exercise price. The exercise date of each option is variable but is usually three years from the allocation date. Except under special circumstances, the options will be exercisable at the end of a specified period only if the individual is still employed by the Group and, in the case of executives, a total shareholder return performance hurdle has been met. The number of options granted under each of the SRS and PRS is determined by a committee of the board of directors. During the year additional options were granted in recognition of the reduction in the option value as a result of the impact of the Demerger. Except for the options referred to above, there were no options issued during the years ended 30 June 2012 or 30 June 2011. The weighted average grant date fair value of options issued during the year ended 30 June 2010 was NZ$2.69. The intrinsic value of options exercised during the year was NZ$2 million (30 June 2011: NZ$1 million; 30 June 2010: NZ$1 million). Options with an intrinsic value of NZ$7 million remain outstanding at the year end.
Information regarding options granted under the SRS and PRS is as follows:
NUMBER OF OPTIONS
30 June 2010 4,541,812
Exercised (512,815)
Forfeited (835,257)
30 June 2011 3,193,740Granted (due to Demerger)1 647,240
Exercised (746,959)
Forfeited (276,053)
30 June 2012 2,817,968
1 Options granted during the year were in compensation for a reduction in the option value due to a lower share price as a result of the Demerger and have the same characteristics as the original options. These are not new options but an increase in the number of the original options. The income statement impact is the same as what would have occurred if the Demerger had not occurred.
The following table summarises Telecom’s SRS options outstanding:
OPTIONS OUTSTANDING AS AT 30 JUNE 2012
PERIOD GRANTEDOPTIONS
OUTSTANDINGREMAINING LIFE1
(YEARS)
1 July 2008 – 30 June 2009 679,100 0.5
1 July 2009 – 30 June 2010 2,138,868 1.2
2,817,968
1 Weighted average.
As at 30 June 2012 there were 35,151 SRS options exercisable (30 June 2011: 134,100).
Fair value of share scheme awardsOptions granted under the SRS and PRS are valued based on the volume weighted average price of 20 days prior to grant date.
In the year ended 30 June 2012 Telecom has made no new awards under the SRS that are subject to performance conditions. The charge relating to all SRS and PRS awards was NZ$1 million in the year ending 30 June 2012 (year ending 30 June 2011: NZ$3 million).
No awards under the SRS and PRS were made in the years ending 30 June 2012 or 30 June 2011, however, in determining the fair value for past awards subject to performance conditions, Telecom considered the following:
2010
Share price at grant date1 2.71
Risk-free interest rate 4.4%
Expected dividend yield 8.9%
Expected option life (in years) 4.25
Expected stock price volatility 29.3%
1 Volume weighted average price of 20 days prior to grant date.
Volatility was based on historic volatility in Telecom’s share price.
NZ$1 million of share scheme awards remain unvested and not expensed as at 30 June 2012 (30 June 2011: NZ$5 million). This expense will be recognised over the vesting period of the awards to 30 June 2013.
| 115investor.telecom.co.nz

GROUP
AS AT 30 JUNE 2012
MEASURED FAIR VALUE THROUGH
PROFIT & LOSS
FAIR VALUE THROUGH OTHER COMPREHENSIVE
INCOME
DESIGNATED IN HEDGING
RELATIONSHIPS AMORTISED COST TOTAL
(DOLLARS IN MILLIONS) NZ$M NZ$M NZ$M NZ$M NZ$M
Note 25 Financial instruments and risk managementTelecom manages its treasury activities through a board-approved treasury constitution consisting of treasury governance and policy frameworks. Telecom is exposed to foreign currency, interest rate, credit, liquidity and equity risks. Each of these risks, the associated financial instruments and the management of those risks, are detailed in this note.
Financial InstrumentsTelecom’s financial instruments are classified under IFRS as follows:
Assets
Current assets
Cash 185 – – – 185
Short-term derivative assets – – 1 – 1
Trade and other receivables – – – 413 413
Finance lease receivables1 – – – 39 39
185 – 1 452 638
Non-current assets
Long-term derivative assets – – 1 – 1
Other receivables – – – 21 21
Finance lease receivables1 – – – 146 146
Long-term investments2 – 56 – 1 57
– 56 1 168 225
Liabilities
Current liabilities
Short-term derivative liabilities – – (3) – (3)
Trade accounts payable – – – (443) (443)
Finance lease payables – – – (6) (6)
Short-term debt – – – (95) (95)
Long-term debt due within one year – – – (312) (312)
– – (3) (856) (859)
Non-current liabilities
Finance lease payables – – – (4) (4)
Long-term derivative liabilities – – (23) – (23)
Long-term debt due after one year – – – (605) (605)
– – (23) (609) (632)
1 Finance lease receivables are stated based on amounts set-off as presented in note 26.
2 Excludes associates.
performance
Telecom Annual Report 2012116 |

GROUP
AS AT 30 JUNE 2011
MEASURED FAIR VALUE THROUGH
PROFIT & LOSS
FAIR VALUE THROUGH OTHER COMPREHENSIVE
INCOME
DESIGNATED IN HEDGING
RELATIONSHIPS AMORTISED COST TOTAL
(DOLLARS IN MILLIONS) NZ$M NZ$M NZ$M NZ$M NZ$M
Assets
Current assets
Cash 324 – – – 324
Collateral funds 110 – – – 110
Short-term derivative assets 1 – 1 – 2
Trade and other receivables – – – 470 470
Finance lease receivables – – – 22 22
435 – 1 492 928
Non-current assets
Long-term derivative assets – – 40 – 40
Other receivables – – – 15 15
Finance lease receivables – – – 29 29
Long-term investments1 – 124 – 1 125
– 124 40 45 209
Liabilities
Current liabilities
Short-term derivative liabilities – – (333) – (333)
Trade accounts payable – – – (597) (597)
Short-term debt – – – (93) (93)
Long-term debt due within one year – – – (304) (304)
– – (333) (994) (1,327)
Non-current liabilities
Long-term derivative liabilities (72) – (258) – (330)
Long-term debt due after one year – – – (1,700) (1,700)
(72) – (258) (1,700) (2,030)
1 Excludes associates.
ReclassificationsThere have been no reclassifications between financial instrument categories during the years ended 30 June 2012 and 30 June 2011.
Fair value of financial instrumentsFinancial instruments are either carried at amortised cost, less any provision for impairment, or fair value. The only significant variances between instruments held at amortised cost and their fair value relates to long-term debt.
The table below categorises Telecom’s financial assets and liabilities that are measured at fair value by the significance of the inputs used in making the measurements, as prescribed in NZ IFRS 7:
• Level 1 fair value measurements are those derived from quoted prices (unadjusted) in active markets for identical assets or liabilities;
• Level 2 fair value measurements are those derived from inputs other than quoted prices included within Level 1 that are observable for the asset or liability, either directly (ie, as prices) or indirectly (ie, derived from prices); and
• Level 3 fair value measurements are those derived from valuation techniques that include inputs for the asset or liability that are not based on observable market data (unobservable inputs).
| 117investor.telecom.co.nz

GROUP
YEAR ENDED 30 JUNE 2012 LEVEL 1 LEVEL 2 LEVEL 3 TOTAL
(DOLLARS IN MILLIONS) NZ$M NZ$M NZ$M NZ$M
GROUP
YEAR ENDED 30 JUNE 2011 LEVEL 1 LEVEL 2 LEVEL 3 TOTAL
(DOLLARS IN MILLIONS) NZ$M NZ$M NZ$M NZ$M
GROUP
YEAR ENDED 30 JUNE 2012 2011(DOLLARS IN MILLIONS) NZ$M NZ$M
Financial assets
Cash 185 – – 185
Short-term derivative assets – 1 – 1
Long-term derivative assets – 1 – 1
Long-term investments1 51 – 5 56
236 2 5 243
Financial liabilities
Short-term derivative liabilities – (3) – (3)
Long-term derivative liabilities – (23) – (23)
– (26) – (26)
1 Excludes associates and Government stock.
Financial assets
Cash 324 – – 324
Collateral funds 110 – – 110
Short-term derivative assets – 2 – 2
Long-term derivative assets – 40 – 40
Long-term investments1 118 – 6 124
552 42 6 600
Financial liabilities
Short-term derivative liabilities – (333) – (333)
Long-term derivative liabilities – (330) – (330)
– (663) – (663)
1 Excludes associates and Government stock.
Reconciliation of Level 3 fair value measurements of financial assets:
Long-term investment in TMT
Balance at beginning of the year 6 12
Gain/(loss) recognised in other comprehensive income (1) (5)
Investment return – (1)
Balance at end of the year 5 6
performance
Telecom Annual Report 2012118 |
Gains and losses on Telecom’s long-term investment in TMT relate to the investment held at the end of the reporting period and are reported as a revaluation of long-term investments in other comprehensive income.
The following methods and assumptions were used to estimate the fair value of each class of financial instrument:
Long-term investments At 30 June 2012 Telecom had quoted and unquoted investments. The quoted investments have standard terms and conditions and are traded in active markets. Telecom measures its investment in Hutchison and in TMT at fair value, and due to the strategic nature of the investments held Telecom has elected to carry these investments at fair value through other comprehensive income. Telecom has chosen to measure the fair value of Hutchison under IFRS 9 using the observable market share price. TMT’s fair value is based on the latest available fund manager’s report.
Cross-currency interest rate swaps, interest rate swaps, forward exchange contracts and currency optionsFair values are estimated on the basis of the quoted market prices of these instruments. If a listed market price is unavailable, then fair value is estimated by using a valuation model involving discounted future cash flows of the derivative, using the applicable forward price curve (for the relevant interest rate, foreign exchange rate or commodity price) and discount rate.
Finance lease receivableThe fair value of finance lease receivables is estimated to be NZ$190 million (30 June 2011: NZ$53 million) using a discount rate based on the relevant swap rate given the tenure of the lease and adding a credit margin that reflects the credit quality of the receivables. As a result of the Demerger, NZ$118 million net of finance lease receivables were recognised, based on the various asset and property usage agreements between Telecom and Chorus.
Long-term debt The fair value of long-term debt (calculated based on the present value of future principal and interest cash flows, discounted at market interest rates at balance date) was NZ$957 million compared to a carrying value of NZ$917 million (30 June 2011: fair value of NZ$2,128 million compared to a carrying value of NZ$2,004 million).
Cash, collateral funds, short-term investments, short-term debt, trade receivables, other receivables and trade accounts payableThe carrying amounts of these balances are approximately equivalent to their fair value because of the short term to maturity.
Other assumptionsNZD forward interest rates used to determine fair values range from 2.6% to 9.4%.
Risk managementTelecom is exposed to market risk due to foreign currency, interest rates and price risk, as well as credit risk, liquidity risk and equity price risk.
Market riskTelecom is exposed to market risk primarily from changes in foreign currency exchange rates and interest rates. Telecom employs risk management strategies, including the use of derivatives such as interest rate swaps, forward exchange contracts, foreign currency options and cross-currency interest rate swaps, to manage these exposures. Telecom monitors the use of derivative financial instruments through the use of well-defined market and credit risk limits and timely reports to senior management. Telecom does not hold or issue derivative financial instruments for trading purposes. All contracts have been entered into with major creditworthy financial institutions. The risk associated with these transactions is that the fair value or cash flows of financial instruments will change due to movements in market rates, coupled with the cost of replacing these agreements at the current market rates in the event of default by the counterparty. Telecom is also subject to equity price risk in relation to long-term investments in listed and unlisted companies, as well as investments in associate companies, when not fully written down.
Currency riskTelecom’s primary objective in managing foreign currency risk is to protect against the risk that the eventual New Zealand dollar net cash flows will be adversely affected by changes in foreign currency exchange rates. To do this Telecom enters into forward exchange contracts and foreign currency options to reduce its foreign currency exposures. Forward exchange contracts are also used to hedge certain foreign currency assets.
Foreign currency assets, where appropriate, are naturally hedged by holding liabilities in the same currency. Capital and operational expenditure in foreign currencies that are highly probable may be hedged. Exposures with amounts and timing that are less than certain may be proportionately hedged, based on certain benchmarks.
A portion of Telecom’s long-term debt has been issued in foreign currency under Telecom’s Euro Medium Term Note programme. Telecom enters into cross-currency interest rate swaps to convert the foreign currency borrowings into a floating rate New Zealand dollar exposure. All debt not denominated in New Zealand dollars is hedged. Debt denominated in foreign currencies is translated to New Zealand dollars with currency translation recognised in the income statement. These movements are offset by the translation of the principal value of the related cross-currency interest rate swaps.
Telecom uses forward exchange contracts and foreign currency options to hedge forecast transactions that have a high probability of occurrence, foreign exchange differences in foreign currency receivables and payables and to hedge certain investments in foreign operations.
| 119investor.telecom.co.nz

GROUP
YEAR ENDED 30 JUNE 2012 aUd1 Usd eUR GbP OtheR tOtal
(dOllaRs IN MIllIONs) NZ$M NZ$M NZ$M NZ$M NZ$M NZ$M
GROUP
YEAR ENDED 30 JUNE 2011 aUd1 Usd eUR GbP Cad ChF OtheR tOtal
(dOllaRs IN MIllIONs) NZ$M NZ$M NZ$M NZ$M NZ$M NZ$M NZ$M NZ$M
GROUP 10% deCRease 10% INCRease
YEAR ENDED 30 JUNE 2012 2011 2012 2011(dOllaRs IN MIllIONs) NZ$M NZ$M NZ$M NZ$M
telecom’s exposure to foreign currencies arising from financial instruments is:
Exposures
Cash 52 66 9 12 – 139
trade receivables 89 19 1 1 – 110
long-term investments 51 1 – – – 52
trade accounts payable (60) (38) (7) (6) (33) (144)
long-term debt – – – (79) – (79)
Total exposure from non-derivative financial instruments 132 48 3 (72) (33) 78
Hedging instruments
Forward exchange contracts (8) 93 25 – 33 143
NZ$ cross-currency interest rate swaps – – – 79 – 79
Total exposure from hedging instruments (8) 93 25 79 33 222
1 Includes balance held in Australian operations.
Exposures
Cash 23 25 2 16 – – 2 68
Collateral funds – 110 – – – – – 110
trade receivables 141 10 – 15 – – – 166
long-term investments 118 2 – – – – – 120
trade accounts payable (98) (29) (5) (15) – – (19) (166)
short-term debt (13) – – – – – – (13)
long-term debt – (301) – (530) (343) (289) – (1,463)
Total exposure from non-derivative financial instruments 171 (183) (3) (514) (343) (289) (17) (1,178)
Hedging instruments
Forward exchange contracts (299) (11) 38 – – – 19 (253)
NZ$ cross-currency interest rate swaps – – – 530 343 289 – 1,162
a$ cross-currency interest rate swaps (624) 301 – – – – – (323)
Total exposure from hedging instruments (923) 290 38 530 343 289 19 586
1 Includes balance held in Australian operations.
the above table includes telecom’s foreign currency exposures to financial instruments. Non-financial assets or liabilities of foreign operations are excluded. Forecast sales and purchases in foreign currencies have not been included in the table above as they are not financial instruments.
as at 30 June 2012 a movement of 10% in the New Zealand dollar would impact the income statement and statement of changes in equity as detailed in the table below:
Impact on:
Net earnings before income tax (9) (4) 8 3
equity (before income tax) 15 (87) (11) 81
this analysis assumes a movement in the New Zealand dollar across all currencies and only includes the effect of foreign exchange movements on financial instruments. all other variables remain constant.
performance
Telecom Annual Report 2012120 |

GROUP
YEAR ENDED 30 JUNE 2012
WEIGHTED EFFECTIVE
INTEREST RATE
WITHIN 1 YEAR
1–2 YEARS
2–3 YEARS
3–4 YEARS
4–5 YEARS
GREATER THAN
5 YEARS TOTAL
(DOLLARS IN MILLIONS) NZ$M NZ$M NZ$M NZ$M NZ$M NZ$M NZ$M NZ$M
GROUP
YEAR ENDED 30 JUNE 2011
WEIGHTED EFFECTIVE
INTEREST RATE
WITHIN 1 YEAR
1–2 YEARS
2–3 YEARS
3–4 YEARS
4–5 YEARS
GREATER THAN
5 YEARS TOTAL
(DOLLARS IN MILLIONS) NZ$M NZ$M NZ$M NZ$M NZ$M NZ$M NZ$M NZ$M
GROUP 100 BASIS POINT DECREASE 100 BASIS POINT INCREASE
YEAR ENDED 30 JUNE 2012 2011 2012 2011(DOLLARS IN MILLIONS) NZ$M NZ$M NZ$M NZ$M
Interest rate riskTelecom employs the use of derivative financial instruments for the purpose of reducing its exposure to fluctuations in interest rates.
Telecom uses cross-currency interest rate swaps to convert foreign currency borrowings into floating rate New Zealand dollar positions. Interest rate swaps are used to convert certain floating rate positions into fixed rate positions. As a consequence, Telecom’s interest rate positions are limited to New Zealand yield curves. Telecom’s objectives of interest rate risk management is to minimise the cost of net borrowings and to minimise the impact of interest rate movements on Telecom’s interest expense and net earnings within policies approved by the Telecom board.
Interest rate repricing analysis The following table indicates the effective interest rates and the earliest period in which recognised financial instruments reprice. Fixed rate balances are presented, including the effect of derivative financial instruments, hedging both interest rates and foreign exchange.
Floating rate:
Cash 1.5% 185 – – – – – 185
Long-term debt 4.2% (300) – – – – – (300)
Short-term debt 3.0% (95) – – – – – (95)
Fixed rate:
Long-term debt 7.0% (312) (3) (73) (150) – (110) (648)
(522) (3) (73) (150) – (110) (858)
Floating rate:
Cash and collateral funds balances 2.0% 434 – – – – – 434
Long-term debt 6.3% (142) – – – – – (142)
Short-term debt 3.0% (35) – – – – – (35)
Fixed rate:
Long-term debt 7.7% (485) (570) (380) (73) (150) (733) (2,391)
Short-term debt 4.7% (11) (10) (8) (6) (23) – (58)
(239) (580) (388) (79) (173) (733) (2,192)
Telecom has not entered into any interest rate swaps to hedge interest payments of forecast short-term debt for the year ended 30 June 2012 (30 June 2011: NZ$58 million).
Financial instruments with rates fixed for 90 days or less are deemed to be floating rate exposures.
As at 30 June 2012 a movement of 100 basis points would impact the income statement and statement of changes in equity (after hedging) as detailed in the table below:
Impact on:
Net earnings before income tax (1) – 1 –
Equity (before income tax) (1) (15) 1 14
This analysis assumes all other variables remain constant.
| 121investor.telecom.co.nz

GROUP
YEAR ENDED 30 JUNE 2012CARRYING AMOUNT
CONTRACTUAL CASH FLOWS
0–6 MONTHS
6–12 MONTHS
1–2 YEARS
2–3 YEARS
3–4 YEARS
4–5 YEARS
5+ YEARS
(DOLLARS IN MILLIONS) NZ$M NZ$M NZ$M NZ$M NZ$M NZ$M NZ$M NZ$M NZ$M
GROUP
YEAR ENDED 30 JUNE 2011CARRYING AMOUNT
CONTRACTUAL CASH FLOWS
0–6 MONTHS
6–12 MONTHS
1–2 YEARS
2–3 YEARS
3–4 YEARS
4–5 YEARS
5+ YEARS
(DOLLARS IN MILLIONS) NZ$M NZ$M NZ$M NZ$M NZ$M NZ$M NZ$M NZ$M NZ$M
Liquidity riskLiquidity risk represents Telecom’s ability to meet its contractual obligations. Telecom evaluates its liquidity requirements on an ongoing basis.
In general, Telecom generates sufficient cash flows from its operating activities to meet its financial liabilities.
In the event of any shortfalls, Telecom has two short-term financing programmes in place; a US$1 billion European Commercial Paper Programme and a NZ$500 million Note Facility. In addition to the short-term financing programmes at 30 June 2012, Telecom had undrawn committed stand-by facility of NZ$600 million (30 June 2011: NZ$700 million) with a number of creditworthy banks and a committed two-and three-year bank facility totalling NZ$400 million, of which NZ$300 million was drawn at 30 June 2012 (30 June 2011: nil). As at 30 June 2012 Telecom also had committed overdraft facilities of NZ$20 million with New Zealand banks and A$5 million with Australian banks. There are no compensating balance requirements associated with these facilities. Telecom’s liquidity policy is to maintain unutilised committed facilities and available cash of at least 100% of the next 12 months’ net funding requirements. The policy also requires that the maximum amount of long-term debt maturing in any financial year is not to exceed NZ$400 million. Net debt must have a weighted average life of between 2.5 and 6.0 years.
As at 30 June 2012 management considered that it was in compliance with its liquidity policy as reported to Telecom’s board of directors. In addition to this assessment of compliance with Telecom’s liquidity policy, the exposure to liquidity risk based on contractual cash flows relating to financial liabilities is summarised below:
Non-derivative financial liabilities
Trade accounts payable 443 443 443 – – – – – –
Finance lease payable 10 11 3 3 4 1 – – –
Short-term debt 95 95 95 – – – – – –
Long-term debt 917 1,037 20 336 125 296 167 5 88
Derivative financial liabilities
Interest rate swaps (net settled) 6 6 1 1 2 1 1 – –
Gross cross-currency interest rate
Inflows – (110) – (4) (4) (4) (5) (5) (88)
Outflows 17 144 2 2 4 5 5 5 121
Gross forward exchange contracts
Inflows – (133) (73) (59) (1) – – – –
Outflows 3 137 75 61 1 – – – –
1,491 1,630 566 340 131 299 168 5 121
Non-derivative financial liabilities
Trade accounts payable 597 597 597 – – – – – –
Short-term debt 93 93 93 – – – – – –
Long-term debt 2,004 2,465 363 62 701 402 120 190 627
Derivative financial liabilities
Interest rate swaps (net settled) 151 185 33 30 45 25 15 12 25
Gross cross-currency interest rate
Inflows – (1,413) (353) (29) (29) (374) (16) (16) (596)
Outflows 495 2,215 664 22 59 437 55 59 919
Gross forward exchange contracts
Inflows – (203) (158) (35) (9) (1) – – –
Outflows 17 222 168 40 13 1 – – –
3,357 4,161 1,407 90 780 490 174 245 975
performance
Telecom Annual Report 2012122 |

GROUP
YEAR ENDED 30 JUNE 2012 2011(DOLLARS IN MILLIONS) NZ$M NZ$M
GROUP
YEAR ENDED 30 JUNE 2012 2011 2010(DOLLARS IN MILLIONS) NZ$M NZ$M NZ$M
Contractual cash flows include contractual undiscounted principal and interest payments. Telecom uses cash and derivative assets to manage liquidity.
Credit riskIn the normal course of its business, Telecom incurs credit risk from financial instruments if a counterparty fails to meet its contractual obligations. Credit risk arises on cash, short-term investments, advances to associate companies, trade receivables, other receivables, finance lease receivables and derivative financial instruments.
Telecom has a credit policy that is used to manage this exposure to credit risk. As part of this policy, limits on exposures with significant counterparties have been set and approved by the board of directors and are monitored on a regular basis. Telecom’s financial instruments do not have significant concentration of risk with any single party.
Telecom has certain derivative and debt agreements that are subject to bilateral credit support agreements that require Telecom or the counterparty to post collateral funds to support the value of certain derivatives. As at 30 June 2012 no collateral was posted (30 June 2011: US$91 million (NZ$110 million). In the event of a downgrade of Telecom’s credit rating to either Baa1 (Moody’s Investors Service) or BBB+ (Standard & Poor’s) US$3 million (based on rates at 30 June 2012) of collateral would be required to be posted.
Telecom places its cash, short-term investments and derivative financial instruments with high credit quality financial institutions and sovereign bodies and limits the amount of credit exposure to any one financial institution. These limits are monitored daily. There is no significant concentration of credit risk with respect to trade receivables.
NZ$1,038 million of Telecom’s assets are subject to credit risk (30 June 2011: NZ$1,222 million). Telecom holds various letters of credit and guarantees over some of these amounts. Telecom does not hold any collateral over these amounts.
Finance lease receivables, other than those relating to asset and property usage agreements with Chorus, are secured over the underlying assets.
Telecom’s only financial assets that are past their due payment date are trade receivables. Telecom’s trade receivables are aged as follows:
Current 264 225
0–30 days past due 100 182
30–60 days past due 22 36
60–90 days past due 8 14
90+ days past due 28 38
422 495
Telecom has NZ$140 million (30 June 2011: NZ$245 million) of financial assets that are overdue and not impaired.
Telecom maintains a provision for estimated losses expected to arise from customers being unable to make required payments. This provision takes into account known commercial factors impacting specific customer accounts, as well as the overall profile of Telecom’s receivables portfolio. In assessing the provision, factors such as past collection history, the age of receivable balances, the level of activity in customer accounts, as well as general macro-economic trends, are taken into account. Significant changes in these factors would likely necessitate changes in the doubtful debts provision. At present, however, Telecom considers the current level of its allowance for doubtful accounts to be adequate to cover expected credit losses on trade receivables. The provision balance is maintained at an entity-wide level and allocated against individual balances once non-collectability is highly probable. Bad debt expenses are reported as other operating expenses in the income statement.
Movements in the allowance for doubtful accounts are as follows:
Balance at beginning of the year 25 24 29
Charged to costs and expenses 12 21 22
Bad debts recovered (3) (3) (5)
Utilised (16) (17) (22)
Balance at end of the year 18 25 24
| 123investor.telecom.co.nz

GROUP
YEAR ENDED 30 JUNE 2012 2011(DOLLARS IN MILLIONS) NZ$M NZ$M
GROUP
YEAR ENDED 30 JUNE 2012 2011(DOLLARS IN MILLIONS) NZ$M NZ$M
Equity riskInvestments that subject Telecom to equity risk include long-term investments in listed and unlisted companies, as well as investments in associate companies. Telecom’s exposure to equity risk as at 30 June 2012 was NZ$57 million (30 June 2011: NZ$125 million). Telecom manages its exposure to equity risk through representation on the board of investee companies or through regular reviews of the investee’s current and projected performance. A 10% movement in quoted prices of shares in Telecom’s listed investment, being Hutchison, would increase or decrease Telecom’s equity by NZ$5 million (30 June 2011: NZ$12 million).
Capital risk managementTelecom manages its capital considering shareholders’ interests, the value of Telecom’s assets and Telecom’s credit ratings. The following table summarises Telecom’s capital:
Cash (185) (324)
Collateral funds – (110)
Short-term debt (note 20) 95 93
Long-term debt at hedged rates 949 2,538
Net debt 859 2,197
Equity 1,642 2,311
Capital 2,501 4,508
The board continues to be committed to Telecom maintaining ‘single A’ credit ratings from both Moody’s Investors Service and Standard & Poor’s and its capital management policies are designed to ensure this objective is met. As part of this commitment, Telecom now manages its debt levels to ensure that the ratio of net interest-bearing debt (inclusive of associated derivatives) to EBITDA does not materially exceed 1.1 times on a long-run basis, which for credit ratings agency purposes equates approximately to debt to EBITDA of 1.5 times. The difference between these two ratios is primarily due to the capitalisation of operating leases by credit ratings agencies.
At 30 June 2012 Telecom’s credit rating for long-term and short-term debt with Moody’s Investors Service was A3 and P-2 respectively, with outlook stable. Standard & Poor’s ratings for long-term and short-term debt was A- and A-2 respectively, with outlook stable.
Net debt includes long-term debt at the value of hedged cash flows due to arise on maturity, plus short-term debt, less any cash and short-term investments. Net debt is a non-GAAP measure, is not defined in accordance with IFRS, but is a measure used by management. The following table reconciles long-term debt at hedged rates to long-term debt at spot rates as reported under IFRS.
Long-term debt (note 22) 917 2,004
Impact of hedged rates used 31 528
Unamortised discount 1 6
Long-term debt at hedged rates 949 2,538
performance
Telecom Annual Report 2012124 |

GROUP
2012 2011YEAR ENDED 30 JUNE ASSETS LIABILITIES ASSETS LIABILITIES
(DOLLARS IN MILLIONS) NZ$M NZ$M NZ$M NZ$M
GROUP
YEAR ENDED 30 JUNE 2012 2011(DOLLARS IN MILLIONS) NZ$M NZ$M
Hedging activitiesTelecom is exposed to market risk primarily from changes in interest rates and foreign currency exchange rates. Telecom employs risk management strategies, including the use of derivatives such as interest rate swaps, forward exchange contracts, foreign currency options and cross-currency interest rate swaps to manage these exposures.
Telecom does not currently hold or issue derivative financial instruments for trading purposes.
Each derivative that is designated for hedge accounting purposes is classified as either:
• A hedge of the variability of the cash flows of recognised liabilities (a cash flow hedge); or
• A hedge of a highly probable forecast transaction (a cash flow hedge).
The fair values of derivatives in hedging relationships and derivatives not designated in hedging relationships are as follows:
Cash flow hedges
Forward exchange contracts 2 (3) – (17)
Interest rate swaps – (6) – (151)
Cross-currency interest rate swaps – (17) 40 (423)
Currency options – – 1 –
2 (26) 41 (591)
Derivatives not designated in hedge relationships – classified as fair value through the profit and loss
Forward exchange contracts – – 1 –
Cross-currency interest rate swaps – – – (72)
– – 1 (72)
Total derivative assets/(liabilities) 2 (26) 42 (663)
Cash flow hedgesTelecom uses cross-currency interest rate swaps and interest rate swaps to manage interest and foreign exchange risk on debt. These swaps are jointly designated as cash flow hedges of the forecast interest and principal cash flows of the debt.
The changes in the fair values of interest rate derivatives accumulated in equity are expected to be reclassified to finance expense as interest payments occur, over the remaining life of the swaps. These fair values by maturity are as follows:
Maturity:
Less than 1 year – 2
1 to 2 years – (4)
2 to 3 years – (10)
3 to 4 years – –
4 to 5 years – (1)
Maturity over 5 years 9 (61)
9 (74)
Telecom enters into forward exchange contracts to hedge foreign currency purchases. The majority of the purchases are forecast to be made within 12 months of 30 June 2012.
When in a hedging relationship, the fair value of foreign exchange forward contracts will be included in the income statement at the same time as the underlying purchase impacts the determination of income. If the purchase relates to an operating expense, the fair value will be recognised when the underlying expense is recognised. If the purchase relates to an item of property, plant and equipment or intangible assets, the fair value will be recognised in the income statement as the asset depreciates or is amortised (see depreciation accounting policy in note 1). If the purchase relates to an inventory item, the fair value will be recognised in the income statement when the underlying inventory is expensed.
| 125investor.telecom.co.nz

2012 2011 2010
GROUP
YEAR ENDED 30 JUNEBEFORE
TAX
TAX CREDIT/
(EXPENSE)NET OF
TAXBEFORE
TAX
TAX CREDIT/
(EXPENSE)NET OF
TAXBEFORE
TAX
TAX CREDIT/
(EXPENSE)NET OF
TAX
(DOLLARS IN MILLIONS) NZ$M NZ$M NZ$M NZ$M NZ$M NZ$M NZ$M NZ$M NZ$M
PARENT
YEAR ENDED 30 JUNE 2011FAIR
VALUEAMORTISED
COST TOTAL
(DOLLARS IN MILLIONS) NZ$M NZ$M NZ$M
PARENT
YEAR ENDED 30 JUNE 2012FAIR
VALUEAMORTISED
COST TOTAL
(DOLLARS IN MILLIONS) NZ$M NZ$M NZ$M
During the period all hedged forecast transactions (aside from those related to Demerger) occurred as expected. Aside from those that related to Demerger, this did not cause any cash flow hedge relationships to no longer qualify for hedge accounting with no resulting foreign exchange loss transferred from the cash flow hedge reserve to the income statement (year ended 30 June 2011: nil).
During Demerger the prepayment of bonds and associated derivatives that were in a cash flow hedge relationship resulted in a net loss being transferred from the cash flow hedge reserve to the income statement. This is included in the NZ$110 million debt restructuring costs (see note 9: Discontinued Operations).
A reconciliation of movements in the cash flow hedge reserve follows:
Balance at beginning of the year (59) (32) (41)
Gain/(loss) recognised in other comprehensive income 66 (18) 48 (134) 40 (94) (106) 31 (75)
Amount reclassified from cash flow hedge reserve to finance expense 24 (7) 17 73 (22) 51 68 (20) 48
Amount reclassified from cash flow hedge reserve to property, plant and equipment/intangible assets (17) 4 (13) 17 (4) 13 17 (5) 12
Amount reclassified from cash flow hedge reserve to inventory 1 – 1 4 (1) 3 28 (8) 20
Amount reclassified to other operating expenses as a result of cash flow hedges no longer effective for hedge accounting – – – – – – 6 (2) 4
Total movements to other comprehensive income 74 (21) 53 (40) 13 (27) 13 (4) 9
Balance at the end of the year (6) (59) (32)
Net investment hedgesNet investment hedges relate to hedges of the effect of movements in forward exchange rates on certain assets held in overseas subsidiaries. The effective portion of any gain or loss on hedges of net investments in foreign operations is recognised in equity and the gain or loss relating to any ineffective portion is recognised immediately in the income statement. All net investment hedges were closed out on the wind up of TCNZ Finance Limited’s Australia Branch in November 2011 and any gains and losses will remain equity until the foreign operation is disposed of. There was no ineffectiveness on net investment hedging relationships during the year ended 30 June 2012 (year ended 30 June 2011: nil).
Parent CompanyThe Parent Company’s financial instruments are classified under IAS 39 and IFRS 9 and are as follows:
Current assets: Receivables due from subsidiaries – 1 1
Non-current assets: Long-term investments – 2,727 2,727
Current liabilities: Debt due within one year – (4,241) (4,241)
Non-current liabilities: Long-term provisions (1,897) – (1,897)
Current assets: Receivables due from subsidiaries – 1,611 1,611
Non-current assets: Long-term investments – 2,727 2,727
Current liabilities: Debt due within one year – (5,924) (5,924)
Non-current liabilities: Long-term provisions (2,741) – (2,741)
The Parent Company has no derivative financial instruments and has no financial assets that are measured at fair value.
performance
Telecom Annual Report 2012126 |

PARENT
YEAR ENDED 30 JUNECARRYING AMOUNT
CONTRACTUAL CASH FLOWS
0–6 MONTHS
(DOLLARS IN MILLIONS) NZ$M NZ$M NZ$M
GROUP
YEAR ENDED 30 JUNE 2012 2011(DOLLARS IN MILLIONS) NZ$M NZ$M
Currency riskLong-term debt amounts are denominated in Australian dollars. The Parent Company does not take any action to reduce its exposure to any resulting currency risk, as long-term debt relates to amounts owed to wholly-owned subsidiaries.
Interest rate riskThe Parent Company has interest rate exposures on some loans to and from subsidiary companies. The Parent Company does not manage the associated risks.
Liquidity riskThe Parent Company’s maximum exposure to liquidity risk relating to financial liabilities is summarised below.
Debt due to subsidiaries:
30 June 2012 (4,241) (4,241) (4,241)
30 June 2011 (5,924) (5,924) (5,924)
Credit riskThe Parent Company has exposure to credit risk from balances owed from subsidiary companies. The maximum exposure to credit risk at 30 June 2012 is NZ$2,728 million (30 June 2011: NZ$4,338 million).
Equity riskThe Parent Company has exposure to equity risk by way of its investments in subsidiaries. The maximum exposure at 30 June 2012 is NZ$5,402 million (30 June 2011: NZ$6,029 million).
Hedging activitiesThe Parent Company has no material hedging activities.
Note 26 CommitmentsOperating lease commitments – Telecom as lessee Telecom has entered into commercial leases on properties, network infrastructure, motor vehicles and other items of equipment. Certain leases are subject to Telecom being able to renew or extend the lease period based on terms that would then be agreed with the lessor. There are no other significant lease terms that relate to contingent rents, purchase options or other restrictions on Telecom.
Future minimum rental commitments for all non-cancellable operating leases are:
Less than 1 year 91 100
Between 1 and 5 years 280 250
More than 5 years 275 278
646 628
| 127investor.telecom.co.nz

GROUP UNDISCOUNTED DISCOUNTED
YEAR ENDED 30 JUNE 2012 2012(DOLLARS IN MILLIONS) NZ$M NZ$M
GROUP UNDISCOUNTED DISCOUNTED UNDISCOUNTED DISCOUNTED
YEAR ENDED 30 JUNE 2012 2012 2011 2011(DOLLARS IN MILLIONS) NZ$M NZ$M NZ$M NZ$M
Finance lease payable – Telecom as lesseeTelecom has entered into commercial finance leases on a range of information and communications technology equipment for internal Telecom use. The profile of lease payments (excludes Chorus leases) is set out below:
Less than 1 year 6 6
Between 1 and 5 years 5 4
Total minimum future lease payments 11 10
Unguaranteed residual value – –
Gross finance lease payable 11 10
Less unearned finance expense (1) –
Present value of minimum finance lease payments 10 10
Finance lease receivables – Telecom as lessorTelecom has entered into commercial finance leases on a range of information and communications technology equipment for Telecom business customers. The profile of lease receipts (excludes Chorus leases) is set out below:
Less than 1 year 33 31 24 22
Between 1 and 5 years 41 34 32 26
More than 5 years 1 – 1 1
Total minimum future lease receipts 75 65 57 49
Unguaranteed residual value 2 2 2 2
Gross finance lease receivable 77 67 59 51
Less unearned finance income (10) N/A (8) N/A
Present value of minimum lease receivable 67 67 51 51
Minimum lease receipts – short term – 31 – 22
Minimum lease receipts – long term – 36 – 29
Allowance for uncollectable lease payments 1 1 1 1
There are no contingent rents recognised as income in the year ended 30 June 2012 (2011: nil).
The interest rate inherent in the leases is fixed at the contract date for the entire lease term.
Finance lease receivable above balances are secured over the equipment leased. Telecom is not permitted to sell or repledge the collateral in the absence of a default by the lessee.
The maximum credit risk exposure for finance lease receivables is the carrying amount of the receivables. Other than the allowance for uncollectable lease payments noted above, the finance lease receivables at 30 June 2012 are neither past due nor impaired.
Finance leases with ChorusOn Demerger, Telecom entered into a number of leases with Chorus for space in exchange buildings. Under these leases, Telecom is:
• a lessor for space in Telecom exchanges; and
• a lessee for space in Chorus exchanges
These leases are generally accounted for as finance leases and include a legal right of offset as Telecom and Chorus settle the payments on a net basis. As such the finance lease payable and finance lease receivable are shown as a net finance lease receivable on the statement of financial position. There are no contingent rents on the leases with Chorus.
performance
Telecom Annual Report 2012128 |

TELECOM AS LESSOR TELECOM AS LESSEE NET
GROUP UNDISCOUNTED DISCOUNTED UNDISCOUNTED DISCOUNTED UNDISCOUNTED DISCOUNTED
YEAR ENDED 30 JUNE 2012 2012 2012 2012 2012 2012 (DOLLARS IN MILLIONS) NZ$M NZ$M NZ$M NZ$M NZ$M NZ$M
The profile of lease net receipts is set out below.
Less than 1 year 14 14 (6) (6) 8 8
Between 1 and 3 years 28 24 (13) (11) 15 13
Between 3 and 5 years 28 20 (13) (9) 15 11
More than 5 years 417 99 (22) (13) 395 86
Total expected future lease receipts/(payments) 487 157 (54) (39) 433 118
Unguaranteed residual value – – – – – –
Finance lease receivable/(payable) 487 157 (54) (39) 433 118
Less unearned finance expense/(income) (330) N/A 15 N/A (315) N/A
Present value of finance lease receivable/(payable) 157 157 (39) (39) 118 118
Expected lease receipts/(payments) – short term 14 (6) 8
Expected lease receipts/(payments) – long term 143 (33) 110
Allowance for uncollectable lease payments – – –
The term of the leases when Telecom is the lessor is for 10 years, with multiple rights of renewal for a further 25 years. The term of the leases when Telecom is the lessee is for three years, with rights of renewal for a further six years. The full term has been used in the calculation of the finance leases payable and receivable as it is likely that due to the specialised nature of the building the leases will be renewed to the maximum term.
Other commitmentsAt 30 June 2012 capital expenditure amounting to NZ$110 million (30 June 2011: NZ$81 million) had been committed under contractual arrangements, in addition, Telecom has an agreement with Optus to on-sell NZ$31 million of this cable capacity. The capital expenditure commitments principally relate to telecommunications network assets.
As at 30 June 2012 Telecom had other supplier commitments of NZ$238 million, NZ$124 million and NZ$31 million for the years ending 30 June 2013, 2014 and 2015 respectively.
| 129investor.telecom.co.nz

Note 27 ContingenciesLawsuits and other claimsWhere Telecom concludes that its defence will more likely than not be successful, such lawsuits or claims are considered a contingent liability and no provision is recognised. When it is more likely than not that Telecom will be liable and that there will be an outflow of resources to settle a lawsuit or claim, a provision is recognised, unless the amount cannot be measured reliably. There can be no assurance that such litigation will not have a material adverse effect on Telecom’s business, financial condition or results of operations.
New ZealandIn March 2004 the Commerce Commission (the Commission) issued proceedings against Telecom claiming that its implementation and maintenance of new retail and wholesale high-speed data transmission service pricing from 1998 constituted a breach by Telecom of section 36 of the Commerce Act (abuse of a dominant position/taking advantage of market power). The Commission sought a declaration that section 36 of the Commerce Act was breached, a pecuniary penalty, and costs. The applicable pecuniary penalty provisions were partly under the old penalty regime (maximum of NZ$5 million) and partly under the new regime (which provides for penalty of the greater of (i) NZ$10 million; or (ii) three times any commercial gain (if it can be ascertained) or 10% of the turnover). The hearing of the Commission’s claim took place in the High Court from June to August 2008. A reserved judgment was delivered in October 2009 in which the Court found that, although most of Telecom’s pricing was not anti-competitive, the pricing of two tail circuits between March 2001 and late 2004 breached section 36 of the Commerce Act. There was insufficient evidence to ascertain the scope of the breach. Telecom appealed to the Court of Appeal and the Commission cross-appealed the points decided in Telecom’s favour. The penalty hearing took place in the High Court in December 2010 and a reserve judgment was delivered on 19 April 2011 ordering that Telecom pay a pecuniary penalty of NZ$12 million. Telecom paid this penalty but also appealed the penalty judgment to the Court of Appeal. The Court of Appeal judgment on liability was released on 27 June 2012. The judgment dismissed Telecom’s appeal against part of the High Court liability judgment, allowed the Commission’s cross-appeal against the High Court judgment and extended the scope of Telecom’s liability to cover pricing on certain elements that the High Court liability judgment had held not to be in breach of section 36 of the Commerce Act. The Court of Appeal judgment on penalty was released on 3 August 2012 reaffirming the penalty imposed by the High Court.
In July 2000 the Commission issued a proceeding against Telecom claiming that the introduction of 0867 constituted a use by Telecom of its dominant position for proscribed purposes. The Commission sought a declaration that this contravened section 36 of the Commerce Act, a pecuniary penalty, and costs. There was a six-week trial in the Auckland High Court, which concluded on 26 September 2007. In a judgment issued on 16 April 2008 the High Court dismissed the Commission’s proceeding, holding that Telecom’s introduction of 0867 did not breach section 36 of the Commerce Act. The Commission appealed the judgment. Telecom
applied to support the judgment on an additional ground. The appeal was heard in March 2009. Telecom was successful in the appeal as the Court of Appeal judgment released on 4 August 2009 dismissed the Commission’s appeal. The Commission successfully applied for leave to appeal to the Supreme Court. The Attorney General intervened on the basis that the counterfactual test should not continue to be the sole causative test under section 36. The Supreme Court hearing was held in June 2010 and the Court delivered its judgment on 1 September 2010. The Supreme Court dismissed the Commission’s appeal and ordered the Commission to pay Telecom costs of $50,000. During FY12 Telecom settled its outstanding claim for costs in the High Court with the Commission.
On 2 August 2011 Telecom and Vodafone announced that they had entered a full and final settlement of the various proceedings that they had initiated in relation to the Commission’s TSO determinations for FY04, FY05, FY06, FY07 and FY08. The terms of the settlement are confidential to the parties. The settlement followed the Supreme Court hearing in February 2011 of Telecom’s and Vodafone’s appeals in respect of the determinations for FY04, FY05, and FY06. The Supreme Court has issued a judgment in respect of the appeals, dismissing each of Telecom and Vodafone’s appeals as moot and dismissing the Commerce Commission’s appeal in respect of the FY05 and FY06 determinations. Any residual issues are allocated to Chorus under the Demerger Asset Allocation Plan and subject to the terms of a Separation Deed between Telecom and Chorus.
Telecom was joined as one of numerous respondents in a claim lodged through the Weathertight Homes Resolution Services (WHRS). The claim related to a property development site called ‘Ellerslie Park’ where Telecom installed external telephone junction boxes. Telecom unsuccessfully applied to strike out the claim against it in 2007. Negotiations resulted in a conditional settlement of the claim against Telecom that was conditional upon Telecom being removed as a party to the claim. A joint removal application was endorsed by the claimants and Telecom and filed with the WHRS. Any residual issues are allocated to Chorus under the Demerger Asset Allocation Plan and subject to the terms of a Separation Deed between Telecom and Chorus.
In October 2010 the Commission announced the commencement of an investigation into Telecom’s alleged breach of the Operational Separation Undertakings (the obligation not to discriminate) in respect of Chorus’ provision of Sub Loop Extension Services (SLES) and Telecom Wholesale’s failure to provide Unbundled Bitstream Access (UBA) with Sub Loop Unbundling (SLU) and SLES. On 26 May 2011 the Commission announced that it had decided to issue enforcement proceedings alleging that Telecom is likely to have discriminated in breach of the Operational Separation Undertakings by failing to provide other telecommunications service providers with UBA in conjunction with SLES, when it provided an equivalent service to its own retail business. A settlement of this matter was entered into in October 2011 between Telecom, the Commerce Commission, Vodafone, Kordia, Orcon, Callplus, Airnet and Compass, pursuant to which the total sum of $31.6 million was paid by Telecom to compensate the various service providers, in agreed amounts. Any residual issues arising out of this matter are allocated to
performance
Telecom Annual Report 2012130 |

Chorus under the Demerger Asset Allocation Plan and subject to the terms of a Separation Deed between Telecom and Chorus.
Under New Zealand law and Inland Revenue practice, tax positions taken by Telecom remain subject to review and possible adjustment by Inland Revenue, generally for a period of four years from the end of the tax year or return period in which the relevant tax return was provided. Inland Revenue reviewed Telecom’s tax position with reference to interest income earned by Telecom subsidiaries tax resident outside of New Zealand. Inland Revenue took the position (in a Notice of Proposed Adjustment (NOPA) issued on 11 August 2011 in respect of the 2008 income year) that the income in question should be taxed as if it had been earned by a New Zealand tax resident. Telecom responded, rejecting Inland Revenue’s NOPA. In February 2012 Inland Revenue and Telecom agreed to settle the dispute based on confidential terms.
Certain ongoing litigation was allocated between Chorus and Telecom. The allocated party will manage the allocated litigation at their cost, with indemnities in place to ensure that the party to which they are allocated bears the economic risk of that litigation. The Separation Deed provides that claims under the indemnities must exceed a certain minimum claim amount and (other than those in relation to litigation) be brought before 30 June 2014. In addition, the amount payable under the indemnities and other claims under the Separation Deed is limited to NZ$300 million.
All of the proceedings summarised above have been commenced in the High Court of New Zealand unless otherwise stated.
Other claimsVarious other lawsuits, claims, investigations (including tax investigations) and inquiries have been brought, are pending or are in process against Telecom and its subsidiaries, none of which are expected by Telecom to have a significant effect on the financial position or profitability of Telecom. However, Telecom cannot reasonably estimate the adverse effect on Telecom if any of the foregoing outstanding claims or inquiries are ultimately resolved against Telecom’s interests. There can be no assurance that such cases will not have a significant effect on Telecom’s business, financial condition, position, results of operations or profitability.
Land claims As previously stated in note 17, interests in land included in property, plant and equipment purchased from the Government may be subject to claims to the Waitangi Tribunal or deemed to be wāhi tapu and, in either case, may be resumed by the Government. Certain claims have been brought or are pending against the Government under the Treaty of Waitangi Act 1975. Some of these claims may affect land transferred to Telecom by the Government. In the event that land is resumed by the Government, there is provision for compensation to Telecom.
Bank guaranteesTelecom has issued bank guarantees totalling A$10 million as at 30 June 2012 (30 June 2011: A$13 million) to guarantee rental payments of a subsidiary company. In the event of the subsidiary defaulting on these rental payments then Telecom has guaranteed to pay these amounts. The likelihood of any payment being made under this guarantee is low.
Cross-border lease guaranteesTelecom has cross-border leases in respect of certain telecommunications assets, which provides certain undertakings (including letters of credit) in accordance with guarantees entered into as part of the transactions. The maximum exposure under these guarantees is now assessed at NZ$13 million (30 June 2011: NZ$29 million) and the last guarantee expires in 2014.
Parent CompanyThe Parent Company has guaranteed, along with guaranteeing subsidiary companies, total indebtedness of TCNZ Finance Limited (a Telecom Group company) amounting to NZ$1,037 million (30 June 2011: NZ$2,759 million).
The Parent Company has also agreed to indemnify Telecom Trustee Limited, a Telecom subsidiary, for any losses incurred on the sale of Telecom shares held by the Trust. Accordingly, where the revaluation of these shares results in a carrying value below historic cost, an equivalent receivable from the Parent Company is recognised by Telecom Trustee Limited.
| 131investor.telecom.co.nz

GROUP
YEAR ENDED 30 JUNE 2012 2011 2010(DOLLARS IN MILLIONS) NZ$M NZ$M NZ$M
Note 28 Related party transactionsInterest of directors in certain transactionsCertain Telecom directors have relevant interests in a number of companies with which Telecom has transactions in the normal course of business and a number of Telecom’s directors are also non-executive directors of other companies. Any transactions undertaken with these entities have been entered into on an arm’s length commercial basis.
Key management personnel costs are presented in note 5.
Other transactions with associate companiesTelecom has the following transactions with associates:
• Telecom provides network operations and management services to Southern Cross in respect of its operations in New Zealand;
• Telecom makes payments to Southern Cross in connection with capacity it has purchased on Southern Cross’ network; and
• Telecom provides wholesale telecommunications services to Community Telco Australia Pty Limited.
Transactions undertaken with these entities have been entered into on an arm’s length commercial basis. Balances in respect of these transactions with associate companies are set out in the table below.
Revenue received from associates1 96 110 95
Expenses paid to associates 10 9 8
Capacity acquired from associates2,3 1 4 48
Receivables from associates 7 8 8
1 Includes dividends received from Southern Cross of NZ$58 million in 2012 (30 June 2011: NZ$71 million; 30 June 2010: NZ$63 million).
2 Telecom’s intangible assets includes capacity acquired from Southern Cross, with a cost of NZ$586 million (30 June 2011: NZ$564 million; 30 June 2010: NZ$560 million) and accumulated amortisation of NZ$338 million (30 June 2011: NZ$320 million; 30 June 2010: NZ$289 million).
3 At 30 June 2012 Telecom has committed to purchases of NZ$79 million for cable capacity from Southern Cross.
Parent CompanyAmounts due from subsidiary companies are for no fixed term and incur interest at interest rates that range from nil to 10%. Debts due to subsidiary companies within one year are for no fixed term and incur interest at a weighted average interest rate of 7.6% at 30 June 2012 (30 June 2011: 7.2%).
Note 29 SubsidiariesAs at 30 June 2012 the significant companies of the Telecom Group and their activities were as follows:
COUNTRY OWNERSHIP PRINCIPAL ACTIVITY
TCNZ Australia Investments Pty Limited Australia 100% A holding company
Telecom New Zealand International
Australia Pty Limited Australia 100% Provides international wholesale telecommunications services
Gen-i Australia Pty Limited Australia 100% Provides outsourced telecommunications services
AAPT Limited Australia 100% Provides value-added telecommunications services
PowerTel Limited Australia 100% Provides wholesale telecommunications services
TCNZ (Bermuda) Limited Bermuda 100% A holding company
Telecom Cook Islands Limited Cook Islands 60% Provides telecommunications services in the Cook Islands
Telecom New Zealand Limited New Zealand 100% Provides local, national and international telephone and data services
Telecom Mobile Limited New Zealand 100% Provides mobile telecommunications services
Xtra Limited New Zealand 100% Internet service provider
Telecom Retail Holdings Limited New Zealand 100% Retailer of telecommunications products and services
Telecom IP Limited New Zealand 100% Owns Group intellectual property
TCNZ Finance Limited New Zealand 100% A Group finance company
Telecom Southern Cross Limited New Zealand 100% A holding company
Telecom New Zealand UK Limited United Kingdom 100% Provides international wholesale telecommunications services
Telecom New Zealand USA Limited United States 100% Provides international wholesale telecommunications services
Telecom Rentals Limited New Zealand 100% Leases telecommunications equipment to third parties
Telecom Leasing Limited New Zealand 100% Procures and leases assetsTelco Insurance Limited Bermuda 100% A Group insurance company
The financial year end of all significant subsidiaries is 30 June.
performance
Telecom Annual Report 2012132 |
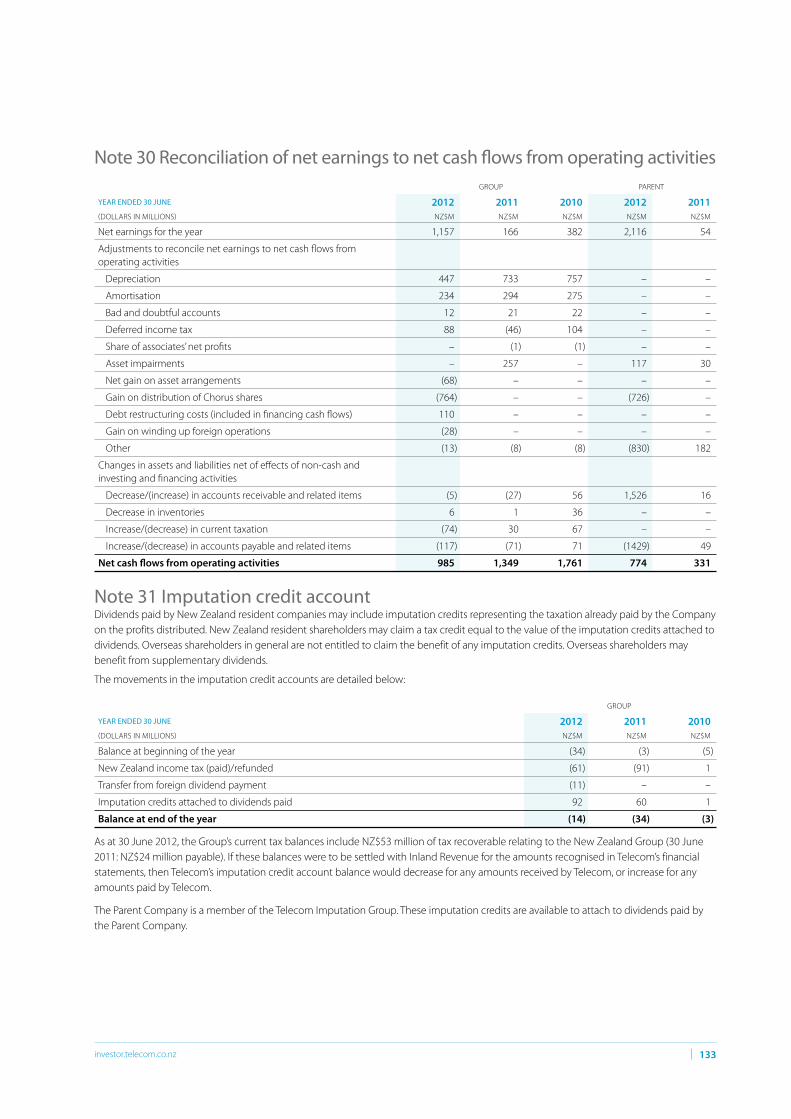
GROUP PARENT
YEAR ENDED 30 JUNE 2012 2011 2010 2012 2011(DOLLARS IN MILLIONS) NZ$M NZ$M NZ$M NZ$M NZ$M
GROUP
YEAR ENDED 30 JUNE 2012 2011 2010(DOLLARS IN MILLIONS) NZ$M NZ$M NZ$M
Note 30 Reconciliation of net earnings to net cash flows from operating activities
Net earnings for the year 1,157 166 382 2,116 54
Adjustments to reconcile net earnings to net cash flows from operating activities
Depreciation 447 733 757 – –
Amortisation 234 294 275 – –
Bad and doubtful accounts 12 21 22 – –
Deferred income tax 88 (46) 104 – –
Share of associates’ net profits – (1) (1) – –
Asset impairments – 257 – 117 30
Net gain on asset arrangements (68) – – – –
Gain on distribution of Chorus shares (764) – – (726) –
Debt restructuring costs (included in financing cash flows) 110 – – – –
Gain on winding up foreign operations (28) – – – –
Other (13) (8) (8) (830) 182
Changes in assets and liabilities net of effects of non-cash and investing and financing activities
Decrease/(increase) in accounts receivable and related items (5) (27) 56 1,526 16
Decrease in inventories 6 1 36 – –
Increase/(decrease) in current taxation (74) 30 67 – –
Increase/(decrease) in accounts payable and related items (117) (71) 71 (1429) 49
Net cash flows from operating activities 985 1,349 1,761 774 331
Note 31 Imputation credit accountDividends paid by New Zealand resident companies may include imputation credits representing the taxation already paid by the Company on the profits distributed. New Zealand resident shareholders may claim a tax credit equal to the value of the imputation credits attached to dividends. Overseas shareholders in general are not entitled to claim the benefit of any imputation credits. Overseas shareholders may benefit from supplementary dividends.
The movements in the imputation credit accounts are detailed below:
Balance at beginning of the year (34) (3) (5)
New Zealand income tax (paid)/refunded (61) (91) 1
Transfer from foreign dividend payment (11) – –
Imputation credits attached to dividends paid 92 60 1
Balance at end of the year (14) (34) (3)
As at 30 June 2012, the Group’s current tax balances include NZ$53 million of tax recoverable relating to the New Zealand Group (30 June 2011: NZ$24 million payable). If these balances were to be settled with Inland Revenue for the amounts recognised in Telecom’s financial statements, then Telecom’s imputation credit account balance would decrease for any amounts received by Telecom, or increase for any amounts paid by Telecom.
The Parent Company is a member of the Telecom Imputation Group. These imputation credits are available to attach to dividends paid by the Parent Company.
| 133investor.telecom.co.nz

Note 32 Significant events after balance dateOn 23 August 2012 the board of directors approved the payment of a second half dividend of NZ$204 million, representing 11 cents per share. The dividend will be 75% imputed (at a ratio of 28/72) in line with the corporate income tax rate. In addition, supplementary dividends totalling approximately NZ$20 million will be payable to shareholders who are not resident in New Zealand. In accordance with the Income Tax Act 2007, Telecom will receive a tax credit from Inland Revenue equivalent to the amount of supplementary dividends paid.
Note 33 New accounting standards not yet adoptedCertain new standards, amendments and interpretations to existing standards have been published that are mandatory for Telecom’s accounting periods beginning on or after 1 July 2012 but which Telecom has not yet adopted. Telecom does not consider any other standards or interpretations in issue, but not yet applicable, to have a significant impact on its financial statements. Those which are relevant to Telecom are as follows:
Amendments to NZ IAS 1 Presentation of financial statements – presentation of other comprehensive incomeEffective for periods beginning on or after 1 July 2012.
These amendments require entities to group items presented in other comprehensive income on the basis of whether they are potentially reclassifiable to profit or loss in subsequent periods. Tax on items of other comprehensive income will be allocated on the same basis.
NZ IFRS 9 (2010) Financial instrumentsEffective for periods beginning on or after 1 January 2015.
The standard adds the requirements related to the classification and measurement of financial liabilities and derecognition of financial assets and liabilities.
NZ IFRS 10 Consolidated financial statements Effective for periods beginning on or after 1 January 2013.
The standard builds on existing principles by identifying the concept of control as the determining factor in whether an entity should be included within the consolidated financial statements of the parent company and provides additional guidance to assist in the determination of control where this is difficult to assess.
NZ IFRS 11 Joint arrangementsEffective for periods beginning on or after 1 January 2013.
The standard provides for a more realistic reflection of joint arrangements by focusing on the rights and obligations of the arrangement, rather than its legal form (as is currently the case). The standard addresses inconsistencies in the reporting of joint arrangements by requiring a single method to account for interests in jointly controlled entities.
Amendments to IAS 28 Investments in associates and joint venturesEffective for periods beginning on or after 1 January 2013.
These amendments incorporate joint ventures into the standard. It prescribes the accounting for investments in associates and sets out the requirements for the application of the equity method when accounting for investments in associates and joint ventures.
NZ IFRS 12 Disclosure of interests in other entitiesEffective for periods beginning on or after 1 January 2013.
The standard applies to entities that have an interest in subsidiaries, joint arrangements, associates or unconsolidated structured entities.
It establishes disclosure objectives and specifies minimum disclosures that an entity must provide to meet those objectives.
NZ IFRS 13 Fair value measurementEffective for periods beginning on or after 1 January 2013.
The standard establishes a single framework for measuring fair value where that is required by other standards and is applicable to both financial and non-financial items.
Amendments to NZ IFRS 7 Financial instruments: disclosures – offsetting financial assets and financial liabilitiesEffective for periods beginning on or after 1 January 2013.
These amendments require information about all recognised financial instruments that are set off in accordance with NZ IAS 32 ‘Financial instruments: presentation’ and also information about recognised financial instruments subject to enforceable master netting arrangements and similar agreements even if they are not set off under NZ IAS 32.
Amendments to NZ IAS 27 Separate financial statementsEffective for periods beginning on or after 1 January 2013.
These amendments remove the accounting and disclosure requirements for consolidated financial statements as a result of the issue of NZ IFRS 10 Consolidated financial statements and NZ IFRS 12 Disclosure of interests in other entities.
Amendments to NZ IAS 32 Financial instruments: disclosures – offsetting financial assets and financial liabilitiesEffective for periods beginning on or after 1 January 2014.
These amendments clarify the meaning of ‘currently has a legally enforceable right to set-off’ and also clarify the application of IAS 32 offsetting criteria to settlement systems which apply gross settlement mechanisms that are not simultaneous.
performance
Telecom Annual Report 2012134 |

| 135investor.telecom.co.nz
Telecom’s approach to corporate governance FrameworkTelecom has a dual listing of its shares on the New Zealand Stock Market (NZSX) and on the Australian Securities Exchange (ASX). Telecom is required to comply with the full listing rules of the NZSX and ASX.
As a result of Telecom’s stock exchange listings in New Zealand and Australia, it is subject to the governance requirements of each of these jurisdictions. This includes: the NZSX Listing Rules and Corporate Governance Best Practice Code; the New Zealand Securities Commission’s (now the Financial Markets Authority) report titled ‘Corporate Governance in New Zealand Principles and Guidelines’ (Corporate Governance in New Zealand Principles and Guidelines); the ASX Listing Rules and the ASX Corporate Governance Council’s Principles and Recommendations.
Where there are conflicts between the requirements or best practice recommendations of New Zealand and Australia, the board has adopted practices and policies consistent with the requirements across these jurisdictions. The board will continue to monitor developments in the governance area and review and update its governance practices to ensure the most appropriate standards of governance for Telecom are maintained.
Telecom’s American Depositary Shares (ADSs), each representing five ordinary Telecom shares and evidenced by American Depositary Receipts (ADRs), were listed on the New York Stock Exchange (NYSE). On 19 July 2012 Telecom delisted its ADSs from the NYSE in order to reduce administration costs and complexity associated with the listing. The last day of trading on the NYSE was 9 July 2012 and the ADSs commenced trading on the over-the-counter (OTC) market in the United States on 10 July 2012. The Bank of New York Mellon is Telecom’s ADR Depositary. Telecom remains registered with the United States Securities Exchange Commission (SEC) pursuant to the United States Securities Exchange Act of 1934 (Securities Exchange Act) however Telecom has announced its intention to deregister in the future in the event it meets the relevant deregistration criteria. As a result of Telecom remaining registered under the Securities Exchange Act, Telecom is subject to SEC reporting obligations under the Securities Exchange Act and the United States Sarbanes-Oxley Act.
Compliance with NZSX Best Practice Code, Corporate Governance in New Zealand Principles and Guidelines and ASX Corporate Governance Council’s Principles and RecommendationsThe NZSX Listing Rules require Telecom to include a statement in this Report disclosing the extent to which it has followed the NZSX Corporate Governance Best Practice Code for the reporting period. Telecom considers its governance practices comply with the Code in its entirety for FY12. Telecom also considers that its governance practices comply with the Corporate Governance in New Zealand Principles and Guidelines in their entirety for FY12. In addition, the ASX Listing Rules require Telecom to include a statement in this Report disclosing the extent to which Telecom’s governance practices comply with the ASX Corporate Governance Council’s Principles and Recommendations set out in the second edition of the Corporate Governance Principles and Recommendations (as amended in 2010) during the reporting period, identifying the recommendations that have not been followed and providing reasons for that variance. Telecom considers that it complies with each of the recommendations.
Further informationMore detail about Telecom’s governance practices and copies of its principal governance documents (including the board charter, the Nominations and Corporate Governance Committee charter, the Human Resources and Compensation Committee charter and the Audit and Risk Management Committee charter) are available on Telecom’s website. Comprehensive compliance checklists cross-referencing the recommendations of the NZSX Corporate Governance Best Practice Code, the ASX Corporate Governance Council’s Principles and Recommendations, the Corporate Governance in New Zealand Principles and Guidelines to the relevant Telecom governance documents are also available on Telecom’s website. Go to: www.telecom.co.nz>TelecomGroup>Governance.
Governance at Telecom
The board and management are committed to ensuring that Telecom maintains international best practice governance structures and adheres to high ethical standards. The board regularly reviews and assesses Telecom’s governance structures and processes to ensure that they are consistent with international best practice, in both form and substance.
GoveRNANCe

Telecom Annual Report 2012136 |
governance
The board of directorsRole of the board and responsibilityThe board of directors is elected by shareholders to govern Telecom in the interests of shareholders and to protect and enhance the value of the assets of Telecom. The board is the overall and final body responsible for all decision-making within the Company. In carrying out its role, the board works to enhance the value of Telecom in the interests of Telecom and its shareholders. The board charter describes the board’s role and responsibilities and regulates
Shareholders
Audit & Risk Management
Committee
Subsidiary Company
Boards
Nominations & Corporate Governance Committee
Human Resources &
Compensation Committee
Board
CEO
Executive & Management Teams
ElECTiON
DElEGATiON
DElEGATiON ACCOuNTABiliTy
ACCOuNTABiliTy
External Auditor
internal Audit
Group Risk Management
Ass
uran
ce
Tax
legal
Accounting
Other
Inde
pend
ent A
dvic
e
Telecom governance framework
DElEGATiON / ACCOuNTABiliTy
Board membership, size and compositionAs at 30 June 2012 the board comprised seven directors: being a non-executive chairman and six non-executive directors. On 13 August 2012 the new CEO, Simon Moutter, joined the board as an executive director and the board now comprises eight directors. The board has a broad range of experience and skills appropriate to meet its objectives. Areas of expertise and experience include telecommunications, finance, legal, brand, marketing, accounting, governance and international business. For details of individual directors see Our company – Board of directors.
The Nominations and Corporate Governance Committee is responsible for making recommendations to the board regarding its size and composition. It also reviews the criteria for the selection of directors to ensure the board comprises the right mix of skills and experience to meet the needs of Telecom.
Selection and role of chairmanThe chairman is elected by the board from the non-executive directors. The board supports the separation of the role of chairman and CEO. The chairman’s role is to manage and provide leadership to the board and to facilitate the board’s interface with the CEO. The current chairman, Mark Verbiest, who was appointed on 1 December 2011 (upon the Demerger taking effect) is a non-executive director and, as required by the board charter, is independent on the basis outlined below. For his biography, see Our company – Board of directors. The board does not have a deputy chairman.
internal board procedure. The board has also delegated a number of its responsibilities to board committees. The role of each committee is described below. To enhance efficiency, the board has delegated to the CEO and subsidiary company boards the day-to-day leadership and management of the Company. The CEO has, in some cases, formally delegated certain authorities to his direct reports and has established a formal delegated authority framework for those direct reports to sub-delegate certain authorities within set limits. The diagram below illustrates Telecom’s governance framework.

| 137investor.telecom.co.nz
Director independenceThe board is committed to having a majority of directors who are judged by the board to be independent of judgement and character and free of material relationships with Telecom and/or other entities and people who might influence, or could be perceived by others to influence, such judgement.
In setting the criteria for determining independence, the board considered the requirements under the NZSX Listing Rules, the NYSE listing standards and the guidance provided in the ASX Corporate Governance Council’s Corporate Governance Principles and Recommendations. Independence standards consistent with the requirements of these jurisdictions have been adopted by Telecom and are contained in the board charter. Telecom’s board charter requires a majority of directors to be independent. As a result of the delisting of Telecom’s ADSs from the NYSE, the board may re-assess the criteria it uses to determine director independence in FY13.
While the board has not set financial materiality thresholds for determining independence, it considers all relationships on a case-by-case basis and, as a general policy, considers a threshold of 5% to be relevant in determining materiality. When determining independence, relationships are considered from the perspective of both Telecom and the customer or supplier.
At its 23 August 2012 board meeting, the board resolved, based on information provided by directors regarding their interests, that each non-executive director on the board at the balance date and at the date of the meeting was independent, with the exception of Mr Roberts. Mr Roberts was found to be not independent as a result of a technical analysis of his role as CEO of Saatchi & Saatchi Worldwide. While the board are of the view that there is in fact no actual conflict of interest, it recognises that there may be a perception that such a relationship could influence Mr Roberts’ decisions in relation to Telecom’s advertising spend with Saatchi & Saatchi New Zealand (in accordance with the board charter test). Despite this determination, the board is of the opinion that Mr Roberts does not in fact exercise influence in relation to the engagement of Saatchi & Saatchi New Zealand as an advertising supplier to Telecom (as decisions relating to advertising spend are made by management, not the board) and that in all other respects the board regards Mr Roberts as independent. The board also resolved that the executive director, Mr Moutter, was not independent by virtue of the fact that he is the CEO and therefore part of the management team.
The board will review any determination it makes on a director’s independence on becoming aware of any information that indicates the director may have a relevant material relationship. For this purpose, directors are required to ensure that they immediately advise of any new or changed relationships so the board can consider and determine the materiality of the relationship. For biographies of directors in office at 30 June 2012, see Our company – Board of directors. For further information about the directors’ interests see Performance – Related party transactions (note 28 to the financial statements) and Disclosures – Interests disclosures.
Conflicts of interestThe board is conscious of its obligations to ensure that directors avoid conflicts of interest (both real and perceived) between their duty to Telecom and their own interests. The board charter outlines the board’s policy on conflicts of interest. Where conflicts of interest do exist at law, then the director must disclose their interest and excuse themselves from any relevant board discussions. Such a director is not permitted to receive any board papers in respect of those interests and, in accordance with the relevant stock exchange listing rules, may not exercise his or her right to vote in respect of such matters.
Nominations and appointment of new directors The procedures for the appointment and removal of directors are ultimately governed by the Company’s constitution. The board may appoint directors to fill casual vacancies that occur or to add persons to the board up to the maximum number (currently 12) prescribed by the constitution. Recommendations for nominations of new directors are generally made by the Nominations and Corporate Governance Committee and considered by the board as a whole. External consultants are used to access a wide base of potential candidates and to review the suitability of candidates for appointment. When recommending a candidate to act as director, the Nominations and Corporate Governance Committee takes into account such factors as it deems appropriate, including the background, experience, professional skills and personal qualities of the candidate, whether their skills and experience will augment the existing board and their availability to commit themselves to the role.
If the board appoints a new director during the year, that person will stand for election by shareholders at the next annual meeting. Shareholders are provided with relevant information on the candidates standing for election in the notice of meeting.
Diversity within the boardThe board recognises that building diversity across Telecom will deliver enhanced business performance – this includes building diversity of thought within the board of directors. Diverse backgrounds, gender, age, experience and perspectives are critical to building a high-performing business, better able to solve problems and implement new ideas. The current board has depth and breadth of experience both in New Zealand and overseas as well as the diversity of age, gender and perspectives necessary to govern Telecom as it addresses opportunities and challenges following the Demerger.
Letters of appointmentAll directors have signed formal letters of appointment setting out the arrangements of their appointment, including their duties, terms, conditions and term of appointment, expectations of the role and remuneration. The terms of appointment may be amended with the agreement of the board.

Telecom Annual Report 2012138 |
governance
Director induction and educationThe board introduces new directors to management and the business through specifically tailored induction programmes, depending on their needs. The programme may include one-on-one meetings with management and visits to key company sites.
All directors are regularly updated on relevant industry and company issues. This may include visits to Telecom operations and briefings from key Executives and industry experts. From time to time the board may also undertake educational trips to receive briefings from companies in relevant industries. There is an ongoing programme of presentations to the board by all business units. The board expects all directors to undertake continuous education so that they may appropriately and effectively perform their duties.
Board performance review Board evaluations are undertaken annually to seek director and Executive feedback on a range of matters relating to board performance, including its role and composition and engagement with management, shareholders and stakeholders. The collective results of the evaluation are then reported to the board by the chairman and discussed with directors. As the majority of the board was newly appointed in December 2011, no such board evaluation took place in FY12.
It is the role of the chairman of the board to regularly address various issues with directors, including individual performance. The board also undertakes regular discussion on governance and performance issues and annually reviews its own performance as a whole against the board charter and each committee against its charter.
CEO performance review The Human Resources and Compensation Committee reviews the performance of the CEO. The formal annual review process is usually conducted in August in respect of the immediately preceding financial year. A review of Dr Reynolds’ performance during FY12 took place in August 2012 to assess his eligibility for any payment in addition to what was paid to him under the Performance Incentive Scheme on termination of his employment (see CEO remuneration for further details). The board approved no additional payment.
The evaluation carried out is undertaken using criteria set by the committee, and approved by the board, that include the performance of the business, the accomplishment of strategic and operational objectives and other non-quantitative objectives agreed at the beginning of each year. The committee recommends a performance outcome to the board for approval. The committee periodically reviews the CEO’s key performance objectives to ensure they are an appropriate measure of the CEO’s performance. For further details of the employment arrangements relating to the CEO see CEO remuneration.
The CEO reports to the Human Resources and Compensation Committee at least annually on management succession planning and management development.
Executive performance reviewThe CEO is responsible for regularly reviewing the performance of his direct reports against their key performance objectives. The formal annual review process is generally conducted in August each year in respect of the immediately preceding financial year. However, the most recent review was conducted by the then CEO, Dr Reynolds in June 2012, prior to his departure, and his recommendations made to the Human Resources and Compensation Committee in August 2012. This evaluation is undertaken using criteria set annually by the CEO that include the performance of the business, the accomplishment of strategic and operational objectives and other non-quantitative objectives agreed with the Human Resources and Compensation Committee at the beginning of each financial year. The Human Resources and Compensation Committee reviews and approves the CEO’s remuneration recommendations for his direct reports, including the payment level of their annual short-term incentives and any other variation of the terms and conditions of employment.
For further details relating to Executive remuneration see Executive remuneration.

| 139investor.telecom.co.nz
Retirement and re-election of directorsTelecom directors have no fixed term of office but are subject to the retirement provisions contained in the constitution, company policies and relevant stock exchange listing rules. In addition, under the NZSX Listing Rules, at least one third (or the number nearest to one third) of the directors are required to retire from office at the annual meeting each year but shall be eligible for re-election at that meeting. The executive director (the CEO, in Telecom’s case) is exempt from the requirement to stand for re-election but the executive director is counted in determining the number of directors that must retire. Under the ASX Listing Rules, a director must not hold office without re-election past the third annual meeting following the director’s appointment or three years, whichever is the longer. The retiring directors at any annual meeting will be those who have been longest in office since they were last elected.
Telecom’s notice of meeting details those director(s) standing for re-election at Telecom’s next annual meeting.
Board access to information and adviceTelecom’s group general counsel and company secretary is responsible for supporting the effectiveness of the board by ensuring that policies and procedures are followed and for coordinating the completion and dispatch of the board agendas and papers.
All directors have access to senior management, including the group general counsel and company secretary, to discuss issues or obtain information on specific areas or items to be considered at the board meeting or other areas they consider appropriate. The board, board committees and each director have the right, subject to the approval of the chairman, to seek independent professional advice at Telecom’s expense to assist them in carrying out their responsibilities. Further, the board and board committees have the authority to secure the attendance of outsiders with relevant experience and expertise at board meetings.
Directors’ shareholdingAs a matter of board policy, non-executive directors are encouraged to hold Telecom shares. For disclosure of each director’s shareholding see Disclosures – Interests disclosures – Director share ownership. Directors are required to comply with Telecom’s Insider Trading Policy and Rules when trading in Telecom shares. For further information about Telecom’s Insider Trading Policy see Insider Trading Policy and trading in Telecom shares below.
Indemnities and insurance As permitted by the constitution, deeds of indemnity have been given to directors for potential liabilities and costs they may incur for acts or omissions in their capacity as directors. In addition, deeds of indemnity have been given to certain senior staff for potential liabilities and costs they may incur for acts or omissions in their capacity as employees of Telecom, directors of Telecom subsidiaries or directors of non-Telecom companies in which Telecom holds interests.
Telecom holds directors and officers liability insurance to cover risks normally covered by such policies arising out of acts or omissions of directors and employees in their capacity as such. Insurance is not provided for dishonest, fraudulent, malicious or wilful acts or omissions. It is standard insurance industry practice not to disclose the name of the insurer, the limit of liability purchased or the premium paid.
Meetings of the board and conduct of meetingsThe board has eight scheduled meetings each year. In addition, it meets whenever necessary between the scheduled meetings to discuss key strategic issues or urgent business. The chairman and the CEO establish meeting agendas to ensure adequate coverage of key issues during the year. The directors generally receive materials for board meetings seven days in advance of the meeting, except in the case of special meetings for which the time period may be shorter due to the urgency of the matter to be considered.
Executives and other senior employees regularly attend board meetings and are also available to be contacted by directors between meetings. The board and its committees also meet regularly in executive session, presided over by the chairman, without the CEO or other management present. Such sessions, in particular, deal with management performance and remuneration issues, board performance evaluation issues, and discussions with the general manager group risk and audit and external auditor to promote a robust independent audit process.
Attendance at board and committee meetings The board held seven formal meetings and four special meetings during FY12. The table below shows director attendance at these board meetings and committee member attendance at committee meetings. Sub-committees of the board also met regularly throughout the year to consider matters of special importance, including the Demerger.

Telecom Annual Report 2012140 |
governance
Board committeesBoard committees and membershipThree board committees assist in the execution of the board’s responsibilities: the Human Resources and Compensation Committee; the Nominations and Corporate Governance Committee; and the Audit and Risk Management Committee. The committees have a number of scheduled meetings each year to coincide with the timing of the various responsibilities of that committee. A due diligence sub-committee was established and met regularly prior to the Demerger to oversee the due diligence carried out in relation to the Demerger. Other committees may be established from time to time to consider matters of special importance or to exercise the delegated authority of the board.
Board and committee meeting attendance for FY12
BOA
RD M
EETI
NG
S
SPEC
IAL
BOA
RD
MEE
TIN
GS
AU
DIT
AN
D R
ISK
MA
NA
GEM
ENT
CO
MM
ITTE
E
HU
MA
N
RESO
URC
ES A
ND
C
OM
PEN
SATI
ON
C
OM
MIT
TEE
NO
MIN
ATIO
NS
AN
D C
ORP
ORA
TE
GO
VERN
AN
CE
CO
MM
ITTE
E
Total number of meetings held
7
4
4
6
1
P Berriman1 5 – 3 – 1
W Boyd2 2 4 1 1 –
M Horn 7 3 4 – 1
M Leyland3 5 – – 5 1
P Reynolds4 6 4 – – –
K Roberts 6 2 – 5 1
S Sheldon5 2 4 1 1 –
C Sitch6 5 – 3 – 1
R Spithill7 2 4 – – –
J Smyth8 5 – 3 5 1
M Verbiest9 5 – – 5 1
1 Mr Berriman was appointed director 1 December 2011.
2 Mr Boyd resigned as director 1 December 2011.
3 Ms leyland was appointed director 1 December 2011.
4 Dr Reynolds resigned as director 31 May 2012.
5 Ms Sheldon resigned as director 1 December 2011.
6 Mr Sitch was appointed director 1 December 2011.
7 Mr Spithill resigned as director 1 December 2011.
8 Ms Smyth was appointed director 1 December 2011.
9 Mr Verbiest was appointed director 1 December 2011.
Committee chartersEach board committee has a charter summarising the role, rights, responsibilities and membership requirements for that committee. The board annually reviews the charters of the board committees and their performance against those charters. The board may consider amending its charter and the committee charters as a result of the delisting of Telecom’s ADSs from the NYSE.
Committee compositionThe board is responsible for appointing committee members according to the skills, experience and other qualities they bring to the committee. All committees are required to comprise a minimum of three members. The composition of the Human Resources and Compensation Committee and the Nominations and Corporate Governance Committee each satisfies the requirement of the respective committee charter that a majority of directors be independent. The composition of the Human Resources and Compensation Committee satisfies the requirement of its charter that all members are non-executive directors. In accordance with its charter, all members of the Audit and Risk Management Committee are independent.
Committee roles and operationsAfter each committee meeting the board is provided with minutes of the committee meeting at the next meeting of the board. Where appropriate, the board is also given a verbal report by the chairman of the committee on the outcomes of the meeting.
The structure, membership and responsibilities of the board’s committees are summarised below. Each committee’s role and responsibilities are also outlined in the relevant committee charter.

| 141investor.telecom.co.nz
Committee roles, responsibilities and membership
COMMITTEEHUMAN RESOURCES AND COMPENSATION COMMITTEE
AUDIT AND RISK MANAGEMENT COMMITTEE
NOMINATIONS AND CORPORATE GOVERNANCE COMMITTEE
Role • To assist the board in overseeing the
management of the human resources
activities of Telecom
• To assist the board in its oversight
of the integrity of the financial
reporting and risk management
framework
• To ensure the independence of
the external auditor
• To identify and recommend to the
board, nominations for members
of the board
• To review and develop Telecom’s
corporate governance principles
and make recommendations to
the board
Responsibilities • Review the current remuneration and
human resources strategy, structure and
policy of Telecom
• Review and make recommendations to the
board on non-executive director
remuneration, having regard to any relevant
factors (including the shareholder-approved
fee pool)
• Review and evaluate the CEO’s performance
against key objectives and make
recommendations to the board on the
CEO’s remuneration
• Review and approve the conditions and
terms of employment of the CEO’s direct
reports
• Review and recommend to the board
the appointment or termination of the
Chief Financial Officer (CFO) and Group
General Counsel
• Review and make recommendations to
the board with respect to incentive
remuneration plans and equity-based
compensation plans
• Make recommendations to the board with
respect to the measurable objectives to be
set by the board for achieving diversity
• Annually assess the effectiveness of the
diversity policy, the measurable objectives
set for achieving diversity, the progress
toward achieving them and make
recommendations to the board in respect
such assessments
• Ensure that the appropriate disclosures with
respect to diversity are made in Telecom’s
annual report
• Annually review and report to the board on
the relative proportion of women and men
who make up Telecom’s workforce, at all
levels of the business
• Oversee all matters concerning the
integrity of the financial statements
and financial reporting systems
and processes
• Ensure compliance with financial
reporting and related regulatory
requirements
• Consider the adequacy of internal
controls after consultation with
management and the external and
internal auditors
• Review the six-monthly fraud
report and make any necessary
disclosures to the external auditor
• Ensure that an appropriate risk
management framework exists,
and review principal risks
• Appoint the external auditors
(subject to annual shareholder
approval)
• Review the external auditors’
qualifications, performance and
independence
• Approve the appointment of the
internal auditor and review the
activities and performance of the
internal audit function
• Review Telecom’s compliance with
applicable laws, regulations and
standards through Telecom’s
compliance frameworks
• Provide oversight of the structure
and outcome of remuneration
incentive arrangements as they
relate to key internal audit
personnel
• Recommend candidates for
appointment to the board
based on the criteria set out in
the board charter
• Oversee the performance
evaluation of the board and
review board succession planning
• Be actively involved in succession
planning for the chairman
• Review, on an ongoing basis,
the governance structures and
processes of the board and make
recommendations to the board
• Recommend to the board the
removal of any director, subject to
the provisions of the constitution
• Make recommendations to the
board as to its size
Members as at
30 June 2012
Justine Smyth (Chair)
Maury Leyland
Kevin Roberts
Mark Verbiest
Murray Horn (Chair)
Paul Berriman
Charles Sitch
Justine Smyth
Mark Verbiest attends meetings
in an ex officio capacity
Mark Verbiest (Chair)
Paul Berriman
Murray Horn
Maury Leyland
Kevin Roberts
Charles Sitch
Justine Smyth

Telecom Annual Report 2012142 |
governance
Audit governance and independence Audit and Risk Management Committee The Audit and Risk Management Committee includes members who have appropriate financial experience and an understanding of the industry in which Telecom operates. All committee members are independent (in accordance with the independence criteria contained in the board charter and Rule 10A-3 under the Securities Exchange Act, which is restated in the Audit and Risk Management Committee charter) and are financially literate. Committee members (and their family members and entities to which they are related) must not receive (directly or indirectly) any compensation or consultancy, advisory or other fees from Telecom (other than those relating to their services as committee and board members or retirement payments made under the constitution) and must not be an affiliated person of Telecom.
The committee charter requires that at least one member of the committee must be an ‘audit committee financial expert’ as defined in the United States Securities and Exchange Commission’s Form 20-F.
The board considers that Dr Murray Horn is an ‘audit committee financial expert’ for the above purposes. Dr Horn is chairman of the Audit and Risk Management Committee and is an independent director (in accordance with the independence criteria contained in the board charter and Rule 10A-3 under the Securities Exchange Act).
For the industry knowledge and financial experience of other members of the Audit and Risk Management Committee see Our company – Board of directors.
The United States Securities and Exchange Commission has determined that an audit committee member who is designated as an ‘audit committee financial expert’ is not deemed to be an expert for any other purpose, including for the purposes of section 11 of the Securities Exchange Act.
External audit independence The Audit and Risk Management Committee is responsible for making recommendations to the board concerning the appointment of Telecom’s external auditors and their terms of engagement. KPMG was automatically re-appointed as Telecom’s auditor for the upcoming year at Telecom’s annual meeting in October 2011. Shareholders also approved the board setting the remuneration of the auditor at the annual meeting in October 2011. The chair of the Audit and Risk Management Committee may invite such persons to attend the committee meetings as deemed necessary. The committee regularly meets with the external auditor without management being present and meets management without the external auditor being present. Committee members may contact the external auditor directly at any time.
See Performance – Auditors’ Reports for the external auditors’ reports for 2012.
Telecom is committed to auditor independence. The Audit and Risk Management Committee reviews the independence and objectivity of the external auditor. For this reason, the work of the external auditor is carefully controlled and must either be (i) consistent with the principles applied in assessing assurance services; or (ii) of a nature described for approval by the Audit and Risk Management Committee, each as set out below.
Under Telecom’s External Audit Independence Policy, the Audit and Risk Management Committee must pre-approve all audit (including all statutory and regulatory audit services) and related assurance services provided by the auditor.
The committee has delegated pre-approval authority to the committee chairman up to an agreed limit. All services approved by the committee chairman are reported to the Audit and Risk Management Committee on a quarterly basis. All audit and audit-related assurance services for the past financial year were approved in accordance with Telecom’s policy.
The External Audit Independence Policy requires rotation of audit partners every five years and places restrictions on an audit partner or audit manager being employed by Telecom in another role and on the external auditor employing Telecom’s CEO, CFO, group controller or any other member of Telecom management who has acted in a financial oversight role.
The policy prohibits the auditor from providing certain specified services and is designed to ensure that related assurance services provided by Telecom’s auditor are not perceived as conflicting with the independent role of the auditor.
The general principles to be applied in assessing related assurance services are as follows:
• the external auditor should not have any involvement in the production of financial information or preparation of financial statements such that they might be perceived as auditing their own work; this includes the provision of valuation services where such valuation forms an input into audited financial information;
• the external auditor should not perform any function of management or be responsible for making management decisions;
• the external auditor should not be responsible for the design or implementation of financial information systems; and
• the separation between internal and external audit should be maintained.
Aside from core audit services, Telecom’s auditor may provide other services with prior approval from the Audit and Risk Management Committee, including, but not limited to:
• other assurance services (eg, TSO certification, trust deed reporting);
• accounting policy advice (including opinions on compliance with International Financial Reporting Standards);
• listing advice; and
• accounting/technical training.
| 143investor.telecom.co.nz
However, it is not considered appropriate for Telecom’s auditor to provide:
• bookkeeping/other services related to accounting records or financial statements;
• the design of financial information systems;
• appraisal/valuation services/opinions as to fairness;
• internal audit services;
• structured finance advice;
• due diligence services;
• legal services (these are services that could be provided only by a person who is qualified in law);
• tax planning, strategy and compliance services;
• management functions;
• broker/dealer/investment adviser/investment banking services;
• services of an expert as an advocate;
• actuarial services;
• provision of temporary staff for appropriate assignments;
• assistance in the recruitment of senior management; and
• tax services to employees of Telecom who act in a financial reporting oversight role1.
The External Audit Independence Policy can be viewed on Telecom’s website (go to www.telecom.co.nz>TelecomGroup> Governance). It is a requirement of the Audit and Risk Management Committee charter that the committee annually assesses and confirms to the board, the independence of the external auditor after consideration of the External Audit Independence Policy criteria. This includes assessing whether the independence of the external audit process has been maintained in light of the performance of any other assurance services. The Audit and Risk Management Committee undertook this assessment at its meeting in August 2012 and confirmed to the board that it had complied in all respects with the External Audit Independence Policy and that the committee was satisfied as to the external auditor’s (KPMG) independence. As part of this assessment, KPMG confirmed in writing that it has complied with all aspects of the External Audit Independence Policy and provided relevant details in support of compliance with Public Company Accounting Oversight Board rule 3526.
Attendance at annual meetingRepresentatives of Telecom’s external auditor will be available at Telecom’s Annual Meeting to answer shareholder questions about the conduct of the audit and the content of the external auditors’ reports.
1 For the purposes of this exclusion, the following persons (among others) are deemed to perform a financial reporting oversight role: CEO, CFO, group controller, the general manager of New Zealand commercial finance and the heads of finance for the Australian businesses.
Controlling and managing risks Approach to risk management Through its risk management framework, Telecom identifies, assesses and manages risks that affect its business, including specific pan-Telecom risks arising from the business direction and strategic environment. Telecom’s risk management framework is implemented through business processes, such as business planning, investment analysis, project management and operations management. Telecom’s Managing Risk Policy requires Telecom’s business and support groups to:
• identify risks that relate to the achievement of their business objectives;
• assess those risks and determine whether they are acceptable under existing controls or whether additional treatment is required;
• respond appropriately to the risks, based on that assessment; and
• monitor and report on the current status of risks and the effectiveness of their controls.
This systematic approach to managing risk is performed on a planned or embedded basis and is implemented throughout Telecom.
Management regularly reports to the board on the effectiveness of Telecom’s management of its material business risks.
For further information on the specific risks facing Telecom’s business see Performance – Group risk factors.
Risk management roles and responsibilitiesRisk management takes place in the context of normal business processes, such as business planning, investment analysis, project management and operations management. In addition, risk is managed through the delegation of authority framework and other Telecom policies that provide a framework for managing specific pan-Telecom risks arising from the Company’s business direction and strategic environment. To manage financial risks around treasury transactions, the board has approved principles and policies that specify who may authorise transactions and segregate the duties of those carrying them out.
The Audit and Risk Management Committee is responsible for ensuring that management has established a risk management framework that includes policies and procedures to effectively identify, treat and monitor principal business risks. The committee also regularly reviews Telecom’s risk profile.
Telecom’s Audit and Risk Management Committee receives reports on the effectiveness of the implementation of policies and processes designed to manage risk. The Audit and Risk Management Committee receives reports from internal audit on the adequacy and effectiveness of Telecom’s internal controls. The committee regularly reports this information to the board.

Telecom Annual Report 2012144 |
governance
CEO/CFO assuranceAlthough Telecom is not required to comply with all of the provisions of the Australian Corporations Act 2001, Telecom requires that its CEO and CFO make an annual declaration in relation to Telecom’s financial statements in the form set out in s295A of the Australian Corporations Act. Section 295A requires the CEO and CFO to declare that: (a) Telecom’s financial records have been properly maintained; (b) the financial statements comply with the accounting standards; and (c) the financial statements give a true and fair view. The board receives a written assurance from the CEO and the CFO that, to the best of their knowledge and belief, the declaration provided by them in the form set out in s295A of the Australian Corporations Act is founded on a sound system of risk management and internal control and that the system is operating effectively in all material respects in relation to financial reporting risks.
Internal auditTelecom has an internal audit group based in New Zealand and Australia. The internal audit charter defines the internal audit group’s objectives, scope, independence, responsibilities and authority. The internal audit group’s primary objective is to assist the board and CEO in exercising good governance by providing independent assurance on Telecom’s control and risk management processes. The Audit and Risk Management Committee approves the appointment and replacement of the general manager, group risk and audit who reports to the board through the committee. The internal audit group is independent from the activities and operations it audits, including risk management systems and has unrestricted access to Telecom’s records and employees. The internal audit group regularly performs audits across Telecom business units in New Zealand, Australia and elsewhere. The internal audit team works to an internal audit plan approved by the Audit and Risk Management Committee. The Audit and Risk Management Committee ensures that the internal audit group is appropriately staffed and that its scope of work is adequate in light of the key risks facing Telecom.
Promoting ethical and responsible behaviour Internal policies and proceduresTelecom employees are responsible for ensuring that Telecom carries out its business activities in a way that maximises business opportunities, has due regard to all applicable legal and regulatory requirements and minimises Telecom’s exposure to unacceptable legal and regulatory risk. Managers are responsible for making sure that Telecom people are given appropriate information and training to assist them in complying with legal, regulatory and policy compliance obligations. Telecom has dedicated compliance staff who support employees and managers in these roles.
Telecom has a number of core internal policies and procedures, including:
• Code of Ethics;
• Managing Risk Policy;
• Insider Trading Policy and Guidelines;
• Market Disclosure and Communications Policies;
• Diversity Policy;
• Health and Safety Policy and related protocols;
• Human Resources Policies, including employment, remuneration and benefits, equal opportunity;
• anti-harassment and discrimination;
• Legal and Compliance Policy;
• Information Management Policy;
• Technology Policy; and
• Delegation of Authority Framework.
Telecom is adopting an integrated compliance framework consistent with AS/NZ-3806 Compliance Programmes. The implementation is monitored by the Audit and Risk Management Committee.
Further detail on selected policies and procedures is set out below.
Code of EthicsTelecom expects its employees and directors to maintain the highest ethical standards. Telecom’s Code of Ethics (Code) establishes the framework by which Telecom people (including the CEO and CFO) are expected to conduct their professional lives by facilitating behaviour and decision-making that meets Telecom’s business goals and is consistent with Telecom’s values, policies and legal obligations. All Telecom people receive online training on the Code. Telecom encourages staff to report any concerns they have about compliance with the Code, Telecom Policies or legal obligations, using a custom built online reporting system. Any concerns are investigated with action taken as appropriate. The Code addresses:
• Conflicts of interest;
• Receipt of gifts;
• Corporate opportunities;
• Confidentiality;

| 145investor.telecom.co.nz
• Expected behaviours (including to deal fairly and honestly with Telecom’s people, professional advisers, customers and suppliers);
• The proper use of Telecom’s assets and information;
• Compliance with laws and Telecom policies;
• Delegated authority; and
• Reporting issues regarding breaches of the Code of Ethics, legal obligations or other Telecom policies.
Telecom also has a Directors’ Code of Ethics, which addresses similar topics and establishes the behaviour expected of directors.
Copies of the Code of Ethics and Directors’ Code of Ethics, along with any amendments or waivers, can be found on Telecom’s website (go to: www.telecom.co.nz>TelecomGroup>Governance) and are also available free of charge on request from the group general counsel and company secretary by emailing [email protected].
Escalation procedures and whistle-blowing Any Telecom employee (including a contractor) who becomes aware of a legal, regulatory, policy or other compliance issue has a responsibility to report it using Telecom’s breach reporting/whistle-blowing frameworks, which include a financial compliance escalation procedure. In addition, Telecom has a procedure whereby accounting, auditing or internal control breaches or concerns may be reported confidentially to the Audit and Risk Management Committee.
Insider Trading Policy and trading in Telecom sharesDirectors and employees are subject to restrictions under the law relating to dealing in Telecom securities and other related Telecom derivatives if they are in possession of inside information. Inside information is information that is not generally available and, if it were generally available, a reasonable person would expect it to have a material effect on the price or value of Telecom securities.
To help ensure compliance with these legal requirements, the Insider Trading Policy specifies that no director or Telecom employee may buy or sell Telecom shares while in possession of inside information. The policy also states that directors and Telecom employees in possession of inside information cannot directly or indirectly advise or encourage any person to deal in Telecom shares. The policy sets out additional rules for directors, executives, direct reports to the Executive and certain other Telecom employees, which includes the requirement to seek Company consent before trading and mandatory trading black-out periods.
Compliance with the Insider Trading Policy is monitored through the consent process, by education and notification by Telecom’s share registrar when any director or officer engages in trading activities. Any breach of the Insider Trading Policy would be regarded very seriously. In addition, as required by the Securities Markets Act 1988 and the Securities Markets (Disclosure of Relevant Interests by Directors and Officers) Regulations 2003, all trading by directors and officers is reported to NZX. Trading by directors is also reported to ASX.
Market disclosure and communications policiesTelecom’s Market Disclosure Policy governs communications with shareholders and other stakeholders. Telecom is committed to providing comprehensive continuous disclosure to shareholders and other stakeholders and complying with the listing rules of the stock exchanges on which Telecom is listed.
Telecom requires certain senior people (the CEO, CFO, group general counsel and company secretary and the general manager, capital markets) and, in some cases, the chairman, to discuss whether information is material prior to its release.
Telecom has appointed a disclosure officer (currently the general manager, capital markets) who, together with the group general counsel and company secretary, is responsible for ensuring that all material information is lodged, as soon as practicable, simultaneously with the NZX and ASX.
The disclosure officer ensures that such information is published on Telecom’s website where appropriate, with further dissemination through broadcast emails to news agencies and other market commentators. Disclosure practices are monitored by the disclosure officer.
Telecom has also appointed certain Executives as authorised spokespeople who are required to ensure that all proposed public comments contain information already in the public domain or information that is not materially price sensitive. Management is responsible for ensuring compliance with the policy.
Telecom’s website contains media releases, periodic financial information, current and past annual reports, dividend histories, notices of meeting, a list of shareholders’ frequently asked questions and other information about the Company. Telecom shareholders can contact the board directly using the dedicated email address: [email protected]. Telecom webcasts its investor and analyst briefings over its website where appropriate.
Full participation of shareholders at the annual meeting is encouraged. Shareholders may electronically appoint and direct a proxy to vote on their behalf at the annual meeting, by lodging their proxy form online at www.investorvote.co.nz/telecom. Telecom will be webcasting its 2012 annual meeting live. Shareholders will be given the opportunity to ask questions of the chairman, directors and auditor during the meeting. The webcast will be archived on the Telecom website after the meeting, along with a copy of the minutes of the meeting.
Diversity at Telecom Telecom believes that building diversity of thought across the organisation will deliver enhanced business performance. Diverse backgrounds, experience and perspectives are critical to build a leading-edge business and to deliver for our customers. Telecom is committed to attracting, recruiting, developing, promoting and retaining a diverse group of talented individuals who will help drive Telecom’s business performance.
Telecom’s Diversity Policy enshrines the Company’s commitment to diversity and sets out the respective responsibilities of the board, the Human Resources and Compensation Committee and management in relation to building diversity across the organisation.
Telecom Annual Report 2012146 |
governance
The Human Resources and Compensation Committee is responsible for developing the measurable objectives in relation to diversity within Telecom and recommending the objectives to the board for approval. The committee is also responsible for conducting annual assessments of the measurable objectives and the progress made toward achieving them, as well as reporting on such progress. These responsibilities are set out in the respective board and committee charters.
For FY12 the board has set the following measurable objectives for achieving greater diversity at Telecom:
• establishing initiatives to increase the proportion of women in senior leadership roles;
• monitoring recruitment processes to ensure effectiveness in sourcing candidates from a wide talent pool; and
• assessing Telecom’s current levels of diversity, identifying where gaps exist and recommending further initiatives to address these gaps.
The current state of the measurable objectives is as follows:
• A number of initiatives have been established to support increasing gender diversity in senior leadership roles. These include the launch of the Telecom Women in Leadership Programme for high-potential female employees in the leadership pipeline; the introduction of a Women’s Leadership Forum to create opportunities for male and female employees to learn and reflect on diversity issues and hear from inspirational speakers; and ongoing support for the Global Women – Women in Leadership Programme.
• Ongoing focus on our recruitment processes, including targeted sourcing campaigns to tap into wider talent pools. Development of a Hiring Manager programme has commenced with a focus on educating managers about Telecom’s Diversity Policy and providing tools and techniques to support building a diverse workforce through the recruitment process.
• An online census was conducted in FY12 to ascertain Telecom’s current diversity fact base. The results will be used to better understand barriers to diversity and to prioritise areas of focus.
• We continue to provide progressive flexible working policies that encourage employees to propose flexible working arrangements that suit their individual circumstances, such as child or relative care.
Telecom Gender CompositionThe current proportion of women at various levels within the Telecom workforce is set out in the table below.
% female % male
Telecom Board of Directors 25 75
Officers* 11 89
Senior Leaders 23 77
Overall Workforce 38 62
* Telecom considers direct reports to the CEO to be ‘officers’.
Kiwi Share The Kiwi Share was a special right convertible preference share held by the Crown prior to the Demerger, which acted as a constitutional mechanism to impose ownership restrictions on Telecom. Prior to 1 December 2011, as part of the Demerger, the Kiwi Share was converted into an ordinary share and the ownership restrictions embodied in the Kiwi Share ceased to exist.
Prior to 2001 the universal service obligations embodied in Telecom’s constitution were known as the Kiwi Share Obligations. The Kiwi Share Obligations required Telecom to ensure the availability and affordability of basic telecommunications services for New Zealanders. In 2001 a Telecommunications Service Obligation (TSO) framework was put in place and aspects of the Kiwi Share Obligations were subsumed in a deed between Telecom and the Crown. The TSO is the regulatory mechanism by which universal service obligations for residential, local access and calling services are imposed and administered.
Under this obligation Telecom is required to:
• provide free local and emergency calling;
• limit local residential telephone service price increases to the rate of increase in the consumer price index; and
• ensure that line rentals for local residential telephone services in rural areas are not higher than the standard rental.
The Government is required under the Telecommunications Amendment Act to commence a comprehensive review of the TSO at the start of 2013.

| 147investor.telecom.co.nz
Remuneration at Telecom
Letter from the Human Resources and Compensation Committee chairman
Dear Shareholder
As the new chairman of the Human Resources and Compensation Committee (HRCC), I am pleased to present the Remuneration section of Telecom’s annual report for the year ended 30 June 2012.
FY12 has seen a significant amount of change for Telecom, with the most significant change being the Demerger from Chorus in November 2011. During this period we also saw the composition of the board change, which resulted in myself, Mark Verbiest and Maury Leyland joining Kevin Roberts on the HRCC. During this period of significant change I am proud to say Telecom has performed well which has resulted in above target incentive outcomes and the value delivered to shareholders through the Demerger has allowed previously granted long-term incentives to partially vest.
Since Demerger the HRCC has focused on ensuring that the remuneration structure of the CEO and Executive team is linked to both short and longer-term performance of the Company and is better aligned with shareholders’ long-term interests. We have created an improved incentive structure with three components: a short-term annual cash-based incentive, an equity incentive scheme that is linked both to achievement of annual performance targets and share price performance, and the current long-term incentive (LTI) with post-allocation hurdles, which means no reward is provided unless shareholders are similarly rewarded. The target total incentive for each individual will not change but the change in incentive mix is designed to increase alignment to shareholder interests by delivering a greater proportion of incentive in equity and reduce the annual cash bonus. For further detail on these changes please see Incentive changes in FY13 below.
Finally, a number of changes have been made to the appearance and format of the Remuneration section of the annual report this year. The intention is to provide you with greater clarity and to provide greater focus on the areas we believe you have the most interest. We continue to include the necessary disclosure obligations we have under New Zealand, Australian and United States legislation and listing rules to which we are subject. We welcome your feedback on this new format.
Yours sincerely
Justine SmythThe Human Resources and Compensation Committee chairman

Telecom Annual Report 2012148 |
governance
Non-executive director remunerationDirectors’ fees The total remuneration available to non-executive directors is fixed by shareholders. The current annual fee pool limit is NZ$1,500,000 and has not been increased since it was approved by shareholders at the Annual Meeting in October 2003.
The Human Resources and Compensation Committee annually reviews director remuneration taking into account the responsibilities, skills, performance and experience of the directors and then makes appropriate recommendations to the board. The Committee takes advice from independent consultants to ensure that remuneration is in line with other comparable companies in New Zealand.
During FY12 the fee structure for non-executive directors was reset taking into account the smaller size of the Company post the Demerger, as follows:
1 DECEMBER 2011 – 30 JUNE 2012
(CURRENT)
1 JULY 2011 – 30 NOVEMBER 2011
(PREVIOUS)
BOARD/COMMITTEE1 CHAIRMAN MEMBER CHAIRMAN MEMBER
Base Fee – Board of Directors
$330,000 $130,000 $435,000 $145,000
Audit and Risk Management Committee
$35,000 $17,000 $30,000 $15,000
Human Resources and Compensation Committee
$30,000 $15,000 $30,000 $15,000
Nominations and Corporate Governance Committee
– – $30,000 $15,000
1 Committee chair and member fees are not payable to the chairman of the board, and committee member fees are not payable to committee chairs. Where a director is the member or chairman of more than one board committee, the director receives the single highest applicable fee.
In addition, prior to the Demerger, the Telecom board representative appointed to the Independent Oversight Group received a fee of $30,000 per annum. The Independent Oversight Group was disestablished following the Demerger.
No director (excluding the CEO) receives compensation in the form of stock options or restricted shares or participates in a bonus or profit-sharing plan.
During FY12 the total remuneration earned by directors and the other benefits received by the directors of Telecom was as follows:
NAME TOTAL REMUNERATION (NZ$) FOR THE PERIOD 1 JULY 2011 – 30 JUNE 20121
Paul Berriman2 $85,772
Wayne Boyd3 $181,250
Murray Horn $169,170
Maury Leyland2 $84,583
Paul Reynolds4 –
Kevin Roberts $151,250
Sue Sheldon5 $72,917
Charles Sitch2 $85,750
Justine Smyth2 $93,333
Ron Spithill6 $83,333
Mark Verbiest2 $192,500
Total7 $1,199,858
1 The figures shown are gross amounts and exclude GST where applicable. In addition to these amounts Telecom meets costs incurred by directors, which are incidental to the performance of their duties. This includes providing directors with telephone concessions (which includes free telephone line rental, mobile phone, national and international phone calls and online services) and paying the cost of directors’ travel. As these costs are incurred by Telecom to enable directors to perform their duties, no value is attributable to them as benefits to directors for the purposes of the above table.
2 Mr Berriman, Ms Leyland, Mr Sitch, Ms Smyth and Mr Verbiest were appointed as directors from 1 December 2011 and earned a pro-rated amount of fees from that date.
3 Mr Boyd retired as a director on 1 December 2011 and earned a pro-rated amount of his fees to that date.
4 As an executive director, Dr Reynolds did not receive directors’ fees during FY12. For further details of Dr Reynolds’ remuneration see CEO remuneration. Dr Reynolds retired as a director on 31 May 2012.
5 Ms Sheldon retired as a director on 1 December 2011 to take up the Chair of Chorus and earned a pro-rated amount of her fees to that date.
6 Mr Spithill was paid NZ$12,500, as the Telecom board representative on the Independent Oversight Group; this is a pro-rated amount of the $30,000 annual fee for the period from 1 July 2011 to 1 December 2011, when he ceased to be a board member. He was also paid NZ$10,417 as the Telecom representative on the boards of Vodafone Hutchison Australia Pty Limited and Hutchison Telecommunications (Australia) Pty Limited (being companies in which Telecom holds a minority stake) for the period from 1 July 2011 to 1 December 2011, when he ceased to be a Telecom board member.
7 As noted in footnote 4 above, the total excludes the remuneration of the former CEO, Dr Reynolds.
Retirement allowances No retirement allowances are provided to directors.
No director (excluding the CEO) has a service contract with Telecom that provides for benefits or remuneration in the event that the service of any such director with Telecom is terminated. For details of benefits or remuneration to be paid to the CEO in such circumstances, see CEO remuneration.
SuperannuationNo superannuation was paid to any Telecom director during FY12.

| 149investor.telecom.co.nz
Telecom employee remunerationRemuneration GovernanceThe Human Resources and Compensation Committee is responsible for reviewing Telecom’s remuneration and human resources strategy, structure, policy and practices. External expert advice, best practice remuneration structures and market trends are reviewed to ensure that the remuneration strategy for Telecom contributes to effective performance and value creation. The Human Resources and Compensation Committee recognises the vital role people play in the achievement of Telecom’s short-term and long-term objectives as a key source of competitive advantage. To grow and be successful, Telecom must be able to attract, retain and motivate capable employees.
The Committee is also ultimately responsible for the governance of Telecom’s remuneration policies and practices and for ensuring Telecom meets its legislative and regulatory requirements as they relate to remuneration matters. Remuneration governance is an issue that has attracted significant interest in recent years and the global financial crisis has highlighted the need to ensure that remuneration packages are appropriately structured. Significant changes have been made to best practice and the regulatory framework relating to Executive remuneration in Australia, the United Kingdom and the United States in response to this heightened interest from shareholders and the wider community. The Committee continually reviews its policies and practices to ensure it meets best practice requirements in this area.
For the FY12 period prior to the Demerger, the Committee comprised Sue Sheldon (Chair), Wayne Boyd and Kevin Roberts. Following the Demerger, Justine Smyth, Mark Verbiest and Maury Leyland were appointed to the Committee and, along with Kevin Roberts, comprise the current Committee members. Justine Smyth has chaired the Committee since 1 December 2011. During the year the Committee has been responsible for reviewing, approving and making recommendations to the board on a number of significant matters, including the following:
• Implications of the Demerger on Telecom’s incentive schemes;
• Re-design of the CEO and Executive team incentives to more closely align them with long-term shareholder value creation;
• Performance reviews of the CEO and Executive team;
• Setting targets and assessing performance for incentive schemes;
• Approving funding for annual remuneration review;
• Monitoring diversity policy and objectives;
• Selection process for Chorus CEO and directors; and
• Recruitment of the new CEO, Mr Moutter.
For further detail on the role and responsibilities of the Human Resources and Compensation Committee see Board Committees.
Remuneration principlesThere are four key principles determined by the Human Resources and Compensation Committee that underpin Telecom’s remuneration policies.
Supporting each key principle are appropriate policies and practices with clear and established accountabilities and processes.
The principles are:
Our Principles
Rewards are market-competitive to attract and retain talented people
Remuneration is linked to performance so that higher levels of performance attract higher rewards
The overall cost of remuneration is managed and linked to the ability of the Company to pay
Rewards to senior management are aligned to the long-term performance of the Company
1. Rewards are market-competitive to attract and retain talented people The overall remuneration structure is designed to deliver rewards that are competitive in the labour markets in which Telecom competes for people.
Telecom’s senior management positions are evaluated using an internationally recognised job evaluation methodology. Job evaluation assesses the comparative importance of each position in terms of its impact and accountability and ensures internal equity between positions. It also facilitates comparisons of remuneration data between Telecom positions and those in other companies that are meaningful and accurate. Senior manager position evaluations are typically confirmed by an independent expert in job evaluation methodology.
Other positions are allocated a job band (which is defined by job evaluation ranges) through either a job matching process or a similar job evaluation methodology as used for senior positions.
Telecom accesses market remuneration information by sourcing a number of New Zealand and Australian remuneration surveys and seeking independent specialist remuneration advice. This provides comprehensive market information, such as remuneration trends and data, performance-based reward structures and pay levels, including benefits and incentive components for different positions in various industries. These are used to ascertain Telecom’s competitive stance and ensure that Telecom’s rewards are sufficiently competitive.
The Human Resources and Compensation Committee decides Telecom’s position within a comparative market and this determines remuneration ranges. Individual remuneration is set within these ranges taking account of a number of factors, including individual performance and capability, specific business needs, the criticality to Telecom of a specific position or individual, market shortages of specific skills, regional differences and economic climate. Remuneration ranges are reviewed annually to reflect movement in market remuneration.
2. Remuneration is linked to performance so that higher levels of performance attract higher rewards Telecom has a comprehensive performance management process. Overall business strategy shapes Telecom’s corporate plan. It cascades down to business groups and is reflected in business plans and finally in individual performance plans. Individual performance plans, established each year, clarify performance expectations against which individual achievement is assessed.

Telecom Annual Report 2012150 |
governance
Individual performance is a key input into the annual remuneration review decision such that above-target performance results in higher levels of fixed remuneration, while below-target performance results in lower or no increase in fixed remuneration at annual review. Other key inputs into the annual remuneration review decision are current market relativity of that individual’s remuneration package and the individual’s skills and capabilities.
The variable remuneration component is at-risk and entirely performance-based. This component includes specifically designed sales incentives, annual incentives and long-term incentives. Each of Telecom’s incentive schemes links desired performance outcomes with appropriate reward.
• Sales incentives, specific to sales positions, are designed to drive achievement of sales, customer value and service targets.
• Telecom’s annual incentive scheme rewards for both company and individual performance. The annual incentive scheme applies at all levels in the organisation, with the specific structure and amount of incentive based on position level.
• Consistent with market practice, long-term incentives apply only to senior management positions. These incentives link the rewards of those individuals who most directly influence Telecom’s long-term business performance to the delivery of outcomes that increase shareholder value.
3. The overall cost of remuneration is managed and linked to the ability of the Company to pay Telecom has a significant financial investment in its people. Effective growth is dependent on the quality, commitment, innovation and drive of these employees. Telecom aims, in a competitive market, to achieve the appropriate balance between managing overall remuneration costs and investing in people.
Telecom sets a conservative position for its fixed remuneration and pays total remuneration at a higher market level when performance objectives are exceeded (our mix of fixed and at-risk remuneration enables this). The overall remuneration cost is therefore linked to Telecom’s performance and ability to pay.
The total funding available for annual remuneration increases is based on market movement and is approved by the Human Resources and Compensation Committee prior to the remuneration review. The Human Resources and Compensation Committee monitors remuneration costs and practices to ensure they are in line with policy.
4. Rewards to senior management are aligned to the long-term performance of the Company The Human Resources and Compensation Committee makes recommendations to the board on senior management incentive remuneration plans, including long-term incentives. Senior management remuneration packages comprise a fixed portion and an at-risk portion that is only paid when performance objectives are met. An Executive’s remuneration package is comprised of approximately 50% as a fixed component, with the remaining 50% at-risk balancing short and longer-term performance.
Telecom incentive schemesIncentive changes for FY13An extensive work programme was undertaken during FY12 to redesign the incentive structure of the CEO and Executive team’s remuneration. This review was undertaken to ensure the incentives drive achievement of Telecom’s strategic objectives within an evolving regulatory and industry landscape. External advice and research was also undertaken on current and emerging market practice.
As a result of this work programme, from FY13 the CEO and Executive team’s incentive structure is comprised of three components – a short-term annual incentive (see Annual incentive scheme below) and two long-term incentives, one being a post-allocation performance-tested long-term incentive (see Current Long-term incentive schemes below) and the other a new equity-based incentive. Each incentive component has a clear purpose. The purpose of the annual incentive is to drive delivery of the annual business plan; whilst the post-allocation performance- tested long-term incentive is to provide greater alignment between CEO/Executives and shareholder interests, with no vesting occurring unless minimum targets are achieved. The new equity incentive is designed to drive delivery of the annual business plan as does the annual incentive scheme; however the equity incentive defers the delivery of the reward and reduces the incentive available to be paid out at the end of the financial year. As the reward is delivered in equity it creates greater alignment to shareholder interests by delivering a greater proportion of the CEO and Executive team’s incentives in equity. The value granted under the scheme is linked to the short-term annual incentive outcome.
The new equity-based incentive will be awarded under the CEO Performance Equity Scheme and the Executive Equity Incentive Scheme and will be delivered in redeemable ordinary shares. Executives will be prohibited from disposing of the redeemable ordinary shares for a specified period, generally two years. At the end of the specified period the redeemable ordinary shares will automatically reclassify into ordinary shares.
As a consequence of introducing an equity-based incentive, the target values of the short-term and long-term incentives were reduced, as was the cash component of the package. The following diagram illustrates a typical Telecom Executive’s incentive construct before and after the changes to be implemented in FY13. A typical Executive’s remuneration package will continue to be comprised of 50% at-risk, with more than half of that at-risk component being delivered through an equity scheme.

| 151investor.telecom.co.nz
Typical Executive Incentive Mix
Annual incentive
22%
Equity incentive 14%
Long-term incentive 14%
Fixed pay 50%
Annual incentive
30%
Long-term incentive 20%
Fixed pay 50%
Tota
l Pac
kage
Tota
l Pac
kage
FY12 FY13
Annual incentive schemeTelecom’s annual incentive scheme is an integral part of Telecom’s overall approach to competitive performance-based remuneration. It aims to reward eligible individuals for meeting or exceeding individual and company targets that are aligned to Telecom’s strategic direction.
The board determines Telecom’s strategy and measures of success and agrees a corporate plan, with reference to external performance benchmarks. Based on this agreed plan, business performance targets are set at the beginning of the year with the board assessing performance against these targets following the completion of the financial year. Business plans cascade down the Company to form the basis of individual performance plans. These plans translate high-level corporate strategies and targets into individual objectives that are specific, measurable, achievable, realistic and time bound. Objectives are set to define, manage and measure against individual performance throughout the year. The incentive design balances business performance and individual performance so that above target performance in both results in above target payments, while below target performance in either results in lower or, in some cases, no incentive payments.
The Demerger of Telecom required that the FY12 financial year be separated into two distinct periods for the purposes of setting targets and assessing performance for the annual incentive scheme. The full FY12 performance outcome was determined by combining the outcomes of these two periods.
Strong performance in FY12 against the agreed customer and financial metrics, as well as achievement of the free cash flow hurdle, resulted in above target business performance and annual incentive outcomes in FY12.
Current Long-term incentive schemes Telecom currently operates equity and cash-based long-term incentive schemes for the CEO, members of the Executive team and senior managers. These schemes are designed to ensure there is an appropriate balance between short-, medium- and longer-term performance objectives.
Telecom’s at-risk long-term incentive schemes have been modified as appropriate over different financial years to maintain appropriate incentivisation in a context of significant transformation in the telecommunications sector. In FY13 (granted in September 2012) long-term incentives will be delivered under the Share Rights Scheme (see Share Rights Scheme below) and the Restricted Share Scheme (see Restricted Share Scheme below). In FY11 and FY12 incentives for selected senior managers were delivered under cash-based incentive schemes which were introduced in anticipation of the Demerger occurring.
Awards made to the CEO and the Executive team in FY12 and FY13 are subject to post-allocation performance hurdles, with outcomes approved by the Human Resources and Compensation Committee. Awards made to senior managers in FY12 and FY13 are subject to a pre-allocation performance hurdle, with the quantum of their award determined by their annual performance outcome achieved for the previous year ended 30 June. This is the same performance outcome that is applied to the annual cash-based incentive scheme (see Annual incentive scheme) and comprises individual and business performance targets.
The long-term incentive schemes currently operating at Telecom during FY12 for the Executive team and senior managers are summarised in the table below. See CEO Remuneration for details of the CEO’s long-term incentive schemes. For details of the new
SCHEME TYPE GRANTED IN EXECUTIVE SENIOR MANAGERS
Telecom Share Rights Scheme
Share-based incentive FY13, FY10 and FY09
Eligible
Three year vesting
Post-allocation performance hurdle
Only Australian employees eligible
Three year vesting
Pre-allocation performance hurdle
Telecom Restricted Share Scheme
Share-based incentive FY13, FY10 and FY09
Ineligible Only New Zealand employees eligible
Three year vesting
Pre-allocation performance hurdle
Telecom Equity Link Scheme
A cash-based incentive which is directly linked to the share price performance of Telecom
FY12 Eligible
Three year vesting
Post-allocation performance hurdle
Eligible
Three year vesting
Pre-allocation performance hurdle
Telecom Cash-based LTI Scheme
A cash-based performance incentive
FY11 Eligible
Two year vesting
Post-allocation performance hurdle
Eligible
Three year vesting
Pre-allocation performance hurdle

Telecom Annual Report 2012152 |
governance
equity-based incentive see Incentive Changes for FY13 above. The first awards to be made to the CEO and Executive team under the new CEO Performance Equity Scheme and the Executive Equity Incentive Scheme will occur following the end of FY13.
Restricted Share SchemeThe Restricted Share Scheme was introduced in September 2001 with the objective of aligning employee incentives with shareholder value without the dilutionary impact of widespread use of share options. Eligibility for this scheme is restricted to New Zealand senior managers (excluding Executives).
Under the Restricted Share Scheme, ordinary shares in Telecom are issued to Telecom Trustee Limited, a Telecom subsidiary. Participants purchase shares from Telecom Trustee Limited with funds lent to them by Telecom and which are held on their behalf by Telecom Trustee Limited. Telecom Trustee Limited cannot exercise any voting rights attached to the shares. However, once vested, the shares have the same voting rights as ordinary shares.
Generally, the shares vest after a three-year period, although a reduced period may be used in some cases. If the individual is still employed by Telecom at the end of the vesting period, the employee is provided a cash bonus which must be used to repay the loan and the shares are then transferred to the individual. Under special circumstances, individuals who cease employment prior to the end of the vesting period can receive a partial award under the Restricted Share Scheme. Restricted shares may be eligible for dividends.
As a result of the Demerger, the trustee under the Restricted Share Scheme received Chorus shares in respect of the Telecom ordinary shares it held on behalf of participants in the same manner as other eligible holders of Telecom shares.
The trustee allocated such Chorus shares to participants in the scheme on a pro-rata basis to the number of shares it held on behalf of each participant and such Chorus shares vested immediately. In addition, the Telecom shares held by the trustee on behalf of any Chorus employees vested immediately. The trustee continued to hold Telecom shares on behalf of Telecom employees in accordance with the scheme.
Share Rights SchemeThe Share Rights Scheme was also introduced in September 2001 as an alternative scheme to the Restricted Share Scheme for the Executive team and Australian senior managers.
Under the Share Rights Scheme, participants are granted rights to purchase Telecom shares at a nil cost strike price. Share rights have no voting rights until exercised and generally cannot be exercised for a three-year period. The share rights will be exercisable at the end of the vesting period only if the individual is still employed by Telecom and, in the case of Executives, a total shareholder return performance hurdle has been met. In special circumstances early vesting may occur.
The value of each share right granted under the Share Rights Scheme changed as a result of the Demerger and in FY12 participants in the scheme received an additional number of share rights in Telecom to reflect such changes in value of the share rights. Participants did not receive any Chorus share rights or shares.
The total number of restricted shares and share rights on issue under these schemes comprised less than 1% of the total shares on issue at 30 June 2012. See note 24 to the financial statements in Performance for more details.
Equity Link Scheme (discontinued)In FY12 the Executive team and senior managers received their long-term incentive awards under the Equity Link Scheme. This scheme was introduced to avoid creating additional complexity by issuing securities under the existing Restricted Share and Share Rights Schemes at a time when the capital structure of the Company was anticipated to change as a result of the Demerger. The Equity Link Scheme provides a cash payment of an amount that is adjusted upwards or downwards based on Telecom share price movement over the specified period, ensuring that the value of the incentive payment is linked to share price performance. Vesting will occur in September 2014, provided the individual is still employed by Telecom. Telecom does not intend to deliver further incentives under the Equity Link Scheme.
Grants to any participants in the Telecom Equity Link Scheme who became employees of Chorus following the Demerger transferred to an equivalent Chorus scheme.
Cash-based LTI Scheme (discontinued)In FY11 the Executive team and senior managers received their long-term incentive awards under a cash-based performance scheme. This cash-based scheme was introduced as it was believed to be an appropriate way to incentivise senior management during a time of extraordinary transformation occurring in the telecommunications industry and to more closely link the Executive and senior managers to deliverables that they could meaningfully influence in the period.
For current Executives, vesting and payment will occur in September 2012, subject to performance hurdle testing and provided the relevant Executive is still employed by Telecom. For senior managers, payment will occur in September 2013, provided the senior manager is still employed by Telecom. In special circumstances early vesting may occur.Telecom does not intend to deliver further incentives under the Cash-based LTI Scheme.
Chorus long-term incentive schemes (legacy)Prior to the Demerger, Telecom was subject to the Undertakings which specified that Chorus employees could not be granted Telecom equity or receive incentives linked to Telecom performance. As a result Chorus long-term incentive schemes pre-FY12 were cash-based. In FY12 eligible Chorus employees received their long-term equity grants under an equity link scheme equivalent to that described above but relating to Chorus shares instead. All cash-based grants made to Chorus employees transferred to Chorus, with payment at vesting to be paid by Chorus.
Telecom Share Option Scheme (legacy)The Telecom Share Option Scheme was introduced in 1994. This scheme has been discontinued and the lapse date of the last tranche of options was 16 September 2011. There are no outstanding options under this scheme.

| 153investor.telecom.co.nz
Superannuation During FY12 Telecom made pension contributions of NZ$0.9 million to the New Zealand Government Superannuation Fund (FY11: NZ$1 million; FY10: NZ$1 million; FY09: NZ$1 million; FY08: NZ$1 million) and NZ$11 million on behalf of Australian employees as required by the Superannuation Guarantee (Administration) Act 1992 (FY11: NZ$14 million; FY10: NZ$15 million; FY09: NZ$18 million; FY08: NZ$10 million). With effect from 1 April 2009, the KiwiSaver Act 2008 required Telecom to make a contribution of 2% of total gross earnings for all New Zealand employees contributing to a KiwiSaver superannuation fund.
Total KiwiSaver Employer Contributions made by Telecom for FY12 were NZ$7.4 million (FY11: NZ$6 million FY10: NZ$4 million; FY09: NZ$2 million; FY08: NZ$266,324).
Executive retirement or redundancy Typically, the Executive employment agreements provide that, in the event an Executive is made redundant, he or she will be entitled to redundancy compensation equivalent to nine months of the Executive’s total base remuneration. The Executive will also be entitled to receive any incentive scheme entitlement in accordance with the rules of the relevant incentive scheme, in the event of his or her redundancy.
CEO remunerationMr Simon Moutter commenced as CEO of Telecom on 13 August 2012. Mr Chris Quin was Acting CEO for the period 1 June 2012 to the commencement date of Mr Moutter’s appointment. Dr Paul Reynolds’ final date of employment was 30 June 2012; however, during the month of June he handed over the CEO duties and provided support to Mr Quin in transition. Details of Dr Reynolds and Mr Moutter’s employment and remuneration arrangements are provided below.
Simon Moutter
Employment agreement and termination benefitsMr Moutter has an employment agreement that commenced on 13 August 2012. The agreement is not a fixed-term contract.
The employment agreement may be terminated by the board on three months’ notice. If the board gives notice of termination, Telecom must pay the CEO a termination payment equal to nine months’ base remuneration. In addition, the board retains sole discretion to determine any entitlements under the CEO’s annual performance incentive, performance equity incentive and long-term performance incentive schemes (all outlined below), subject to the rules of these schemes.
The employment agreement may also be terminated by the board without notice, in the event that the board considers the CEO to be guilty of serious misconduct which justifies summary dismissal or if the CEO commits an act of bankruptcy. In such an event, the CEO is only entitled to his base remuneration and accrued statutory holiday pay and all other entitlements will be forfeited.
The agreement may be terminated by the CEO on three months’ notice within three months of a fundamental change occurring. A ‘fundamental change’ is where the CEO is no longer the CEO of
a company listed on either the New Zealand or Australian stock exchanges and, as a result, the terms of his employment are materially different from those set out in his employment agreement. If such a fundamental change occurs, the CEO is entitled to a payment as if the board had terminated his employment agreement on notice. The CEO may also, at any time, terminate the agreement on six months’ notice. During such notice period, the CEO will continue to receive all remuneration and other entitlements under the agreement.
The board may elect to pay the CEO an amount based on his base remuneration in lieu of all or part of any termination notice period.
If the CEO is prevented from carrying out his duties by personal accident, death or ill health, the board may in certain circumstances terminate the agreement immediately and make a payment equal to nine months’ base remuneration to the CEO. There is no redundancy payment provision in the CEO’s employment agreement.
RemunerationIn determining the CEOs remuneration package, the board considered the scope and complexity of the CEOs role, the high calibre of Mr Moutter, external expert advice on best practice remuneration structures, the business challenges facing the Telecom Group and market practice for the remuneration of chief executive officers in positions of similar responsibility in New Zealand and Australia.
The CEO’s employment agreement provides that his remuneration package (including annual target values of the incentive components) will be reviewed each year at 1 July, with the first such review at 1 July 2013.
As the CEO is a director of Telecom, the issue of shares or share rights to him must be approved by an ordinary resolution of shareholders at Telecom’s Annual Meeting to be held on 28 September 2012.
The CEO’s remuneration package for FY13 comprises:
1. Fixed cash remuneration of NZ$1,350,000 per annum.
2. An annual cash-based short-term incentive with a target value of NZ$750,000 with the actual incentive award achieved being determined by the board based on Telecom and CEO performance against annual performance criteria.
3. An equity incentive award delivered in Telecom redeemable ordinary shares with a target value of NZ$600,000 per annum. This award will be made under the CEO Performance Equity Scheme described further below.
4. A long-term incentive delivered in the form of a grant of NZ$1,000,000 of share rights to acquire Telecom ordinary shares subject to the CEO achieving specified performance hurdles. This grant will be made under the CEO Performance Rights Scheme described further below.
The CEO’s employment agreement also provides for a one-off grant of NZ$750,000 share rights to acquire ordinary shares in Telecom (Additional Grant) to be made in FY13, subject to shareholder approval. This grant will be made under the CEO Performance Rights Scheme; however it will differ from other grants under that scheme in that there are no performance criteria attached to it.

Telecom Annual Report 2012154 |
governance
In addition, 50% of the share rights will be exercisable one year after the grant and the remaining 50% will be exercisable two years after the grant.
Payments or awards under the CEO’s cash-based short-term incentive and equity incentive will be pro-rated for FY13 from the date of the CEO’s commencement of employment with Telecom.
CEO Incentive Schemes
CEO Annual Performance Incentive SchemeThe CEO is eligible for an annual cash-based short-term incentive which is subject to his achievement of specific performance objectives set by the board based on the agreed strategy and business plan for the respective financial year. The specific performance objectives will be based on Telecom’s business and strategic plans. These objectives will be set at the beginning of each financial year and assessed at the end of the financial year by the board when it makes its determination of the incentive award. The board will assess the CEO’s performance and determine the actual payment value of his short-term incentive in the range of 0 to 175% of his target value.
CEO Performance Equity SchemeThe CEO Performance Equity Scheme is intended to reward the CEO for achieving pre-specified target levels of performance during a financial year and to align the CEO’s remuneration with the long-term performance of Telecom. The performance objectives that apply under this scheme are the same as those that apply under the CEO Annual Performance Incentive Scheme. The board will assess the CEO’s performance and determine the actual award in the range of 0 to 175% of his target value. The incentive award will be delivered in redeemable ordinary shares, however, if shareholder approval is not obtained or at the board’s discretion, this award can be delivered in cash. The CEO is prohibited from disposing of the redeemable ordinary shares for a specified period, generally two years and Telecom may redeem the shares in certain termination situations. At the end of the specified period they will automatically reclassify into ordinary shares. The issue of the shares on these conditions links a substantial part of the CEO’s remuneration with the share price performance of Telecom.
The grant of redeemable ordinary shares to the CEO is subject to approval by shareholders. Approval will be sought for the issue of a maximum number of redeemable ordinary shares to the CEO under the CEO Performance Equity Scheme over three years at the Annual Meeting on 28 September 2012. Subject to shareholder approval, the first issue of shares under the CEO Performance Equity Scheme is expected to occur in September 2013. Subsequent grants of shares will be at the discretion of the board within the context of the approval granted by shareholders and may be made in September of each year but in no case later than three years after the date of the 2012 Annual Meeting.
CEO Performance Rights SchemeThe CEO Performance Rights Scheme is intended to link part of the CEO’s remuneration with the long-term performance of Telecom
and align the CEO’s interests with those of shareholders, through the granting of equity with post-allocation performance testing.
Subject to obtaining shareholder approval, the CEO will receive an annual long-term incentive award of NZ$1,000,000 of share rights in FY13.
Shareholder approval will be sought for the issue of a maximum number of share rights to the CEO under the CEO Performance Rights Scheme over three years at the Annual Meeting on 28 September 2012. If such approval is obtained, the first issue of shares under the CEO Performance Rights Scheme is expected to occur in October 2012. Subsequent grants of share rights will be at the discretion of the board and may be made in September of each year but in no case later than three years after the date of the 2012 Annual Meeting.
Each share right is granted for no cash consideration and provides the right to purchase one Telecom ordinary share for no cash consideration (that is, each share right has a nil exercise price). The board will set the period after which share rights are eligible for vesting (that is, become exercisable) at the time a grant is made. For the grant for FY13, the board has determined that one-half of the share rights will be eligible for vesting two years after the grant, and one-half of the share rights will be exercisable three years after the grant. For subsequent grants of share rights it is anticipated that the board will specify that share rights be eligible for vesting three years after the grant.
The ability of any of the share rights to vest and the number of share rights that will vest following the end of the vesting period, is dependent on the applicable performance hurdle being met. There will be a re-test 12 months after the initial testing of the performance hurdle.
Each share right converts to one ordinary share on exercise or, at the board’s discretion, a cash amount equal to the value of the shares can be paid instead.
Performance HurdleShare rights granted under the CEO Performance Rights Scheme (other than the Additional Grant) can only be exercised if the applicable performance hurdle has been met. Testing to determine whether the performance hurdle has been met will occur at the end of the vesting period of the grant. In order for share rights to be exercised, the minimum threshold of this hurdle must be met. If the maximum performance hurdle is not met, there will be a re-test twelve months later using the same methodology. The board may amend the performance hurdle or specify a different performance hurdle or specify a different re-test date for future grants of share rights under the CEO Performance Rights Scheme if it determines, in its discretion, that the proposed performance hurdle ceases to be appropriate. The performance hurdle for a particular grant of share rights cannot be changed after those share rights have been granted. Achievement of the performance hurdle will be determined by the board following receipt of data that verifies that the performance hurdle has been met for each tranche of share rights. Once the performance hurdle is met, the share rights may be exercised up to and including the lapse date.
| 155investor.telecom.co.nz
The board also has discretion to grant shares rights with no performance hurdles. It is anticipated that the board will specify that subsequent grants of share rights are subject to performance hurdles.
Dr Reynolds
Employment agreement and termination benefitsDr Reynolds’ employment agreement commenced on 27 September 2007 and was not a fixed-term contract. The pre-Demerger board and Dr Reynolds agreed that Dr Reynolds’ employment would cease on 30 June 2012 and that he would receive a termination payment of 12 months’ base remuneration on that date.
RemunerationDr Reynolds’ remuneration package reflected the scope and complexity of the CEO role, with responsibility for leading Telecom through a period of significant transformation and, ultimately, the establishment of two separately listed companies during FY12. His remuneration was performance-based so that it was directly linked to the long-term performance of Telecom. The package included a combination of (i) a fixed cash component, (ii) an at-risk short-term annual incentive award (to be paid under his Performance Incentive Scheme) and (iii) an at-risk long-term incentive award (to be paid under his applicable long-term incentive scheme).
As with all Telecom Executives and senior managers, Dr Reynolds’ at-risk long-term incentive schemes were modified as appropriate
over different financial years to maintain appropriate incentivisation in the context of significant transformation in the telecommunications sector.
In September 2011 Dr Reynolds was granted a cash-based incentive, directly linked to Telecom’s share price performance. This grant was made under the same scheme as that made to the Executive team and senior managers and described in Equity Link Scheme. The cash-based equity link grant lapsed in full upon Dr Reynolds’ termination and he received no payment under this scheme.
In September 2010 Dr Reynolds’ long-term incentive was structured as a cash-based performance incentive. This grant was also made under the same scheme as that made to the Executive team and senior managers and described in Cash-based LTI Scheme.
Prior to 2010 Dr Reynolds’ long-term incentive comprised either share rights granted under his Performance Rights Scheme or a combination of performance rights and entitlements granted under his Performance Entitlements Scheme. These schemes operated as described in Telecom’s 2011 annual report. The value of previously granted performance rights and performance entitlements granted under Dr Reynolds’ long-term incentive schemes changed as a result of the Demerger and Dr Reynolds received an additional number of performance rights on Demerger to reflect such change in value. The value of the initial grants remain unchanged.
Remuneration for period ending 30 June 2012The table below shows the details of the remuneration earned by or paid to, Dr Reynolds prior to his departure for FY12.
BASE SALARY FIXED1
SHORT-TERM INCENTIVE2 AT RISK (EARNED IN FY12, PAID IN FY12)
LONG-TERM INCENTIVE AT RISK VESTED / EXERCISED IN FY12
SPECIAL PAYMENTS3
TERMINATION PAYMENTS4
NZ$1,906,836 NZ$1,750,000 274,204 performance rights5
491,127 performance incentive shares6
NZ$2,100,0007
$331,552 NZ$1,750,000
1 This includes 12 months’ base remuneration for the period worked 1 July 2011 to 30 June 2012 and annual leave owing at the time of Dr Reynolds’ termination.
2 This is the gross actual annual incentive earned for FY12 and paid in FY12, being 100% of Dr Reynolds’ target value under his Performance Incentive Scheme. For FY11 and FY12, the board exercised its discretion to deliver Dr Reynolds’ annual short-term incentive amount earned for the relevant year entirely in cash. The gross amount earned for FY11 and paid during FY12 was NZ$3,062,500.
3 Special payments include payment for personal travel between New Zealand and the United Kingdom, gross accommodation payments and obtaining tax advice.
4 Dr Reynolds was paid 12 months’ base remuneration in accordance with the agreed termination terms. See Employment agreement and termination benefits above.
5 668,790 performance rights were granted to Dr Reynolds in FY09 and 274,204 vested after initial testing in September 2011. The 512,128 remaining performance rights (includes 117,542 additional performance rights granted as an adjustment on Demerger) are subject to re-testing in September 2012.
6 The board exercised its discretion to unrestrict 280,258 and 108,878 performance incentive shares granted in FY10 and FY11 respectively under Dr Reynolds’ Performance Incentive Scheme, on 25 May 2012.
7 This is the maximum of the cash-incentive that Dr Reynolds was eligible to receive under the cash-based long-term incentive scheme granted in September 2010. The pre-Demerger board exercised its discretion to make this payment on Dr Reynolds’ termination, prior to the vesting date of 15 September 2012 as all targets had been achieved in full.

Telecom Annual Report 2012156 |
governance
Lapsing of LTI134,100 of the performance rights granted to Dr Reynolds in FY08, with a value of NZ$583,333 at the time of grant, lapsed during FY12 and Dr Reynolds received no value in relation to them.
In September 2011 (FY12) Dr Reynolds was granted his long-term incentive under the Equity Link Scheme, with a total of 1,027,867 equity equivalent units granted. This incentive was to vest after three years (in September 2014), subject to achieving specific hurdles set by the board. The value at the time of the grant was $2,100,000. This grant lapsed in full upon Dr Reynolds termination and he received no value under the grant.
Demerger adjustmentsConsistent with the treatment of equity-based incentives held by other employees, the value of previously granted performance rights and performance entitlements granted under Dr Reynolds’ long-term incentive schemes were adjusted to take account of Demerger and Dr Reynolds received an additional number of performance rights (117,542 for FY09 and 202,238 for FY10) and performance entitlements (28,596 for FY10) on Demerger to reflect such change in value. The value of the initial grants remain unchanged.
Termination termsDr Reynolds has the opportunity for existing performance rights and performance entitlements to vest on their original test and re-test dates as follows:
• 512,128 performance rights under the Performance Rights Scheme subject to re-testing in September 2012; and
• 881,148 performance rights and 124,594 performance entitlements under the relevant scheme subject to initial testing in September 2012 and re-testing in September 2013.
As Dr Reynolds ceased employment prior to the lapse date of these grants, the pre-Demerger board exercised its discretion to enable these grants to remain live and proceed through performance testing and re-testing.
In addition, reasonable relocation costs for Dr Reynolds and his family to return to the United Kingdom and accommodation and telephony costs for a period of up to two months following Dr Reynolds’ termination where provided as part of his termination terms.

| 157investor.telecom.co.nz
Rem
uner
atio
n of
Exe
cutiv
es
The
tabl
e be
low
sho
ws
the
deta
ils o
f the
rem
uner
atio
n pa
id a
nd e
arne
d du
ring
FY12
for e
ach
of th
e Ex
ecut
ives
em
ploy
ed b
y Te
leco
m a
t 30
June
201
2 (e
xclu
ding
the
form
er C
EO, D
r Rey
nold
s, w
hose
co
mpe
nsat
ion
is d
iscl
osed
und
er C
EO re
mun
erat
ion)
.
EXEC
UTI
VEM
OST
REC
ENT
POSI
TIO
N T
ITLE
FIXE
D R
EMU
NER
ATIO
NAT
-RIS
K IN
CEN
TIVE
S (S
UBJ
ECT
TO P
ERFO
RMA
NC
E TE
STIN
G)
SPEC
IAL
PAYM
ENTS
4
BASE
SA
LARY
1SH
ORT
-TER
M IN
CEN
TIVE
EA
RNED
IN F
Y122
(PA
ID D
URI
NG
YEA
R FY
13)
LON
G-T
ERM
INC
ENTI
VE V
ESTE
D/
TRA
NSF
ERRE
D IN
FY1
23LO
NG
-TER
M IN
CEN
TIVE
LA
PSED
IN F
Y12
Ala
n G
ourd
ieCE
O R
etai
l$7
60,0
00$4
87,5
1945
,266
Sha
re R
ight
s32
,569
Sha
re R
ight
s$0
Nic
k O
lson
Chie
f Fin
anci
al O
ffice
r$6
70,0
00$6
08,4
00–
108,
020
Shar
e O
ptio
ns$9
8,63
7
Chris
Qui
nCE
O G
en-i5
$650
,000
$642
,623
32,9
05 S
hare
Rig
hts
113,
127
Shar
e O
ptio
ns$1
6,43
86
Dav
id H
aver
crof
t G
roup
Chi
ef Te
chno
logy
Offi
cer
$600
,000
$505
,440
––
$2,8
75
Rod
Snod
gras
sCh
ief P
rodu
ct O
ffice
r$5
50,0
00$2
89,5
7526
,637
Sha
re R
ight
s–
$0
Tris
tan
Gilb
erts
onG
roup
Gen
eral
Cou
nsel
&
Com
pany
Sec
reta
ry$4
70,0
00$3
29,9
4014
,450
Sha
re R
ight
s10
,398
Sha
re R
ight
s$2
,144
1 Ba
se s
alar
y is
the
tota
l cos
t to
Tele
com
of s
alar
y an
d p
acka
ged
ben
efits
rece
ived
in F
Y12.
As
pro
vide
d fo
r oth
er
Tele
com
em
plo
yees
, the
ab
ove
indi
vidu
als
also
rece
ive
tele
pho
ne c
once
ssio
ns, w
hich
incl
ude
free
tele
pho
ne li
ne
rent
al, n
atio
nal a
nd in
tern
atio
nal c
alls
, mob
ile a
nd o
nlin
e se
rvic
es. T
he v
alue
of t
his
tele
pho
ne c
once
ssio
n is
not
in
clud
ed in
this
figu
re. I
n ad
ditio
n, th
e ab
ove
indi
vidu
als
rece
ive
de m
inim
is a
mou
nts
by w
ay o
f con
trib
utio
ns to
m
edic
al in
sura
nce
pre
miu
ms
and
mem
ber
ship
of t
he M
arra
m T
rust
(a c
omm
unit
y he
alth
care
and
hol
iday
ac
com
mod
atio
n p
rovi
der)
. If t
he in
divi
dual
is a
Kiw
iSav
er m
emb
er, a
con
trib
utio
n of
2%
of g
ross
ear
ning
s is
m
ade
tow
ards
that
indi
vidu
al’s
Kiw
iSav
er s
chem
e. T
hese
am
ount
s ar
e no
t inc
lude
d in
this
figu
re. T
he K
iwiS
aver
m
emb
ers
as a
t 30
June
201
2 w
ere
Ala
n G
ourd
ie a
nd T
rista
n G
ilber
tson
.
2 Th
is a
mou
nt is
the
actu
al a
nnua
l inc
entiv
e ea
rned
by
the
rele
vant
Exe
cutiv
e fo
r FY1
2 an
d p
aid
in A
ugus
t 201
2,
bei
ng F
Y13.
The
act
ual a
nnua
l sho
rt-t
erm
ince
ntiv
e ea
rned
by
the
Exec
utiv
es fo
r FY1
1 an
d p
aid
in A
ugus
t 201
1,
bei
ng F
Y12
was
: Ala
n G
ourd
ie $
681,
200,
Nic
k O
lson
$57
7,89
1, C
hris
Qui
n $6
44,5
20, D
avid
Hav
ercr
oft $
561,
990,
Ro
d Sn
odgr
ass
$389
,366
and
Tris
tan
Gilb
erts
on $
397,
716.
3 Th
e va
lue
of s
hare
righ
ts g
rant
ed in
FY0
9 an
d FY
10 w
ere
adju
sted
on
Dem
erge
r and
Exe
cutiv
es (c
onsi
sten
t with
ot
her e
mp
loye
es) h
oldi
ng s
hare
righ
ts o
n th
e da
te o
f the
Dem
erge
r rec
eive
d an
add
ition
al n
umb
er o
f sha
re
right
s to
refle
ct s
uch
chan
ge in
val
ue. T
he n
umb
er o
f add
ition
al s
hare
righ
ts re
ceiv
ed w
as: A
lan
Gou
rdie
66,
861,
C
hris
Qui
n 37
,188
, Rod
Sno
dgra
ss 3
0,10
6 an
d Tr
ista
n G
ilber
tson
21,
344.
In S
epte
mb
er 2
011
(FY1
2) E
xecu
tives
w
ere
gran
ted
thei
r lon
g-te
rm in
cent
ive
unde
r the
Equ
ity
Link
Sch
eme.
Exe
cutiv
es w
ere
gran
ted
equi
ty
equi
vale
nt u
nits
ves
ting
in S
epte
mb
er 2
014
(ie, F
Y15)
if th
e re
leva
nt E
xecu
tive
is s
till e
mp
loye
d by
Tel
ecom
and
th
e p
ost-
allo
catio
n p
erfo
rman
ce h
urdl
es a
ttac
hed
to th
e re
leva
nt in
cent
ive
are
met
. The
num
ber
of e
quit
y eq
uiva
lent
uni
ts g
rant
ed w
as: A
lan
Gou
rdie
254
,519
, Nic
k O
lson
132
,154
, Chr
is Q
uin
174,
224,
Dav
id H
aver
crof
t 11
7,47
1, R
od S
nodg
rass
107
,681
and
Tris
tan
Gilb
erts
on 9
2,01
9.
4 S
pec
ial p
aym
ents
incl
ude
pay
men
ts fo
r tax
atio
n ad
vice
, util
ity
cost
s, a
ccom
mod
atio
n al
low
ance
s an
d ac
ting
pay
men
ts.
5 C
hris
Qui
n ac
ted
in th
e ro
le o
f CEO
for t
he p
erio
d 1
June
201
2 to
12
Aug
ust 2
012.
6 Th
is is
the
pay
men
t ear
ned
for t
he a
ctin
g C
EO ro
le fo
r the
per
iod
1 Ju
ne 2
012
to 3
0 Ju
ne 2
012
(FY1
2) b
ut it
will
no
t be
pai
d un
til th
e co
mp
letio
n of
the
actin
g p
erio
d in
FY1
3.
The
aggr
egat
e am
ount
of c
ompe
nsat
ion
earn
ed b
y an
d be
nefit
s gr
ante
d to
all
mem
bers
of
the
Exec
utiv
e te
am (i
nclu
ding
Dr R
eyno
lds)
dur
ing
FY12
was
NZ$
15,5
09,0
41. T
his
figur
e in
clud
es te
rmin
atio
n pa
ymen
ts a
nd o
ther
rem
uner
atio
n an
d be
nefit
s pa
id to
Exe
cutiv
es
who
left
dur
ing
FY12
(inc
ludi
ng D
r Rey
nold
s) a
nd to
peo
ple
who
wer
e in
act
ing
Exec
utiv
e po
sitio
ns d
urin
g FY
12. I
t als
o in
clud
es th
e gr
ant v
alue
of l
ong-
term
ince
ntiv
es g
rant
ed to
all
mem
bers
of t
he E
xecu
tive
team
dur
ing
FY12
; how
ever
Exe
cutiv
es d
o no
t rec
eive
any
val
ue
unde
r lon
g-te
rm in
cent
ives
unl
ess
they
ves
t.
The
aggr
egat
e re
mun
erat
ion
figur
e ex
clud
es th
e LT
I gra
nt m
ade
to D
r Rey
nold
s du
ring
FY12
w
ith a
val
ue o
f $2,
100,
000,
whi
ch la
psed
in fu
ll up
on h
is te
rmin
atio
n an
d he
rece
ived
no
valu
e un
der i
t. Ve
stin
g of
LTI
gra
nted
to c
urre
nt E
xecu
tives
in F
Y12
will
occ
ur in
Sep
tem
ber
2014
(ie,
FY1
5) s
ubje
ct to
con
tinue
d em
ploy
men
t and
sat
isfa
ctio
n of
per
form
ance
hur
dles
.
This
agg
rega
te re
mun
erat
ion
figur
e do
es n
ot in
clud
e th
e va
lue
of c
ash
LTI,
shar
e rig
hts
or
rest
ricte
d sh
ares
ves
ting
in F
Y12,
as
thes
e w
ere
incl
uded
in th
e ag
greg
ate
figur
e fo
r the
re
leva
nt fi
nanc
ial y
ear i
n w
hich
the
LTI w
as g
rant
ed.

Telecom Annual Report 2012158 |
governance
Agg
rega
te e
quit
y ho
ldin
gs a
nd s
hare
ow
ners
hip
of E
xecu
tives
as
at 3
0 Ju
ne 2
012
– in
clud
ing
num
ber g
rant
ed, u
nres
tric
ted,
laps
ed d
urin
g FY
12EX
ECU
TIVE
CLA
SS O
F EQ
UIT
Y SE
CU
RITY
1 N
UM
BER
HEL
D A
T 30
JU
NE
2011
NU
MBE
R G
RAN
TED
D
URI
NG
FY1
2 A
S A
RES
ULT
OF
DEM
ERG
ER
AD
JUST
MEN
T2
NU
MBE
R VE
STED
/ A
CQ
UIR
ED /
U
NRE
STRI
CTE
D
DU
RIN
G F
Y12
NU
MBE
R LA
PSED
/ C
AN
CEL
LED
D
URI
NG
FY1
2
NU
MBE
R EX
ERC
ISED
-/ S
OLD
D
URI
NG
FY1
2
NU
MBE
R H
ELD
AT
30 J
UN
E 20
12EX
ERC
ISE
PRIC
E RA
NG
EEA
RLIE
ST P
OSS
IBLE
EX
ERC
ISE
DAT
E / T
RAN
SFER
D
ATE
RAN
GE
EXPI
RY D
ATE
RAN
GE
Paul
Rey
nold
sPe
rform
ance
Rig
hts
1,48
1,80
031
9,78
027
4,20
4(1
34,1
00)
(274
,204
)1,
393,
276
N/A
16/0
9/11
– 1
6/09
/12
16/1
2/12
– 1
6/12
/13
Perfo
rman
ce
Ince
ntiv
e Sh
ares
3
49
1,12
7 –
(4
91,1
27)4
– –
–
N/A
N
/A
N/A
Ord
inar
y Sh
ares
– –
765,
331
––
765,
331
N/A
N/A
N/A
Tris
tan
Gilb
erts
onSh
are
Righ
ts96
,501
21,3
44(1
4,45
0)(1
0,39
8)(1
4,45
0)92
,997
N/A
16/0
9/11
– 1
6/09
/12
16/1
2/12
– 1
6/12
/13
Ord
inar
y Sh
ares
5,23
4–
14,4
50–
(19,
684)
– N
/AN
/AN
/A
Ala
n G
ourd
ieSh
are
Righ
ts30
2,28
666
,861
(45,
266)
(32,
569)
(45,
266)
291,
312
N/A
16/0
9/11
– 1
6/09
/12
16/1
2/12
– 1
6/12
/13
Ord
inar
y Sh
ares
16
,395
–17
5,26
6–
–19
1,66
1N
/AN
/AN
/A
Dav
id H
aver
crof
tRe
stric
ted
Shar
es28
,704
–
––
–28
,704
N/A
16/1
2/12
N/A
Nic
k O
lson
Shar
e O
ptio
ns10
8,02
0–
– (1
08,0
20)
– –
6.11
N/A
N/A
Rest
ricte
d Sh
ares
67,1
65–
30,8
43–
–36
,322
N/A
16/0
9/12
N/A
Ord
inar
y Sh
ares
10,7
25–
31,5
54–
–42
,279
N/A
N/A
N/A
Chris
Qui
nSh
are
Opt
ions
113,
127
– –
(113
,127
)–
– 6.
11N
/AN
/A
Shar
e Ri
ghts
157,
746
37,1
88(3
2,90
5)–
(32,
905)
162,
029
N/A
16/0
9/11
– 1
6/09
/12
16/1
2/12
– 1
6/12
/13
Ord
inar
y Sh
ares
10,3
03–
32,9
05–
(43,
208)
– N
/AN
/AN
/A
Rod
Sno
dgra
ssSh
are
Righ
ts12
7,70
030
,106
(26,
637)
– (2
6,63
7)13
1,16
9N
/A16
/09/
11 –
16/
09/1
216
/12/
12 –
16/
12/1
3
Ord
inar
y Sh
ares
8,52
4–
26,6
37–
(35,
161)
– N
/AN
/AN
/A
1 Su
bje
ct to
foot
note
2 b
elow
, no
new
per
form
ance
righ
ts, s
hare
op
tions
, sha
re ri
ghts
or r
estr
icte
d sh
ares
wer
e gr
ante
d un
der t
he re
leva
nt in
cent
ive
sche
mes
dur
ing
FY12
. Gra
nts
wer
e m
ade
unde
r the
se s
chem
es in
prio
r yea
rs.
For f
urth
er d
etai
ls o
f the
sp
ecifi
c in
cent
ive
sche
mes
und
er w
hich
the
gran
ts w
ere
mad
e, s
ee C
urre
nt lo
ng-t
erm
in
cent
ive
sche
mes
ab
ove.
2 Th
e va
lue
of e
ach
per
form
ance
righ
t and
sha
re ri
ght g
rant
ed u
nder
the
Perf
orm
ance
Rig
hts
Sche
me
and
the
Shar
e Ri
ghts
Sch
eme
chan
ged
as a
resu
lt o
f Dem
erge
r and
in F
Y12
par
ticip
ants
in th
ese
sche
mes
rece
ived
an
adju
sted
nu
mb
er o
f per
form
ance
righ
ts a
nd s
hare
righ
ts in
Tel
ecom
to re
flect
suc
h ch
ange
s in
val
ue.
3 O
rdin
ary
Tele
com
sha
res
sub
ject
to re
stric
tive
cond
ition
s is
sued
in a
ccor
danc
e w
ith D
r Rey
nold
s’ Pe
rfor
man
ce
Ince
ntiv
e Sc
hem
e.
4. 3
89,1
36 p
erfo
rman
ce in
cent
ive
shar
es v
este
d ea
rly
on D
r Rey
nold
s’ te
rmin
atio
n.
As
at 1
3 A
ugus
t 201
2 th
ere
was
no
chan
ge in
Exe
cutiv
es’ e
quity
inte
rest
s as
des
crib
ed a
bove
.

| 159investor.telecom.co.nz
Value of equity-based compensation – exercised or lapsed The following table details equity-based compensation that was granted to Executives prior to 30 June 2011 that was exercised, unrestricted or lapsed during the period ending 30 June 2012, and the value derived from those securities.
CLASS OF EQUITY SECURITY DATE OF GRANT DATE OF EXERCISE/UNRESTRICTING/LAPSE
NUMBER EXERCISED/ UNRESTRICTED/ (LAPSED)
EXERCISE PRICE NZ$
Paul Reynolds Performance Rights 27/09/07 16/12/11 (134,100) –
16/09/08 23/11/11 274,204 –
Performance Incentive Shares
17/09/08 17/09/11 101,991 –
16/09/09 25/05/12 280,258 –
15/09/10 25/05/12 108,878 –
Tristan Gilbertson Share Rights 16/09/08 09/11/11 14,450 –
16/09/08 16/12/11 (10,398) –
Alan Gourdie Share Rights 16/09/08 17/11/11 45,266 –
16/09/08 16/12/11 (32,569) –
Nick Olson Share Options 16/09/05 16/09/11 (108,020) $6.11
Restricted Shares 16/09/08 16/09/11 30,843 –
Chris Quin Share Options 16/09/05 16/09/11 (113,127) $6.11
Share Rights 16/09/08 14/11/11 32,905 –
Rod Snodgrass Share Rights 16/09/08 10/11/11 26,637 –
The Executive position held by Tina Symmans was disestablished on 31 January 2012. As at 30 June 2012 she held 57,472 share rights.
The Executive position held by Mark Ratcliffe was disestablished on 30 November 2011 as a result of Demerger and Mr Ratcliffe joined Chorus to take up the role of CEO. During FY12 163,667 share options held by Mr Ratcliffe lapsed.

Telecom Annual Report 2012160 |
governance
Employees The table below sets out the total number of employees employed on a headcount basis by Telecom over the past three financial years as at 30 June. Telecom also reports the total number of employees on a full-time equivalent (FTE) basis (see Performance – Key Performance Indicators), which is different to total headcount. The following employee numbers exclude fixed-term employees (ie employees who are employed for a specified period rather than on a permanent basis). At 30 June 2012 there were 107 fixed-term employees. The reduction in employee numbers from 2011 to 2012 is primarily due to the number of employees who ceased to be employed by Telecom and commenced employment with Chorus on Demerger.
YEARS ENDED 30 JUNE 2012 2011 2010
Employees 7,619 8,297 8,629
The diagrams below provide a breakdown of persons employed by Telecom by business unit and geographic location as at 30 June 2012:
Permanent Employees by Business Unit Permanent Employees by Country
CookIslands1
107Technology
& SharedServices
1,877
Retail1,796
Product242
Gen-i2,339
Corporate505
AAPT753
1 Telecom Cook Islands Limited is 60% owned by Telecom.
Cook Islands1
107United States11
Singapore1
New Zealand6,561
Great Britain5
Australia934
The majority of Telecom’s employees reside in New Zealand and are employed on individual employment agreements with no fixed terms. The majority of Telecom’s Australian employees are employed on individual employment agreements with no fixed terms. Federal awards, which specify minimum wages and conditions are relevant to some of these Australian agreements. Fixed term employees and casual contractors are also used.
A minority of employees in New Zealand and Australia belong to unions. In Australia, some employees are members of the Community and Public Sector Union and the Communications Union and in New Zealand some employees are members of the New Zealand Amalgamated Engineering, Printing and Manufacturing Union. Telecom does not require employees to disclose their union membership and, consequently, union details and membership figures are unknown.
Employee remuneration range The table below shows the number of employees and former employees of Telecom, not being directors of Telecom, who, in their capacity as employees, received remuneration and other benefits during FY12 of at least NZ$100,000.
The remuneration figures shown include all monetary payments actually made during the year, including redundancies and the face value of any at-risk long-term incentives granted, where applicable
(although such value will not be realised unless the incentives vest). Long-term incentives vesting during FY12 are not included as such incentives were accounted for in the FY in which they were granted. Long-term incentives granted to employees in FY12 which lapsed during FY12 on the relevant employee’s termination are not included in the figures in the table.
The table includes all monetary payments made to employees during FY12 relating to their employment as a Telecom employee who ceased to be employed by Telecom and commenced employment with Chorus on Demerger. This does not include long-term incentives granted to employees employed by Telecom who commenced employment with Chorus and for whom the liability for payment at vesting transferred to Chorus.
The table does not include amounts paid post 30 June 2012 that related to FY12. Employees receive telephone concessions that can include free telephone line rental, national and international phone calls and online services. The value of this benefit is not included in these remuneration figures.
In addition, certain employees receive contributions towards membership of the Marram Trust (a community healthcare and holiday accommodation provider) contributions to the Government Superannuation Fund (a legacy benefit provided to a small number of employees) and, if the individual is a KiwiSaver
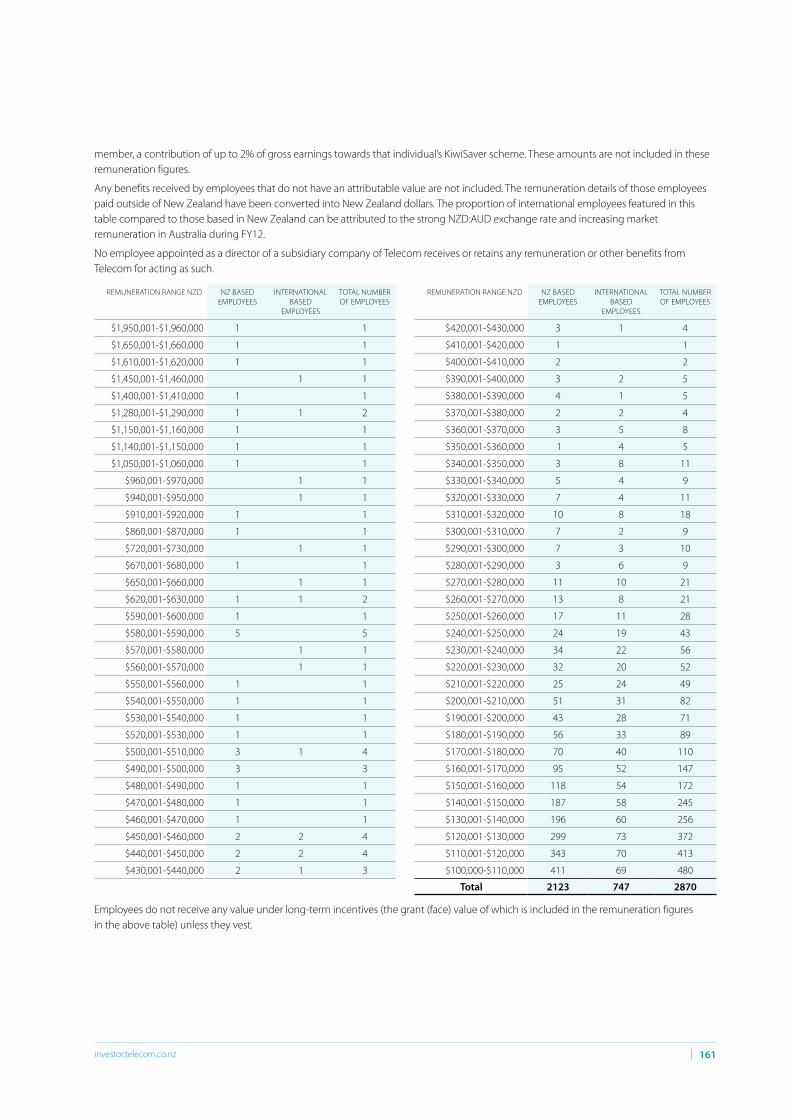
| 161investor.telecom.co.nz
member, a contribution of up to 2% of gross earnings towards that individual’s KiwiSaver scheme. These amounts are not included in these remuneration figures.
Any benefits received by employees that do not have an attributable value are not included. The remuneration details of those employees paid outside of New Zealand have been converted into New Zealand dollars. The proportion of international employees featured in this table compared to those based in New Zealand can be attributed to the strong NZD:AUD exchange rate and increasing market remuneration in Australia during FY12.
No employee appointed as a director of a subsidiary company of Telecom receives or retains any remuneration or other benefits from Telecom for acting as such.
REMUNERATION RANGE NZD NZ BASED EMPLOYEES
INTERNATIONAL BASED
EMPLOYEES
TOTAL NUMBER OF EMPLOYEES
$1,950,001-$1,960,000 1 1
$1,650,001-$1,660,000 1 1
$1,610,001-$1,620,000 1 1
$1,450,001-$1,460,000 1 1
$1,400,001-$1,410,000 1 1
$1,280,001-$1,290,000 1 1 2
$1,150,001-$1,160,000 1 1
$1,140,001-$1,150,000 1 1
$1,050,001-$1,060,000 1 1
$960,001-$970,000 1 1
$940,001-$950,000 1 1
$910,001-$920,000 1 1
$860,001-$870,000 1 1
$720,001-$730,000 1 1
$670,001-$680,000 1 1
$650,001-$660,000 1 1
$620,001-$630,000 1 1 2
$590,001-$600,000 1 1
$580,001-$590,000 5 5
$570,001-$580,000 1 1
$560,001-$570,000 1 1
$550,001-$560,000 1 1
$540,001-$550,000 1 1
$530,001-$540,000 1 1
$520,001-$530,000 1 1
$500,001-$510,000 3 1 4
$490,001-$500,000 3 3
$480,001-$490,000 1 1
$470,001-$480,000 1 1
$460,001-$470,000 1 1
$450,001-$460,000 2 2 4
$440,001-$450,000 2 2 4
$430,001-$440,000 2 1 3
REMUNERATION RANGE NZD NZ BASED EMPLOYEES
INTERNATIONAL BASED
EMPLOYEES
TOTAL NUMBER OF EMPLOYEES
$420,001-$430,000 3 1 4
$410,001-$420,000 1 1
$400,001-$410,000 2 2
$390,001-$400,000 3 2 5
$380,001-$390,000 4 1 5
$370,001-$380,000 2 2 4
$360,001-$370,000 3 5 8
$350,001-$360,000 1 4 5
$340,001-$350,000 3 8 11
$330,001-$340,000 5 4 9
$320,001-$330,000 7 4 11
$310,001-$320,000 10 8 18
$300,001-$310,000 7 2 9
$290,001-$300,000 7 3 10
$280,001-$290,000 3 6 9
$270,001-$280,000 11 10 21
$260,001-$270,000 13 8 21
$250,001-$260,000 17 11 28
$240,001-$250,000 24 19 43
$230,001-$240,000 34 22 56
$220,001-$230,000 32 20 52
$210,001-$220,000 25 24 49
$200,001-$210,000 51 31 82
$190,001-$200,000 43 28 71
$180,001-$190,000 56 33 89
$170,001-$180,000 70 40 110
$160,001-$170,000 95 52 147
$150,001-$160,000 118 54 172
$140,001-$150,000 187 58 245
$130,001-$140,000 196 60 256
$120,001-$130,000 299 73 372
$110,001-$120,000 343 70 413
$100,000-$110,000 411 69 480
Total 2123 747 2870
Employees do not receive any value under long-term incentives (the grant (face) value of which is included in the remuneration figures in the above table) unless they vest.

Telecom Annual Report 2012162 |
disclosures
Interests disclosures
Director share ownershipAs at 13 August 2012 directors and Executives had a beneficial interest in Telecom shares representing approximately 0.06% of the shares outstanding.
Telecom ordinary shares beneficially owned by directors and Executives have the same voting rights as all other ordinary shares of Telecom currently on issue.
As at 30 June 2012 directors had a relevant interest (as defined in the Securities Markets Act 1988) in Telecom shares as follows:
NAME RELEVANT INTEREST IN TELECOM SHARES
30 JUNE 2012 PERCENTAGE1
Paul Berriman 20,000 0.0011
Murray Horn 20,000 0.0011
Maury Leyland 4,000 0.0002
Kevin Roberts 20,000 0.0011
Justine Smyth 170,000 0.0091
Mark Verbiest 17,568 0.0009
1 Each percentage stated has been rounded to the nearest 1/1000th of a percent.
As at 13 August 2012 there was no change in directors’ relevant interests in Telecom shares.
Interests register The following are particulars of entries made in the interests register for FY12.
Disclosure of director interests Directors disclosed, pursuant to section 140 of the Companies Act 1993, an interest or cessation of interest in the following entities during FY12.
Paul BerrimanENTITY RELATIONSHIP
HKT Trust which is majority
owned by PCCW*Chief Technology Officer1
1 Mr Berriman was Chief Technology Officer of PCCW prior to the spin-off of HKT Trust from PCCW in November 2011.
Murray HornENTITY RELATIONSHIP
NZ Health Innovation Hub Appointed Chairman
Maury LeylandENTITY RELATIONSHIP
Transpower New Zealand Limited* Director
Paul ReynoldsENTITY RELATIONSHIP
XConnect Global Networks
Limited (United Kingdom)
Ceased to be a director
XConnect Global Networks
Limited (United Kingdom)
Re-appointed a director
Kevin RobertsENTITY RELATIONSHIP
The New Zealand Edge Ceased to be a director
Charles SitchENTITY RELATIONSHIP
Sitch Superannuation Fund* Trustee
Trinity College Melbourne
University*
Board member
Bkk Partners* Advisory director
Justine SmythENTITY RELATIONSHIP
New Zealand Post Limited * Director
New Zealand Post Limited Ceased to be a director
New Zealand Post Group Finance
Limited*
Director
New Zealand Post Group Finance
Limited
Ceased to be a director
New Zealand Breast Cancer
Foundation*
Trustee and chair
Lingerie Brands Limited* Executive director and owner
Pure Advantage* Trustee
Financial Markets Authority* Board member
The Lingerie Lounge Limited* Director

| 163investor.telecom.co.nz
Mark VerbiestENTITY RELATIONSHIP
Financial Markets Authority* Board member
Southern Cross Medical Society* Director
Southern Cross Medical Society Ceased to be a director
Southern Cross Health Services
Limited*
Director
Southern Cross Health Services
Limited
Ceased to be a director
Activa Health Limited* Director
Activa Health Limited Ceased to be a director
Bear Fund NZ Limited* Director
AMP NZ Office Limited* Director
AMP NZ Office Limited Ceased to be a director
Willis Bond Capital Partners
Limited*
Director and Chairman
Willis Bond General Partner
Limited*
Director and Chairman
Freightways Limited* Director
Transpower New Zealand Limited* Director and Chairman
Government Superannuation
Fund Authority Board of Trustees*
Member
Government Superannuation
Fund Authority-Board of Trustees
Ceased to be a member
Southern Cross Healthcare
Trust-Board of Trustees*
Member
Southern Cross Healthcare
Trust-Board of Trustees
Ceased to be a member
NZ International Festival of the
Arts Trust*
Trustee
* These interests were recorded in the interests register at the time of the relevant director’s appointment.
Relevant interest in shares Directors disclosed, pursuant to section 148 of the Companies Act 1993, the following acquisitions and disposals of relevant interests in Telecom shares during FY12:
Paul Reynolds DATE OF DISPOSAL/ ACQUISITION
CONSIDERATION PAID/RECEIVED
NUMBER OF SHARES ACQUIRED/(DISPOSED)
CLASS OF SECURITIES
17/09/2011 N/A (Unrestricting
of incentive shares)
101,991 Ordinary
shares
23/11/2011 N/A (Exercise of
share rights)
274,204 Ordinary
shares
16/12/2011 N/A (Lapse of
Performance Rights)(134,100)1 Share rights
16/01/2012 Services to Telecom 319,780 Share rights
25/05/2012 N/A (Unrestricting
of incentive shares)
389,136 Ordinary
shares
1 The share rights issued pursuant to Dr Reynolds’ performance rights scheme lapsed as the pre-specified performance hurdles were not met. For further details of this scheme and the performance hurdles associated with it, see Remuneration – CEO Remuneration.
Paul BerrimanDATE OF DISPOSAL/ ACQUISITION
CONSIDERATION PAID/RECEIVED
NUMBER OF SHARES ACQUIRED/(DISPOSED)
CLASS OF SECURITIES
29/02/2012 A$33,300 20,000 Ordinary shares
Murray HornDATE OF DISPOSAL/ ACQUISITION
CONSIDERATION PAID/RECEIVED
NUMBER OF SHARES ACQUIRED/(DISPOSED)
CLASS OF SECURITIES
29/02/2012 NZ$21,450 10,000 Ordinary shares
Maury LeylandDATE OF DISPOSAL/ ACQUISITION
CONSIDERATION PAID/RECEIVED
NUMBER OF SHARES ACQUIRED/(DISPOSED)
CLASS OF SECURITIES
Held at time of
appointment as
director
NZ$8,070 4,000 Ordinary shares
Justine SmythDATE OF DISPOSAL/ ACQUISITION
CONSIDERATION PAID/RECEIVED
NUMBER OF SHARES ACQUIRED/(DISPOSED)
CLASS OF SECURITIES
Held at time of
appointment as
director
NZ$179,402 70,000 Ordinary shares
1/12/2011 NZ$206,035 100,000 Ordinary shares
Mark VerbiestDATE OF DISPOSAL/ ACQUISITION
CONSIDERATION PAID/RECEIVED
NUMBER OF SHARES ACQUIRED/(DISPOSED)
CLASS OF SECURITIES
Held at time of
appointment as
director
Services to
Telecom1
2,568 Ordinary shares
1/03/2012 NZ$32,400 15,000 Ordinary shares
1 Shares were awarded under an employee incentive scheme during Mr Verbiest’s previous tenure as an employee.
The board authorised, for the purposes of section 161 of the Companies Act 1993, during FY12 the entry into:
(a) Dr Reynolds’ remuneration package, including the equity link long-term incentive scheme and the CEO exit terms; and
(b) the incoming CEO (Mr Moutter’s) employment agreement, short-term (performance) incentive scheme, equity incentive scheme and share (performance) rights scheme.
During FY12, entries were made in the interests register for the purposes of section 162 of the Companies Act 1993 in relation to insurance effected for Telecom’s directors and officers for a period of 12 months from 1 June 2011 and in relation to deeds of indemnity provided to all directors and specified officers of the Company.

Telecom Annual Report 2012164 |
disclosures
Related party transactions Executives do not participate in new grants under Telecom’s restricted share scheme but Executives have in the past held restricted shares from prior, non-executive, roles with Telecom. Loans associated with the restricted share scheme have been made on interest-free terms. As at the date of this report, no Executive has any loan under the Restricted Share Scheme and no loans will be provided in the future. During the period from 30 June 2011 to 13 August 2012, there had been outstanding loan amounts to Executives totalling NZ$265,026.
Key management personnel costs, which include the remuneration of the CEO and the members of the Executive team, are disclosed in note 5 to the financial statements.
Other related party transactions that are required to be disclosed by IFRS are detailed in note 28 to the financial statements, see Performance for further details.
Shareholder and exchange disclosures
Stock exchange listing and OTC tradingThe ordinary shares of Telecom Corporation of New Zealand Limited are listed on the NZSX and ASX. Telecom shares were listed on the NYSE in the form of American Depositary Shares (ADSs, with one ADS equal to five ordinary shares). On 19 July 2012 the ADSs were delisted from the NYSE and now trade on the over-the-counter (OTC) market in the US. It is anticipated that the delisting will, in time, reduce administration costs and the complexity associated with the NYSE listing. See Group Risk Factors for a discussion of the effect of the delisting on ADS-liquidity.
Prior to the Demerger the NZX gave Telecom’s shares a Non-Standard designation due to the Kiwi Share provisions in Telecom’s constitution. However, this designation no longer applies as the Kiwi Share converted into an ordinary share on Demerger. For further information on the Kiwi Share, see Shares and Governance – Other Matters – Kiwi Share.
NZX waivers Details of all waivers granted and published by NZX within or relied upon by Telecom in the 12 months immediately preceding the date two months before the date of publication of this Report are available on Telecom’s website at www.telecom.co.nz.
ASX listingTelecom changed its admission category on the ASX from ‘ASX Exempt Foreign’ to ‘ASX Listing’ in the 2002 financial year. As a consequence of becoming fully listed on the ASX, Telecom is required to make the following statements:
• Telecom is incorporated in New Zealand; and
• Telecom is not subject to Chapters 6, 6A, 6B and 6C of the Corporations Act 2001 dealing with the acquisition of shares (ie, substantial holdings and takeovers).
From the date of the Demerger the ownership restrictions on Telecom’s securities imposed by the constitution no longer apply. For further detail see Summary of Telecom’s constitution and key shareholder rights.
SharesAs at 13 August 2012 there were 1,856,780,364 Telecom shares on issue. At the same date there were also approximately 429 ADS holders in the United States holding the equivalent of 12.8% of Telecom shares.
Telecom has a number of distinct relationships with the New Zealand Government, including as a shareholder, regulator and customer. Prior to the Demerger the New Zealand Government held a convertible preference share (Kiwi Share) in Telecom. With effect from the date of Demerger, the Kiwi Share was converted into an ordinary share in Telecom and the special rights and limitations relating to ownership in Telecom, which attached to the Kiwi Share, ceased to have an effect. As at 13 August 2012 the New Zealand Government held a nominal number of ordinary shares in Telecom in accordance with the terms of the Kiwi Share Conversion Deed.

| 165investor.telecom.co.nz
Dividends declared The following is a summary of all dividends declared by Telecom since 2008.
1ST QUARTER 2ND QUARTER 3RD QUARTER 4TH QUARTER
2008 NZ cents 7.00 7.00 7.00 8.00
US cents 27.06 27.76 26.77 26.14
20091 NZ cents 6.00 6.00 6.00 6.00
US cents 13.81 13.40 16.01 18.05
20101 NZ cents 6.00 6.00 6.00 6.00
US cents 18.33 17.82 17.14 21.98
2011 NZ cents 3.50 3.50 3.50 7.50
US cents 13.23 12.86 14.11 36.51
2011 NZ cents (special dividend)2 2.00
US cents (special dividend)2 9.73
20123 NZ cents 9.00 11.00
US cents 37.53 44.484
The amounts above in NZ cents are dividends per ordinary share, and the amounts expressed in US cents are dividends per American Depositary Share (ADS). The amount of US cents is calculated based on an approximate exchange rate. The actual US dividend paid is based on the currency conversion exchange rate obtained by the Bank of New York Mellon when converting NZ dollars into US dollars and less transaction charges. On 1 April 1997 Telecom’s ADS to ordinary share ratio changed from 1:16 to 1:8. On 25 September 2007 Telecom’s ADS to ordinary share ratio changed from 1:8 to 1:5.
1 The 2009 and 2010 dividends were unimputed and are therefore subject to resident withholding tax. The 2009 and 2010 dividends are shown after the deduction of 15% non-resident withholding tax.
2 On 19 August 2011 Telecom announced the payment of a fully imputed special dividend of 2.0 cents per share. This dividend was a result of better than expected results in the six month period to 30 June 2011.
3 The first semi-annual dividend for FY12 was paid on 5 April 2012. The second semi-annual dividend for FY12 is payable on 5 October 2012. In FY12 Telecom moved from quarterly to semi-annual dividend payments to align with its financial reporting cycle.
4 Estimate based on an exchange rate at 31 July 2012 of US$0.8088.
The last date for shareholders to participate in the second semi-annual dividend announced on 24 August 2012 is 21 September 2012. In FY12 Telecom moved from quarterly to semi-annual dividend payments to align with its financial reporting cycle.
Price history The following tables set out, for the periods indicated, the highest and lowest closing sale prices for the ordinary shares as derived from the Daily Official List of the NZSX.
(a) Annual high and low market prices for the last five financial years:
PERIOD NZ$ PER SHARE
HIGH LOW
1 July 2007 - 30 June 2008 4.79 3.57
1 July 2008 - 30 June 2009 3.81 2.20
1 July 2009 - 30 June 2010 2.88 1.81
1 July 2010 - 30 June 2011 2.51 1.82
1 July 2011 - 30 June 2012 2.77 1.94

Telecom Annual Report 2012166 |
disclosures
(b) Quarterly high and low market prices for the last two full financial years:
PERIOD NZ$ PER SHARE
HIGH LOW
1 July 2010 - 30 September 2010 2.13 1.82
1 October 2010 - 31 December 2010 2.24 2.02
1 January 2011 - 31 March 2011 2.32 1.97
1 April 2011 - 30 June 2011 2.51 1.96
1 July 2011 - 30 September 2011 2.77 2.37
1 October 2011 - 31 December 2011 2.72 1.94
1 January 2012 - 31 March 2012 2.53 1.98
1 April 2012 - 30 June 2012 2.67 2.33
(c) Monthly high and low market prices for the last six months and the period commencing 1 August 2012 and ended 13 August 2012:
PERIOD NZ$ PER SHARE
HIGH LOW
1 March 2012 - 31 March 2012 2.53 2.16
1 April 2012 - 30 April 2012 2.63 2.44
1 May 2012 - 31 May 2012 2.67 2.53
1 June 2012 - 30 June 2012 2.54 2.33
1 July 2012 - 31 July 2012 2.66 2.43
1 August 2012 - 13 August 2012 2.73 2.66
Share buybacks Dividend Reinvestment PlanFor the FY12 interim dividend paid in April 2012 Telecom acquired an equivalent number of ordinary shares on-market, in order to avoid an increase in capital arising from the plan. Telecom does not intend to acquire the equivalent number of shares for the final FY12 dividend, which will be paid in October 2012. These mechanisms will be reviewed at each dividend date.
PERIOD TOTAL NUMBER OF SHARES (OR UNITS) PURCHASED
AVERAGE PRICE PAID PER SHARE (OR UNITS) ($NZ)
TOTAL NUMBER OF SHARES (OR UNITS) PURCHASED AS PART
OF PUBLICLY ANNOUNCED PLANS OR PROGRAMMES
MAXIMUM NUMBER (OR APPROXIMATE DOLLAR VALUE)
OF SHARES (OR UNITS) THAT MAY YET BE PURCHASED UNDER THE
PLANS OR PROGRAMMES1
2011
July – – – –
August – – – –
September – – – –
October – – – –
November – – – –
December – – – –
2012
January – – – –
February – – – –
21 - 27 March 2012 6,871,300 $2.40 6,871,300 –
April – – –
May – – – –
June – – – –
Total 6,871,300 – 6,871,300 –
1 On 24 February 2012 Telecom announced that it would operate a small on-market share buyback to neutralise its dividend reinvestment plan. Telecom was authorised by the board to acquire on-market an equivalent number of ordinary shares as would be issued pursuant to Telecom’s dividend reinvestment plan in respect of the first semi-annual dividend for FY12. The maximum number of shares to be purchased was set at the beginning of the buyback period and was restricted to an equivalent number of shares issued pursuant to the dividend reinvestment plan for the first FY12 semi-annual dividend.

| 167investor.telecom.co.nz
Surplus Capital ReturnTelecom is also undertaking an on-market buyback programme for up to a maximum of 200 million shares for an aggregate purchase price of not more than NZ$300 million. The share buybacks have been, and will continue to be, effected by Telecom purchasing shares on the NZSX at the prevailing market price from time to time. The share buyback is intended to return surplus capital to shareholders. Shares acquired under the buyback are cancelled.
PERIOD TOTAL NUMBER OF SHARES (OR UNITS) PURCHASED1
AVERAGE PRICE PAID PER SHARE (OR UNITS) ($NZ)
TOTAL NUMBER OF SHARES (OR UNITS) PURCHASED AS PART
OF PUBLICLY ANNOUNCED PLANS OR PROGRAMMES
MAXIMUM NUMBER (OR APPROXIMATE DOLLAR VALUE)
OF SHARES (OR UNITS) THAT MAY YET BE PURCHASED UNDER THE
PLANS OR PROGRAMMES2
2011
July – – – –
August – – – –
September – – – –
October – – – –
November – – – –
December – – – –
2012
January – – – –
February – – – –
12 - 20, 28 - 29 March 2012 9,598,523 $2.46 9,598,523 190,401,477
2 - 18 April 2012 9,619,479 $2.45 9,619,479 180,781,998
4 - 29 May 2012 12,031,644 $2.55 12,031,644 168,750,354
8 - 29 June 2012 37,427,822 $2.43 37,427,822 131,322,532
Total 68,677,468 $2.46 68,677,468 131,322,532
1 All share purchases were on-market transactions.
2 On 24 February 2012 Telecom announced that it would introduce an on-market buyback programme for up to a maximum of 200 million shares for an aggregate purchase price of not more than NZ$300 million to return surplus capital to shareholders. The programme will expire on 31 December 2012.
ShareholdersCurrent substantial security holders According to information publicly available to Telecom via notices filed pursuant to the New Zealand Securities Markets Act 1988, the beneficial owners of 5% or more of Telecom’s ordinary shares as at 30 June 2012 and as at 13 August 2012 were as follows:
30 June 2012
% OF CLASS AT 30 JUNE1
OWNER NUMBER OWNED AS AT 30 JUNE 2012
2012 2011 2010
AMP Capital Investors (New Zealand) Limited2 109,981,249 5.87 5.71 n/a
Blackrock Investment Management (Australia) Limited 113,820,785 6.08 n/a 5.33
1 The percentages quoted are based on the issued share capital of 1,920,694,831 as at 30 June 2010, 1,924,678,136 as at 30 June 2011 and 1,872,032,114 as at 30 June 2012. The 1,872,032,114 differs from the 1,856,745,213 shares recorded in the financial statements at 30 June 2012, as the latter takes into account the contractual share buyback transactions entered into in the three days of trading prior to the financial year-end (which were settled and entered into the share register after 30 June 2012 in accordance with market practice). Accordingly, the percentages may differ from those notified to NZX by the shareholder at the time of the transaction.
2 Telecom understands that, due to arrangements relating to the merger of AXA and AMP, the substantial security holder filings for AMP Capital Investors (New Zealand) Limited and AXA Group relate in part to certain of the same Telecom securities.
13 August 20121
OWNER NUMBER OWNED AS AT 13 AUGUST 2012
% OF CLASS AS AT 13 AUGUST 20122
Blackrock Investment Management (Australia) Limited 113,820,785 6.13
1 AMP Capital Investors (New Zealand) Limited ceased to be a substantial security holder during July 2012.
2 The percentages quoted are based on the issued share capital of 1,856,780,364 as at 13 August 2012. Accordingly, the percentages may differ from those notified to NZX by the shareholder at the time of the transaction.
Substantial security holders have the same voting rights as other shareholders.
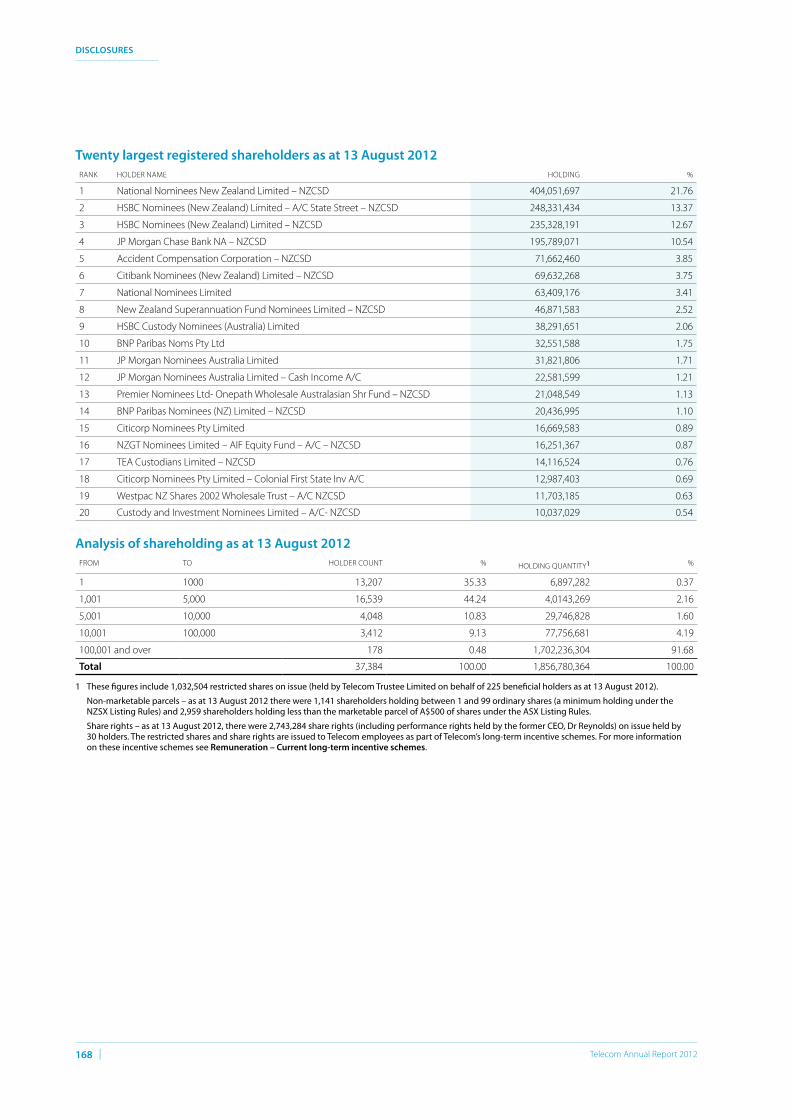
Telecom Annual Report 2012168 |
disclosures
Twenty largest registered shareholders as at 13 August 2012RANK HOLDER NAME HOLDING %
1 National Nominees New Zealand Limited – NZCSD 404,051,697 21.76
2 HSBC Nominees (New Zealand) Limited – A/C State Street – NZCSD 248,331,434 13.37
3 HSBC Nominees (New Zealand) Limited – NZCSD 235,328,191 12.67
4 JP Morgan Chase Bank NA – NZCSD 195,789,071 10.54
5 Accident Compensation Corporation – NZCSD 71,662,460 3.85
6 Citibank Nominees (New Zealand) Limited – NZCSD 69,632,268 3.75
7 National Nominees Limited 63,409,176 3.41
8 New Zealand Superannuation Fund Nominees Limited – NZCSD 46,871,583 2.52
9 HSBC Custody Nominees (Australia) Limited 38,291,651 2.06
10 BNP Paribas Noms Pty Ltd 32,551,588 1.75
11 JP Morgan Nominees Australia Limited 31,821,806 1.71
12 JP Morgan Nominees Australia Limited – Cash Income A/C 22,581,599 1.21
13 Premier Nominees Ltd- Onepath Wholesale Australasian Shr Fund – NZCSD 21,048,549 1.13
14 BNP Paribas Nominees (NZ) Limited – NZCSD 20,436,995 1.10
15 Citicorp Nominees Pty Limited 16,669,583 0.89
16 NZGT Nominees Limited – AIF Equity Fund – A/C – NZCSD 16,251,367 0.87
17 TEA Custodians Limited – NZCSD 14,116,524 0.76
18 Citicorp Nominees Pty Limited – Colonial First State Inv A/C 12,987,403 0.69
19 Westpac NZ Shares 2002 Wholesale Trust – A/C NZCSD 11,703,185 0.63
20 Custody and Investment Nominees Limited – A/C- NZCSD 10,037,029 0.54
Analysis of shareholding as at 13 August 2012 FROM TO HOLDER COUNT % HOLDING QUANTITY1 %
1 1000 13,207 35.33 6,897,282 0.37
1,001 5,000 16,539 44.24 4,0143,269 2.16
5,001 10,000 4,048 10.83 29,746,828 1.60
10,001 100,000 3,412 9.13 77,756,681 4.19
100,001 and over 178 0.48 1,702,236,304 91.68
Total 37,384 100.00 1,856,780,364 100.00
1 These figures include 1,032,504 restricted shares on issue (held by Telecom Trustee Limited on behalf of 225 beneficial holders as at 13 August 2012).
Non-marketable parcels – as at 13 August 2012 there were 1,141 shareholders holding between 1 and 99 ordinary shares (a minimum holding under the NZSX Listing Rules) and 2,959 shareholders holding less than the marketable parcel of A$500 of shares under the ASX Listing Rules.
Share rights – as at 13 August 2012, there were 2,743,284 share rights (including performance rights held by the former CEO, Dr Reynolds) on issue held by 30 holders. The restricted shares and share rights are issued to Telecom employees as part of Telecom’s long-term incentive schemes. For more information on these incentive schemes see Remuneration – Current long-term incentive schemes.

| 169investor.telecom.co.nz
Additional shareholder information
Subsidiary company directors The following people held office as directors of subsidiary companies at 30 June 2012. Alternate directors are indicated with an (A).
SUBSIDIARY COMPANY CURRENT DIRECTORS DIRECTORS WHO RETIRED DURING THE YEAR
AAPT Finance Pty Limited T Jerome, P Reid
AAPT Limited J Orlando, D Yuile, J van Woerkom, C Quin R Snodgrass, N Olson, P Reynolds
AAPT Mobile Pty Limited T Jerome, P Reid
AAPT Wireless Holdings Pty Limited T Jerome, P Reid
AAPT Wireless Pty Limited T Jerome, P Reid
ABN 73 080 394 645 Pty Ltd T Jerome, P Reid
Commerce Solutions Pty Limited T Jerome, P Reid
Connect Internet Solutions Pty Limited T Jerome, P Reid
Ellipsat Australia Pty Ltd T Jerome, P Reid
Gen-i Australia Pty Limited C Quin, P Howse, D Yuile R Snodgrass
Gen-i Limited C Quin, T Gilbertson
Magna Data Australia Pty Ltd T Jerome, P Reid
Magna Systems Pty Ltd T Jerome, P Reid
PowerTel Ltd J Orlando, D Yuile, C Quin, J van Woerkom R Snodgrass, N Olson, P Reynolds
Request Broadband Pty Ltd T Jerome, P Reid
Request Business Solutions Pty Ltd T Jerome, P Reid
Spectrum Satellite Services Pty Ltd T Jerome, P Reid
TCNZ (Bermuda) Limited C Adderley, J Collis, R Snodgrass,
M Amissah (A), S Davies (A), J Redden (A),
S Demerling (A), J Wilson (A), T Counsell (A),
M Laing (A), G Lock (A)
A Hopkinson (A)
TCNZ Australia Investments Pty Limited T Gilbertson, D Yuile, C Johnston, C Quin,
J van Woerkom
J Orlando, N Olson
TCNZ (United Kingdom) Securities Limited N Olson, A Francescangeli
N Batchelor
TCNZ Cook Islands Holdings Limited J van Woerkom
TCNZ Cook Islands Limited J van Woerkom
TCNZ Equities Limited T Gilbertson, M Laing A Parker
TCNZ Finance Limited N Olson, T Gilbertson, J van Woerkom, M Laing A Parker, P Reynolds
TCNZ Financial Services Limited T Gilbertson, M Laing A Parker
TCNZ Solutions Australia Pty Limited T Jerome, P Reid
Teleco Insurance Limited C Adderley, M Laing, J Redden, J Collis (A),
P Bubenzer (A), S Davies (A), S Demerling (A),
M Amissah (A), R Snodgrass (A), G Lock (A),
N Clarke (A)
A Parker, D Lines, A Hopkinson (A)
Teleco Insurance (NZ) Limited T Gilbertson, M Laing A Parker, C Mulholland
Telecom 3G (Australia) Limited N Olson, T Gilbertson
Telecom Capacity Limited R Snodgrass
Telecom Cook Islands Limited J Maher, J van Woerkom, M Beder, J Selwood
(A), M Sword, N Newnham, C Walton (A)
J Mitchell
Telecom Directories Holdings Limited T Gilbertson, M Laing A Parker
Telecom Enterprises Australia Pty Limited J Orlando, T Gilbertson, D Yuile, J van Woerkom N Olson
Telecom Enterprises Limited N Olson, T Gilbertson
Telecom Investments Limited T Gilbertson, M Laing A Parker
Telecom IP Limited N Olson, T Gilbertson

Telecom Annual Report 2012170 |
disclosures
SUBSIDIARY COMPANY CURRENT DIRECTORS DIRECTORS WHO RETIRED DURING THE YEAR
Telecom Leasing Limited T Gilbertson, N Olson, M Laing A Parker
Telecom Mobile Leasing No.1 Limited T Gilbertson, M Laing A Parker
Telecom Mobile Leasing No.2 Limited T Gilbertson, M Laing A Parker
Telecom Mobile Limited N Olson, T Gilbertson
Telecom New Zealand Australia Pty Limited J Orlando, T Gilbertson, D Yuile, J van Woerkom N Olson
Telecom New Zealand Communications (USA)
Limited
L Miller, C Walton A Dalziel
Telecom New Zealand International Australia
Pty Limited
C Walton, K Thompson A Dalziel
Telecom New Zealand International Limited C Walton, T Gilbertson
Telecom New Zealand Limited N Olson, T Gilbertson, S Miller, M Laing A Parker
Telecom New Zealand Singapore Pte Limited L Seng, C Walton, A Tierney
Telecom New Zealand (UK) Enterprises Limited N Olson, M Laing A Parker
Telecom New Zealand (UK) Licences Limited D Hasemore N Batchelor
Telecom New Zealand UK Limited D Hasemore, C Walton, L Miller N Batchelor, A Dalziel
Telecom New Zealand USA Limited L Miller, C Walton A Dalziel
Telecom Pacific Investments Limited N Olson, T Gilbertson
Telecom Pacific Limited N Olson, T Gilbertson
Telecom Pagenet Limited T Gilbertson
Telecom Rentals Limited T Gilbertson, M Laing A Parker, C Mulholland
Telecom Retail Holdings Limited N Olson, T Gilbertson
Telecom Southern Cross Finance Limited J Collis, C Adderley, M Laing, A Hopkinson (A),
M Amissah (A), S Davies (A), J Redden (A),
S Demerling (A), T Counsell (A),
R Snodgrass (A), G Lock (A)
A Parker
Telecom Southern Cross Limited N Olson, T Gilbertson
Telecom Trustee Limited N Olson, T Gilbertson
Telecom Wellington Investments Limited T Gilbertson, M Laing A Parker
Telegistics Repair Limited N Olson, T Gilbertson
Xtra Limited R Snodgrass, T Gilbertson
Subsidiary company directors (continued)

| 171investor.telecom.co.nz
Summary of Telecom’s constitution and key shareholder rights This section summarises the principal provisions of Telecom’s constitution, which was amended on 11 November 2011. Telecom is governed by its constitution. The constitution can be amended only with the consent of the holders of 75% of the issued shares in Telecom, entitled to vote and voting on the resolution to amend the constitution.
For a copy of Telecom’s constitution go to: www.telecomgroup.co.nz>TelecomGroup>Goverance
Telecom’s constitution does not specify the objects or purposes of Telecom.
Telecom has established an ADR facility to provide for the deposit of shares and the creation of ADSs representing the deposited securities and for the execution and delivery of ADRs evidencing such ADSs. The Deposit Agreement between Telecom and the Depositary governs the ADR facility and sets out the rights and responsibilities of Telecom, the Depositary and the owners and beneficial owners of ADSs.
In addition to summarising the principal provisions of Telecom’s constitution, this section summarises the key provisions of the Deposit Agreement and certain requirements of the Companies Act 1993 (Companies Act), the NZSX Listing Rules and the ASX Listing Rules (where these requirements differ materially from those that apply in the United States).
Changes in capitalTelecom’s directors have the authority to approve the issue of shares at their discretion, subject to the requirement to act in accordance with the constitution, New Zealand law and the listing rules of the exchanges on which Telecom is listed.
Restrictions on ownershipShortly before the Demerger, the Kiwi Share, a redeemable preference share held in Telecom by the New Zealand Government, was converted into an ordinary share. As part of the process of converting this share, the ownership restrictions set out in the constitution ceased to apply from the Demerger in accordance with clause 8.1 of the constitution.
BorrowingTelecom’s directors have all the powers necessary for managing Telecom’s business and affairs, including the power to borrow. There are no restrictions in the constitution specifically limiting the power to borrow. However, there is a requirement for shareholder approval of all major transactions and material transactions with related parties.
Telecom may redeem redeemable equity securitiesSubject to the listing rules of the exchanges on which Telecom is listed and the Companies Act, the constitution allows Telecom to redeem redeemable equity securities:
• At its option if permitted by the terms of issue.
• At the option of the holder of the redeemable equity securities if permitted by the terms of issue.
• On a date for redemption, if any, specified in the constitution or specified in the terms of issue of the redeemable securities.
Telecom may only redeem redeemable equity securities for consideration that is specified, or calculated by reference to a formula, or fixed by a suitably qualified person who is not associated with or interested in Telecom, in accordance with the Companies Act. In order to redeem securities, the board of Telecom must be satisfied on reasonable grounds that Telecom will satisfy the solvency test after the redemption, in accordance with the Companies Act. The board must have resolved and certified that the redemption of the shares is of benefit to the remaining shareholders, and that the consideration for the redemption is fair and reasonable to the company. The board must certify the grounds for its conclusion.
Further capital callsThe constitution empowers the board to make calls on any holder of securities only for any money that is unpaid on that holder’s securities and not otherwise payable at a specified time or times under the constitution or the terms of the issue of those securities or any contract for issue of those securities. An obligation to pay unpaid amounts of the issue price of any securities cannot be cancelled, reduced or deferred without the authority of an ordinary resolution. At the date of this annual report, Telecom’s share register did not include any shares in respect of which amounts were unpaid.
The constitution does not impose a liability on shareholders for any further capital calls by Telecom. In particular, no money is payable for calls or otherwise on shares that were fully paid at the time the constitution was adopted.
Sinking fund provisionsThe constitution does not contain any sinking fund provisions.
Alteration of rightsCurrently, Telecom only has one class of shares on issue, being ordinary shares.
Under the constitution the rights attaching to Telecom’s shares can be varied or abrogated only with the consent of the holders of at least 75% of the issued shares of that class that may be affected, entitled to vote and voting on the resolution to alter the rights.
Alteration of rights of ADS holdersThe ADSs and the provisions of the Deposit Agreement may be amended by agreement between Telecom and the Depositary. ADSs already on issue will not be affected by certain amendments until 30 days’ notice has been given to the ADS holders.
Share in Telecom’s profitsThe constitution does not provide shareholders with any additional rights to share in Telecom’s profits other than the right to dividends as described below (see Dividend rights) and the right to share in the distribution of Telecom’s surplus assets as described below (see Share in surplus on liquidation).

Telecom Annual Report 2012172 |
disclosures
Share in surplus on liquidationOn a distribution of capital in the event of liquidation, the constitution gives all shareholders the right to an equal share in the distribution of Telecom’s surplus assets.
DirectorsComposition of the boardThe constitution requires that at least half of the board be New Zealand citizens.
Interested directors’ voting powersThe NZSX Listing Rules prohibit a director from voting on any matter in which that director is directly or indirectly materially interested and from being included in the quorum at which a matter relating to such transaction arises. However, interested directors are permitted to vote where a directors’ certificate is required under the Companies Act or the vote relates to the grant of an indemnity in favour of a director or employee.
Where a director is interested in a transaction, that director may attend the meeting at which the matter is discussed, at their discretion.
RemunerationThe board may authorise, without shareholder approval:
• the remuneration (excluding issues of equity securities) of any executive director in their capacity as an executive;
• payments to directors’ of reasonable travelling, accommodation and other expenses incurred in relation to Telecom’s management; and
• subject to any applicable restrictions in the NZSX or ASX Listing Rules, any remuneration for work not in the capacity of a director.
The sums to be paid to the directors for their services as directors (other than for services as an executive director) must be approved by shareholders by ordinary resolution.
That shareholder approval applies to all director fees paid during subsequent years (within the cap) until the shareholders alter that approval by ordinary resolution.
Retirement of directors At least one-third (or the number nearest to one-third if the total number of directors is not a multiple of three) of the directors must retire each year at the annual meeting but shall be eligible for re-election at that meeting. The directors to retire shall be those who have been longest in office since they were last elected or deemed elected (other than the executive director who, in the case of Telecom, is the CEO and under the constitution is exempt from this requirement).
Number of shares required to be held by a directorThere is no requirement in the constitution for directors to hold Telecom shares.
SharesDividend rightsThe directors may authorise a dividend provided the directors are satisfied on reasonable grounds and certify that Telecom is able to meet the solvency test contained in the Companies Act immediately after the dividend is paid.
The board must not authorise a dividend:
• in respect of some but not all shares in a class; or
• that is of a greater value per share in respect of some shares in a class than it is in respect of other shares of that class,
unless the shares are not fully paid up, in which case the dividends can be paid in proportion to the amount paid up on each share.
If a dividend is authorised by the board, all registered shareholders of ordinary shares have the right to an equal share in that dividend (subject to the terms of issue of the shares held).
The board also has the right to deduct from the dividend any amounts owed by the shareholder to Telecom whether in respect of a call or otherwise. The board must deduct from any dividend any amount required by law to be deducted.
In addition, the board can authorise and pay a supplementary dividend to non-resident shareholders who qualify for such a dividend in terms of the New Zealand Income Tax Act 2007.
If a dividend or other distribution remains unclaimed for one year after having been authorised, the board may invest or otherwise use that money for the benefit of Telecom until it is claimed. If a shareholder does not claim a dividend (or any other distribution or money payable to a shareholder or former shareholder in respect of shares or debt securities) within five years of its having been authorised, the board may resolve that the dividend is forfeited for the benefit of Telecom.
Telecom operates a dividend reinvestment plan pursuant to which shareholders may elect to have the dividends to which they are entitled applied to purchase further ordinary shares at or around the prevailing market price.
Distributions to ADS holders Whenever the Depositary or the Custodian receives any cash dividend or other cash distribution on any deposited securities, the Depositary will, subject to the Depositary being able to convert any sums received in foreign currency into US dollars, convert the distribution into US dollars and distribute the amount received (minus any relevant taxes, charges and fees) to ADS holders in proportion to the number of ADSs held as at the relevant record date.
Subject to the Deposit Agreement, if any distribution is in the form of a dividend or free distribution of shares, the Depositary may, at Telecom’s request, distribute to ADS holders additional ADSs representing the amount of such shares proportionate to the number of ADSs held.
The Depositary currently offers a service under which ADS holders can elect to have their distributions reinvested. Telecom is not involved in the operation of this service. There can be no assurance that ADS holders will be given the opportunity to receive elective distributions on the same terms and conditions as the holders of shares.

| 173investor.telecom.co.nz
Calling shareholder meetingsThe constitution requires the directors to call an annual meeting of shareholders not later than 15 months after the previous annual meeting or six months after Telecom’s balance date and they may call a special meeting at any time. The directors must call a special meeting of shareholders if shareholders holding shares carrying not less than 5% of voting rights entitled to be exercised on an issue request a special meeting in writing.
The constitution requires that written notice of the time and place of a meeting of shareholders be sent to every shareholder on the share register entitled to receive notice of the meeting (and every director and auditor of Telecom) not less than ten working days before the meeting. Notice can be delivered, posted, faxed or sent electronically. The constitution provides that equity security holders of all classes are entitled to attend meetings of shareholders and to receive notices, reports and financial statements issued generally to holders of securities carrying votes.
The quorum for a meeting of shareholders is two or more shareholders having the right to vote at the meeting and no business can be transacted unless a quorum is present.
Upon the Depositary’s receipt from Telecom of notice of the annual meeting of Telecom’s shareholders, the Depositary will, at Telecom’s request, mail to ADS holders a notice and fix the record date (the date on which ADS voting entitlements are determined).
Voting rightsTelecom’s ordinary shares each carry a right to vote on any resolution at a meeting of shareholders. Holders of ordinary shares may vote at a meeting in person or by proxy, representative or attorney. Voting may be conducted by voice, show of hands or poll.
The constitution also allows the board to set the record date for determining who may vote and what shares may be voted at a meeting of shareholders. Such record date may be as late as 5.00pm on the day before such meeting.
Where two or more persons are registered as the holders of a share, the vote of the person named first in the share register and voting on a matter must be accepted to the exclusion of the votes of the other joint holders.
A shareholder is not entitled to vote at any meeting of shareholders (other than at a meeting of an interest group to which that shareholder belongs) unless all sums due to Telecom by that shareholder in respect of any share registered in that shareholder’s name have been paid. At the date of this annual report, Telecom did not have any shares in respect of which sums remained unpaid.
Shareholders must vote on a show of hands or by voice vote unless a poll is called. A poll may be demanded by:
• the chair;
• at least five shareholders having the right to vote at the meeting;
• a shareholder or shareholders having the right to exercise at least 10% of the total votes entitled to be exercised on the business to be transacted at the meeting; or
• a shareholder or shareholders holding shares that confer a right to vote at the meeting and on which the total amount paid up is at least 10% of the total amount paid up on all the shares that confer that right.
A shareholder may exercise the right to vote in person or by proxy or (if the person is a body corporate) by representative.
The board may permit the appointment of proxies or representatives to be made by electronic means, postal votes to be cast by electronic means and to the extent permitted by law, votes to be cast on resolutions at meetings of shareholders (or of other groups) by electronic means.
Voting rights on director appointmentsShareholders may, by ordinary resolution, appoint by separate resolutions persons who are not disqualified either to fill a casual vacancy or subject to the maximum number of directors not being reached, to act as an additional director.
Shareholder resolutionsUnder the constitution, matters which require a shareholder resolution include:
• appointing or removing a director or an auditor;
• adopting or altering the constitution;
• approving a major transaction;
• approving an amalgamation under the Companies Act; and
• liquidating Telecom.
ADS holders’ voting rightsThe holders of ADSs at the close of business on the record date are entitled, subject to the terms of the Deposit Agreement, to instruct the Depositary as to the exercise of the voting rights pertaining to the ADS holder’s ADSs. The Depositary will endeavour to vote the shares so represented in accordance with such instructions. The Depositary will not vote the shares so represented unless it has received instructions from the relevant ADS holder. The Depositary may only vote shares in the event of a poll.
The Deposit Agreement does not provide ADS holders the right to cause the Depositary to request a meeting of shareholders.

Telecom Annual Report 2012174 |
disclosures
Overseas Investment Act 2005 and Regulations Overseas persons who acquire shares in Telecom must also comply with the Overseas Investment Act and Regulations.
The Overseas Investment Act 2005 requires that an overseas person obtain consent from the relevant Minister or the Overseas Investment Office (as applicable) before entering into certain acquisitions of shares or interests in shares. The acquisitions for that consent is required are broadly acquisitions which result in the overseas person or an associate of an overseas person (either alone or together with its associates):
• Acquiring a 25% or more ownership or control interest in Telecom, being one of the following:
• A beneficial entitlement to or a beneficial interest in 25% or more of Telecom’s shares; or
• The right to exercise or control the exercise of 25% or more of the votes entitled to be cast at a Telecom meeting; or
• The power to control the composition of 25% or more of the board of Telecom.
• Increasing its existing 25% or more ownership or control interest in Telecom.
There are limited exceptions to these requirements.
Under the Overseas Investment Act, Telecom is an overseas person because of its foreign shareholders. Overseas persons are required to obtain consent for certain activities. Telecom must obtain consent from the Overseas Investment Office for New Zealand business acquisitions where the value exceeds NZ$100 million or for certain transactions involving sensitive land.
Material contractsThe material contracts which Telecom has entered into in the two years preceding the date of this Report are summarised below.
Broadly, the contracts relate to the UFB initiative and the Demerger of Telecom, which are described further in Our Company – Business Operations – Demerger.
Legacy Demerger AgreementsThe following agreements were entered into between Telecom and CFH and other parties prior to the Demerger in relation to the Demerger and Telecom’s participation in the UFB Initiative. With effect from the Demerger, these contracts have either been terminated or Telecom’s rights and obligations under these contracts have been transferred to Chorus, and so Telecom is no longer is subject to any ongoing obligations.
1. Interim Period Agreement (IPA)The IPA dated 24 May 2011, as amended, governed the contractual arrangement between Telecom and CFH for the interim period, being the period beginning on 24 May 2011 and ending on the date of Demerger (1 December 2011). The IPA automatically terminated upon completion of the Demerger, save for a limited number of clauses which continued in effect, however with effect from the Demerger, Telecom’s rights and obligations under this agreement were transferred to Chorus and accordingly Telecom is no longer subject to any obligations under the IPA.
2. Network Infrastructure Project Agreement (NIPA) Telecom entered into the NIPA on 24 May 2011, prior to the Demerger. The NIPA, as amended, governs the contractual arrangement between Chorus and CFH relating, in general, to the design, build, delivery and operation of the UFB network, and applies to the 24 UFB candidate areas awarded to Chorus by CFH. The NIPA also covers the governance of Chorus, the delivery of Layer 1 and Layer 2 services and products on the UFB network, commitments to prioritising the UFB network and commitments relating to partnering with local fibre companies. With effect from the Demerger, Telecom’s rights and obligations under this agreement were transferred to Chorus and accordingly Telecom is no longer subject to any obligations under the NIPA.
3. Kiwi Share Conversion Deed Telecom entered into the Kiwi Share Conversion Deed on 11 July 2011 with the Crown. The Kiwi Share Conversion Deed provided for the Kiwi Share, a redeemable preference share held by the Crown, to be converted to an ordinary Telecom share, subject to certain conditions being satisfied. Those conditions included the approval by Telecom shareholders of the Demerger and the court having granted the final court orders on terms which made provision for certain matters to the Government’s satisfaction. The conversion occurred on 25 November 2011 and as such the Kiwi Share Conversion Deed is a legacy deed and Telecom has no further obligations under it.
Ongoing Demerger Related Agreements The following agreements were entered into between Telecom, CFH, Chorus and/or other parties to effect the Demerger of Telecom. Telecom continues to have obligations under these agreements.
1. Separation Deed As part of the Demerger, Telecom, Chorus and Chorus New Zealand Limited entered into the Separation Deed dated on 13 September 2011, as amended and restated on 25 October 2011. Broadly, the Separation Deed required Telecom to operate the businesses that Chorus would operate immediately after the Demerger in a manner consistent with its previous practices and the parties were required to do all things necessary to implement the Demerger. The Separation Deed also provided that certain assets and liabilities were to be transferred (subject to third party rights) from Telecom to Chorus, with effect on and from the Demerger date and that Chorus would pay the purchase price in consideration for the transfer of those certain assets and liabilities. The parties also agreed to conduct and defend litigation in accordance with a specific regime and to indemnify each other for certain costs and expenses incurred in relation to their respective businesses incurred post-Demerger. The Separation Deed also contained provisions in respect of the transfer and continued use of certain intellectual property rights and indemnification for certain costs and expenses incurred in relation to the parties’ respective businesses post-Demerger. Deeds to transfer contracts, certain parts of contracts, property and intellectual property from Telecom to Chorus have been entered into between Telecom and Chorus.

| 175investor.telecom.co.nz
2. New Products Commitment Agreement (NPCA) The NPCA imposes certain commitments on Telecom’s Gen-i and Retail businesses to develop and offer certain retail fibre products. The NPCA was entered into on 24 May 2011 by CFH and Telecom and will expire on 31 December 2015.
Under the NPCA, and subject to the availability of appropriate network access services, Telecom Retail commits to (at a minimum):
• develop and launch a retail broadband over fibre product on Chorus’ UFB network 6 months after the date on which Chorus provides the required fibre input services. As at 13 August 2012, Telecom and CFH are in negotiations to define (i) what the Chorus inputs need to include in order to support a scale launch of Telecom’s retail broadband over fibre product and (ii) a new target launch date for broadband over fibre.
• deliver a fibre variant of its current PSTN voice service for residential and single line small business customers who have broadband over fibre (and this will perform similarly to the current PSTN service), by 15 December 2013; and
• at the request of CFH, provide confidential briefings to CFH on fibre-readiness and “in train” product and technology plans that support services over fibre.
Under the NPCA, and subject to the availability of appropriate network access services, Telecom’s Gen-i business unit commits to:
• continue to make available certain existing fibre based products and services (or alternative fibre services performing substantially similar functions) at least for 12 months from 24 May 2011 and thereafter as long as they are commercially viable;
• develop its business strategy for FY12 onwards to reflect UFB, the emerging multi-network environment and the increasing competitiveness of the telecommunications industry; and
• at the request of CFH, provide confidential briefings to CFH on fibre-readiness and “in train” plans.
3. Commercial Service Agreements with ChorusAs part of the Demerger, Telecom entered into the following three material ongoing agreements with Chorus for the supply of various Chorus products and services:
• the Wholesale Commercial Services Agreement;
• the Chorus Services Agreement; and
• the Chorus UFB Services Agreement.
In addition, Telecom as a retail service provider, may also seek that Chorus supply regulated services to Telecom pursuant to Standard Terms Determinations issued by the Commerce Commission from time to time.
The Wholesale Commercial Services Agreement and the Chorus Services Agreement govern the supply of services which the legacy Telecom Wholesale and Chorus business units supplied to customers prior to the Demerger and which Chorus now supplies to Telecom following the Demerger. The Chorus UFB Services Agreement governs the supply of CFH-funded fibre products from Chorus to Telecom. Further detail of these agreements is provided below.
The generally agreed division of services under each of the three agreements is based on the following principles:
1. Any service that formed a part of Chorus’ Reference Offer for UFB services is governed by the UFB Services Agreement and accordingly the service had to be approved by CFH.
2. A service provided by Telecom’s pre-Demerger Wholesale business unit that was not part of Chorus’ Reference Offer and was provided to Telecom customers pre-Demerger under the Wholesale Services Agreement would be governed by the Wholesale Commercial Services Agreement, therefore providing continuity for customers.
3. A service provided by Telecom’s pre-Demerger Chorus business unit that was not part of Chorus’ Reference Offer and was provided to Telecom’s customers pre-Demerger under the Chorus Services Agreement would be governed by the revised Chorus Services Agreement.
4. Any new service that was not provided to Telecom customers pre-Demerger by any part of Telecom (i.e. an ‘internal’ or ‘legacy’ service) would be governed by the Chorus Services Agreement unless it was a legacy layer 2 service in which case it would sit under the Wholesale Commercial Services Agreement.
Non-regulated services provided by Chorus under these service agreements may be subject to Chorus’s deeds of undertaking, and accordingly, where they are, they will be priced on a non-discriminatory basis and as negotiated by Chorus and the market. Pricing for services under the Chorus UFB Services Agreement will be as determined by CFH, and regulated services will be priced as set by the applicable regulations.
Wholesale Commercial Services Agreement
The Wholesale Commercial Services Agreement dated 15 November 2011 between Telecom and Chorus, governs the supply of legacy copper bitstream services to Telecom (that are not available to other retail service providers – services that supersede those legacy copper services are available to other retail service providers) and other layer 2 data and handover connection services, and is based on the form of such agreement used by Telecom’s Wholesale business unit prior to the Demerger. Under the Wholesale Commercial Services Agreement, the pricing of a service can be altered by Chorus by giving 60 days written notice unless expressly provided otherwise in the service description for the service. The specific services supplied under the Wholesale Commercial Services Agreement are:
• Commercial UBA: A Digital Subscriber Line (DSL) enabled service, enabling access to, and interconnection with, Chorus’ fixed Packet Data Network (PDN) that connects the end user’s building, or the building distribution frames, to Chorus’ first data switch, other than a DSLAM.
• HSNS Lite: An ethernet access tail service delivering uncontended bandwidth over a fibre or copper access between a site and a locally or remotely defined handover point for the coverage area.
• HSNS Premium: A layer 2 ethernet access tail service delivering uncontended bandwidth over a fibre access between a site and a locally or remotely defined handover point for the coverage area.
• Legacy Broadband: An internet-grade “best efforts” bitstream service and enables Telecom to offer end users DSL enabled services.

Telecom Annual Report 2012176 |
disclosures
• UPC Lite: Delivered over the legacy ATM access network platform, it provides an ‘intermediate input’ service which provides the layer 2 component which can be combine with Telecom’s network or other services to provide business-grade network services to customers.
• Enhanced UBA Tail Extension: A backhaul service that extends an Enhanced UBA Tail Extension from the local handover point to a remote handover point. Pre-configured per coverage area.
• Basic UBA Tail Extension (UBR Backhaul): Extends a UBS or Basic UBA access tail to a remote handover point. An enhanced throughput option can be selected over the Local Aggregation Path and to the remote handover point.
• UPC: An ‘intermediate input’ service which provides the layer 2 component which service providers can combine with their own network or other services to provide business-grade network services to end users.
• Legacy LBDS: An access service which can be used to provide services to end users, based on the current services supported.
The key terms of the agreement include:
• Chorus must use reasonable endeavours to meet target minimum service levels included in the special terms for the relevant services unless otherwise specified.
• No specific remedy or penalties for breach are provided for.
• The term of the agreement is 12 months unless Telecom terminates for convenience (on 3 months’ notice, or 1 month for individual services) or either party terminates for cause.
• The HSNS Lite and HSNS Premium service have term discounts and corresponding minimum contract terms that carry early termination charges.
• The provision of the Legacy Broadband Service expires 31 December 2014. All other services do not have definite end dates (although Legacy Broadband and Legacy LBDS are grandfathered, and it is anticipated that HSNS Premium will be replaced.
• Reciprocal liability caps apply, with both parties liable for $50,000 per event, and a total of $100,000 annually, except in relation to physical injury, in which case the cap is $20 million.
• Disputes are managed via a good faith negotiation process, which can lead to mediation by agreement, or will ultimately result in arbitration under New Zealand law.
Chorus Services Agreement
The Chorus Services Agreement dated 15 November 2011 between Telecom and Chorus, governs the layer 1, network aggregation, access, backhaul, co-location and field force services supplied by Chorus to retail service providers (including Telecom) and is based on the form of such agreement used by Telecom’s Chorus business unit prior to the Demerger. Under the Chorus Services Agreement, the pricing of a service can be altered by Chorus by giving 90 days written notice unless expressly provided otherwise in the service description for the service. The specific services supplied under the Chorus Services Agreement are:
• Commercial Backhaul: Any backhaul service supplied for the purpose of providing access to, and interconnection with,
exchange based services, that is not provided by Chorus pursuant to the UCLL Backhaul STD.
• PSTN Backhaul: A 2 Mbps (E1) backhaul service supplied for the purpose of providing access to, and interconnection with, the Baseband Service for the purpose of supporting PSTN services.
• E1 (2Mbps) Access Service: A service and associated equipment that enables access to, and interconnection with, Chorus’ network (including fibre, copper and radio access technologies).
• Field Force Reactive Maintenance – Outside Plant: Services for the restoration of telecommunications services where an abnormality in the service has been reported which involves outside plant.
• Field Force Reactive Maintenance – Inside Plant: Services for the restoration of telecommunications services where an abnormality in the service has been reported which involves inside plant.
• Field Force Network Maintenance – Routine: Pre-scheduled maintenance checks undertaken on a regular basis on network equipment.
• Field Force – NGH: Next generation field force services, covering the product offerings of CPE accreditation services, the install next generation CPE service, the Service Delivery Point (SDP) installation service, the Customer Premises Equipment (CPE) integration service, the Wiring Add on service, and the Premises (Service Termination) wiring and repair service.
• Field Force – Enhanced Services: Enhanced services made up of the enhanced restore service, the co-ordinated provisioning service, the managed provisioning service, the critical response service and the extended provisioning hours service.
• Baseband: A service to enable the delivery of PSTN analogue telephony services over a range of access technologies from the end user to a service provider’s handover point. Five product variants are covered, Baseband Copper, Baseband PCM, Baseband IP, Baseband Remote, and Baseband Bitstream.
• STM (1,4,16) Access Service: A service and associated equipment that enables access to, and interconnection with, Chorus’ network.
• E3 (34/45Mbps) Access Service: A service and associated equipment that enables access to, and interconnection with, Chorus’ network.
• Carrier Network Services: A backhaul and aggregation customer solution to provide a complete outsourced regional aggregation solution for ethernet and legacy TDM traffic.
The key terms of the agreement include:
• Chorus must use reasonable endeavours to meet target minimum service levels included in the special terms for the relevant services unless otherwise specified.
• No specific remedy or penalties for breach are provided for in most cases.
• The TSO input services (Baseband and PSTN Backhaul) need to be supplied to a standard that meets the Telecom TSO Deed obligations.

| 177investor.telecom.co.nz
• The term of the agreement is indefinite unless either party terminates for convenience (on 6 months notice for Chorus, and 1 or 2 months notice for Telecom) or cause.
• The Enhanced Restore field force services agreement has a minimum contract term of 12 months, and early termination charges apply.
• All current services provided under the agreement do not have definite end dates.
• TSO input services (Baseband, PSTN Backhaul) incorporate a TSO schedule which has termination/suspension/liability provisions particular to Telecom. This means the TSO input services cannot be terminated while the TSO Deeds are in place, but contain a mutually agreed migration plan from the current services towards the UFB based services.
• Liability caps are set in respect of any breach event or series of related events in any 12 month period.
• The liability cap for each product is reciprocal at $2m for each party, with the cap for the Field Services applying for each sub-product within that service. The cap applies to Telecom in respect of a damages claim by Chorus for breaches of Telecom’s general obligations under the agreement (e.g. to use the services for lawful purposes, to obey Chorus’ instructions around service interruptions that are needed for network safely, to not interfere with others use of the network).
• TSO input services (Baseband, Commercial Backhaul) incorporate a TSO schedule which provides for recovery of regulatory fees if there is a breach of the relevant Acts.
• A 3 tier governance framework for TSO input services is provided for, with all other disputes ending in binding arbitration as the final point of escalation.
• No early termination charges apply unless a term commitment is entered into (currently only applies to Enhanced Services).
Chorus UFB Services Agreement
The Chorus UFB Services Agreement dated 15 November 2011 between Chorus and Telecom (also referred to as the CFH Wholesale Services Agreement in the Scheme Booklet) forms Chorus’ reference offer for UFB services as required under the NIPA. The Chorus UFB Services Agreement governs the supply of wholesale fibre access services, bitstream services and co-location services by Chorus to Telecom, as one of its retail service providers. The form of agreement to be entered into between Chorus and each retail service provider is currently subject to public consultation. Chorus has committed to passing on the benefit of any variations to the agreement which it entered into with Telecom on 15 November 2011 once consultation has completed. It is required that Chorus provide wholesale fibre services to all retail service providers (including Telecom) on the same terms. Under the current draft, the pricing of a service can be altered by Chorus by following a consultation process unless expressly provided otherwise.
The specific services supplied under the Chorus UFB Services Agreement are:
• Direct Fibre Access Service: The Direct Fibre Access Service is a dark fibre service suitable for the delivery of complex business grade applications requiring point-to-point fibre access. It enables access to, and interconnection with the LFC Network.
• Central Office and POI Co-location: The Central Office and POI Co-location Service is a service (and its associated functions, including the associated functions of the LFC’s operational support systems) that provides co-location facilities for a Service Provider’s equipment, and access to a handover point, at the LFC’s relevant Central Office solely for the purposes of providing access to, and interconnection with, the LFC Network (including any necessary supporting equipment) for the purposes of using the UFB Services.
• Bitstream 2: The Bitstream 2 Service is a multi-class bitstream service suitable for accessing a wide range of internet and bespoke applications and content delivered over a shared fibre access.
• Bitstream 3: The Bitstream 3 Service is a single-class bitstream service suitable for complex business grade applications and premium residential products delivered over a shared fibre access.
• Bitstream 3a: The Bitstream 3a Service is a multi-class bitstream service suitable for complex business grade applications and premium residential products delivered over a shared fibre access.
• Bitstream 4: The Bitstream 4 Service is a high-speed single-class bitstream service suitable for complex business grade applications delivered over point-to-point fibre access.
• Multicast Service: The Multicast Service provides the ability to broadcast one or more media streams to multiple users simultaneously within a geographical region.
• ATA Voice: The ATA Voice Service provides the ability for End Users to continue to their existing analogue telephones and telephony services on a GPON-based Bitstream access.
• Baseband: The Baseband Service is a service to enable the delivery of PSTN analogue phone and telephony services over a GPON Fibre access from the End User Site to the Handover Point.
• UFB Handover Connection Service: The UFB Handover Connection Service is a linking service that provides the inter-network connectivity between the other Bitstream Services and the Service Provider networks.
• Bandwidth Fibre Access Service: A throughput managed fibre based service suitable for the delivery of complex business grade applications requiring point to point fibre access.
• Intra Candidate Area Backhaul Service (ICABS): A dark fibre service providing access to a single optical fibre between the service provider’s Central Office Co-Location service footprint in the originating LFC Central Office and the service provider’s requested point of delivery.

Telecom Annual Report 2012178 |
disclosures
Exchange controls The New Zealand dollar is convertible into other currencies at freely floating rates and there are no New Zealand restrictions on the flow of New Zealand currency across borders.
See Taxation – Dividends below for a description of the taxation on dividend returns to shareholders. Interest payments to non-resident holders of debt securities are subject to Non-Resident Withholding Tax (NRWT); however, issuers may instead seek approval to pay an Approved Issuer Levy (AIL) representing 2% of the interest payments.
A zero rate of AIL is also available in certain limited circumstances for interest payments made to non-residents. To qualify for the zero rate of AIL, the debt security must meet certain requirements. The zero rate of AIL is only expected to apply in limited circumstances in respect of certain debt securities issued by Telecom.
Taxation The following summary is based on tax laws of the United States and New Zealand in effect on the date of this Report and is subject to changes in United States or New Zealand law, including changes that could have retroactive effect. The following summary does not take into account or discuss the tax laws of any country other than the United States or New Zealand.
This summary does not describe United States estate and gift tax considerations, nor state and local tax considerations within the United States, and is not a comprehensive description of all United States federal income tax or New Zealand tax considerations that may be relevant to a decision to purchase, sell or hold ADSs or shares. Furthermore, this summary does not address United States federal income tax or New Zealand income tax considerations relevant to holders of ADSs or shares who are subject to taxing jurisdictions other than, or in addition to, the United States and New Zealand, and does not address all possible categories of United States holders, some of which (such as financial institutions, insurance companies, broker-dealers, partnerships and their partners, tax-exempt organisations (including private foundations) holders who own (directly, indirectly or constructively) 10% or more of Telecom’s voting stock, investors that hold ADSs or shares as part of a straddle, hedge, conversion, constructive sale or other integrated transaction for United States federal income tax purposes or investors that have a functional currency other than the United States dollar) may be subject to special rules.
This summary contains a description of the principal United States federal income tax and New Zealand tax consequences of the purchase, ownership and disposition of ADSs or shares by a ‘United States holder’ only (as separately defined in the sections ‘United States taxation’ and ‘New Zealand taxation’ below).
United States taxationAs used in this section ‘United States taxation’, the term ‘United States holder’ means a beneficial owner of ADSs or shares that is: (i) an individual citizen or resident of the United States; (ii) a corporation or other entity taxable as a corporation for United States federal income tax purposes organised under the laws of the United States or any state or political subdivision thereof; (iii) an estate the income of which is subject to United States federal income tax without regard to its source; or (iv) a trust if a United States court is able to exercise primary supervision over administration of the trust and one or more United States persons have authority to control all substantial decisions of the trust or if the trust was in existence on 20 August 1996 and has elected to be treated as a United States person. This discussion assumes that United States holders hold ADSs or shares as capital assets for United States federal income tax purposes.
If an entity that is classified as a partnership for United States federal income tax purposes holds ADSs or shares, the United States federal income tax treatment of its partners will generally depend upon the status of the partners and the activities of the partnership. Entities that are classified as partnerships for United States tax purposes and persons holding ADSs or shares through such entities should consult their own tax advisers.
For United States federal income tax purposes, holders of ADSs will be treated as owners of the underlying shares represented by the ADSs.
DividendsFor United States federal income tax purposes, any cash distributions paid (without reduction for New Zealand withholding tax, see New Zealand taxation – Dividends) with respect to ADSs or shares out of current or accumulated earnings and profits as determined under United States federal income tax principles (Earnings and Profits) to a United States holder, will be includible in the gross income of such holder as dividend income. Because Telecom does not intend to determine its Earnings and Profits, any distribution paid will generally be treated as a ‘dividend’ for United States federal income tax purposes. A non-corporate recipient of dividend income will generally be subject to tax on such income received from a ‘qualified foreign corporation’ at a maximum United States federal tax rate of 15% rather than the marginal tax rates generally applicable to ordinary income provided that certain holding period requirements are met. This reduced rate applicable to dividend income will expire for tax years beginning after 31 December 2012, resulting in such income becoming subject to higher ordinary income rates. A non-United States corporation (other than a corporation classified as a ‘passive foreign investment company’ for United States federal income tax purposes) generally will be considered to be a qualified foreign corporation (i) if it is eligible for the benefits of a comprehensive tax treaty with the United States that the Secretary of Treasury of the United States determines is satisfactory for purposes of this provision and that includes an exchange of information program or (ii) with respect to any dividend, it pays such dividend on stock (or ADSs with respect to stock) which is readily tradable on an established securities market in

| 179investor.telecom.co.nz
the United States. There is currently a tax treaty in effect between the United States and New Zealand that the Secretary of Treasury has determined is satisfactory for these purposes and Telecom believes it should be eligible for the benefits of the treaty. United States corporations that hold ADSs or shares will generally not be entitled to the ‘dividends received deduction’ generally available to United States corporations for dividends received from United States corporations (and certain non-United States corporations).
A distribution of Telecom shares by Telecom to its shareholders made as part of a pro rata distribution to all shareholders of Telecom generally will not be treated as a taxable dividend to United States holders.
For United States federal income tax purposes, the amount of any distribution paid in NZ dollars will be the US dollar value of the NZ dollars at the spot currency exchange rate in effect on the date of receipt of the distribution by the United States holder or by the Depositary, whether or not the NZ dollars are in fact converted into US dollars at that time. No additional currency exchange gain or loss will be recognised by a United States holder if the NZ dollars received are converted into US dollars on the date received at that spot rate. Currency gain or loss, if any, realised on the disposition of NZ dollars generally will be a foreign currency gain or loss, which is United States source ordinary income or loss.
Dividends generally will be treated as income from foreign sources for United States foreign tax credit purposes. Subject to limitations discussed below, the withholding tax imposed by New Zealand on dividends is a creditable foreign tax for United States federal income tax purposes in an amount generally equal to the US dollar equivalent of the withholding tax paid; (i) for cash-basis taxpayers, at the conversion rate in effect on the day the withholding tax is paid and (ii) for accrual-basis taxpayers, at the average exchange rate for the taxable year to which the withholding tax relates (or at the conversion rate in effect on the day the withholding tax is paid if the accrual basis taxpayer makes an applicable election). Therefore, the holder will generally be entitled to treat the amount withheld as a foreign tax paid by the holder in computing a foreign tax credit (or in computing a deduction for foreign income taxes paid if the holder does not elect to use the foreign tax credit provisions of the Internal Revenue Code of 1986, as amended).
The Internal Revenue Code imposes a number of limitations on the use of foreign tax credits. In general, foreign tax credits are limited to the same proportion of the United States tax against which such credit is taken, which the taxpayer’s net taxable income from the sources outside of the United States (foreign source income) bears to the taxpayer’s entire net taxable income for the taxable year. This foreign tax credit limitation must be computed separately for specific classes of income. In addition, special rules apply in determining the foreign tax credit limitation with respect to dividends that are subject to the maximum 15% tax rate. The rules governing the foreign tax credit are complex and the availability of the foreign tax credit and the application of the limitations on the credit are fact-specific. Investors should consult their own tax advisers regarding the application of the foreign tax credit to their individual circumstances.
Sale or other disposition of ADSs or sharesA United States holder will recognise capital gain or loss on the sale or other disposition of ADSs or shares in an amount equal to the difference between (i) the amount realised upon their disposition and (ii) the holder’s basis in the ADSs or shares. Capital gain or loss will be long term if the ADSs or shares have been held for more than one year. Capital losses are generally deductible only against capital gains and not against ordinary income, subject to certain limited exceptions.
Capital gain recognised by a United States holder on the sale or other disposition of ADSs or shares will be United States source gain. Losses from the sale of ADSs or shares will generally be sourced in the same manner as gains from the sale of such ADSs or shares. However, United States Treasury Regulations include a dividend recapture rule and other exceptions may apply. Investors are encouraged to consult their own tax advisers regarding the proper treatment of such losses.
Exchanges, deposits and withdrawals of shares for ADSs or ADSs for shares by a United States holder will not result in recognition of gain or loss for United States federal income tax purposes.
Backup withholding and information reportingInformation reporting generally will apply to payments of dividends on, and proceeds from the sale or redemption of, ADSs or shares made within the United States to a United States holder of ADSs or shares (other than an exempt recipient, including a corporation and certain other persons). Backup withholding, at a rate of 28%, will apply to those amounts if a United States holder (other than an exempt recipient) fails to provide an accurate tax identification number and certain other certification or fails to report interest and dividends required to be shown on its United States federal income tax returns. Investors should consult their own tax advisers regarding their qualification for exemption from backup withholding and the procedure for obtaining an exemption. Backup withholding is not an additional tax. The amount of backup withholding imposed on a payment to a United States holder generally will be allowed as a credit against the United States holder’s United States federal income tax liability, and a United States holder may obtain a refund of any excess amounts withheld under the backup withholding rules by timely filing the appropriate claim for refund with the Internal Revenue Service and furnishing any required information.
Effective for taxable years beginning after March 18, 2010, an individual United States holder and certain entities may be required to submit to the Internal Revenue Service certain information with respect to his or her beneficial ownership of the ADSs or shares. This law also imposes penalties if a United States holder is required to submit such information to the IRS and fails to do so. Investors should consult their own tax advisers regarding reporting requirements that may be imposed with respect to ownership of the ADSs or shares.

Telecom Annual Report 2012180 |
disclosures
New Zealand taxationAs used in this section ‘New Zealand taxation’ the term ‘United States holder’ means a beneficial owner of ADSs or shares who: (i) is resident in the United States for tax purposes and is accepted as such by the New Zealand taxing authorities; (ii) is not also resident in New Zealand for New Zealand tax purposes; and (iii) does not hold ADSs or shares in connection with any permanent establishment or fixed base in New Zealand.
DividendsNew Zealand generally imposes a 30% withholding tax on dividends paid by a New Zealand corporation to a non-resident shareholder. However, to the extent to which dividends have maximum imputation credits attached (see further below) the rate of withholding is 15%. Also, reduced rates (generally 15%) apply to non-resident shareholders who are entitled to the benefits of an income tax treaty.
Pursuant to the income tax treaty between New Zealand and the United States, United States holders are subject to a maximum New Zealand withholding tax of 15% of the gross amount of all cash dividends paid by Telecom. The December 2008 protocol to the tax treaty that came into effect from 1 January 2011 for New Zealand withholding taxes does not change this rate, except for a United States holder who holds 10% or more of the voting power in Telecom and meets certain other criteria. The maximum rate for such a person is now 5%.
New Zealand operates a full imputation system of corporate taxation. Under the imputation system New Zealand tax paid by Telecom gives rise to credits (known as imputation credits) which can be attached to its dividends and used by a shareholder, who is treated as a resident for New Zealand tax purposes, to offset such holder’s New Zealand income tax liability on those dividends. A United States holder cannot directly credit these imputation credits against such holder’s withholding tax liability. However, the financial impact of the New Zealand withholding tax on cash dividends paid to a United States holder can be reduced under the New Zealand Foreign Investor Tax Credit (FITC) regime.
Under the FITC regime Telecom can obtain a tax credit based on the amount of imputation credits attached to dividends paid to non-New Zealand tax residents. This tax credit reduces Telecom’s tax liability, providing it with cash to make a supplementary dividend distribution to non-New Zealand tax residents, which is in addition to the ordinary dividend. Provided that the cash dividend has imputation credits attached at the maximum rate allowed, the overall effect is that a non-New Zealand tax resident generally receives an aggregate after New Zealand tax cash dividend equating to the amount that would have been received if the withholding tax had not been imposed. To the extent imputation credits are attached at less than the maximum rate allowed, the level of supplementary dividend is reduced and thus the level of aggregate cash dividend is reduced.
The FITC regime does not apply to a United States holder who holds, directly, 10% or more of the voting power in Telecom or who is otherwise entitled to the maximum 5% New Zealand withholding tax rate that applies under the December 2008 protocol to the income tax treaty between New Zealand and the United States.
Fully imputed dividends paid to such United States holders are not subject to New Zealand withholding tax.
Certain forms of non-New Zealand sourced income derived by Telecom (known generally as ‘active business income’) will not be subject to New Zealand tax. If and when this untaxed income is distributed, the distribution to a United States holder will, in the absence of the benefit of a supplementary dividend, be subject to withholding tax of 15%.
Stock dividends (also known as ‘bonus issues’ for New Zealand tax purposes) made by Telecom will be categorised under New Zealand tax law as either taxable bonus issues or non-taxable bonus issues. Broadly speaking, taxable bonus issues arise where Telecom allows a shareholder to choose between the receipt of cash and the receipt of shares (where the shareholder takes the shares) or when Telecom issues shares and elects to treat the issue as a taxable bonus issue. In general, any distribution by Telecom on or in respect of its shares, other than a non-taxable bonus issue, will be considered a dividend for New Zealand tax purposes. Taxable bonus issues are treated as non-cash dividends for New Zealand tax purposes. Taxable bonus issues (as well as other non-cash dividends) made to a United States holder are subject to New Zealand withholding tax at the rate of zero percent to the extent that imputation credits are attached to the dividend at the maximum rate allowable. With respect to any remaining portion, New Zealand withholding tax will be payable by Telecom. Non-taxable bonus issues are not treated for New Zealand tax purposes as dividends and the New Zealand withholding tax does not apply to them.
Share repurchases and cancellations by Telecom are subject to a regime that treats the repurchase or cancellation amount as a dividend to the extent that it exceeds the amount of available subscribed capital in Telecom. Available subscribed capital is essentially the amount paid to Telecom in respect of the issue of shares, less amounts of subscribed capital already returned to shareholders. To the extent that the amount paid on cancellation or redemption is less than the amount of Telecom’s available subscribed capital, the payment is generally not treated as a dividend. However, where shares are repurchased off-market pursuant to a pro rata cancellation and aggregate payments to shareholders are less than 10% of the market value of all shares in Telecom, or to the extent the repurchase is in lieu of a dividend, payments to shareholders are treated entirely as dividends. Where Telecom repurchases shares on-market, amounts received by shareholders are not dividends in the shareholders’ hands. However, to the extent the payments for on-market repurchases exceed the available subscribed capital, tax is effectively required to be paid by Telecom on that excess amount.
Capital gainsUnder the tax treaty between New Zealand and the United States, a United States holder who does not have, and has not had, a permanent establishment or fixed base in New Zealand, will not be subject to New Zealand tax on any gain on a sale of ADSs or shares. However, the tax treaty does not prevent New Zealand from taxing profits on sales of ADSs or shares held by a United States person where the profits or gains are attributable to a permanent

| 181investor.telecom.co.nz
establishment or fixed base available, or previously available, to such person in New Zealand. Although New Zealand does not have a capital gains tax as such, certain profits on share sales are taxed under New Zealand income tax rules (for example, where shares are acquired for the dominant purpose of resale or by a securities dealer).
Other taxesOrdinarily, interest paid to non-residents is subject to NRWT at either the domestic rate of 15% or a reduced rate under any applicable income tax treaty. However, an issuer of a debt instrument to a non-associated non-resident lender may apply to have the instrument registered and the interest made subject to approved issuer levy (AIL). AIL is a levy payable by the issuer equal to 2% of the interest payments. A zero rate for AIL was recently introduced for debt instruments that meet certain qualifying criteria. The zero rate AIL generally only applies to a NZ dollar-denominated publicly offered debt instrument that is listed on a recognised exchange or satisfies a widely held test and where the registry and paying agency activities are carried out in New Zealand. The debt instrument cannot have been issued through a private placement or be an asset-backed security. For qualifying debt securities the zero rate AIL applies to interest payments made after 7 May 2012.
No stamp duty is payable in New Zealand on transfers of the shares and no notice of such transfers need be given by a shareholder to New Zealand fiscal authorities. New Zealand Goods and Services Tax does not apply to share issues or transfers.
New Zealand gift duty applied in respect of any gift made before 1 October 2011 by a United States holder of ADSs or shares where that gift and any other gift by the United States holder of property situated in New Zealand within 12 months before or after that first-mentioned gift exceeded in aggregate value NZ$27,000. For this purpose ADSs and shares are treated as property situated in New Zealand. Certain limited exemptions and reliefs exist.
Gift duty applied at 5% on the amount of gifts over NZ$27,000 and increased on a graduated scale to a maximum rate of 25% on the amount of gifts over NZ$72,000. New Zealand gift duty was repealed from 1 October 2011. Any gift of property situated in New Zealand by a United States holder from that date is duty free.
Provisional taxCompanies pay New Zealand tax on a provisional basis in three instalments at four-month intervals in respect of each income year. They may pay further tax or receive a refund of tax depending on their final tax liability determined in their tax return for that income year.
Imputation credits arising from payments of tax are recorded as credits in an account called an imputation credit account at the time the tax is paid.
Continuity of ownership requirementTelecom must satisfy continuity of ownership requirements to retain its imputation credits. To this end it must maintain at least 66% of its ownership on a continuous basis from the date it derives imputation credits (ie, pays a tax instalment) to the date it attaches those imputation credits to dividends (ie, the date of the payment of the dividend). Accordingly, imputation credits in Telecom’s
imputation credit account will be lost upon the occurrence of a more than 34% change in its ownership at any time between the derivation of those credits and the attaching of those credits to dividends.
Ownership is measured by reference either to shareholders’ voting interests or, in certain circumstances, to both voting interests and the market value of interests held in a company. In some cases an attribution rule can apply to treat all less-than 10% non-associated shareholders in Telecom as a single notional person. When this attribution rule applies, changes in the individual holding of these shareholders can be disregarded for calculating continuity of ownership.
Legal proceedingsFor details of Telecom’s significant legal proceedings and investigations see note 27 to the financial statements.
Documents on display (US)Telecom files reports and other information with the Securities and Exchange Commission (SEC). You may read without charge, and copy at prescribed rates, any document filed at the public reference facilities of the SEC’s principal office at 100 F Street, NE, Washington, D.C. 205490, United States of America.
The SEC also maintains a website that contains reports and other information regarding registrants that are required to file electronically with the SEC. The address of this website is www.sec.gov.
Please call the SEC at 1 800 SEC 0330 for further information on the operation of the public reference facilities.
Forward-looking statements This Report contains forward-looking statements within the meaning of Section 27A of the United States Securities Act of 1933 and Section 21E of the United States Securities Exchange Act of 1934. Such forward-looking statements are based on the beliefs of Telecom’s management, as well as on assumptions made by, and information currently available to, Telecom at the time such statements were made.
These forward-looking statements include statements of Telecom’s present expectations, beliefs, future plans, strategies, other anticipated developments and matters that are not historical facts. Forward-looking statements can generally be identified by the use of forward-looking words such as ‘may’, ‘could’, ‘anticipate’, ‘estimate’, ‘expect’, ‘opportunity’, ‘plan’, ‘continue’, ‘objectives’, ‘outlook’, ‘guidance’, ‘intend’, ‘aim’, ‘seek’, ‘believe’, ‘should’, ‘will’ and similar expressions.
These forward-looking statements include, without limitation, statements relating to:
• Telecom’s operations and business prospects;
• Capital expenditure and investment plans;
• Telecom’s business and operating strategies, including Telecom’s Vision2013 initiative, reducing costs, simplifying Telecom’s business and improving customer experiences and operational performance;

Telecom Annual Report 2012182 |
disclosures
• Telecom’s ability to deliver on the sharing and commercial arrangements entered into on Demerger;
• Telecom’s expectations for its future financial performance generally;
• The regulatory environment and the impact of regulatory initiatives on Telecom;
• Future dividend payout levels;
• The performance of AAPT and its ability to achieve earnings growth;
• Cash flow from operations and existing cash and available borrowings sufficient to fund Telecom’s expected capital expenditure, working capital and investment requirements;
• The performance of investments, including dividends from Southern Cross;
• Growth of, and opportunities available in, the communications and IT services markets and Telecom’s positioning to take advantage of such opportunities;
• The convergence of technologies, growth and opportunities to offer new products and services;
• Plans for the launch of new products and services;
• Telecom’s network and infrastructure development plans;
• Network performance and resilience and quality;
• The impact of legal proceedings, investigations and inquiries involving Telecom;
• Competition, market shares, prices and growth; and
• The operating environment and overall market conditions and trends.
Such forward-looking statements are not guarantees of future performance. Actual results, performance or achievements could differ materially from those projected in, or implied by, the forward-looking statements as a result of various assumptions, risks and uncertainties. In addition to the risks described elsewhere in the Report under Risk factors, other factors and risks could cause actual results to differ materially from those described in the forward-looking statements. These factors and risks include, but are not limited to:
• Telecom’s ability to successfully implement its strategy, including removing operating costs, reducing capital expenditure and simplifying its business;
• Telecom’s ability to comply with regulatory requirements;
• Competition in the markets in which Telecom operates and the entrance of new competitors to these markets, particularly in the New Zealand market for mobile phone services;
• the effect on competition of the planned acquisition of Telstraclear by Vodafone;
• Uncertainties regarding fibre uptake;
• Rapid technological changes and convergence of telecommunications, information services and media markets and technologies;
• Uncertainties regarding operating new systems and technologies;
• Uncertainties about the degree of growth in the number of markets in which Telecom operates;
• Decreasing revenues from traditional services due to mobile and other substitution and competitive pressures;
• Technological innovations, including the cost of developing new products, networks and solutions and the need to increase expenditures for improving the quality of service;
• The anticipated benefits and advantages of new technologies, products and services, including broadband and other new-wave initiatives not being realised;
• Significant changes in market shares for Telecom and its principal products and services;
• Network or system interruptions;
• Use of third-party suppliers and the resources available in the New Zealand labour market for delivery of important services and projects;
• Uncertainties around acquisitions, divestments and investments;
• Future regulatory actions and conditions;
• General economic conditions within the countries in which Telecom operates; and
• Other factors or trends affecting the telecommunications industry generally, the economies in which Telecom operates and Telecom’s financial condition in particular.
Given the risks, uncertainties and other factors, undue reliance should not be placed on any forward-looking statement, which speaks only as of the date made. Telecom does not undertake any obligation to review or confirm analysts’ expectations or estimates or to release publicly any revisions to any forward-looking statements to reflect events or circumstances after the date of this Report or to reflect the occurrence of unanticipated events. Further, the information contained in this document is a statement of Telecom’s intention as of the date of this filing and is based upon, among other things, the existing regulatory environment, industry conditions, market conditions and prices, the economy in general and Telecom management’s assumptions. Telecom’s management may change its intentions at any time and without notice based upon any changes in such factors, assumptions or otherwise.

| 183investor.telecom.co.nz
GlossaryIn addition the following terms have the following meanings:
ACCC means Australian Competition and Consumer Commission.
ACMA means Australian Communications and Media Authority.
ADR means American Depositary Receipt.
ADS means an American Depositary Share.
ADSL means Asymmetric Digital Subscriber Line, a technology for delivering a high bit rate data link to customers over ordinary copper wire.
ADSL2+ is a form of DSL, which extends the capability of basic ADSL by doubling the number of downstream bits.
ARPU means Average Revenue per Unit/User.
ASX means Australian Securities Exchange.
Balance Sheet means Statement of Financial Position.
CDMA means Code Division Multiple Access, a technology used in digital mobile networks. The voice and text elements of Telecom’s CDMA services closed in July 2012. Limited low-speed data services remain active with a view to closing these in August 2012.
Computerland means the ICT business (Ceritas New Zealand Limited) acquired by Telecom New Zealand Limited in 2004.
CPI means Consumer Price Index.
Depositary means The Bank of New York Mellon.
DSL means Digital Subscriber Line, a family of communications technologies allowing high-speed data over existing copper-based telephony plant in the local loop.
DSLAM means Digital Subscriber Line Access Multiplexers, which is network-based equipment used to deliver DSL services to customers.
DWDM means dense wavelength division multiplexing, a technology that puts data from different sources together on an optical fibre, with each signal carried at the same time on its own separate light wavelength.
EBITDA means Earnings before Interest, Tax Expense, Depreciation and Amortisation. For Telecom’s calculation of EBITDA see Performance – Earnings before interest, taxation, depreciation and amortisation (EBITDA).
EMTN means Euro Medium Term Notes.
FCA means Full Cost Apportionment.
FNT means Future Network Transformation.
FTE means Full-Time Equivalent.
FTTN means Fibre-To-The-Node.
FTTP means Fibre-To-The-Premise.
GAAP means Generally Accepted Accounting Principles.
HRCC means Human Resources Compensation Committee.
HSNS means High-Speed Network Service.
ICT means Information and Communication Technologies.
IDC means International Data Corporation.
IFRS means International Financial Reporting Standards.
IOG means Independent Oversight Group that acted as the high-level external monitoring group for Telecom’s compliance with operational separation undertakings. Disbanded at 1 December 2011 as a result of the Demerger.
IP means Internet Protocol, a communications protocol suite used for carrying data on the internet.
IP-VPN means Internet Protocol-Virtual Private Network, an industry term for an IP-based VPN.
ISDN means the Integrated Services Digital Network, a switched digital transmission network that can carry a range of digitised voice, data and images. Basic Rate Access offers 128 Kbit/s capacity on two channels and Primary Rate Access offers 2 Mbit/s capacity on 30 channels.
ISP means Internet Service Provider.
Kiwi Share means the single Telecom preference share held by the New Zealand Government which converted to an ordinary share on Demerger.
LAN means Local Area Network.
Layer 1 means Layer 1 within the Open Systems Interconnection model and is classified as the physical layer and within a telecommunications fixed access network this can be considered to comprise copper and fibre cables and co-location space inside exchanges or cabinets.
Layer 2 means Layer 2 within the Open Systems Interconnection model and is classified as the data link layer and provides the functional and procedural means to transfer data between network entities. Within the telecommunications fixed access network this can be considered to comprise the bitstream equipment and services which transmit basic data from one point in the network to another over the Layer 1 physical assets.
LFC means a local fibre company, being an entity in which CFH, the Government and a partner will hold shares, and through which the investment of CFH and the partner in relation to the UFB Initiative will be effected.
LTE means long term evolution, a fourth-generation fully packet based mobile network technology that is capable of providing more efficient and faster data transfer than 3G.
MED means Ministry of Economic Development.
MMS means Multimedia Messaging Service.
MPLS means Multi-Protocol Label Switching, an industry term for a data communications technique where labels are used to switch data packets across a network.
MVNO means Mobile Virtual Network Operator.
NM means Not Meaningful.

Telecom Annual Report 2012184 |
disclosures
NYSE means New York Stock Exchange.
NZ IAS means New Zealand International Accounting Standard.
NZSX means the New Zealand Stock Exchange.
NZX means NZX Limited.
OECD means Organisation for Economic Co-operation and Development.
Operational Separation Undertakings means the Telecom operational separation undertakings in the form provided to the Minister of Communications and Information Technology on 25 March 2008 and approved by the Minister pursuant to Part 2A of the Telecommunications Act, as such undertakings may be amended or replaced from time to time.
OTA means Originating and Terminating Access.
PABX means Private Automatic Branch Exchange, which is a small-scale switching system located in an office or building that provides voice and data extension lines and an access point to the public network.
PSTN means the Public Switched Telephone Network, a nationwide dial-up telephone network used, or intended for use, in whole or in part, by the public for the purposes of providing telecommunications between telephone devices.
Retail NGT means Telecom’s Retail Next Generation Telecom business model.
SEC means Securities and Exchange Commission.
SIP means Session Initiation Protocol.
SME means Small and Medium-sized Enterprises.
SMS means Short Message Service.
Southern Cross means Southern Cross Cables group of companies which consists of two sister companies, Southern Cross Cables Holdings Limited and Pacific Carriage Holdings Limited, and their subsidiaries.
T&SS means Technology & Shared Services.
TCF means Telecommunications Carriers Forum.
TDL means Telecommunications Development Levy.
TDM means Time Division Multiplex.
Tier 1 Telecommunication providers that have their own networks.
Tier 2 Telecommunication providers that buy access from tier 1 providers (eg, Telecom Wholesale customers).
Tier 3 Telecommunication providers that buy their access from tier 2 providers (eg, Resellers of Tier 2 services).
TSLRIC means the Total Service Long Run Incremental Cost methodology for determining the cost of a service.
TSO means the Telecommunications Service Obligation recorded in the Telecommunications Service Obligation Deed for Local Residential Telephone Service between the Crown and Telecom New Zealand Limited, dated December 2001 as amended.
UBA means Unbundled Bitstream Access.
UCLL means Unbundled Copper Local Loop.
UFB means ultra-fast broadband.
VoIP means Voice over Internet Protocol, a term used in IP telephony for managing the delivery of voice information using the IP.
VPN means Virtual Private Network, a carrier-provided service in which the public network provides the equivalent of a privately established customer network.
WACC means Weighted Average Cost of Capital.
WAN means Wide Area Network.
WCDMA means Wideband CDMA, an International Telecommunications Union-recognised 3G mobile telephony technology using 5MHz channels to deliver voice and peak data rates from 64 to 384kbps.
3G means third-generation mobile network as defined by the International Telecommunications Union.

With customers at our heart we will become New Zealand’s most preferred company
OUR FY12 PERFORMANCE OUR COMPANY
OUR VISION
Our mission is:
To be number one in Mobile, Broadband, and ICT
We believe in:
People drive our successPassion for customersWorking together as oneActing with openness and integrity
Our current focus is:
Effortless customer experiences through our people, products, platforms, processes, and operational excellence
To do this we’ll:
Do the basics brilliantlyKnow what’s valuableInvest wisely
NZ$4,576mOperating revenues and other gains
NZ$1,079mEBITDA from continuing operations
NZ$1,157mNet earnings for the year
NZ$311mNet earnings from continuing operations
61cEarnings per share
20cDividends per share
NZ$528mCapital expenditure
Successful completion of Demerger
1,565kTotal XT mobile connections
60kGrowth in postpaid mobile connections
NZ$169m On-market buyback of shares
ARBN 050 611 277
Shareholder inquiries/contact details Telecom is a company incorporated with limited liability under the New Zealand Companies Act 1993 and domiciled in New Zealand (Companies Office registration number 328287 and ARBN number 050 611 277).
Registered officeLevel 2Telecom Place167 Victoria Street WestAuckland 1010
Principal administrative office in Australia Level 23 680 George StreetSydney NSW 2000Ph +61 2 9009 9009
Company secretaryTristan Gilbertson
Annual Meeting of shareholdersTelecom’s Annual Meeting of shareholders will be held in the conference centre, Level 2, Telecom Place, 167 Victoria Street West, Auckland on Friday, 28 September 2012 at 10.00am. A Notice of Annual Meeting and Proxy Form will be circulated to shareholders.
Shareholders with inquiries about transactions, changes of address or dividend payments should contact Telecom’s share registries.
New Zealand registryComputershare Investor Services Limited Private Bag 92119Auckland 1142Ph +64 9 488 8777Fax +64 9 488 8787New Zealand Toll Free 0800 737 100Email: [email protected]: www.computershare.co.nz
Australian registry Computershare Investor Services Pty LimitedGPO Box 3329, MelbourneVIC 3001, AustraliaPh +61 3 9415 4083Australia Freephone: 1 800 501 366Fax +61 3 9473 2500Email: [email protected] Website: www.computershare.co.nz
United States registry Details for Depositary Receipts, Transfer Agent, and RegistrarThe Bank of New York MellonPO Box 358516Pittsburgh, PA 15252-8516United States
Toll Free phone number for United States domestic calls:+1 888 BNY ADRS (+1 888 269 2377)
Number for international calls:+1 201 680 6825
Email: [email protected]: www.bnymellon.com/shareowner
Shareholder inquiries about Telecom’s operating and financial performance should be emailed to [email protected] or addressed to:
Head of Investor RelationsTelecom New Zealand LimitedPrivate Bag 92028Auckland 1142New Zealand
Contact phone numbers Australia 1800 123 350Canada 1800 280 0398Hong Kong 800 962 867New Zealand 0800 737 500Singapore 800 641 1013United Kingdom 0800 960 283United States 1800 208 2130
For more informationhttp://investor.telecom.co.nz
investor.telecom.co.nzARBN 050 611 277
| 185
designedbyinsight.com

Embracing the future
Telecom Corporation of New Zealand LimitedAnnual ReportFor the year ended 30 June 2012
TELECOM
CORPO
RATION
OF N
EW ZEA
LAN
D LIM
ITED | A
NN
UA
L REPORT FO
R THE YEA
R END
ED 30 JU
NE 2012
investor.telecom.co.nzARBN 050 611 277