Tees Valley Job Vacancies · An increase in job vacancies may be an indication of new job creation,...
45
Transcript of Tees Valley Job Vacancies · An increase in job vacancies may be an indication of new job creation,...


Page 2 of 45
Tees Valley Job Vacancies
January – December 2018
Contents Page
1. Introduction 3
2. Key Findings 4
3. Vacancy Summary by Geography 7
4. Occupational Groups 13
5. Detailed Occupations 17
6. Average Wage 19
7. Top Employers 21
8. Job Vacancies by Key Sector 22
9. Education 29
10. Top Skills 31
11. Conclusions 34
12. Appendix A – Sector Definitions 35
13. Appendix B – Detailed Occupation Changes by Local Authority
36
May 2019

Page 3 of 45
1. Introduction
This report is an update on the characteristics of job vacancies within Tees Valley
covering the period January 2018 – December 2018 (inclusive). Tees Valley
covers the five local authority districts of Darlington, Hartlepool, Middlesbrough,
Redcar and Cleveland and Stockton-on-Tees.
The data used is drawn from the commercial ‘Labour Insight Jobs (Burning Glass
Technologies) product. This searches the internet for job adverts. Consequently
only jobs advertised via the internet will be included in this report. Occupations
are defined by the 2010 Standard Occupational Classification (SOC) system.
TVCA Key Sectors definitions based on the 2007 Standard Industrial Classification
(SIC) system can be found in Appendix A.
Numbers are not comparable with previous reports due to revisions in the
methodology used by Labour Insight to classify vacancies.
The level of representation of job vacancies advertised on the web is open to
question as there may be variations in mode of recruitment by sector and size of
business.
An increase in job vacancies may be an indication of new job creation, skills
shortage vacancies or high staff turnover.

Page 4 of 45
2. Key Findings

Page 5 of 45
There were 30,368 job vacancies advertised online in Tees Valley between
January and December 2018.
22,000 Tees Valley residents were unemployed1 in 2018 with 1.4 jobs
advertised for every unemployed person, this compares to 6.2 jobs per
unemployed person nationally.
The number of Job Vacancies has remained fairly steady when compared to
2017, with a slight 0.3% fall (88 fewer vacancies), in comparison to a 7%
drop nationally and a 6% drop across the North of England2.
The largest number of job vacancies in Tees Valley in 2018 were for
Teaching and Educational Professionals with 2,904 job vacancies,
followed by Science, Research, Engineering and Technology
Professionals3 with 2,695 vacancies, then Health Professionals with 2,632
vacancies.
The largest rise when compared to 2017 is for Process, Plant and
Machine Operatives with a 54% increase and vacancies increasing from
240 in 2017 to 369 in 2018 (an extra 129 vacancies).
This is followed by a 35% rise in vacancies for Elementary Trades and
Related occupations with vacancies increasing from 205 in 2017 to 277 in
2018 (72 extra vacancies).
The average advertised wage in Tees Valley remains competitive at £29,900
compared to a national wage of £34,200. The Tees Valley average has risen
by 3.8% over the last year compared to a 3.4% fall in the average advertised
wage nationally.
The National Health Service advertised the highest number of vacancies in
2018 with 1,566 vacancies.
Out of the 18,622 vacancies which could be allocated to an industry sector,
the Health and Social Care sector shows the highest proportion of
vacancies with 26% of all vacancies (4,908 vacancies) followed by Public
Admin, Defence and Education with 24% (4,428 vacancies).
This large percentage of job vacancies available for public sector jobs
reflects the larger than average public sector employment within Tees
Valley, with latest figures from ONS showing that 24% of all employment
within Tees Valley is public sector, compared to 22% nationally.
Job vacancies advertised in the Tees Valley in 2018 required lower level
skills than those advertised nationally, with 43% requiring a Level 2
1 Unemployed – number of people unemployed aged 16+, ONS Annual Population Survey, January 2018 to December 2018.
2 The North region includes the North East, North West and Yorkshire and Humber.
3 This occupational group includes IT and Telecommunication professionals.

Page 6 of 45
qualification, compared to 28% nationally and 36% requiring a Level 5 or
above qualification compared to 53% nationally.4
There was a 3% rise in vacancies requiring a Level 5 or above qualification
compared to a 14% fall nationally. However, there was a 24% increase in
vacancies requiring a Level 2 qualification compared to a 13% increase
nationally.
4 Level 2 qualifications include GCSEs, BTEC First/Diplomas, Traineeships and Intermediate Apprenticeships. Level
5 or above qualifications include Foundation, Bachelor, Honours, Master and Postgraduate Degrees, HND’s and Higher/Degree Apprenticeships.

Page 7 of 45
3. Vacancy Summary by Geography
This section provides a summary of vacancies advertised at a Tees Valley level
before looking at the vacancies advertised within each of the five Tees Valley
local authorities.
There were 30,368 job vacancies advertised online in Tees Valley between
January and December 2018.
Tees Valley - Over the last year
The number of Job Vacancies has remained fairly steady when compared to
2017, with a slight 0.3% fall (88 fewer vacancies), in comparison to a 7%
drop nationally and a 6% drop across the North of England.
There has been a 0.3% fall in job vacancies (88 fewer vacancies) with
numbers falling from 30,456 in 2017 to 30,368 in 2018. This compares to a
7% decrease nationally and a 6% decrease across the North of England.
The largest rise when compared to 2017 has been for Process, Plant and
Machine Operatives with a 54% rise and 129 extra vacancies (from 240 to
369). There has also been a 35% rise in vacancies for Elementary Trades
and Related occupations, with numbers increasing from 205 to 277 (72
extra vacancies).
There has been a 27% fall in vacancies for Leisure, Travel and Related
Personal Service occupations with numbers dropping from 441 in 2017 to
324 in 2018 (117 fewer vacancies).
Tees Valley - Over the last three years
There has been a 4% increase in job vacancies (1,183 extra vacancies) with
vacancies rising from 29,185 in 2015 to 30,368 in 2018. However this
increase is smaller than the 12% rise observed across the UK and the 8%
rise across the North of England.
The largest rise in vacancies has been for Business, Media and Public
Service Professionals with a 27% increase and numbers rising from 1,643
vacancies in 2015 to 2,086 in 2018 (443 extra vacancies).
Over the last three years Leisure, Travel and Related Personal Service
occupations have seen a 19% fall (77 fewer vacancies) followed by 16% fall
in Skilled Construction and Building Trades (85 fewer vacancies).
Figure 1 shows the number of job vacancies advertised within the five Tees
Valley local authorities over the last three years. The local authority location
is taken directly from the job advertisement:
Page 8 of 45
Figure 1: Tees Valley Vacancy Numbers by Local Authority
Middlesbrough consistently has the highest number of job vacancies in Tees
Valley, however it must be taken into consideration that Middlesbrough has
the largest town centre and there may be a number of job vacancies with a
Middlesbrough postal address in the job vacancy that actually lie within the
Redcar and Cleveland local authority boundary e.g. Eston, Normanby etc.
Figures 2 and 3 summarise the changes in job vacancy numbers by Tees
Valley local authority over the last year and last three years respectively5:
Figure 2: Change in job vacancies over last year
Figure 3: Change in job vacancies over last three years
5 The Tees Valley figure will not equal the sum of the five Tees Valley local authorities as there are a number of job vacancies that advertise their location as ‘Tees Valley’ and do not specify a specific local authority .
2017 2018 Change Change %
Darlington 7,280 7,425 145 2%
Hartlepool 2,165 2,375 210 10%
Middlesbrough 10,640 10,335 -305 -3%
Redcar and Cleveland 2,515 2,485 -30 -1%
Stockton 7,785 7,715 -70 -1%
Tees Valley 30,455 30,370 -85 0%
North of England 1,466,695 1,377,570 -89,125 -6%
UK 9,372,975 8,697,620 -675,355 -7%
Change over last year
2015 2018 Change Change %
Darlington 5,750 7,425 1,675 29%
Hartlepool 1,985 2,375 390 20%
Middlesbrough 12,395 10,335 -2,060 -17%
Redcar and Cleveland 2,915 2,485 -430 -15%
Stockton 5,810 7,715 1,905 33%
Tees Valley 29,185 30,370 1,185 4%
North of England 1,272,615 1,377,570 104,955 8%
UK 7,772,630 8,697,620 924,990 12%
Change over last three years
Page 9 of 45
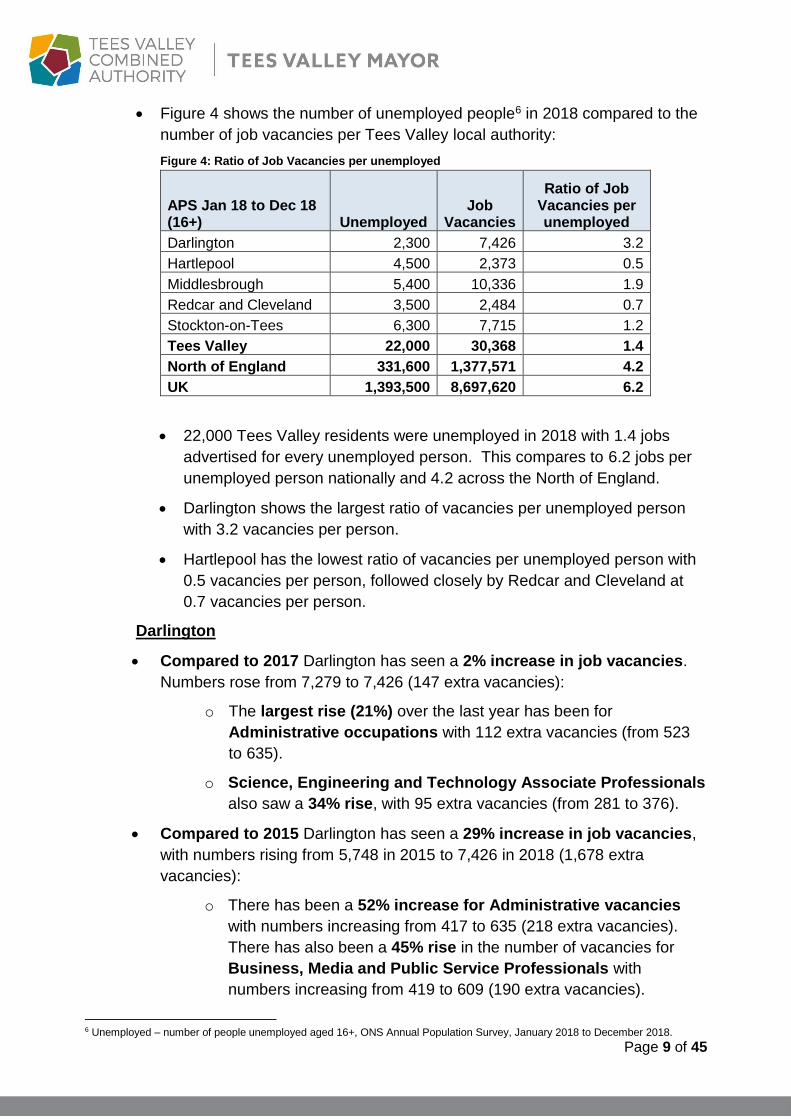
Figure 4 shows the number of unemployed people6 in 2018 compared to the
number of job vacancies per Tees Valley local authority:
Figure 4: Ratio of Job Vacancies per unemployed
APS Jan 18 to Dec 18 (16+) Unemployed
Job Vacancies
Ratio of Job Vacancies per unemployed
Darlington 2,300 7,426 3.2
Hartlepool 4,500 2,373 0.5
Middlesbrough 5,400 10,336 1.9
Redcar and Cleveland 3,500 2,484 0.7
Stockton-on-Tees 6,300 7,715 1.2
Tees Valley 22,000 30,368 1.4
North of England 331,600 1,377,571 4.2
UK 1,393,500 8,697,620 6.2
22,000 Tees Valley residents were unemployed in 2018 with 1.4 jobs
advertised for every unemployed person. This compares to 6.2 jobs per
unemployed person nationally and 4.2 across the North of England.
Darlington shows the largest ratio of vacancies per unemployed person
with 3.2 vacancies per person.
Hartlepool has the lowest ratio of vacancies per unemployed person with
0.5 vacancies per person, followed closely by Redcar and Cleveland at
0.7 vacancies per person.
Darlington
Compared to 2017 Darlington has seen a 2% increase in job vacancies.
Numbers rose from 7,279 to 7,426 (147 extra vacancies):
o The largest rise (21%) over the last year has been for
Administrative occupations with 112 extra vacancies (from 523
to 635).
o Science, Engineering and Technology Associate Professionals
also saw a 34% rise, with 95 extra vacancies (from 281 to 376).
Compared to 2015 Darlington has seen a 29% increase in job vacancies,
with numbers rising from 5,748 in 2015 to 7,426 in 2018 (1,678 extra
vacancies):
o There has been a 52% increase for Administrative vacancies
with numbers increasing from 417 to 635 (218 extra vacancies).
There has also been a 45% rise in the number of vacancies for
Business, Media and Public Service Professionals with
numbers increasing from 419 to 609 (190 extra vacancies).
6 Unemployed – number of people unemployed aged 16+, ONS Annual Population Survey, January 2018 to December 2018.

Page 10 of 45
Hartlepool
Hartlepool consistently has the lowest number of job vacancies advertised
in Tees Valley.
Compared to 2017 a 10% increase has been seen with vacancies rising
from 2,164 in 2017 to 2,373 in 2018 (209 extra vacancies):
o There has been a 41% increase in vacancies for Teaching and
Educational Professionals with vacancies rising from 232 to 328 (96
extra vacancies).
o There has also been a 66% increase in vacancies for Science,
Engineering and Technology Associate Professionals, with
numbers rising from 70 to 116 (46 extra vacancies).
Compared to 2015 Hartlepool has seen a 19% rise in vacancies, with
numbers rising from 1,986 in 2015 to 2,373 in 2018 (387 extra vacancies):
o There has been a 75% rise in Teaching and Educational
Professionals, with numbers rising from 187 to 328 (141 extra
vacancies), followed by a 23% rise in vacancies for Caring Personal
Service occupations, with numbers rising from 208 to 256 (48 extra
vacancies).
Middlesbrough
Middlesbrough consistently has the highest number of job vacancies in
Tees Valley however as mentioned on page 6 it must be taken into
consideration that Middlesbrough has the largest town centre and there may
be a number of job vacancies with a Middlesbrough postal address that
actually lie within the Redcar and Cleveland local authority boundary e.g.
Eston, Normanby etc.
Compared to 2017 Middlesbrough has seen a 3% drop in vacancies, one of
only two Tees Valley districts to see a drop in vacancies. Numbers fell from
10,642 in 2017 to 10,336 in 2018 (306 fewer vacancies):
o In particular there has been a 19% drop in vacancies for Business
and Public Service Associate Professionals with vacancies falling
from 665 to 542 (123 fewer vacancies). There has also been a 12%
drop in vacancies for Health Professionals with numbers falling from
958 to 847 (111 fewer vacancies).
Middlesbrough has seen a 17% drop in job vacancies compared to 2015,
with numbers falling from 12,395 in 2015 to 10,336 in 2018 (2,059 fewer
vacancies):
o There has been a 27% drop in vacancies for Sales occupations, with
numbers falling from 881 to 641 (240 fewer vacancies). This is

Page 11 of 45
followed by a 42% drop in vacancies for Skilled Metal, Electrical and
Electronic Trade occupations, with numbers falling from 483 to 281
(202 fewer vacancies).
Redcar and Cleveland
Compared to 2017 Redcar and Cleveland has seen a 1% fall in vacancies.
Numbers decreased from 2,513 in 2017 to 2,484 in 2018 (29 fewer
vacancies).
o There has been a 163% increase in vacancies for Other Managers
and Proprietors, with numbers rising from 41 to 108 (67 extra
vacancies).
o There has also been a 133% increase in vacancies for Elementary
Trades and Related Occupations with numbers rising from 12 to 28
(16 extra vacancies).
However compared to 2015 Redcar and Cleveland has seen a 15% drop in
job vacancies, with numbers falling from 2,917 in 2015 to 2,484 in 2018 (433
fewer vacancies).
o In particular there has been a 30% drop in vacancies for Caring
Personal Service occupations, with numbers falling from 408 to 285
(123 fewer vacancies).
o There has also been a 59% drop in vacancies for Secretarial and
Related occupations with numbers falling from 91 to 37 (54 fewer
vacancies).
Stockton-on-Tees
Compared to 2017 Stockton-on-Tees has seen a 1% drop in job vacancies,
one of only two Tees Valley districts to see a fall. Numbers fell from 7,784 in
2017 to 7,715 in 2018 (69 fewer vacancies):
o There has been a 26% drop in vacancies for Caring Personal
Service occupations, with numbers falling from 708 to 527 (181
fewer vacancies).
o This is followed by an 11% drop in Health Professionals, with
vacancies falling from 635 to 565 (70 fewer vacancies).
Compared to 2015, Stockton has experienced the largest increase in
vacancies across Tees Valley with a 33% rise and numbers increasing from
5,810 in 2015 to 7,715 in 2018 (1,905 extra vacancies).
o There has been an 87% rise in vacancies for Business, Media and
Public Service Professionals, with numbers increasing from 296 to
553 (257 extra vacancies).

Page 12 of 45
o This is followed by a 44% rise in vacancies for Science, Research,
Engineering and Technology Professionals, with numbers rising
from 573 to 827 (254 extra vacancies).
For a detailed analysis of occupation changes by local authority please see
Appendix B.

Page 13 of 45
4. Occupational Groups
Figure 5 shows the distribution of job vacancies in Tees Valley by 2 digit
Standard Occupational Classification (SOC) group, comparing 2017 with
2018:
Figure 5: Tees Valley Job Vacancies by Occupation Groups
Teaching and Educational Professionals show the largest number of job
vacancies with 2,904 job vacancies, followed by Science, Research,
Engineering and Technology Professionals7 with 2,695 vacancies, then
Health Professionals with 2,632 vacancies.
The largest rise when compared to 2017 is for Process, Plant and
Machine Operatives, with a 54% increase and vacancies increasing from
7 This occupational group includes IT and Telecommunication professionals.

Page 14 of 45
240 in 2017 to 369 in 2018 (an extra 129 vacancies). This is followed by an
35% rise in vacancies for Elementary Trades and Related occupations
with vacancies increasing from 205 in 2017 to 277 in 2018 (72 extra
vacancies).
Leisure, Travel and Related Personal Service occupations have seen a
27% fall in job vacancies compared to 2017, with vacancies dropping from
441 to 324 (117 fewer vacancies). There has also been a 13% fall in
vacancies for Health Professionals with vacancies dropping from 3,030 in
2017 to 2,632 in 2018 (398 fewer vacancies).
In order to further understand the 54% increase in Process, Plant and
Machine Operatives vacancies Figure 6 shows the change in vacancy
numbers for this occupational group, broken down further into 4 digit SOC
codes:
Figure 6: Process, Plant and Machine Operatives by 4 digit SOC Code
Occupation 2017 2018 change
Metal working machine operatives 36 92 56
Plant and machine operatives n.e.c. 68 89 21
Printing machine assistants 7 22 15
Chemical and related process operatives 8 18 10
Construction operatives n.e.c. 37 47 10
Tyre, exhaust and windscreen fitters 1 8 7
Scaffolders, stagers and riggers 16 23 7
Assemblers and routine operatives n.e.c. 3 9 6
Routine inspectors and testers 2 7 5
Textile process operatives 1 4 3
Quarry workers and related operatives 2 5 3
Energy plant operatives 4 7 3
Sewing machinists 1 3 2
Assemblers (vehicles and metal goods) 6 7 1
Water and sewerage plant operatives 1 1 0
Assemblers (electrical and electronic products) 2 2 0
Rail construction and maintenance operatives 2 2 0
Food, drink and tobacco process operatives 10 9 -1
Metal making and treating process operatives 3 2 -1
Electroplaters 1 0 -1
Road construction operatives 8 6 -2
Weighers, graders and sorters 8 1 -7
Paper and wood machine operatives 13 5 -8
We can see from Figure 6 that the largest increase (156%) for this
occupational group is for Metal working machine operatives with 56 extra
vacancies for these occupations compared to the same period last year.

Page 15 of 45
Demand has also increased for Plant and machine operatives with vacancies
increasing from 68 in 2017 to 89 in 2018 (21 extra vacancies).
In order to further understand the 35% rise in vacancies for Elementary
Trades and Related occupations Figure 7 shows the change in vacancy
numbers for this occupational group, broken down further into 4 digit SOC
codes:
Figure 7: Elementary Trades and Related occupations by 4 digit SOC Code
Occupation 2,017 2,018 Change
Elementary process plant occupations n.e.c. 58 86 28
Elementary construction occupations 93 118 25
Forestry workers 16 29 13
Fishing and other elementary agriculture occupations n.e.c. 11 15 4
Packers, bottlers, canners and fillers 20 21 1
Industrial cleaning process occupations 0 1 1
Farm workers 7 7 0
Figure 7 shows that there has been an increase in vacancies in the majority
of occupations in this occupational group. Elementary process plant
occupations n.e.c has seen the largest rise (48%) with 28 extra vacancies
followed by Elementary construction occupations with 25 extra vacancies.
In order to further understand the 27% fall in Leisure, Travel and Related
Personal Service occupations, Figure 8 below shows the change in
vacancy numbers, broken down further into 4 digit SOC codes:
Figure 8: Leisure, Travel and Related Personal Service Occupations by 4 digit SOC Code
Occupation 2017 2018 Change
Beauticians and related occupations 130 56 -74
Hairdressers and barbers 97 62 -35
Housekeepers and related occupations 67 42 -25
Leisure and travel service occupations n.e.c. 8 3 -5
Sports and leisure assistants 37 37 0
Rail travel assistants 1 3 2
Caretakers 86 89 3
Cleaning and housekeeping managers and supervisors 10 18 8
Travel agents 5 14 9
We can see from Figure 8 that the largest fall (57%) was in Beauticians
and related occupations with vacancies falling from 130 in 2017 to 56 in
2018 (74 fewer vacancies). This is followed by a 36% fall in Hairdressers and
barbers from 97 in 2017 to 62 in 2018 (35 fewer vacancies).
In order to further understand the 13% drop in Health Professionals Figure
9 shows the change in vacancy numbers broken down further into 4 digit
SOC codes:

Page 16 of 45
Figure 9: Health Professionals by 4 digit SOC Code
Occupation 2017 2018 Change
Nurses 1,827 1,479 -348
Medical practitioners 469 418 -51
Dental practitioners 71 54 -17
Veterinarians 123 108 -15
Health professionals n.e.c. 73 58 -15
Occupational therapists 57 43 -14
Speech and language therapists 43 29 -14
Midwives 15 4 -11
Physiotherapists 69 59 -10
Medical radiographers 59 55 -4
Therapy professionals n.e.c. 27 26 -1
Podiatrists 6 7 1
Psychologists 73 77 4
Ophthalmic opticians 61 108 47
Pharmacists 57 107 50
We can see from Figure 9 that there has been a 19% fall in vacancies for
Nurses with vacancies dropping from 1,827 in 2017 to 1,479 in 2018 (348
fewer vacancies). There has also been an 11% drop in vacancies for
Medical Practitioners with vacancies falling from 469 to 418 (51 fewer
vacancies).
Page 17 of 45
5. Detailed Occupations
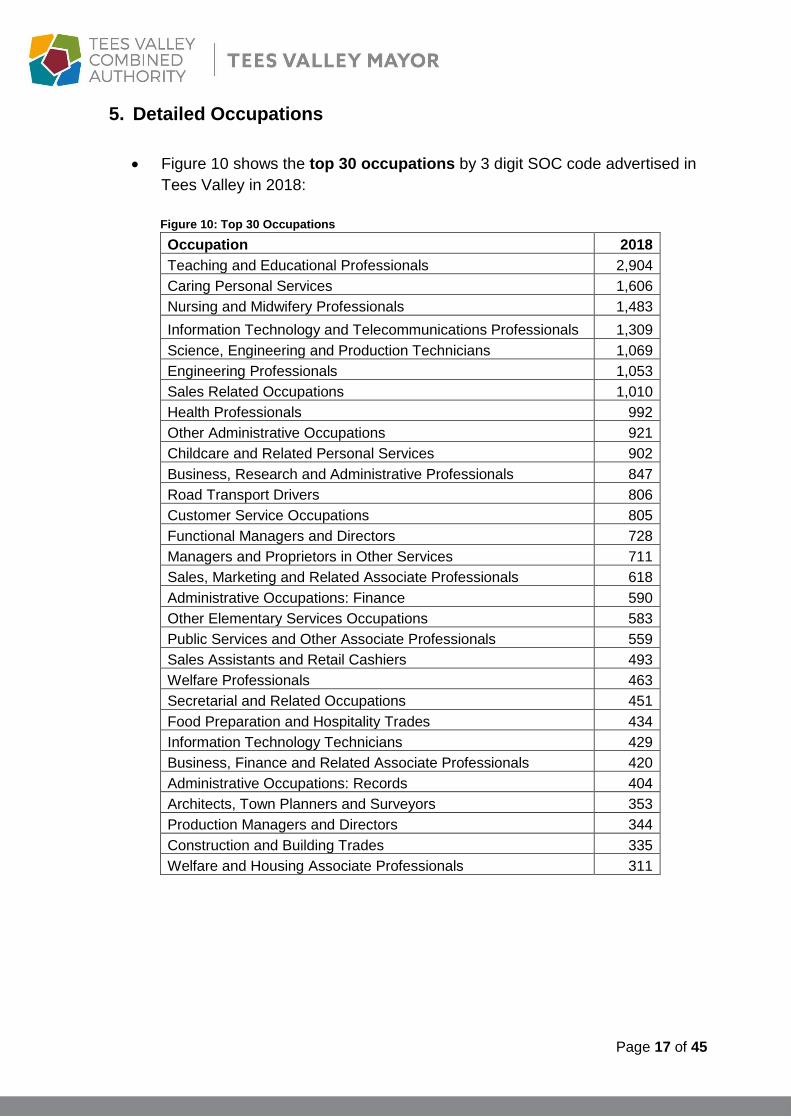
Figure 10 shows the top 30 occupations by 3 digit SOC code advertised in
Tees Valley in 2018:
Figure 10: Top 30 Occupations
Occupation 2018
Teaching and Educational Professionals 2,904
Caring Personal Services 1,606
Nursing and Midwifery Professionals 1,483
Information Technology and Telecommunications Professionals 1,309
Science, Engineering and Production Technicians 1,069
Engineering Professionals 1,053
Sales Related Occupations 1,010
Health Professionals 992
Other Administrative Occupations 921
Childcare and Related Personal Services 902
Business, Research and Administrative Professionals 847
Road Transport Drivers 806
Customer Service Occupations 805
Functional Managers and Directors 728
Managers and Proprietors in Other Services 711
Sales, Marketing and Related Associate Professionals 618
Administrative Occupations: Finance 590
Other Elementary Services Occupations 583
Public Services and Other Associate Professionals 559
Sales Assistants and Retail Cashiers 493
Welfare Professionals 463
Secretarial and Related Occupations 451
Food Preparation and Hospitality Trades 434
Information Technology Technicians 429
Business, Finance and Related Associate Professionals 420
Administrative Occupations: Records 404
Architects, Town Planners and Surveyors 353
Production Managers and Directors 344
Construction and Building Trades 335
Welfare and Housing Associate Professionals 311

Page 18 of 45
The occupations that have shown the biggest increase in job vacancies when
compared to 2017 (by 3 digit SOC code) can be seen in Figure 11.
Figure 11: Largest Increases in Job Vacancies Occupation 2017 2018 Change
Science, Engineering and Production Technicians 747 1,069 322
Teaching and Educational Professionals 2,609 2,904 295
Road Transport Drivers 609 806 197
Business, Research and Administrative Professionals 682 847 165
Administrative Occupations: Records 290 404 114
Artistic, Literary and Media Occupations 99 196 97
Welfare and Housing Associate Professionals 216 311 95
Plant and Machine Operatives 131 221 90
Customer Service Occupations 726 805 79
Production Managers and Directors 279 344 65
The occupations that have shown the largest decrease in job vacancies when
compared to 2017 (by 3 digit SOC code) are shown in Figure 12.
Figure 12: Largest Decreases in Job Vacancies
Occupation 2017 2018 Change
Nursing and Midwifery Professionals 1,842 1,483 -359
Information Technology and Telecommunications Professionals 1,575 1,309 -266
Caring Personal Services 1,859 1,606 -253
Hairdressers and Related Services 227 118 -109
Childcare and Related Personal Services 999 902 -97
Health and Social Services Managers and Directors 309 226 -83
Functional Managers and Directors 808 728 -80
Sales, Marketing and Related Associate Professionals 688 618 -70
Electrical and Electronic Trades 355 301 -54
Therapy Professionals 196 157 -39
For a detailed analysis of occupation changes by local authority please
see Appendix B.

Page 19 of 45
6. Average Advertised Wage
The average advertised wage8 in Tees Valley remains competitive at
£29,900 compared to a national wage of £34,200.
Tees Valley has a tradition of lower salaries, this along with an increase of
lower paid jobs such as kitchen and catering assistants and van drivers
results in a competitive average wage for Tees Valley.
When compared to 2017 the Tees Valley average advertised wage has seen
a 3.8% increase (an extra £1,100) compared to a 3.4% decrease nationally.
2018 figures from the Annual Survey of Hours and Earnings (ASHE) show
that the average annual gross salary for full time workers in Tees Valley was
£31,028, compared to £36,611 nationally. This shows that the average
advertised wage of £29,900 in 2018 is lower than the existing average Tees
Valley wage of £31,028 as reported in ASHE.
Figure 13 shows the average advertised wage in Tees Valley broken down
by 2 digit SOC code.
8 Salary figures are pro rata to reflect full-time, annual wage status.

Page 20 of 45
Figure 13: Average Advertised Wage in Tees Valley by occupation
Science, Research, Engineering and Technology Professionals had the
highest average advertised wage in Tees Valley in 2018 at £40,900, followed
by Health Professionals at £40,000.
Leisure, Travel and Related Personal Service occupations have seen the
most significant rise in average advertised wage when compared to 2017,
rising 21% from £16,200 to £19,600 (a £3,400 increase).
However there has been a 5% fall in the average advertised wage of
Business, Media and Public Service Professionals with the average wage
decreasing from £40,100 in 2017 to £37,900 in 2018 (a £2,200 drop).
Page 21 of 45
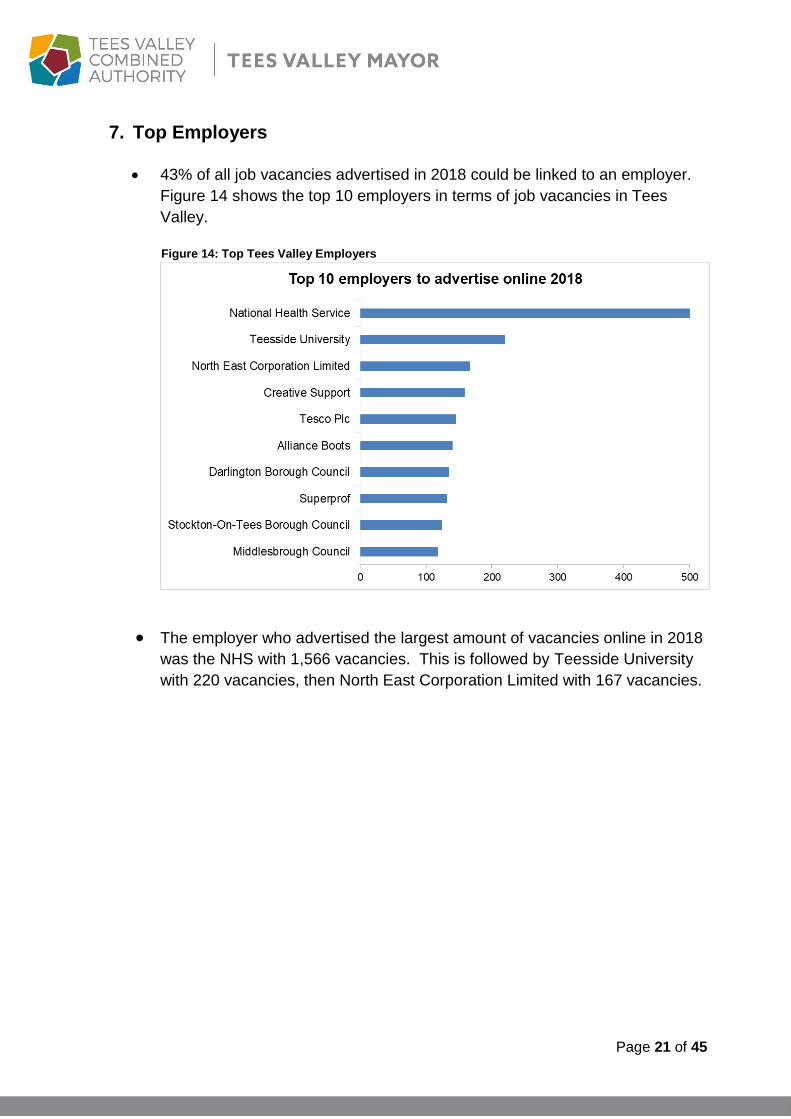
7. Top Employers 43% of all job vacancies advertised in 2018 could be linked to an employer.
Figure 14 shows the top 10 employers in terms of job vacancies in Tees
Valley.
Figure 14: Top Tees Valley Employers
The employer who advertised the largest amount of vacancies online in 2018
was the NHS with 1,566 vacancies. This is followed by Teesside University
with 220 vacancies, then North East Corporation Limited with 167 vacancies.
Page 22 of 45
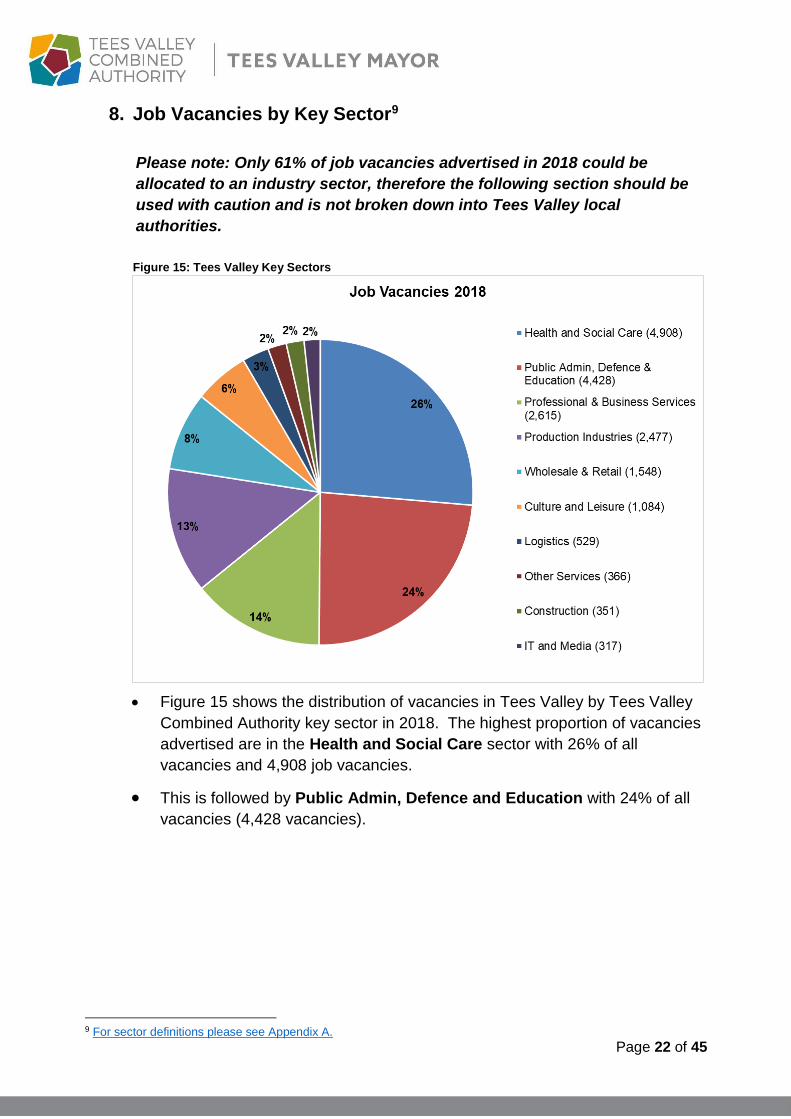
8. Job Vacancies by Key Sector9
Please note: Only 61% of job vacancies advertised in 2018 could be
allocated to an industry sector, therefore the following section should be
used with caution and is not broken down into Tees Valley local
authorities.
Figure 15: Tees Valley Key Sectors
Figure 15 shows the distribution of vacancies in Tees Valley by Tees Valley
Combined Authority key sector in 2018. The highest proportion of vacancies
advertised are in the Health and Social Care sector with 26% of all
vacancies and 4,908 job vacancies.
This is followed by Public Admin, Defence and Education with 24% of all
vacancies (4,428 vacancies).
9 For sector definitions please see Appendix A.
Page 23 of 45
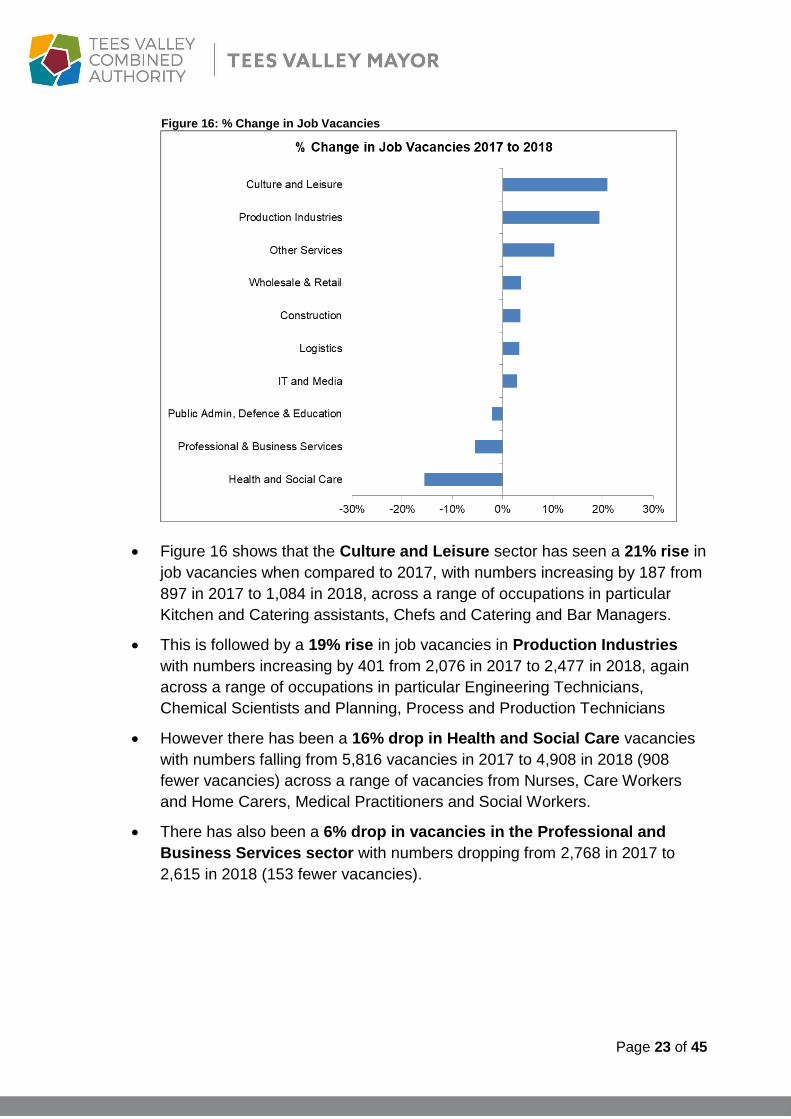
Figure 16: % Change in Job Vacancies
Figure 16 shows that the Culture and Leisure sector has seen a 21% rise in
job vacancies when compared to 2017, with numbers increasing by 187 from
897 in 2017 to 1,084 in 2018, across a range of occupations in particular
Kitchen and Catering assistants, Chefs and Catering and Bar Managers.
This is followed by a 19% rise in job vacancies in Production Industries
with numbers increasing by 401 from 2,076 in 2017 to 2,477 in 2018, again
across a range of occupations in particular Engineering Technicians,
Chemical Scientists and Planning, Process and Production Technicians
However there has been a 16% drop in Health and Social Care vacancies
with numbers falling from 5,816 vacancies in 2017 to 4,908 in 2018 (908
fewer vacancies) across a range of vacancies from Nurses, Care Workers
and Home Carers, Medical Practitioners and Social Workers.
There has also been a 6% drop in vacancies in the Professional and
Business Services sector with numbers dropping from 2,768 in 2017 to
2,615 in 2018 (153 fewer vacancies).

Page 24 of 45
a) Construction
The Construction sector accounted for 2% of all vacancies advertised in Tees
Valley in 2018 with 351 vacancies. The number of vacancies has risen by
4% when compared to 2017, with numbers increasing from 339 to 351 (12
extra vacancies).
60% of job vacancies in Construction could be linked to an employer name.
The top five employers to advertise Construction vacancies in Tees Valley
in 2018 were:
o Anglian Home Improvements Group (22 vacancies);
o Taylor Wimpey (16 vacancies);
o One Stop Stores Lt. (11 vacancies);
o S.G.S Ltd. (10 vacancies); and
o Anchor Ltd (10 vacancies).
The average salary for the 351 Construction jobs advertised in 2015 was
£37,700 a £9,700 increase compared to £28,000 for 2017.
b) Culture and Leisure
The Culture and Leisure sector accounted for 6% of all jobs advertised in
Tees Valley in 2018 with 1,084 vacancies. There has been a 21% increase in
vacancies compared to 2017 with numbers rising from 897 in 2017 to 1,084
in 2018 (187 extra vacancies) with a particular rise in vacancies for kitchen
and catering assistants.
69% of job vacancies in Culture and Leisure could be linked to an employer
name. The top five employers to advertise vacancies in Tees Valley in
2018 were:
o Pizza Hut (99 vacancies);
o KFC (72 vacancies);
o Stonegate Pub Company (68 vacancies);
o Greggs (47 vacancies); and
o The Bannatyne Group (35 vacancies).
The average salary for the 1,084 Culture and Leisure jobs advertised in 2018
was £20,800 a £800 increase from the £20,000 average salary for 2017.
c) Health and Social Care
Health and Social Care is the largest sector for job vacancies in Tees Valley
accounting for 26% of all vacancies advertised in 2018, with 4,908 vacancies.
However there has been a 16% fall in the number of vacancies advertised

Page 25 of 45
compared to 2017 with numbers falling from 5,816 to 4,908 (908 fewer
vacancies) across a range of occupations, in particular nurses, nursing
auxiliaries and assistants and health services and public health managers
and directors.
66% of job vacancies in Health and Social Care could be linked to an
employer name. The top five employers to advertise Health and Social
Care vacancies in Tees Valley in 2018 were:
o National Health Service (1,566 vacancies);
o Creative Support (225 vacancies);
o Four Seasons Health Care (71 vacancies);
o The Sanctuary Group (68 vacancies); and
o Voyage Care (62 vacancies)
The average salary for the 4,908 Health and Social Care jobs advertised in
2018 was £31,200, a £100 drop from the £31,300 average salary for 2017.
d) IT, and Media
The IT and Media sector accounted for 2% of all jobs advertised in Tees Valley
in 2018 with 317 vacancies. This sector has seen a 3% rise in vacancies
when compared to 2017 with numbers increasing from 308 in 2017 to 317 in
2018 (9 extra vacancies).
90% of job vacancies in IT and Media could be linked to an employer name.
The top five employers to advertise vacancies in Tees Valley in 2018 were:
o Newsquest Media Group (32 vacancies),
o Virgin Media (27 vacancies);
o EE Ltd (20 vacancies);
o Thirteen Ltd (18 vacancies); and
o British Telecom (16 vacancies)
The average salary for the 317 IT and Media jobs advertised in 2018 was
£26,500 a £1,400 increase from the £25,100 average salary for 2017. This
wage reflects the entry and lower level IT vacancies advertised for various call
centres across Tees Valley.
e) Logistics
The Logistics sector accounted for 3% of all job vacancies advertised in Tees
Valley in 2018 with 529 vacancies. There has been a 3% rise in vacancies
compared to 2017, with numbers increasing from 512 in 2017 to 529 in 2018
(17 extra vacancies).

Page 26 of 45
39% of job vacancies in Logistics could be linked to an employer name. The
top five employers to advertise Logistics vacancies in Tees Valley in 2018
were:
o DHL Express (28 vacancies);
o Royal Mail (23 vacancies);
o Yodel (10 vacancies);
o Stobart Group (7 vacancies); and
o Start Your New Job / AV Dawson Ltd / Agency Drivers Network Ltd (6
vacancies each).
The average salary for the 529 Logistics jobs advertised in 2018 was
£26,200, a £3,600 increase from the £22,600 average salary for 2017.
f) Production Industries
Production Industries accounted for 13% of all job vacancies advertised in
Tees Valley in 2018 with 2,477 vacancies. This sector has seen a 19% rise
in vacancies compared to 2016, with numbers increasing from 2,076 to
2,0477 (401 extra vacancies) across a range of occupations, in particular
engineering technicians, chemical scientists and planning process and
production technicians.
38% of job vacancies in Production Industries could be linked to an employer
name. The top five employers to advertise vacancies in Tees Valley in 2018
were:
o Cummins Ltd (107 vacancies);
o Foster Wheeler (94 vacancies);
o Johnson Matthey PLC (58 vacancies);
o Castleview Ltd (54 vacancies); and
o Lucite International Group Ltd (40 vacancies).
The average salary for the 2,085 Production Industries jobs advertised in
2018 was £30,600, no change from the £30,600 average salary for 2017.
g) Professional and Business Services
The Professional and Business Services sector accounted for 14% of all job
vacancies advertised in Tees Valley in 2018 with 2,615 vacancies. There
has been a 6% drop in vacancies when compared to 2017 with 153 fewer
vacancies.
72% of job vacancies in Professional and Business services could be linked
to an employer name. The top five employers to advertise vacancies in
2018 were:

Page 27 of 45
o WESSER Ltd (68 vacancies);
o G4S Cash Solutions (66 vacancies);
o Co-operative Insurance (39 vacancies);
o OCS Group (36 vacancies); and
o Fresh Group Ltd (33 vacancies).
The average salary for the 2,615 Professional and Business Services jobs
advertised in 2018 was £27,600, a £1,900 increase compared to the
£25,700 average salary for 2017.
h) Public Admin, Defence and Education
The Public Admin, Defence and Education sector is the second largest sector
with 24% of all job vacancies advertised in Tees Valley in 2018 with 4,428
vacancies. There has been a 2% drop in vacancies compared to 2017, with
numbers falling from 4,525 to 4,428 (97 fewer vacancies).
41% of job vacancies in Public Admin, Defence and Education could be
linked to an employer name. The top five employers to advertise
vacancies in 2018 were:
o Teesside University (220 vacancies);
o Superprof (131 vacancies);
o Darlington Borough Council (120 vacancies);
o Stockton-on-Tees Borough Council (112 vacancies); and
o Middlesbrough Council (110 vacancies).
The average salary for the 4,428 Public Admin, Defence and Education jobs
advertised in 2018 was £31,900, a £3,200 drop compared to the £28,700
average salary for 2017.
i) Wholesale and Retail
The Wholesale and Retail sector accounted for 8% of all job vacancies
advertised in Tees Valley in 2018 with 1,548 vacancies. There has been a
4% rise in vacancies compared to 2017, with numbers increasing from 1,494
to 1,548 (54 extra vacancies) across a range of occupations including
customer service occupations, pharmacists and pharmacy dispensing
assistants.

Page 28 of 45
80% of job vacancies in Wholesale and Retail could be linked to an employer
name. The top five employers to advertise vacancies in 2018 were:
o Tesco Plc (146 vacancies);
o Alliance Boots (140 vacancies);
o Asda (80 vacancies);
o R.M.S. Ltd (63 vacancies); and
o Orridge Company Ltd (36 vacancies)
The average salary for the 1,548 Wholesale and Retail jobs advertised in
2018 was £23,300, a £200 rise from the £23,100 average salary for 2017.
j) Other Services10
The Other Services sector accounted for 2% of all job vacancies advertised
in Tees Valley in 2018 with 365 vacancies. However there has been a 10%
increase in vacancies when compared to 2017 with numbers rising from 331
to 365 (34 extra vacancies), across a range of occupations including
secondary education teaching professionals, driving instructors and business
and financial project management professionals.
72% of job vacancies in Other Services could be linked to an employer
name. The top five employers to advertise vacancies in 2017 were:
o Imperial Workforce Ltd (109 vacancies);
o Sync Incorproated Ltd (21 vacancies);
o Lifestyle Fitness Ltd (17 vacancies);
o Working for Wildlife Ltd (6 vacancies) and
o Hospice UK (5 vacancies)
The average salary for the 365 Other Services jobs advertised in 2018 was
£25,600, a £4,400 increase from the £21,200 average salary for 2017.
10 Other Services includes Hairdressing, funeral activities, physical well-being organisations such as gyms, repair of goods, and charities amongst others.

Page 29 of 45
9. Education Only 20% of Tees Valley job vacancies advertised in 2018 included details about required
education levels, therefore please use the following section with caution.
Qualification levels include:
Figure 17: Qualification Levels
Level Description
Level 2 GCSE’s, BTEC First/Diplomas, Traineeships and Intermediate
Apprenticeships
Level 3 A Levels, BTEC National Diplomas, Advanced Apprenticeships
Level 4 Certificate/Diploma of Higher Education, HNC, Higher
Apprenticeships
Level 5 Foundation Degrees, HND’s, Diploma of Higher Education, Higher
Apprenticeships
Level 6 Bachelor/Honours Degree, Degree Apprenticeships
Level 7 Masters Degree and Postgraduate Certificates, Degree
Apprenticeships
Figure 18 shows the level of education specified on job vacancies advertised
in Tees Valley compared to national figures in 2018:
Figure 18: Education requirements compared to national
36% of job vacancies advertised in 2018 required a Level 5 or above
qualification e.g. degree level, compared to 53% nationally.
43% of job vacancies required a Level 2 qualification e.g. GCSE’s,
compared to 28% nationally.

Page 30 of 45
13% of vacancies required a Level 3 qualification e.g. A Level, equal to
13% nationally.
7% of vacancies required a Level 4 qualification e.g. HNC, Diploma,
compared to 6% nationally.
Figure 19 shows the change in education requirement for 2018 compared to
2017:
Figure 19: Education Requirements
There has been a 3% increase in vacancies requiring Level 5 or above
qualification e.g. degree level when compared 2017, with vacancies rising
from 2,198 to 2,261 (63 extra vacancies), this is compared to a 14% drop
nationally.
There has been an 11% drop in vacancies requiring a Level 4 qualification
e.g. diploma, HNC’s degree level when compared to 2017, with vacancies
falling from 475 to 425 (50 fewer vacancies), this is compared to an 8% drop
nationally.
There has been an 26% drop in vacancies requiring a Level 3 qualification
e.g. A-Levels when compared to 2017, with vacancies falling from 1,115 to
828 (287 fewer vacancies), this mirrors a 26% drop nationally.
There has been a 24% increase in vacancies requiring a Level 2
qualification e.g. GCSE’s when compared to 2017, with vacancies increasing
from 2,164 to 2,675 (511 extra vacancies), this is compared to a 13% rise
nationally.

Page 31 of 45
10. Top Skills
Labour Insight groups skills into three groups;
o Baseline Skills such as communication and problem solving;
o Specialist Skills such as teaching and repair; and
o Computer Skills such as Microsoft Excel and JavaScript.
Figure 20 shows the top 10 baseline skills requested in Tees Valley in 2018
along with the number of vacancies which requested the skill:
Figure 20: Top 10 Baseline Skills Baseline Skills 2018
Communication Skills 5,428
Organisational Skills 2,429
Planning 2,247
Detail-Orientated 1,582
Creativity 1,502
English 1,463
Microsoft Excel 1,387
Leadership 1,105
Microsoft Office 1,053
Problem Solving 952
Figure 21 shows the top 10 specialist skills requested in Tees Valley in 2018
along with the number of vacancies which requested the skill:
Figure 21: Top 10 Specialist Skills Specialised Skills 2018
Teaching 3,714
Customer Service 2,876
Teamwork / Collaboration 1,954
Sales 1,815
Budgeting 1,493
Working With Patient And/Or Condition: Mental Health 1,235
Project Management 874
Cleaning 830
Key Performance Indicators (KPIs) 815
Accounting 763
Page 32 of 45
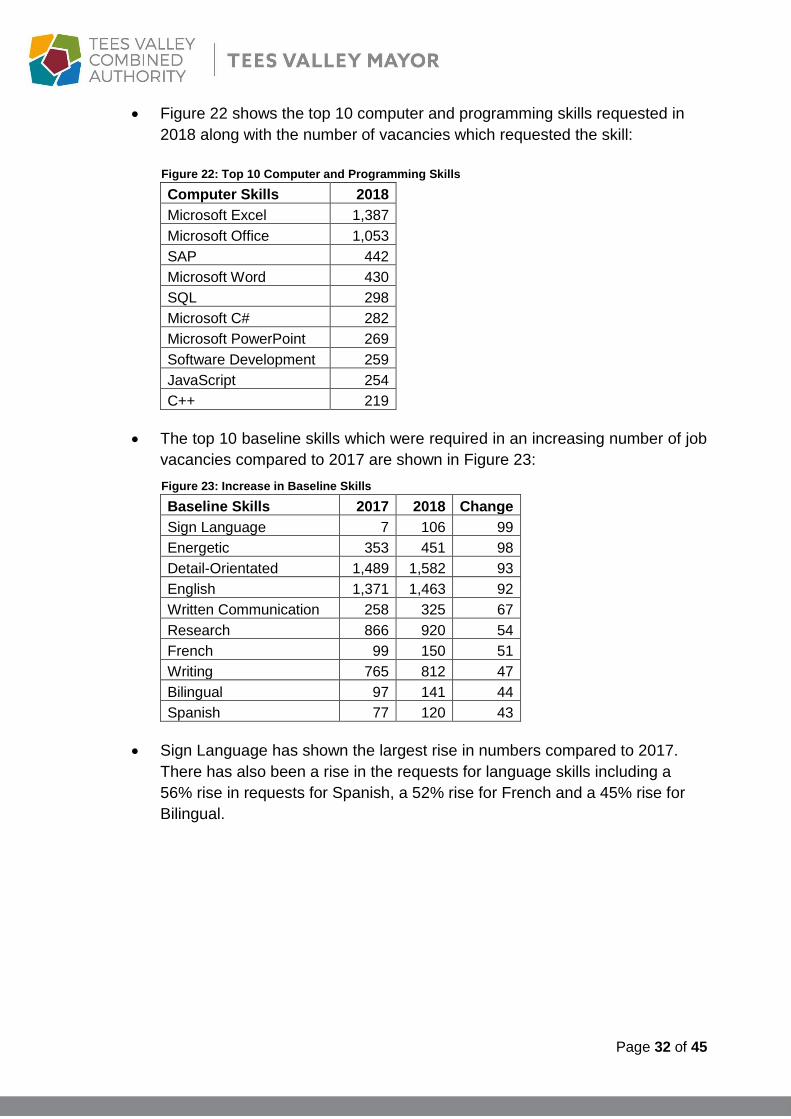
Figure 22 shows the top 10 computer and programming skills requested in
2018 along with the number of vacancies which requested the skill:
Figure 22: Top 10 Computer and Programming Skills Computer Skills 2018
Microsoft Excel 1,387
Microsoft Office 1,053
SAP 442
Microsoft Word 430
SQL 298
Microsoft C# 282
Microsoft PowerPoint 269
Software Development 259
JavaScript 254
C++ 219
The top 10 baseline skills which were required in an increasing number of job
vacancies compared to 2017 are shown in Figure 23:
Figure 23: Increase in Baseline Skills Baseline Skills 2017 2018 Change
Sign Language 7 106 99
Energetic 353 451 98
Detail-Orientated 1,489 1,582 93
English 1,371 1,463 92
Written Communication 258 325 67
Research 866 920 54
French 99 150 51
Writing 765 812 47
Bilingual 97 141 44
Spanish 77 120 43
Sign Language has shown the largest rise in numbers compared to 2017.
There has also been a rise in the requests for language skills including a
56% rise in requests for Spanish, a 52% rise for French and a 45% rise for
Bilingual.

Page 33 of 45
The top 10 specialist skills which were required in an increasing number of
job vacancies compared to 2017 are shown in Figure 24:
Figure 24: Increase in Specialist Skills
Specialist Skills 2017 2018 Change
Customer Service 2,583 2,876 293
Social Services 326 524 198
Tutoring 0 194 194
Technical Recruiting 0 170 170
Computer Numerical Control (CNC) 0 152 152
SAP 296 442 146
Home Health 0 143 143
External Auditing 171 307 136
Process Engineering 0 135 135
Public Health and Safety 0 124 124
Customer Service has shown the largest rise when compared to 2017,
followed by Social Services skills and Tutoring skills.
The top 10 computer skills which were required in an increasing number of
job vacancies compared to 2017 are shown in Figure 25:
Figure 25: Increase in Computer Skills
Computer Skills 2017 2018 Change
SAP 296 442 146
Enterprise Resource Planning (ERP) 160 207 47
Microsoft Operating Systems 47 92 45
Scrum 62 105 43
SolidWorks 20 58 38
Word Processing 81 115 34
Microsoft Azure Cloud Services 6 38 32
Software Engineering 139 170 31
Microsoft PowerShell 19 47 28
SCADA 45 67 22
SAP (Systems, Application and Products software) skills have shown the
largest rise when compared to 2017 with a 58% increase.

Page 34 of 45
11. Conclusions
This report has summarised the characteristics of online job vacancies within Tees
Valley as analysed by the Labour Insight system between January and December
2018. Vacancies have remained fairly steady with a slight 0.3% fall when compared
to 2017 with vacancies increasing from 30,456 to 30,369 (88 fewer vacancies). This
compares to a 7% decrease nationally and a 6% decrease across the North of
England.
There were 1.4 jobs advertised for every unemployed person in Tees Valley in 2018,
this compares to 6.2 jobs per unemployed person nationally.
Job vacancy numbers in the public sector remain high with the proportion of job
vacancies highest in the Health and Social Care sector (26%), followed by Public
admin, defence and education with 24%. The large percentage of job vacancies
available in the public sector reflects the latest figures from ONS showing that 24% of
all employment within Tees Valley is public sector, compared to 22% nationally.
Job vacancies were highest for Teaching and Educational Professionals with
2,904 job vacancies, followed by Science, Research, Engineering and Technology
Professionals with 2,695 vacancies, then Health Professionals with 2,632
vacancies.
The largest rise when compared to 2017 has been for Process, Plant and Machine
Operatives with a 54% increase and 129 extra vacancies (from 240 to 369).
There has also been an 35% rise in vacancies for Elementary Service
Occupations with vacancies increasing from 205 in 2017 to 277 in 2018 (72 extra
vacancies).
The average advertised wage in Tees Valley remains competitive at £29,900
compared to a national wage of £34,200 and reflects the high number of lower paid
jobs such as carers and teaching assistants. The Tees Valley average has risen by
3.8% over the last year compared to a 3.4% fall nationally.
Job vacancies advertised in the Tees Valley in 2018 required lower level skills than
those advertised nationally, with 43% requiring a Level 2 qualification, compared to
28% nationally and 36% requiring a Level 5 or above qualification compared to 53%
nationally.
However there has been a rise in vacancies requiring higher level skills with a 3%
rise in vacancies requiring a Level 5 or above qualification compared to a 14% fall
nationally. There is also continuing demand for lower level skills with a 24% increase
in vacancies requiring a Level 2 qualification compared to a 13% rise nationally.
Tees Valley Combined Authority, Strategy, Policy and Intelligence
May 2019

12. Appendix A – Sector Definitions
Figure 26: Sector Definitions
TVCA broad sector SIC Description
SIC
Code
Construction Construction F
Culture and Leisure
Accommodation And Food Service Activities I
Arts, Entertainment And Recreation R
Health and Social Care Human Health And Social Work Activities Q
IT and Media Information And Communication J
Logistics Transportation And Storage H
Production Industries
Agriculture, Forestry And Fishing A
Electricity, Gas, Steam And Air Conditioning
Supply D
Manufacturing C
Mining And Quarrying B
Water Supply; Sewerage, Waste Management And
Remediation Activities E
Professional & Business
Services
Financial And Insurance Activities K
Professional, Scientific And Technical Activities M
Real Estate Activities L
Administrative And Support Service Activities N
Public Admin, Defence &
Education
Education P
Public Administration And Defence; Compulsory
Social Security O
Wholesale & Retail
Wholesale And Retail Trade; Repair Of Motor
Vehicles And Motorcycles G
Other Services Other Service Activities S

Page 36 of 45
13. Appendix B – Occupation Changes by Local Authority
Darlington
There were 7,426 Darlington job vacancies advertised online in 2018, a
2% increase compared to 2017 (147 extra vacancies).
Figure 27 shows the distribution of vacancies in Darlington by 2 digit SOC
group:
Figure 27: Darlington Job Vacancies

Page 37 of 45
The largest percentage of vacancies (11%) was for Health Professionals
with 822 vacancies, followed by Administrative occupations with 9% of
all vacancies (635 vacancies).
The largest rise in job vacancies over the last year has been for
Administrative occupations, with a 21% rise and numbers increasing
from 523 to 635 (112 extra vacancies).
There has also been a 34% increase in Science, Engineering and
Technology Associate professionals with numbers increasing from 281
in 2017 to 376 in 2018 (95 extra vacancies).
There has been 15% drop in vacancies for Health Professionals
compared to 2017, with numbers falling from 967 to 822 (145 fewer
vacancies).
Figures 28 and 29 show the top 10 vacancy increases and decreases in
Darlington over the last year by 3 digit Standard Occupational
Classification (SOC) group:
Figure 28: Top 10 Darlington increases
Top 10 job vacancy increases in Darlington 2017 2018 Change
Teaching and Educational Professionals 434 517 83
Science, Engineering and Production Technicians 146 207 61
Information Technology Technicians 80 139 59
Business, Research and Administrative Professionals 212 262 50
Administrative Occupations: Records 95 136 41
Road Transport Drivers 137 176 39
Administrative Occupations: Finance 159 197 38
Sales Related Occupations 209 243 34
Plant and Machine Operatives 24 56 32
Business, Finance and Related Associate Professionals 117 148 31
Figure 29: Top 10 Darlington decreases
Top 10 job vacancy decreases in Darlington 2017 2018 Change
Nursing and Midwifery Professionals 564 487 -77
Information Technology and Telecommunications
Professionals 368 314 -54
Health Professionals 338 292 -46
Engineering Professionals 263 220 -43
Functional Managers and Directors 251 209 -42
Sales, Marketing and Related Associate Professional 188 156 -32
Draughtspersons and Related Architectural Technicians 55 30 -25
Health Associate Professionals 83 58 -25
Therapy Professionals 65 43 -22
Housekeeping and Related Services 45 25 -20
Page 38 of 45
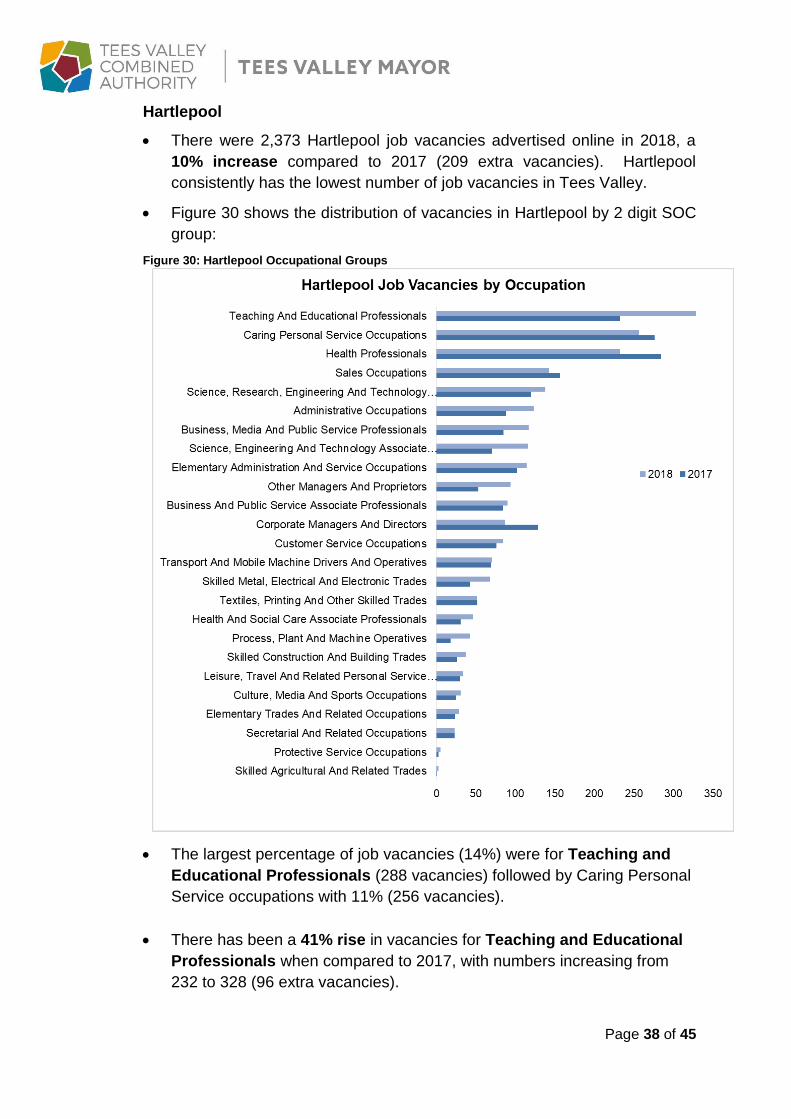
Hartlepool
There were 2,373 Hartlepool job vacancies advertised online in 2018, a
10% increase compared to 2017 (209 extra vacancies). Hartlepool
consistently has the lowest number of job vacancies in Tees Valley.
Figure 30 shows the distribution of vacancies in Hartlepool by 2 digit SOC
group:
Figure 30: Hartlepool Occupational Groups
The largest percentage of job vacancies (14%) were for Teaching and
Educational Professionals (288 vacancies) followed by Caring Personal
Service occupations with 11% (256 vacancies).
There has been a 41% rise in vacancies for Teaching and Educational
Professionals when compared to 2017, with numbers increasing from
232 to 328 (96 extra vacancies).

Page 39 of 45
There has been an 18% drop in vacancies for Health Professionals over
the last year, with numbers falling from 284 to 232 (52 fewer vacancies).
Figures 31 and 32 show the top 10 vacancy increases and decreases in
Hartlepool over the last year by 3 digit SOC group.
Figure 31: Top 10 Hartlepool increases
Top 10 job vacancy increases in Hartlepool 2017 2018 Change
Teaching and Educational Professionals 232 328 96
Science, Engineering and Production Technicians 49 76 27
Other Administrative Occupations 49 75 26
Information Technology Technicians 15 36 21
Managers and Proprietors in Other Services 37 55 18
Customer Service Occupations 62 79 17
Plant and Machine Operatives 12 29 17
Business, Research and Administrative
Professionals 31 46 15
Managers and Proprietors in Health and Care
Services 13 28 15
Welfare and Housing Associate Professionals 11 26 15
Figure 32: Top 10 Hartlepool decreases
Top 10 job vacancy decreases in Hartlepool 2017 2018 Change
Nursing and Midwifery Professionals 198 157 -41
Sales Related Occupations 106 79 -27
Caring Personal Services 184 158 -26
Functional Managers and Directors 56 31 -25
Business, Finance and Related Associate
Professionals 35 12 -23
Health and Social Services Managers and Directors 34 19 -15
Managers and Directors in Retail and Wholesale 17 6 -11
Customer Service Managers and Supervisors 14 5 -9
Other Skilled Trades 18 9 -9
Other Elementary Services Occupations 63 55 -8

Page 40 of 45
Middlesbrough
Middlesbrough consistently has the highest number of job vacancies in
Tees Valley. There were 10,336 Middlesbrough job vacancies advertised
online in 2018, however this is a 3% drop compared to 2017 (306 fewer
vacancies).
Figure 33 shows the distribution of vacancies in Middlesbrough by 2 digit
SOC group.
Figure 33: Middlesbrough Occupational Groups
The largest percentage of vacancies (11%) was for Teaching and
Educational Professionals (1,110 vacancies). This is followed by
Science, Research, Engineering and Technology Professionals with

Page 41 of 45
9.2% (945 vacancies) and Caring Personal Service occupations with
9.1% (939 vacancies).
There has been a 19% drop in vacancies for Business and Public
Service Associate Professionals when compared to 2017, with
vacancies falling from 665 to 542 (123 fewer vacancies).
There has also been a fall in the number of Health Professionals with
numbers dropping from 958 in 2017 to 847 in 2018 (111 fewer vacancies).
Figures 34 and 35 show the top 10 vacancy increases and decreases in
Middlesbrough over the last year by 3 digit (SOC) group:
Figure 34: Top 10 Middlesbrough increases
Top 10 job vacancy increases in Middlesbrough 2017 2018 Change
Road Transport Drivers 242 359 117
Teaching and Educational Professionals 1,001 1,110 109
Science, Engineering and Production Technicians 275 363 88
Health Professionals 312 395 83
Engineering Professionals 289 364 75
Elementary Storage Occupations 61 113 52
Administrative Occupations: Records 84 134 50
Welfare and Housing Associate Professionals 78 121 43
Plant and Machine Operatives 45 75 30
Architects, Town Planners and Surveyors 120 146 26
Figure 35: Top 10 Middlesbrough decreases
Top 10 job vacancy decreases in Middlesbrough 2017 2018 Change
Nursing and Midwifery Professionals 592 420 -172
Information Technology and Telecommunications
Professionals 553 465 -88
Caring Personal Services 620 548 -72
Sales, Marketing and Related Associate Professionals 258 206 -52
Public Services and Other Associate Professionals 248 197 -51
Other Administrative Occupations 271 230 -41
Electrical and Electronic Trades 149 110 -39
Elementary Cleaning Occupations 107 70 -37
Secretarial and Related Occupations 176 139 -37
Food Preparation and Hospitality Trades 142 112 -30

Page 42 of 45
Redcar and Cleveland
There were 2,484 Redcar and Cleveland job vacancies advertised online
in 2018, a 1% fall when compared to 2017 (29 fewer vacancies).
Figure 36 shows the distribution of vacancies in Redcar and Cleveland by
2 digit SOC group.
Figure 36: Redcar and Cleveland Occupational Groups
The largest percentage of vacancies (14%) was for Teaching and
Educational Professionals (346 vacancies) followed by Caring
Personal Service Occupations with 11% (285 vacancies).
There has been a 163% rise in vacancies for Other Managers and
Proprietors when compared to 2017, with numbers rising from 41 to 108
(67 fewer vacancies)

Page 43 of 45
However, there has been a 57% fall in vacancies for Leisure, Travel And
Related Personal Service Occupations with numbers falling from 81 in
2017 to 35 in 2018 (46 fewer vacancies).
This is followed by a 20% fall in Science, Research, Engineering And
Technology Professionals with numbers falling from 255 to 204 (51
fewer vacancies).
Figures 37 and 38 show the top 10 vacancy increases and decreases in
Redcar and Cleveland over the last year by 3 digit (SOC) group:
Figure 37: Top 10 Redcar and Cleveland increases
Top 10 job vacancy increases in Redcar and Cleveland 2017 2018 Change
Managers and Proprietors in Other Services 31 69 38
Food Preparation and Hospitality Trades 24 53 29
Managers and Proprietors in Health and Care Services 8 32 24
Other Administrative Occupations 62 86 24
Science, Engineering and Production Technicians 64 84 20
Artistic, Literary and Media Occupations 8 26 18
Production Managers and Directors 17 32 15
Teaching and Educational Professionals 331 346 15
Other Elementary Services Occupations 39 52 13
Customer Service Occupations 38 49 11
Figure 38: Top 10 Redcar and Cleveland decreases
Top 10 job vacancy increases in Redcar and Cleveland 2017 2018 Change
IT and Telecommunications Professionals 133 75 -58
Hairdressers and Related Services 70 22 -48
Childcare and Related Personal Services 132 95 -37
Caring Personal Services 209 183 -26
Sports and Fitness Occupations 37 16 -21
Electrical and Electronic Trades 40 19 -21
Health Professionals 86 70 -16
Administrative Occupations: Finance 43 30 -13
Nursing and Midwifery Professionals 93 81 -12
Road Transport Drivers 55 46 -9

Page 44 of 45
Stockton-on-Tees
There were 7,715 Stockton-on-Tees job vacancies advertised online in
2018, a 1% drop compared to 2017 (69 fewer vacancies).
Figure 39 shows the distribution of vacancies in Stockton-on-Tees by 2
digit SOC group.
Figure 39: Stockton-on-Tees Occupational Groups
The largest percentage of vacancies (11%) was for Science, Research,
Engineering and Technology Professionals (827 vacancies). This is
followed by Teaching and Educational Professionals with 8% (603
vacancies) and Administrative occupations with 8% (601 vacancies).

Page 45 of 45
There has been a 26% drop in vacancies for Caring Personal Service
occupations when compared to 2017, with numbers falling from 708 to
527 (181 fewer vacancies). This is followed by an 11% drop in Health
Professionals with vacancies falling from 635 to 565 (70 fewer
vacancies).
Figures 40 and 41 show the top 10 vacancy increases and decreases in
Stockton-on-Tees over the last year by 3 digit (SOC) group:
Figure 40: Top 10 Stockton-on-Tees increases
Top 10 job vacancy increases in Stockton 2017 2018 Change
Science, Engineering and Production Technicians 212 339 127
Business, Research and Administrative Professionals 164 273 109
Artistic, Literary and Media Occupations 9 74 65
Road Transport Drivers 120 164 44
Natural and Social Science Professionals 60 98 38
Secretarial and Related Occupations 98 136 38
Food Preparation and Hospitality Trades 94 129 35
Public Services and Other Associate Professionals 117 147 30
Welfare and Housing Associate Professionals 56 83 27
Business, Finance and Related Associate
Professionals 97 121 24
Figure 41: Top 10 Stockton-on-Tees decreases
Top 10 job vacancy decreases in Stockton 2017 2018 Change
Caring Personal Services 454 352 -102
Childcare and Related Personal Services 243 167 -76
Information Technology and Telecommunications
Professionals 485 417 -68
Nursing and Midwifery Professionals 394 337 -57
Health and Social Services Managers and Directors 90 37 -53
Administrative Occupations: Finance 200 168 -32
Customer Service Managers and Supervisors 50 18 -32
Information Technology Technicians 141 110 -31
Sales Related Occupations 264 236 -28
Managers and Proprietors in Health and Care Services 43 17 -26