Tectonic control of fan size: the importance of spatially ...
16
Basin Research (1996) 8, 351–366 Tectonic control of fan size: the importance of spatially variable subsidence rates Kelin X. Whipple* and Carolyn R. Trayler² *Department of Earth, Atmospheric and Planetary Sciences, MIT, Cambridge, MA 02139, USA ²Department of Earth Resources, Colorado State University, Fort Collins, CO 80523, USA ABSTRACT We study the geophysical controls on the size of alluvial fans. Simple relationships between catchment characteristics, sediment yield, subsidence patterns and fan size are developed. As predicting fan size is essentially a conservation of mass problem, our analysis is general, applying to all types of fan landform. The importance of spatially variable subsidence rates has gone largely unrecognized in previous studies of modern fans. Here we stress that the distribution of subsidence rates in the depositional basin is a primary control on relative fan size. Both free coefficients in the oft-cited power-law correlation of fan area and catchment area can be shown to be set primarily by the tectonic setting, taken to include source area uplift rate and the subsidence distribution in the depositional basin. In the case of a steady-state landscape, relative fan size is shown to be independent of both climate and source lithology; only during times of significant departure from steady state can relative fan size be expected to vary with either climate or source lithology. Transients associated with (1) a sudden increase in rock uplift rate, (2) a sudden change in climate and (3) the unroofing of strata with greatly differing erodibilities may produce variation of relative fan areas with both climate and source lithology. Variation of relative fan size with climate or lithology, however, requires that catchment–fan system response to perturbations away from steady state is sensitive to climate and lithology. Neither the strength of transient system responses nor their sensitivity to climate or lithology are known at present. Furthermore, internal feedbacks can significantly dampen any climatic or lithological effect. Thus theoretical considerations of the importance of climatic and lithological variables are inconclusive, but suggest that climatic and lithological effects are probably of secondary importance to tectonic effects. Field data from an unsteady landscape in Owens Valley, California, support and illustrate theoretical predictions regarding tectonic control of fan size. Field data from Owens Valley allow, but do not prove, a secondary dependence on source lithology. In addition, the Owens Valley field data indicate no relationship between relative fan size and climate. Headward catchment growth and enhanced sediment bypassing of fans during times of increased sediment yield (glacial) are put forward as plausible explanations. Hooke, 1968, 1972; Hooke & Rohrer, 1977; Harvey, INTRODUCTION 1984; Lecce, 1991; Jansson et al., 1993; Ritter et al., 1995). Studies of controls on the relative size of modern The problem fans have direct relevance to the problem of progradation Fans have been heralded as sensitive indicators of climatic of clastic wedges often approached from a stratigraphic fluctuations and neotectonic activity and their deposits perspective (e.g. Paola et al., 1992; Gordon & Heller, as indicators of movement on basin-bounding faults, 1993). palaeogeography and even palaeoclimate. For these Power-law correlations between fan area (A f [m2]) and reasons, there has been great interest in exploring the catchment area (A d [m2]), relationships between the size of modern fans and such A f =cAn d (1) environmental variables as climate, source lithology and tectonic setting (Bull, 1964; Denny, 1965; Lustig, 1965; have been reported for modern fans in many field sites, © 1996 Blackwell Science Ltd 351
Transcript of Tectonic control of fan size: the importance of spatially ...

Basin Research (1996) 8, 351–366
Tectonic control of fan size: the importance of spatiallyvariable subsidence ratesKelin X. Whipple* and Carolyn R. Trayler†*Department of Earth, Atmospheric and Planetary Sciences,MIT, Cambridge, MA 02139, USA†Department of Earth Resources, Colorado State University,Fort Collins, CO 80523, USA
ABSTRACT
We study the geophysical controls on the size of alluvial fans. Simple relationships betweencatchment characteristics, sediment yield, subsidence patterns and fan size are developed. Aspredicting fan size is essentially a conservation of mass problem, our analysis is general,applying to all types of fan landform. The importance of spatially variable subsidence rates hasgone largely unrecognized in previous studies of modern fans. Here we stress that thedistribution of subsidence rates in the depositional basin is a primary control on relative fansize. Both free coefficients in the oft-cited power-law correlation of fan area and catchment areacan be shown to be set primarily by the tectonic setting, taken to include source area uplift rateand the subsidence distribution in the depositional basin. In the case of a steady-statelandscape, relative fan size is shown to be independent of both climate and source lithology;only during times of significant departure from steady state can relative fan size be expected tovary with either climate or source lithology. Transients associated with (1) a sudden increase inrock uplift rate, (2) a sudden change in climate and (3) the unroofing of strata with greatlydiffering erodibilities may produce variation of relative fan areas with both climate and sourcelithology. Variation of relative fan size with climate or lithology, however, requires thatcatchment–fan system response to perturbations away from steady state is sensitive to climateand lithology. Neither the strength of transient system responses nor their sensitivity toclimate or lithology are known at present. Furthermore, internal feedbacks can significantlydampen any climatic or lithological effect. Thus theoretical considerations of the importance ofclimatic and lithological variables are inconclusive, but suggest that climatic and lithologicaleffects are probably of secondary importance to tectonic effects. Field data from an unsteadylandscape in Owens Valley, California, support and illustrate theoretical predictions regardingtectonic control of fan size. Field data from Owens Valley allow, but do not prove, a secondarydependence on source lithology. In addition, the Owens Valley field data indicate norelationship between relative fan size and climate. Headward catchment growth and enhancedsediment bypassing of fans during times of increased sediment yield (glacial) are put forwardas plausible explanations.
Hooke, 1968, 1972; Hooke & Rohrer, 1977; Harvey,INTRODUCTION 1984; Lecce, 1991; Jansson et al., 1993; Ritter et al.,
1995). Studies of controls on the relative size of modernThe problemfans have direct relevance to the problem of progradation
Fans have been heralded as sensitive indicators of climatic of clastic wedges often approached from a stratigraphicfluctuations and neotectonic activity and their deposits perspective (e.g. Paola et al., 1992; Gordon & Heller,as indicators of movement on basin-bounding faults, 1993).palaeogeography and even palaeoclimate. For these Power-law correlations between fan area (A
f[m2]) and
reasons, there has been great interest in exploring the catchment area (Ad
[m2]),relationships between the size of modern fans and such
Af=cAn
d(1)environmental variables as climate, source lithology and
tectonic setting (Bull, 1964; Denny, 1965; Lustig, 1965; have been reported for modern fans in many field sites,
© 1996 Blackwell Science Ltd 351

K. X. Whipple and C. R. Trayler
covering diverse geological and climatic settings. sidered. Here ‘steady state’ implies that two conditionshold: (1) uplift is balanced by erosion in the source areaCompilations of available data have been published else-
where and are included in most textbooks covering the and (2) subsidence is balanced by deposition in the basin.The discussion on nonsteady-state landscapes focusestopic of alluvial fan geomorphology ( Hooke, 1968; Bull,
1977; Lecce, 1990). A wide range values of both the primarily on circumstances in which the former conditionis not satisfied. Short-term fluctuations in sedimentationcoefficient (c) and the exponent (n) in Eq. (1) have been
reported. This variability is usually ascribed to some rate that may invalidate the latter condition are con-sidered briefly.combination of climatic, lithological and tectonic factors
(e.g. Bull, 1964; Hunt & Mabey, 1966; Hooke & Rohrer, The cornerstone of the analysis is a set of simpleequations describing the relationships between catchment1977; Lecce, 1991; Ritter et al., 1995). However, a gen-
eral, process-based statement of the linkages between characteristics, sediment yield, subsidence patterns andfan size. We subdivide the analysis into two parts: (1)catchment characteristics (climate, lithology, rock uplift
rate), sediment yield (Qs
[m3 yr−1]), volumetric rate of the relationship between catchment characteristics, sedi-ment yield and the volumetric rate of fan depositionfan deposition (V
f[m3 yr−1]), rates and patterns of basin
subsidence (s [m yr−1]), and fan size (Af) is lacking. In (V
f), and (2) the relationship between V
fand fan area
(Af). The latter is governed by the distribution ofparticular, the role of differential rates and patterns of
subsidence has not been clearly elucidated in the literature subsidence and will be shown to have a profound influ-ence on fan area – catchment area relationships. Theon modern fans.
Gordon & Heller (1993) highlight the need for a results of this theoretical analysis are supported andillustrated by new field data from Owens Valley,quantitative assessment of how and why c and n values
(Eq. 1) reflect the physical environment of a fan. Their California (Fig. 1). In addition, well-known data setsfrom the literature are discussed.study emphasizes the profound importance of the distri-
bution and rate of subsidence in determining the extentof gravel (i.e. fan) progradation. Gordon & Heller (1993)comment that they are surprised that fan area and
RELATIONSHIPS FOR SEDIMENTcatchment area should have a simple power-law relation-ship (Eq. 1) for the simple reason that the fundamental YIELD AND FA N AREArelationship should be between catchment area and fan Sediment yield and the volumetric rate of fanvolume (more precisely the volumetric rate of fan depos- depositionition; Hooke, 1968), not fan area. They further suggestthat differences in subsidence may explain much of the We assert that the fundamental reason for a correlation
between fan area (Af) and catchment area (Ad) is thatvariability recorded in modern fans. Gordon & Heller’sinsightful comment is borne out in our analysis of the sediment yield (Q
s) increases monotonically with catch-
ment area:controls on fan size. It will be shown that straightforwardconsideration of mass conservation in fan–catchment
Qs=e(1−l
r)A
d, (2)systems, and distribution of that mass in depositional
basins according to the distribution of subsidence rates,where e denotes the spatially averaged erosion rate
is capable of reconciling apparent disagreements in the(m yr−1) and l
rdenotes rock porosity. Note that in
literature regarding the relative roles of tectonic, litho-principle e may vary with climate, lithology, catchment
logical and climatic conditions (e.g. Bull, 1964, 72; Huntarea and relief. In many landscapes, specific sediment
& Mabey, 1966; Hooke & Rohrer, 1977; Lecce, 1991;yield (Q ∞s[m yr−1]) is found to be a function of catchment
Gordon & Heller, 1993; Ritter et al., 1995).area,
Q ∞s=Q s/Ad=e(1−lr)=f (Ad) , (3)
Approach and scopewith specific sediment yield diminishing with increasedcatchment area as hillslope gradients decline, valleysWe present a theoretical analysis of the controls on fan
size. We consider fan size as the end product of a simple widen and sediment storage increases (Church et al.,1988). However, in many mountainous areas, the steep,mass-balance involving the production of sediment, the
deposition (or nondeposition) of sediment on fans and rugged catchments supplying debris to alluvial fans havenarrow valley floors and negligible amounts of sedimentthe distribution of mass in a subsiding basin. The
treatment is general and applies to all types of fan storage – diminishing specific sediment yield with catch-ment area is unlikely to be an important factor. Welandform, regardless of geological and climatic setting.
We consider an idealized landscape consisting of a moun- restrict our discussion to fans derived from this type ofsteep, mountainous catchment where the assumption thattain block subjected to a spatially uniform uplift rate (Ur
[m yr−1]) separated by a fault from a depositional basin e does not vary with drainage area is valid. Channels areassumed to be bedrock controlled, with only minorexperiencing steady but spatially variable subsidence (s).
Both steady-state and disequilibrium landscapes are con- alluvial reaches above the fan apex.
© 1996 Blackwell Science Ltd, Basin Research, 8, 351–366352

Tectonic control of fan size
Fig. 1. Simplified geological map ofOwens Valley, California. Majorgraben-bounding faults, inferred fromgravity data, are shown as heavy dottedlines (Pakiser et al., 1964). Surface traceof Owens Valley Fault (OVF) shown assolid, broken line. Fan groups studiedindicated by number (1–4): (1) northernWhite Mountains (NWM); (2) southernWhite Mountains (SWM); (3) westernbajada (WB); and (4) Owens Lake (OL).Gravity profiles (A–D) indicated.
vary with drainage area, rather it implies a mutualSteady state
adjustment of drainage area (Ad) and slope (S
d).
Erodibility (kr) is assumed to vary with lithology andIn a steady-state landscape subjected to a uniform rock
uplift rate, surface erosion rate (e) is everywhere equal erosivity (kc) with runoff, extent of glaciation or themagnitude and frequency of debris-flow scouring events,within the uplifted source area. The linkages between
the steady-state erosion rate and catchment properties depending on climatic and physiographic conditions.Both the coefficients (kr and kc) and exponents ( p and q)are usefully illustrated in terms of the erosion of bedrock
channels. Since erosion rate is uniform, it is sufficient to in this generalized erosion law are poorly constrained atpresent and almost certainly vary with process (e.g. fluvialconsider the local channel lowering rate at the catchment
outlet. Moreover, in nonsteady-state landscapes (dis- incision, glacial erosion or debris-flow scour).In the steady state, erosion rate is uniform within thecussed below) the channel lowering rate sets the local
base level for the entire catchment. The erosion rate at catchment (e=ech
) and the volume rate of the removalof rock from the source drainage per unit time (sedimentthe catchment outlet (e
ch) is set by the erodibility of the
rock (kr), the erosivity of the climate (k
c), the drainage yield, Q
s) is equal to the product of the rate of incision
of the trunk stream and the drainage area. Combiningarea (Ad) and the local channel gradient (S
d):
Eqs. (2) and (4) givesech=kekrApdSqd, (4)Q se=e (1−lr)Ad=krkc(1−lr)Ap+1d Sqd, (5)
where p and q are constants and the units of kr and kcdepend on the exponent p (Howard & Kerby, 1983; Seidl where Q se denotes the sediment yield at steady state.
Thus, at first glance there appears to be a simple and& Dietrich, 1992; Howard et al., 1994). Note that Eq. (4)is not inconsistent with the assumption that e does not direct relationship between sediment yield and source
© 1996 Blackwell Science Ltd, Basin Research, 8, 351–366 353

K. X. Whipple and C. R. Trayler
lithology and climate. However, as mentioned above, & Slingerland (1996) show promise for developing quanti-tative insights into the nature of b(t), the catchmentchannel gradient (S
d) is not an independent variable.
In a steady-state landscape an additional constraint can response function.Two restrictive conditions were imposed in the deri-be placed on the problem: average surface erosion rate
(or exhumation rate) (e) must exactly balance the rock vation of Eq. (7), which gives Qse as a function of rockuplift rate (Ur), rock porosity (lr) and drainage area (Ad):uplift rate (Ur) (Molnar & England, 1990). Substituting
this condition (ech=e=Ur) into Eq. (4) gives (1) that the erosion rate is everywhere equal to the rockuplift rate and (2) that the trunk stream had an equili-brium profile as prescribed by Eq. (6). The formerSqd=
Urkrkc
A−pd . (6)assumption is the most restrictive. Channel profilesshould recover first from perturbations away from theSubstituting Eq. (6) into (5) we find thatbase steady-state condition, with adjustments in hillslope
Q se=Ur(1−lr) Ad. (7) profiles lagging channel response significantly. Below weassume this to be the case and consider variations inThus for a steady-state landscape with bedrock channelssediment yield during the interval between adjustmentwe have the simple result that equilibrium sediment yieldof bedrock channels and the eventual adjustment ofvaries directly with catchment area (Ad) and uplift ratecatchment physiography. This facilitates a simple defi-(Ur). Besides a weak lithological dependence associatednition of b(t), the catchment response function.with different rock porosities, specific sediment yield is
During perturbations away from steady state the con-set by the rock uplift rate. In a steady-state landscapedition that erosion rate is everywhere equal is not satisfiedclimatic and lithological differences between catchments(e<e
ch). The resulting imbalance can be parameterizedwill be reflected in catchment physiography (e.g. Kooi &
asBeaumont, 1994), but not specific sediment yield.
e=b(t)ech
, (8)Departures from steady state where b(t) is assumed to vary with climate and lithology.
In principle, the average erosion rate could vary as aOnly under unsteady conditions does the potential forpower of channel erosion rate, but since so little is knownlithological and climatic control of specific sediment yieldabout the form of b(t), that additional complexity isarise. However, departures from steady state are commonunwarranted at this time. Combining Eqs (2), (4), (6)in the landscape, and their durations may be longand (8) yields a simple expression for sediment yieldcompared with the response time-scale of fans (e.g. Ritterduring excursions from steady state (Q
st):et al., 1995). The potential for a lithological or climatic
signal in relative fan areas lies in the system’s response Qst=b(t)U
r(t) (1−l
r)A
d. (9)
to large perturbations from the base steady-state con-Substituting Eq. (7) into (9) givesdition, such as a dramatic increase in rock uplift rate, a
sudden change in climate or the unroofing of strata withQ
st=b(t)
Ur
(t)U
rQ
se. (10)significantly different erodibilities. In all cases the system
will move towards re-establishing equilibrium throughadjustments of catchment physiography (e.g. Adams, Equations (9) and (10) are strictly only valid during the
post-channel-adjustment interval when Eqs (4) and (6)1980).We postulate that the sensitivity of the catchment–fan apply. However, b(t) may be generalized to incorporate
the early stages of channel adjustment as is done below.system to perturbations away from steady state may be afunction of climate and source lithology: both the Figure 2 schematically illustrates probable forms of
the generalized b(t). That is, Fig. 2 illustrates probableresponse time-scale of catchment physiography and thetotal amount of physiographic adjustment necessary to responses in specific sediment yield to hypothesized
changes in rock uplift rate, climate and lithology (i.e. duere-establish equilibrium may depend on climate andsource lithology. We parameterize system response during to progressive unroofing of a stratigraphic sequence).
Figure 2(A) illustrates the differential response of twotransients with a hypothetical nondimensional responsefunction (b(t)) and present speculative sediment yield catchments to the same step function increase in rock
uplift rate. A catchment that is either subjected to a morecurves to illustrate how differences in lithology andclimate might influence fan area – catchment area ‘erosive’ climate, or rests on less resistant rock units
(solid curve) is hypothesized to undergo a brief, intenserelationships. We stress that the form of b(t) and itssensitivity to climate and lithology are unknown at phase of increased sediment yield, returning to equilib-
rium faster than a neighbouring catchment subjected topresent. It is possible that b(t) is not a function of eitherclimate or lithology. The salient point in the following a less ‘erosive’ climate or cut into more resistant rock
units (dashed curve). Thus, for a time, an enhancedarguments is that climate and lithology can only influencefan area – catchment area relationships through variations specific sediment yield is expected from the more erodible
rock units, or under the more ‘erosive’ climate. However,in b(t) of the type we describe. Numerical simulations oflandscape evolution such as those presented by Tucker sediment yields rapidly return to equilibrium levels
© 1996 Blackwell Science Ltd, Basin Research, 8, 351–366354

Tectonic control of fan size
Fig. 2(A), and a similar cross-over is anticipated. Notethat sediment yield is predicted to drop below equilibriumlevels when the climate returns to ‘normal’ at the end ofthe glacial cycle. The hypothesized oscillation in specificsediment yield may explain the episodic aggradationof fans characteristic of glaciated areas during theQuaternary (e.g. Ritter et al., 1995). Finally, Fig. 2(C)illustrates the probable pattern of specific sediment yieldresponse to the unroofing of strata of either higher orlower erodibilities, assuming constant uplift and climate.Again, a transient increase in specific sediment yieldfollowing the exposure of weaker units is anticipated.
Internal feedbacks and the volumetric rate of fan deposition
Whether or not lithology- or climate-driven differencesin specific sediment yield are translated into measurabledifferences in relative fan size depends in part on theefficacy of internal feedbacks which can act to dampenthe relationship between sediment yield and the volu-metric rate of fan deposition. An obvious feedbackmechanism is the possible headward growth of drainagesand the expansion of catchment areas. Catchments cutinto more erodible lithologies, or subjected to a moreerosive climate, may produce more sediment duringexcursions away from steady state (Eq. 10). However,this increase in sediment flux may be accompanied by anincrease in catchment area, with important implicationsfor relative fan areas.
A more subtle, but potentially important, internalfeedback mechanism is associated with the partitioningof sediment between the fan and the valley floor. Theeffect of this partitioning can be quantified in a simpleway as a dimensionless ‘trap efficiency factor’ (E
t). Trap
Fig. 2. Schematic illustration of sediment yield responses to efficiency (Et) varies between 0 and 1, and is simply
perturbations from steady state. A. Step function increase in defined as the fraction of the total sediment yield that isrock uplift rate. Solid line – erodible rock type or a more deposited on fans:‘erosive’ climate; dashed line – resistant rock type or a less‘erosive’ climate. B. Pulsed increase in ‘erosivity’ (glaciation).
Vf=E
tA 1
1−lsB Q
s, (11)Solid line – glaciated catchments; dashed line – unglaciated
catchments. C. Unroofing of strata with markedly differentwhere l
sis the porosity of the fan sediments, and V
fiserodibilities (uplift rate and climate assumed constant). Solid
the volumetric rate of fan deposition. The role of trapline – exposure of weaker rock; dashed line – exposure of moreresistant rock. efficiency (E
t) is analogous to that of the proportion of
sediment flux that is ‘gravel’ in the basin fill modelof Paola et al. (1992). Paola et al. (1992), however, pur-posefully do not consider possible interrelationships(Fig. 2; Schumm & Rea, 1995) and it is possible that the(e.g. the feedback mechanisms) between variables in theirsediment yield curves will cross, effectively reversing themodel. In addition to possible interdependencies between‘normal’ lithological or climatic signal. This reversal canEt and climate or lithology, trap efficiency may be aoccur if and only if the more responsive catchmentfunction of catchment area, with trap efficiency decliningre-establishes equilibrium in a shorter time, as illustratedwith catchment size (Hooke & Rohrer, 1977):in Fig. 2(A).
Figure 2(B) illustrates the response of two catchmentsV
f=E
toA−r
d A 1
1−lsB Q
s, (12)subjected to a sudden change in climatic regime, but
where the intensity of this change is greater in onecatchment than the other. This scenario is presented as where Eto is the trap efficiency of a 1-km2 catchment,
and r is a constant which, in principle, may vary withanalogous to the response of glaciated and unglaciatedcatchments to a glacial cycle. The hypothetical response process (e.g. debris-flow vs. fluviatile transport).
Empirical evidence suggests that Et
is only a weakin specific sediment yield is similar to that illustrated in
© 1996 Blackwell Science Ltd, Basin Research, 8, 351–366 355

K. X. Whipple and C. R. Trayler
function of Ad, with r taking a narrow range of values Basin structure, subsidence patterns and fan
between 0.0 and 0.2 (Hooke, 1968; Hooke & Rohrer, size1977; Jansson et al., 1993).
Trap efficiency is largely determined by two factors: Depositional surfaces tend towards a condition of equilib-rium in which the mean rate of net surface aggradation(1) the grain-size distribution of the source regolith and
(2) fan depositional processes. As such, lithology, climate relative to a fixed horizontal datum is everywhere approxi-mately equal (Hooke, 1968; Paola et al., 1992):and tectonic setting all have important effects. Both Eto
and the exponent (r) may vary during departures fromsteady state. Temporal variations in trap efficiency (E
t)
∂g(x, y)
∂t=z(x, y)−s(x, y)#k , (15)
in response to climatic change have been discussed byHarvey (1984). Both positive and negative correlations where x and y are the cross- and down-valley coordinates,between trap efficiency and other lithological and climatic g is surface elevation, z is the deposition rate, s is thefactors (k
rand k
c) are possible, resulting in either positive subsidence rate and k is a constant equal to zero in a
or negative feedback. For instance, enhanced erodibility steady-state landscape. Regardless of whether the valleyis sometimes associated with increased regolith fines floor is experiencing net deflation (k<0) or net aggra-content (erodible volcanic terranes) and sometimes with dation (k>0), averaged over long time, local sedimen-decreased regolith fines content (weakly indurated coarse tation rate varies with local subsidence rate (Paola et al.,clastic sedimentary rock or highly fractured but well- 1992; Gordon & Heller, 1993). For the purpose ofindurated sedimentary rocks). Similarly, increased sedi- simplicity, in the following discussion we will assumement yields from glaciated basins might be negated by that the condition k=0 is approximately satisfied.decreased trap efficiency associated with sustained higher However, it should be noted that pulses of acceleratedstream discharges. Moreover, as discussed below, reduced erosion (e.g. Fig. 2) may cause sedimentation to tempor-trap efficiencies imply enhanced rates of valley floor arily out-pace background subsidence rates, potentiallydeposition, with important consequences for fan area – enhancing climatic or lithological control of relative fancatchment area relations in closed basins (Hooke, 1968; areas in the short term (e.g. Ritter et al., 1995).Jansson et al., 1993). As first described by Hooke (1968) for the restricted
case of uniform subsidence, the long-term tendencytowards equilibrium dictates that fan size (Af) be set byVf, the volumetric rate of fan deposition, and zp (~sp),Summarythe rate of playa or valley floor deposition. In the sections
The volumetric rate of fan deposition is primarily con- below we first review the condition of uniform subsidencetrolled by the tectonic setting, more specifically by the discussed by Hooke (1968), and then generalize therock uplift rate. Tectonic control is most direct in a arguments to idealized but common nonuniform subsid-steady-state landscape, where specific sediment yield ence patterns. The form of the relationship between A
fmust balance rock uplift (Adams, 1980; Molnar & and Vf
will be shown to be governed by the distributionEngland, 1990). Secondary variations associated with and rate of subsidence in the depositional basin.source lithology and climate can arise in both steady-state and disequilibrium landscapes, but their magnitudes
Uniform subsidence: simple grabenand possibly signs will be different. Combining Eqs (7)and (12) reveals that, in a steady-state landscape, litho- Consider a complex of coalescing fans building into alogical and climatic influences are only felt through the simple graben experiencing uniform subsidence (Fig. 3A).trap efficiency factor (E
to, r): Fan area (A
f) is set by the net volume of sediment
deposited on the fan per unit time (Vf) and the mean
deposition rate on the valley floor (zp):V
f=E
toA1−lr
1−lsBU
rA1−r
d. (13)
Af= 1
zpV
f, (16)
Conversely, during transients associated with suddenchanges in uplift rates, climate or lithological erodibility, where sedimentation rate just balances subsidence in alithology and climate may directly influence specific steady-state landscape (Fig. 4A; Hooke, 1968, 1972;sediment yield (Fig. 2). Combining Eqs (9) and (12) for Jansson et al., 1993). Note that in a closed basin, theunsteady conditions gives valley floor sedimentation rate is set by the area of the
valley floor and the total contribution of sediment tothe valley floor from surrounding catchments ( JanssonV
f=b(t)E
to(t) A1−l
r1−l
sB U
r(t) A1−r∞
d, (14)
et al., 1993). In other words, zp is not independent of Vfin closed basins. This relationship constitutes anotherinternal feedback mechanism. However, in open basins,where Eto(t) and r∞ may be different than their steady-
state values. In this case, the trap efficiency factor may or in closed basins with complex internal structure, thelocal z
pmay be largely independent of the local V
f. Foract as either a positive or negative feedback.
© 1996 Blackwell Science Ltd, Basin Research, 8, 351–366356

Tectonic control of fan size
Similarly, substituting Eqs (14) and (16) into Eq. (1)gives, for nonsteady-state landscapes,
c= b(t)Eto
(t)zp
A1−lr
1−lsB U
r(t) , (18a)
n=1−r∞ . (18b)
Thus in the special case of uniform subsidence, tectonic,lithological and climatic influences on the volumetric rateof fan deposition (Eqs 13 and 14) directly affect therelationship between fan area and catchment area. Notethat exponents close to unity (0.0<r<0.2) are expectedin this environment for both steady and unsteady land-scapes (Hooke, 1968; Jansson et al., 1993).
Nonuniform subsidence 1: half graben
Consider a complex of coalescing fans building into alaterally uniform half-graben. Subsidence varies only inthe x-direction (perpendicular to the range front), withthe subsidence rate increasing linearly away from therange front (Fig. 3B). In this case, fan area (A
f) increases
nonlinearly with the volumetric rate of fan deposition(Vf):
Af= C W
ftan hD1/2
V 1/2f
, (19)
where Wf
is fan width (set by valley spacing and lateralcompetition between fans) and h is the angular rate offault-block rotation (Figs 3B and 4A). Clearly, the simplehalf graben structure has a marked influence on expectedc and n values (compare Eqs 19 and 16; Fig. 4A). Forexample, substituting Eqs (13) and (19) into (1) gives,for steady-state,
c= CEto
Wf
tan h A1−lr
1−lsB U
rD1/2, (20a)
Fig. 3. Idealized basin structures. A. Simple graben – uniformn=1/2(1−r) . (20b)subsidence (s
p~zp). B. Half-graben tilt block (deposition from
left). Angular rate of tilting (h) shown. C. Simplified foredeepbasin: linear decrease in subsidence away from range front.Angular rate of tilting (h) and basin length (Lb) are shown. Nonuniform subsidence 2: foredeep basinD. Complex graben – nonuniform subsidence. Z and s aresedimentation and subsidence rates, respectively. Subscripts 1 In the case of an idealized foredeep basin in whichand 2 refer to the fault block on the left and right, respectively. subsidence is uniform in the down-valley direction, butWidth of the fault block on the left (L) is indicated. decreases linearly with distance from the range front
(Fig. 3C), fan area (Af) again increases nonlinearly with
the volumetric rate of fan deposition (Vf):
simplicity we will assume independence of Vf
and thebackground rate of deposition (z
p), which is the general A
f= −Lbtan h±√L2btan2h−(4 tan h/Wf)Vf−2 tan h/W
f, (21)
case.Substituting Eqs (13) and (16) into Eq. (1) (A
f=cAn
d) where L
bis the distance from the range front to the
yields explicit expressions for c and n values for steady- hinge point (Fig. 3C). Again c and n values in Eq. (1)state landscapes: fitted by regression through field data obtained in a
‘foredeep basin’ setting will be strongly influenced byc= Eto
zpA1−lr
1−lsBU
r, (17a) the subsidence pattern, with, in this case, n values greater
than unity expected (Fig. 4A). The strength of thetectonic control in both half graben and foredeep basinsn=1−r . (17b)
© 1996 Blackwell Science Ltd, Basin Research, 8, 351–366 357

K. X. Whipple and C. R. Trayler
Fig. 4. Schematic illustration of fan area– volume (per unit time) relationships.A. Relationships derived in text for thesimple graben, half-graben and foredeepstructures illustrated in Fig. 3. B. Fanarea relationships for the complexgraben structure (heavy lines) (Fig. 3D).Power-law fits (thin dashed lines) areshown to highlight the relationshipbetween c and n values and variouscombinations of L and the ratio Z
1/Z
2.
is such that any lithological or climatic influences (through ratios of fan to valley floor sedimentation rate (z1/z
2), n
decreases and c increases (Fig. 4B).b(t), the catchment response function) are likely to beoverwhelmed.
SummaryNonuniform subsidence 3: complex graben The fundamental implication of the preceding analysis is
that in any tectonic setting where subsidence is nonuni-The dependence of relative fan sizes on tectonic settingform, relative fan sizes are largely controlled by theis particularly profound in settings where fans buildspatial distribution of subsidence rates and bear littleacross major geophysical structures – across suddendirect relation to the physical characteristics of the sourcechanges in subsidence rate. Complex grabens are onearea. Fan area – drainage area relationships of the formsuch setting, and are common in extensional basins.(A
f=cAn
d) must be considered in the context of localConsider the simple hypothetical basin illustrated in
tectonic setting. Moreover, in all cases relative fan sizesFig. 3(D). Where the rate of sediment delivery to theare primarily controlled by the combination of rock upliftfans is small, such that the conditionrate and basin subsidence. Lithological and climatic
Vf<z1LWf , (22) influences are second-order effects, are strongest duringtransients associated with sudden changes in rock uplift(where L is the length of the bedrock bench and therate, climate (e.g. Ritter et al., 1995) or source lithology,subscript 1 refers to values for the left-hand side, and 2and may be damped by internal feedback mechanisms.to values for the right-hand side, of the basin in Fig. 3D)Lithological and climatic effects can be expected to beholds, then the exponent in Eq. (1) is independent ofmost important in basins experiencing spatially uniformsubsidence rate (n
1=n
2) and c is directly dependent on
subsidence.sedimentation rate (Eq. 16; c1=V
f/z
1>c
2=V
f/z
2).
However, where sediment delivery to some fans is large,FIELD EVIDENCEsuch that
Vf>z1LWf , (23) Motivation and approach
We have shown that climate and lithology could havethen both c1 and n1 (assuming an equation of the formof (1) is fit to field data) are dependent on L, z1 and z2 opposite effects on fan area – catchment area relation-
ships, depending on (1) whether the system is in steady(Fig. 4B). To date, analytical expressions for the param-eters c and n have not been found for this structural state, (2) the time elapsed since the system was last
perturbed away from steady state and (3) the operationconfiguration. However, it can be seen that for smaller
© 1996 Blackwell Science Ltd, Basin Research, 8, 351–366358
Tectonic control of fan size
of internal feedback mechanisms associated with either Spatial variation in relative long-term sedimentationrate (and therefore subsidence rate) was assessed fromcatchment growth or the trap efficiency factor (E
t).
local differences in the total depth of low-density alluvialUnfortunately neither the magnitudes of the hypothesizedfill, as inferred from published gravity data (Pakiser et al.,transients in specific sediment yield associated with1964; Hunt & Mabey, 1966; Chapman et al., 1973; Oliverdepartures from steady state (Fig. 2) nor the strength of& Robbins, 1978; Oliver & Robbins, 1982). Precisethe internal feedback mechanisms are quantitativelydetermination of fill depths is not warranted because itunderstood at present. Field data are required for evalu-is not possible at present to determine accurately theation of the relative roles of climate and lithology intiming of opening and deepening of the various structuressetting relative fan sizes.comprising the Owens Valley graben. We assume thatExtensive bajadas (piedmonts of coalescing fans) ofthe evolution of these structures has been relativelycoalescing debris-flow fans occur in places on both sidescontinuous and contemporaneous such that relative long-of Owens Valley and along the full length of the valleyterm sedimentation rates are faithfully reflected in the(Fig. 1). Great variability in fan size with geographicalrelative magnitudes of total fill depth. Previous studiesposition is obvious on Fig. 1. Associated with the rangehave demonstrated that interpretations based on theof debris-flow fan properties in Owens Valley is a wideregional gravity data sets cited above are consistent withrange of lithological, climatic and tectonic conditionsboth newer, more densely sampled gravity data andincluding: (1) granitic, metasedimentary, and meta-shallow seismic data (Pakiser et al., 1964; Serpa et al.,volcanic rock types (Fig. 1), (2) a strong west–east1988; Keener et al., 1993).precipitation gradient in the Sierra Nevada rain
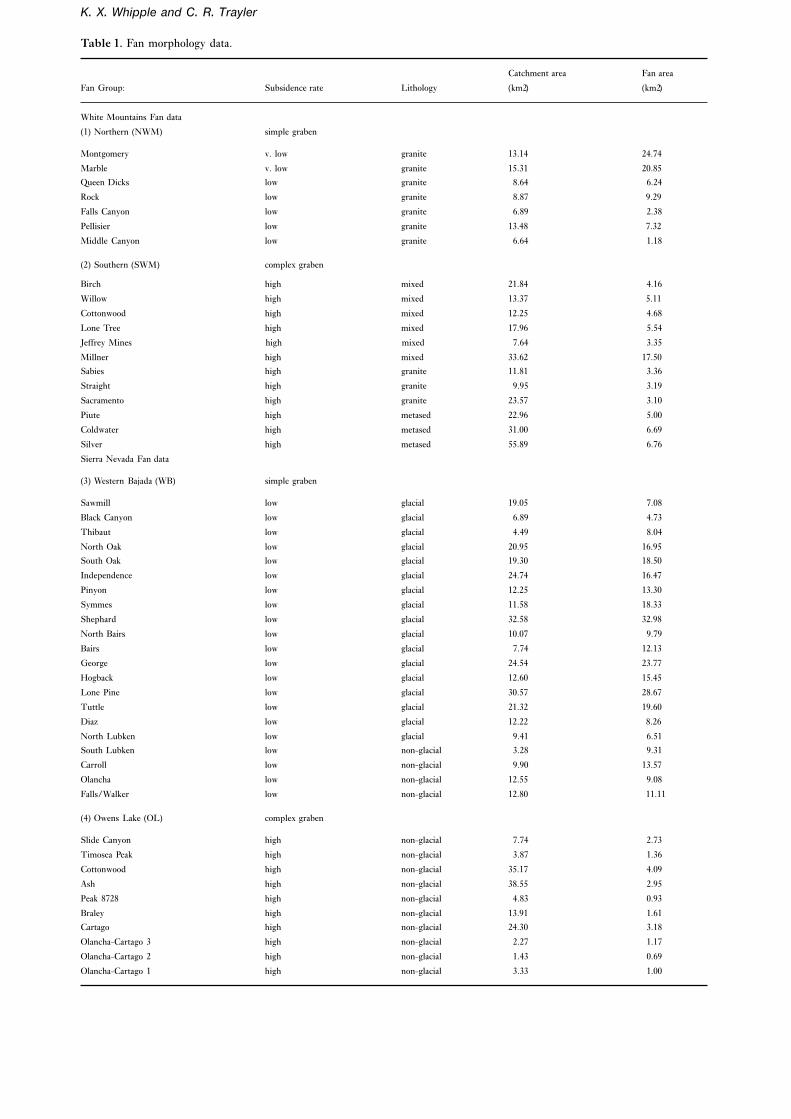
Gravity models for representative cross-sectionsshadow (Bierman et al., 1991), (3) both glaciated (Latethrough the various structural blocks which comprisePleistocene) and unglaciated drainages (Gillespie, 1982;the Owens Valley graben were fit with aid of aBierman et al., 1991) and (4) spatially variable subsidencetwo-dimensional computer algorithm (Fig. 5). Follow-rates (Pakiser et al., 1964; Hollett et al., 1989). Weing Pakiser et al. (1964) and Keener et al. (1993) ancapitalize on this diversity of field conditions to isolateestimated density contrast of 0.4 g cm−3 was assumed inand evaluate the effects of lithological, climatic andall cases, except in the deep graben beneath Owens Lake,tectonic differences on the size of fans. Late Quaternarywhere particularly fine-grained sediments are deposited.climatic fluctuations and variable tectonic rates in theHere a density contrast of 0.5 g cm−3 was assumedrapidly evolving Owens Valley argue against a steady-(Pakiser et al., 1964).state condition in this field area (Gillespie, 1982; Chase
For analysis, fans in the four fan groups studied were& Wallace, 1988; Bierman et al., 1991).
classified according to their geological, climatic and tec-tonic setting. Lithological assemblages in each basin wereclassified on the basis of broadly defined lithotypes onlyMethodology(granitics, metavolcanics and metasedimentary rocks).
Four fan groups in Owens Valley were chosen for Fans derived from basins with more than 70% outcropquantitative analysis. These include, from north to south, in a given rock type were considered monolithological;the northern White Mountains (NWM), southern White others were simply considered ‘mixed’. The ‘mixed’Mountains (SWM), western bajada (WB) and Owens classification in all cases represents a combination ofLake (OL) fan groups (Fig. 1). Data used in the analysis granitic, metasedimentary, and metavolcanic rock types.were obtained from topographic, geological and gravity Tectonic setting was simply classified as one of eithermaps of each study site. Fan and catchment sizes were ‘low’ (<1 km fill) or ‘high’ (>2 km fill) subsidence rate,measured on 1524 000-scale US Geological Survey topo- and either a ‘simple’ or ‘complex’ graben structure.graphic maps with aid of a digitizer. Aerial photographs Climatic setting was characterized by modern meanwere used to help in delimiting boundaries between annual precipitation data and the size of late Pleistocenecoalescing fans. Delimited fan areas include in all cases glaciers supported by the source basin.both the modern, active fan and any abandoned fan Divisions between the four fan groups studied (NWM,segments, in keeping with our interest in the long-term SWM, WB and OL) were chosen purposefully on tec-interplay of sediment supply rate and tectonic setting. tonic boundaries. The fans were then subdivided accord-
An additional suite of measurements were made to ing to lithological (NWM and SWM groups) and climaticcharacterize source basin lithology, climatic setting and setting (WB and OL groups) and plotted on scatterlong-term sedimentation rates. Source lithology was diagrams. Power-law regression models (Eq. 1) wereclassified on the basis of information on 1524 000-scale computed for each fan group. The single outliers in bothand 15250 000-scale geological maps (Matthews & the WB group (Sawmill Creek) and the SWM groupBurnett, 1965; Nelson, 1966a,b; Strand, 1967; Crowder (Millner Creek) were excluded from regression analysis.et al., 1972; Crowder & Sheridan, 1972; Streitz & Stinson,1977) ( Table 1). Differences in climatic setting were
Study site descriptionsassessed on the basis of: (1) modern precipitation records(Rantz, 1969) and (2) morphological indicators of the Lithological, climatic and tectonic classifications are sum-
marized in Table 1 and are outlined briefly here. Thedegree of source area glaciation.
© 1996 Blackwell Science Ltd, Basin Research, 8, 351–366 359
K. X. Whipple and C. R. Trayler
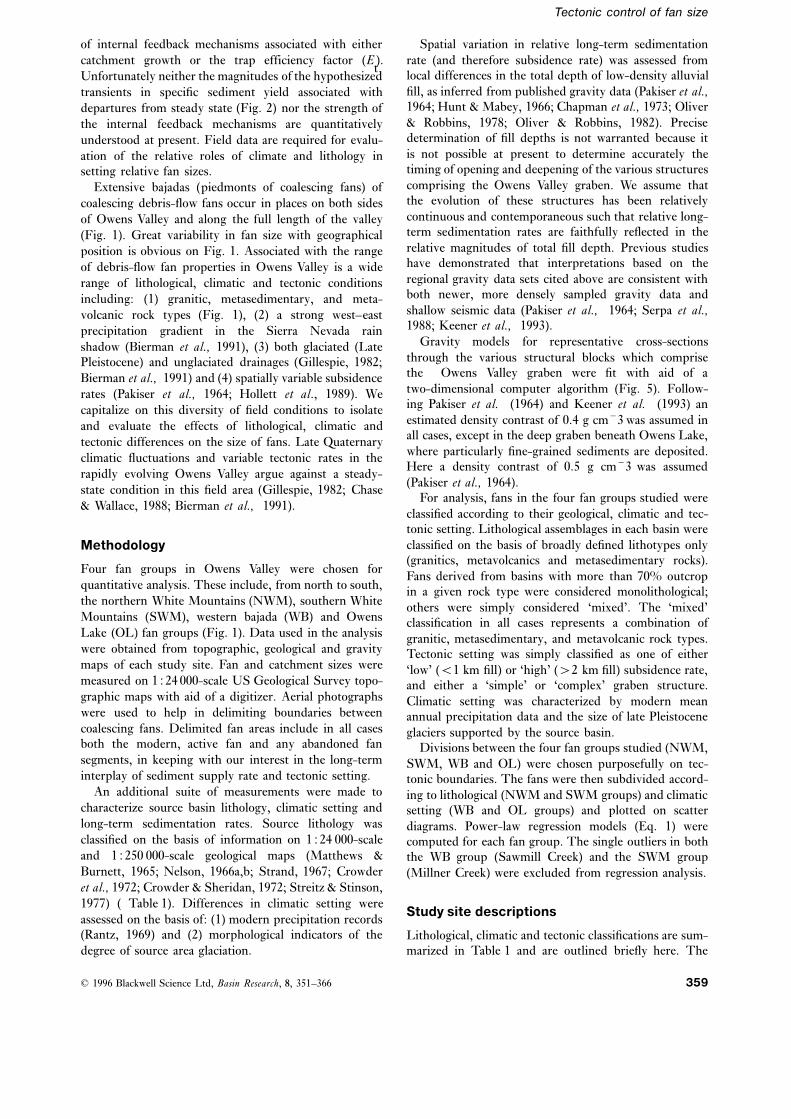
Table 1. Fan morphology data.
Catchment area Fan area
Fan Group: Subsidence rate Lithology (km2) (km2)
White Mountains Fan data
(1) Northern (NWM) simple graben
Montgomery v. low granite 13.14 24.74
Marble v. low granite 15.31 20.85
Queen Dicks low granite 8.64 6.24
Rock low granite 8.87 9.29
Falls Canyon low granite 6.89 2.38
Pellisier low granite 13.48 7.32
Middle Canyon low granite 6.64 1.18
(2) Southern (SWM) complex graben
Birch high mixed 21.84 4.16
Willow high mixed 13.37 5.11
Cottonwood high mixed 12.25 4.68
Lone Tree high mixed 17.96 5.54
Jeffrey Mines high mixed 7.64 3.35
Millner high mixed 33.62 17.50
Sabies high granite 11.81 3.36
Straight high granite 9.95 3.19
Sacramento high granite 23.57 3.10
Piute high metased 22.96 5.00
Coldwater high metased 31.00 6.69
Silver high metased 55.89 6.76
Sierra Nevada Fan data
(3) Western Bajada (WB) simple graben
Sawmill low glacial 19.05 7.08
Black Canyon low glacial 6.89 4.73
Thibaut low glacial 4.49 8.04
North Oak low glacial 20.95 16.95
South Oak low glacial 19.30 18.50
Independence low glacial 24.74 16.47
Pinyon low glacial 12.25 13.30
Symmes low glacial 11.58 18.33
Shephard low glacial 32.58 32.98
North Bairs low glacial 10.07 9.79
Bairs low glacial 7.74 12.13
George low glacial 24.54 23.77
Hogback low glacial 12.60 15.45
Lone Pine low glacial 30.57 28.67
Tuttle low glacial 21.32 19.60
Diaz low glacial 12.22 8.26
North Lubken low glacial 9.41 6.51
South Lubken low non-glacial 3.28 9.31
Carroll low non-glacial 9.90 13.57
Olancha low non-glacial 12.55 9.08
Falls/Walker low non-glacial 12.80 11.11
(4) Owens Lake (OL) complex graben
Slide Canyon high non-glacial 7.74 2.73
Timosea Peak high non-glacial 3.87 1.36
Cottonwood high non-glacial 35.17 4.09
Ash high non-glacial 38.55 2.95
Peak 8728 high non-glacial 4.83 0.93
Braley high non-glacial 13.91 1.61
Cartago high non-glacial 24.30 3.18
Olancha-Cartago 3 high non-glacial 2.27 1.17
Olancha-Cartago 2 high non-glacial 1.43 0.69
Olancha-Cartago 1 high non-glacial 3.33 1.00

Tectonic control of fan size
AB D
C
Fig
.5.S
ubsu
rfac
ege
omet
ryof
low
-den
sity
,lat
eC
enoz
oic
allu
vial
filli
nO
wen
sVa
lley,
Cal
iforn
ia.A
ssum
edfil
land
back
grou
ndde
nsiti
esar
ein
dica
ted.
Upp
erpl
otsh
ows
both
the
obse
rved
(sol
iddo
ts)a
ndes
timat
ed(s
olid
line)
loca
lBou
guer
grav
ityan
omal
y(a
linea
rre
gion
altr
end
has
been
extr
acte
din
allc
ases
).L
ower
plot
show
sth
ere
cons
truc
ted
fillg
eom
etry
show
nw
ithou
tve
rtic
alex
agge
ratio
n.L
ocat
ion
oflin
esA
–Din
dica
ted
onF
ig.1
.A.S
truc
ture
bene
ath
the
NW
Mfa
ngr
oup.
B.S
WM
fan
grou
p.C
.WB
fan
grou
p.D
.OL
fan
grou
p.
© 1996 Blackwell Science Ltd, Basin Research, 8, 351–366 361

K. X. Whipple and C. R. Trayler
fans of the northern White Mountains (NWM) groupare derived from predominantly granitic rocks and arebuilding out onto a shallow bedrock bench north of thetermination of the narrow graben that separates the WhiteMountains from the Volcanic Tableland (Fig. 1; Pakiseret al., 1964). Here the depositional setting is that of aslowly subsiding, simple graben (Fig. 5A). The southernWhite Mountains (SWM) group includes fans derivedfrom dominantly granitic, metasedimentary and metavol-canic lithologies. These fans are being deposited directlyinto the narrow graben north of Bishop (Figs 1 and 5B).The depositional setting is that of a rapidly subsiding,complex graben with the fans building across a shallowbedrock bench and into the deep graben (Fig. 5B). Thecatchments above both the White Mountains fan groupsremained unglaciated during the late Pleistocene andstand within the rain shadow of the Sierra Nevada.
The western bajada (WB) group includes all fansbetween the southern tip of the Alabama Hills and theBig Pine volcanic complex (Fig. 1). These fans arederived from predominantly granitic rocks and includesource basins which were variously unglaciated, slightlyglaciated and extensively glaciated. The impressive fansof the WB group are building out onto a shallow bedrockbench (Figs 1 and 5C). This is a low-subsidence-rateenvironment and is classified as a simple graben becausethe fans do not extend beyond the shallow bedrockbench. Finally, the fans of the Owens Lake (OL) groupare derived from the granitic rocks of the Sierra Nevadaand are being deposited into the deep Owens Lake grabenafter bypassing a narrow bedrock bench (Figs 1 and 5D).This is a rapidly subsiding, complex graben depositionalsetting. Catchments above the OL fan group did notsupport valley glaciers during the late Pleistocene.
A
B
C
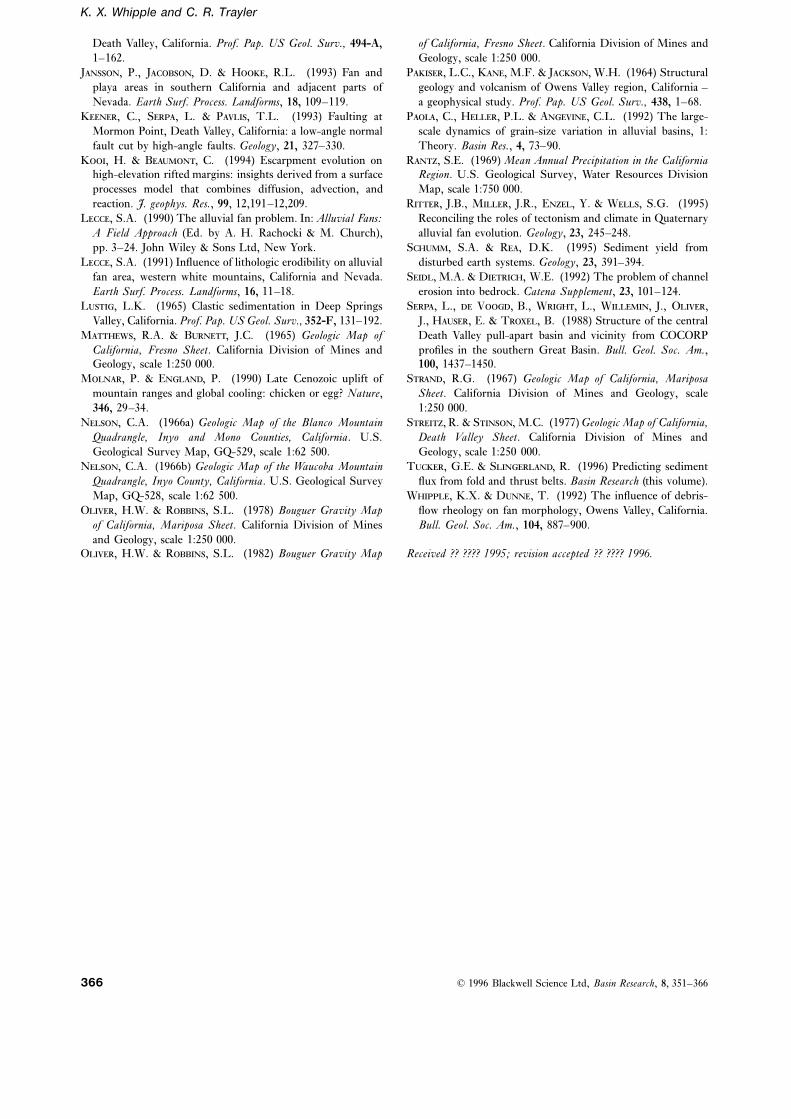
Fig. 6. Fan area vs. drainage area. A. Fans of the western bajadaResults and analysis (WB) and Owens Lake (OL) groups. Outlier (S) is Sawmill
Creek fan (excluded from regression analysis). B. Fans of theCatchment area and subsidence ratesouthern (SWM) and northern White Mountains (NWM)groups. Single outlier (M) is Millner Creek fan (excluded fromFan size is strongly correlated with catchment area andregression analysis). C. Comparison of OL fans with SWMdepth of low-density fill (inferred subsidence rate). Thefans.correlation with catchment area is obvious, with fan area
(Af) increasing monotonically with drainage area (Ad)within each fan group, as anticipated in Eq. (13) and
Source lithology(14) (Fig. 6A,B). The dependence on tectonic setting isclearly displayed in between-group differences in relative Direct evaluation of the lithological influence on fan areafan size and is particularly well illustrated in the difference – catchment area relationships is made possible by thebetween the western bajada (WB) and Owens Lake (OL) range of source lithologies present in the SWM fanfan groups (Fig. 6A; Table 2). Here fans building into group: lithological variability is isolated in a setting withthe high-sedimentation-rate environment of the southern uniform climate and uniform basin structure, fill depth,graben are approximately one-tenth the size of fans on and inferred long-term subsidence rate (Fig. 1; Table 1).the western bajada. This difference in relative fan size is Lithological differences also exist between the tectonicallycommensurate with the difference in estimated fill depths similar OL and SWM fan groups. However, although(c. 2.5 and 0.25 km, respectively; Fig. 5) and therefore both the OL and SWM fan groups classify as high-average long-term sedimentation rates, consistent with subsidence-rate, complex grabens, the gravity data indi-the direct tectonic control anticipated in Eqs (16), (19) cate that the distribution of subsidence below the fans is
different (Fig. 5B,D). Comparisons of relative fan sizesand (21).
© 1996 Blackwell Science Ltd, Basin Research, 8, 351–366362

Tectonic control of fan size
Table 2. Regression analysis.
Fan Group Sample size 95% confidence band t statistic (c) P-value (c) r2
(1) Northern Whites (NWM) 7 c 0.01 0.00–0.07 −2.76 0.033 0.757
n 2.82 0.98–4.65 3.94 0.008
(2) Southern Whites (SWM) 11 c 1.66 0.73–3.78 1.40 0.191 0.325
n 0.34 0.06–0.62 2.76 0.02
(3) Western Bajada* (WB) 20 c 2.59 1.33–5.02 3.00 0.007 0.609
n 0.64 0.39–0.90 5.29 4.2 E-5
(linear: n=1 forced)† c 0.94 0.84–1.04 19.68 1.5 E-15 0.754
n 1.00 – – –
(4) Owens Lake (OL) 10 c 0.64 0.42–0.99 −2.36 0.043 0.808
n 0.47 0.28–0.66 5.81 2.6 E-4
* Data for fans derived from glaciated, slightly and unglaciated catchments fall on a single trend and were lumped together forregression analysis. † The low n-value in the power-law regression fit (n=0.64) is not statistically significant.
between these two field sites as a function of either with no discernible differences in relative fan size(Fig. 6A).precipitation (nonglacial) or lithology must be made
with caution.Comparison of data on fans derived from different DISCUSSION
source lithologies within the SWM group does notconvincingly support even a second-order dependence of Theoretical relationships developed earlier predict that,
to first order, tectonic setting controls relative fan areasrelative fan size on source lithology (Fig. 6B). Thegranitic-source fans are among the smallest in this group, regardless of whether the fan system is in steady state or
not. This follows because tectonic setting strongly influ-but they are not statistically separable. At first glance,comparison of data from the OL group appears to ences both (1) the relationship between catchment area
(Ad) and the volumetric rate of fan deposition (V
f) andstrengthen the argument that resistant granitic lithologies
produce smaller fans (Fig. 6C). However, the comparison (2) the relationship between Vf and fan area (Af).Moreover, where subsidence rates are nonuniform bothis not quantitatively valid because: (1) differences in
graben structure (i.e. subsidence distribution), although the c and n values in familiar power-law correlations offan area and catchment area (Eq. 1) are found to benot precisely known, are apparent in Fig. 5(B,D) and (2)
source climates are different owing to the east–west largely determined by the distribution of subsidence (i.e.basin structure) and bear little relation to catchmentprecipitation gradient in the rain shadow of the Sierra
Nevada (Rantz, 1969 ; Bierman et al., 1991). Differences characteristics. Additionally, the theory suggests that therelative importance of lithological and climatic influencesin average subsidence rates and/or the geometry of the
graben structures are the most likely explanations. The depends on (1) deviations from steady state, (2) differ-ences in response time-scale between fans and theirdashed lines on Fig. 6(C) illustrate how differences in
graben structure alone (inferred from gravity sections in catchments and (3) the efficacy of internal feedbackmechanisms associated with catchment growth and theFig. 5B,D) could explain the observed differences in
relative fan size (see Fig. 4B). At best the evidence for a fractionation of sediment between fans and the valleyfloor. However, neither the catchment response functionssignificant lithological effect is inconclusive.(b(t)) nor the internal feedback mechanisms are wellenough understood to make general, quantitative state-
Climatic setting ments about the roles of climatic and lithological vari-ables. The Owens Valley field data shed some light onThe approximate quantitative correspondence between
relative fan size and sedimentation rate seen in compari- the relative importance of lithological and climatic effectsand the significance of internal feedback mechanisms.son of the WB and OL groups (Fig. 6A) suggests that
fan areas are insensitive to the climatic differences Field data from Owens Valley strongly support thetheoretical predictions outlined above. Unfortunately thebetween these two fan groups (glaciated vs. nonglaciated).
This inference can be tested by looking closely at the combination of (1) nonsteady-state conditions associatedwith climatic fluctuation during the Quaternary and (2)fans of the WB group. The extent of Late Pleistocene
glaciation is the only significant difference between adjac- the limited range of rock uplift rates in Owens Valley(Gillespie, 1982; Chase & Wallace, 1988; Bierman et al.,ent fans within the WB group and relative fan sizes can
be expected to record the climatic signal (Eq. 14; Fig. 2B), 1991) precludes the possibility of testing theoreticalpredictions of the importance of rock uplift rate.if any exists. Remarkably, within the WB group, fans
derived from variously unglaciated, slightly glaciated and However, the overriding importance of spatially variablesubsidence rates is particularly well illustrated by theheavily glaciated drainages all plot on the same trend,
© 1996 Blackwell Science Ltd, Basin Research, 8, 351–366 363

K. X. Whipple and C. R. Trayler
Owens Valley field data. For instance, the low exponent catchments classified as ‘mudstone’ tend to be signifi-cantly steeper than those classified as ‘sandstone’. Thevalues (in Eq. 1) found in regression analysis of some of
the Owens Valley data (Table 2) are most likely due to less-steep, ‘sandstone’ catchments are associated withsmaller relative fan sizes. It is unclear whether basinspatially variable subsidence rates.
Exponents (in Eq. 1) slightly less than unity have been slope or source lithology is more important: reclassifyingthe catchments as either ‘steep’ or ‘less steep’ separatesexplained previously in terms of either declining specific
sediment yield or declining trap efficiency with increasing the data into a pair of distinct trends as effectively as theoriginal lithological classification. Steeper catchmentscatchment area (e.g. Hooke, 1968; Hooke & Rohrer,
1977). However, as discussed earlier, this explanation is supported by ostensibly weaker (more erodible) litho-logies suggest the possibility that differential uplift ratesuntenable for n values much less than unity, particularly
in the rugged terrain of the Basin and Range Province. may be responsible for the observed differences in relativefan size in this field area.Subsidence rates that increase with distance from the
range front probably explain the low exponents obtained Lecce (1991) presents an interesting argument toexplain what he perceives as a paradox in fan area –for the southern White Mountains (n=0.34; Table 2)
and the Owens Lake (n=0.47; Table 2) fan groups catchment area data from the White Mountains in OwensValley (Lecce lumps our ‘southern’ and ‘northern’ fan(Figs 4B and 6C). In both cases, the n value is
significantly less than unity at the 95% confidence level groups together): larger fans are associated with the moreresistant granitic units in the northern part of the range(Table 2). Furthermore, differences in relative fan size
between the WB and OL fan groups and the NWM and (Fig. 1). Lecce argues that downwearing of hillslopegradients and subsequent increases in sediment storageSWM fan groups are primarily due to between-group
differences in long-term subsidence rates (Figs 5 and 6). in catchments underlain by weaker lithological assem-blages ought to reduce sediment yield and lead to theThe Owens Valley field data also demonstrate that, at
least in this field setting, marked differences in lithological development of smaller fans. The argument has merit.Such a condition could develop in a nonsteady-stateand climatic conditions have no demonstrable influence
on relative fan sizes. This lack of correspondence is landscape, and is anticipated by the cross-over of the twosediment yield curves in Fig. 2. However, we believeparticularly well illustrated in the case of climatic vari-
ation (between glaciated and unglaciated catchments) and that in the specific case of the White Mountains inOwens Valley, Lecce’s (1991) data are best explained asis significant for two reasons: it demonstrates (1) that so
long as short-term sedimentation rates do not greatly a difference in subsidence rates. An unfortunate geo-graphical coincidence is apparently responsible for theoutpace tectonic subsidence rates, climatic influences are
of second-order importance and (2) that the feedback confusion: the termination of the deep, narrow grabenthat runs along the flank of the White Mountains approxi-mechanisms discussed in earlier can be of considerable
importance. The finding that variations in bedrock lith- mately coincides with the transition to more resistantgranitic rocks in the northern White Mountains (Fig. 1).ology do not markedly influence relative fan sizes within
the SWM group can be interpreted in three ways: (1)the fan–catchment system is at or near steady state
CONCLUSIONS(unlikely); (2) the catchment response function (b(t)) isnot particularly sensitive to source lithology; or (3) Predicting fan areas is essentially a conservation of mass
problem: mass is produced by surface erosion (sedimentinternal feedback mechanisms effectively counteractthe lithological influence. These competing hypotheses yield), transported and deposited, with some fraction
contributing to fan deposition, and distributed in thecannot be tested rigorously with current data.depositional basin according to the spatial pattern oftectonic subsidence rates. By coupling conservation of
Relation to previous workmass with a simple erosion law, the physical relationshipsthat govern fan size can be expressed quantitatively,Several authors have argued that source lithology has an
important influence on relative fan size (e.g. Bull, 1964; explicitly accounting for the varied roles of climatic,lithological and tectonic variables (Eqs 13, 14, 16, 19Hooke & Rohrer, 1977; Lecce, 1991). However, the only
convincing field data are those of Hooke & Rohrer (1977). and 21). The theoretical expressions developed hereunequivocally demonstrate that in a steady-state land-Hooke & Rohrer (1977) clearly establish, based on field
data from Death Valley, that (1) differential subsidence scape, fan area – catchment area relationships are deter-mined almost entirely by the tectonic setting (Eqs 17 andrate is the overriding first-order control on relative fan
areas and (2) second-order differences in relative fan 20; Fig. 4). Lithology and climate play a subsidiary role,influencing only porosity changes and the proportion ofareas are systematically correlated with source lithology.
Other published data sets are inconclusive. Bull (1964) sediment sequestered in fans (Eq. 17; Harvey, 1984).However, fluctuations in climate and tectonic uplift rateswas the first to show an apparent lithological dependence
in relative fan sizes. However, this well-known data set are prevalent in Earth history and landscapes are fre-quently perturbed away from the steady state. Nonsteady-is unconvincing because: (1) lithological differences
amongst the various basins studied are subtle and (2) state conditions are particularly important because the
© 1996 Blackwell Science Ltd, Basin Research, 8, 351–366364

Tectonic control of fan size
(1991) Quaternary geomorphology and geochronology ofresponse time-scale of fans is typically much shorter thanOwens Valley, California. In: Geological Excursions in Southernthe response time-scale of catchment physiography,California and Mexico (Ed. by M. J. Walawender & B. B.implying that, in the wake of major perturbations, climateHanan), pp. 199–223. Geological Society of America, Sanand lithology could significantly influence fan area –Diego.catchment area relationships where conditions are
B, W.B. (1964) Geomorphology of segmented alluvial fansappropriate. in western Fresno County, California. Prof. Pap. US Geol.
A qualitative discussion of catchment and fan responses Surv., 352-E, 89–129.to a suite of tectonic, climatic and lithological pertur- B, W.B. (1972) Recognition of alluvial-fan deposits in thebations, including hypothetical sediment yield curves, stratigraphic record. In: Recognition of Ancient Sedimentaryhas been presented. Evaluation of catchment response Environments (Ed. J. K. Rigby & W. K. Hamblin), pp. 63–83.functions (b(t)), and their sensitivity to climate and Society of Economic Paleontologists and Mineralogists.
B, W.B. (1977) The alluvial fan environment. Prog. Phys.lithology, through either theoretical modelling exercisesGeogr., 1, 222–270.(e.g. Tucker & Slingerland, 1996) or careful field obser-
C, R.H., H, D.L. & T, B.W. (1973)vation is identified as an important area for futureBouguer Gravity Map of California, Death Valley Sheet.research. We argue that climatic and lithological variablesCalifornia Division of Mines and Geology, scale 1:250 000.may become important during transient responses to
C, C.G. & W, T.C. (1988) Flexural isostasy andlarge perturbations away from steady state, such as theuplift of the Sierra Nevada of California. J. geophys. Res.,
onset of glaciation or a dramatic increase in rock uplift 93, B4, 2795–2802.rates. However, even during transients, internal feedback C, M., K, R. & T, J.D. (1988) Regionalmechanisms can, in some circumstances, significantly clastic sediment yield in British Columbia. Can. J. Earthdampen the response. In general, tectonic setting is the Sci., 26, 31–45.dominant control, particularly over the long term. Short- C, D.F., R, P.F. & H, D.L. (1972)term exceptions are possible when the response is particu- Geologic map of the Benton Quadrangle, Mono County,
California and Esmeralda and Mineral Counties, Nevada. U.S.larly strong and background tectonic subsidence ratesGeological Survey Map, GQ-1013, scale 1:62 500.(and/or valley floor deposition rates) are relatively low.
C, D.F. & S, M.F. (1972) Geologic map of theRitter et al. (1995) document a field example of suchWhite Mountain Peak Quadrangle, Mono County, California.short-term fluctuations.U.S. Geological Survey Map, GQ-1012, scale 1:62 500.New field data from Owens Valley generally support
D, C.S. (1965) Alluvial fans in the Death Valley Region,theoretical predictions, and demonstrate the potentialCalifornia and Nevada. Prof. Pap. US Geol. Surv., 466, 1–62.
importance of internal feedback mechanisms. Differences G, A.R. (1982) Quaternary glaciation and tectonism inin tectonic setting account for the full range of variability the southeastern Sierra Nevada, Inyo County, California. PhDin relative fan sizes in Owens Valley and there is no thesis, California Institute of Technology, Pasadena,conclusive evidence in our data that either source lith- California.ology or climate importantly influence either relative fan G, I. & H, P.L. (1993) Evaluating major controls
on basinal stratigraphy, Pine Valley, Nevada: Implicationssizes or the coefficients in the familiar power-law relation-for syntectonic deposition. Bull. Geol. Soc. Am., 105, 47–55.ship (Eq. 1) used to describe them. Finally, the theory
H, A.M. (1984) Debris flows and fluvial deposits inappears to be sufficiently general to reconcile apparentSpanish Quaternary alluvial fans: implications for fan mor-disagreements in the literature regarding the relative rolesphology. In: Sedimentology of Gravels and Conglomerates (Ed.of tectonic, lithological and climatic conditions (e.g. Bull,by E. H. Koster & R. J.Steel), pp. 123–132. Canadian Society1964; Lustig, 1965; Hunt & Mabey, 1966; Hooke &of Petroleum Geologists.
Rohrer, 1977; Lecce, 1991; Ritter et al., 1995). H, K.J., D, W.R., MC, W.H. & W,
C.L. (1989) Geology and water resources of Owens Valley,California. U.S. Geological Survey Open File Report,ACKNOWLEDGEMENTS88-715, 1–118.
H, R.L. (1968) Steady-state relationships on arid-regionThis research was supported by the National Sciencealluvial fans in closed basins. Am. J. Sci., 266, 609–629.Foundation, Grant EAR-9004843. Critical reviews by
H, R.L. (1972) Geomorphic evidence for Late-WisconsinR. LeB. Hooke, T. Dunne, P. Flemings and A. Howardand Holocene tectonic deformation in Death Valley,improved the manuscript. We thank D. Mohrig and D.California. Bull. Geol. Soc. Am., 83, 2073–2098.Miller for insightful discussions. We are grateful to the
H, R., LB. & R, W.L. (1977) Relative erodibilityWhite Mountain Research Station and the staff at theof source-area rock types, as determined from second-order
Bishop Laboratory for providing accommodation. variations in alluvial-fan size. Bull. Geol. Soc. Am., 88,1177–1182.
H, A.D., D, W.E. & S, M.A. (1994)REFERENCESModeling fluvial erosion on regional to continental scales.J. geophys. Res., 99, 13,971–13,986.A, J. (1980) Contemporary uplift and erosion of the
H, A.D. & K, G. (1983) Channel changes inSouthern Alps, New Zealand. Bull. Geol. Soc. Am., 91, Partbadlands. Bull. Geol. Soc. Am., 94, 739–752.II, 1–114.
B, P.R., G, A.R., W, K.X. & C, D. H, C.B. & M, D.R. (1966) Stratigraphy and structure,
© 1996 Blackwell Science Ltd, Basin Research, 8, 351–366 365
K. X. Whipple and C. R. Trayler
Death Valley, California. Prof. Pap. US Geol. Surv., 494-A, of California, Fresno Sheet. California Division of Mines andGeology, scale 1:250 000.1–162.
J, P., J, D. & H, R.L. (1993) Fan and P, L.C., K, M.F. & J, W.H. (1964) Structuralgeology and volcanism of Owens Valley region, California –playa areas in southern California and adjacent parts of
Nevada. Earth Surf. Process. Landforms, 18, 109–119. a geophysical study. Prof. Pap. US Geol. Surv., 438, 1–68.P, C., H, P.L. & A, C.L. (1992) The large-K, C., S, L. & P, T.L. (1993) Faulting at
Mormon Point, Death Valley, California: a low-angle normal scale dynamics of grain-size variation in alluvial basins, 1:Theory. Basin Res., 4, 73–90.fault cut by high-angle faults. Geology, 21, 327–330.
K, H. & B, C. (1994) Escarpment evolution on R, S.E. (1969) Mean Annual Precipitation in the CaliforniaRegion. U.S. Geological Survey, Water Resources Divisionhigh-elevation rifted margins: insights derived from a surface
processes model that combines diffusion, advection, and Map, scale 1:750 000.R, J.B., M, J.R., E, Y. & W, S.G. (1995)reaction. J. geophys. Res., 99, 12,191–12,209.
L, S.A. (1990) The alluvial fan problem. In: Alluvial Fans: Reconciling the roles of tectonism and climate in Quaternaryalluvial fan evolution. Geology, 23, 245–248.A Field Approach (Ed. by A. H. Rachocki & M. Church),
pp. 3–24. John Wiley & Sons Ltd, New York. S, S.A. & R, D.K. (1995) Sediment yield fromdisturbed earth systems. Geology, 23, 391–394.L, S.A. (1991) Influence of lithologic erodibility on alluvial
fan area, western white mountains, California and Nevada. S, M.A. & D, W.E. (1992) The problem of channelerosion into bedrock. Catena Supplement, 23, 101–124.Earth Surf. Process. Landforms, 16, 11–18.
L, L.K. (1965) Clastic sedimentation in Deep Springs S, L., V, B., W, L., W, J., O,
J., H, E. & T, B. (1988) Structure of the centralValley, California. Prof. Pap. US Geol. Surv., 352-F, 131–192.M, R.A. & B, J.C. (1965) Geologic Map of Death Valley pull-apart basin and vicinity from COCORP
profiles in the southern Great Basin. Bull. Geol. Soc. Am.,California, Fresno Sheet. California Division of Mines andGeology, scale 1:250 000. 100, 1437–1450.
S, R.G. (1967) Geologic Map of California, MariposaM, P. & E, P. (1990) Late Cenozoic uplift ofmountain ranges and global cooling: chicken or egg? Nature, Sheet. California Division of Mines and Geology, scale
1:250 000.346, 29–34.N, C.A. (1966a) Geologic Map of the Blanco Mountain S, R. & S, M.C. (1977) Geologic Map of California,
Death Valley Sheet. California Division of Mines andQuadrangle, Inyo and Mono Counties, California. U.S.Geological Survey Map, GQ-529, scale 1:62 500. Geology, scale 1:250 000.
T, G.E. & S, R. (1996) Predicting sedimentN, C.A. (1966b) Geologic Map of the Waucoba MountainQuadrangle, Inyo County, California. U.S. Geological Survey flux from fold and thrust belts. Basin Research (this volume).
W, K.X. & D, T. (1992) The influence of debris-Map, GQ-528, scale 1:62 500.O, H.W. & R, S.L. (1978) Bouguer Gravity Map flow rheology on fan morphology, Owens Valley, California.
Bull. Geol. Soc. Am., 104, 887–900.of California, Mariposa Sheet. California Division of Minesand Geology, scale 1:250 000.
O, H.W. & R, S.L. (1982) Bouguer Gravity Map Received ?? ???? 1995; revision accepted ?? ???? 1996.
© 1996 Blackwell Science Ltd, Basin Research, 8, 351–366366