
TEConomy/BIO Investment, Innovation and Job … Partners, LLC (TEConomy) endeavors at all times to...
68
TEConomy/BIO Investment, Innovation and Job Creation in a Growing U.S. Bioscience Industry 2018
Transcript of TEConomy/BIO Investment, Innovation and Job … Partners, LLC (TEConomy) endeavors at all times to...

TEConomy/BIO
Investment, Innovation and Job Creation in a Growing U.S. Bioscience Industry2018

TEConomy Partners, LLC (TEConomy) endeavors at all times to produce work of the highest quality, consistent with our contract commitments. However, because of the research and/or experimental nature of this work, the client undertakes the sole responsibility for the consequence of any use or misuse of, or inability to use, any information or result obtained from TEConomy, and TEConomy, its partners, or employees have no legal liability for the accuracy, adequacy, or efficacy thereof.
BIO is the world’s largest trade association representing biotechnology companies, academic institutions, state biotechnology centers and related organizations across the United States and in more than 30 other nations. BIO members are involved in the research and development of innovative healthcare, agricultural, industrial and environmental biotechnology products. BIO also produces the BIO International Convention, the world’s largest gathering of the biotechnology industry, along with industry-leading investor and partnering meetings held around the world. BIOtechNOW is BIO’s blog chronicling “innovations transforming our world.”
TEConomy Partners, LLC is a global leader in research, analysis and strategy for innovation-based economic development. Today we’re helping nations, states, regions, universities and industries blueprint their future and translate knowledge into prosperity. The principals of TEConomy Partners include the authors of the prior Battelle/BIO State Bioscience Development reports, published since 2004. For further information, please visit www.teconomypartners.com.
Public Affairs Consultants
PMP Public Affairs Consulting, Inc.—PMP— is an independent consulting firm serving the public and constituent relations needs of bioscience-related companies and associations.

TABLE OF CONTENTSINTRODUCTION AND HIGHLIGHTS ................................................................................................................. 1National Industry Highlights 1
State-by-State and Metropolitan Area Bioscience Industry Highlights 3
Innovation Ecosystem: Key Findings 3
U.S. BIOSCIENCE INDUSTRY CONTINUES LONG-TERM GROWTH TREND ......................................................... 5Recent Industry Performance: Job Growth Accelerates in 2015-16 8
Bioscience Wages: Rising Wages and Expanding Wage Premium for Industry Workers 10
Economic Impacts: The Bioscience Industry’s Broader Value and Contributions to the National Economy 11
State-by-State and Metropolitan Area Bioscience Industry Key Findings and Highlights 17
THE INNOVATION ECOSYSTEM FOR THE U.S. BIOSCIENCE INDUSTRY .......................................................... 23R&D Funding and Expenditures: Ecosystem Bolstered by Increasing NIH Budgets 23
Patent Activity Reflects Expanding Innovation 25
Venture Capital Investments in the Biosciences Reach New Highs 26
STATE AND METROPOLITAN AREA PERFORMANCE .................................................................................... 29Agricultural Feedstock & Industrial Biosciences 31
Drugs & Pharmaceuticals 34
Medical Devices & Equipment 37
Research, Testing & Medical Laboratories 40
Bioscience-Related Distribution 43
THE INNOVATION ECOSYSTEM: STATE PERFORMANCE MEASURES ............................................................. 47Academic Bioscience R&D Expenditures 47
NIH Funding 49
Bioscience-Related Patents 50
Bioscience Venture Capital Investments 52
APPENDIX: DATA & METHODOLOGY ............................................................................................................ 55Industry Employment, Establishments and Wages 55
Industry Economic Impacts and Employment Multipliers 58
Bioscience Academic R&D Expenditures 58
National Institutes of Health (NIH) Funding 59
Bioscience Venture Capital Investments 59
Bioscience Patents 59

TABLESTable 1. U.S. Bioscience Establishment and Employment Data, 2016 and Percent Change, 2001-14 and 2014-16 1Table 2. U.S. Bioscience Establishment and Employment Data, 2016 and Percent Change, 2001-14 and 2014-16 10Table 3. Economic Impacts of the U.S. Bioscience Industry, 2016 ($ in millions) 13Table 4. U.S. Biobased Product Share and Associated Establishments and Employment of Manufacturing Industries 17Table 5. State Specializations and Job Growth by Bioscience Subsector 2016 20Table 6. U.S. Bioscience Venture Capital Investments by Stage, 2014-2017 27Table 7. States with Large and Specialized Employment in Agricultural Feedstock and Industrial Biosciences, 2016 32Table 8. Metropolitan Statistical Areas with the Largest Employment Levels
in Agricultural Feedstock and Industrial Biosciences, 2016 32Table 9. Metropolitan Statistical Areas with the Highest Location Quotients in Agricultural Feedstock
and Industrial Biosciences, by size of MSA, 2016 33Table 10. States with Large and Specialized Employment in Drugs and Pharmaceuticals 35Table 11. Metropolitan Statistical Areas with the Largest Employment Levels in Drugs and Pharmaceuticals, 2016 35Table 12. Metropolitan Statistical Areas with the Highest Location Quotients in Drugs and Pharmaceuticals, by size of MSA, 2016 36Table 13. States with Large and Specialized Employment in Medical Devices and Equipment, 2016 38Table 14. Metropolitan Statistical Areas with the Largest Employment Levels in Medical Devices and Equipment, 2016 38Table 15. Metropolitan Statistical Areas with the Highest Location Quotients in Medical Devices and Equipment, by size of MSA, 2016 39Table 16. States with Large and Specialized Employment in Research, Testing and Medical Laboratories, 2016 41Table 17. Metropolitan Statistical Areas with the Largest Employment Levels in Research, Testing and Medical Laboratories, 2016 41Table 18. Metropolitan Statistical Areas with the Highest Location Quotients in Research,
Testing and Medical Laboratories, by size of MSA, 2016 42Table 19. States with Large and Specialized Employment in Bioscience-Related Distribution, 2016 44Table 20. Metropolitan Statistical Areas with the Largest Employment Levels in Bioscience-Related Distribution, 2016 44Table 21. Metropolitan Statistical Areas with the Highest Location Quotients in Bioscience-Related Distribution,
by size of MSA, 2016 45Table 22. Leading States-Academic Bioscience R&D Expenditures & Growth 48Table 23. Leading States-Per Capita and Concentration of Academic Bioscience R&D Expenditures 48Table 24. Leading States-NIH Funding 49Table 25. Leading States-Bioscience-Related Patents 50Table 26. Leading States-Bioscience-Related Patents by Class Group, 2014-2017 51Table 27. Leading States in Bioscience Venture Capital Investments 52Table 28. Leading States in Bioscience Venture Capital Investments by Segment, 2014-2017 53Table A-1. The Bioscience Industry, NAICS Definition 57Table A-2. Bioscience-Related Patents—Classes and Groups 61
FIGURESFigure 1. Economic Impacts of the U.S. Bioscience Industry, 2016 ($ in millions) 2Figure 2. U.S. Bioscience Industry and Private Sector Employment Trends, 2001-16 5Figure 3. Employment Change—the U.S. Bioscience Industry vs. Other Technology Industries, 2001-16 6Figure 4. Change in Real Average Annual Wages in the Biosciences and the Total Private Sector, 2001-16 11Figure 5. Economic Impacts of the U.S. Bioscience Industry, 2016 ($ in millions) 13Figure 6. Change in Bioscience Employment by State, 2001-16 and 2014-16 18Figure 7. National Institutes of Health Awards, FY 2014-17 ($ in billions) 24Figure 8. University Bioscience R&D Expenditures, FY 2014-16 ($ in billions) 25Figure 9. Bioscience-related U.S. Patents, 2014-17 25Figure 10. Bioscience-related U.S. Patents by Segment, Cumulative 2014-17 26Figure 11. Bioscience-related Venture Capital Investments, 2014-17 ($ in millions) 26Figure 12. Bioscience-related Venture Capital Investments by Segment, 2014-17 ($ in millions) 28

1
The bioscience industry represents the unique
confluence of key characteristics for societal and
economic progress—extremely high levels of
innovation that are saving and improving lives through
advancements in biomedical, energy and advanced
food and industrial technologies; and expanding a
wide mix of employment opportunities with wages and
incomes that support a high standard of living. The
industry thinks big and is addressing a host of global
grand challenges related to diagnosing, treating and
curing disease; ensuring a safe, affordable and more
sustainable food supply; and leveraging biotechnologies
and sustainable approaches to develop biobased fuels,
chemicals and other industrial products.
This eighth, biennial report focuses on the economic
progress and footprint of the industry geographically
including the performance, positioning and latest
trends in the bioscience industry for the nation, states
and metropolitan areas. For the first time, it includes a
national assessment of the full economic impact of the
bioscience industry not only in terms of employment,
but also with respect to economic output and fiscal
impacts. In addition, the report details the situation
for the industry’s innovation ecosystem considering
several key facets that ensure a high-performing
industry and the long-term success it has maintained.
These include the nation’s academic research
activities and trends in federal funding, access to
critical angel and venture capital and the innovation
outputs context via patent activities.
This report, and the accompanying state profiles
made available online, continues to focus on the
activities and economic benefits across states, as the
bioscience industry has an extensive economic reach
and impacts that benefit every region of the country.
National Industry HighlightsThe following are highlights and key findings from the
latest TEConomy/BIO industry assessment:
• The U.S. bioscience industry directly employed
1.74 million in 2016 in more than 85,000
business establishments.
• Since 2001, U.S. bioscience companies have
increased employment by 273,000 jobs, or
nearly 19 percent, with net job gains recorded
by the industry in all but 2 of the last 15 years.
INTRODUCTION AND HIGHLIGHTS

2
• Since 2014, total bioscience industry
employment has risen by 4.4 percent, with
four of the industry’s five major subsectors
contributing to the job gains. Industry hiring
accelerated in 2015 and 2016 compared with
the prior two years.
• Bioscience industry wages are consistently
higher and growing faster, on average, than
those for the overall economy, reflecting the
skilled, high-quality jobs in demand. The average
U.S. bioscience worker earned nearly $99,000
in 2016, 85 percent greater than the average
for the overall private sector.
• The bioscience industry’s total economic impact
on the U.S. economy, as measured by overall
output, totaled $2 trillion in 2016 (Figure 1).
This impact is generated by the direct output
of the bioscience industry combined with the
indirect (supply chain) and induced (employee
spending) impacts.
• The industry’s 1.74 million employees and its
associated economic output support 8 million
jobs throughout the entire U.S. economy through
both indirect and induced effects.
Figure 1Economic Impacts of the U.S. Bioscience Industry, 2016
Direct Impact Total Impact
1.74MEmployment
Employment 8.0M
Wages & Benefit $558B
Economic Output $2.0T
State & Local Taxes $81B
Federal Taxes $141BSource: TEConomy Partners data, analysis using IMPLAN U.S. Input/Output Model, 2016.

3
INVESTMENT, INNOVATION AND JOB CREATION IN A GROWING U.S. BIOSCIENCE INDUSTRY
State-by-State and Metropolitan Area Bioscience Industry HighlightsThe nation’s bioscience industry extends to every
state, and a majority have a specialized concentration
of jobs in at least one bioscience subsector. In fact, the
number of states with a niche industry specialization
has increased from 32, two years ago, to 38 today.
Likewise, the industry is an important economic engine
for the nation’s metropolitan regions.
• Thirty-eight states and Puerto Rico have
a specialization in at least one of the five
bioscience subsectors in 2016. These include: { 18 states specialized in Agricultural
Feedstock & Industrial Biosciences { 11 states and Puerto Rico specialized in
Bioscience-related Distribution { 12 states and Puerto Rico specialized in
Drugs & Pharmaceuticals { 14 states and Puerto Rico specialized in
Medical Devices & Equipment { 11 states and Puerto Rico specialized in
Research, Testing & Medical Laboratories
• Over the 2014 to 2016 period, 41 states
experienced job growth in the bioscience
industry.
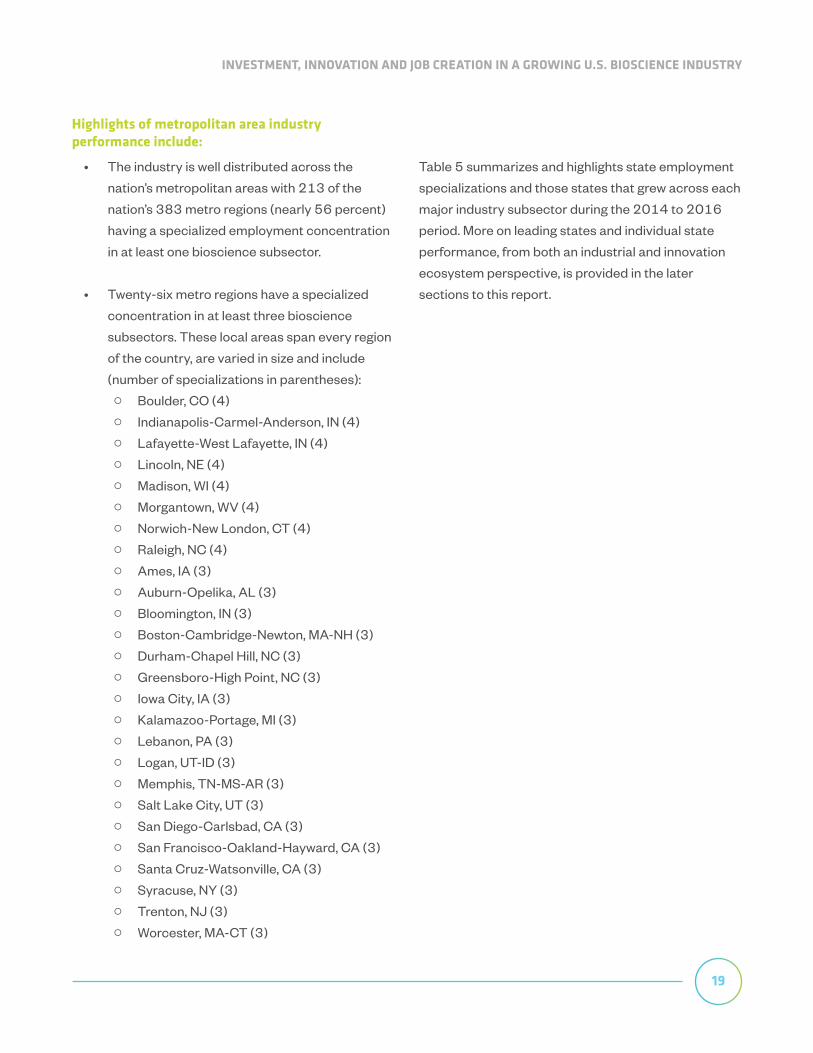
• The industry is well distributed across the
nation’s metropolitan areas with 213 of the
nation’s 383 metro regions (nearly 56 percent)
having a specialized employment concentration
in at least one bioscience subsector.
• Twenty-six metro regions have a specialized
concentration in at least three bioscience
subsectors. These local areas span every region
of the country and are varied in size.
Innovation Ecosystem: Key FindingsPerformance and trends in the national ecosystem for
biosciences development have been quite positive,
however continued national and state support for
industry innovation is critical for maintaining national
competitiveness. Highlights from the ecosystem
assessment include:
• Venture Capital Investments in the Biosciences Reach New Highs. More than
$66 billion in venture capital was invested in
bioscience companies in the 2014 through
2017 period. It is common to see year-to-year
variability in the levels of investments, but there
has been an upward trend in industry investing
with new highs reached in the biosciences in
2015 (at $17.0 billion) and then again in 2017
when $20 billion was invested.
• Ecosystem Bolstered by Increasing NIH Budgets. For several years, concerns have
been raised regarding declining and/or flat NIH
research budgets and the subsequent effects
on academic and other research. Fortunately for
the bioscience community, NIH funding is back
on the rise with budget increases sustained each
of the last three years.
• Growth for Academic Biosciences R&D in 2016. Following a 1.5 percent decline in 2015, academic
R&D expenditures in the biosciences increased a
healthy 5.5 percent to $42 billion in 2016.
• Patent Activity Reflects Expanding Innovation. The U.S. has increased patent
totals in bioscience-related technology classes
by nearly 5 percent since 2014, or 1.6 percent
per year, on average. While 2015 and 2016
had lower numbers of total patents awarded to
a U.S. inventor, 2017 saw the total rise to nearly
27,000, a new high.


5
The nation’s bioscience industry is continuing to
generate high-quality jobs at a steady pace. More than 6
years into the current economic expansion, employment
among industry firms reached 1.74 million jobs in 2016
across a diverse array of industry subsectors operating
at nearly 86,000 U.S. business establishments.
Figure 2 U.S. Bioscience Industry and Private Sector Employment Trends, 2001-16
96
98
100
102
104
106
108
110
112
114
116
118
120 � U.S. BioscienceIndustry
� U.S. Total Private Sector
2016201520142013201220112010200920082007200620052004200320022001
Empl
oym
ent I
ndex
(200
1 = 10
0)
Source: TEConomy Partners analysis of U.S. Bureau of Labor Statistics, QCEW data; enhanced file from IMPLAN.
U.S. BIOSCIENCE INDUSTRY CONTINUES LONG-TERM GROWTH TREND
Since 2001, U.S. bioscience companies have
increased employment by 273,000 jobs, nearly
19 percent, with net job gains recorded by the
industry in all but 2 of the last 15 years (Figure 2).
The industry has been less affected by recessions
compared with the rest of the economy and this

6
resilience meant that during the Great Recession the
biosciences did not contract as deeply as the nation’s
overall private sector. Additionally, the bioscience
industry was able to regain its footing and recover its
lost jobs much faster than the economy as a whole.
Industry job growth has accelerated during the current
expansion—its average annual growth has risen by
0.2 percentage points compared with the average for
the 2001-2008 period.
Looking back over a decade and a half, this knowledge-
based and technology-driven industry represents
the confluence of two key characteristics for societal
and economic progress—extremely high levels of
innovation that are saving and improving lives through
advancements in biomedical, energy and advanced
food and industrial technologies; and expanding a
mix of employment opportunities with wages and
incomes that support a high standard of living. Its
long-term performance compares well against other
major U.S. technology industries with job gains nearly
twice that of the overall private sector and behind only
software and computer services among other leading
technology sectors (Figure 3). While not matching
the rapid rate of growth in software and computer
services, the biosciences are increasingly overlapping
and converging with information technologies involving
a wide range of expanding applications in areas such
as electronic medical records, connected devices
for patient monitoring, bioinformatics, precision
agriculture and other uses of information technologies
for improving diagnosis, targeting treatments and
improving healthcare delivery.
The bioscience industry’s physical footprint includes
85,702 establishments owned and operated by
industry firms across every U.S. state. Since 2001,
the bioscience industry has increased business
establishments by 40 percent compared with just
under 19 percent for the overall private sector. In
Figure 3Employment Change—the U.S. Bioscience Industry vs. Other Technology Industries, 2001-16
41.2%
18.6%9.8%
-3.9%
-46.8%Computer & Peripheral
EquipmentAerospace
Products & PartsTotal Private
SectorBiosciencesSoftware &
Computer Services
Source: TEConomy Partners analysis of U.S. Bureau of Labor Statistics, QCEW data; enhanced file from IMPLAN.

7
INVESTMENT, INNOVATION AND JOB CREATION IN A GROWING U.S. BIOSCIENCE INDUSTRY
Defining the BiosciencesDefining the biosciences is challenging due to its diverse mix of technologies, products, R&D focus and companies themselves. The industry includes companies engaged in advanced manufacturing, research activities and technology services but has a common thread or link in their application of knowledge in the life sciences and how living organisms function. At a practical level, federal industry classifications don’t provide for one over-arching industry code that encompasses the biosciences. Instead, two dozen detailed industries must be combined and grouped to best organize and track the industry in its primary activities.
The TEConomy/BIO State Initiatives reports have developed an evolving set of major aggregated subsectors that group the bioscience industry into five key components, including:
Agricultural feedstock and industrial biosciences —Firms engaged in agricultural production and processing, organic chemical manufacturing and fertilizer manufacturing. The subsector includes industry activity in the production of ethanol and other biofuels.
Bioscience-related distribution —Firms that coordinate the delivery of bioscience-related products spanning pharmaceuticals, medical devices and ag biotech. Distribution in the biosciences is unique in its deployment of specialized technologies including cold storage, highly regulated monitoring and tracking and automated drug distribution systems.
Drugs and pharmaceuticals —Firms that develop and produce biological and medicinal products and manufacture pharmaceuticals and diagnostic substances.
Medical devices and equipment —Firms that develop and manufacture surgical and medical instruments and supplies, laboratory equipment, electromedical apparatus including MRI and ultrasound equipment, dental equipment and supplies.
Research, testing and medical laboratories —Firms engaged in research and development in biotechnology and other life sciences, life science testing laboratories and medical laboratories. Includes contract and clinical R&D organizations.
It is important to note that in the federal data used for the industry assessment a bioscience company operating multiple U.S. establishments can be classified into more than one industry subsector depending upon the primary activity of each individual establishment. For example, a company establishment focused on R&D would be classified within research, testing and medical labs while that same company’s distribution facility would be classified within the distribution subsector.
For this edition of the biennial report, TEConomy and BIO re-examined the industry definition to understand and explore whether additional industries are worthy of inclusion and in particular, examined industries active in the industrial and agricultural biosciences. And while there is extensive emerging activity in these sectors, the NAICS codes in which these companies reside are still not “primarily” bioscience in nature. See the feature on Industrial Biotechnology and the Biobased Economy on page 14 of this report for more.

8
the recent 2014 to 2016 period, the bioscience
industry grew its establishment base by 7.7 percent
compared to 3.4 percent private sector growth. The
average bioscience establishment employs more than
its counterparts in the overall private sector—
an average of 20 jobs per bioscience establishment
compared with 13 jobs in the private sector.
Recent Industry Performance: Job Growth Accelerates in 2015-16While stepping back to re-examine this longer-term
track record provides important perspective, this 2018
edition of the TEConomy/BIO biennial report focuses
on the more recent past, with the primary focus of the
national and state-level data and performance analysis
for the industry and its innovation ecosystem from
2014 through 2016. And in the case of some data, the
analysis extends through 2017.
To best understand the industry’s performance
and dynamics, it is important to look to the diverse
components that form the industry. Since 2004,
this biennial report has defined and organized the
industry across a set of major “subsectors” utilizing
federal industry classifications that combine to form
as complete a definition as possible (recognizing the
constraints of these industry classifications) and one
that is comparable for an assessment across states
and even metropolitan regions. Five major subsectors
form the industry definition today:
• Agricultural Feedstock & Industrial Biosciences
• Bioscience-related Distribution
• Drugs & Pharmaceuticals
• Medical Devices & Equipment
• Research, Testing & Medical Laboratories
Table 1U.S. Bioscience Establishment and Employment Data, 2016 and Percent Change, 2001-16 and 2014-16
Bioscience Industry & Subsectors
Establishment Data Employment Data
Count, 2016
Change, 2001-2016
Change, 2014-2016
Count,2016
Change, 2001-2016
Change, 2014-2016
Agricultural Feedstock & Industrial Biosciences
1,709 2.8% -3.2% 68,027 -1.3% -1.2%
Bioscience-related Distribution
39,149 7.0% 3.8% 469,640 13.1% 3.7%
Drugs & Pharmaceuticals 3,754 44.0% 13.7% 299,113 -2.0% 2.0%
Medical Devices & Equipment
8,083 29.7% 5.9% 359,293 4.3% 2.9%
Research, Testing & Medical Laboratories
33,007 133.3% 13.1% 547,566 62.7% 8.2%
Total Biosciences 85,702 40.0% 7.7% 1,743,639 18.6% 4.4%
Source: TEConomy Partners analysis of U.S. Bureau of Labor Statistics, QCEW data; enhanced file from IMPLAN.

9
INVESTMENT, INNOVATION AND JOB CREATION IN A GROWING U.S. BIOSCIENCE INDUSTRY
Subsector performance/overviewsResearch, testing and medical laboratories is the largest and fastest growing among the bioscience industry subsectors since 2014. The subsector is unique relative to the others in its service offerings for contract and clinical research expertise. Subsector firms employ more than 547,000 or 31 percent of the overall bioscience industry and have an impressive record of net job gains on an annual basis as far back as 2001. Since 2014, both components of the subsector have grown but the biotechnology and other life sciences R&D employment has been faster, increasing nearly 10 percent compared with about 4 percent growth for medical labs.
Bioscience-related distribution employed nearly 470,000 in 2016 across a widespread national geographic footprint that spanned more than 39,000 business establishments. The subsector’s 3.7 percent job growth since 2014 was primarily driven by its two largest components—medical, dental and hospital equipment and supplies distribution (up nearly 5 percent) and the delivery of drugs and pharmaceuticals (up 4 percent). The subsector accounts for 27 percent of national bioscience employment.
Medical device and equipment companies employ more than 359,000 and have grown their employment base by 2.9 percent since 2014, an acceleration of job growth after several years of relatively flat employment levels. The subsector, which employs one in five bioscience workers, had most of its job gains since 2014 in the electromedical apparatus component, which includes a wide range of product manufacturing including MRI equipment and PET scanners as well as pacemakers and endoscopic equipment.
Drugs and pharmaceuticals has seen a 2 percent employment gain since 2014 with subsector jobs totaling more than 299,000 in 2016. In fact, following several years of net job losses, the subsector has experienced four consecutive years of at least some net job increase. The subsector is not only growing jobs but also its business establishments which outpaced rapid growth industry-wide, boosting its physical footprint by 13.7 percent. Jobs in drugs and pharmaceuticals have the highest average wages among the major subsectors, reaching nearly $114,000 in 2016. Two components of the subsector had double-digit job growth from 2014 through 2016—biological products, which includes vaccines and gene therapies among other products and medicinal and botanical manufacturing. While drugs and pharmaceuticals accounts for 17 percent of U.S. bioscience jobs, the subsector is closely aligned with R&D establishments that fall within research, testing and medical labs, as well as within bioscience-related distribution.
Agricultural feedstock and industrial biosciences employs more than 68,000 nationally in more than 1,700 business establishments. The subsector had a 1.2 percent employment decline from 2014 through 2016 with modest job losses spread across the agricultural chemicals components. The job declines were partially offset by gains among the agricultural feedstock components including wet corn milling and oilseed processing. Despite the recent job declines, subsector employment has risen by 2.9 percent during the economic expansion (since 2010). The contraction of subsector establishments may be linked to recent consolidation within the industry.

10
Since 2014, total bioscience industry employment
has risen by 4.4 percent, with four of the five major
subsectors contributing to the job gains (Table 1).
Industry hiring accelerated in 2015 and 2016 compared
with the prior two years, averaging 2.2 percent annually
compared with 1.3 percent annually in 2013-14.
Research, testing and medical labs, the largest of the
industry subsectors, led with 8.2 percent job growth
from 2014 to 2016, and continues its impressive
record of consistently adding jobs every year back to
2001. Following two years of slower growth, drugs and
pharmaceuticals hiring accelerated in 2016. Similarly,
after several years of smaller gains and one modest
decline, medical device manufacturing had 1.5
percent annual growth in both 2015 and 2016. Firms
in the bioscience distribution space also increased
their pace in hiring during the recent two-year period
by 3.7 percent. Agricultural feedstock and industrial
biosciences is the only subsector to see a modest
decline, with employment decreasing by less than 1
percent each of the last two years.
Bioscience Wages: Rising Wages and Expanding Wage Premium for Industry WorkersThe bioscience industry stands out for being a
generator and source of high-wage jobs. Industry wages
are consistently higher and growing faster, on average,
than those for the overall economy. This reflects the
skilled, high-quality jobs in demand within an industry
advancing a wide range of value-adding products and
services, and it further reflects the importance of the
industry as a national economic engine.
In 2017 the nation’s bioscience workers earned nearly
$99,000, on average (Table 2), which is more than
$45,000 (85 percent) above the average for the
nation’s private sector. This wage premium earned
by bioscience workers has grown from 64 percent in
2001 to 85 percent today.
Each bioscience subsector has average wages well
above those for the overall private sector, as well as
exceeding those for most other major U.S. industries.
Employees within both the drugs and pharmaceuticals
and research, testing and medical labs subsectors
earn average wages exceeding $100,000 annually,
higher than for their counterparts in industries such as
finance and insurance and information.
Table 2Average Annual Wages for the Biosciences and Other Major Industries, 2016
Employment Sector Annual Average Wage
Drugs & Pharmaceuticals $113,815
Research, Testing & Medical Labs
$106,942
Finance & Insurance $101,180
Total Biosciences $98,961
Information (IT, Telecommunications, Broadcasting, Data Processing)
$98,475
Bioscience-Related Distribution $93,677
Professional & Technical Services
$90,950
Medical Devices & Equipment $84,746
Agricultural Feedstock & Industrial Biosciences
$80,961
Manufacturing $64,860
Construction $58,643
Real Estate & Rental & Leasing $54,959
Total Private Sector $53,354
Transportation & Warehousing $50,443
Health Care & Social Assistance $47,955
Retail Trade $30,297
Source: TEConomy Partners analysis of U.S. Bureau of Labor Statistics, QCEW data; QCEW data; enhanced file from IMPLAN.

11
INVESTMENT, INNOVATION AND JOB CREATION IN A GROWING U.S. BIOSCIENCE INDUSTRY
Figure 4Change in Real Average Annual Wages in the Biosciences and the Total Private Sector, 2001-16
Agricultural Feedstock
& Industrial Biosciences
Bioscience-Related
Distribution
Drugs & Pharmaceuticals
Medical Devices & Equipment
Research, Testing & Medical Labs
15%20%21%
31%
19%
Total Bioscience23%
Total Private Sector9%
Source: TEConomy Partners analysis of U.S. Bureau of Labor Statistics, QCEW data; enhanced file from IMPLAN.
Long-term average wage growth for the biosciences
has outpaced that for the private sector. Since 2001,
real (inflation-adjusted) wages have increased by
23 percent versus just 9 percent for the economy
as a whole (Figure 4). Workers in each of the major
subsectors have seen their average wages rise by
double-digits over the decade and a half, with those in
research, testing and medical labs experiencing the
greatest increase (up 31 percent).
Economic Impacts: The Bioscience Industry’s Broader Value and Contributions to the National EconomyThe bioscience industry’s 1.74 million workers
earning high wages and developing, manufacturing
and distributing innovative products and services
across every U.S. state, create a substantial
national economic impact. Like other industries,
the biosciences have an extensive, interdependent
supply chain for inputs to research, production and
distribution activities. The industry both supports
and depends upon other companies and industries
to supply everything from business services to
commodity inputs. In addition, industry employees
generate demand for goods and services through their
personal spending. As a result, the biosciences have
a national economic impact that extends well beyond
their direct employment and earnings.
Economic impact analysis using Input/Output models
measures the types of impacts and effects described,
including:
• Direct effects: the direct employment and other
economic activity generated by the industry’s
operations and expenditures;
• Indirect effects: the economic activity
generated for supplier firms by the target
industry; and

12
• Induced effects: the additional economic
activity generated by the personal spending of
the direct employees and the employees of the
supplier firms in the overall economy.
The sum of these three effects is referred to as the
total economic impact. TEConomy estimated the total
economic impact of the U.S. bioscience industry in
2016 based on employment values for each detailed
industry sector within the biosciences and evaluated
the impacts across several key economic measures:
• Employment. The total number of full- and
part-time jobs in all industries;
• Personal Income. The wages and salaries,
including benefits, earned by the workers
holding the jobs created;
• Value-Added. The difference between an
industry’s total output and the cost of its labor
and other inputs; and
• Output. The total value of production or sales in
all industries. 1
Additionally, the model allows for a high-level
estimation of tax revenues generated by the economic
activity at a combined state/local level and at a
federal level. These tax revenues include estimates
of a variety of corporate and personal tax payments,
including both the employer and employee portions of
social insurance taxes.
The bioscience industry’s total economic impact on
the U.S. economy, as measured by overall output,
totaled $2 trillion in 2016 (Figure 5 and Table 3).
1 In impact-related literature the total output impacts are often referred to as the “economic impact” of a project or investment.
This impact is generated by the direct output of
the bioscience industry which totaled $885 billion
combined with the indirect and induced impacts that
total more than $1.1 billion. This means every $1
in industry output generates an additional $1.27 in
output throughout the rest of the national economy,
for an industry output “multiplier” of 2.27. This
substantial industry output represents 6.1 percent
of all U.S. economic activity.
The industry’s 1.74 million employees and its
associated economic output support 8 million jobs
throughout the entire economy through both indirect
and induced effects. These additional jobs span
numerous other industries including those in the
supply chain such as real estate, consulting, legal
services, transportation, information technology and
utilities, just to name some. The industry’s employment
multiplier is 4.57, meaning that for every bioscience
job an additional 3.57 jobs are supported throughout
the rest of the national economy.
Additional economic impacts of the industry extend
to its contributions to local, state and federal tax
revenues through the corporate, personal income
and other taxes paid by bioscience firms, their
suppliers and their workers. These total taxes,
through a combined direct and multiplier effects, are
estimated to have contributed $81 billion to state
and local governments and $141 billion to the federal
government in 2016.

13
INVESTMENT, INNOVATION AND JOB CREATION IN A GROWING U.S. BIOSCIENCE INDUSTRY
Table 3Economic Impacts of the U.S. Bioscience Industry, 2016 ($ in millions)
Impact Type Employment Labor Income Value Added Output State/Local Tax Revenue
Federal Tax Revenue
Direct Effect 1,743,639 $181,526 $422,520 $884,545 $27,418 $52,083
Indirect Effect 2,763,391 $201,634 $314,176 $574,249 $24,245 $46,063
Induced Effect 3,468,360 $174,993 $309,087 $549,423 $29,413 $42,921
Total Impact 7,975,390 $558,153 $1,045,783 $2,008,218 $81,076 $141,068
Multiplier 4.57 3.07 2.48 2.27
Source: TEConomy Partners data, analysis of U.S. IMPLAN Input/Output Model, 2016.
Figure 5Economic Impacts of the U.S. Bioscience Industry, 2016
Direct Impact Total Impact
1.74MEmployment
Employment 8.0M
Wages & Benefit $558B
Economic Output $2.0T
State & Local Taxes $81B
Federal Taxes $141BSource: TEConomy Partners data, analysis using IMPLAN U.S. Input/Output Model, 2016.

14
Industrial Biotechnology and the Biobased Economy
Bioscience innovation at work expanding markets for sustainable industrial products, demonstrating commercial success, and presenting opportunities for U.S. companies and rural America to seize upon.
The authors of this report have long recognized the challenges of fully capturing and including all relevant bioscience-related industrial activities in a definition that is constrained by the limitations of federal industrial classifications (industry NAICS codes). The biosciences and biotechnologies have been at the leading edge of new product development and commercial markets within existing industries that government classifications often cannot isolate or stay ahead of. As a result, for comparable state-by-state comparisons, the industrial definition utilized in this report undoubtedly undercounts the full extent of bioscience-related activities.
One area where TEConomy has worked closely with BIO for this study is recognizing and examining the rising importance and economic contributions of the industrial biosciences, or the “biobased economy”. Significant components of the biobased economy that are definable using NAICS codes are included within the TEConomy/BIO industrial definition, including certain feedstocks and ethanol production. However, much of the biobased activity is often captured within much larger, traditional petroleum-based product, agricultural production and other NAICS categories. For example, individual companies have had success with producing biobased plastics for a variety of applications (e.g., Polylactic Acid or PLA), but those specific companies are included among thousands of U.S. fossil fuel plastics producers. Within some sectors, TEConomy has been able to estimate national biobased employment and establishments, due to the availability of federal product-level data at a national, but not state level. These data, along with key findings from national and international assessments conducted by BIO, USDA and others are included here.
BIO defines the biobased economy as “the entire value chain of producing consumer goods from biological feedstocks and processes.”2 This value chain uses renewable resources or gases—such as biomass, algae or methane—as feedstock, instead of fossil fuel resources and is driven by increasing recognition of the need for, and value in, the sustainable sourcing of materials. The biobased economy is enabled by industrial biotechnology, a set of tools and technologies that leverage natural
2 Biotechnology Innovation Organization, “The U.S. Biobased Economy: Economic Impact” Fact Sheet, 2018.
• Biomass• Algae• Methane• Waste and Off-gases
• Synthetic Biology• Enzymes• Biorefining• Gene editing
Industrial Biotech• Sustainable Fuels• Chemicals• Polymers• Food Ingredients
ProductsFeedstock
The Biobased Economy
Source: Biotechnology Innovation Organization.

15
INVESTMENT, INNOVATION AND JOB CREATION IN A GROWING U.S. BIOSCIENCE INDUSTRY
characteristics of microbes and enzymes as well as thermochemical processes via biorefining to translate biomass, carbon and biobased waste streams and off-gases into chemicals for industrial and consumer products.
Biobased products and applications are all around us and include transportation fuels, renewable specialty and commodity chemicals and power generation. Value-added renewable chemicals can be used to produce food, solvents, adhesives, cosmetics, personal care products and polymers for plastics and packaging.
The U.S. Department of Agriculture’s BioPreferred® Program, developed with the goal of increasing market opportunities for biobased products, has commissioned studies to measure the economic impact of the renewable chemicals and biobased product industry’s contribution to the U.S. economy. The most recent study3 has included impacts through seven primary sectors:
The study for USDA found the biobased products industry contributed $393 billion in total value added and 4.2 million jobs to the nation’s economy in 2014, when accounting for not only the direct industry contributions but also the “spillover” indirect and induced impacts. The USDA’s figures do not count direct or indirect economic activity from biofuel production.
The industry’s value chain originates from dedicated energy crops and operates through different types of biorefining approaches to produce industrial products and consumer goods that generate environmental, economic and other benefits. With agriculture at the heart of this materials sourcing comes numerous economic benefits and returns to rural America via existing and new markets and uses for agricultural products and rurally sourced biomass as feedstocks. Economic benefits to rural communities add to the overall value proposition for biobased industrial development through job creation.
The 2016 USDA study includes measuring the economic impacts to states, with leading states in direct employment reflecting top agricultural, chemical and other production states largely in the South and Midwest. The top 10 states in terms of direct jobs include: California, North Carolina, Texas, Georgia, Pennsylvania, Wisconsin, Ohio, New York, Alabama and Florida.
While technological and other developmental challenges remain—such as where to source biomass, further reducing processing costs and integrating products to consumers—the promise of industrial biotechnology and biobased products is exciting. The cost-competitiveness of biomass feedstocks, initial commercial successes of products, the prospects for novel performance characteristics of renewable chemicals and research investments underway point to accelerating growth opportunities. Lux Research estimates that venture capitalists invested $5.3 billion in biobased materials and renewable chemicals from 2010 through 2015.4 BCC Research has a strong outlook for biobased products markets and
3 United States Department of Agriculture, “An Economic Impact Analysis of the U.S. Biobased Products Industry,” 2016.
4 Lux Research (2016). Show Me the Money: Where Is Venture Capital Placing Bets in Biobased? http://members.luxresearchinc.com/research/report/21604
“Globally, the biotechnology sector is a driver of the ‘fourth industrial revolution,’ and presents an incredible opportunity for American farmers and rural communities to thrive at the forefront of innovation.”
—USDA Task Force on Agriculture and Rural Prosperity,
Report to the President of the United States
• Agriculture and forestry• Biorefining• Biobased chemicals
• Enzymes• Bioplastic bottles and
packaging
• Forest products • Textiles

16
opportunities, with expectations for 8.9 percent compound annual growth through 2021 projecting the global market for bioproducts to reach nearly $715 billion.5
TEConomy’s analysis of biobased products’ share of economic activity and corresponding national establishment and employment estimates within several industry NAICS classifications is presented below. These industries include both biobased and non-biobased products and several are emerging toward greater biobased products in a substantial manner. The total estimated biobased establishments and employment, just among these industries, total 292 and 15,835, respectively. TEConomy and BIO will continue to monitor these industry sectors and their embedded biobased production into the future for potential inclusion in the industrial biosciences definition used for state reporting.
Table 4U.S. Biobased Product Share and Associated Establishments and Employment of Manufacturing Industries
NAICS Code
NAICS TitleShare of U.S.
Establish-ments
Estimated Estabs. Assoc. with Biobased
Products, 2016
Share of U.S. Employees
Estimated Employment
Assoc. with Biobased Products,
2016Biobased Product Title
325194
Cyclic crude, intermediate and gum and wood chemical manufacturing
48% 43 44% 1,388Gum/wood chemicals,
incl. wood distillation products
325199
All other basic organic chemical manufacturing
16% 122 17% 6,415
Total, all product codes below
Fatty acids (produced for sale as such)
Bulk pesticides and other bulk synthetic organic agricultural chemicals, excluding preparations
Industrial organic flavor oil mixtures and blends
Natural organic chemicals
325220Artificial and synthetic fibers and filaments manufacturing 9% 20 11% 2,820
Rayon, acetate and lyocell manufactured fibers
325520Adhesive manufacturing
4% 27 6% 1,296Natural base glues and adhesives
326150
Urethane and other foam product (except polystyrene) manufacturing
9% 80 11% 3,917Products made of foam other than polystyrene or polyurethane, including
phenolics, vinyl and cellulose acetate, etc.
Source: TEConomy analysis of U.S. Census Bureau’s Economic Census; Bureau of Labor Statistics, QCEW data.
Note: Other manufacturing industries were considered for this analysis and not included here as their biobased product categories were either not disclosed by the Census Bureau or the share of biobased activity was 1 percent or less.
5 BCC Research, Biorefinery Products: Global Markets, March 2017.

17
INVESTMENT, INNOVATION AND JOB CREATION IN A GROWING U.S. BIOSCIENCE INDUSTRY
State-by-State and Metropolitan Area Bioscience Industry Key Findings and HighlightsThe nation’s bioscience industry extends to every
state, with a well-distributed geographic presence.
The importance of the industry as a job generator and
economic driver is evident as a majority of states have
a specialized concentration of jobs6 in at least one
bioscience subsector. In fact, the number of states
with a niche industry specialization has increased from
32 two years ago to 38 today. Likewise, the industry
is an important economic engine for the nation’s
metropolitan regions.
Highlights of state industry performance include:
• Thirty-eight states and Puerto Rico have
a specialization in at least one of the five
bioscience subsectors in 2016. These include: { 18 states specialized in Agricultural
Feedstock & Industrial Biosciences { 11 states and Puerto Rico specialized in
Bioscience-related Distribution { 12 states and Puerto Rico specialized in
Drugs & Pharmaceuticals { 14 states and Puerto Rico specialized in
Medical Devices & Equipment { 11 states and Puerto Rico specialized in
Research, Testing & Medical Laboratories
• New Jersey and Puerto Rico stand out as the
only states that are specialized in 4 of the 5
bioscience subsectors.
• Over the 2014 to 2016 period, 41 states
experienced job growth in the bioscience
industry.
6 State and regional location quotients (LQs) measure the degree of job concentration within the region relative to the nation. States or regions with an LQ greater than 1.0 are said
to have a concentration in the subsector. When the LQ is significantly above average, 1.20 or greater, the state is said to have a “specialization” in the subsector.

18
Figure 6Change in Bioscience Employment by State, 2001-16 and 2014-16
Job Gain of 5,000 or more
Job Gain of 1,000 to 4,999
Job Gain of 1 to 999
Unchanged or Job Loss of -1 to -999
Job Loss of -1,000 or more
Job Gain of 5,000 or more
Job Gain of 1,000 to 4,999
Job Gain of 1 to 999
Unchanged or Job Loss of -1 to -999
Job Loss of -1,000 or more
2001-16
2014-16
19
INVESTMENT, INNOVATION AND JOB CREATION IN A GROWING U.S. BIOSCIENCE INDUSTRY
Highlights of metropolitan area industry performance include:
• The industry is well distributed across the
nation’s metropolitan areas with 213 of the
nation’s 383 metro regions (nearly 56 percent)
having a specialized employment concentration
in at least one bioscience subsector.
• Twenty-six metro regions have a specialized
concentration in at least three bioscience
subsectors. These local areas span every region
of the country, are varied in size and include
(number of specializations in parentheses): { Boulder, CO (4) { Indianapolis-Carmel-Anderson, IN (4) { Lafayette-West Lafayette, IN (4) { Lincoln, NE (4) { Madison, WI (4) { Morgantown, WV (4) { Norwich-New London, CT (4) { Raleigh, NC (4) { Ames, IA (3) { Auburn-Opelika, AL (3) { Bloomington, IN (3) { Boston-Cambridge-Newton, MA-NH (3) { Durham-Chapel Hill, NC (3) { Greensboro-High Point, NC (3) { Iowa City, IA (3) { Kalamazoo-Portage, MI (3) { Lebanon, PA (3) { Logan, UT-ID (3) { Memphis, TN-MS-AR (3) { Salt Lake City, UT (3) { San Diego-Carlsbad, CA (3) { San Francisco-Oakland-Hayward, CA (3) { Santa Cruz-Watsonville, CA (3) { Syracuse, NY (3) { Trenton, NJ (3) { Worcester, MA-CT (3)
Table 5 summarizes and highlights state employment
specializations and those states that grew across each
major industry subsector during the 2014 to 2016
period. More on leading states and individual state
performance, from both an industrial and innovation
ecosystem perspective, is provided in the later
sections to this report.

20
Table 5State Specializations and Job Growth by Bioscience Subsector, 2016
State
Agricultural Feedstock &
Industrial Biosci-ences
Drugs & Pharmaceuticals
Medical Devices & Equipment
Research, Testing & Medical
Laboratories
Bioscience- Related
Distribution
Special- ization,
2016
Growth, 2014-16
Special- ization,
2016
Growth, 2014-16
Special- ization,
2016
Growth, 2014-16
Special- ization,
2016
Growth, 2014-16
Special- ization,
2016
Growth, 2014-16
AL
AK
AZ
AR
CA
CO
CT
DE
DC
FL
GA
HI
ID
IL
IN
IA
KS
KY
LA
ME
MD
MA
MI
MN
MS
MO
MT
NE
NV

21
INVESTMENT, INNOVATION AND JOB CREATION IN A GROWING U.S. BIOSCIENCE INDUSTRY
Table 5State Specializations and Job Growth by Bioscience Subsector, 2016
State
Agricultural Feedstock &
Industrial Biosci-ences
Drugs & Pharmaceuticals
Medical Devices & Equipment
Research, Testing & Medical
Laboratories
Bioscience- Related
Distribution
Special- ization,
2016
Growth, 2014-16
Special- ization,
2016
Growth, 2014-16
Special- ization,
2016
Growth, 2014-16
Special- ization,
2016
Growth, 2014-16
Special- ization,
2016
Growth, 2014-16
NH
NJ
NM
NY
NC
ND
OH
OK
OR
PA
PR
RI
SC
SD
TN
TX
UT
VT
VA
WA
WV
WI
WY
Note: Solid dots represent either a specialization where state location quotient >=1.20 or employment growth > 0%.
Source: TEConomy Partners analysis of U.S. Bureau of Labor Statistics, QCEW data; enhanced file from IMPLAN.
Continued


23
THE INNOVATION ECOSYSTEM FOR THE U.S. BIOSCIENCE INDUSTRY
The industry-focused outcomes examined in the
previous section largely describe a thriving national
bioscience sector that is growing high-quality jobs.
Look deeper, however, and much of the success of the
industry, both past and present, is built upon a high-
functioning national ecosystem that supports both
basic and applied research and development with the
appropriate resources, protects intellectual property,
and allocates capital to promising new, emerging
and existing businesses. Each of these elements,
combined with the appropriate access to and pipeline
for talent at all skill levels, combine to determine
hard-earned economic outcomes and benefits, as
well as the products and services that improve lives.
This ecosystem and industry success cannot be taken
for granted, particularly in a high-stakes, globally
competitive environment.
This section examines the national trends for four
key elements of the industry’s unique innovation
ecosystem.
R&D Funding and Expenditures: Ecosystem Bolstered by Increasing NIH BudgetsFederal funding for bioscience-related research is a
critical element to advance a science-driven industry.
Several agencies fund life sciences research at U.S.
colleges and universities, with the National Institutes
of Health (NIH) recognized as the “gold standard”
for the largest component of bioscience research—
biomedical. NIH also funds research at hospitals and
other biomedical research institutions. According to
NIH, it currently invests $37 billion in annual research,
with a majority of that funding awarded to the external
Bioscience Innovation Ecosystem, Featured Measures
• NIH Funding• Academic Bioscience R&D Expenditures• Bioscience Patents• Bioscience Venture Capital Investments

24
research community and a smaller fraction invested in
internal research. According to NIH:
“More than 80% of the NIH’s funding is awarded
through almost 50,000 competitive grants to more
than 300,000 researchers at more than 2,500
universities, medical schools and other research
institutions in every state and around the world.” 7
While the role of federal research is well understood
as vital to the biosciences, a new study finds that
NIH-funding contributed to published scientific re-
search associated with every new medicine approved
by the Food and Drug Administration (FDA) over the
2010 through 2016 period.8 The study, conducted
by a team at Bentley University, focused on more than
$100 billion in grant-funded research invested by the
NIH that ultimately helped lead to the 210 new medi-
cines approved during the 6-year period. The authors
find that more than 90 percent of this activity was in
basic research related to biological targets rather than
specific therapeutics, thus emphasizing the impor-
tance not only of applied but also complementary
basic research for drug development.
For several years, concerns have been raised
regarding declining and/or flat NIH research budgets
and the subsequent effects on academic and other
research. Fortunately for the bioscience community,
NIH funding is back on the rise. After peaking in 2003,
and excluding one-time federal ARRA stimulus funding
in 2009 and 2010, the overall NIH budget has seen
year-to-year declines or been flat with no substantial
increase until 2016. Budget increases have been
sustained each of the last three years, with FY 2016-
7 See: https://www.nih.gov/about-nih/what-we-do/budget#note
8 Cleary, et al, “Contribution of NIH funding to new drug approvals 2010–2016,” Proceedings of the National Academy of Sciences, February 12, 2018.
9 AAAS R&D report series, based on OMB data, agency budget documents and information from agency budget offices. FY 2018 figures are omnibus-enacted amounts. Accessed
from AAAS at: https://www.aaas.org/page/historical-trends-federal-rd
18 R&D budgets increasing an average of 4.8 percent
annually, though still well below the double-digit
budget increases seen in the late 1990s and early
2000s.9
The recent NIH budget increases have translated
into a steadily growing funding base for extramural
research awards (Figure 7). Since 2014, awards have
increased by nearly $4.1 billion or 18.5 percent.
Figure 7National Institutes of Health Awards, FY 2011-17 ($ in billions)
0 5 10 15 20 25 30
2017
2016
2015
2014
2013
2012
2011
$22.1
$22.3
$23.6
$23.8
$22.9
$24.6
$26.2
Source: TEConomy Partners analysis of National Institutes of Health RePORT data.
NIH research funding directly impacts trends in
bioscience-related academic research, as health
sciences represents a majority (53 percent) of these
expenditure totals. The 2016 TEConomy/BIO report
had found a slow-growth situation for academic
bioscience R&D expenditures, affected in part by the
trends in NIH funding, but bolstered by increases in
25
INVESTMENT, INNOVATION AND JOB CREATION IN A GROWING U.S. BIOSCIENCE INDUSTRY
other funding sources, namely from the institutions
themselves, industry and state and local governments.
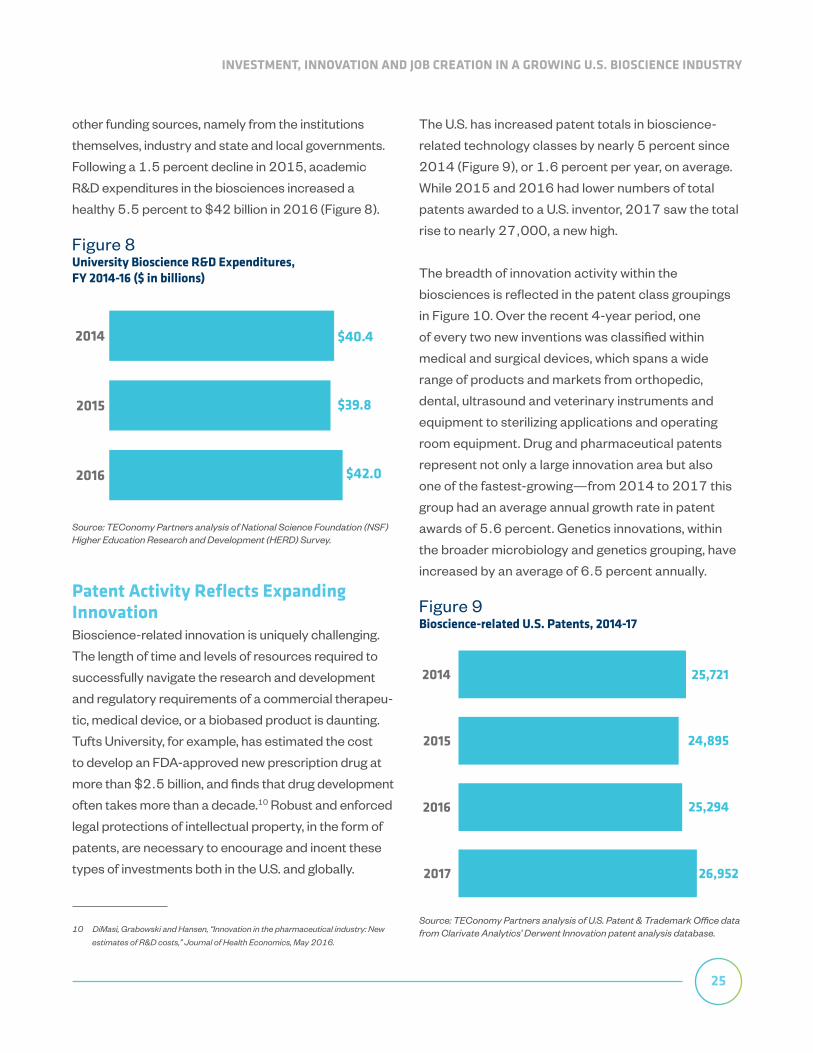
Following a 1.5 percent decline in 2015, academic
R&D expenditures in the biosciences increased a
healthy 5.5 percent to $42 billion in 2016 (Figure 8).
Figure 8University Bioscience R&D Expenditures, FY 2014-16 ($ in billions)
$40.4
$39.8
$42.02016
2015
2014
Source: TEConomy Partners analysis of National Science Foundation (NSF) Higher Education Research and Development (HERD) Survey.
Patent Activity Reflects Expanding InnovationBioscience-related innovation is uniquely challenging.
The length of time and levels of resources required to
successfully navigate the research and development
and regulatory requirements of a commercial therapeu-
tic, medical device, or a biobased product is daunting.
Tufts University, for example, has estimated the cost
to develop an FDA-approved new prescription drug at
more than $2.5 billion, and finds that drug development
often takes more than a decade.10 Robust and enforced
legal protections of intellectual property, in the form of
patents, are necessary to encourage and incent these
types of investments both in the U.S. and globally.
10 DiMasi, Grabowski and Hansen, “Innovation in the pharmaceutical industry: New
estimates of R&D costs,” Journal of Health Economics, May 2016.
The U.S. has increased patent totals in bioscience-
related technology classes by nearly 5 percent since
2014 (Figure 9), or 1.6 percent per year, on average.
While 2015 and 2016 had lower numbers of total
patents awarded to a U.S. inventor, 2017 saw the total
rise to nearly 27,000, a new high.
The breadth of innovation activity within the
biosciences is reflected in the patent class groupings
in Figure 10. Over the recent 4-year period, one
of every two new inventions was classified within
medical and surgical devices, which spans a wide
range of products and markets from orthopedic,
dental, ultrasound and veterinary instruments and
equipment to sterilizing applications and operating
room equipment. Drug and pharmaceutical patents
represent not only a large innovation area but also
one of the fastest-growing—from 2014 to 2017 this
group had an average annual growth rate in patent
awards of 5.6 percent. Genetics innovations, within
the broader microbiology and genetics grouping, have
increased by an average of 6.5 percent annually.
Figure 9 Bioscience-related U.S. Patents, 2014-17
0 5000 10000 15000 20000 25000 30000
2017
2016
2015
2014 25,721
24,895
25,294
26,952
Source: TEConomy Partners analysis of U.S. Patent & Trademark Office data from Clarivate Analytics’ Derwent Innovation patent analysis database.

26
Figure 10Bioscience-related U.S. Patents by Segment, Cumulative 2014-17
0 10000 20000 30000 40000 50000 60000
Microbiology & Genetics
Medical & Surgical Devices
Drugs & Pharmaceuticals
Biological Sampling & Analysis
Bioinformatics & Health IT
Biochemistry
Agricultural Bioscience 6,706
3,630
17,706
10,153
12,855
266
51,48310,153
Microbiology &Genetics
Medical &Surgical Devices
Drugs &Pharmaceuticals
BiologicalSampling & Analysis
Bioinformatics &Health IT
Biochemistry
AgriculturalBioscience
Source: TEConomy Partners analysis of U.S. Patent & Trademark Office data from Clarivate Analytics’ Derwent Innovation patent analysis database.
Venture Capital Investments in the Biosciences Reach New Highs Access to capital is especially vital for R&D-intensive
bioscience companies facing long time horizons to
guide innovations through to commercial outcomes
and steady revenues. In particular, seed-stage and
early-stage companies require funding, often in
multiple tranches or rounds to sustain their product
development as well as to conduct the rigorous pre-
clinical and clinical testing required to meet industry
regulations.
More than $66 billion in venture capital was invested
in bioscience companies in the 2014 through 2017
period (Figure 11). It is common to see year-to-year
variability in the levels of investments, but there has
been an upward trend in industry investing with new
highs reached in the biosciences in 2015 (at $17.0
billion) and then again in 2017 when nearly $20.1
billion was invested. After reaching the $10 billion
threshold back in 2007 at the peak of the prior
expansion, the biosciences did not again surpass this
milestone until 2013. It then took just 4 years to reach
$20 billion, a new high for the industry.
The recent increases in dollar volumes directed
toward bioscience companies coincide, however, with
greater overall VC investments in U.S. companies.
Since 2001 the biosciences have averaged 25
percent of total venture investments, but in the
recent 4-year period the industry’s share has been
lower at 21 percent, reflecting greater resources
directed toward IT companies in particular. Likewise,
biosciences’ share of all VC deal activity (number of
deals) has averaged 19 percent since 2001, but in
recent years this average declined to 15 percent.
Figure 11Bioscience-related Venture Capital Investments, 2014-17 ($ in millions)
0 5000 10000 15000 20000 25000
2017
2016
2015
2014 $14,571
$17,023
$14,494
$20,080
Source: TEConomy Partners analysis of data from PitchBook Data, Inc.
Industry investments broken out by company stage
show that a majority of the $66.2 billion invested (55
percent) has gone to later-stage bioscience companies
during the recent 4-year period. This is essentially the
same share that has been allocated to the later stage

27
INVESTMENT, INNOVATION AND JOB CREATION IN A GROWING U.S. BIOSCIENCE INDUSTRY
bioscience investments, on average, since 2001
(56.5 percent) and this share had been rising—peaking
in 2014 with 65 percent of investments in the later
stage companies. In 2016 and 2017, however,
the share of funding to earlier stage companies
increased and in 2017 the earlier-stage funding
instead accounted for a majority, 54 percent, the first
observation of a majority since 2001. Though one or
two observations does not necessarily indicate a trend,
it will be important to track this improved situation for
earlier-stage companies’ access to risk capital.
About one-third of industry VC funding was invested in
biotechnology companies over the last 4 years (Figure
12). Companies engaged in drug discovery and
delivery received $13.4 billion or 20 percent of the
industry’s total. Health technologies, which includes
companies with IT and other electronic applications
11 AgFunder AgriFood Tech Investing Report, Mid-year Review 2017.
such as enterprise and electronic medical records
systems, reached $8.1 billion during this period.
Investments in ag biotech are included within
agricultural chemicals and biofuels categories, but
areas such as animal health and animal biotechnology
are captured across other groupings including
biotechnology, pharmaceuticals and the various
medical device categories. A separate source
for investments in a wide range of “AgriFood”
technologies, AgFunder, has seen a rebound and rise
in private funding for new firms through the first half of
2017 after a dip in 2016.11 AgFunder tracks a broad
range of firms deploying technologies on farms, in the
agricultural supply chain, among retailers and those
used by consumers.
Table 6U.S. Bioscience Venture Capital Investments by Stage, 2014-2017
Stage Number of Deals Number of Companies
Total VC Investments
($ Millions)
Average Per Deal ($ Millions)
Average Investment Per
Company ($ Millions)
Pre-seed 1,756 1,329 $136 $0.08 $0.10
Angel 1,586 1,252 $3,182 $2.01 $2.54
Seed 807 688 $1,272 $1.58 $1.85
Early Stage 1,967 1,489 $25,035 $12.73 $16.81
Later Stage 1,816 1,169 $36,544 $20.12 $31.26
Total 7,932 4,762 $66,169 $8.34 $13.90
Note: Company totals by stage will not sum to the total as individual companies progress in their stage and often receive multiple investments during a multi-year time frame. Pre-Seed stage includes accelerator, incubator and even crowdfunding-based sources.
Source: TEConomy Partners analysis of PitchBook Data, Inc.

28
Figure 12Bioscience-related Venture Capital Investments by Segment, 2014-17 ($ in millions)
Therapeutic Devices
AgriculturalChemicals $130
Biofuels $675
DiagnosticEquipment $3,636
HealthcareDistributors $54
Laboratory Services(Healthcare) $572
Medical Supplies $461
MonitoringEquipment $2,550
Other Biosciencesand Healthcare $1,571
Pharmaceuticals $2,114
Surgical Devices $4,554
$5,250
Drug Discoveryand Delivery $13,383
HealthcareTechnology Systems $8,141
Biotechnology $23,076
Source: TEConomy Partners analysis of data from PitchBook Data, Inc.
The performance of and situation for the bioscience
innovation ecosystem is quite positive in this latest
assessment of selected elements. In recent years,
the ecosystem has seen rising NIH budgets and an
increase in academic R&D, growth in patent activity
and record levels of private investments in the industry
are helping to contribute to advancing innovation
and industry growth. The U.S., however, cannot be
complacent. The international competition for the
biosciences is fierce. This ecosystem can be fragile,
affected by economic cycles, and key components
such as federal funding are subject to political shifts
and budget constraints.

29
STATE AND METROPOLITAN AREA PERFORMANCE
This section provides an in-depth examination of
employment trends for states among each of the five
major bioscience subsectors. Data were tabulated for
each state, the District of Columbia and Puerto Rico,
and for every U.S. Metropolitan Statistical Area (MSA)
to determine the size and relative job concentration
within each subsector. In addition, employment growth
and loss were calculated to highlight recent trends.
The key metrics used in this section include:
• Employment size measures the absolute level
of jobs within each region.
{ To allow for meaningful comparisons,
each region’s share of total U.S. subsector
employment was analyzed. States with 5
percent or more of national employment
are designated “large”; states with more
than 3 percent but less than 5 percent are
referred to as “sizable.” { For metropolitan regions, a table is included
for each subsector presenting the top 25
metropolitan regions in employment.
• Employment concentration is a useful
way in which to gauge the relative size of a
region’s subsectors relative to the national
average. While employment size reveals the
largest geographic components, employment
concentration can reveal the relative importance
of the subsectors to a regional or state economy.
{ State and regional location quotients (LQs)
measure the degree of job concentration
within the region relative to the nation.
States or regions with an LQ greater than
1.0 are said to have a concentration in
the subsector. When the LQ is significantly
above average, 1.20 or greater, the state
is said to have a “specialization” in the
subsector. { For metropolitan regions, a table
is provided presenting the top 15
metropolitan areas according to LQs,
based on the size of the region (either small,
medium or large).

30
• The level of employment growth or loss over
the 2014 to 2016 period provides a way to
measure the performance of a state’s bioscience
sector. In this analysis, job growth or loss was
measured by absolute employment gains or
losses, as percentage changes may overstate
trends in those states with a smaller subsector
employment base.

31
INVESTMENT, INNOVATION AND JOB CREATION IN A GROWING U.S. BIOSCIENCE INDUSTRY
Agricultural Feedstock & Industrial Biosciences The agricultural feedstock and industrial biosciences subsector applies life sciences knowledge, biochemistry and biotechnologies to the processing and production of agricultural goods as well as organic and agricultural chemicals. The subsector also includes activities around the production of biofuels and feedstocks for biobased polymers.12
Examples of Products• Fertilizers, pesticides, herbicides,
fungicides and agricultural microbials• Corn and soybean oil• Ethanol and biodiesel fuels• Organic chemicals made from renewable
resources or through biological processes• Polymers, plastics and textiles synthesized
from plant-based feedstock or through biological processes
• Biocatalysts• Biobased ingredients for cosmetics, personal
care products, flavors and fragrances
12 For further information and context regarding this subsector, please also see the
discussion regarding Industrial Biotechnology and the Biobased Economy in the
previous section of this report.
Examples of Companies• Amyris• BASF Enzymes• Bayer CropScience• DSM• Corteva
Agriscience• DuPont Industrial
Biosciences• Evolva
• Genus• Intrexon• Monsanto• Novozymes• Poet• Scotts Miracle-Gro• Simplot Plant
Sciences• Syngenta
States that are Both Large and Specialized*• Illinois• Iowa• Indiana
*States are listed in descending order by subsector employment levels.
Large (5% or more)
Sizable (3% to 4.9%)
Small (1% to 2.9%)
Undersized (0% to 0.9%)
State Share of Total U.S. Employment2016
Specialized (L.Q.>1.20)
Concentrated (1.00<L.Q.<1.20)
Expanded (0.80<L.Q.<1.00))
Under Average (L.Q.<0.80)
Employment Concentration Relative to the U.S.2016
Job Gain of 500 or more
Job Gain of 1 to 499
Unchanged or Job Loss of -1 to -499
Job Loss of -500 or more
Employment Gains and Losses2014-2016

32
Table 8Metropolitan Statistical Areas with the Largest Employment Levels in Agricultural Feedstock and Industrial Biosciences, 2016
Metropolitan Statistical Area 2016 Employment
Decatur, IL 5,114
Houston-The Woodlands-Sugar Land, TX 2,136
Lakeland-Winter Haven, FL 1,642
Chicago-Naperville-Elgin, IL-IN-WI 1,399
Baton Rouge, LA 1,126
Cedar Rapids, IA 1,125
Tampa-St. Petersburg-Clearwater, FL 1,092
Indianapolis-Carmel-Anderson, IN 1,056
New Orleans-Metairie, LA 1,003
Memphis, TN-MS-AR 879
Sioux City, IA-NE-SD 868
Omaha-Council Bluffs, NE-IA 704
St. Louis, MO-IL 697
Kansas City, MO-KS 686
Peoria, IL 623
New York-Newark-Jersey City, NY-NJ-PA 621
Dallas-Fort Worth-Arlington, TX 607
Charleston, WV 586
Lafayette-West Lafayette, IN 559
Columbus, OH 548
Des Moines-West Des Moines, IA 536
Madison, WI 498
Phoenix-Mesa-Scottsdale, AZ 460
Los Angeles-Long Beach-Anaheim, CA 441
Orlando-Kissimmee-Sanford, FL 426
Table 7States with Large and Specialized Employment in Agricultural Feedstock and Industrial Biosciences, 2016
State Establishments, 2016
Employment, 2016
Location Quotient, 2016
Share of U.S. Employment
Illinois 82 8,529 2.97 12.5%
Iowa 125 7,952 10.85 11.7%
Indiana 50 3,599 2.46 5.3%
Agricultural Feedstock & Industrial BiosciencesState Leaders & Highlights
Employment Size: Employment is relatively concentrated in the top 11 states, which account for 68 percent of employment in this subsector. Those 11 states are:
• Large States: Illinois, Iowa, Texas, Florida, Indiana
• Sizable States: California, Ohio, Nebraska, Louisiana, Missouri, North Carolina
Employment Concentration: Eighteen states have a specialized concentration of jobs in the agricultural feedstock and industrial biosciences subsector, more than for any other subsector. These concentrations are in the Midwest and South.
• Specialized States: Iowa, Nebraska, South Dakota, Illinois, Louisiana, Idaho, Indiana, Wyoming, North Dakota, West Virginia, Missouri, Kansas, Alabama, Mississippi, Oklahoma, Arkansas, Minnesota, Ohio
• Concentrated States: North Carolina, Florida, Wisconsin
Employment Growth: Over the 2014 to 2016 period, 27 states experienced some increase in subsector employment, with Ohio, West Virginia and Wisconsin experiencing the largest gains.
Large and Specialized States: Three states have both high employment and a specialized concentration of jobs in agricultural feedstock and industrial biosciences (Table 7).

33
INVESTMENT, INNOVATION AND JOB CREATION IN A GROWING U.S. BIOSCIENCE INDUSTRY
Table 9Metropolitan Statistical Areas with the Highest Location Quotients in Agricultural Feedstock and Industrial Biosciences, by size of MSA, 2016
Metropolitan Statistical Area Location Quotient 2016 Employment
Large MSAs (Total Private Employment Greater than 250,000Baton Rouge, LA 6.23 1,126New Orleans-Metairie, LA 3.71 1,003Des Moines-West Des Moines, IA 3.06 536Omaha-Council Bluffs, NE-IA 3.00 704Madison, WI 2.89 498Memphis, TN-MS-AR 2.88 879Fresno, CA 2.19 387Indianapolis-Carmel-Anderson, IN 2.12 1,056Dayton, OH 1.86 328Tampa-St. Petersburg-Clearwater, FL 1.71 1,092Knoxville, TN 1.67 306Toledo, OH 1.56 230Houston-The Woodlands-Sugar Land, TX 1.48 2,136Kansas City, MO-KS 1.36 686Wichita, KS 1.18 170Medium MSAs (Total Private Employment Between 75,000 and 250,000)Sioux City, IA-NE-SD 19.81 868Cedar Rapids, IA 15.98 1,125Lakeland-Winter Haven, FL 15.51 1,642Charleston, WV 11.85 586Peoria, IL 7.20 623Lubbock, TX 5.49 350Fayetteville, NC 4.13 211Mobile, AL 3.85 324Evansville, IN-KY 3.52 275Stockton-Lodi, CA 3.00 341Jackson, MS 2.84 336Beaumont-Port Arthur, TX 2.72 212Greeley, CO 2.71 130Brownsville-Harlingen, TX 2.34 146Yakima, WA 2.29 122Small MSAs (Total Private Employment Less than 75,000)Decatur, IL 200.85 5,114Danville, IL 15.76 197Mankato-North Mankato, MN 15.32 407St. Joseph, MO-KS 15.27 412Decatur, AL 14.98 377Lafayette-West Lafayette, IN 13.68 559Enid, OK 12.83 169Grand Island, NE 10.79 220Hanford-Corcoran, CA 8.41 152Kankakee, IL 7.98 168Muskegon, MI 5.80 185Pocatello, ID 5.77 86Florence-Muscle Shoals, AL 5.65 144Lima, OH 5.30 136Sierra Vista-Douglas, AZ 4.93 63

34
Drugs & Pharmaceuticals The drugs and pharmaceuticals subsector produces commercially available medicinal and diagnostic substances. The subsector is generally characterized by large multinational firms heavily engaged in R&D and manufacturing activities to bring drugs to market.
Examples of Products• Biopharmaceuticals• Vaccines• Targeted disease therapeutics• Tissue and cell culture media• Dermatological/topical treatments• Diagnostic substances• Animal vaccines and therapeutics
Examples of Companies• Acorda
Therapeutics• Alkermes• Alnylam
Pharmaceuticals• Amgen• Bayer• Biogen• Eli Lilly and
Company
• GlaxoSmithKline• Novo Nordisk• Pfizer• Roche Group-
Genentech• Sangamo
Therapeutics• Vertex
Pharmaceuticals
States that are Both Large and Specialized*• California• New Jersey• North Carolina• Illinois• Pennsylvania• Indiana
*States are listed in descending order by subsector employment levels.
Large (5% or more)
Sizable (3% to 4.9%)
Small (1% to 2.9%)
Undersized (0% to 0.9%)
State Share of Total U.S. Employment2016
Specialized (L.Q.>1.20)
Concentrated (1.00<L.Q.<1.20)
Expanded (0.80<L.Q.<1.00))
Under Average (L.Q.<0.80)
Employment Concentration Relative to the U.S.2016
Job Gain of 500 or more
Job Gain of 1 to 499
Unchanged or Job Loss of -1 to -499
Job Loss of -500 or more
Employment Gains and Losses2014-2016
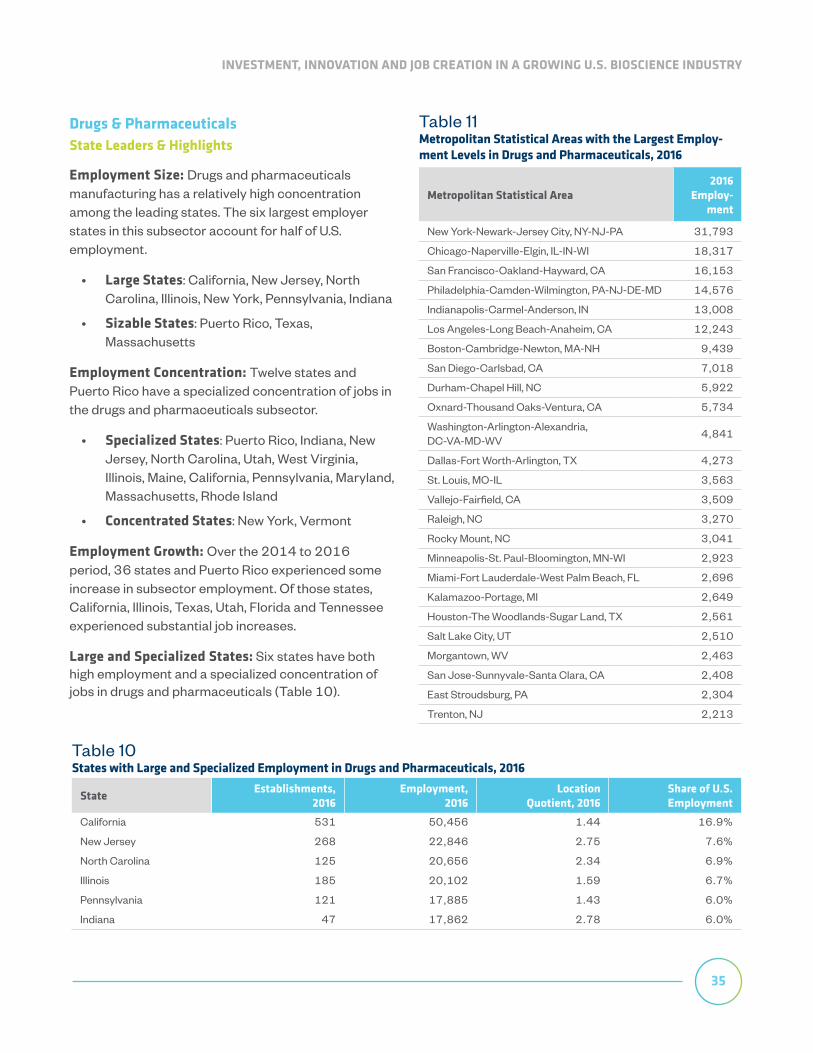
35
INVESTMENT, INNOVATION AND JOB CREATION IN A GROWING U.S. BIOSCIENCE INDUSTRY
Drugs & PharmaceuticalsState Leaders & Highlights
Employment Size: Drugs and pharmaceuticals manufacturing has a relatively high concentration among the leading states. The six largest employer states in this subsector account for half of U.S. employment.
• Large States: California, New Jersey, North Carolina, Illinois, New York, Pennsylvania, Indiana
• Sizable States: Puerto Rico, Texas, Massachusetts
Employment Concentration: Twelve states and Puerto Rico have a specialized concentration of jobs in the drugs and pharmaceuticals subsector.
• Specialized States: Puerto Rico, Indiana, New Jersey, North Carolina, Utah, West Virginia, Illinois, Maine, California, Pennsylvania, Maryland, Massachusetts, Rhode Island
• Concentrated States: New York, Vermont
Employment Growth: Over the 2014 to 2016 period, 36 states and Puerto Rico experienced some increase in subsector employment. Of those states, California, Illinois, Texas, Utah, Florida and Tennessee experienced substantial job increases.
Large and Specialized States: Six states have both high employment and a specialized concentration of jobs in drugs and pharmaceuticals (Table 10).
Table 10States with Large and Specialized Employment in Drugs and Pharmaceuticals, 2016
State Establishments, 2016
Employment, 2016
Location Quotient, 2016
Share of U.S. Employment
California 531 50,456 1.44 16.9%
New Jersey 268 22,846 2.75 7.6%
North Carolina 125 20,656 2.34 6.9%
Illinois 185 20,102 1.59 6.7%
Pennsylvania 121 17,885 1.43 6.0%
Indiana 47 17,862 2.78 6.0%
Table 11Metropolitan Statistical Areas with the Largest Employ-ment Levels in Drugs and Pharmaceuticals, 2016
Metropolitan Statistical Area2016
Employ-ment
New York-Newark-Jersey City, NY-NJ-PA 31,793
Chicago-Naperville-Elgin, IL-IN-WI 18,317
San Francisco-Oakland-Hayward, CA 16,153
Philadelphia-Camden-Wilmington, PA-NJ-DE-MD 14,576
Indianapolis-Carmel-Anderson, IN 13,008
Los Angeles-Long Beach-Anaheim, CA 12,243
Boston-Cambridge-Newton, MA-NH 9,439
San Diego-Carlsbad, CA 7,018
Durham-Chapel Hill, NC 5,922
Oxnard-Thousand Oaks-Ventura, CA 5,734
Washington-Arlington-Alexandria, DC-VA-MD-WV
4,841
Dallas-Fort Worth-Arlington, TX 4,273
St. Louis, MO-IL 3,563
Vallejo-Fairfield, CA 3,509
Raleigh, NC 3,270
Rocky Mount, NC 3,041
Minneapolis-St. Paul-Bloomington, MN-WI 2,923
Miami-Fort Lauderdale-West Palm Beach, FL 2,696
Kalamazoo-Portage, MI 2,649
Houston-The Woodlands-Sugar Land, TX 2,561
Salt Lake City, UT 2,510
Morgantown, WV 2,463
San Jose-Sunnyvale-Santa Clara, CA 2,408
East Stroudsburg, PA 2,304
Trenton, NJ 2,213

36
Table 12Metropolitan Statistical Areas with the Highest Location Quotients in Drugs and Pharmaceuticals, by size of MSA, 2016
Metropolitan Statistical Area Location Quotient 2016 Employment
Large MSAs (Total Private Employment Greater than 250,000Oxnard-Thousand Oaks-Ventura, CA 8.61 5,734Indianapolis-Carmel-Anderson, IN 6.19 13,008San Francisco-Oakland-Hayward, CA 3.30 16,153Madison, WI 2.88 2,098Raleigh, NC 2.69 3,270Albany-Schenectady-Troy, NY 2.63 2,182Philadelphia-Camden-Wilmington, PA-NJ-DE-MD 2.49 14,576San Diego-Carlsbad, CA 2.46 7,018Worcester, MA-CT 2.41 1,879Chicago-Naperville-Elgin, IL-IN-WI 1.91 18,317Greenville-Anderson-Mauldin, SC 1.88 1,505Salt Lake City, UT 1.81 2,510Buffalo-Cheektowaga-Niagara Falls, NY 1.74 1,904Boston-Cambridge-Newton, MA-NH 1.69 9,439New York-Newark-Jersey City, NY-NJ-PA 1.68 31,793Medium MSAs (Total Private Employment Between 75,000 and 250,000)Vallejo-Fairfield, CA 13.05 3,509Durham-Chapel Hill, NC 10.48 5,922Kalamazoo-Portage, MI 8.92 2,649Trenton, NJ 5.10 2,213Santa Cruz-Watsonville, CA 3.75 778Waco, TX 3.63 843Provo-Orem, UT 3.26 1,502Ogden-Clearfield, UT 3.06 1,423Lincoln, NE 3.01 1,029Portland-South Portland, ME 2.83 1,572Boulder, CO 2.83 1,003Norwich-New London, CT 2.71 610Burlington-South Burlington, VT 2.52 614Huntsville, AL 2.47 1,008Fort Collins, CO 2.42 703Small MSAs (Total Private Employment Less than 75,000)Rocky Mount, NC 26.72 3,041East Stroudsburg, PA 20.84 2,304Morgantown, WV 20.19 2,463Kankakee, IL 15.02 1,339Greenville, NC 12.73 1,603Bloomington, IN 10.66 1,285St. Joseph, MO-KS 10.07 1,149Logan, UT-ID 8.84 957Athens-Clarke County, GA 7.31 1,111Lebanon, PA 5.89 593Iowa City, IA 3.93 581Harrisonburg, VA 3.86 497Lafayette-West Lafayette, IN 3.66 632Terre Haute, IN 3.53 476Cleveland, TN 3.42 322

37
INVESTMENT, INNOVATION AND JOB CREATION IN A GROWING U.S. BIOSCIENCE INDUSTRY
Medical Devices & Equipment Firms in the medical device and equipment subsector produce a variety of biomedical instruments and other healthcare products and supplies for diagnostics, surgery, patient care and laboratories. The subsector is continually advancing the application of electronics and information technologies to improve and automate testing and patient care capabilities.
Examples of Products• Bioimaging equipment• Surgical supplies and instruments• Orthopedic/prosthetic implants and devices• Genomic sequencing equipment• Automated external defibrillators (AEDs)• Vascular stents and other implantable devices• Dental instruments and orthodontics
Examples of Companies• 3M Health Care• Becton, Dickinson
and Co.• Boston Scientific
Corp.• Cook Medical• DuPuy Synthes• GE Healthcare
• Medtronic• Philips Healthcare• Regenesis
Biomedical• Siemens Medical
Solutions• Stryker• Zimmer
States that are Both Large and Specialized*• California• Minnesota• Massachusetts
*States are listed in descending order by subsector employment levels.
Large (5% or more)
Sizable (3% to 4.9%)
Small (1% to 2.9%)
Undersized (0% to 0.9%)
State Share of Total U.S. Employment2016
Specialized (L.Q.>1.20)
Concentrated (1.00<L.Q.<1.20)
Expanded (0.80<L.Q.<1.00))
Under Average (L.Q.<0.80)
Employment Concentration Relative to the U.S.2016
Job Gain of 500 or more
Job Gain of 1 to 499
Unchanged or Job Loss of -1 to -499
Job Loss of -500 or more
Employment Gains and Losses2014-2016

38
Medical Devices & EquipmentState Leaders & Highlights
Employment Size: The medical device subsector has a well-distributed geographic footprint, with large or sizable states in every region. The top ten employing states continue to account for almost 60 percent of employment in this subsector.
• Large States: California, Minnesota, Massachusetts
• Sizable States: Indiana, Florida, Pennsylvania, Puerto Rico, Illinois, New Jersey, New York, Utah, Michigan, Texas
Employment Concentration: Fourteen states and Puerto Rico have a specialized concentration of jobs in the medical device and equipment subsector.
• Specialized States: Puerto Rico, Minnesota, Utah, Massachusetts, Indiana, Delaware, Connecticut, Nebraska, South Dakota, Colorado, California, New Hampshire, Wisconsin, Vermont, New Jersey
• Concentrated States: Tennessee, Pennsylvania, Rhode Island, Michigan
Employment Growth: Over the 2014 to 2016 period, 37 states, Puerto Rico and D.C. experienced some increase in subsector employment with 9 states having substantial increases led by California, Minnesota, Utah, Illinois and Arkansas.
Large and Specialized States: Three states have both high employment and a specialized concentration of jobs in medical devices and equipment (Table 13).
Table 14Metropolitan Statistical Areas with the Largest Employ-ment Levels in Medical Devices and Equipment, 2016
Metropolitan Statistical Area 2016 Employment
Los Angeles-Long Beach-Anaheim, CA 27,935
Minneapolis-St. Paul-Bloomington, MN-WI 26,440
Boston-Cambridge-Newton, MA-NH 16,567
New York-Newark-Jersey City, NY-NJ-PA 15,954
Chicago-Naperville-Elgin, IL-IN-WI 12,391
Salt Lake City, UT 8,948
San Francisco-Oakland-Hayward, CA 8,841
San Diego-Carlsbad, CA 8,668
San Jose-Sunnyvale-Santa Clara, CA 7,621
Milwaukee-Waukesha-West Allis, WI 6,199
Philadelphia-Camden-Wilmington, PA-NJ-DE-MD
6,019
Memphis, TN-MS-AR 5,876
Pittsburgh, PA 5,072
Seattle-Tacoma-Bellevue, WA 4,722
Denver-Aurora-Lakewood, CO 4,645
Miami-Fort Lauderdale-West Palm Beach, FL 4,609
Cleveland-Elyria, OH 4,530
Providence-Warwick, RI-MA 4,045
Dallas-Fort Worth-Arlington, TX 4,028
Bloomington, IN 3,934
Portland-Vancouver-Hillsboro, OR-WA 3,850
Raleigh, NC 3,417
Tampa-St. Petersburg-Clearwater, FL 3,264
Boulder, CO 3,085
New Haven-Milford, CT 3,025
Table 13States with Large and Specialized Employment in Medical Devices and Equipment, 2016
State Establishments, 2016
Employment, 2016
Location Quotient, 2016
Share of U.S. Employment
California 1,183 62,686 1.49 17.4%
Minnesota 343 27,555 3.80 7.7%
Massachusetts 288 21,378 2.35 6.0%

39
INVESTMENT, INNOVATION AND JOB CREATION IN A GROWING U.S. BIOSCIENCE INDUSTRY
Table 15Metropolitan Statistical Areas with the Highest Location Quotients in Medical Devices and Equipment, by size of MSA, 2016
Metropolitan Statistical Area Location Quotient 2016 Employment
Large MSAs (Total Private Employment Greater than 250,000Minneapolis-St. Paul-Bloomington, MN-WI 5.45 26,440Salt Lake City, UT 5.31 8,948Memphis, TN-MS-AR 3.75 5,876New Haven-Milford, CT 3.23 3,025Milwaukee-Waukesha-West Allis, WI 2.85 6,199San Jose-Sunnyvale-Santa Clara, CA 2.66 7,621San Diego-Carlsbad, CA 2.50 8,668Boston-Cambridge-Newton, MA-NH 2.45 16,567Raleigh, NC 2.31 3,417Providence-Warwick, RI-MA 2.28 4,045Worcester, MA-CT 2.10 1,994Syracuse, NY 2.04 1,475Bridgeport-Stamford-Norwalk, CT 1.96 2,203Rochester, NY 1.85 2,347Madison, WI 1.85 1,638Medium MSAs (Total Private Employment Between 75,000 and 250,000)Kalamazoo-Portage, MI 8.19 2,953Boulder, CO 7.16 3,085Gainesville, FL 5.18 1,452Santa Rosa, CA 4.85 2,491Ocala, FL 3.52 898Naples-Immokalee-Marco Island, FL 3.37 1,288Ogden-Clearfield, UT 3.36 1,902Reading, PA 2.95 1,319Colorado Springs, CO 2.75 1,774Santa Maria-Santa Barbara, CA 2.58 1,230Ann Arbor, MI 2.43 931Saginaw, MI 2.27 502Utica-Rome, NY 2.27 606Huntington-Ashland, WV-KY-OH 2.26 715Manchester-Nashua, NH 2.02 1,079Small MSAs (Total Private Employment Less than 75,000)Bloomington, IN 26.85 3,934Flagstaff, AZ 19.35 2,562Niles-Benton Harbor, MI 12.25 1,934Glens Falls, NY 10.42 1,349State College, PA 7.21 963Sumter, SC 6.77 612Staunton-Waynesboro, VA 3.16 370Decatur, IL 2.80 366Sheboygan, WI 2.76 439Dover, DE 2.66 402Logan, UT-ID 2.58 340Lebanon, PA 2.50 306Auburn-Opelika, AL 2.27 284Michigan City-La Porte, IN 2.25 226Bellingham, WA 1.60 340

40
Research, Testing & Medical Laboratories The research, testing and medical laboratories sub-sector includes firms performing a range of activities; from highly research-oriented companies working to develop and commercialize new industrial biotechnol-ogies, drug discovery/delivery systems and gene and cell therapies, to more service-oriented firms engaged in medical and other life sciences testing services.
Examples of Products• Stem cell/regenerative research• Molecular diagnostics and testing• Preclinical drug development• Drug delivery systems• DNA synthesis• Research/laboratory support services
Examples of Companies• Albany Molecular
Research• Algenol Biotech• Bayer CropScience• Charles River
Laboratories• Complete Genomics• Corteva Agriscience• Covance• IQVIA
• Laboratory Corp. of America
• Monsanto• NeoGenomics• Pacific Biomarkers• Pathway Genomics• Quest Diagnostics• Syngenta• Synthetic Genomics
States that are Both Large and Specialized*• California• Massachusetts• New Jersey• Pennsylvania• North Carolina
*States are listed in descending order by subsector employment levels.
Large (5% or more)
Sizable (3% to 4.9%)
Small (1% to 2.9%)
Undersized (0% to 0.9%)
State Share of Total U.S. Employment2016
Specialized (L.Q.>1.20)
Concentrated (1.00<L.Q.<1.20)
Expanded (0.80<L.Q.<1.00))
Under Average (L.Q.<0.80)
Employment Concentration Relative to the U.S.2016
Job Gain of 500 or more
Job Gain of 1 to 499
Unchanged or Job Loss of -1 to -499
Job Loss of -500 or more
Employment Gains and Losses2014-2016

41
INVESTMENT, INNOVATION AND JOB CREATION IN A GROWING U.S. BIOSCIENCE INDUSTRY
Research, Testing & Medical LaboratoriesState Leaders & Highlights
Employment Size: With the largest employment base and the highest overall growth rate among the five subsectors, the research, testing and medical labs subsector has a significant presence in most states. The top ten employer states make up 64 percent of national employment, and the top 15 all have more than 10,000 subsector jobs.
• Large States: California, Massachusetts, New Jersey, Pennsylvania, North Carolina
• Sizable States: New York, Florida, Texas, Maryland, Illinois
Employment Concentration: Eleven states and Puerto Rico have a specialized concentration of jobs in the research, testing and medical laboratories subsector.
• Specialized States: Massachusetts, New Jersey, Maryland, Delaware, North Carolina, Puerto Rico, New Mexico, California, Utah, Pennsylvania, Washington, Kansas
• Concentrated States: District of Columbia, Connecticut, Maine
Employment Growth: Over the 2014 to 2016 period, 39 states experienced some increase in subsector employment. Nineteen states experienced substantial increases led by California, New Jersey, Massachusetts, Pennsylvania, Texas, North Carolina and Florida.
Large and Specialized States: Five states have both high employment and a specialized concentration of jobs in research, testing and medical laboratories (Table 16).
Table 16States with Large and Specialized Employment in Research, Testing and Medical Laboratories, 2016
State Establishments, 2016
Employment, 2016
Location Quotient, 2016
Share of U.S. Employment
California 4,221 94,348 1.47 17.2%
Massachusetts 1,637 51,202 3.69 9.4%
New Jersey 1,072 35,600 2.34 6.5%
Pennsylvania 1,303 29,588 1.29 5.4%
North Carolina 1,862 28,896 1.79 5.3%
Table 17Metropolitan Statistical Areas with the Largest Employment Levels in Research, Testing and Medical Laboratories, 2016
Metropolitan Statistical Area2016
Employ-ment
New York-Newark-Jersey City, NY-NJ-PA 47,090
Boston-Cambridge-Newton, MA-NH 46,375
San Francisco-Oakland-Hayward, CA 25,099
San Diego-Carlsbad, CA 24,647
Philadelphia-Camden-Wilmington, PA-NJ-DE-MD 24,048
Los Angeles-Long Beach-Anaheim, CA 22,569
Washington-Arlington-Alexandria, DC-VA-MD-WV 19,504
Chicago-Naperville-Elgin, IL-IN-WI 16,402
San Jose-Sunnyvale-Santa Clara, CA 11,750
Durham-Chapel Hill, NC 9,765
Seattle-Tacoma-Bellevue, WA 9,699
Miami-Fort Lauderdale-West Palm Beach, FL 8,835
Baltimore-Columbia-Towson, MD 8,343
Minneapolis-St. Paul-Bloomington, MN-WI 8,143
Dallas-Fort Worth-Arlington, TX 7,361
Kansas City, MO-KS 7,229
Phoenix-Mesa-Scottsdale, AZ 7,062
Salt Lake City, UT 6,661
Atlanta-Sandy Springs-Roswell, GA 6,503
St. Louis, MO-IL 6,380
Houston-The Woodlands-Sugar Land, TX 6,270
Pittsburgh, PA 5,765
Raleigh, NC 5,381
Detroit-Warren-Dearborn, MI 5,031
Madison, WI 4,976

42
Table 18Metropolitan Statistical Areas with the Highest Location Quotients in Research, Testing and Medical Laboratories, by size of MSA, 2016
Metropolitan Statistical Area Location Quotient 2016 Employment
Large MSAs (Total Private Employment Greater than 250,000San Diego-Carlsbad, CA 4.44 24,647Boston-Cambridge-Newton, MA-NH 4.27 46,375Madison, WI 3.52 4,976San Francisco-Oakland-Hayward, CA 2.64 25,099San Jose-Sunnyvale-Santa Clara, CA 2.56 11,750Salt Lake City, UT 2.47 6,661Raleigh, NC 2.27 5,381Albuquerque, NM 2.15 3,011Philadelphia-Camden-Wilmington, PA-NJ-DE-MD 2.11 24,048Worcester, MA-CT 2.06 3,132Greensboro-High Point, NC 2.00 2,944Kansas City, MO-KS 1.74 7,229Washington-Arlington-Alexandria, DC-VA-MD-WV 1.73 19,504Albany-Schenectady-Troy, NY 1.63 2,623Baltimore-Columbia-Towson, MD 1.60 8,343Medium MSAs (Total Private Employment Between 75,000 and 250,000)Durham-Chapel Hill, NC 8.88 9,765Trenton, NJ 5.52 4,661Kennewick-Richland, WA 4.55 2,106Wilmington, NC 4.13 1,944Barnstable Town, MA 2.15 825Boulder, CO 2.13 1,469Spokane-Spokane Valley, WA 1.86 1,639Ann Arbor, MI 1.67 1,026St. Cloud, MN 1.41 599Norwich-New London, CT 1.33 582Gainesville, FL 1.31 590Lincoln, NE 1.30 867South Bend-Mishawaka, IN-MI 1.29 715Huntsville, AL 1.27 1,012Peoria, IL 1.23 873Small MSAs (Total Private Employment Less than 75,000)Burlington, NC 11.63 2,924Ames, IA 3.19 462California-Lexington Park, MD 2.51 347Morgantown, WV 2.38 565Mount Vernon-Anacortes, WA 2.34 420Ithaca, NY 1.76 367Logan, UT-ID 1.59 334Columbia, MO 1.52 483Santa Fe, NM 1.25 271Lafayette-West Lafayette, IN 1.23 414Manhattan, KS 1.22 162Lewiston, ID-WA 1.17 122Brunswick, GA 1.14 182Bangor, ME 1.12 300Idaho Falls, ID 1.09 283

43
INVESTMENT, INNOVATION AND JOB CREATION IN A GROWING U.S. BIOSCIENCE INDUSTRY
Bioscience-Related Distribution The bioscience-related distribution subsector coordinates the delivery of bioscience-related products spanning pharmaceuticals, medical devices and equipment and ag biotech products. The subsector leverages and deploys specialized technologies such as cold storage, highly regulated product monitoring, RFID technologies and automated drug distribution systems.
Examples of ProductsDistribution of:
• Pharmaceuticals• Vaccines• Plasma/blood• Veterinary medicines• Surgical instruments/appliances• Diagnostic and bioimaging equipment• Plant seeds• Agricultural chemicals
Examples of Companies• Amerisource-
Bergen• Cardinal Health• Henry Schein• McKesson• Monsanto• Omnicare• Owens & Minor
• Park Seed• Patterson
Companies• PharMerica
Corporation• Seminis Vegetable
Seeds• Wilbur-Ellis
States that are Both Large and Specialized*• Florida• Illinois
*States are listed in descending order by subsector employment levels.
Large (5% or more)
Sizable (3% to 4.9%)
Small (1% to 2.9%)
Undersized (0% to 0.9%)
State Share of Total U.S. Employment2016
Specialized (L.Q.>1.20)
Concentrated (1.00<L.Q.<1.20)
Expanded (0.80<L.Q.<1.00))
Under Average (L.Q.<0.80)
Employment Concentration Relative to the U.S.2016
Job Gain of 500 or more
Job Gain of 1 to 499
Unchanged or Job Loss of -1 to -499
Job Loss of -500 or more
Employment Gains and Losses2014-2016

44
Bioscience-Related DistributionState Leaders & Highlights
Employment Size: The distribution subsector’s large employment base is well distributed across the U.S., with the top 10 employing states making up just 55 percent of all employment and every state having a presence to some degree.
• Large States: California, Texas, Florida, Illinois
• Sizable States: New Jersey, New York, Ohio, Pennsylvania, North Carolina, Georgia
Employment Concentration: Eleven states and Puerto Rico have a specialized concentration of jobs in the bioscience-related distribution subsector.
• Specialized States: Nebraska, South Dakota, Puerto Rico, North Dakota, Iowa, New Jersey, Tennessee, Illinois, Florida, Kentucky, Colorado, Minnesota
• Concentrated States: North Carolina, Wisconsin, Ohio, Utah, Delaware, California, Georgia, Indiana
Employment Growth: Over the 2014 to 2016 period, 33 states experienced some increase in subsector employment with 13 states having substantial increases led by Texas, California, Georgia, Massachusetts, Florida, New Jersey and Ohio.
Large and Specialized States: Two states have both high employment and a specialized concentration of jobs in bioscience-related distribution (Table 19).
Table 20Metropolitan Statistical Areas with the Largest Employ-ment Levels in Bioscience-Related Distribution, 2016
Metropolitan Statistical Area 2016 Employment
New York-Newark-Jersey City, NY-NJ-PA 32,883
Los Angeles-Long Beach-Anaheim, CA 25,251
Chicago-Naperville-Elgin, IL-IN-WI 20,494
Dallas-Fort Worth-Arlington, TX 17,439
Miami-Fort Lauderdale-West Palm Beach, FL 15,595
Philadelphia-Camden-Wilmington, PA-NJ-DE-MD
11,005
Atlanta-Sandy Springs-Roswell, GA 10,633
Houston-The Woodlands-Sugar Land, TX 8,197
Boston-Cambridge-Newton, MA-NH 8,169
Minneapolis-St. Paul-Bloomington, MN-WI 7,908
Phoenix-Mesa-Scottsdale, AZ 6,774
Denver-Aurora-Lakewood, CO 6,692
Columbus, OH 6,092
Riverside-San Bernardino-Ontario, CA 5,624
Detroit-Warren-Dearborn, MI 5,387
Memphis, TN-MS-AR 5,279
San Francisco-Oakland-Hayward, CA 5,225
Seattle-Tacoma-Bellevue, WA 5,132
St. Louis, MO-IL 4,845
San Diego-Carlsbad, CA 4,690
Nashville-Davidson—Murfreesboro—Franklin, TN
4,521
Tampa-St. Petersburg-Clearwater, FL 4,503
Indianapolis-Carmel-Anderson, IN 4,341
Charlotte-Concord-Gastonia, NC-SC 4,333
Cincinnati, OH-KY-IN 4,285
Table 19States with Large and Specialized Employment in Bioscience-Related Distribution, 2016
State Establishments, 2016
Employment, 2016
Location Quotient, 2016
Share of U.S. Employment
Florida 3,018 36,155 1.28 7.7%
Illinois 1,881 26,058 1.31 5.5%

45
INVESTMENT, INNOVATION AND JOB CREATION IN A GROWING U.S. BIOSCIENCE INDUSTRY
Table 21Metropolitan Statistical Areas with the Highest Location Quotients in Bioscience-Related Distribution, by size of MSA, 2016
Metropolitan Statistical Area Location Quotient 2016 Employment
Large MSAs (Total Private Employment Greater than 250,000Memphis, TN-MS-AR 2.48 5,279Des Moines-West Des Moines, IA 2.01 2,454Oxnard-Thousand Oaks-Ventura, CA 1.92 2,112Raleigh, NC 1.85 3,717Columbus, OH 1.79 6,092Miami-Fort Lauderdale-West Palm Beach, FL 1.76 15,595Louisville/Jefferson County, KY-IN 1.63 3,626Jacksonville, FL 1.61 3,667Columbia, SC 1.60 1,886Dallas-Fort Worth-Arlington, TX 1.47 17,439Nashville-Davidson—Murfreesboro—Franklin, TN 1.42 4,521Greensboro-High Point, NC 1.42 1,765Denver-Aurora-Lakewood, CO 1.38 6,692Toledo, OH 1.36 1,392Omaha-Council Bluffs, NE-IA 1.32 2,170Medium MSAs (Total Private Employment Between 75,000 and 250,000)Port St. Lucie, FL 3.54 1,718Naples-Immokalee-Marco Island, FL 2.92 1,519Springfield, IL 2.41 792Provo-Orem, UT 2.11 1,606Visalia-Porterville, CA 1.88 975Trenton, NJ 1.77 1,267Kalamazoo-Portage, MI 1.74 856Fargo, ND-MN 1.58 745Lakeland-Winter Haven, FL 1.55 1,148Fort Collins, CO 1.53 736Greeley, CO 1.49 499Santa Cruz-Watsonville, CA 1.47 502Sioux Falls, SD 1.43 762Stockton-Lodi, CA 1.40 1,111Boulder, CO 1.35 794Small MSAs (Total Private Employment Less than 75,000)Albany, OR 4.61 695El Centro, CA 3.49 627Morgantown, WV 3.32 670Jackson, TN 2.56 534Hammond, LA 2.32 297Ames, IA 2.26 277Jonesboro, AR 2.10 389Bloomington, IN 1.85 369Yuma, AZ 1.67 342Hanford-Corcoran, CA 1.64 207Texarkana, TX-AR 1.59 293Iowa City, IA 1.53 373Grand Island, NE 1.49 212Cape Girardeau, MO-IL 1.40 212Danville, IL 1.36 119


47
THE INNOVATION ECOSYSTEM: STATE PERFORMANCE MEASURES
This section highlights leading states—both overall
and on a per capita basis—across performance
measures for the bioscience industry’s innovation
ecosystem, including:
• National Institutes of Health funding
• Academic bioscience R&D expenditures
• Bioscience-related patents
• Venture capital investments in bioscience
companies
Academic Bioscience R&D ExpendituresAcademic research, funded through federal and
other sources including industry, non-profits and
state and local governments, is a major force for life
sciences innovation. U.S. colleges and universities
spent $42 billion in bioscience-related R&D activities
in 2016. The leading states are generally larger and
home to multiple research universities. Five of these
states exceeded $2 billion in 2016 expenditures—
California, New York, Texas, Pennsylvania and North
Carolina (Table 22). Pennsylvania and Massachusetts
are not only among the leaders in overall size but also
in terms of recent growth.
On a per capita basis, other states emerge among the
leaders including Washington, DC (which includes two
major research universities), Connecticut, Nebraska,
New Hampshire and Iowa (Table 23). Other states
have a very high concentration of their academic R&D
activity focused in the biosciences including Missouri,
Vermont, Arkansas and Connecticut, which all exceed
80 percent of their overall expenditures.

48
Table 22Leading States-Academic Bioscience R&D Expenditures & Growth
Academic Bioscience R&D Expenditure, 2016 Academic Bioscience R&D Growth, 2014-16
Leading States Total R&D Expenditure ($ Thousands) Leading States Growth Rate, %
California $5,539,463 Wyoming 135.2%
New York $4,057,179 Alaska 24.1%
Texas $3,276,218 Colorado 21.8%
Pennsylvania $2,425,134 Montana 18.2%
North Carolina $2,159,908 Nevada 17.8%
Massachusetts $1,723,143 Pennsylvania 17.6%
Maryland $1,708,746 Arizona 15.0%
Illinois $1,429,861 Alabama 14.8%
Ohio $1,344,444 Connecticut 14.6%
Michigan $1,336,071 Massachusetts 13.7%
Source: TEConomy Partners analysis of National Science Foundation (NSF) Higher Education Research and Development (HERD) Survey.
Table 23Leading States-Per Capita and Concentration of Academic Bioscience R&D Expenditures
Academic Bioscience R&D Per Capita, 2016Academic Bioscience Share of
Total Science & Engineering R&D
Leading States $ Per Capita Leading States % Share
District of Columbia $457 Missouri 84.6%
Maryland $284 Vermont 81.8%
Connecticut $256 Arkansas 80.8%
Massachusetts $253 Connecticut 80.2%
North Carolina $213 Kentucky 78.2%
New York $205 North Carolina 75.9%
Pennsylvania $190 Nebraska 75.0%
Nebraska $176 South Carolina 72.6%
New Hampshire $166 Minnesota 71.9%
Iowa $164 Oregon 70.3%
Source: TEConomy Partners analysis of National Science Foundation (NSF) Higher Education Research and Development (HERD) Survey.

49
INVESTMENT, INNOVATION AND JOB CREATION IN A GROWING U.S. BIOSCIENCE INDUSTRY
NIH Funding
The recent growth in NIH budgets and corresponding
research grants represent a welcome infusion to the
innovation ecosystem following many years of flat
or declining federal funding for bioscience research.
Institutions and researchers in seven states exceeded
$1 billion in NIH funding in 2017 (Table 24) and an
eighth state, Washington, was on the cusp. Leading
recipients in smaller states such as Massachusetts
and Maryland are highly concentrated relative to
the state’s population and reach three to five times
the national average ($80 per capita). And while the
original base level of state funding can influence or
overstate recent growth rates, Maryland is again near
the top of the list, rapidly growing a large existing base.
Rhode Island is highly concentrated in funding relative
to its size and is growing rapidly.
Table 24Leading States-NIH Funding
Total NIH Funding, 2017 Per Capita NIH Funding, 2017 NIH Funding Growth, 2014-17
Leading States-NIH Funding
Total Funding ($
Thousands)
Leading States-NIH Funding
$ Per Capita
Leading States-NIH Funding
Growth Rate,
2014-17
California $3,946,355 Massachusetts $396 Wyoming 66.1%
Massachusetts $2,716,744 District of Columbia $328 Maryland 59.4%
New York $2,386,045 Maryland $266 Alaska 55.7%
Pennsylvania $1,672,905 Rhode Island $161 Mississippi 50.9%
Maryland $1,611,923 Connecticut $146 West Virginia 49.2%
North Carolina $1,245,779 Washington $135 Florida 37.4%
Texas $1,160,645 Pennsylvania $131 Virginia 34.6%
Washington $998,184 North Carolina $121 Idaho 32.0%
Illinois $805,535 New York $120 Rhode Island 29.4%
Ohio $754,319 Minnesota $100 Arkansas 29.0%
Source: TEConomy Partners analysis of National Institutes of Health RePORT data.

50
Bioscience-Related Patents
U.S. inventors were associated with nearly 103,000
patents awarded from 2014 through 2017 in
bioscience-related technology classes. California is,
by far, the leading state in patent awards accounting
for nearly one in three patents during the 4-year
period (Table 25). Massachusetts also stands out in
generating close to 12,000 patents and leads among
states in per capita patent awards. Several states not
among the national leaders show innovation strengths
relative to their size including Delaware, Connecticut,
New Hampshire, Rhode Island, Indiana and Maryland.
Table 26 provides insights into the innovation
strengths of leading states. Several states, such as
California, Pennsylvania, Massachusetts, Illinois, New
York and New Jersey are among the leaders in all,
or nearly all categories reflecting varied and wide-
reaching industry and university innovation strengths.
Other states such as Iowa, Indiana, Missouri, North
Carolina, Washington and Wisconsin demonstrate
more focused niche strengths in one or two
predominant technology areas.
Table 25Leading States-Bioscience-Related Patents
Bioscience-Related Patent Totals, 2014-17
Bioscience-Related Patent Distributions
Leading States Count Leading States Per 1M Population
California 30,386 Massachusetts 429
Massachusetts 11,699 Minnesota 309
New Jersey 7,303 Delaware 249
Pennsylvania 7,029 Connecticut 243
New York 6,977 New Hampshire 230
Minnesota 6,813 New Jersey 204
Florida 5,100 California 194
Texas 4,704 Rhode Island 170
Ohio 4,553 Indiana 157
Illinois 4,355 Maryland 153
Source: TEConomy Partners analysis of U.S. Patent & Trademark Office data from Clarivate Analytics’ Derwent Innovation patent analysis database.

51
INVESTMENT, INNOVATION AND JOB CREATION IN A GROWING U.S. BIOSCIENCE INDUSTRY
Table 26Leading States-Bioscience-Related Patents by Class Group, 2014-2017
StateTotal
Bioscience Patents
Agricultural Biosciences Biochemistry
Bioinformat-ics & Health
IT
Biological Sampling &
Analysis
Drugs & Pharmaceu-
ticals
Medical & Surgical Devices
Microbiology & Genetics
CA
FL
IA
IL
IN
MA
MD
MN
MO
NC
NJ
NY
OH
PA
TX
WA
WI
Source: TEConomy Partners analysis of U.S. Patent & Trademark Office data from Clarivate Analytics’ Derwent Innovation patent analysis database.
Note: A shaded circle signifies the state ranks in the top 5 and an open circle signifies the state ranks in the next 5 for that particular patent class.

52
Bioscience Venture Capital Investments
Venture capital investments in U.S. bioscience
companies are rising and reached a new high at
$20 billion in 2017. Despite this expansion, venture
investments continue to be highly concentrated in two
states—California and Massachusetts. Combined,
companies in these states were recipients of nearly
$44 billion in VC investments during the 2014 to
2017 period, capturing 66 percent of the national
total, or $2 out of every $3 invested. Eleven states
have had more than $1 billion in VC investments
during the last four years—the ten states shown in
Table 27 plus New Jersey.
Beyond Massachusetts and California, Washington,
Pennsylvania and Minnesota stand out for attracting
$1 to nearly $2 billion in VC investments relative to
the size of their states.
The leading states in venture capital investments by
industry/technology segment are shown in Table 28.
Massachusetts and California are among the leading
states in nearly all categories. Texas, Pennsylvania and
New York are among the leaders in six (TX, PA) and
five (NY) categories, respectively.
Table 27Leading States in Bioscience Venture Capital Investments
Total Bioscience Venture Capital Investment, 2014-17
Bioscience Venture Capital Distributions
Leading States Total ($ Millions) Leading States $ Per 1M Population
California $28,582 Massachusetts $2,226
Massachusetts $15,270 California $723
New York $2,158 Washington $269
Washington $1,993 Connecticut $250
Pennsylvania $1,778 Colorado $210
Texas $1,591 Minnesota $203
Illinois $1,586 Utah $200
North Carolina $1,368 District of Columbia $159
Colorado $1,180 Maryland $158
Minnesota $1,132 Pennsylvania $139
Source: TEConomy Partners analysis of data from PitchBook Data, Inc.
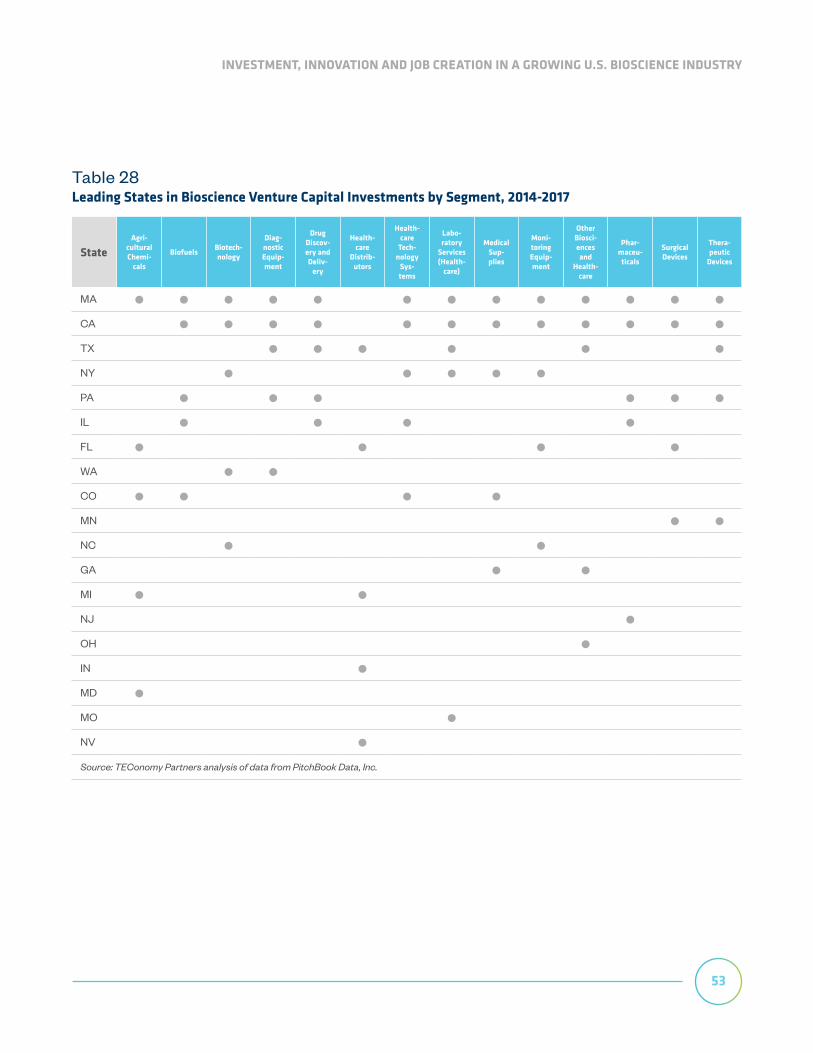
53
INVESTMENT, INNOVATION AND JOB CREATION IN A GROWING U.S. BIOSCIENCE INDUSTRY
Table 28Leading States in Bioscience Venture Capital Investments by Segment, 2014-2017
StateAgri-
cultural Chemi-
cals
Biofuels Biotech-nology
Diag-nostic Equip-ment
Drug Discov-ery and Deliv-
ery
Health-care
Distrib-utors
Health-care
Tech-nology
Sys-tems
Labo-ratory
Services (Health-
care)
Medical Sup-plies
Moni-toring Equip-ment
Other Biosci-ences and
Health-care
Phar-maceu-
ticals
Surgical Devices
Thera-peutic
Devices
MA
CA
TX
NY
PA
IL
FL
WA
CO
MN
NC
GA
MI
NJ
OH
IN
MD
MO
NV
Source: TEConomy Partners analysis of data from PitchBook Data, Inc.

55
APPENDIX: DATA & METHODOLOGY
Industry Employment, Establishments and WagesThe bioscience industry employment analysis in this
report examines national, state and metropolitan area
data and corresponding trends in the biosciences
from 2001 through 2016. For employment analysis,
TEConomy Partners used the Bureau of Labor
Statistics (BLS) Quarterly Census of Employment and
Wages (QCEW) data. The QCEW data provide the most
current, detailed industry employment, establishment
and wage figures available at both a national and
subnational level. TEConomy utilizes an enhanced
version of these data from a private vendor, IMPLAN.
The QCEW program is a cooperative program
involving BLS and the State Employment Security
Agencies. The QCEW program produces a
comprehensive tabulation of employment and
wage information for workers covered by state
unemployment insurance (UI) laws and federal workers
covered by the Unemployment Compensation for
Federal Employees (UCFE) program. Publicly available
files include data on the number of establishments,
monthly employment and quarterly wages, by NAICS
(North American Industry Classification System)
industry, by county and by ownership sector, for the
entire United States. These data are aggregated to
annual levels, to higher industry levels (NAICS industry
groups, sectors and supersectors) and to higher
geographic levels (national, state and metropolitan
statistical area [MSA]).
Since 2001, the QCEW has been producing and
publishing data according to the NAICS. Compared
with the prior classification system—the 1987
Standard Industrial Classification (SIC) system, NAICS
better incorporates new and emerging industries.
Employment, establishment and wage data produced
by the QCEW program for 2001 to present are not
comparable with SIC-based industry data from prior
years. This limits the ability to construct a longer time
series for data analysis; however, 16 years of NAICS-
based data (2001-2016) are now available.
Twenty-four NAICS industries at the most detailed
(6-digit) level make up the TEConomy definition of
the biosciences and its subsectors. These detailed
industries are aggregated up to five major subsectors
of the bioscience industry. Four of the detailed NAICS

56
industries, Testing Laboratories (NAICS 541380); R&D
in the Physical, Engineering and Life Sciences (except
Biotechnology) (NAICS 541712); Drug and Druggists’
Sundries Merchant Wholesalers (NAICS 424210); and
Farm Supplies Merchant Wholesalers (NAICS 424910)
are adjusted in this analysis by TEConomy to include
only the share of these industries directly involved in
biological or other life science activities. To isolate these
relevant life science components, TEConomy used
information and data from the U.S. Census Bureau’s
Economic Census. These shares were updated by
TEConomy for this edition of the biennial report and
applied historically, and therefore data for the relevant
industry subsectors are no longer comparable with
those published in prior reports.

57
INVESTMENT, INNOVATION AND JOB CREATION IN A GROWING U.S. BIOSCIENCE INDUSTRY
Table A-1. The Bioscience Industry, NAICS Definition
Bioscience Subsector NAICS Code NAICS Description
Agricultural Feedstock & Industrial Biosciences
311221 Wet Corn Milling
311224 Soybean and Other Oilseed Processing
325193 Ethyl Alcohol Manufacturing
325311 Nitrogenous Fertilizer Manufacturing
325312 Phosphatic Fertilizer Manufacturing
325314 Fertilizer (Mixing Only) Manufacturing
325320 Pesticide and Other Agricultural Chemical Manufacturing
Drugs & Pharmaceuticals
325411 Medicinal and Botanical Manufacturing
325412 Pharmaceutical Preparation Manufacturing
325413 In-Vitro Diagnostic Substance Manufacturing
325414 Biological Product (except Diagnostic) Manufacturing
Medical Devices & Equipment
334510 Electromedical and Electrotherapeutic Apparatus Manufacturing
334516 Analytical Laboratory Instrument Manufacturing
334517 Irradiation Apparatus Manufacturing
339112 Surgical and Medical Instrument Manufacturing
339113 Surgical Appliance and Supplies Manufacturing
339114 Dental Equipment and Supplies Manufacturing
Research, Testing, & Medical Laboratories
541380* Testing Laboratories
541711 Research and Development in Biotechnology
541712*Research and Development in the Physical, Engineering and Life Sciences (except Biotechnology)
621511 Medical Laboratories
Bioscience-Related Distribution
423450Medical, Dental and Hospital Equipment and Supplies Merchant Wholesalers
424210* Drugs and Druggists’ Sundries Merchant Wholesalers
424910* Farm Supplies Merchant Wholesalers
*Includes only the portion of these industries engaged in relevant life science activities.

58
National and state data were tabulated and presented
in both summary analytical and state profile tables.
Data for Puerto Rico and the District of Columbia are
included in this report at both the “state” and national
level. U.S. employment, establishment and wage
totals in this report reflect the sum of all state data
and include both Puerto Rico and DC. All state, DC
and most data for Puerto Rico are from TEConomy’s
enhanced QCEW file from IMPLAN.
For more information on the BLS Quarterly Census of
Employment and Wages, see http://www.bls.gov/cew/.
Industry Economic Impacts and Employment Multipliers
The economic impact of the U.S. bioscience industry
is estimated using national employment at a detailed
industry sector level as inputs; and was developed
using a custom national Input/Output (I/O) model from
IMPLAN. The IMPLAN model’s data matrices track the
flow of commodities to industries from producers and
institutional consumers within the nation. The data
also model consumption activities by workers, owners
of capital and imports. The inter-industry trade flows
built into the model permit estimating the impacts of
one sector on all other sectors with which it interacts.
The model’s outputs, which are the impacts typically
measured in an economic impact study, are the
expenditure impacts of the bioscience industry. They
quantify direct and indirect job creation, associated
personal incomes, business output and associated
revenues to federal, state and local taxing jurisdictions.
Separately, employment multipliers generated
from IMPLAN’s state level Input/Output models
were used to estimate the employment impact on
all other industries of adding bioscience jobs at the
state level. It is important to note that, like all impact
models, Input/Output models provide an approximate
order-of-magnitude estimate of impacts. State level
multipliers and the resulting estimated employment
impacts are shown in each state profile table for each
major bioscience subsector.
Additional Bioscience Performance Metrics DataAt the national level and for each of the state profiles,
additional key bioscience performance metrics
provide further insights into the current structure,
recent performance and capacity of the state’s
bioscience innovation ecosystem. These metrics and
their data sources are briefly described in the following
paragraphs.
Bioscience Academic R&D ExpendituresBased upon data from the National Science
Foundation’s (NSF) Higher Education Research
and Development Survey, national and state totals
(summation of all state’s responding institutions) are
calculated for FY 2016 (most current year available) as
well as the previous two years (FY 2014 – FY 2015).
Data are provided for total R&D expenditures (including
per capita measures) as well as in chart form for the
bioscience fields including Health Sciences, Biological
and Biomedical Sciences, Agricultural Sciences,
Bio/Biomedical Engineering, Natural Resources and
Conservation and Other Life Sciences.
For more information on the NSF Higher Education
Research and Development Survey, see http://www.
nsf.gov/statistics/srvyherd/.
National Institutes of Health (NIH) FundingNIH extramural funding data for FY 2017 (the most
current full year available) and for previous years
were obtained using the NIH Awards by Location &

59
INVESTMENT, INNOVATION AND JOB CREATION IN A GROWING U.S. BIOSCIENCE INDUSTRY
Organization section within the NIH Research Portfolio
Online Reporting Tool (RePORT) database. Data are
provided for total NIH extramural funding, growth from
FY 2014 through FY 2017 and FY 2017 per capita
measures are also calculated.
For more information on the NIH Awards data, see
http://report.nih.gov/award/index.cfm.
Bioscience Venture Capital InvestmentsVenture capital investments, while not the only source
of equity capital for bioscience firms, are often the
largest and is typically the most publicly known and
reported source of investment funds allowing for
comparability among states.
Venture capital data were collected using the
PitchBook venture capital database capturing all
venture capital (including “Angel” and pre-seed
investment activity) from January 1, 2014 through
December 31, 2017. The analysis includes selected
investments categorized in PitchBook in the
Healthcare industry sector, including all companies
in Healthcare Devices and Supplies, Healthcare
Technology Systems, Pharmaceuticals and
Biotechnology and Other Healthcare. Only Healthcare
Distributors and Laboratory Services companies
are included from PitchBook’s Healthcare Services
industry group; but the analysis excludes hospitals,
clinics, elder care facilities and other healthcare
service companies. Investments in Agricultural
Chemicals within PitchBook’s Materials and Resources
industry sector were also included. Additionally,
specific investments in venture capital deals related
to ethanol/biofuel/biodiesel-related companies were
included from the Alternative Energy Equipment and
Energy Production industry codes located within the
Energy sector in PitchBook.
Bioscience PatentsThe use of patent data provides a surrogate (though
not perfect) approach to understanding those
innovations that bioscience-related industrial
organizations, research institutions and general
inventors deem significant enough to register
and protect. Patents provide some measure of
comparability among regions in one facet of innovation
in terms of activity levels within distinct technology
areas. Furthermore, examining recent patent
activity provides some insight into firms’ recent R&D
investment areas and strategies, and hence, potential
future lines of business.
Each patent document references at least two distinct
entities who are associated with the intellectual
property (IP) that was generated—the inventor(s)
of the patent, or the person(s) who generated the
IP disclosed in the patent, and the assignee(s) of
the patent, or the entity(ies) which currently have
ownership of the IP outlined in the patent. Each patent
can have multiple inventors and assignees, and
multiple inventors are very common. For this analysis,
TEConomy uses the address location of the named
inventor(s) in the analysis of geographic distribution of
bioscience patent areas across states, with the credit
for invention being “shared” across all the unique
states represented by the set of listed inventors in
the patent document. Hence, if a bioscience patent
is invented by individuals in two states, each state
will receive “credit” for generating the patent, but
at a national level the patent is counted only once.
Similarly, when two or more named inventors are from
the same state the patent only gets counted once.
It is important to note that this analysis uses only the
inventors of the patent as a measure of bioscience
innovation activity levels. As companies acquire
60
ownership of IP being generated by others, patents
can be assigned to different geographies without any
addition of significant innovative value to the original
patent. As a result, tracking patent innovation levels
by inventor allows for a more consistent and accurate
assessment of the places where innovative bioscience
IP is being generated by researchers as opposed to
being retained or licensed by companies which may or
may not align with the same geographic context.
USPTO assigns each patent with a specific numeric
major patent “class” as well as supplemental secondary
patent classes which detail the primary technology
areas being documented by the patented IP. These
classes are assigned to patents by dedicated
classification staff who examine the documented IP’s
key focus and end uses. For example, a patent for
a new biopharmaceutical may have a main patent
class detailing the therapeutic activity or formulation
of the drug with supplemental classes documenting
any novel synthesizing or manufacturing processes
critically tied to creation of the drug. The major patent
class and supplemental patent classes are chosen by
the USPTO classification staff during the process of
reviewing patent applications. By combining relevant
patent classes across the wide array of bioscience-
related activity, these class designations allow for
an aggregation scheme that focuses around broad
technology themes that are specific to the biosciences.
TEConomy has grouped US-invented patents into
broader bioscience patent class groups for the
purposes of bioscience innovation trends analysis.
Beginning in 2010, the UPSTO and the European
Patent Office (EPO) began the process of moving
towards a Cooperative Patent Classification (CPC)
system enacted as a harmonization and compatibility
effort to provide consistent technology class
documentation of disclosed IP across international
borders. The new class system uses a structure
that is similar to and complies with the International
Patent Classification (IPC) system but expands on
it in documenting detailed new technology areas.
TEConomy uses this CPC scheme to group US-
invented patents into broader bioscience patent class
groups for the purposes of bioscience innovation
trends analysis.
Patent data were collected using the Clarivate
Analytics’ Derwent Innovation patent analysis
database and includes all granted patents from
January 1, 2014 through December 31, 2017 as
documented by USPTO. Table A-2 provides a listing of
the patent classes and class groups that were used in
this analysis to determine the set of bioscience-related
patents as well as how they are grouped into major
areas of bioscience-related technologies.

61
INVESTMENT, INNOVATION AND JOB CREATION IN A GROWING U.S. BIOSCIENCE INDUSTRY
Table A-2Bioscience-Related Patents—Classes and Groups
Bioscience Patent Class Group Patent Class Patent Class Description
Agricultural Bioscience
A01H New plant varieties, cultivars, genotypes and processes for engineering them
A01NPreservation of human or animal bodies and plants, biocides/pesticides and plant growth regulators
C05B Phosphatic fertilizers
C05C Nitrogenous fertilizers
C05D Inorganic fertilizers
C05F Organic fertilizers
C05G Fertilizer mixtures
Biochemistry
C07D Organic chemistry (heterocyclic compounds)
C07H Sugars and derivatives thereof; nucleosides; nucleotides; nucleic acids
C07J Steroids
C07K Peptides
Bioinformatics & Health ITG06F 19/1, 19/2
Bioinformatics
G06F 19/3
Medical informatics and clinician decision support tools
G06Q 50/22
General health IT systems and software
G06Q 50/24
Patient record data management
Biological Sampling & Analysis
G01N 24 Assays (e.g. immunoassays or enzyme assays)
G01N 25 Screening methods for compounds of potential therapeutic value
G01N 26 Assays involving molecular polymers
G01N 28 Detection or diagnosis of specific diseases
G01N 33 (partial) Investigation and analysis techniques pertaining to specific biological substances
G01R 33 (partial)NMR spectroscopy analysis of biological material (e.g. in vitro testing) and NMR imaging systems
Drugs & Pharmaceuticals
A61K Pharmaceuticals, biopharmaceuticals and biologics
Medical & Surgical Devices
G06K 9 (partial) Microscopic inspection of biological structures
G06T 7 (partial) Biomedical image processing and analysis

62
Table A-2Bioscience-Related Patents—Classes and Groups
Bioscience Patent Class Group Patent Class Patent Class Description
A61B Surgical and diagnostic devices
A61C Dental instruments, implements, tools or methods
A61D Veterinary instruments, implements, tools or methods
A61FOrthopedic and prosthetic equipment, implantable devices (e.g. stents), bandages and first aid devices and other medical supplies
A61GMedical transport devices, operating chairs and tables for medical/dental patient applications
A61H Physical therapy apparatus, artificial respiration
A61JContainers and devices for administering pharmaceuticals, medicine and food and other medical materials; baby comforters
A61LSterilizing/deodorization of materials; chemical materials for bandages, dressings and other surgical articles
A61MDevices for introducing or removing media from the body; devices for producing or ending sleep/stupor
A61N Electrotherapy; magnetotherapy; radiation therapy; ultrasound therapy
Microbiology & Genetics
C12M Enzymology or microbiology equipment and devices
C12N Genetic engineering, culture media and other microbiology methods or compositions
C12P Fermentation or enzyme-related synthesis of chemical compounds
C12Q Measuring or testing processes involving enzymes or microbiology


