Teck 2011 Annual Report
136
Take a closer look. 2011 Annual Report
-
Upload
teck-resources-limited -
Category
Documents
-
view
221 -
download
1
description
Teck is a diversified resource company committed to responsible mining and mineral development with business units focused on copper, steelmaking coal, zinc and energy. We are also a significant producer of specialty metals such as germanium and indium. We actively explore for copper, zinc and gold in the Americas, Asia Pacific, Europe and Africa.
Transcript of Teck 2011 Annual Report

Teck
2011
An
nu
al R
ep
ort Ta
ke
a clo
ser lo
ok
.
Take a closer look.
2011 Annual Report

At Teck, we pay close attention to the details, but never lose sight of the bigger picture.
Take a closer look.
2011 Annual Report
2 Teck 2011 Annual Report
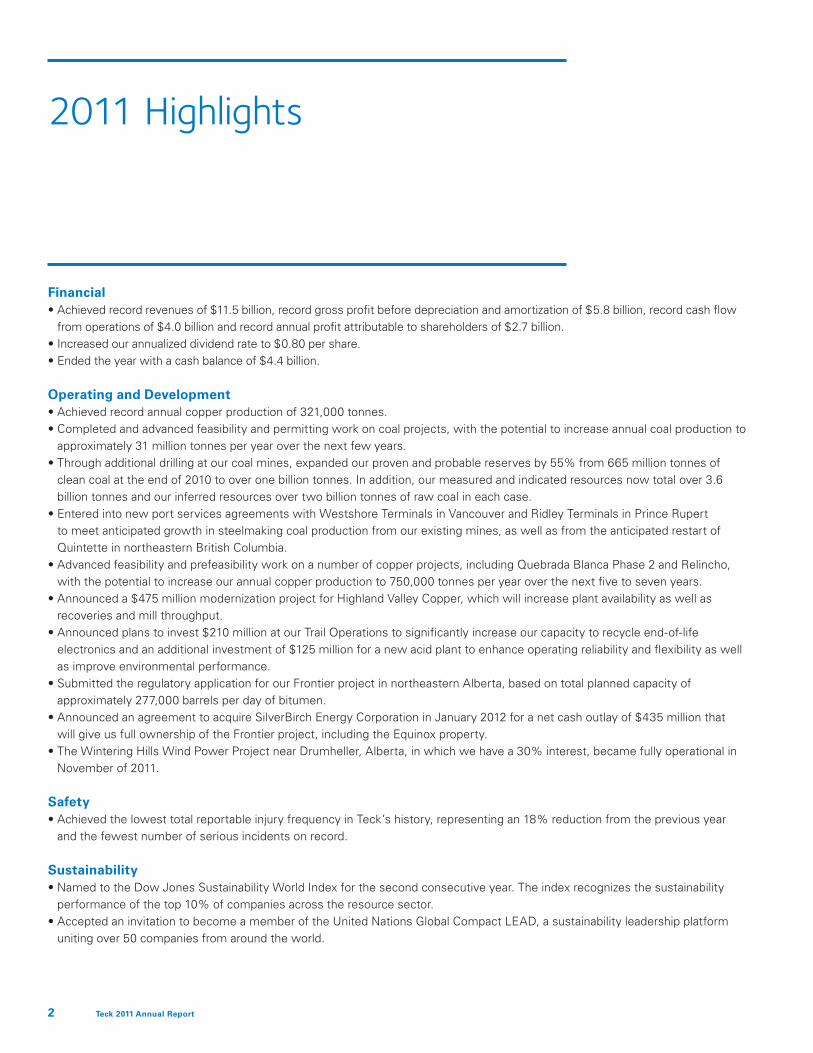
2011 Highlights
Financial•Achieved record revenues of $11.5 billion, record gross profit before depreciation and amortization of $5.8 billion, record cash flow
from operations of $4.0 billion and record annual profit attributable to shareholders of $2.7 billion.•Increased our annualized dividend rate to $0.80 per share. •Ended the year with a cash balance of $4.4 billion.
Operating and Development•Achieved record annual copper production of 321,000 tonnes.•Completed and advanced feasibility and permitting work on coal projects, with the potential to increase annual coal production to
approximately 31 million tonnes per year over the next few years. •Through additional drilling at our coal mines, expanded our proven and probable reserves by 55% from 665 million tonnes of
clean coal at the end of 2010 to over one billion tonnes. In addition, our measured and indicated resources now total over 3.6 billion tonnes and our inferred resources over two billion tonnes of raw coal in each case.
•Entered into new port services agreements with Westshore Terminals in Vancouver and Ridley Terminals in Prince Rupert to meet anticipated growth in steelmaking coal production from our existing mines, as well as from the anticipated restart of Quintette in northeastern British Columbia.
•Advanced feasibility and prefeasibility work on a number of copper projects, including Quebrada Blanca Phase 2 and Relincho, with the potential to increase our annual copper production to 750,000 tonnes per year over the next five to seven years.
•Announced a $475 million modernization project for Highland Valley Copper, which will increase plant availability as well as recoveries and mill throughput.
•Announced plans to invest $210 million at our Trail Operations to significantly increase our capacity to recycle end-of-life electronics and an additional investment of $125 million for a new acid plant to enhance operating reliability and flexibility as well as improve environmental performance.
•Submitted the regulatory application for our Frontier project in northeastern Alberta, based on total planned capacity of approximately 277,000 barrels per day of bitumen.
•Announced an agreement to acquire SilverBirch Energy Corporation in January 2012 for a net cash outlay of $435 million that will give us full ownership of the Frontier project, including the Equinox property.
•The Wintering Hills Wind Power Project near Drumheller, Alberta, in which we have a 30% interest, became fully operational in November of 2011.
Safety•Achieved the lowest total reportable injury frequency in Teck’s history, representing an 18% reduction from the previous year
and the fewest number of serious incidents on record.
Sustainability•Named to the Dow Jones Sustainability World Index for the second consecutive year. The index recognizes the sustainability
performance of the top 10% of companies across the resource sector.•Accepted an invitation to become a member of the United Nations Global Compact LEAD, a sustainability leadership platform
uniting over 50 companies from around the world.

Profit Attributable to Shareholders ($ in billions)
Cash Flow ($ in billions)
$1.6
$0.7
$1.8
$1.8
$2.7
2007 2008 2009 2010 20110
1
2
3
$1.7
$2.1
$3.0 $3
.3
$4.0
2007 2008 2009 2010 20110
1
2
3
4
Global Operations 4
Letter from the Chairman 6
Letter from the CEO 8
Our Business 10
Safety 12
Our People 14
Sustainability 17
Management’s Discussion and Analysis 23
Copper 26
Coal 31
Zinc 33
Energy 36
Exploration 38
Financial Overview 39
Consolidated Financial Statements 58
Board of Directors 127
Officers 130
Corporate Information 132
Revenue ($ in billions)
Table of Contents
Mineral reserve and resource estimates for our properties are disclosed in our most recent Annual Information Form, which is available on our website at www.teck.com, or on the Canadian Securities Administrators website at www.sedar.com and on the EDGAR section of the United States Securities and Exchange Commission (SEC) website at www.sec.gov.
Forward-Looking StatementsThis annual report contains forward-looking statements. Please refer to the caution on forward-looking information on page 57.
All dollar amounts expressed throughout this report are in Canadian dollars unless otherwise noted.
Cover Photo: a rock containing copper and molybdenum from Highland Valley Copper.
$6.2 $6
.7 $7.7
$9.2
$11.
5
2007 2008 2009 2010 20110
2
4
6
8
10
12
Note: Amounts for 2011 and 2010 were prepared in accordance with IFRS. Amounts for prior years were prepared using Canadian GAAP.
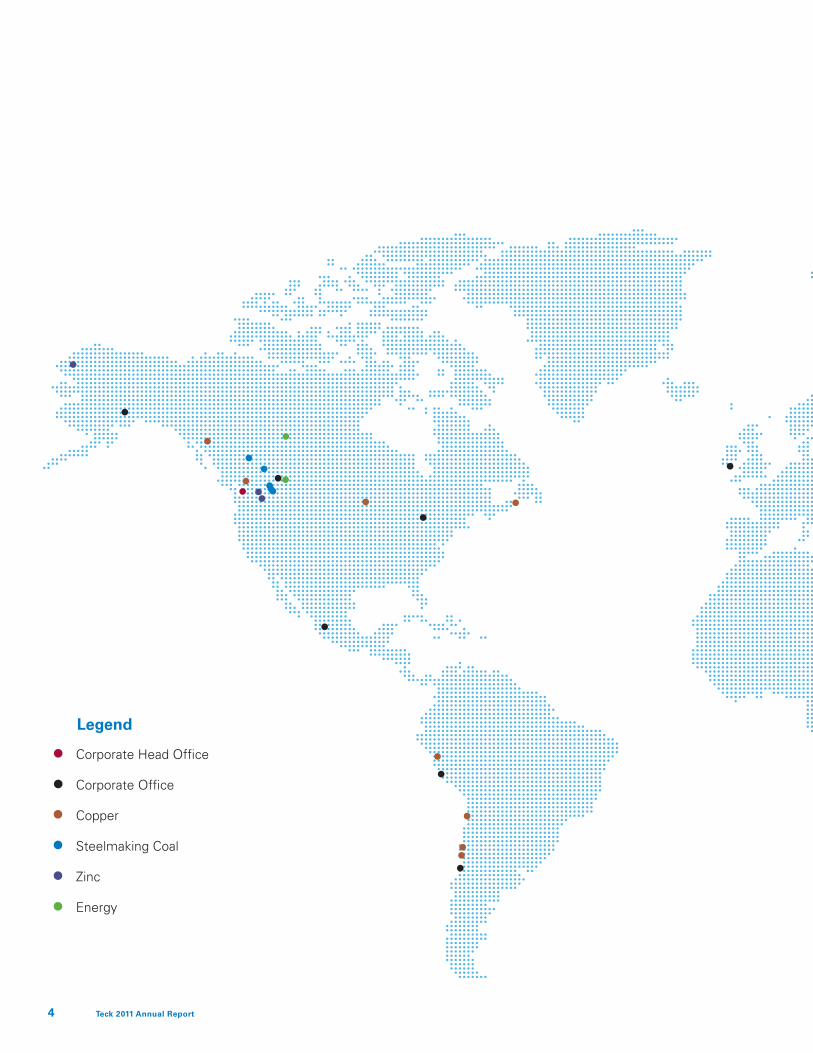
4 Teck 2011 Annual Report
Corporate Head Office
Corporate Office
Copper
Steelmaking Coal
Zinc
Energy
Legend

5
Global OperationsTeck is a diversified natural resource company committed to responsible resource development, with business units focused on copper, steelmaking coal, zinc and energy. We actively explore for copper, zinc and gold in the Americas, Asia Pacific, Europe and Africa.
We are headquartered in Vancouver, Canada. We own or have an interest in 13 mines in Canada, the United States, Chile and Peru, as well as one large metallurgical complex in Canada. We also have corporate, exploration, technology and marketing offices in 15 locations across Asia, Australia, Africa, Europe and the Americas.

6 Teck 2011 Annual Report
Norman B. KeevilChairman of the Board
To the Shareholders:
2011 was another good year for Teck, with strong performances in our mining operations, record profits, a solid financial position at year-end, and a management team and workforce committed to ensuring that Teck is a company we can all be proud to be a part of, whether as shareholders, employees or members of the communities in which we work.
Our coal operations are in good shape, and expanding. Our copper position has never looked better, our zinc business is solid and we have substantial oil sands resources which will result in an important fourth major product line for us in the coming years.
Internationally we have had a Pacific focus since before this was conventional wisdom, and our long-standing relationship with Japan’s Sumitomo Metal Mining has been augmented by the recent investment in Teck by China Investment Corporation. In an increasingly globalized economy, relationships such as these are important and to be nurtured.
It is a significant anniversary year for Teck and, if I may be permitted a bit of historical reflection, it is exactly 100 years since prospectors Sandy McIntyre and Jim Hughes discovered gold and sunk a 35-foot exploration shaft on claim LI 238 in the bush of Teck Township in Northern Ontario. This would become the Teck-Hughes Mine, which would operate for 50 years before its ore reserves were exhausted. Teck-Hughes Gold Mines Limited would eventually develop the Lamaque gold mine at Val d’Or, Quebec in the 1930s and participate with several other companies in the Mattagami base metal discovery in the 1950s. While the company had enjoyed a measure of success, by the end of its first 50 years it had been surpassed in size and importance by a number of other Canadian mining companies, including Noranda, McIntyre, Inco and Falconbridge. That would soon begin to change.
It was 50 years ago, in 1962, that Teck-Hughes, Lamaque and a new oil company, Canadian Devonian Petroleums Ltd., were merged to form Teck Corporation. The new Teck would add oil to its declining gold production, and as time passed would augment this with copper, niobium, zinc, silver, more gold and metallurgical coal mines as it gradually evolved, one step at a time, into Teck Resources Limited, now Canada’s largest diversified mining company.
There have been ups and downs along the way, including occasional difficult governments, periods of strong prices and others of recessions, and a long period of slow growth years in the developed world (often described as “20 years of declining prices in real terms”) which we endured until markets finally turned buoyant again in 2006, with strong demand growth from emerging economies. It had not been easy to grow value in those tough years in particular, but we had managed, and were able to enter the current era with a good base of mining assets and opportunities upon which to build further.
It was quite a run for those of us involved, including the late Bob Hallbauer, my father, also Norman Keevil, and many others. Each should be proud of having laid part of the groundwork to build this company, perhaps in a small way making “a dent in the universe”, as Steve Jobs would say, and this is being continued ably by the present management team under Don Lindsay.
There have always been challenges, not the least of which was that we didn’t have the luxury of starting with a large, world-class orebody such as Broken Hill, Chuquicamata, Sudbury, the Horne Mine or Kidd Creek. Instead we had to assemble the building blocks through the sequential development of smaller, often unrecognized prospects as they were discovered or otherwise became available.
Letter from the Chairman
7
Norman B. KeevilChairmanVancouver, B.C., CanadaFebruary 28, 2012
This naturally led to our strategic emphasis on continuously augmenting our ore reserve position one brick at a time, adding quality and longevity where possible, and to be being continuously alert to opportunity in order to accomplish this. As my father used to say, reflecting upon his canoeing days with the Geological Survey of Canada, “Never rest on your ores”.
It is fair to say that the opportunities that would make a real difference were not always obvious at the time. They seldom are, or they probably wouldn’t have been available.
When we built the Niobec mine with our partner Soquem few people in the business had ever heard of niobium. When we started work on the Afton deposit some mining people actually opined that it was impossible to process native copper successfully. When we undertook to build the first Hemlo gold mine the country was in the depths of a severe recession; when we built the Bullmoose coal mine it required major rail and port infrastructure and long-term, premium-priced sales contracts to make it work; and when we committed to build the Antamina mine at an elevation of over 4,000 metres in the high Andes Mountains of Peru the market penalized us because it was widely observed that nobody had ever successfully built a plant of any kind at that altitude on budget (which happened to be true). But we and our partners could and did.
What does the future hold?
We do live in “uncertain times”, as is widely said, but in reality this is nothing new. I don’t recall too many times when the future was certain, for this or any other business. That said, with increasingly globalized trade, the emergence of important new economic players and the rise of state capitalism, the rate of change and degree of uncertainty may be even greater than in the past.
As I write the European Union is dealing with ongoing financial crises. Politics in the U.S. seem more polarized than ever. China and India have internal problems of their own which they will deal with, but the details as to how they will do this are not yet universally clear. The outcome of the “Arab Spring” remains unclear, as do the outcome of Iran’s nuclear ambitions and Israel’s existential concerns – and these are just some of the current uncertainties.
At the same time, more people than ever in the world are emerging from poverty with new hope for better lives and, barring complete economic collapse, this trend should continue. The hopeful in India, China and elsewhere have aspirations that are completely independent of which political party governs in the U.S., or what happens to Greece, to name a couple of the current news hot spots. With global communications and social media the rise of such aspirations will not be easily reversed.
This growth will require more and more of the things we produce, coal to make steel, copper for its major uses in infrastructure and wiring, zinc and oil. It has been said: “If you can’t grow it, you have to mine it”; there is a fair amount of truth to that.
Teck is well positioned to be a significant player in this future. We have a good portfolio of projects in each of these commodities that can be developed in an orderly fashion, and we fully expect to continue augmenting these as new opportunities are identified. We have a battle-hardened team of engineers, geologists, environmental scientists and financial people who have the capability to succeed, and we have a strong balance sheet to back them up. If ore reserves, people and financial strength are the keys to success for a mining company, as we have said before, then we have these, as well as a solid record of sustainability and history of growing value by building new mines and operating them successfully.
There is an old saying: “May you live in interesting times”. We have done, we do now, and we are likely to continue to do so. Teck has been around for 100 years, and for 50 years in its current incarnation, and all of us here fully intend to see Teck continue as an important part of the mining business well into the future.
Thanks to all of the Teck people in Canada, the U.S., Chile, Peru and in all the other countries in which we work and explore for your efforts in making this a company to be proud of.
On behalf of the Board,

8 Teck 2011 Annual Report
To the Shareholders:
For almost 100 years, Teck has been supplying many of the metals that the world needs. Over our company’s rich history, we have mined everything from gold to copper, zinc and silver, to steelmaking coal, to specialty metals such as germanium, niobium and indium.
We are constantly reminded that so much of what we rely on in our daily lives are the products of mining operations around the world. And, in the world’s emerging economies, people striving for a better life are dreaming of the things that mining makes possible – whether it is a car, an appliance, better health care or better housing. Our world has a real and growing need for the products that Teck produces. And despite ongoing economic uncertainty, demand for Teck’s products remains strong, particularly in the world’s emerging economies.
There is no higher priority than the safety of our people. It is a core value that underpins our vision of everyone going home safe and healthy every day. The year 2011 was an important one in this regard as we recorded the lowest total reportable injury frequency in our history, representing an 18% reduction from the previous year and the fewest number of serious incidents on record. This doesn’t mean our work is done, but it does remind us that by keeping focused on health and safety, we can reach our goal of operating without injuries. In 2011, we significantly advanced our sustainability objectives by establishing short- and long-term goals in the areas of water, energy, ecosystems and biodiversity, communities, materials stewardship and people with the objective of embedding sustainability in every decision we make.
Financial and Operational Highlights
We achieved a number of financial and operating records in 2011, including record annual revenues of $11.5 billion, up 25% from 2010, and record cash flow from operations, up 21% from 2010. We posted record gross profit, before depreciation and amortization, of $5.8 billion, up 30% from 2010. We increased our annualized dividend rate to $0.80 per share and we achieved record annual profit attributable to shareholders of $2.7 billion, up 47% from 2010. Finally, we raised $2 billion in an offering of 7, 10 and 30-year notes mid-year, taking advantage of historically low interest rates and our investment grade credit rating to further reduce our all-in interest rate and extend our average term to maturity.
Our financial results in 2011 reflect the strength of our broadly diversified asset base and the benefits we are realizing from being able to expand production from our existing operations at relatively low capital cost. Despite our strong financial results, this past year was not without its challenges. While we achieved record annual copper production, moved a record amount of material at our coal operations and delivered strong performance in our zinc operations, prices for both coal and copper declined significantly by the fourth quarter. While copper prices rebounded subsequent to year-end, our steelmaking coal markets remain weaker than we experienced for much of 2011, so coal prices remain below the average price we received last year.
In coal, investments in new mining equipment, plant upgrades and people have resulted in substantial increases in material moved, which will allow for increased coal production. Global economic conditions and softer steel prices have caused many steel producers to slow their production and to be cautious in purchasing raw materials. While we continue to develop our production capacity, our plans allow for flexibility to adapt to changes in demand.
Letter from the CEO
Donald R. LindsayPresident and Chief Executive Officer

9
Our investments at Carmen de Andacollo in Chile and Antamina in Peru have and will continue to generate increased copper production from those two operations. We are advancing our other late stage copper development projects, particularly Relincho and Quebrada Blanca Phase 2 where the feasibility study is expected to be completed this year.
The proposed acquisition of SilverBirch Energy Corporation, announced in early January and expected to close in April, will significantly increase our bitumen resource position and give us full ownership of the Frontier oil sands project, improving our ability to advance the project toward development. Combined with ongoing engineering work at Fort Hills, where a development decision is expected in 2013, our energy business unit is emerging as the fourth pillar of Teck’s exciting future.
Our zinc business unit had a very strong year in 2011. Along with an increase in production of zinc in concentrate at our Red Dog mine, production of refined zinc and lead from our Trail Operations also increased as a result of improved performance in all areas of the plant. We are making investments to improve performance, including upgrades to expand our capacity to recover metals from electronic waste. In 2011 we recycled 15,600 tonnes of e-waste and we will continue to build on that record in the years ahead.
Objectives for 2012
With many new projects in our pipeline, Teck is actively planning for the future. In 2012, we will significantly augment our project development capacity to strengthen our ability to design, build and operate new projects to convert our large resource position into cash flow and profits. Building on the strength of our operating and project teams in Chile is a primary focus as we advance our QB Phase 2 and Relincho copper projects toward development and production.
Competition for the talented people we need is fierce and we recognize the need to invest in the further training and development of our people and, in particular, our front-line supervisors. We will put new emphasis on our employees’ personal health and its contribution to achieving our objective of everyone going home safe and healthy every day. And, while continuing our overall commitment to sustainability, we will devote significant effort to a company-wide water strategy, focused on both our performance at our operations and on community investments.
We continue to examine new development opportunities in commodities and jurisdictions of interest around the world. While we will continue our “stay the course” strategy – that is, focusing on our existing operations and projects – Teck remains well positioned to identify, analyze and pursue new value-creating opportunities as they arise. In the coming year we intend to maintain a strong, liquid balance sheet in order to access the most attractive sources of capital to sustain and grow our business. In 2012, we will continue our emphasis on meeting or exceeding our production targets in copper, steelmaking coal and zinc. We are also aiming to achieve greater efficiencies and cost savings for our operations through our Operating Excellence program.
Management
Our success as a company begins with our people. I want to extend my sincere appreciation to all of our employees for their dedication and successful efforts that enable Teck to continue on our exciting growth path.
In 2011 Jim Utley, Vice President, Human Resources and Howard Chu, Vice President, Asian Affairs and Chief Representative, China retired after long and distinguished careers with the company. They each personify the commitment to hard work and dedication to the company and its core values that make Teck a proud organization across all facets of our business. On behalf of everyone at Teck, I want to personally thank Jim and Howard for their valuable contributions.
I want to welcome Graham Foyle-Twining, who has recently joined us as Vice President, Human Resources and Ralph Lutes who joined us as our new Vice President, Asian Affairs and Chief Representative, China, based in our Beijing office.
Looking at the big picture, Teck is well positioned to continue and expand our long, distinguished role in supplying critical raw materials to meet growing worldwide demand. And now, more than ever – whether we are talking about our commitment to our shareholders, our employees, our communities, our customers, our partners, or our environment – keeping our eye on the big picture means never losing sight of the details.
Donald R. Lindsay President and Chief Executive Officer February 28, 2012

10 Teck 2011 Annual Report
Our Business
Copper
Copper plays an important role in meeting the world’s growing demand for infrastructure and products and is a vital component in power generation and transmission, construction, clean technology and electronics. As a major world supplier of copper, with five operating mines and three large development projects in Canada and South America, Teck is growing its copper production to meet that demand.
In 2011, our share of copper production from Antamina in Peru, Quebrada Blanca and Carmen de Andacollo in Chile, Highland Valley Copper in British Columbia (B.C.) and Duck Pond in Newfoundland, was 321,000 tonnes of copper, which accounted for 27% of our revenue and 29% of our gross profit before depreciation and amortization.
Coal
The pace of urbanization and industrialization in the Asia-Pacific region, particularly China and India, is driving demand for steel and the steelmaking coal needed to produce it. Steelmaking coal is an important part of building the infrastructure necessary to accommodate hundreds of millions of people seeking to enhance their quality of life.
We are the largest producer of steelmaking coal in North America, and the second-largest exporter of seaborne steelmaking coal in the world. Our six operating coal mines are located in Western Canada, with five in southeastern B.C. and one in west-central Alberta. In addition, a feasibility study for the reopening of the Quintette mine in northeastern B.C. is underway.
In 2011, we produced 22.8 million tonnes of coal, which accounted for 49% of our revenue and 57% of our gross profit, before depreciation and amortization.
Teck is a diversified resource company committed to responsible mining and mineral development with business units focused on copper, steelmaking coal, zinc and energy. We are also a significant producer of specialty metals such as germanium and indium. We actively explore for copper, zinc and gold in the Americas, Asia Pacific, Europe and Africa.

11
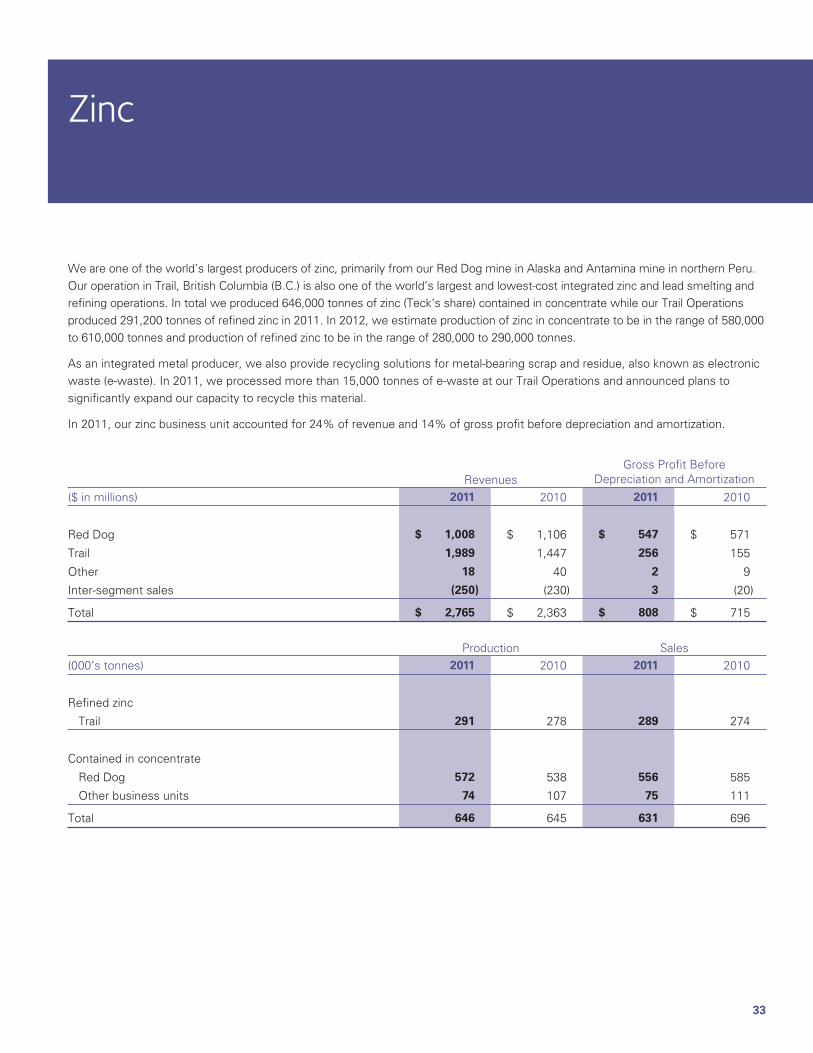
Zinc
Zinc plays an important role in the protection of infrastructure as a key component in galvanized steel. Zinc also protects and supports human health as an essential micronutrient and a soil additive that can significantly improve crop yields.
Our zinc production primarily comes from the Red Dog mine in Alaska and the Antamina mine in northern Peru. Our operations in Trail, B.C. represent one of the world’s largest fully integrated zinc and lead smelting and refining complexes. As an integrated metal producer, we also provide recycling solutions for metal-bearing scrap and residue, also known as urban ore. In 2011, we processed more than 15,000 tonnes of electronic waste at our Trail Operations and announced plans to significantly expand our capacity to recycle this material.
Our share of zinc produced at our operations was 646,000 tonnes of zinc contained in concentrate and 291,000 tonnes of refined zinc in 2011, which accounted for 24% of our revenue and 14% of our gross profit, before depreciation and amortization.
Energy
As conventional sources of energy decline and the world population continues to grow and become more urbanized, responsible and sustainable development of new sources of energy is essential to meeting global demand.
Located in the Athabasca region of northeastern Alberta, our energy assets include a 20% interest in the Fort Hills project and a 50% interest in the Frontier project. We have reached an agreement to acquire the remaining 50% interest in Frontier which, subject to receipt of various approvals, is expected to close in April 2012. In addition, we hold interests in various other oil sands leases in the exploration phase.
Our recoverable contingent bitumen resources totalled 2.1 billion barrels at the end of 2011. Upon closing of the Frontier transaction, our contingent bitumen resources will rise 67% to 3.5 billion barrels. We are researching methods to improve the sustainability of our oil sands assets and are also developing renewable energy projects.
Our corporate strategy is focused on continuing to build a broadly diversified resource company, growing our production at existing operations and developing new projects in stable jurisdictions. At Teck, the pursuit of sustainability guides our approach to business. We recognize that our success depends on our ability to establish safe environments for our people and collaborative relationships with communities of interest.
We are headquartered in Vancouver, Canada. We own or have an interest in 13 mines in Canada, the United States, Chile and Peru, as well as one large metallurgical complex in Canada. We have expertise across a wide range of activities related to mining and minerals processing including exploration, development, smelting, refining, safety, environmental protection, materials stewardship, recycling and research.
12 Teck 2011 Annual Report
Safety
At Teck, safety is a core value. We believe it is possible to work without injuries and are focused on continually improving our safety performance. Our Courageous Safety Leadership (CSL) philosophy empowers every employee to be a safety leader and to play an active role in their own safety and the safety of those around them. It challenges existing beliefs and attitudes and encourages the changes required to instill an ingrained culture of safety.
Through the collective efforts of thousands of employees, we achieved an encouraging safety milestone in 2011, with the lowest total reportable injury frequency in Teck’s history – an 18% improvement over the previous year – and the fewest number of serious incidents on record. However, until we realize our vision of everyone going home safe and healthy every day, we know there is more work to be done.
We continue to build on our CSL journey, which began in 2009 when employees across all our operations participated in CSL training. Since that time, CSL has become a part of our culture, with over 12,000 employees and contractors receiving CSL training. Every meeting at Teck begins with a “safety share” where employees discuss safety issues and opportunities to improve our safety.
In 2011, we continued the second phase of our CSL journey, which involved our sites sharing their safety stories through videos that were viewed in crew talks and meetings across the company. These safety shares are instrumental in sharing knowledge, celebrating success and reinforcing our culture of safety. Our senior management and site management teams also continued to implement our Visible, Felt Leadership initiative, which focuses on regular, active engagement between management and employees in the field. Engaging our employees through commitment and demonstrated leadership on safety is critical to our success.
We also gathered a broad cross-section of employees from across our operations in the spring of 2011 to begin development of the next phase of CSL. This will build on our existing CSL programs and reinforce our commitment to courageous safety leadership.
Developing and implementing new technology is also a critical component of our overall approach to safety. In 2011, we began piloting several new technologies aimed at improving the safe operation of equipment. These include fatigue-monitoring systems, proximity sensors and real-time vehicle systems monitoring.

13
We analyze and learn from injuries or incidents to target areas of highest risk, take steps to ensure they do not reoccur, share findings across our company, and continually improve our safety measures. A High Potential Incident Database launched in 2010 is helping us to better identify the root cause of incidents and to undertake corrective measures.
We believe that every injury is preventable. By learning from our history, continually improving our programs and technology, and empowering employees to become courageous safety leaders, we will realize our vision of everyone going home safe and healthy every day.
“When you make safety a core value, you think about it first in all of your actions and you share this leadership with your family and friends.” – Roberta Hicks,
Underground Haulage Truck Driver, Duck Pond Operations
Pictured right: Roberta Hicks, Underground Haulage
Truck Driver, Duck Pond Operations

14 Teck 2011 Annual Report
Our People
Teck’s nearly 12,000 employees worldwide are engaged in responsible resource development and production, cutting-edge scientific research and exploring for new ore deposits. Having the right people on our team is critical to our success. That is why we are focused on recruiting the best people and providing rewarding careers and professional development opportunities.
Recruit the BestWorking for Teck provides a unique opportunity to live and work in some of the world’s most incredible places. Our people enjoy challenging work assignments and excellent opportunities for career and professional growth.
With plans for growth across the company, recruiting employees is a priority for Teck. Last year we hired more than 2,500 employees worldwide. In order to sustain and grow our operations, recruiting the best people remains an integral part of our focus.
In 2011, we launched a new recruitment campaign. Our strategy includes new recruitment materials, enhanced recruitment programs, and application tracking software to share applicant information across operations.
Provide Rewarding CareersProviding opportunities for growth and engagement is a key part of our commitment to our people. Approximately 36% of our employees have worked at Teck for more than 10 years. We want to build on that experience by offering a range of career opportunities that allow employees to explore their interests and develop their skills.
A key factor in retaining our employees is helping them engage in meaningful conversations with their supervisors. Our Building Strength with People program is designed to assist in this process by focusing conversations on performance, development and career opportunities to ensure both individual and business success. In 2011, to help enhance the quality of these conversations, we implemented Meaningful Conversations training, which was delivered at several operations in 2011 and is continuing in 2012.
We are also celebrating excellence in our people through programs like the Excellence Awards, which recognizes employees for their outstanding contributions to the company. Our 2011 recipients participated in a cultural exchange between Chile and Canada, providing an opportunity to increase cross-cultural awareness and share knowledge across our organization.

15
“Living and working in the Elk Valley was a huge draw for me. This is the best backyard in the world. The ability to do the things I love and build a great career at the same time was why I knew Teck was where I wanted to work.” – Ryan Ramage,
Mechanical Engineer, Greenhills Operations
Pictured right: Ryan Ramage, Mechanical Engineer, Greenhills Operations

16 Teck 2011 Annual Report
Develop TalentOur employee development strategy comprises programs designed to support the professional, technical and leadership development of our people.
Emerging Leaders, launched in 2007, seeks to develop employees for key senior positions in the company. Leading for Excellence guides the development of those responsible for teams of managers or supervisors and Leading for the Future has been designed to develop our front-line managers.
We also encourage our employees to upgrade their educational background, knowledge and skills through training and education courses. Business education is provided through our Business Education Program in partnership with Simon Fraser University and includes a graduate diploma in business administration and an MBA program. Other educational advancement opportunities include financial assistance for approved courses and a language training program.
By building leadership skills in our people, our programs add to the strong professional development opportunities available at Teck and build on our commitment to attract, retain and develop people who will lead us to a successful and sustainable future.
Pictured above: Matt Rosales, GIS Analyst II, Exploration
“Before I had joined Teck I was aware of Teck’s reputation for strong mentorship and professional development opportunities. This was a major factor in my decision to join Teck and throughout my career I have found that reputation to be well deserved.” – Matt Rosales, GIS Analyst II, Exploration
17
At Teck, the pursuit of sustainability guides our approach to business. Over our 100-year history, we have learned that responsible mining and mineral development are fundamental to our long-term success.
Taking ActionOur commitment to sustainability is measured by our performance and by the actions we take to protect and contribute to a healthy social, economic and environmental landscape.
We are building partnerships and capacity to meet sustainability challenges within the regions in which we operate and at the global level. For example, as one of the world’s largest producers of zinc, we are working with the international community to address the global issue of zinc deficiency in people and in agricultural soils, particularly in developing countries. In doing so, we can help save and sustain lives by ensuring that people, especially children, have enough zinc in their diets. Some of our partners include the International Zinc Association, UNICEF, the Zinc Alliance for Child Health, the Micronutrient Initiative and the Government of Canada.
We worked to raise awareness about the challenge of zinc deficiency through participation in Free The Children’s We Day events across Canada in 2011. We also entered into a partnership with BASF, the world’s leading chemical company, to jointly develop innovative and affordable zinc fortification and supplementation solutions, with the goal of reducing zinc deficiency among 100 million people in developing countries by 2015.
In 2011, we accepted an invitation to become a member of the United Nations Global Compact LEAD, a sustainability leadership platform uniting over 50 companies from around the world to achieve higher levels of sustainability performance, impact and action.
For the second year in a row, we were named to the Dow Jones Sustainability World Index, indicating that our sustainability practices rank in the top 10% of companies in the resource industry worldwide.
Planning for the FutureIn 2011, we set long-term sustainability goals that stretch through to 2030. We also set short-term goals and listed actions that will help us to achieve our vision for sustainability in six key focus areas: Our People, Community, Water, Ecosystems and Biodiversity, Energy, and Materials Stewardship.
Sustainability

18 Teck 2011 Annual Report
CommunityOur sustainability strategy is rooted in our vision to leave communities better off as a result of their interactions with us.
For the Sullivan mine near Kimberley, British Columbia (B.C.), a major employer and economic engine for nearly 100 years, that has meant working closely with the community to support economic diversification for life after the mine. That partnership has helped turn Kimberley into a resort destination and we continue to support economic diversification with our involvement in the potential development of a solar power plant based at the old Sullivan mine site.
In 2011, we continued to make progress in how we work with communities like Kimberley by building capacity to manage our social performance. Teck has developed a Social Management and Responsibility at Teck (SMART) toolkit, which provides the tools and guidance to help our employees manage social risk and performance. The toolkit was tailored for our exploration employees in 2011 through a specialized SMART Exploration training program. In 2012 we will continue adding more tools to SMART.
Cultural awareness training was implemented at a number of operations in 2011, enhancing our employees’ understanding of Indigenous Peoples’ culture and history. Dialogue training also continued to provide employees with the skills necessary to build and maintain positive relationships with our communities of interest.
“Developing a solar power project on the old Sullivan mine site in Kimberley would further diversify the local economy while at the same time provide information to Teck on the role that solar power can play in meeting our energy goals.” – Susan Stocker,
Manager, Sustainability & Community Investment, Sustainability
Pictured above: Karen Ramírez, Communities Coordinator, Carmen de Andacollo

19
Water Our vision is to contribute to the ability of present and future generations to enjoy a balance between the social, economic, recreational and cultural benefits of water resources, within ecologically sustainable limits.
In Chile, dialogue with the community about their concerns regarding water use at the Carmen de Andacollo mine has led to an agreement with the community to supply water to our process plant from a different source. In 2011, we completed construction of a 27-kilometre water pipeline, allowing us to stop using water from the aquifer we previously shared with the community.
In 2011, we also implemented projects designed to protect water quality by reducing selenium levels downstream of our coal operations. When selenium is present in elevated concentrations, which can occur in coal mining when water comes into contact with waste rock, there is potential for ecosystems to be impacted.
Our knowledge and experience in selenium management is continuing to increase and will be enhanced through two key pilot projects. At our Fording River Operations, we constructed the five-kilometre-long Kilmarnock Creek diversion to reduce the amount of water that comes into contact with waste rock. At our Line Creek Operations, we advanced the design of a water treatment facility. These two pilot projects will provide us with valuable insight as we work to complement our existing strategies to manage selenium and protect water quality.
“Guided by our vision for water management, we’ve listened to the community, understood their concerns, and together have found solutions for water use that meet that vision and ensure the long-term viability of both Carmen de Andacollo and the community.” – Mauricio Gómez,
Superintendent, External Relations, Carmen de Andacollo
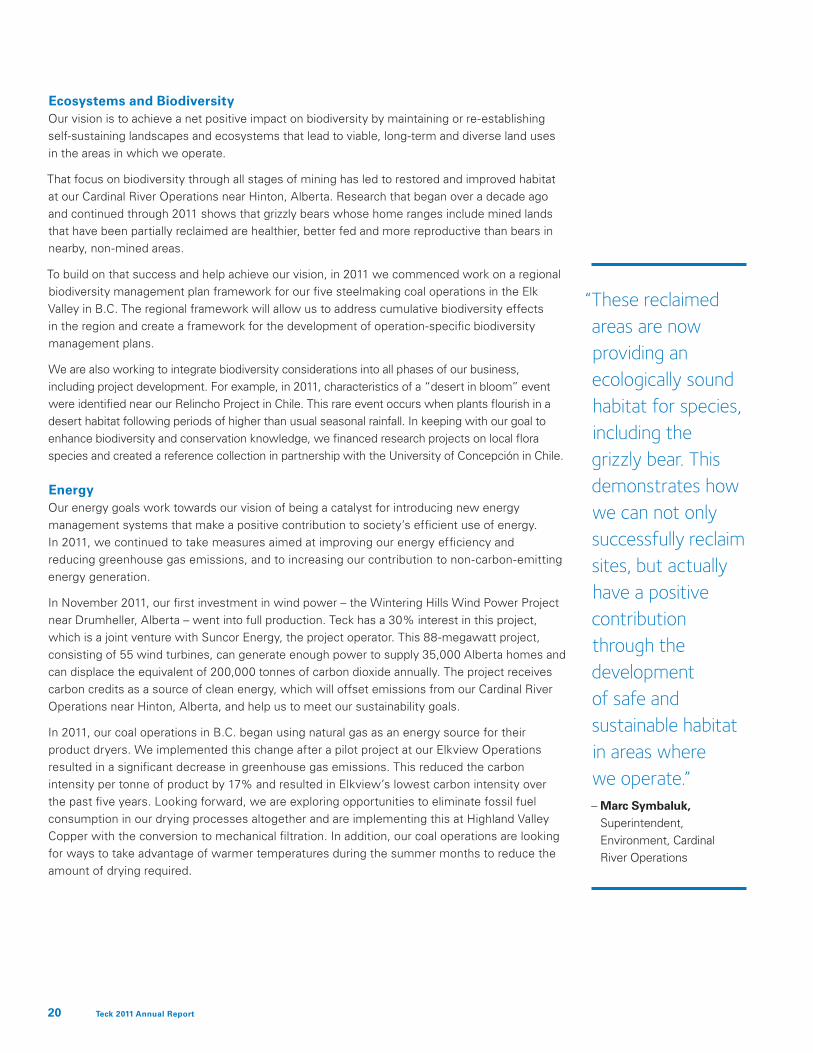
Pictured right: Reclaimed area at Cardinal River Operations
20 Teck 2011 Annual Report
Ecosystems and Biodiversity Our vision is to achieve a net positive impact on biodiversity by maintaining or re-establishing self-sustaining landscapes and ecosystems that lead to viable, long-term and diverse land uses in the areas in which we operate.
That focus on biodiversity through all stages of mining has led to restored and improved habitat at our Cardinal River Operations near Hinton, Alberta. Research that began over a decade ago and continued through 2011 shows that grizzly bears whose home ranges include mined lands that have been partially reclaimed are healthier, better fed and more reproductive than bears in nearby, non-mined areas.
To build on that success and help achieve our vision, in 2011 we commenced work on a regional biodiversity management plan framework for our five steelmaking coal operations in the Elk Valley in B.C. The regional framework will allow us to address cumulative biodiversity effects in the region and create a framework for the development of operation-specific biodiversity management plans.
We are also working to integrate biodiversity considerations into all phases of our business, including project development. For example, in 2011, characteristics of a “desert in bloom” event were identified near our Relincho Project in Chile. This rare event occurs when plants flourish in a desert habitat following periods of higher than usual seasonal rainfall. In keeping with our goal to enhance biodiversity and conservation knowledge, we financed research projects on local flora species and created a reference collection in partnership with the University of Concepción in Chile.
Energy Our energy goals work towards our vision of being a catalyst for introducing new energy management systems that make a positive contribution to society’s efficient use of energy. In 2011, we continued to take measures aimed at improving our energy efficiency and reducing greenhouse gas emissions, and to increasing our contribution to non-carbon-emitting energy generation.
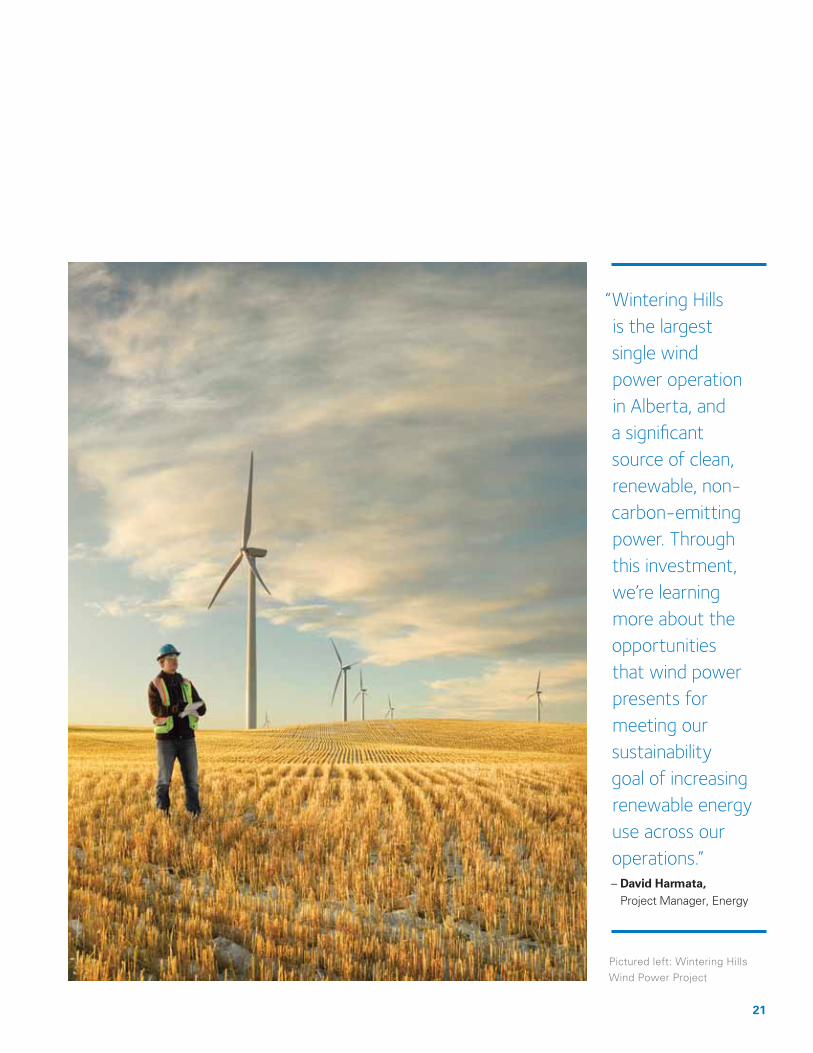
In November 2011, our first investment in wind power – the Wintering Hills Wind Power Project near Drumheller, Alberta – went into full production. Teck has a 30% interest in this project, which is a joint venture with Suncor Energy, the project operator. This 88-megawatt project, consisting of 55 wind turbines, can generate enough power to supply 35,000 Alberta homes and can displace the equivalent of 200,000 tonnes of carbon dioxide annually. The project receives carbon credits as a source of clean energy, which will offset emissions from our Cardinal River Operations near Hinton, Alberta, and help us to meet our sustainability goals.
In 2011, our coal operations in B.C. began using natural gas as an energy source for their product dryers. We implemented this change after a pilot project at our Elkview Operations resulted in a significant decrease in greenhouse gas emissions. This reduced the carbon intensity per tonne of product by 17% and resulted in Elkview’s lowest carbon intensity over the past five years. Looking forward, we are exploring opportunities to eliminate fossil fuel consumption in our drying processes altogether and are implementing this at Highland Valley Copper with the conversion to mechanical filtration. In addition, our coal operations are looking for ways to take advantage of warmer temperatures during the summer months to reduce the amount of drying required.
“These reclaimed areas are now providing an ecologically sound habitat for species, including the grizzly bear. This demonstrates how we can not only successfully reclaim sites, but actually have a positive contribution through the development of safe and sustainable habitat in areas where we operate.” – Marc Symbaluk,
Superintendent, Environment, Cardinal River Operations
21
“Wintering Hills is the largest single wind power operation in Alberta, and a significant source of clean, renewable, non-carbon-emitting power. Through this investment, we’re learning more about the opportunities that wind power presents for meeting our sustainability goal of increasing renewable energy use across our operations.” – David Harmata,
Project Manager, Energy
Pictured left: Wintering Hills Wind Power Project
22 Teck 2011 Annual Report
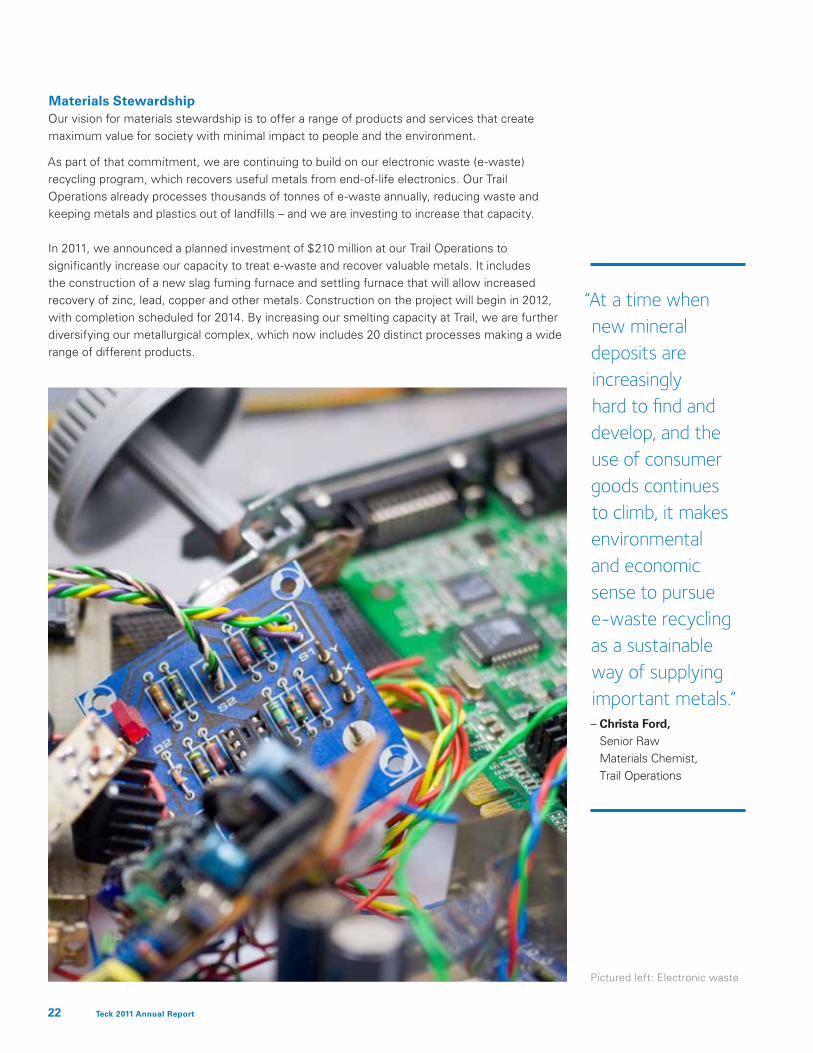
Materials Stewardship Our vision for materials stewardship is to offer a range of products and services that create maximum value for society with minimal impact to people and the environment.
As part of that commitment, we are continuing to build on our electronic waste (e-waste) recycling program, which recovers useful metals from end-of-life electronics. Our Trail Operations already processes thousands of tonnes of e-waste annually, reducing waste and keeping metals and plastics out of landfills – and we are investing to increase that capacity.
In 2011, we announced a planned investment of $210 million at our Trail Operations to significantly increase our capacity to treat e-waste and recover valuable metals. It includes the construction of a new slag fuming furnace and settling furnace that will allow increased recovery of zinc, lead, copper and other metals. Construction on the project will begin in 2012, with completion scheduled for 2014. By increasing our smelting capacity at Trail, we are further diversifying our metallurgical complex, which now includes 20 distinct processes making a wide range of different products.
“At a time when new mineral deposits are increasingly hard to find and develop, and the use of consumer goods continues to climb, it makes environmental and economic sense to pursue e-waste recycling as a sustainable way of supplying important metals.” – Christa Ford,
Senior Raw Materials Chemist, Trail Operations
Pictured left: Electronic waste
Management’s Discussion and Analysis
23
24 Teck 2011 Annual Report24 Teck 2011 Annual Report
Management’s Discussion and Analysis
Our business is exploring for, developing, acquiring and producing natural resources. We manage our activities according to commodity lines and, along with our corporate functions, we are organized into business units focused on copper, coal, zinc and energy.
Through our interests in mining and processing operations in Canada, the United States, Chile and Peru, we are the world’s second-largest exporter of seaborne high quality steelmaking coal, an important producer of copper, and one of the world’s largest zinc producers. We also produce lead, molybdenum, silver and various specialty and other metals, chemicals and fertilizers. In addition, we own a 20% interest in the Fort Hills oil sands project and a 50% interest in other oil sands leases in the Athabasca region of Alberta. We also actively explore for gold.
Our corporate business unit manages our corporate growth initiatives and includes groups that provide administrative, technical, financial and other support to all of our business units.
The Management’s Discussion and Analysis of our results of operations is prepared as at February 28, 2012 and should be read in conjunction with our audited consolidated financial statements as at and for the year ended December 31, 2011. Unless the context otherwise dictates, a reference to Teck, Teck Resources, the Company, us, we, or our, refers to Teck Resources Limited and its subsidiaries including Teck Metals Ltd. and Teck Coal Partnership. All dollar amounts are in Canadian dollars, unless otherwise specified, and are based on our consolidated financial statements that are prepared in accordance with International Financial Reporting Standards (IFRS) for 2011 and 2010 and on Canadian Generally Accepted Accounting Principles (GAAP) for 2009. In addition, we use certain non-GAAP financial measures, which are explained and reconciled throughout the Management’s Discussion and Analysis in this report. Certain comparative amounts have been reclassified to conform to the presentation adopted for 2011.
This Management’s Discussion and Analysis contains certain forward-looking information and forward-looking statements. You should review the cautionary statement on forward-looking information under the caption “Caution on Forward-Looking Information” on page 57, which forms part of this Management’s Discussion and Analysis.
Additional information about us, including our most recent Annual Information Form, is available on the Canadian Securities Administrators website at www.sedar.com (SEDAR) and on the EDGAR section of the United States Securities and Exchange Commission’s website at www.sec.gov.
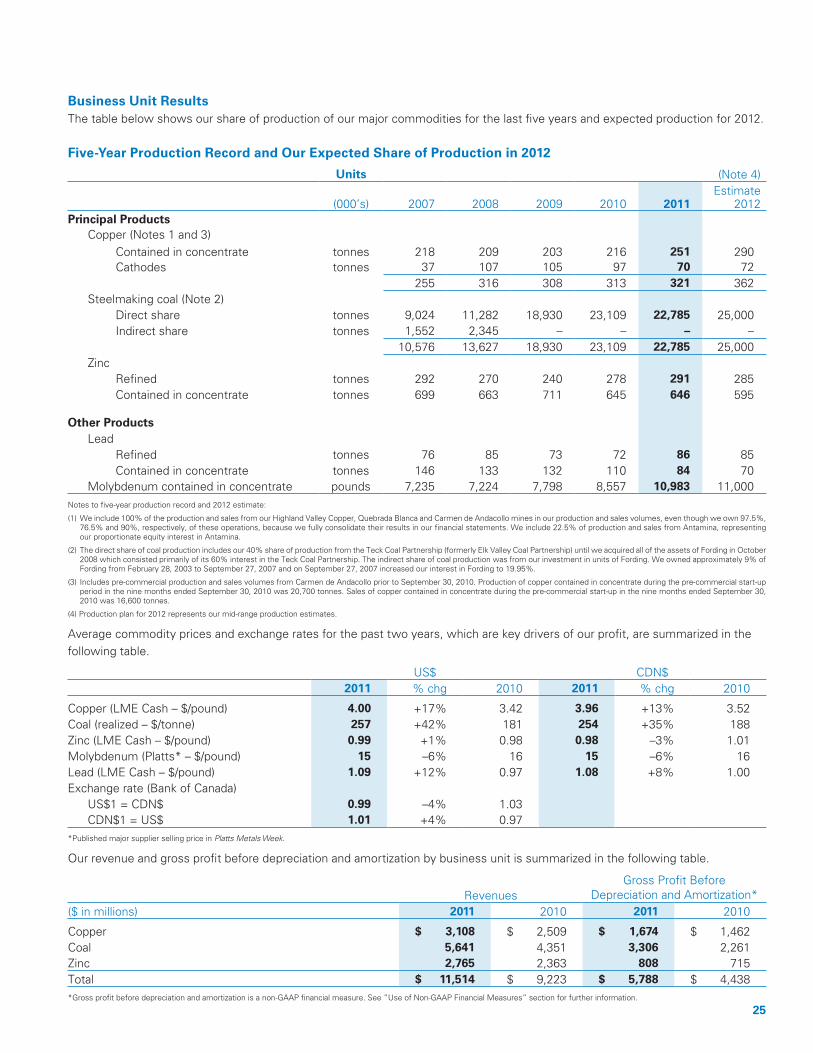
Business Unit ResultsThe table below shows our share of production of our major commodities for the last five years and expected production for 2012.
Five-Year Production Record and Our Expected Share of Production in 2012
Units (Note 4)
(000’s) 2007 2008 2009 2010 2011
Estimate 2012
Principal Products Copper (Notes 1 and 3) Contained in concentrate
tonnes
218
209
203
216
251
290
Cathodes tonnes 37 107 105 97 70 72255 316 308 313 321 362
Steelmaking coal (Note 2) Direct share tonnes 9,024 11,282 18,930 23,109 22,785 25,000 Indirect share tonnes 1,552 2,345 – – – –
10,576 13,627 18,930 23,109 22,785 25,000 Zinc Refined tonnes 292 270 240 278 291 285 Contained in concentrate tonnes 699 663 711 645 646 595
Other Products Lead Refined tonnes 76 85 73 72 86 85 Contained in concentrate tonnes 146 133 132 110 84 70 Molybdenum contained in concentrate pounds 7,235 7,224 7,798 8,557 10,983 11,000Notes to five-year production record and 2012 estimate:
(1) We include 100% of the production and sales from our Highland Valley Copper, Quebrada Blanca and Carmen de Andacollo mines in our production and sales volumes, even though we own 97.5%, 76.5% and 90%, respectively, of these operations, because we fully consolidate their results in our financial statements. We include 22.5% of production and sales from Antamina, representing our proportionate equity interest in Antamina.
(2) The direct share of coal production includes our 40% share of production from the Teck Coal Partnership (formerly Elk Valley Coal Partnership) until we acquired all of the assets of Fording in October 2008 which consisted primarily of its 60% interest in the Teck Coal Partnership. The indirect share of coal production was from our investment in units of Fording. We owned approximately 9% of Fording from February 28, 2003 to September 27, 2007 and on September 27, 2007 increased our interest in Fording to 19.95%.
(3) Includes pre-commercial production and sales volumes from Carmen de Andacollo prior to September 30, 2010. Production of copper contained in concentrate during the pre-commercial start-up period in the nine months ended September 30, 2010 was 20,700 tonnes. Sales of copper contained in concentrate during the pre-commercial start-up in the nine months ended September 30, 2010 was 16,600 tonnes.
(4) Production plan for 2012 represents our mid-range production estimates.
Average commodity prices and exchange rates for the past two years, which are key drivers of our profit, are summarized in the following table.
US$ CDN$2011 % chg 2010 2011 % chg 2010
Copper (LME Cash – $/pound) 4.00 +17% 3.42 3.96 +13% 3.52Coal (realized – $/tonne) 257 +42% 181 254 +35% 188Zinc (LME Cash – $/pound) 0.99 +1% 0.98 0.98 –3% 1.01Molybdenum (Platts* – $/pound) 15 –6% 16 15 –6% 16Lead (LME Cash – $/pound) 1.09 +12% 0.97 1.08 +8% 1.00Exchange rate (Bank of Canada)
US$1 = CDN$ 0.99 –4% 1.03CDN$1 = US$ 1.01 +4% 0.97
*Published major supplier selling price in Platts Metals Week.
Our revenue and gross profit before depreciation and amortization by business unit is summarized in the following table.
Revenues
Gross Profit BeforeDepreciation and Amortization*
($ in millions) 2011 2010 2011 2010
Copper $ 3,108 $ 2,509 $ 1,674 $ 1,462Coal 5,641 4,351 3,306 2,261Zinc 2,765 2,363 808 715Total $ 11,514 $ 9,223 $ 5,788 $ 4,438*Gross profit before depreciation and amortization is a non-GAAP financial measure. See ”Use of Non-GAAP Financial Measures” section for further information.
25
26 Teck 2011 Annual Report
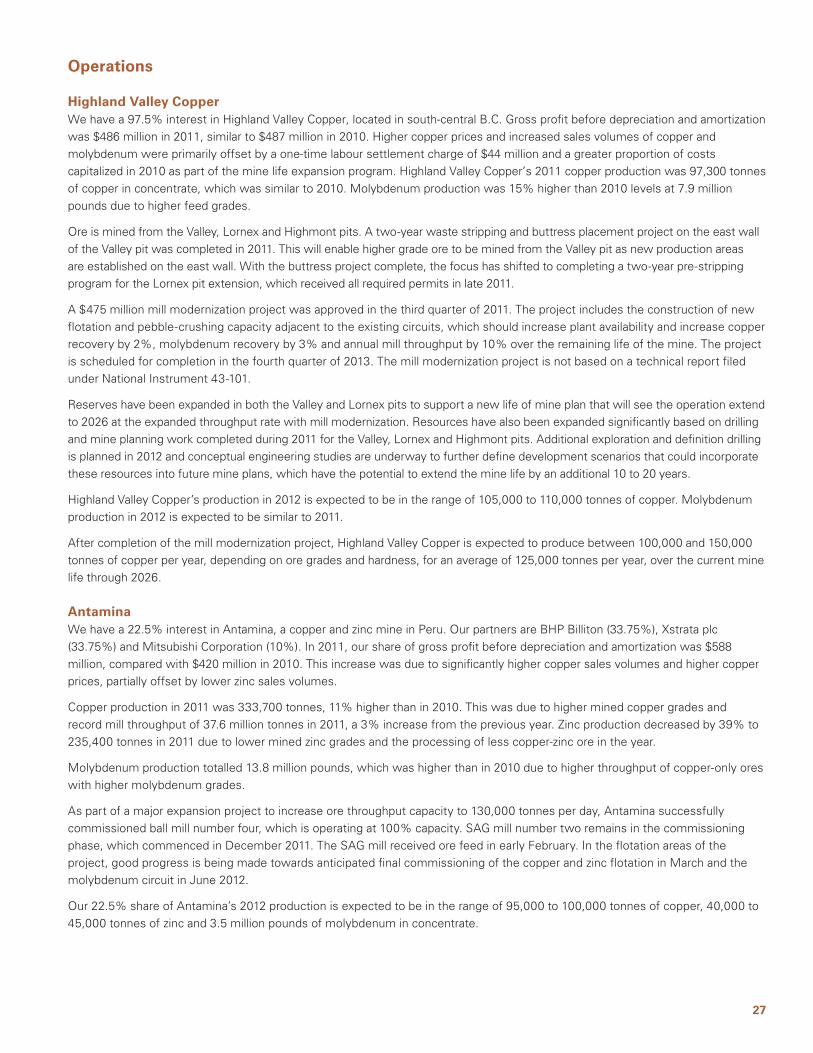
In 2011, we produced a record 321,000 tonnes of copper from Antamina in Peru, Quebrada Blanca and Carmen de Andacollo in Chile, Highland Valley Copper in British Columbia (B.C.) and Duck Pond in Newfoundland. We achieved a key milestone by completing a two-year waste stripping and buttress placement project at Highland Valley Copper, which will provide access to higher grade ore. Work continued on the Antamina expansion project, which saw the successful commissioning of ball mill number four, now operating at 100% capacity. Prefeasibility work on the Relincho Project in Chile was completed and a full feasibility study is now underway. The feasibility study for Quebrada Blanca Phase 2 is expected to be completed by the end of the first quarter of 2012. We also completed prefeasibility work at the Galore Creek project in northwest B.C., with additional environmental and engineering work ongoing. In 2012, we estimate copper production to be in the range of 350,000 to 375,000 tonnes.
In 2011, our copper operations accounted for 27% of our revenue and 29% of our gross profit before depreciation and amortization.
Copper
Revenues
Gross Profit BeforeDepreciation and Amortization
($ in millions) 2011 2010 2011 2010
Highland Valley Copper $ 997 $ 828 $ 486 $ 487
Antamina 799 641 588 420
Quebrada Blanca 562 697 255 406
Carmen de Andacollo 608 208 288 91
Duck Pond 142 135 57 58
Total $ 3,108 $ 2,509 $ 1,674 $ 1,462
Production Sales(000’s tonnes) 2011 2010 2011 2010
Highland Valley Copper 97 99 104 98
Antamina 75 68 76 65
Quebrada Blanca 64 86 64 90
Carmen de Andacollo (Note 1) 72 45 69 42
Duck Pond 13 15 13 15
Total 321 313 326 310
1) Includes pre-commercial production and sales volumes from Carmen de Andacollo prior to September 30, 2010. Production of copper contained in concentrate during the pre-commercial start-up period in the nine months ended September 30, 2010 was 20,700 tonnes. Sales of copper contained in concentrate during the pre-commercial start-up in the nine months ended September 30, 2010 was 16,600 tonnes.
27
Operations
Highland Valley CopperWe have a 97.5% interest in Highland Valley Copper, located in south-central B.C. Gross profit before depreciation and amortization was $486 million in 2011, similar to $487 million in 2010. Higher copper prices and increased sales volumes of copper and molybdenum were primarily offset by a one-time labour settlement charge of $44 million and a greater proportion of costs capitalized in 2010 as part of the mine life expansion program. Highland Valley Copper’s 2011 copper production was 97,300 tonnes of copper in concentrate, which was similar to 2010. Molybdenum production was 15% higher than 2010 levels at 7.9 million pounds due to higher feed grades.
Ore is mined from the Valley, Lornex and Highmont pits. A two-year waste stripping and buttress placement project on the east wall of the Valley pit was completed in 2011. This will enable higher grade ore to be mined from the Valley pit as new production areas are established on the east wall. With the buttress project complete, the focus has shifted to completing a two-year pre-stripping program for the Lornex pit extension, which received all required permits in late 2011.
A $475 million mill modernization project was approved in the third quarter of 2011. The project includes the construction of new flotation and pebble-crushing capacity adjacent to the existing circuits, which should increase plant availability and increase copper recovery by 2%, molybdenum recovery by 3% and annual mill throughput by 10% over the remaining life of the mine. The project is scheduled for completion in the fourth quarter of 2013. The mill modernization project is not based on a technical report filed under National Instrument 43-101.
Reserves have been expanded in both the Valley and Lornex pits to support a new life of mine plan that will see the operation extend to 2026 at the expanded throughput rate with mill modernization. Resources have also been expanded significantly based on drilling and mine planning work completed during 2011 for the Valley, Lornex and Highmont pits. Additional exploration and definition drilling is planned in 2012 and conceptual engineering studies are underway to further define development scenarios that could incorporate these resources into future mine plans, which have the potential to extend the mine life by an additional 10 to 20 years.
Highland Valley Copper’s production in 2012 is expected to be in the range of 105,000 to 110,000 tonnes of copper. Molybdenum production in 2012 is expected to be similar to 2011.
After completion of the mill modernization project, Highland Valley Copper is expected to produce between 100,000 and 150,000 tonnes of copper per year, depending on ore grades and hardness, for an average of 125,000 tonnes per year, over the current mine life through 2026.
AntaminaWe have a 22.5% interest in Antamina, a copper and zinc mine in Peru. Our partners are BHP Billiton (33.75%), Xstrata plc (33.75%) and Mitsubishi Corporation (10%). In 2011, our share of gross profit before depreciation and amortization was $588 million, compared with $420 million in 2010. This increase was due to significantly higher copper sales volumes and higher copper prices, partially offset by lower zinc sales volumes.
Copper production in 2011 was 333,700 tonnes, 11% higher than in 2010. This was due to higher mined copper grades and record mill throughput of 37.6 million tonnes in 2011, a 3% increase from the previous year. Zinc production decreased by 39% to 235,400 tonnes in 2011 due to lower mined zinc grades and the processing of less copper-zinc ore in the year.
Molybdenum production totalled 13.8 million pounds, which was higher than in 2010 due to higher throughput of copper-only ores with higher molybdenum grades.
As part of a major expansion project to increase ore throughput capacity to 130,000 tonnes per day, Antamina successfully commissioned ball mill number four, which is operating at 100% capacity. SAG mill number two remains in the commissioning phase, which commenced in December 2011. The SAG mill received ore feed in early February. In the flotation areas of the project, good progress is being made towards anticipated final commissioning of the copper and zinc flotation in March and the molybdenum circuit in June 2012.
Our 22.5% share of Antamina’s 2012 production is expected to be in the range of 95,000 to 100,000 tonnes of copper, 40,000 to 45,000 tonnes of zinc and 3.5 million pounds of molybdenum in concentrate.

28 Teck 2011 Annual Report
Quebrada BlancaQuebrada Blanca is located in northern Chile, 240 kilometres southeast of the city of Iquique. We own 76.5% of Quebrada Blanca and our partners are Inversiones Mineras S.A. (13.5%), and Empresa Nacional de Minería (ENAMI) (10%). The operation mines ore from an open pit and leaches the ore to produce copper cathodes via a conventional solvent extraction and electrowinning (SX-EW) process. Gross profit before depreciation and amortization was $255 million in 2011, compared with $406 million in 2010, due to a decline in production levels.
In 2011, Quebrada Blanca produced 63,400 tonnes of copper cathode, compared to 86,200 tonnes in 2010. This was due to transitioning from high-grade heap leach to a lower-grade dump leach operation and weather-related issues, including heavy rains from January to March and unusual snow conditions in early July.
Production of approximately 65,000 to 70,000 tonnes of copper cathode is expected in 2012.
Quebrada Blanca’s supergene orebody is expected to be mined out by 2016, but residual copper cathode production is expected to continue, at declining production rates, through 2018.
Work continues on finalizing the feasibility study for the Quebrada Blanca hypogene project by the end of the first quarter of 2012. Production could average approximately 200,000 tonnes of copper and 5,000 tonnes of molybdenum per year in concentrates over a 30-year mine life. There is potential for higher production rates during the first 10 years of operation, with production commencing as early as 2016. Infill and exploration drilling continue to produce encouraging results and a new resource and reserve estimate will be completed following the feasibility study. The project will face the same industry-wide cost pressures as seen on other large-scale projects contemplated for development.
As part of the ongoing project work plan for 2012, the Social Environmental Impact Assessment (SEIA) is expected to be submitted to the Chilean authorities during the second quarter. Work continues on securing long-term power supply for the project and settling project financing arrangements with other shareholders. During 2012, partial funding of the project is expected to allow engineering to continue and the procurement of long-lead equipment to begin so that the schedule for a 2016 start-up can be maintained.
Carmen de AndacolloWe have a 90% interest in the Carmen de Andacollo mine in Chile, which is located 350 kilometres north of Santiago. The remaining 10% is owned by ENAMI. Copper and gold in concentrate and copper cathode are produced from the mine. Gross profit before depreciation and amortization was $288 million in 2011, compared with $91 million in 2010 due to significantly higher copper production and higher copper prices.
Carmen de Andacollo produced a total of 66,100 tonnes of copper contained in concentrate in 2011, compared with 34,800 tonnes in 2010, which included 20,700 tonnes of pre-commercial production prior to September 30, 2010. Copper cathode production was 6,300 tonnes in 2011, compared with 10,300 tonnes last year, as expected, due to the planned depletion of the supergene ore as we transitioned into mining hypogene ore.
Steps were taken to increase plant throughput in 2011, including the installation of a small crusher to feed coarse ore to the pebble crusher and modifications to the SAG mill motor to provide increased power. Concentrate recoveries were above design expectations. In addition, we plan to install a 20,000 tonnes-per-day pre-crushing plant during the first quarter of 2012 at a cost of approximately US$14 million.
We expect 2012 production to be 70,000 to 75,000 tonnes of copper in concentrate and approximately 5,000 tonnes of copper cathode.
Work continues on a study to examine adding more plant capacity to increase annual copper production to a range of 100,000 to 120,000 tonnes. The study includes drilling to confirm additional ore reserves and addresses the key issues of availability of process water and permitting requirements. The study is expected to be completed in the first quarter of 2012. The planned plant throughput and production improvements noted above are not based on a technical report filed under National Instrument 43-101.
29
Duck PondThe Duck Pond underground copper-zinc mine is located in central Newfoundland. Duck Pond’s gross profit before depreciation and amortization was $57 million in 2011, similar to $58 million in 2010.
Copper production in 2011 was 13,200 tonnes while zinc production was 21,300 tonnes. This compares with copper production of 15,000 tonnes and 20,200 tonnes of zinc production in 2010.
The current mine life extends to the end of 2014. Duck Pond’s production in 2012 is expected to be approximately 10,000 to 15,000 tonnes of copper and between 15,000 and 20,000 tonnes of zinc.
Relincho (100% owned)Relincho, a major greenfields copper project, is located in central Chile, approximately 110 kilometres east of the port city of Huasco at an altitude of 2,200 metres above sea level. Prefeasibility work has been completed and indicates that developing a 140,000 tonnes-per-day concentrator and associated facilities would cost approximately US$4 billion, with possible first concentrate production in 2017. Copper production would average 195,000 tonnes per year in the first five years of full production and 180,000 tonnes per year over the 22-year mine life. In addition, 6,000 tonnes per year of molybdenum could be produced as a byproduct over the life of the mine. As a result of the studies completed to date, we decided in the third quarter of 2011 to commence a full feasibility study, which is expected to be complete by the first quarter of 2013.
Galore Creek (50% owned)The Galore Creek project is located in northwest B.C. A prefeasibility study was completed in July 2011 and an advanced engineering program to consider additional development options was completed in the fourth quarter. As a result of this work, the partners have approved a $25 million work program for 2012 that will focus on field work such as infill and geotechnical drilling to support these development options. Additional engineering and environmental studies will also continue.
Mesaba (100% owned)Work on an advanced scoping study at the Mesaba copper-nickel project in northern Minnesota continued in 2011. The study is expected to be completed in mid-2012 and will inform a decision on whether to proceed to prefeasibility.
Cominco Engineering Services Limited (CESL)Located in Richmond, B.C., CESL focuses on advancing and commercializing our proprietary hydrometallurgical technology. We have a well-tested suite of technologies suitable for treating complex copper, copper-gold, copper-nickel and nickel concentrates, particularly those with deleterious elements such as arsenic or magnesium that inhibit the sale of concentrates to conventional smelters. In 2012, the CESL team will continue to seek opportunities to unlock metallurgically challenged resources to create additional value and to commercialize the CESL process.

30 Teck 2011 Annual Report
Markets
Copper prices averaged US$4.00 per pound in 2011, up US$0.58 per pound from the 2010 average. London Metal Exchange (LME) copper prices in 2011 recorded their highest levels in 44 years in real terms and their highest annual average ever in nominal terms.
Copper metal demand grew by 3.5% in 2011 to reach 19.9 million tonnes globally. This growth in demand was partially reflected in LME stocks, which ended the year down 1.8% at 371,000 tonnes. Total reported global stocks (which include producer, consumer, merchant and terminal stocks) stood at an estimated 23 days of global consumption versus the 25-year average of 29 days of global consumption.
Production disruptions continued in 2011, with estimates of close to 1.0 million tonnes of planned production lost during the year. Total copper mine production including solvent extraction and electrowinning (SX-EW) increased by only 0.5% in 2011, keeping the global concentrate market in deficit for the year. Despite a forecast increase in global mine production, smelting capacity utilization is expected to remain under pressure in 2012, with the concentrate market remaining in deficit. Based on a history of production shortfalls over the past seven years, combined with the continuing difficulties in bringing new production to market and the number of labour contracts outstanding at major operations in 2012, continued unplanned production disruptions are likely.
With the concentrate market projected to be in deficit in 2012 and the expectation of continued lower smelter capacity utilization, we would expect an increase in the usage of scrap copper to offset any reduction in concentrate feed. With copper scrap availability also remaining tight, we believe total refined production may be insufficient to meet the increase in global copper demand in 2012. With global copper metal demand projected to increase by 3.7% in 2012 compared to 3.5% in 2011, according to Brook Hunt, a Wood Mackenzie Company, supply is expected to lag behind demand and the copper metal market may record another deficit in 2012.
Copper Price and LME InventorySource: LME
Tonnes (000’s) US$/pound
2007 2008 2009 2010 20110
$1.00
$2.00
$3.00
$4.00
$5.00
0 tonnes
150
300
450
600
Global Demand for CopperTonnes in millions
Source: ICSG, Brook Hunt – a Wood Mackenzie Company
Rest of the World China
1987 1991 1995 1999 2003 2007 20110
$1.00
$2.00
$3.00
$4.00
$5.00
0 tonnes
5
10
15
20
25
Copper InventoriesSource: ICSG, LME, COMEX, SHFE
Tonnes (000’s)
25-year average days inventory
Days
2007 2008 2009 2010 20110
5
10
15
20
25
30
35
0 tonnes
200
400
600
800
1,000
1,200
1,400
959
To
nn
es
19 D
ays
1,09
3 T
on
nes
22 D
ays
1,36
3 T
on
nes
27 D
ays
1,20
8 T
on
nes
23 D
ays
1,23
2 T
on
nes
23 D
ays

31
In 2011, we produced 22.8 million tonnes of coal, the majority of which was shipped to the Asia-Pacific region. Through additional drilling at our coal mines, we expanded our proven and probable reserves by 55% from 665 million tonnes of clean coal at the end of 2010 to over one billion tonnes. In addition, our measured and indicated resources now total over 3.6 billion tonnes and our inferred resources over two billion tonnes of raw coal in each case. Estimated production for 2012 is expected to be in the range of 24.5 to 25.5 million tonnes, depending on customer demand.
With current expansion plans underway at our six existing mines, and the potential restart of our Quintette mine, we expect to reach a production rate of approximately 31 million tonnes of coal per year by 2014, subject to permitting.
In 2011, our coal business unit accounted for 49% of revenue and 57% of gross profit before depreciation and amortization.
Coal
($ in millions) 2011 2010
Revenues $ 5,641 $ 4,351
Gross profit before depreciation and amortization $ 3,306 $ 2,261
Production (000’s tonnes) 22,785 23,109
Sales (000’s tonnes) 22,207 23,167
Operations
Increased gross profit before depreciation and amortization primarily reflects significantly higher selling prices, partially offset by the effects of the stronger Canadian dollar and higher unit cost of product sold. The average realized selling price increased to US$257 per tonne in 2011, compared with US$181 per tonne in 2010.
Factors affecting gross profit in 2011 include higher unit production costs due primarily to the increase in strip ratios, upfront labour settlement costs of approximately $40 million, higher diesel prices and increased contractor costs. Mining contractors were used to a greater extent during 2011 to supplement our own equipment and staffing in order to maximize production and to assist in certain mining areas that are better suited to smaller equipment.
Coal sales volumes of 22.2 million tonnes decreased 4% from 2010, due primarily to a lack of available clean coal inventory in early 2011 and customer-initiated deferrals of shipments late in the year.
Our 2011 production of 22.8 million tonnes decreased slightly from 2010, and fell short of our stated 2011 target. This was due largely to the strike at our Elkview mine and unusually difficult winter weather conditions in the first quarter.
Our investments in mobile equipment and staffing have significantly increased our capacity to move waste and expose raw coal. During 2011, we increased our haul truck fleet size by 23 units and our shovel fleet by two units. In addition, we replaced 21 existing haul trucks and three existing shovels. All of this new equipment is state-of-the-art and large capacity, which increases the overall productivity and efficiency of our mobile equipment fleets. We have also increased our workforce by approximately 500 people. With these additional resources, we ended 2011 achieving record levels of material movement. We completed the expansion of the processing plant at our Greenhills mine during 2011 and the plant expansion at Elkview is expected to be completed in the first quarter of 2012. New five-year union labour agreements were also reached at our Elkview and Fording River mines during 2011.

32 Teck 2011 Annual Report
Work is ongoing to develop and implement selenium management plans for each of our six operating coal mines and for the Quintette Project. It is also possible that permitting for current and future projects may be delayed or withheld until appropriate selenium management plans are developed and implemented. We have begun to implement a number of measures, including a water treatment plant, entailing expenditures of $72 million over the next three years. However, our plans are not yet complete and additional costs may be incurred, which may be significant.
Capital spending in 2011 of $524 million included additional equipment, processing plant upgrades and new pit developments, as well as approximately $70 million for the Quintette Project.
Quintette ProjectOur Quintette mine in northeast British Columbia (B.C.) has been closed since 2000. In June 2010, we initiated a feasibility study to reopen this mine, which is expected to be completed in the second quarter of 2012. Long-lead equipment items, including trucks, shovels and drills have been ordered; preliminary on-site work has commenced; and stakeholder consultation and permitting processes are ongoing. The mine will have a design capacity of approximately three million tonnes per year. Assuming the results of the study are positive and necessary permits are received on a timely basis, the mine could be in production in the second half of 2013.
RailRail transportation from our five mines in southeast B.C. for seaborne export is now provided under a 10-year agreement with the Canadian Pacific Railway (CP) that commenced in April 2011. This agreement provides us with access to increased rail capacity to support our ongoing coal expansion and includes a commitment by CP to invest capital to increase its capacity to transport coal. The new contract also supports and encourages greater collaboration and transparency between the two companies to enhance the effectiveness of the coal supply chain.
PortA number of key initiatives have been undertaken to ensure that we have access to ocean port loading capacity in excess of our planned shipping levels. A new railcar positioning indexer was installed mid-2011 at Neptune Bulk Terminals (Neptune) and a second stacker reclaimer will be constructed and put into operation by early 2013. These two projects will increase Neptune’s capacity from eight million tonnes in 2010 to 12.5 million tonnes per year by mid-2013. In addition, Westshore Terminals has announced an expansion of their capacity to 33 million tonnes per year by the end of 2012 and Teck’s contract with Westshore increases proportionately over its four-year term through March 2016. Finally, Ridley Terminals has announced its intention to double its capacity to 24 million tonnes per year and we have reached agreement for sufficient annual capacity to meet our shipping needs for planned Quintette exports through 2024.
SalesA major focus of our coal marketing strategy has been to establish new customers in markets where long-term growth in steel production and steelmaking coal imports will support our expansion efforts over the long term. Two of the key development markets are India, where steel production growth is in early stages and offers significant upward potential, and China, where urbanization trends favour long-term steel industry growth fundamentals. Over the last year, we have established important new customer relationships in both of these markets that will help us to achieve our growth objectives. At the same time, we continue to focus on enhancing and maintaining relationships with our traditional customers.
Markets
The supply of high quality seaborne steelmaking coal was tight for much of 2011, resulting largely from robust demand and weather-related production shortfalls in Australia. Demand was generally strong until late 2011 as customers purchased all available product to make up for the earlier supply disruptions. That situation changed near the end of 2011 when steel demand softened. At the same time, coal production in Canada and Australia had fully recovered from earlier disruptions. Weaker demand and better availability of coal caused the benchmark price for our highest-quality products to decrease from a record high of US$330 per tonne earlier in the year to US$235 per tonne for the first quarter of 2012.
33
We are one of the world’s largest producers of zinc, primarily from our Red Dog mine in Alaska and Antamina mine in northern Peru. Our operation in Trail, British Columbia (B.C.) is also one of the world’s largest and lowest-cost integrated zinc and lead smelting and refining operations. In total we produced 646,000 tonnes of zinc (Teck’s share) contained in concentrate while our Trail Operations produced 291,200 tonnes of refined zinc in 2011. In 2012, we estimate production of zinc in concentrate to be in the range of 580,000 to 610,000 tonnes and production of refined zinc to be in the range of 280,000 to 290,000 tonnes.
As an integrated metal producer, we also provide recycling solutions for metal-bearing scrap and residue, also known as electronic waste (e-waste). In 2011, we processed more than 15,000 tonnes of e-waste at our Trail Operations and announced plans to significantly expand our capacity to recycle this material.
In 2011, our zinc business unit accounted for 24% of revenue and 14% of gross profit before depreciation and amortization.
Zinc
Revenues
Gross Profit BeforeDepreciation and Amortization
($ in millions) 2011 2010 2011 2010
Red Dog $ 1,008 $ 1,106 $ 547 $ 571
Trail 1,989 1,447 256 155
Other 18 40 2 9
Inter-segment sales (250) (230) 3 (20)
Total $ 2,765 $ 2,363 $ 808 $ 715
Production Sales(000’s tonnes) 2011 2010 2011 2010
Refined zinc
Trail 291 278 289 274
Contained in concentrate
Red Dog 572 538 556 585
Other business units 74 107 75 111
Total 646 645 631 696
34 Teck 2011 Annual Report
Operations
Red DogRed Dog is located in northwest Alaska and is one of the world’s largest zinc mines. Red Dog’s gross profit before depreciation and amortization was $547 million, compared with $571 million in 2010. The lower 2011 gross profit was mainly due to lower metal prices and lower sales volumes as a result of the timing of shipments.
In 2011, zinc production at Red Dog was 572,200 tonnes compared to 538,000 tonnes in 2010. This was due to record mill throughput. Lead production in 2011 was 84,000 tonnes compared to 109,900 in 2010 due to lower ore grades and lower recoveries from near-surface weathered ore from the Aqqaluk pit.
Red Dog’s location exposes the operation to severe weather and winter ice conditions, which can significantly impact production, sales volumes and operating costs. In addition, the mine’s bulk supply deliveries and all concentrate shipments occur during a short ocean shipping season that normally runs from early July to late October. This short shipping season means that Red Dog’s sales volumes are higher in the last six months of the year, resulting in significant variability in its quarterly earnings, depending on metal prices.
In accordance with the operating agreement governing the Red Dog mine between Teck and NANA Regional Corporation Inc. (NANA), NANA is entitled to a royalty equal to 25% of net proceeds of production. This royalty increases by 5% every fifth year to a maximum of 50%, with the next increase to 30% occurring in the fourth quarter of 2012. The NANA royalty charge in 2011 was US$129 million, compared with US$173 million in 2010. NANA has advised us that it ultimately shares approximately 62% of the royalty, net of allowable costs, with other Regional Alaskan Native Corporations pursuant to section 7(i) of the Alaska Native Claims Settlement Act.
Red Dog continues to pursue a renewal of its main water discharge permit. In January 2010, the United States Environmental Protection Agency (EPA) released the Aqqaluk Supplemental Environmental Impact Statement (SEIS) and simultaneously issued a new water discharge permit for the mine under the National Pollutant Discharge Elimination System (NPDES). As a result of a third-party appeal of the State of Alaska’s certification of that permit, the conditions of the new permit governing effluent limitations for lead, selenium, zinc, cyanide and total dissolved solids (TDS) were stayed pending resolution of the appeal by the Environmental Appeal Board. In March 2010, those limitations were withdrawn by the EPA to allow them additional time to consider arguments raised by the appeal and to discuss these issues with the State of Alaska. Until a permit with attainable limits is issued, the corresponding provisions of our existing permit will remain in effect. The existing permit contains an effluent limitation for TDS that the mine cannot meet. The mine will, however, discharge water in accordance with limits found in the SEIS to be fully protective of the environment, and which are consistent with the court-imposed interim discharge limits already applicable to the mine under a 2008 settlement agreement.
We continue to work with regulators to finalize a renewed water discharge permit for Red Dog. We believe that the regulatory process has been appropriate and robust and that a permit with appropriate effluent limitations will ultimately be issued. Nonetheless, there can be no assurance that further appeals or permit uncertainty will not give rise to liability or impede mining activities, or that permit conditions that are ultimately issued will not impose significant costs on the Red Dog operation.
We expect 2012 production to be in the range of 525,000 to 545,000 tonnes of zinc contained in concentrate and approximately 70,000 tonnes of lead contained in concentrate.
Trail OperationsOur Trail Operations in B.C. is one of the world’s largest fully integrated zinc and lead smelting and refining complexes. They also produce a variety of precious and specialty metals, chemicals and fertilizer products. Trail Operations has a two-thirds interest in the Waneta hydroelectric dam as well as ownership of the related transmission system. The Waneta Dam provides low-cost, clean, renewable power to the metallurgical operations.
Trail Operations contributed $256 million to gross profit before depreciation and amortization in 2011, compared with $155 million in 2010. The increase in gross profit was due primarily to higher prices for silver and higher production and sales volumes of zinc, lead and silver. These gains were partially offset by higher labour and supply costs associated with higher production.
Refined zinc production totalled 291,200 tonnes in 2011, compared with 278,300 tonnes the previous year. This increase is due, in part, to improved performance of the zinc electrolytic plant.
Refined lead production of 85,600 tonnes was higher than the 71,500 tonnes produced in 2010. This increased production was due, in part, to the KIVCET furnace operating at higher feed rates than in 2010, improved oxygen supply reliability and no loss of production in 2011 due to planned major maintenance outages.
Record silver production of 21.7 million ounces resulted from increased treatment of silver-bearing concentrate.

Our e-waste recycling process treated 15,600 tonnes of material during the year, and we plan to treat about 17,000 tonnes in 2012. In August 2011, we reached a milestone of 50,000 tonnes recycled since the initiative was undertaken in 2006. We are continuing to process zinc alkaline batteries as part of our expanded efforts in recycling post-consumer waste and, in 2011, we began processing fluorescent light bulbs.
In September 2011 we announced plans to invest $210 million at our Trail Operations to significantly increase our capacity to recycle end-of-life electronics. This $210 million project includes the construction of a new slag fuming furnace and a settling furnace that will integrate into the existing lead smelting process. Construction on the project will begin in 2012, with completion scheduled for 2014. In November, we announced an additional investment of $125 million for installation of a new acid plant, which will replace two existing plants and is expected to deliver enhanced operating reliability and flexibility as well as improved environmental performance. Construction is scheduled to begin in April 2012, with the new plant expected to go into service in late 2013.
In 2012, we expect to produce in the range of 280,000 to 290,000 tonnes of refined zinc, approximately 85,000 tonnes of refined lead and approximately 21 million ounces of silver.
Other Zinc OperationsOur Pend Oreille mine, located in Washington State, has been on care and maintenance since February 2009. A core group of employees is working to keep the site ready in the event of a future restart. All regulatory and environmental requirements are being met.
Markets
Zinc prices on the London Metal Exchange (LME) averaged US$0.99 per pound for the year, up US$0.01 per pound from the 2010 average.
In 2011, global zinc metal consumption grew to 13 million tonnes, which was an increase of 4% over 2010 levels. Metal premiums increased in North America while premiums in Asia and in Europe remained stable. Despite the improved demand for zinc in 2011, metal supply grew at a greater rate, leading to a surplus metal market in 2011 of 300,000 tonnes. LME stocks increased by 120,000 tonnes or 17% over 2010 levels and finished the year at 822,000 tonnes. We estimate that total global stocks (which include producer, consumer, merchant and terminal stocks) increased by 294,000 tonnes representing an estimated 51 days of global consumption compared to the 25-year average of an estimated 41 days.
In 2011, global mine production grew by 3%, or 370,000 tonnes of contained zinc, while global refined production rose by 500,000 tonnes or 4%. In 2010, the global concentrate market recorded a deficit and in 2011 the concentrate market remained in deficit as evidenced by falling spot processing fees.
In 2012, we believe the global zinc concentrate market will continue to be in a structural deficit, as global refinery capacity, primarily in China, is expected to grow at a greater rate than global mine production. This structural concentrate deficit should mean that refineries will operate at below full utilization rates and may result in cuts in metal production from planned levels. However, we believe that global refined production should still grow at a greater rate than refined demand, leading to a global zinc metal surplus.
Tonnes (000’s) US$/pound
2007 2008 2009 2010 20110
$1
$2
$3
0 tonnes
300
600
900
Rest of the World China
1987 1991 1995 1999 2003 2007 20110
$1.00
$2.00
$3.00
$4.00
$5.00
0 tonnes
2
4
6
8
10
12
14
Tonnes (000’s)
25-year average days inventory
Days
2007 2008 2009 2010 2011
635
To
nn
es
21 D
ays
828
To
nn
es
27 D
ays
1,09
6 T
on
nes
37 D
ays
1,47
8 T
on
nes
43 D
ays
1,72
2.5
To
nn
es
51 D
ays
0
10
20
30
40
50
60
0 tonnes
300
600
900
1,200
1,500
1,800
Zinc Price and LME InventorySource: LME
Global Demand for ZincTonnes in millions Source: ILZSG, Brook Hunt – a Wood Mackenzie Company
Zinc InventoriesSource: ILZSG, LME, SHFE
35

36 Teck 2011 Annual Report
Fort Hills Oil Sands Project
The Fort Hills oil sands project is located approximately 90 kilometres north of Fort McMurray in northern Alberta. We hold a 20% interest in the Fort Hills Energy Limited Partnership (Fort Hills Partnership), which owns the Fort Hills oil sands project, with 39.2% held by Total E&P Canada Ltd. (Total) and the remaining 40.8% held by the operator of the project, Suncor Energy Inc. (Suncor).
At December 31, 2011, our best estimate of our 20% share of the recoverable bitumen at Fort Hills is 684 million barrels. To the end of 2011, approximately $2.8 billion has been spent on the Fort Hills project. Our share was $961 million, of which $54 million was spent in 2011. In connection with our ownership interest, we are committed to fund 27.5% of the next $4.7 billion of project spending and our 20% pro rata share thereafter.
Engineering studies are ongoing to update the design basis for the project and improve the accuracy of the cost estimates in anticipation of a project sanction decision by the partners in 2013. Should the partners sanction Fort Hills (Phase 1), production is anticipated to start in 2016, ramping up to approximately 160,000 barrels per day of bitumen production. Potential exists to double production with Phase 2, up to 320,000 barrels per day.
Suncor has provided a forecast project spending estimate of approximately $800 million for 2012, of which our share would be $220 million, including our earn-in commitments.
Located in the Athabasca oil sands region of northeastern Alberta, our energy assets include a 20% interest in the Fort Hills oil sands project and a 50% interest in the Frontier oil sands project. In addition, we hold a 50% interest in various other oil sands leases in the exploration phase, including the Lease 421 Area. Our recoverable contingent bitumen resources totalled 2.1 billion barrels at the end of 2011. These valuable long-term assets are located in a politically stable jurisdiction and will be mined using conventional technologies that build upon our core skills in large-scale truck and shovel operations.
We recognize that there are concerns over the potential environmental impact of developing oil sands projects. As such, we are researching methods to improve extraction and processing to enhance the sustainability of our projects. We are encouraged by the progress of the industry towards improving technology and production processes, reducing water consumption, improving tailings management, and increasing land reclamation and revegetation.
We are also developing renewable energy projects. We have a 30% interest in the Wintering Hills Wind Power Project, which became fully operational in November of 2011.
The disclosure that follows includes references to contingent bitumen resource estimates. Further information on these estimates, and the related risks and uncertainties, is set out in our most recent Annual Information Form filed on SEDAR and under cover of Form 40-F on EDGAR. There is no certainty that it will be commercially viable to produce any portion of the contingent resources.
Energy

Teck/SilverBirch Joint Venture
We jointly hold, with SilverBirch Energy Corporation (SilverBirch), oil sands leases located near the Fort Hills project. To date, we have spent $388 million for our 50% share of the acquisition, exploration and engineering costs of these oil sands leases, of which $15 million was spent in 2011.
In January 2012, we entered into an agreement to acquire SilverBirch by way of a plan of arrangement for a net cash outlay of $435 million. Closing of the transaction is subject to SilverBirch shareholders approval and receipt of necessary regulatory approvals. On closing, the transaction will give Teck full ownership of the Frontier project, including Equinox. SilverBirch assets other than its interest in Frontier and Equinox will be transferred to a new company, which will be owned by SilverBirch’s shareholders. Completion of this transaction will create a simplified ownership structure for Frontier, provides an opportunity to explore new partnerships and other alternatives to move the project towards development, and reduces Teck’s exposure to oil sands leases not amenable to mining. If the transaction closes, it will increase our best estimate of our total contingent resources by 67% to a total of 3.5 billion barrels of bitumen. This transaction is expected to close in April 2012.
Frontier ProjectThe Frontier project is located immediately northwest of the Fort Hills project in northern Alberta. We hold a 50% interest in the Frontier project. In November 2011 the Frontier project application was submitted to regulators. Review and approval of the application is expected to take approximately three years. In January, the federal government announced the referral of the Frontier regulatory application to an independent review panel. The Frontier project requires various provincial and federal regulatory reviews; conducting these reviews in parallel can streamline and improve the regulatory process while maintaining a thorough and rigorous review.
The Frontier project consists of approximately 28,960 hectares of oil sands leases and as at December 31, 2011, our best estimate is that our 50% interest in the Frontier project represents approximately 1.4 billion barrels of contingent bitumen resources. The project has been designed for up to four production lines with a total capacity of approximately 277,000 barrels per day of bitumen; the first two production lines are planned to have a production capacity of 159,000 barrels per day. The Frontier project includes an option of developing Equinox, 10 kilometres south of Frontier, as a satellite operation.
In 2011, Teck completed testing and sampling at 83 geotechnical sites on and around the Frontier project leases. This geotechnical program was designed to gain information on material suitability and foundation conditions in the proposed facilities areas. No field exploration activities are planned in 2012 – the key focus will be on supporting the regulatory application review, consultations with stakeholders and ongoing engineering studies.
Lease 421 Area
We hold a 50% interest in the Lease 421 Area, which is located east of the Fort Hills project in northern Alberta. In 2011, a seismic program was successfully completed on the Lease 421 Area. Data acquired during the field seismic program should assist in planning future resource delineation programs.
To date, a total of 59 core holes have been completed in the Lease 421 Area. The results indicate 49 of the core holes contain prospective oil sands that range in thickness from 10 to 40 metres (averaging 19 metres) with oil sand grades ranging from 9% to 18% by weight, with 10% to 12% fines and overburden thicknesses ranging from 17 to 68 metres (averaging 39 metres). These results indicate the potential for a mineable resource; however, further core hole drilling is required to establish the quantity and quality of any potential resource, and environmental baseline data collection is required to assess any future project potential. We expect to spend approximately $5 million for our share of the exploration, engineering and community activities during 2012.
Wintering Hills Wind Power Project
Wintering Hills is located near Drumheller, Alberta. We hold a 30% interest in Wintering Hills with Suncor Energy Products Inc., a wholly owned subsidiary of Suncor Inc., the project operator. Installation of 55 wind turbines was completed during 2011 and operations began in November 2011. Our share of expected power generation in 2012 is 80 GWhs, which will result in 50,000 tonnes of CO2-equivalent offsets. Our total investment in connection with the project was approximately $64 million.
37

38 Teck 2011 Annual Report
Throughout 2011, exploration efforts in Canada, Alaska, Mexico, Chile, Peru, Ireland, Turkey, Namibia and Australia were carried out through our eight regional offices. Expenditures of $105 million in 2011, including mine site and development/engineering projects, were focused on copper, zinc and gold opportunities.
Several Teck-owned porphyry copper projects in Canada, Chile, Mexico, Peru, Turkey and Namibia were drilled during 2011. Three joint venture copper projects – Halilaga in Turkey, La Verde in Mexico, and Zafranal in Peru – are continuing to advance through the resource estimate stage. In addition, several Teck-owned copper projects in Mexico, Peru, Chile, Brazil and Namibia were drilled by other parties, pursuant to earn-in agreements. In 2011, we conducted ground geophysical surveys and drill target definition outside the historical Bethlehem pits at our Highland Valley Copper mine in Canada. At our Quebrada Blanca mine in Chile, we drilled targets approximately 10 kilometres from the existing mine and at our Relincho Project in Chile we made new surface discoveries approximately two kilometres from the planned pit. In 2012, we plan to drill several copper projects in British Columbia, Mexico, Peru, Chile, Turkey and Namibia.
Zinc exploration remains focused in three areas: the Red Dog mine district in Alaska, northeastern Australia, and Ireland. In both Alaska and Australia, the target type is large, high-grade, sediment-hosted deposits similar to Red Dog. In 2011, we undertook approximately 4,000 metres of exploration drilling on the Noatak project, where there are multiple high quality targets near our existing Red Dog mine. In Ireland, the target type is large high-grade deposits similar to the producing Navan mine. We also conducted exploration drilling for zinc in northeastern Australia and in Ireland in the Limerick Basin. Drill programs will continue in all three countries in 2012.
In addition to exploring for copper and zinc, we are exploring for, and looking to partner in, new gold opportunities. Our plan is to explore, find and advance gold resources through targeted exploration activity in secure jurisdictions. Once an opportunity has been recognized, the strategy is to optimize that opportunity or asset through further definition drilling and engineering studies and then capture value through periodic divestitures. Our current exploration efforts in gold are primarily focused in Canada, Chile, Peru, Mexico and Turkey. In 2011, our Demir and Halilaga gold exploration projects in Turkey moved toward the resource estimate stage. In 2012, we expect our TV Tower project in Turkey will also progress toward the resource estimate stage. We will also drill projects in Alaska, Peru and Chile in 2012.
Exploration
Exploration by Location 2011
AsiaPacific
SouthAmerica
NorthAmericaEurope
22%39%
30%
9%
Exploration by Commodity 2011
Other
Gold
CopperZinc
10%
22% 44%
24%

39
Our results for 2011 were prepared in accordance with International Financial Reporting Standards (IFRS), which we now treat as Generally Accepted Accounting Principles (GAAP). On conversion to IFRS our accounting policies changed and the presentation, financial statement captions and terminology used in this annual report and the accompanying consolidated financial statements differ in many respects from that used in all previously issued financial statements and annual reports. Further details on the conversion to IFRS are provided under the caption “International Financial Reporting Standards” and in the notes to our consolidated financial statements as at and for the year ended December 31, 2011. The new accounting policies have been applied in accordance with the transition rules applicable to the conversion to IFRS. Under these transition rules, comparative figures as at and for the year ended December 31, 2010 have been prepared and presented in accordance with IFRS. Comparative figures for 2009 have been prepared and presented in accordance with accounting principles generally accepted in Canada for that period. In addition, certain comparative figures have been reclassified to conform to the presentation adopted for 2011.
Financial Overview
Financial Summary($ in millions, except per share data) 2011 2010 2009
Revenue and profit
Revenues $ 11,514 $ 9,223 $ 7,674 Gross profit before depreciation and amortization $ 5,788 $ 4,438 $ 3,662 EBITDA* $ 5,459 $ 4,326 $ 4,109 Profit attributable to shareholders $ 2,668 $ 1,820 $ 1,831
Cash flow
Cash flow from operations $ 3,957 $ 3,274 $ 2,983 Capital expenditures $ 1,236 $ 810 $ 590 Investments $ 463 $ 46 $ 372
Balance sheet
Cash balances, including restricted cash $ 4,405 $ 832 $ 1,420 Total assets $ 34,219 $ 29,055 $ 29,873 Debt, including current portion $ 7,035 $ 4,948 $ 8,004
Per share amounts
Profit attributable to shareholders Basic $ 4.52 $ 3.09 $ 3.43 Diluted $ 4.50 $ 3.08 $ 3.42 Dividends declared per share $ 0.70 $ 0.50 $ –
*EBITDA is a non-GAAP financial measure. See “Use of Non-GAAP Financial Measures” section for further information.
Financial data for 2011 and 2010 was prepared in accordance with IFRS. Financial data for 2009 was prepared using Canadian GAAP.

40 Teck 2011 Annual Report
Our revenue and profit depend on prices for the commodities we produce, sell and use in our production processes. Commodity prices are determined by the supply of and demand for those commodities, which are influenced by global economic conditions. We normally sell the products that we produce at prevailing market prices or in the case of steelmaking coal, at negotiated prices on term contracts. Prices for these products, particularly for exchange-traded commodities, can fluctuate significantly and that volatility can have a material effect on our financial results.
We record our financial results using the Canadian dollar and accordingly, our operating results and cash flows are affected by changes in the Canadian dollar exchange rate relative to the currencies of other countries where we operate. Exchange rate movements can have a significant impact on our results, as a significant portion of our operating costs are incurred in Canadian and other currencies and most of our revenues and debt are denominated in United States (U.S.) dollars.
Profit attributable to shareholders for 2011 was $2.7 billion, or $4.52 per share, which included $146 million of after-tax gains on the sale of assets. This compares with $1.8 billion or $3.09 per share in 2010, which included a total of $768 million of after-tax gains on the sale of assets and a $658 million after-tax charge related to our debt refinancing activities. Profit attributable to shareholders in 2009 was $1.8 billion, or $3.43 per share, which included $881 million of after-tax non-cash foreign exchange gains and gains on the sale of assets.
Our profit over the past three years has included items that we segregate for presentation to investors so that the ongoing profit of the company may be more clearly understood. These are described below and summarized in the table that follows. Excluding these items, our profit for 2011 was positively affected by higher prices for our major commodities.
Our profit in 2010 included $65 million of after-tax non-cash foreign exchange gains and $768 million of after-tax gains on the sale of various assets that were undertaken as part of our debt reduction plan. Partially offsetting these favourable items were $658 million of after-tax unamortized discounts and issues costs related to our Fording acquisition debt that we wrote off as we repaid and refinanced that debt.
Our profit in 2009 included $561 million of after-tax non-cash foreign exchange gains on our net debt and $320 million of after-tax gains on the sale of various assets that were undertaken as part of our debt reduction plan. Partially offsetting these favourable items were $117 million of unamortized discounts and issues costs related to our Fording acquisition debt that we wrote off as we repaid and refinanced that debt and $139 million of impairment losses related to our oil sands assets, the majority of which relates to the delay of the mine and bitumen production portion of the Fort Hills project.
The table below shows the impact of these items on our profit.
2011 2010 2009
Profit attributable to shareholders $ 2,668 $ 1,820 $ 1,831
Add (deduct) the after-tax effect of:
Gains on sale of assets (146) (768) (320)
Foreign exchange gains (4) (65) (561)
Derivative (gains) losses (128) (153) 36
Financing items – 658 117
Asset impairments and write downs 23 – 139
Tax items – 11 (30)
Collective agreement charges 55 – –
Earnings from discontinued operations – – (81)
Adjusted profit* $ 2,468 $ 1,503 $ 1,131
Adjusted earnings per share* $ 4.18 $ 2.55 $ 2.12
*Adjusted profit and adjusted earnings per share are all non-GAAP measures. See “Use of Non-GAAP Financial Measures” section for further information.

41
2011 Revenue by Business Unit 2011 Revenue by Commodity2011 Gross Profit
by Business Unit*
*Before depreciation and amortization
Zinc
Coal
Zinc
Coal
Coal
Copper
Copper
Copper
Zinc
Silver
Other
Lead
14%
29%
57%
24%
49%
27%
3%
5%
8%
12%
23%
49%
Cash flow from operations in 2011 was $4.0 billion, compared with $3.3 billion in 2010 and $3.0 billion in 2009. The changes in cash flow from operations are due mainly to the volatility in commodity prices and changes in the Canadian/U.S. dollar exchange rate.
At December 31, 2011, our cash balance was $4.4 billion. Total debt was $7.0 billion and our net debt to net debt-plus-equity ratio was 13% compared with 21% at December 31, 2010.
Gross Profit
Our gross profit is made up of our revenues less the operating, depreciation and amortization expenses at our producing operations. Income and expenses from our business activities that do not produce commodities for sale are included in our other operating income and expenses or in our non-operating income and expenses.
Our principal commodities are copper, steelmaking coal and zinc, which accounted for 23%, 49% and 12% of revenues respectively in 2011. Silver and lead are significant byproducts of our zinc operations, accounting for 8% and 3% each, respectively, of our 2011 revenues. We also produce a number of other byproducts including molybdenum, various specialty metals, chemicals and fertilizers, which in total accounted for 5% of our revenue in 2011.
Our revenues are affected by sales volumes, which are determined by our production levels and demand for the commodities we produce, commodity prices and currency exchange rates.
Our revenues were a record $11.5 billion in 2011 compared with $9.2 billion in 2010, driven by higher average prices for our main commodities in 2011 than 2010 and higher sales volumes for our copper, partly offset by lower sales volumes of steelmaking coal and zinc.
Our cost of sales includes all of the expenses required to produce our products, such as labour, energy, operating supplies, concentrates purchased for our Trail Operations’ refining and smelting operation, royalties, and marketing and distribution costs required to sell and transport our products to various delivery points. Our cost of sales also includes depreciation and amortization expense. Due to the geographic locations of many of our operations, we are highly dependent on third parties for the provision of rail, port and other distribution services. In certain circumstances, we negotiate prices for the provision of these services where we may not have viable alternatives to using specific providers, or may not have access to regulated rate-setting mechanisms. Contractual disputes, demurrage charges, rail and port capacity issues, availability of vessels and railcars, weather problems and other factors can have a material effect on our ability to transport materials from our suppliers and to our customers in accordance with schedules and contractual commitments.
The magnitude of our costs is dictated mainly by our production volumes, the costs of labour, operating supplies and concentrate purchases, by strip ratios, haul distances and ore grades, and by distribution costs, commodity prices, foreign exchange rates and costs related to non-routine maintenance projects. Production volumes mainly affect our variable operating and our distribution costs. In addition, production may also affect our sales volumes and, when combined with commodity prices, affects profitability and ultimately our royalty expenses.

42 Teck 2011 Annual Report
Our cost of sales was $6.6 billion in 2011, compared with $5.7 billion in 2010. The new copper concentrator at Carmen de Andacollo operated for a full year in 2011, compared with three months in 2010, as commercial production commenced October 1, 2010. This accounted for approximately $250 million of the increase in cost of sales in 2011. We also incurred one-time labour settlement costs at Highland Valley Copper and our coal operations totalling $84 million in 2011. The balance of our higher costs of sales was partly due to increased energy costs, consumables and the use of contractors to maximize production at our coal operations. In addition, the cost of concentrate purchases at our Trail Operations increased by approximately $400 million due to higher metal prices, especially for silver, and as a result of our Trail Operations functioning at higher production levels compared with 2010.
In 2011, our depreciation expense was $911 million compared with $916 million in 2010. An increase in throughput at our copper operations led to a slight increase in the depreciation charge in our copper division. However, this was more than offset by the effect of an increase in our coal reserves, which reduced our per-unit amortization rate and our overall depreciation charge for coal. We expect that these increased reserves will have a more significant effect in reducing the depreciation charge in 2012.
Other Expenses
($ in millions) 2011 2010
General and administrative $ 125 $ 137
Exploration 105 56
Research and development 17 20
Other operating expense (income) 174 (640)
Finance income (113) (95)
Finance expense 595 691
Non-operating expense (income) (197) 418
Share of income (losses) of associates 5 5
$ 711 $ 592
We must continually replace our reserves as they are depleted in order to maintain production levels over the long term. We try to do this through our exploration and development program and through acquisition of interests in new properties or in companies that own such properties. Exploration for minerals and oil is highly speculative and the projects involve many risks. The vast majority of exploration projects are unsuccessful and there are no assurances that current or future exploration programs will find deposits that are ultimately brought into production. We have increased our exploration activities in 2011 and 2010.
Our research and development expenditures are primarily focused on advancing our proprietary CESL hydrometallurgical technology, the development of internal and external growth opportunities, and the development and implementation of process and environmental technology improvements at operations.
Other operating income and expenses includes items we consider to be related to the operation of our business, such as final pricing adjustments, which are further described in the next paragraph, share-based compensation, gains or losses on commodity derivatives, gains or losses on sale of operating or exploration assets, and provisions for our closed properties. Significant items in 2011 include $130 million of gains on the sale of assets, $210 million of negative pricing adjustments described in more detail in the paragraph that follows and a $21 million expense recovery for share-based compensation resulting from the decline in our share price. Significant items in 2010 included $721 million of gains on the sale of assets, $116 million of positive pricing adjustments and a $124 million charge for share-based compensation.
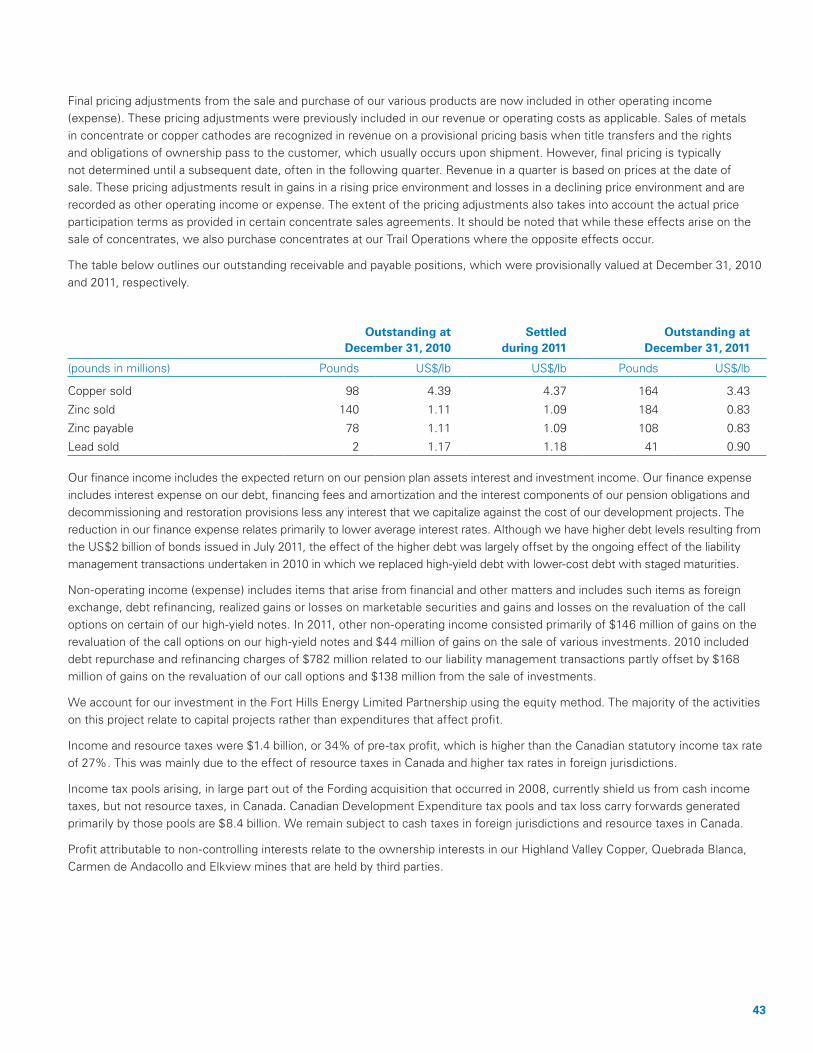
43
Final pricing adjustments from the sale and purchase of our various products are now included in other operating income (expense). These pricing adjustments were previously included in our revenue or operating costs as applicable. Sales of metals in concentrate or copper cathodes are recognized in revenue on a provisional pricing basis when title transfers and the rights and obligations of ownership pass to the customer, which usually occurs upon shipment. However, final pricing is typically not determined until a subsequent date, often in the following quarter. Revenue in a quarter is based on prices at the date of sale. These pricing adjustments result in gains in a rising price environment and losses in a declining price environment and are recorded as other operating income or expense. The extent of the pricing adjustments also takes into account the actual price participation terms as provided in certain concentrate sales agreements. It should be noted that while these effects arise on the sale of concentrates, we also purchase concentrates at our Trail Operations where the opposite effects occur.
The table below outlines our outstanding receivable and payable positions, which were provisionally valued at December 31, 2010 and 2011, respectively.
Outstanding at
December 31, 2010Settled
during 2011Outstanding at
December 31, 2011
(pounds in millions) Pounds US$/lb US$/lb Pounds US$/lb
Copper sold 98 4.39 4.37 164 3.43
Zinc sold 140 1.11 1.09 184 0.83
Zinc payable 78 1.11 1.09 108 0.83
Lead sold 2 1.17 1.18 41 0.90
Our finance income includes the expected return on our pension plan assets interest and investment income. Our finance expense includes interest expense on our debt, financing fees and amortization and the interest components of our pension obligations and decommissioning and restoration provisions less any interest that we capitalize against the cost of our development projects. The reduction in our finance expense relates primarily to lower average interest rates. Although we have higher debt levels resulting from the US$2 billion of bonds issued in July 2011, the effect of the higher debt was largely offset by the ongoing effect of the liability management transactions undertaken in 2010 in which we replaced high-yield debt with lower-cost debt with staged maturities.
Non-operating income (expense) includes items that arise from financial and other matters and includes such items as foreign exchange, debt refinancing, realized gains or losses on marketable securities and gains and losses on the revaluation of the call options on certain of our high-yield notes. In 2011, other non-operating income consisted primarily of $146 million of gains on the revaluation of the call options on our high-yield notes and $44 million of gains on the sale of various investments. 2010 included debt repurchase and refinancing charges of $782 million related to our liability management transactions partly offset by $168 million of gains on the revaluation of our call options and $138 million from the sale of investments.
We account for our investment in the Fort Hills Energy Limited Partnership using the equity method. The majority of the activities on this project relate to capital projects rather than expenditures that affect profit.
Income and resource taxes were $1.4 billion, or 34% of pre-tax profit, which is higher than the Canadian statutory income tax rate of 27%. This was mainly due to the effect of resource taxes in Canada and higher tax rates in foreign jurisdictions.
Income tax pools arising, in large part out of the Fording acquisition that occurred in 2008, currently shield us from cash income taxes, but not resource taxes, in Canada. Canadian Development Expenditure tax pools and tax loss carry forwards generated primarily by those pools are $8.4 billion. We remain subject to cash taxes in foreign jurisdictions and resource taxes in Canada.
Profit attributable to non-controlling interests relate to the ownership interests in our Highland Valley Copper, Quebrada Blanca, Carmen de Andacollo and Elkview mines that are held by third parties.

44 Teck 2011 Annual Report
Financial Position and Liquidity
Our financial position and liquidity continued to improve during 2011. This was a result of the cash flow derived from our operations and $1.9 billion from long-term notes issued in July. Our total debt balance was $7.0 billion at December 31, 2011 compared with $4.9 billion at the end of 2010.
Our debt positions and credit ratios are summarized in the following table.
December 31,
2011
December 31,
2010
Fixed rate term notes $ 6,698 $ 4,694
Other 219 281
Total debt (US$ in millions) 6,917 4,975
Canadian $ equivalent at year-end exchange rate 7,035 4,948
Less cash balances (4,405) (832)
Net debt $ 2,630 $ 4,116
Debt to debt-plus-equity 28% 24%
Net debt to net debt-plus-equity 13% 21%
Average interest rate at year-end 6.93% 7.59%
The cost of funds under our credit facilities depends in part on our credit ratings. Moody’s currently rates us at Baa2 with a stable outlook, Standard & Poor’s rates us at BBB with a stable outlook, Dominion Bond Rating Service rates us as BBB with a stable trend and Fitch Ratings rates Teck as BBB with a stable outlook. The costs under our credit facilities would change if certain of our credit ratings were to change.
Our primary sources of liquidity and capital resources are our cash and temporary investments, cash flow provided from operations and funds available under our committed bank credit facilities, of which approximately $1.1 billion is currently available.
Operating Cash FlowCash flow from operations was $4.0 billion in 2011 compared with $3.3 billion in 2010. The increased cash flow from operations in 2011 was due mainly to the higher gross profits at our operations from rising commodity prices.
Investing ActivitiesCapital expenditures were $1.2 billion in 2011 and included $520 million on sustaining capital and $720 million on development projects. The largest components of sustaining expenditures were $250 million at Teck Coal, approximately $50 million at each of Trail Operations, Red Dog, Quebrada Blanca and $45 million at Highland Valley Copper. Development expenditures included approximately $275 million at Teck Coal as part of our plans to increase coal production to 31 million tonnes, $130 million for our share of the Antamina expansion project, $85 million for Highland Valley Copper’s mine life extension project, $75 million for the Phase 2 hypogene project at Quebrada Blanca, $40 million at Carmen de Andacollo and $32 million for the Wintering Hills Wind Power Project. Investments in 2011 totalled $463 million, of which $300 million was for a number of publicly traded companies and $54 million for our share of costs for our equity accounted investment in Fort Hills.
Cash proceeds from the sale of non-core assets in 2011 totalled $289 million. The amount includes $128 million for the sale of the Carrapateena project in Australia and $161 million from the sale of other assets and investments in publicly traded companies.

45
Financing ActivitiesSignificant financing activities during 2011 included the US$2 billion notes offering that closed in July, for net proceeds of $1.9 billion and the $171 million to repurchase 4.8 million Class B subordinate voting shares for cancellation pursuant to our normal course issuer bid.
During the first half of 2010, we repaid the remaining outstanding balance of US$2.35 billion on the term loan related to our 2008 acquisition of Fording Coal with cash flow derived from our operations and proceeds from the sale of non-core assets. In the latter half of 2010 we initiated three tender offers totalling US$1.450 billion and acquired and cancelled US$1.993 billion of the high-yield notes that we issued in May 2009. We financed these tender offers with cash on hand and the issuance of new lower coupon notes maturing in 2017, 2021 and 2040. These transactions reduced our future interest expense by approximately US$225 million per year. We retired debt with an average maturity of six years and issued debt with an average maturity of 18 years.
On February 28, 2012, we issued US$500 million of senior unsecured notes due March 1, 2019 and US$500 million of senior unsecured notes due March 1, 2042. The 2019 notes bear interest at 3% per annum and the 2042 notes bear interest at 5.2% per annum. We also issued a notice of redemption to redeem all US$530 million principal amount of our outstanding 9.75% senior notes due 2014 and US$521 million principal amount, or approximately half, of our outstanding 10.75% senior notes due 2019, with the redemption to take place on March 19, 2012. We intend to use the net proceeds from our offering of the notes described above plus cash on hand to fund the redemptions. Interest expense savings resulting from the redemption and the issuance of new notes are expected to be approximately US$55 million per annum, on an after-tax basis, and we expect to record an estimated net after-tax accounting charge of approximately US$340 million in the first quarter of 2012 in connection with the redemption.
Including the issue and redemption of notes described in the paragraph above, average maturity profile of our consolidated indebtedness is approximately 15.1 years and the weighted average interest rate is approximately 6.0%.
Quarterly Earnings and Cash Flow
($ in millions except per share data) 2011 2010
Q4 Q3 Q2 Q1 Q4 Q3 Q2 Q1
Revenues $ 2,972 $ 3,380 $ 2,796 $ 2,366 $ 2,716 $ 2,414 $ 2,198 $ 1,895
Gross profit 1,212 1,571 1,197 897 1,127 926 848 621
EBITDA 1,304 1,660 1,461 1,034 1,013 921 888 1,504
Profit attributable to shareholders 637 814 756 461 325 316 283 896
Earnings per share 1.08 1.38 1.28 0.78 0.55 0.54 0.48 1.52
Cash flow from operations 1,199 1,383 621 754 1,156 771 834 513
Revenues from operations were $3.0 billion in the fourth quarter compared with $2.7 billion a year ago. Revenues from our copper business unit were similar to the same period a year ago, as higher sales volumes were offset by lower copper prices. Coal revenues increased by $219 million compared with the fourth quarter of 2010 due to significantly higher realized coal prices, partially offset by a 7% decline in sales volumes. Revenues from our zinc business unit rose slightly from a year ago as higher sales volumes from our Trail Operations were offset by lower volumes from Red Dog and lower zinc and lead prices.
Gross profit before depreciation and amortization from our copper business unit decreased by $102 million in the fourth quarter compared with a year ago, as a result of lower copper prices and a one-time pre-tax $44 million labour settlement charge at our Highland Valley Copper mine. These items were partly offset by a 12% increase in sales volumes due to higher production levels and timing of shipments last year. Copper production in the fourth quarter rose by 5% to 89,000 tonnes compared with a year ago, primarily as a result of improved production at Highland Valley Copper, Carmen de Andacollo and Antamina. Copper prices averaged US$3.40 per pound in the fourth quarter of 2011, a decrease of 13% from US$3.92 per pound in the same period a year ago.

46 Teck 2011 Annual Report
Gross profit before depreciation and amortization from our coal business unit increased by $209 million in the fourth quarter compared with a year ago, primarily due to significantly higher coal prices. Lower sales volumes and higher unit operating costs partially offset the higher coal prices. Coal production was on target in the fourth quarter, increasing by 11% over last year to 6.7 million tonnes. This was the result of our significant investment in mobile equipment and workforce to implement our planned expansion. Unit cost of product sold in the fourth quarter, before transportation and depreciation charges, of $65 per tonne improved from previous quarters this year but increased by 20%, or $11 per tonne, over the same quarter of 2010 due primarily to increased contractor costs, higher strip ratios and significantly higher prices for diesel and explosives. Coal sales of 5.5 million tonnes in the fourth quarter were below production levels and 7% lower than the same period last year. The decrease in fourth quarter sales volume compared with the same quarter in 2010 reflects the weaker market conditions. Global economic conditions and softer steel prices have caused many steel producers to slow their production and be cautious in purchasing raw materials. While we continue to develop our production capacity, our plans allow for flexibility to adapt to changes in demand. We realized an average coal price of US$253 per tonne in the fourth quarter, which was lower than the record high prices achieved earlier in 2011, but still up 27% over the same period a year ago.
Gross profit before depreciation and amortization from our zinc business unit decreased by $25 million in the fourth quarter compared with a year ago partly due to lower zinc and lead prices and lower sales volumes from Red Dog. Zinc and lead sales volumes from Red Dog declined by 11% and 20%, respectively, as customers had accelerated deliveries of zinc and lead in the fourth quarter of 2010. Lead sales were also lower due to reduced annual lead production levels as a result of lower ore grades from the Aqqaluk pit. Refined zinc and lead production from Trail Operations increased by 6% and 71%, respectively, compared with a year ago as a result of improved performance in all areas of the plant, increased throughput, and the impact of maintenance shutdowns in the fourth quarter of 2010.
Profit attributable to shareholders was $637 million, or $1.08 per share, in the fourth quarter compared with $325 million or $0.55 per share in the same period last year primarily due to significantly higher coal prices, partially offset by lower sales volumes of zinc and coal. Other items affecting profit attributable to shareholders in the fourth quarter were a gain related to an increase in the fair value of our option to call certain of our high-yield notes prior to their maturity, which resulted from declining market interest rates in the quarter. In addition, we incurred a one-time $29 million after-tax charge in connection with a labour settlement at our Highland Valley Copper mine. Pricing adjustments were minimal in the fourth quarter of 2011 compared with $38 million of after-tax positive pricing adjustments in the fourth quarter of 2010.
Cash flow from operations, before changes in non-cash working capital items, was $1.2 billion in the fourth quarter compared with $1.0 billion a year ago.
Changes in non-cash working capital items resulted in a use of cash of $49 million in the fourth quarter compared with a $124 million source of cash in the same period a year ago. In the fourth quarter of 2010, we sold a portion of our coal receivables, which reduced our working capital requirements by approximately $150 million.
Outlook
The information that follows is in addition to the disclosure concerning specific operations included in the Operations section of this document.
We continue to experience volatile markets for our products. Commodity markets have historically been volatile and prices can change rapidly and customers can alter shipment plans. This can have a substantial impact on our business. The uncertainty over the ongoing economic conditions in Europe continues to have an effect on the global economy, and this may affect both prices and shipments to our customers.

47
Commodity Prices and 2012 ProductionCommodity prices are a key driver of our earnings. On the supply side, the depleting nature of ore reserves, difficulties in finding new orebodies, the permitting processes, the availability of skilled labour to develop projects, as well as infrastructure constraints, political risk and significant cost inflation may continue to have a moderating impact on the growth in future production. Although we are concerned about current global economic conditions, particularly in Europe, we believe that, over the longer term, the industrialization of emerging market economies will continue to be a major positive factor in the future demand for commodities. Therefore, we believe that the long-term price environment for the products that we produce and sell remains favourable.
Based on our expected 2012 mid-range production estimates and a Canadian/U.S. dollar exchange rate of $1.00, the sensitivity of our annual profit attributable to shareholders to the indicated changes in commodity prices, before pricing adjustments, and the U.S. dollar exchange rate is as follows:
2012 Mid-Range Production Estimates Change
Effect of Change on
ProfitEffect on
EBITDA
Coal (000’s tonnes) 25,000 US$1/tonne $ 16 million $ 25 million
Copper (tonnes) 362,000 US$0.01/lb $ 5 million $ 7 million
Zinc (tonnes) 880,000 US$0.01/lb $ 7 million $ 10 million
US$ exchange Cdn$0.01 $ 55 million $ 85 million
Notes:
(1) The effect on our profit attributable to shareholders of commodity price and exchange rate movements will vary from quarter to quarter depending on sales volumes.
(2) Zinc includes 285,000 tonnes of refined zinc and 595,000 tonnes of zinc contained in concentrates.
(3) All production estimates are subject to change based on market and operating conditions.
Foreign exchange translation gains and losses on our U.S. dollar denominated debt arising from exchange rate fluctuations are not expected to have a significant effect on our 2012 earnings, as our debt level is expected to be designated as a hedge against our investments in U.S. dollar denominated foreign operations and working capital items.
Copper and zinc prices are currently trading similar to 2011 average prices. Coal market conditions softened in the third quarter and remained so through the fourth quarter. By historical standards, however, prices for high quality steelmaking coal remain relatively high. The fluctuations in the Canadian/U.S. dollar exchange rate can have a significant effect on our profit and financial position. The Canadian dollar, to date in 2012, has averaged approximately $1.01 against the U.S. dollar compared with $0.99 in 2011.
Our copper production for 2012 is expected to be in the range of 350,000 to 375,000 tonnes, as a result of improved production at our operations. This compares with 321,000 tonnes produced in 2011.
Our coal production in 2012 is expected to be in the range of 24.5 to 25.5 million tonnes. Our actual production will depend upon improvements in customer demand for deliveries of steelmaking coal. Should deliveries not improve, we may adjust our production plans, depending on market conditions and the sales outlook. We have the flexibility to devote additional resources to pre-stripping in these circumstances.
Our zinc in concentrate production in 2012 is expected to be in the range of 580,000 to 610,000 tonnes compared with 646,000 tonnes in 2011. Red Dog’s production is expected to decrease by approximately 35,000 tonnes and our share of zinc production from Antamina will decrease by approximately 10,000 tonnes due to orebody sequencing. Refined zinc production from our Trail Operations in 2012 is expected to be in the range of 280,000 to 290,000 tonnes.
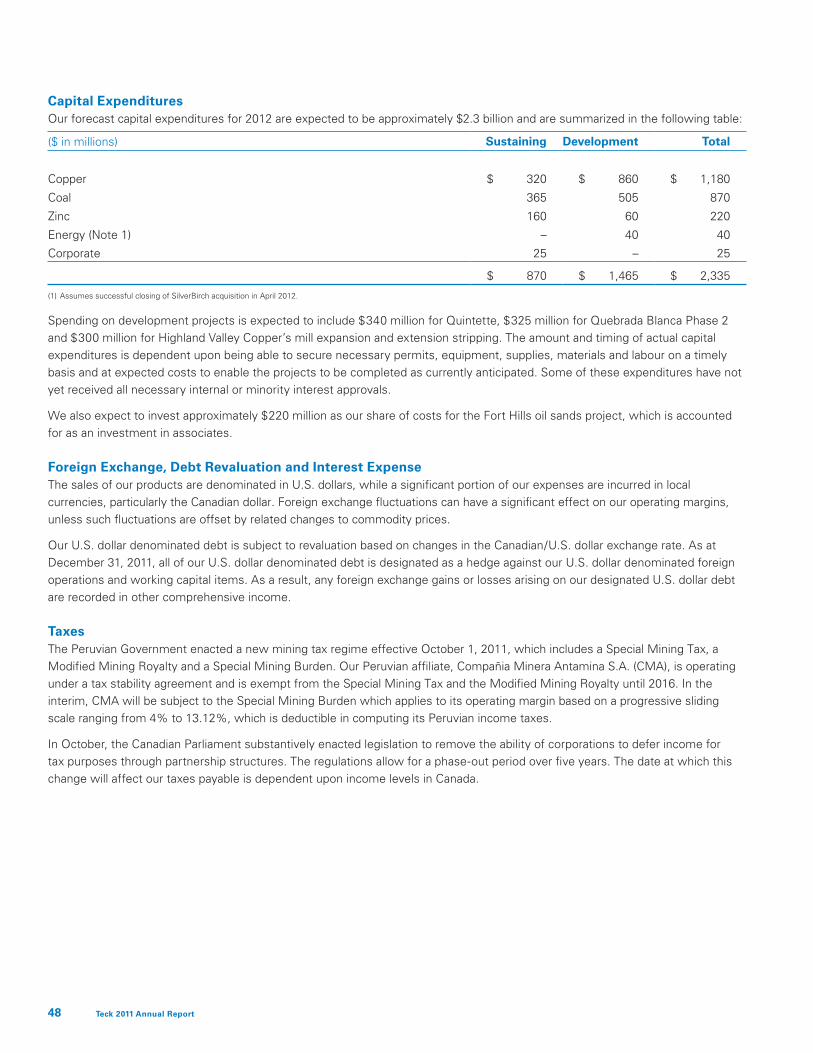
48 Teck 2011 Annual Report
Capital ExpendituresOur forecast capital expenditures for 2012 are expected to be approximately $2.3 billion and are summarized in the following table:
($ in millions) Sustaining Development Total
Copper $ 320 $ 860 $ 1,180
Coal 365 505 870
Zinc 160 60 220
Energy (Note 1) – 40 40
Corporate 25 – 25
$ 870 $ 1,465 $ 2,335
(1) Assumes successful closing of SilverBirch acquisition in April 2012.
Spending on development projects is expected to include $340 million for Quintette, $325 million for Quebrada Blanca Phase 2 and $300 million for Highland Valley Copper’s mill expansion and extension stripping. The amount and timing of actual capital expenditures is dependent upon being able to secure necessary permits, equipment, supplies, materials and labour on a timely basis and at expected costs to enable the projects to be completed as currently anticipated. Some of these expenditures have not yet received all necessary internal or minority interest approvals.
We also expect to invest approximately $220 million as our share of costs for the Fort Hills oil sands project, which is accounted for as an investment in associates.
Foreign Exchange, Debt Revaluation and Interest ExpenseThe sales of our products are denominated in U.S. dollars, while a significant portion of our expenses are incurred in local currencies, particularly the Canadian dollar. Foreign exchange fluctuations can have a significant effect on our operating margins, unless such fluctuations are offset by related changes to commodity prices.
Our U.S. dollar denominated debt is subject to revaluation based on changes in the Canadian/U.S. dollar exchange rate. As at December 31, 2011, all of our U.S. dollar denominated debt is designated as a hedge against our U.S. dollar denominated foreign operations and working capital items. As a result, any foreign exchange gains or losses arising on our designated U.S. dollar debt are recorded in other comprehensive income.
TaxesThe Peruvian Government enacted a new mining tax regime effective October 1, 2011, which includes a Special Mining Tax, a Modified Mining Royalty and a Special Mining Burden. Our Peruvian affiliate, Compañia Minera Antamina S.A. (CMA), is operating under a tax stability agreement and is exempt from the Special Mining Tax and the Modified Mining Royalty until 2016. In the interim, CMA will be subject to the Special Mining Burden which applies to its operating margin based on a progressive sliding scale ranging from 4% to 13.12%, which is deductible in computing its Peruvian income taxes.
In October, the Canadian Parliament substantively enacted legislation to remove the ability of corporations to defer income for tax purposes through partnership structures. The regulations allow for a phase-out period over five years. The date at which this change will affect our taxes payable is dependent upon income levels in Canada.

49
Other Information
British Columbia Carbon Tax and Cap and TradeThe Province of British Columbia (B.C.) introduced a carbon tax on virtually all fossil fuels in 2008. The tax is imposed on fossil fuels used in B.C. and, as of July 1, 2011, is based on $25 per tonne of CO2-emission equivalent, increasing to $30 per tonne in 2012. For 2011, our seven B.C.-based operations paid $29.7 million in provincial carbon tax, primarily from our use of coal, diesel fuel and natural gas. We anticipate that this will increase to approximately $35–$40 million per year in carbon tax by 2012 as the tax rate increases. The B.C. government has initiated the creation of a cap and trade mechanism to further reduce greenhouse gas emissions. However, it has indicated that the carbon tax and the cap and trade system will be integrated to avoid double taxation. We will monitor this issue as legislation is developed.
Financial Instruments and DerivativesWe hold a number of financial instruments and derivatives, the most significant of which are marketable equity securities, foreign exchange forward sales contracts, fixed price forward metal sales contracts, settlements receivable, settlements payable, and prepayment rights on our 2016 and 2019 notes. The financial instruments and derivatives are all recorded at fair values on our balance sheet with gains and losses in each period included in other comprehensive income and profit from continuing operations. Some of our gains and losses on metal-related financial instruments are affected by smelter price participation and are taken into account in determining royalties and other expenses. All are subject to varying rates of taxation depending on their nature and jurisdiction.
Critical Accounting Estimates and Judgments
In preparing financial statements, management has to make estimates and judgments that affect the reported amounts of assets, liabilities, revenues and expenses. Based on historical experience and other factors we consider to be reasonable, including expectations of future events, management makes judgments that are believed to be reasonable under the circumstances. Actual results could differ from our estimates. Critical accounting estimates are those that affect the consolidated financial statements materially and involve a significant level of judgment by management. Management’s critical accounting estimates apply to the assessment of the impairment of goodwill, the estimated recoverable reserves and resources, and the valuation of other assets and liabilities such as decommissioning and restoration provisions, accounting for income taxes, retirement benefit obligations, and derivatives.
Goodwill Impairment TestingWe allocate goodwill arising from business combinations to the cash generating unit or group of cash generating units acquired that are expected to receive the benefits from the business combination. When performing annual goodwill impairment tests, we are required to determine the recoverable amount relating to each cash generating unit or group of cash generating units to which goodwill has been allocated. The recoverable amount relating to each cash generating unit or group of cash generating units is determined as the higher of its fair value less cost to sell and its value in use.
We determine the recoverable amount of individual cash generating units or groups of cash generating units by using discounted cash flow models prepared by internal experts with help from third-party advisors when required. Significant assumptions used include commodity prices, mineral reserves and resources, operating costs, capital expenditures, discount rates, foreign exchange rates, and inflation rates. The assumptions used are based on management’s best estimates and are reviewed by senior management. Significant judgment is applied, and changes in these assumptions may alter the results of goodwill impairment testing, impairment charges recorded in the income statement and the resulting carrying values of assets.
We did not record any impairment of our goodwill balances in 2011. Significant changes to long-term commodity prices and discount rates would be required before impairment would be indicated.
50 Teck 2011 Annual Report
Estimated Recoverable Reserves and ResourcesMineral reserve and resource estimates are based on various assumptions relating to operating matters. This includes, with respect to production costs, mining and processing recoveries, cut-off values or grades, and assumptions relating to long-term commodity prices. In some cases, mineral reserve and resource estimates are further affected by exchange rates, inflation rates and capital costs assumptions. Cost estimates are based on feasibility study estimates or operating history. Estimates are prepared by appropriately qualified persons, but will be impacted by forecasted commodity prices, inflation rates, exchange rates, capital and production costs and recoveries, amongst other factors.
Estimated recoverable reserves and resources are used to determine the depreciation of property plant and equipment at operating mine sites, in accounting for deferred stripping costs, in performing impairment testing and for forecasting the timing of the payment of decommissioning and restoration costs. Therefore, changes in the assumptions used could impact the carrying value of assets, depreciation and impairment charges recorded in the income statement and the carrying value of the decommissioning and restoration provision.
Decommissioning and Restoration ProvisionsThe amounts recorded for decommissioning and restoration provisions (DRP) are based on future costs estimates included in closure and remediation plans. These estimates are based on engineering studies of the work that is required by environmental laws or public statements by management that results in an obligation.
The DRP is adjusted at each reporting period for changes to factors such as the expected amount of cash flows required to discharge the liability, the timing of such cash flows and the discount rate. The DRP requires other significant estimates and assumptions such as requirements of the relevant legal and regulatory framework, and the timing, extent and costs of required decommissioning and restoration activities. To the extent the actual costs differ from these estimates, adjustments will be recorded and the income statement may be impacted.
Retirement Benefit PlansThe cost of providing benefits through defined benefit pension plans and post-retirement benefit plans is actuarially estimated. Cost and obligation estimates depend on management’s assumptions about future events, which are used by actuaries. Actuarial assumptions used include factors such as discount rates, expected plan performance, salary escalation, expected health care costs, retirement dates of employees and life expectancy. Actual results may differ materially from those estimates based on these assumptions.
Current and Deferred Income TaxesThe determination of our tax expense for the year and its deferred tax liabilities and assets involves significant management estimate and judgment involving a number of assumptions. In determining these amounts, management interprets tax legislation in a variety of jurisdictions and makes estimates of the expected timing of the reversal of deferred tax assets and liabilities. Deferred tax liabilities arising from temporary differences on investments in subsidiaries, joint ventures and associates are recognized unless the reversal of the temporary differences are not expected to occur in the foreseeable future and can be controlled. Management also makes estimates of future taxable profits, which affects the extent to which potential future tax benefits may be used. Assumptions about the generation of future taxable profits and repatriation of retained earnings depend on management’s estimates of future production and sales volumes, commodity prices, reserves, operating costs, decommissioning and restoration costs, capital expenditures, dividends and other capital management transactions. We are subject to assessments by various taxation authorities who may interpret tax legislation differently. These differences may affect the final amount or timing of the payment of taxes. We provide for these differences, where known, based on management’s best estimate of the probable outcome of these matters.

51
Fair Value of Derivatives We value our derivative instruments using pricing models or discounted cash flow models. These models require a variety of inputs, including, but not limited to, contractual items, market prices, forward price curves, yield curves and credit spreads. These inputs are obtained from or corroborated with the market where possible. Changes in these assumptions could impact the carrying value of derivative instruments and the amount of unrealized gains or losses recognized in other operating income (expense) and non-operating income (expense).
Outstanding Share Data
As at February 28, 2012, there were 576,620,095 Class B subordinate voting shares and 9,353,470 Class A common shares outstanding. In addition, there were 7,194,736 employee stock options outstanding, with exercise prices ranging between $4.15 and $58.80 per share. More information on these instruments and the terms of their conversion are set out in the equity note to our 2011 consolidated financial statements.
Contractual and Other Obligations
($ in millions) Less Than 1 Year 2–3 Years 4–5 YearsMore than
5 years Total
Debt $ 744 $ 1,310 $ 1,658 $ 7,697 $ 11,409
Operating leases 43 50 41 26 160
Capital leases 61 19 5 19 104
Road and port lease at Red Dog (Note 1) 18 36 36 282 372
Minimum purchase obligations (Note 2)
Concentrate, equipment and supply purchases 1,081 115 97 196 1,489
Shipping and distribution 75 5 5 3 88
Pension funding (Note 3) 94 – – – 94
Other non-pension post-retirement benefits (Note 4) 11 25 29 347 412
Decommissioning and restoration provision (Note 5) 54 82 57 1,234 1,427
Other long-term liabilities (Note 6) 17 31 14 23 85
Contributions to the Fort Hills oil sands project (Note 7) 216 1,069 – – 1,285
$ 2,414 $ 2,742 $ 1,942 $ 9,827 $ 16,925
Notes:
(1) We lease road and port facilities from the Alaska Industrial Development and Export Authority through which we ship metal concentrates produced at the Red Dog mine. Minimum lease payments are US$18 million per annum and are subject to deferral and abatement for force majeure events.
(2) The majority of our minimum purchase obligations are subject to continuing operations and force majeure provisions.
(3) As at December 31, 2011, the company had a net pension deficit of $278 million based on actuarial estimates prepared on a going concern basis. The amount of minimum funding for 2012 in respect of defined benefit pension plans is $94 million. The timing and amount of additional funding after 2012 is dependent upon future returns on plan assets, discount rates, and other actuarial assumptions.
(4) We had a discounted, actuarially determined liability of $412 million in respect of other non-pension post-retirement benefits as at December 31, 2011. Amounts shown are estimated expenditures in the indicated years.
(5) We accrue environmental and reclamation obligations over the life of our mining operations and amounts shown are estimated expenditures in the indicated years at fair value, assuming credit-adjusted risk-free discount rate of 4.95% and inflation factors of 2.00%.
(6) Other long-term liabilities include amounts for post-closure, environmental costs and other items.
(7) In November 2005, we acquired a 15% interest in the Fort Hills Energy Limited Partnership, which is developing the Fort Hills oil sands project in Alberta, Canada. In September 2007, we acquired an additional 5% interest, bringing our total interest to 20%. To earn our additional 5% interest, we are required to contribute 27.5% of $5 billion of project expenditures after project spending reaches $2.5 billion. We are presently funding at this level. Thereafter, we are responsible for our 20% share of development costs. As a decision to proceed with the project has not yet been made, no additional commitments beyond our earn-in commitment are presently shown. In the event of project abandonment, as agreed to by the partners, monies held by the Fort Hills Energy Limited Partnership would be returned to the partners in the respective equity ratios after having fulfilled all funding obligations to an aggregate of $7.5 billion.

52 Teck 2011 Annual Report
International Financial Reporting Standards (IFRS)
Effective January 1, 2011, Canadian publicly listed entities were required to prepare their financial statements in accordance with IFRS. Due to the requirement to present comparative financial information, the effective transition date was January 1, 2010. 2011 was our first year reporting under IFRS.
Our IFRS conversion team identified four phases to our conversion: scoping and planning, detailed assessment, implementation and post-implementation. We have now completed our IFRS conversion project through implementation. Post-implementation will continue in future periods, as outlined on page 54.
The following outlines our transition project, IFRS transitional impacts and the ongoing impact of IFRS on our financial results.
Transitional Financial ImpactAs a result of the policy choices we have selected and the changes we were required to make under IFRS, we have recorded a reduction in our equity of approximately $134 million as at January 1, 2010. The table below outlines adjustments to our equity on adoption of IFRS on January 1, 2010, and at December 31, 2010 for comparative purposes.
(Cdn$ in millions)
January 1,
2010
December 31,
2010
Equity under Canadian GAAP $ 14,591 $ 16,176
Decommissioning and restoration provisions 175 142Borrowing costs (54) (44)Employee benefits (363) (445)Financial instruments (32) (19)Foreign currency translation (2) (41)Reversal of impairment 22 22Provisions (4) (6)Income and resource taxes 124 110
Total IFRS adjustments to equity (134) (281)
Equity under IFRS $ 14,457 $ 15,895
A reconciliation of our comprehensive income under Canadian GAAP and IFRS for the year ended December 31, 2010 and a discussion of the impact of IFRS on our cash flows are provided below.
Comprehensive Income ImpactAs a result of the policy choices we have selected and the changes we were required to make under IFRS, we have recorded a reduction in our profit of approximately $39 million for the year ended December 31, 2010. We have also recorded a reduction in our comprehensive income of approximately $147 million for the year ended December 31, 2010.

53
The following is a summary of the adjustments to comprehensive income for the year ended December 31, 2010 under IFRS (all of which are outlined in the notes to our consolidated financial statements):
(Cdn$ in millions)
Year ended
December 31, 2010
Comprehensive income under Canadian GAAP $ 1,928
Profit adjustments
Decommissioning and restoration provisions (33) Employee benefits – amortization of actuarial gains and losses 37 Financial instruments – embedded derivative 13 Foreign exchange (13) Borrowing costs 10 Provisions (2) Income and resource taxes (51)
Total profit adjustments (39)
Other comprehensive income adjustments
Currency translation adjustments (26) Employee benefits – actuarial gains (losses) (119) Income and resource taxes 37
Total other comprehensive income adjustments (108)
Total comprehensive income adjustments (147)
Comprehensive income under IFRS $ 1,781
Cash Flow ImpactThe only IFRS transition adjustment that impacted our cash balance in 2010 was as a result of our accounting policy choice to proportionately consolidate joint ventures, specifically Galore Creek. We have recorded our 50% portion of Galore Creek’s cash balance throughout 2010, which did not have a material impact on our cash balances. None of the other IFRS transition adjustments noted above had an impact on our cash balances during 2010.
We have presented cash interest paid as a financing activity in our statements of cash flows under IFRS. Under previous Canadian GAAP, cash interest paid was included as an operating activity. This presentation change will increase our cash flows from operating activities and reduce our cash flows from financing activities in future periods. For the 12 months ended December 31, 2010, our operating cash flows increased by $533 million compared to Canadian GAAP, with cash flow from financing activities reduced by the same amount. There is no net impact on cash and cash equivalents as a result of this presentation change.
Financial Statement Presentation ChangesThe transition to IFRS has resulted in numerous financial statement presentation changes in our financial statements, most significantly on the consolidated statement of income. The changes to the balance sheet relate to the further break-out of balances on the face of the balance sheet, including retirement benefit provisions, deferred tax assets and investments in associates. In addition, we combined components of other assets and our investment balance into the “Financial and other assets” line. The changes to our cash flow statement are outlined above.

54 Teck 2011 Annual Report
The following is a summary of the significant changes to our consolidated statement of income:
•Expenses by function and nature – our statement of income presents expenses by function. Accordingly, depreciation and amortization is no longer presented as a separate item on the statement of income but is included in cost of sales.
•Other operating income (expense) includes items we consider to be related to the operation of our business, such as pricing adjustments from settlement receivables, share-based compensation, commodity derivatives, gains or losses on sale of operating assets and provisions for our closed properties. Non-operating income (expense) includes items we consider to arise from financial and other matters and includes such items as foreign exchange, debt refinancing costs, marketable securities gains and losses, and gains and losses on the revaluation on other derivatives.
•Finance expense – under IFRS, finance expense includes interest on debt, accretion expense for decommissioning and restoration and other provisions and interest associated with pension and post-retirement benefit obligations. Accretion and interest associated with pension and post-retirement benefit obligations were previously included in cost of sales and general and administration expense.
•Finance income – finance income under IFRS includes interest income and return on pension plan assets.
The above changes are reclassifications within our statement of income so there is no net impact to our profit as a result of these changes.
Control ActivitiesFor all changes to policies and procedures that have been identified, the effectiveness of internal controls over financial reporting and disclosure controls and procedures has been assessed and any changes have been implemented. In addition, controls over the IFRS changeover process have been implemented, as necessary. We have identified and implemented the required accounting process changes that resulted from the application of IFRS accounting policies and these changes were not significant. We have completed the design, implementation and documentation of the internal controls over accounting process changes resulting from the application of IFRS accounting policies. We applied our existing control framework to the IFRS changeover process. All accounting policy changes and transitional financial position impacts were subject to review by senior management and the Audit Committee of the Board of Directors.
Business Activities and Key Performance MeasuresWe have assessed the impact of the IFRS transition project on our financial covenants and key ratios. The transition did not significantly impact our covenants and key ratios that have an equity component.
We have also reviewed the impact of the IFRS transition project on our compensation arrangements. We have identified compensation arrangements that are calculated based on indicators in our financial statements. Our Human Resources department will ensure that all compensation arrangements incorporate indicators from our financial statements prepared under IFRS in accordance with our compensation policies.
Information Technology and SystemsThe IFRS transition project did not have a significant impact on our information systems for the convergence periods. We also do not expect significant changes in the post-convergence periods.
Post-ImplementationThe post-implementation phase will involve continuous monitoring of changes in IFRS in future periods. We note that the standard-setting bodies that determine IFRS have significant ongoing projects that could impact the IFRS accounting policies that we have selected. In particular, new or revised IFRSs or IFRICs in relation to consolidation, disclosure of interests in other entities, joint arrangements, financial instruments, fair value measurement, post-employment benefits, other comprehensive income and stripping costs in the production phase of a surface mine were issued and will be effective post-2013. We note that the International Accounting Standards Board is currently considering including an extractive activities project on their agenda, which could significantly impact our financial statements, primarily in the areas of capitalization of exploration costs and disclosures. We have processes in place to ensure that potential changes are monitored and evaluated. The impact of any new IFRSs and IFRIC Interpretations are evaluated as they are drafted and published. We also expect new or revised IFRSs and IFRICs in relation to revenue recognition, leases, hedging and discontinued operations to be issued in the near future.

55
Disclosure Controls and Internal Control over Financial Reporting
Disclosure Controls and ProceduresDisclosure controls and procedures are designed to provide reasonable assurance that information required to be disclosed in reports filed or submitted by us under U.S. and Canadian securities legislation is recorded, processed, summarized and reported within the time periods specified in those rules and include controls and procedures designed to ensure that information required to be disclosed in reports filed or submitted by us under U.S. and Canadian securities legislation is accumulated and communicated to management, including the Chief Executive Officer and Chief Financial Officer, as appropriate to permit timely decisions regarding required disclosure. Management, including the Chief Executive Officer and Chief Financial Officer, has evaluated the effectiveness of the design and operation of our disclosure controls and procedures, as defined in the rules of the U.S. Securities and Exchange Commission and Canadian Securities Administration, as at December 31, 2011. Based on this evaluation, the Chief Executive Officer and Chief Financial Officer have concluded that our disclosure controls and procedures were effective as at December 31, 2011.
Management’s Report on Internal Control Over Financial ReportingOur management is responsible for establishing and maintaining adequate internal control over financial reporting. Any system of internal control over financial reporting, no matter how well designed, has inherent limitations. Therefore, even those systems determined to be effective can provide only reasonable assurance with respect to financial statement preparation and presentation. Management has used the Committee of Sponsoring Organizations of the Treadway Commission (COSO) framework to evaluate the effectiveness of our internal control over financial reporting. Based on this assessment, management has concluded that as at December 31, 2011, our internal control over financial reporting was effective.
The effectiveness of our internal controls over financial reporting has been audited by PricewaterhouseCoopers LLP, an independent registered public accounting firm, who have expressed their opinion in their report included with our annual consolidated financial statements.
Changes in Internal Control Over Financial ReportingOther than changes related to our IFRS transition plan, there have been no significant changes in our internal control over financial reporting during the year ended December 31, 2011 that have materially affected, or are reasonably likely to materially affect, our internal control over financial reporting.
Use of Non-GAAP Financial Measures
Our financial results are prepared in accordance with accounting principles generally accepted in Canada (GAAP), which effective January 1, 2011 transitioned to International Financial Reporting Standards. This document refers to gross profit before depreciation and amortization, EBITDA, adjusted profit, adjusted earnings per share, and the net debt to net debt-plus-equity ratio, which are not measures recognized under GAAP in Canada or the U.S. and do not have a standardized meaning prescribed by GAAP.
Gross profit before depreciation and amortization is gross profit as reported with depreciation and amortization excluded. EBITDA is profit attributable to shareholders before interest, finance expense net of finance income, income and resource taxes and depreciation and amortization. For adjusted profit, we adjust profit attributable to shareholders as reported to remove the effect of certain kinds of transactions in these measures. Adjusted earnings per share is calculated by dividing the adjusted profit amount by our reported weighted average shares outstanding. Net debt is total debt as reported less cash and cash equivalents. The net debt to net debt-plus-equity ratio takes total debt as reported, and divides that by the sum of net debt plus total equity.
These measures may differ from those used by different issuers, and may not be comparable to such measures as reported by others. We disclose these measures, which have been derived from our financial statements and applied on a consistent basis, because we believe they assist readers in understanding the results of our operations and financial position and are meant to provide further information about our financial results to investors.

56 Teck 2011 Annual Report
Reconciliation of Gross Profit Before Depreciation and Amortization
($ in millions) 2011 2010
Gross profit $ 4,877 $ 3,522
Depreciation and amortization 911 916
Gross profit before depreciation and amortization $ 5,788 $ 4,438
Reported as:
Copper
Highland Valley Copper $ 486 $ 487
Antamina 588 420
Quebrada Blanca 255 406
Carmen de Andacollo 288 91
Duck Pond 57 58
Coal 3,306 2,261
Zinc
Red Dog 547 571
Trail 256 155
Other 2 9
Inter-segment sales 3 (20)
Gross profit before depreciation and amortization $ 5,788 $ 4,438
Reconciliation of Profit Attributable to Shareholders to EBITDA
($ in millions) 2011 2010
Profit attributable to shareholders $ 2,668 $ 1,820
Finance expense net of finance income 482 596
Provision for income and resource taxes 1,398 994
Depreciation and amortization 911 916
EBITDA $ 5,459 $ 4,326
Quarterly Reconciliation
($ in millions) 2011 2010
Q4 Q3 Q2 Q1 Q4 Q3 Q2 Q1
Profit attributable to shareholders $ 637 $ 814 $ 756 $ 461 $ 325 $ 316 $ 283 $ 896
Finance expense net of finance income
134
133
109
106
130
146
153
167
Provision for income and resource taxes
311
470
366
251
333
240
213
208
Depreciation and amortization 222 243 230 216 225 219 239 233
EBITDA $ 1,304 $ 1,660 $ 1,461 $ 1,034 $ 1,013 $ 921 $ 888 $ 1,504

57
This document contains certain forward-looking information and forward-looking statements as defined in applicable securities laws. All statements other than statements of historical fact are forward-looking statements. The use of any of the words “anticipate”, “plan”, “continue”, “estimate”, “expect”, “may”, “will”, “project”, “predict”, “potential”, “should”, “believe” and similar expressions is intended to identify forward-looking statements. These forward-looking statements, principally under the heading “Outlook”, but also elsewhere in this document, include estimates, forecasts, statements and information as to management’s expectations with respect to, among other things, our strategies, projects, future production and operating performance, future financial performance and cash flows, our plans for our operating and development projects, including our oil sands projects, forecast production from our operations, forecast operating costs, expected progress, costs and outcomes of our various expansion projects, the sensitivity of our earnings to changes in commodity prices and exchange rates, the potential impact of transportation and other potential production disruptions, the impact of currency exchange rates, future trends for the company, progress in development of mineral properties, the timing and outcome of expected production increases, the reopening of the Quintette coal mine, future production estimates and guidance, sales volumes and selling prices for our products (including the settlement of coal contracts with customers), capital expenditures, mine production costs, demand and market outlook for commodities, future commodity prices, the settlement of coal contracts with customers and labour contracts with employees, the outcome of mine permitting currently underway, timing of various studies on our projects, the impact of measures required to manage selenium discharges, the timing of the closing of the acquisition of SilverBirch, the hypogene project at Quebrada Blanca, potential mine life increases at Highland Valley Copper and the timing of completion and results of the modernization program at the operation, increased port capacity, the time frame for the review of our proposal for the Frontier project, and the outcome of legal proceedings involving the company.
These forward-looking statements involve numerous assumptions, risks and uncertainties and actual results may vary materially. These statements are based on a number of assumptions, including, but not limited to, assumptions regarding general business and economic conditions, interest rates, the supply and demand for, deliveries of, and the level and volatility of prices of, zinc, copper and coal and other primary metals and minerals as well as oil, and related products, the timing of the receipt of regulatory and governmental approvals for our development projects and other operations, our costs of production, production and productivity levels, as well as those of our competitors, power prices, continuing availability of water and power resources for our operations, market competition, the accuracy of our reserve and resource estimates (including with respect to size, grade and recoverability) and the geological, operational and price assumptions on which these are based, conditions in financial markets, the future financial performance of the company, our ability to attract and retain skilled staff, our ability to procure equipment and operating supplies, ability to deliver product to customer smelters for treatment and refining, positive results from the studies on our expansion projects, our ability to secure adequate transportation for our products, improvements in customer demand for coal, our ability to obtain permits for our operations and expansions, and our ongoing relations with our employees and business partners and joint venturers and with respect to the SilverBirch transaction, assumptions regarding the satisfaction of closing conditions. The foregoing list of assumptions is not exhaustive.
Events or circumstances could cause actual results to vary materially. Factors that may cause actual results to vary materially include, but are not limited to, changes in commodity and power prices, changes in interest and currency exchange rates, acts of foreign governments and the outcome of legal proceedings, inaccurate geological and metallurgical assumptions (including with respect to the size, grade and recoverability of mineral reserves and resources), unanticipated operational difficulties (including failure of plant, equipment or processes to operate in accordance with specifications or expectations, cost escalation, unavailability of materials and equipment, government action or delays in the receipt of government approvals, industrial disturbances or other job action, failure of our transportation providers moving our products to our customers or to provide port services, adverse weather conditions and unanticipated events related to health, safety and environmental matters), political risk, social unrest, failure of customers or counterparties to perform their contractual obligations, changes in our credit ratings, changes or deterioration in general economic conditions and unexpected delays or difficulties in obtaining permits. Statements concerning future production costs or volumes, and the sensitivity of the company’s earnings to changes in commodity prices and exchange rates are based on numerous assumptions of management regarding operating matters and on assumptions that demand for products develops as anticipated, that customers and other counterparties perform their contractual obligations, that operating and capital plans will not be disrupted by issues such as mechanical failure, unavailability of parts and supplies, labour disturbances, interruption in transportation or utilities, adverse weather conditions, and that there are no material unanticipated variations in the cost of energy or supplies.
We assume no obligation to update forward-looking statements except as required under securities laws. Further information concerning risks and uncertainties associated with these forward-looking statements and our business can be found in our Annual Information Form for the year ended December 31, 2011, filed on SEDAR and on EDGAR under cover of Form 40-F.
Caution on Forward‑Looking Information

Consolidated Financial StatementsFor the Years Ended December 31, 2011 and 2010
58 Teck 2011 Annual Report

59
Management is responsible for the integrity and fair presentation of the financial information contained in this annual report. Where appropriate, the financial information, including financial statements, reflects amounts based on the best estimates and judgments of management. The financial statements have been prepared in accordance with accounting principles generally accepted in Canada. Financial information presented elsewhere in the annual report is consistent with that disclosed in the financial statements.
Management is responsible for establishing and maintaining adequate internal control over financial reporting. Any system of internal control over financial reporting, no matter how well designed, has inherent limitations. Therefore, even those systems determined to be effective can provide only reasonable assurance with respect to financial statement preparation and presentation. The system of controls is also supported by a professional staff of internal auditors who conduct periodic audits of many aspects of our operations and report their findings to management and the Audit Committee.
Management has a process in place to evaluate internal control over financial reporting based on the criteria established by the Committee of Sponsoring Organizations of the Treadway Commission (COSO) in Internal Control - Integrated Framework.
The Board of Directors oversees management’s responsibility for financial reporting and internal control systems through an Audit Committee, which is composed entirely of independent directors. The Audit Committee meets periodically with management, our internal auditors and independent auditors to review the scope and results of the annual audit and to review the financial statements and related financial reporting and internal control matters before the financial statements are approved by the Board of Directors and submitted to the shareholders.
PricewaterhouseCoopers LLP, an independent registered public accounting firm, appointed by the shareholders, have audited our financial statements in accordance with Canadian generally accepted auditing standards and have expressed their opinion in the auditor’s report.
Donald R. Lindsay President and Chief Executive Officer
Ronald A. Millos Senior Vice President, Finance and Chief Financial Officer February 28, 2012
Management’s Responsibility for Financial Reporting

60 Teck 2011 Annual Report
To the Shareholders of Teck Resources Limited
We have completed an integrated audit of Teck Resources Limited and its subsidiaries’ December 31, 2011 consolidated financial statements and their internal control over financial reporting as at December 31, 2011 and an audit of their December 31, 2010 consolidated financial statements. Our opinions, based on our audits, are presented below.
Report on the consolidated financial statements We have audited the accompanying consolidated financial statements of Teck Resources Limited and its subsidiaries, which comprise the consolidated balance sheets as at December 31, 2011, 2010 and January 1, 2010 and the consolidated statements of income, comprehensive income, cash flows and changes in equity for the years ended December 31, 2011 and 2010, and the related notes, which comprise a summary of significant accounting policies and other explanatory information.
Management’s responsibility for the consolidated financial statementsManagement is responsible for the preparation and fair presentation of these consolidated financial statements in accordance with International Financial Reporting Standards as issued by the International Accounting Standards Board and for such internal control as management determines is necessary to enable the preparation of consolidated financial statements that are free from material misstatement, whether due to fraud or error.
Auditor’s responsibilityOur responsibility is to express an opinion on these consolidated financial statements based on our audits. We conducted our audits in accordance with Canadian generally accepted auditing standards and the standards of the Public Company Accounting Oversight Board (United States). Those standards require that we plan and perform an audit to obtain reasonable assurance about whether the consolidated financial statements are free from material misstatement. Canadian generally accepted auditing standards require that we comply with ethical requirements.
An audit involves performing procedures to obtain audit evidence, on a test basis, about the amounts and disclosures in the consolidated financial statements. The procedures selected depend on the auditor’s judgment, including the assessment of the risks of material misstatement of the consolidated financial statements, whether due to fraud or error. In making those risk assessments, the auditor considers internal control relevant to the company’s preparation and fair presentation of the consolidated financial statements in order to design audit procedures that are appropriate in the circumstances. An audit also includes evaluating the appropriateness of accounting principles and policies used and the reasonableness of accounting estimates made by management, as well as evaluating the overall presentation of the consolidated financial statements.
We believe that the audit evidence we have obtained in our audits is sufficient and appropriate to provide a basis for our audit opinion on the consolidated financial statements.
OpinionIn our opinion, the consolidated financial statements present fairly, in all material respects, the financial position of Teck Resources Limited and its subsidiaries as at December 31, 2011, 2010 and January 1, 2010 and their financial performance and their cash flows for the years ended December 31, 2011 and 2010 in accordance with International Financial Reporting Standards as issued by the International Accounting Standards Board.
Report on internal control over financial reportingWe have also audited Teck Resources Limited’s and its subsidiaries’ internal control over financial reporting as at December 31, 2011, based on criteria established in Internal Control - Integrated Framework, issued by the Committee of Sponsoring Organizations of the Treadway Commission (COSO).
Independent Auditor’s Report

61
Management’s responsibility for internal control over financial reportingManagement is responsible for maintaining effective internal control over financial reporting and for its assessment of the effectiveness of internal control over financial reporting included in Management’s Report on Internal Control Over Financial Reporting.
Auditor’s responsibilityOur responsibility is to express an opinion on the company’s internal control over financial reporting based on our audit. We conducted our audit of internal control over financial reporting in accordance with the standards of the Public Company Accounting Oversight Board (United States). Those standards require that we plan and perform the audit to obtain reasonable assurance about whether effective internal control over financial reporting was maintained in all material respects.
An audit of internal control over financial reporting includes obtaining an understanding of internal control over financial reporting, assessing the risk that a material weakness exists, testing and evaluating the design and operating effectiveness of internal control, based on the assessed risk, and performing such other procedures as we consider necessary in the circumstances.
We believe that our audit provides a reasonable basis for our audit opinion on the company’s internal control over financial reporting.
Definition of internal control over financial reportingA company’s internal control over financial reporting is a process designed to provide reasonable assurance regarding the reliability of financial reporting and the preparation of financial statements for external purposes in accordance with generally accepted accounting principles. A company’s internal control over financial reporting includes those policies and procedures that: (i) pertain to the maintenance of records that, in reasonable detail, accurately and fairly reflect the transactions and dispositions of the assets of the company; (ii) provide reasonable assurance that transactions are recorded as necessary to permit preparation of financial statements in accordance with generally accepted accounting principles, and that receipts and expenditures of the company are being made only in accordance with authorizations of management and directors of the company; and (iii) provide reasonable assurance regarding prevention or timely detection of unauthorized acquisition, use, or disposition of the company’s assets that could have a material effect on the financial statements.
Inherent limitationsBecause of its inherent limitations, internal control over financial reporting may not prevent or detect misstatements. Also, projections of any evaluation of effectiveness to future periods are subject to the risk that controls may become inadequate because of changes in conditions or that the degree of compliance with the policies or procedures may deteriorate.
OpinionIn our opinion, Teck Resources Limited and its subsidiaries maintained, in all material respects, effective internal control over financial reporting as at December 31, 2011, based on criteria established in Internal Control - Integrated Framework issued by COSO.
Chartered Accountants February 28, 2012 Vancouver, British Columbia

62 Teck 2011 Annual Report
Consolidated Statements of Income Years ended December 31
(Cdn$ in millions, except for share data) 2011 2010
Revenues $ 11,514 $ 9,223
Cost of sales (6,637) (5,701)
Gross profit 4,877 3,522
Other operating expenses
General and administration (125) (137)
Exploration (105) (56)
Research and development (17) (20)
Other operating income (expense) (Note 7) (174) 640
Profit from operations 4,456 3,949
Finance income (Note 8) 113 95
Finance expense (Note 8) (595) (691)
Non-operating income (expense) (Note 9) 197 (418)
Share of losses of associates (Note 13) (5) (5)
Profit before tax 4,166 2,930
Provision for income and resource taxes (Note 18) (1,398) (994)
Profit for the year $ 2,768 $ 1,936
Profit attributable to:
Shareholders of the company $ 2,668 $ 1,820
Non-controlling interests 100 116
Profit for the year $ 2,768 $ 1,936
Earnings per share (Note 21(g))
Basic $ 4.52 $ 3.09
Diluted $ 4.50 $ 3.08
Weighted average shares outstanding (millions) 590.4 589.5
Shares outstanding at end of year (millions) 586.6 590.6
The accompanying notes are an integral part of these financial statements.
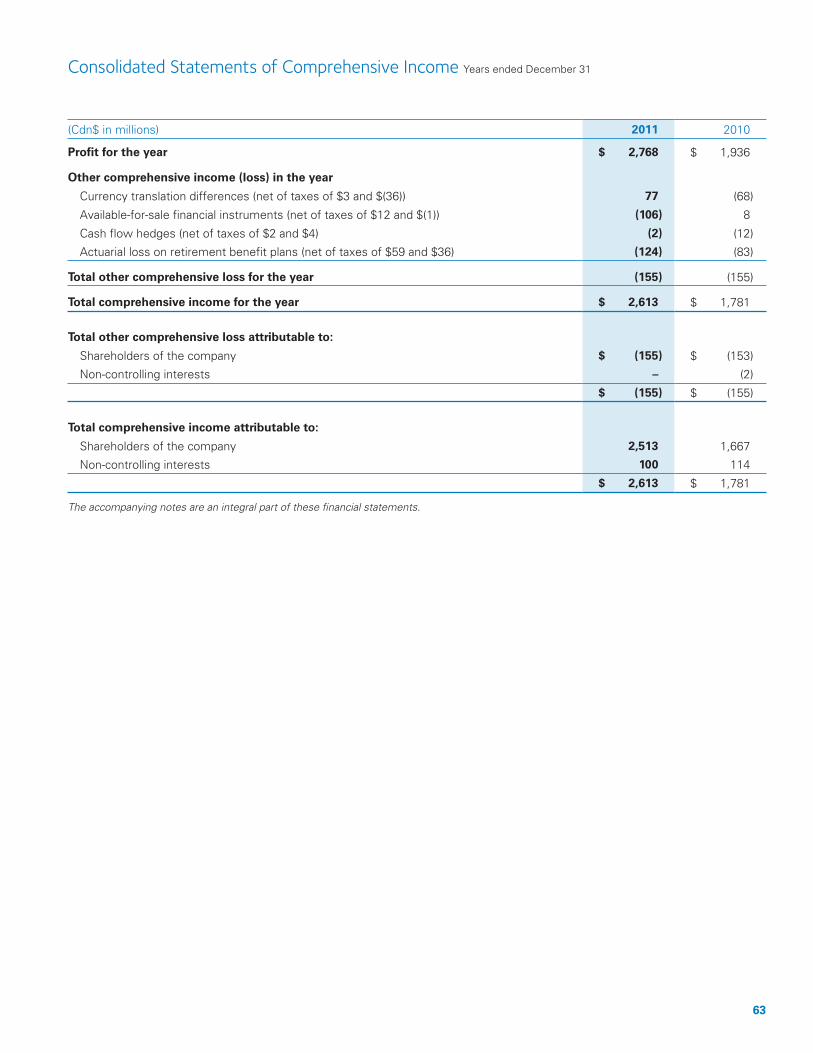
63
Consolidated Statements of Comprehensive Income Years ended December 31
(Cdn$ in millions) 2011 2010
Profit for the year $ 2,768 $ 1,936
Other comprehensive income (loss) in the year
Currency translation differences (net of taxes of $3 and $(36)) 77 (68)
Available-for-sale financial instruments (net of taxes of $12 and $(1)) (106) 8
Cash flow hedges (net of taxes of $2 and $4) (2) (12)
Actuarial loss on retirement benefit plans (net of taxes of $59 and $36) (124) (83)
Total other comprehensive loss for the year (155) (155)
Total comprehensive income for the year $ 2,613 $ 1,781
Total other comprehensive loss attributable to:
Shareholders of the company $ (155) $ (153)
Non-controlling interests – (2)
$ (155) $ (155)
Total comprehensive income attributable to:
Shareholders of the company 2,513 1,667
Non-controlling interests 100 114
$ 2,613 $ 1,781
The accompanying notes are an integral part of these financial statements.

64 Teck 2011 Annual Report
Consolidated Statements of Cash Flows Years ended December 31
(Cdn$ in millions) 2011 2010
Operating activities
Profit for the year $ 2,768 $ 1,936
Adjustments for:
Depreciation and amortization 911 916
Provision for deferred income and resource taxes 701 282
Share of loss of associates 5 5
Gain on sale of investments and assets (174) (859)
Unrealized gains on derivatives (158) (182)
Asset write-downs 30 –
Foreign exchange gains (7) (81)
Loss on debt repurchase – 782
Finance income (113) (95)
Finance expense 595 691
Other 73 (18)
4,631 3,377
Net change in non-cash working capital items (674) (103)
3,957 3,274
Investing activities
Purchase of property, plant and equipment (1,236) (810)
Purchase of financial investments and other assets (463) (46)
Proceeds from the sale of investments and other assets 289 1,239
Decrease in restricted cash – 91
(1,410) 474
Financing activities
Issuance of debt 1,907 1,560
Repayment of debt (104) (5,054)
Debt interest paid (377) (533)
Issuance of Class B subordinate voting shares 4 33
Purchase and cancellation of Class B subordinate voting shares (171) –
Dividends paid (354) (118)
Distributions to non-controlling interests (54) (89)
851 (4,201)
Effect of exchange rate changes on cash and cash equivalents 175 (46)
Increase (decrease) in cash and cash equivalents 3,573 (499)
Cash and cash equivalents at beginning of year 832 1,331
Cash and cash equivalents at end of year $ 4,405 $ 832
Supplemental cash flow information (Note 10)
The accompanying notes are an integral part of these financial statements.
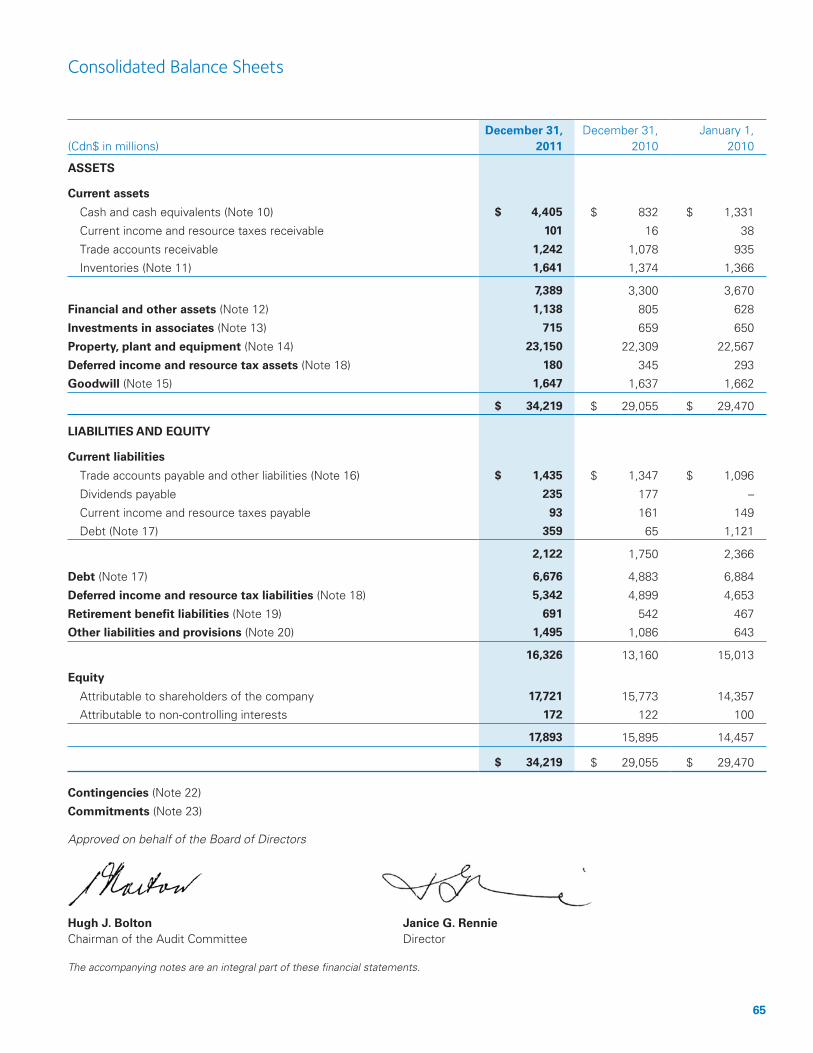
65
Consolidated Balance Sheets
(Cdn$ in millions)December 31,
2011December 31,
2010January 1,
2010
ASSETS
Current assets
Cash and cash equivalents (Note 10) $ 4,405 $ 832 $ 1,331
Current income and resource taxes receivable 101 16 38
Trade accounts receivable 1,242 1,078 935
Inventories (Note 11) 1,641 1,374 1,366
7,389 3,300 3,670
Financial and other assets (Note 12) 1,138 805 628
Investments in associates (Note 13) 715 659 650
Property, plant and equipment (Note 14) 23,150 22,309 22,567
Deferred income and resource tax assets (Note 18) 180 345 293
Goodwill (Note 15) 1,647 1,637 1,662
$ 34,219 $ 29,055 $ 29,470
LIABILITIES AND EQUITY
Current liabilities
Trade accounts payable and other liabilities (Note 16) $ 1,435 $ 1,347 $ 1,096
Dividends payable 235 177 –
Current income and resource taxes payable 93 161 149
Debt (Note 17) 359 65 1,121
2,122 1,750 2,366
Debt (Note 17) 6,676 4,883 6,884
Deferred income and resource tax liabilities (Note 18) 5,342 4,899 4,653
Retirement benefit liabilities (Note 19) 691 542 467
Other liabilities and provisions (Note 20) 1,495 1,086 643
16,326 13,160 15,013
Equity
Attributable to shareholders of the company 17,721 15,773 14,357
Attributable to non-controlling interests 172 122 100
17,893 15,895 14,457
$ 34,219 $ 29,055 $ 29,470
Contingencies (Note 22)
Commitments (Note 23)
Approved on behalf of the Board of Directors
Hugh J. Bolton Janice G. Rennie Chairman of the Audit Committee Director The accompanying notes are an integral part of these financial statements.

66 Teck 2011 Annual Report
Consolidated Statements of Changes in Equity Years ended December 31
(Cdn$ in millions) 2011 2010
Class A common shares (Note 21) $ 7 $ 7
Class B subordinate voting shares (Note 21)
Beginning of year 6,795 6,750
Share repurchases (57) –
Issued on exercise of options 5 45
End of year 6,743 6,795
Retained earnings
Beginning of year 8,840 7,398
Profit for the period attributable to shareholders of the company 2,668 1,820
Dividends declared (412) (295)
Share repurchases (114) –
Actuarial loss on retirement benefit plans (124) (83)
End of year 10,858 8,840
Contributed surplus
Beginning of year 84 85
Share-based payment expense (Note 21(c)) 14 11
Transfer to Class B subordinate voting shares on exercise of options (1) (12)
End of year 97 84
Accumulated other comprehensive income (loss)
attributable to shareholders of the company (Note 21(f))
Beginning of year 47 117
Other comprehensive loss before actuarial loss on retirement benefit plans (31) (70)
End of year 16 47
Non-controlling interests
Beginning of year 122 100
Profit for the year attributable to non-controlling interests 100 116
Other comprehensive income – (2)
Other 4 (3)
Distributions to non-controlling interests (54) (89)
End of year 172 122
Total equity $ 17,893 $ 15,895
The accompanying notes are an integral part of these financial statements.

67
1. Nature of Operations
Teck Resources Limited and its subsidiaries (“Teck,” “we,” “us,” or “our”) are engaged in mining and related activities including exploration, development, processing, smelting and refining. Our major products are steelmaking coal, copper and zinc. We also produce precious metals, lead, molybdenum, electrical power, fertilizers and other metals. Metal products are sold as refined metals or concentrates. We also own an interest in a wind power project and in certain oil sands leases and have a partnership interest in an oil sands development project.
Teck is a Canadian corporation and our registered office is at 550 Burrard Street, Vancouver, British Columbia, Canada, V6C 0B3.
2. Basis of Preparation
We prepare our financial statements in accordance with Canadian generally accepted accounting principles as set out in the Handbook of the Canadian Institute of Chartered Accountants (“CICA Handbook”). In 2010, the CICA Handbook was revised to incorporate International Financial Reporting Standards (“IFRS”) and requires publicly accountable enterprises to apply such standards effective for years beginning on or after January 1, 2011. In these financial statements, the term “Canadian GAAP” refers to Canadian GAAP before the adoption of IFRS.
These annual consolidated financial statements have been prepared in accordance with IFRS as issued by the International Accounting Standards Board (“IASB”). We adopted IFRS in accordance with IFRS 1, First-Time Adoption of International Financial Reporting Standards (“IFRS 1”) as at January 1, 2010. Subject to certain transition elections provided for in IFRS 1 and disclosed in Note 31, we have consistently applied the same accounting policies in our opening IFRS balance sheet as at January 1, 2010 and throughout all periods presented, as if these policies had always been in effect. Note 31 discloses the impact of the transition to IFRS on our reported equity, comprehensive income and cash flows, including the nature and effect of significant changes in accounting policies from those used in our consolidated financial statements for the year ended December 31, 2010. The exemptions we have taken in applying IFRS for the first time are set out in Note 31.
The policies applied in these annual consolidated financial statements are presented in Note 3 and are based on IFRS issued and outstanding as of February 28, 2012, the date the Board of Directors approved the financial statements. These accounting policies have been applied in preparing the financial statements for the years ended December 31, 2011 and 2010, and the opening balance sheet on January 1, 2010, the date of transition.
3. Summary of Significant Accounting Policies
The principal accounting policies applied in the preparation of these consolidated financial statements are set out below. These policies have been consistently applied to all the years presented, unless otherwise stated.
Basis of Presentation
Our consolidated financial statements include the accounts of Teck Resources Limited and all of its subsidiaries. Our significant operating subsidiaries include Teck Metals Ltd. (“TML”), Teck American Inc. (“TAI”), Teck Alaska Inc. (“TAK”), Teck Highland Valley Copper Partnership (“Highland Valley Copper”), Teck Coal Partnership (“Teck Coal”), Compañia Minera Teck Quebrada Blanca S.A. (“Quebrada Blanca”) and Compañia Minera Teck Carmen de Andacollo (“Andacollo”).
All subsidiaries are entities that we control, either directly or indirectly, where control is defined as the power to govern the financial and operating policies of an entity so as to obtain benefits from its activities. This control is evidenced through owning more than 50% of the voting rights or currently exercisable potential voting rights of a company’s share capital. All of our inter-company balances and transactions, including unrealized profits and losses arising from intra-group transactions, have been eliminated in full. For subsidiaries that we control, but do not own 100% of, the net assets and net profit attributable to outside shareholders are presented as amounts attributable to non-controlling interests in the consolidated balance sheet and consolidated statement of income and comprehensive income.
Notes to Consolidated Financial Statements Years ended December 31, 2011 and 2010
68 Teck 2011 Annual Report
Notes to Consolidated Financial Statements Years ended December 31, 2011 and 2010
3. Summary of Significant Accounting Policies (continued)
Certain of our mining activities are conducted through entities or assets where we share joint control including Compañia Minera Antamina (“Antamina”), Galore Creek Partnership (“Galore Creek”), Waneta Dam, Greenhills operation and Wintering Hills Wind Power Project. These entities and assets are accounted for using the proportionate consolidation method.
All dollar amounts are presented in Canadian dollars unless otherwise specified.
Interests in Joint Ventures
A joint venture can take the form of a jointly controlled entity, jointly controlled operation or jointly controlled asset. All joint ventures involve a contractual arrangement that establishes joint control. A jointly controlled entity is an entity in which we share joint control over the strategic, financial and operating decisions with one or more venturers through the establishment of a corporation, partnership or other entity. A jointly controlled operation involves the use of the assets and resources of the venturers rather than the establishment of a corporation, partnership or other entity. The operation incurs its own expenses and liabilities and raises its own finances. A jointly controlled asset involves joint control of one or more of the assets acquired or contributed for the purpose of the joint venture. Each venturer takes a share of the output from the assets and bears an agreed share of the expenses.
All joint ventures are accounted for using the proportionate consolidation method. Our proportionate share of the assets, liabilities, revenues, expenses, and cash flows of the joint venture are included in our consolidated financial statements.
Investments in Associates
Investments over which we exercise significant influence and which are neither subsidiaries nor interests in joint ventures are associates. Investments in associates are accounted for using the equity method, except when classified as held for sale.
The equity method involves the recording of the initial investment at cost and the subsequent adjusting of the carrying value of the investment for our proportionate share of the profit or loss and any other changes in the associate’s net assets such as dividends.
Our proportionate share of the associate’s profit or loss is based on its most recent financial statements. Where there are differences in the associate’s reporting period, financial statements are aligned to our reporting date or adjustments are made to reflect any material transactions or events that occur between the different dates. Adjustments are made to align any inconsistencies between our accounting policies and our associate’s policies before applying the equity method. Adjustments are also made to account for depreciable assets based on their fair values at the acquisition date and for any impairment losses recognized by the associate.
If our share of the associate’s losses equals or exceeds our investment in the associate, recognition of further losses is discontinued. After our interest is reduced to zero, additional losses will be provided for and a liability recognized, only to the extent that we have incurred legal or constructive obligations or made payments on behalf of the associate. If the associate subsequently reports profits, we resume recognizing our share of those profits only after our share of the profits equals the share of losses not recognized.
At each balance sheet date, we assess our investments in associates for indicators of impairment.
Foreign Currency Translation
The functional currency for each of our subsidiaries and for joint ventures and associates is the currency of the primary economic environment in which the entity operates. Transactions in foreign currencies are translated to the functional currency of the entity at the exchange rate in existence at the date of the transaction. Monetary assets and liabilities denominated in foreign currencies at the balance sheet date are retranslated at the period end date exchange rates. Non-monetary items which are measured using historical cost in a foreign currency are translated using the exchange rate at the date of the transaction. Non-monetary items that are measured at fair value in a foreign currency are translated using the exchange rates at the date when the fair value was determined.
The functional currency of Teck Resources Limited, the parent entity, is the Canadian dollar, which is also the presentation currency of our consolidated financial statements.

69
Foreign operations are translated from their functional currencies into Canadian dollars on consolidation. Items in the statement of income are translated using weighted average exchange rates that reasonably approximate the exchange rate at the transaction date. Items in the balance sheet are translated at the closing spot exchange rate. Exchange differences on the translation of the net assets of entities with functional currencies other than the Canadian dollar, and any offsetting exchange differences on net debt used to hedge those assets, are recognized in a separate component of equity through other comprehensive income.
Exchange differences that arise relating to long-term intercompany balances that form part of the net investment in a foreign operation are also recognized in this separate component of equity through other comprehensive income.
On disposition or partial disposition of a foreign operation, the cumulative amount of related exchange differences recorded in a separate component of equity is recognized in the statement of income.
Revenue Recognition
Sales of product are recognized when the risks and rewards of ownership pass to the customer and the price is reasonably determinable. The majority of our cathode and metal concentrates are sold under pricing arrangements where final prices are determined by quoted market prices in a period subsequent to the date of sale. For these sales, the price is determined on a provisional basis at the date of sale and revenues are recorded at that time based on forward prices.
Adjustments are made to the sale price in subsequent periods based on movements in quoted market prices up to the date of final pricing. As a result, the value of our cathode and concentrate sales receivables change as the underlying commodity market prices vary and this adjustment mechanism has the characteristics of a derivative. Accordingly, the fair value of the receivable is adjusted each reporting period by reference to forward market prices and the changes in fair value are recorded as an adjustment to other operating income (expense).
Financial Instruments
We recognize financial assets and liabilities on the balance sheet when we become a party to the contractual provisions of the instrument.
Cash and cash equivalents
Cash and cash equivalents include cash on account, demand deposits and money market investments with maturities from the date of acquisition of three months or less, which are readily convertible to known amounts of cash and are subject to insignificant changes in value. Cash and cash equivalents are designated as loans and receivables.
Trade receivables and payables
Trade receivables and payables are non-interest bearing and are recognized initially at fair value and subsequently measured at amortized cost. Where necessary, trade receivables are net of allowances for uncollectable amounts. We may enter into transactions to sell trade receivables to third parties. If the risks and rewards of ownership of the receivables are transferred to the purchaser, we account for the transaction as a sale and derecognize the trade receivables.
Investments in marketable securities
Investments in marketable securities are designated as available-for-sale and recorded at fair value. Fair values are determined by reference to quoted market prices at the balance sheet date. Unrealized gains and losses on available-for-sale investments are recognized in other comprehensive income until investments are disposed of or when there is objective evidence of an impairment in value. Investment transactions are recognized on the trade date with transaction costs included in the underlying balance.
At each balance sheet date, we assess for any objective evidence of an impairment in value of our investments and record such impairments in profit for the period. If an impairment of an investment in a marketable equity security has been recorded in profit, it cannot be reversed in future periods.

70 Teck 2011 Annual Report
Notes to Consolidated Financial Statements Years ended December 31, 2011 and 2010
3. Summary of Significant Accounting Policies (continued)
Debt
Debt is initially recorded at total proceeds received less direct issuance costs. Debt is subsequently measured at amortized cost, calculated using the effective interest rate method.
Derivative instruments
Derivative instruments, including embedded derivatives, are recorded at fair value through profit or loss and accordingly are recorded on the balance sheet at fair value. Unrealized gains and losses on derivatives held for trading are recorded as part of other operating income (expense) or non-operating income (expense) in profit depending on the nature of the derivative. Fair values for derivative instruments are determined using valuation techniques, using assumptions based on market conditions existing at the balance sheet date. Derivatives embedded in non-derivative contracts are recognized separately unless they are closely related to the host contract.
Hedging
Certain derivative investments may qualify for hedge accounting. For fair value hedges, any gains or losses on the hedging instrument relating to both the effective and ineffective portion of the hedge are recognized in profit, which offset the fair value changes in the hedged item.
For cash flow hedges, any unrealized gains and losses on the hedging instrument relating to the effective portion of the hedge are initially recorded in other comprehensive income. Gains and losses are recognized in profit upon settlement of the hedging instrument, when the hedged item ceases to exist, or when the hedge is determined to be ineffective.
For hedges of net investments in foreign operations, any foreign exchange gains or losses on the hedging instrument relating to the effective portion of the hedge are initially recorded in other comprehensive income. Gains and losses are recognized in profit on the ineffective portion of the hedge, or when there is a disposal or partial disposal of a foreign operation being hedged.
Inventories
Finished products, work in process and raw materials inventories are valued at the lower of weighted average cost and net realizable value. Raw materials include concentrates for use at smelting and refining operations. Work in process inventory includes inventory in the milling, smelting or refining process and stockpiled ore at mining operations.
For work in process and finished product inventories, cost includes all direct costs incurred in production including direct labour and materials, freight, depreciation and amortization and directly attributable overhead costs. Waste rock stripping costs related to mine production are included in the cost of inventories as incurred.
When inventories have been written down to net realizable value, we make a new assessment of net realizable value in each subsequent period. If the circumstances that caused the write-down no longer exist, the remaining amount of the write-down is reversed.
We use both joint-product and by-product costing for work in process and finished product inventories. Joint costing is applied to primary products at the Red Dog, Antamina, Duck Pond and Trail operations, where the profitability of the operations is dependent upon the production of a number of primary products. Joint costing allocates total production costs based on the relative values of the products. Where by-product costing is used, by-products are allocated the incremental costs of processes that are specific to the production of that product.
Supplies inventory is valued at the lower of weighted average cost and net realizable value. Cost includes acquisition, freight and other directly attributable costs.

71
Property, Plant and Equipment
Land, buildings, plant and equipment
Land is recorded at cost and buildings, plant and equipment are recorded at cost less accumulated depreciation and impairment losses. Cost includes the purchase price and the directly attributable costs to bring the assets to the location and condition necessary for it to be capable of operating in the manner intended by management.
Depreciation of mobile equipment, buildings used for production, and plant and processing equipment at our mining operations is calculated on a units-of-production basis. Depreciation of buildings not used for production, and plant and equipment at our smelting operations is calculated on a straight-line basis over the assets’ estimated useful lives. Where components of an asset have different useful lives, depreciation is calculated on each separate part. Depreciation commences when an asset is available for use. Estimates of remaining useful lives and residual values are reviewed annually. Changes in estimates are accounted for prospectively.
The expected useful lives are as follows:
• Buildingsandequipment(notusedinproduction) 3–40years
• Plantandequipment(smeltingoperations) 8–25years
Mineral properties and mine development costs
The cost of acquiring and developing mineral properties or property rights, including waste rock stripping costs related to mine development and costs incurred during production to increase future output by providing access to additional sources of reserves, are deferred. Once available for use, mineral properties and mine development costs are depreciated on a units-of-production basis over the proven and probable reserves to which they relate.
Underground mine development costs are depreciated using the block depreciation method where development costs associated with each distinct section of the mine are depreciated over the reserves to which they relate.
Exploration and evaluation costs
Exploration and evaluation costs are charged to profit in the year in which they are incurred, except where these costs relate to specific properties for which resources, as defined under National Instrument 43-101, exist and it is expected that the expenditure can be recovered by future exploitation or sale, in which case they are capitalized. Capitalized exploration and evaluation costs are considered to be tangible assets. These assets are not depreciated as they are not currently available for use. When proven and probable reserves are determined and development is approved, capitalized exploration and evaluation costs are reclassified to mineral properties and leases or construction in progress within property, plant and equipment.
Development costs of oil sand properties
The costs of acquiring, exploring, evaluating and developing oil sands properties are capitalized when it is expected that these costs will be recovered through future exploitation or sale of the property. Capitalized development costs of oil sand properties are considered to be tangible assets. These assets are not depreciated as they are not currently available for use. When proven and probable reserves are determined and development is approved, capitalized development costs for oil sand properties are reclassified to mineral properties and leases or construction in progress within property, plant and equipment.
Construction in progress
Assets in the course of construction are capitalized as construction in progress. Construction in progress is not depreciated. On completion, the cost of construction is transferred to the appropriate category of property, plant and equipment, and depreciation commences when the asset is available for its intended use.

72 Teck 2011 Annual Report
Notes to Consolidated Financial Statements Years ended December 31, 2011 and 2010
3. Summary of Significant Accounting Policies (continued)
Impairment of non-current assets
The carrying amounts of non-current assets are reviewed for impairment whenever facts and circumstances suggest that the carrying amounts may not be recoverable. If there are indicators of impairment, the recoverable amount of the asset is estimated in order to determine the extent of any impairment. Where the asset does not generate cash flows that are independent from other assets, the recoverable amount of the cash generating unit to which the asset belongs is determined. The recoverable amount of an asset or cash generating unit is determined as the higher of its fair value less cost to sell and its value in use. An impairment loss exists if the asset’s or cash generating unit’s carrying amount exceeds the recoverable amount and is recorded as an expense immediately.
Value in use is determined as the present value of the future cash flows expected to be derived from an asset or cash generating unit. The estimated future cash flows are discounted to their present value using a pre-tax discount rate that reflects current market assessments of the time value of money and the risks specific to the asset or cash generating unit for which estimates of future cash flows have not been adjusted. Fair value less cost to sell is the amount obtainable from the sale of an asset or cash generating unit in an arm’s length transaction between knowledgeable, willing parties, less the costs of disposal. For mining assets, when a binding sale agreement is not readily available, fair value less cost to sell is estimated using a discounted cash flow approach. Estimated future cash flows are calculated using estimated future prices, mineral reserves and resources, operating and capital costs. All assumptions used are those that an independent market participant would consider appropriate.
When there is an indication of impairment of exploration and evaluation assets or oil sands development costs, impairment will be assessed at the area of interest or geographical region level, respectively, representing a cash generating unit.
Tangible assets that have been impaired in prior periods are tested for possible reversal of impairment whenever events or changes in circumstances indicate that the impairment has reversed. If the impairment has reversed, the carrying amount of the asset is increased to its recoverable amount but not beyond the carrying amount that would have been determined had no impairment loss been recognized for the asset in the prior periods. A reversal of an impairment loss is recognized into profit immediately.
Repairs and maintenance
Repairs and maintenance costs, including shutdown maintenance costs, are charged to expense as incurred, except when these repairs significantly extend the life of an asset or result in an operating improvement. In these instances, the portion of these repairs relating to the betterment is capitalized as part of plant and equipment.
Borrowing costs
We capitalize borrowing costs that are directly attributable to the acquisition, construction or production of an asset that takes a substantial period of time to get ready for its intended use. We begin capitalizing borrowing costs when expenditures are incurred and activities are undertaken to prepare the asset for its intended use. The amount of borrowing costs capitalized cannot exceed the actual amount of borrowing costs incurred during the period. All other borrowing costs are expensed as incurred.
We discontinue the capitalization of borrowing costs when substantially all of the activities necessary to prepare the qualifying asset for its intended use or sale are complete. Capitalized borrowing costs are amortized over the useful life of the related asset.
Leased assets
Leased assets in which we receive substantially all of the risks and rewards of ownership of the asset are capitalized as finance leases at the lower of the fair value of the asset or the estimated present value of the minimum lease payments. The corresponding lease obligation is recorded within debt on the balance sheet.
Assets under operating leases are not capitalized, and rental payments are expensed based on the terms of the lease.

73
Goodwill
We allocate goodwill arising from business combinations to each cash generating unit or group of cash generating units that are expected to receive the benefits from the business combination. Irrespective of any indication of impairment, the recoverable amount of the cash generating unit or group of cash generating units to which goodwill has been allocated is tested annually for impairment and when there is an indication that the goodwill may be impaired in accordance with “Impairment of non-current assets.” Any impairment is recognized as an expense immediately. Any impairment of goodwill is not subsequently reversed.
Current and Deferred Taxes
Taxes, comprising both income and resource taxes, which are accounted for as income taxes, are recognized in the statement of income, except where they relate to items recognized in other comprehensive income or directly in equity, in which case the related taxes are recognized in other comprehensive income or equity.
Current taxes receivable or payable are estimated on taxable income for the current year at the statutory tax rates enacted or substantively enacted.
Deferred tax assets and liabilities are recognized based on the difference between the tax and accounting values of assets and liabilities and are calculated using enacted or substantively enacted tax rates for the periods in which the differences are expected to reverse. The effect of tax rate changes is recognized in profit or equity, as the case may be, in the period of substantive enactment.
Deferred tax assets are recognized only to the extent that it is probable that future taxable profits of the relevant entity or group of entities, in a particular jurisdiction, will be available against which the assets can be utilized.
Deferred tax liabilities are recognized for taxable temporary differences arising on investments in subsidiaries, joint ventures and associates. However, we do not recognize such deferred tax liabilities where the timing of the reversal of the temporary differences can be controlled and it is probable that the temporary differences will not reverse in the foreseeable future.
As an exception, deferred tax assets and liabilities are not recognized if the temporary differences arise from the initial recognition of goodwill or an asset or liability in a transaction (other than in a business combination) that affects neither accounting profit nor taxable profit.
We are subject to assessments by various taxation authorities that may interpret tax legislation differently than ourselves. The final amount of taxes to be paid depends on a number of factors, including the outcomes of audits, appeals, or negotiated settlements. We account for such differences based on our best estimate of the probable outcome of these matters.
Employee Benefits
Defined benefit pension plans
Defined benefit pension plan obligations are based on actuarial determinations. The projected unit credit method is used to determine the defined benefit obligations, the related current service costs and, where applicable, the past service costs. Actuarial assumptions used in the determination of defined benefit pension plan assets and liabilities and non-pension post-retirement obligation are based upon our best estimates, including discount rates, expected plan performance, salary escalation, expected health care costs and retirement dates of employees.
Past service costs are recognized as an expense on a straight-line basis evenly throughout the vesting period. To the extent that the benefits are already vested, immediately following the introduction of changes to a defined benefit plan, the past service costs are expensed.
Actuarial gains and losses, which can arise from differences between expected and actual outcomes or changes in actuarial assumptions, are recognized immediately through other comprehensive income and directly into retained earnings.
74 Teck 2011 Annual Report
Notes to Consolidated Financial Statements Years ended December 31, 2011 and 2010
3. Summary of Significant Accounting Policies (continued)
Defined contribution pension plans
The cost of providing benefits through defined contribution plans is charged to profit as the obligation to contribute is incurred.
Non-pension post-retirement plans
We provide certain health care benefits for certain employees when they retire. Non-pension post-retirement plan obligations are based on actuarial determinations. The cost of these benefits is expensed over the period in which the employees render services. These non-pension post-retirement benefits are funded by us as they become due.
Share-Based Payments
The fair value method of accounting is used for share-based payment transactions. Under this method, the cost of share options and other equity-settled share-based payment arrangements is recorded based on the estimated fair value at the grant date and charged to profit over the vesting period. For employees eligible for normal retirement prior to vesting, the expense is charged to profit over the period from the grant date to the date they are eligible for retirement. Where awards are forfeited because non-market based vesting conditions are not satisfied, the expense previously recognized is proportionately reversed in the period the forfeiture occurs.
Share-based payment expense relating to cash-settled awards, including deferred and restricted share units is accrued over the vesting period of the units based on the quoted market value of Class B subordinate voting shares. As these awards will be settled in cash, the expense and liability are adjusted each reporting period for changes in the underlying share price.
Provisions
Decommissioning and restoration provisions
Future obligations to retire an asset, including dismantling, remediation and ongoing treatment and monitoring of the site related to normal operations are initially recognized and recorded as a provision based on estimated future cash flows discounted at a credit adjusted risk free rate. This decommissioning and restoration provision is adjusted at each reporting period for changes to factors including the expected amount of cash flows required to discharge the liability, the timing of such cash flows and the discount rate.
The provisions are also accreted to full value over time through periodic charges to profit. This unwinding of the discount is charged to financing expense in the statement of income.
The amount of the decommissioning and restoration provision initially recognized is capitalized as part of the related asset’s carrying value and depreciated to profit. The method of depreciation follows that of the underlying asset. The costs related to a decommissioning and restoration provision are only capitalized to the extent that the amount meets the definition of an asset and can bring about future economic benefit. For a closed site or where the asset which generated a decommissioning and restoration provision no longer exists, there is no longer future benefit related to the costs and as such, the amounts are expensed. For operating sites, a revision in estimates or a new disturbance will result in an adjustment to the liability with an offsetting adjustment to the capitalized retirement cost. For closed sites, adjustments to the decommissioning and restoration provision that are required as a result of changes in estimates are charged to profit in the period in which the adjustment is identified.
Environmental disturbance restoration provisions
During the operating life of an asset, events such as infractions of environmental laws or regulations may occur. These events are not related to the normal operation of the asset and are referred to as environmental disturbance restoration provisions. The costs associated with these provisions are accrued and charged to profit in the period in which the event giving rise to the liability occurs. Any subsequent adjustments to these provisions due to changes in estimates are also charged to profit in the period of adjustment. These costs are not capitalized as part of the long-lived asset’s carrying value.

75
Other provisions
Provisions are recognized when a present legal or constructive obligation exists, as a result of past events, and it is probable that an outflow of resources that can be reliably estimated will be required to settle the obligation. Where the effect is material, the provision is discounted using an appropriate current market-based pre-tax discount rate.
Share Repurchases
Where we repurchase any of our equity share capital, the excess of the consideration paid over book value is deducted from contributed surplus and retained earnings on a pro-rata basis.
Research and Development
Research costs are expensed as incurred. Development costs are only deferred when the product or process is clearly defined, the technical feasibility has been established, the future market for the product or process is clearly defined and we are committed to, and have the resources to, complete the project.
Earnings per Share
Earnings per share is calculated based on the weighted average number of shares outstanding during the year. For diluted earnings per share, dilution is calculated based upon the net number of common shares issued should “in-the-money” options and warrants be exercised and the proceeds used to repurchase common shares at the average market price in the year. Dilution from convertible securities is calculated based on the number of shares to be issued after taking into account the reduction of the related after-tax interest expense.
New IFRS Pronouncements
New IFRS pronouncements that have been issued but are not yet effective are listed below. We plan to apply the new standard or interpretation in the annual period for which it is first effective.
Consolidated financial statements
In May 2011, the IASB issued IFRS 10, Consolidated Financial Statements (“IFRS 10”). IFRS 10 establishes principles for the presentation and preparation of consolidated financial statements when an entity controls one or more other entities. This IFRS defines the principle of control and establishes control as the basis for determining which entities are consolidated in an entity’s consolidated financial statements. IFRS 10 sets out three elements of control: a) power over the investee; b) exposure, or rights, to variable returns from involvement with the investee; and c) the ability to use power over the investee to affect the amount of the investors’ return. IFRS 10 sets out the requirements on how to apply the control principle. IFRS 10 supersedes International Accounting Standards (“IAS”) 27, Consolidated and Separate Financial Statements and Standing Interpretations Committee (“SIC”) 12, Consolidation – Special Purpose Entities.
IFRS 10 is effective for annual periods beginning on or after January 1, 2013, with earlier application permitted if adopted along with IFRS 11, Joint Arrangements (“IFRS 11”), IFRS 12, Disclosures of Interest in Other Entities (“IFRS 12”), IAS 27 (revised) and IAS 28, Investments in Associates and Joint Ventures (revised) (“IAS 28”). We are currently assessing the impact of these standards on our financial statements.

76 Teck 2011 Annual Report
Notes to Consolidated Financial Statements Years ended December 31, 2011 and 2010
3. Summary of Significant Accounting Policies (continued)
Disclosures of interests in other entities
In May 2011, the IASB issued IFRS 12, which outlines the disclosure requirements for interests in subsidiaries and other entities to enable users to evaluate the risks associated with interests in other entities and the effects of those interests on an entity’s financial position, financial performance and cash flows. IFRS 12 supersedes IAS 27, Consolidated and Separate Financial Statements and SIC-12, Consolidation – Special Purpose Entities.
IFRS 12 is effective for annual periods beginning on or after January 1, 2013, with earlier application permitted if adopted along with IFRS 10, IFRS 11, IAS 27 (revised) and IAS 28 (revised). We are currently assessing the impact of these standards on our financial statements.
Joint arrangements
In May 2011, the IASB issued IFRS 11, which provides guidance on accounting for joint arrangements. If an arrangement results in joint control, IFRS 11 classifies joint arrangements as either joint operations or joint ventures, depending on the rights and obligations of the parties involved.
A joint operation is an arrangement where the jointly controlling parties have rights to the assets and obligations in respect of the liabilities relating to the arrangement. An entity accounts for a joint operation by recognizing its portion of the assets, liabilities, revenues and expenses. A joint venture is an arrangement where the jointly controlling parties have rights to the net assets of the arrangement. A joint venture is accounted for using the equity method. Proportionate consolidation is no longer permitted.
This standard is effective for annual periods beginning on or after January 1, 2013, with earlier application permitted. We are currently assessing the impact that IFRS 11 will have on our consolidated financial statements. This assessment includes analyzing all our joint arrangements to determine the appropriate accounting treatment under the new standard, as it is our current accounting policy to proportionately consolidate all our joint ventures.
Financial instruments
IFRS 9, Financial Instruments (“IFRS 9”), addresses the classification, measurement and recognition of financial assets and financial liabilities. IFRS 9 was issued in November 2009 and October 2010. It replaces the parts of IAS 39, Financial Instruments: Recognition and Measurement (“IAS 39”) that relate to the classification and measurement of financial instruments. IFRS 9 requires financial assets to be classified into two measurement categories: those measured as at fair value and those measured at amortized cost. The determination is made at initial recognition. The classification depends on the entity’s business model for managing its financial instruments and the contractual cash flow characteristics of the instrument. For financial liabilities, the standard retains most of the IAS 39 requirements. The main change is that, in cases where the fair value option is taken for financial liabilities, the part of a fair value change due to an entity’s own credit risk is recorded in other comprehensive income rather than the income statement, unless this creates an accounting mismatch.
IFRS 9 is effective for annual periods beginning on or after January 1, 2015, with earlier application permitted. We are currently assessing the impact of this standard on our financial statements.
Fair value measurement
In May 2011, the IASB issued IFRS 13, Fair Value Measurement (“IFRS 13”). This standard defines fair value, sets out a single IFRS framework for measuring fair value and outlines disclosure requirements about fair value measurements.
IFRS 13 defines fair value as the price that would be received to sell an asset or paid to transfer a liability in an orderly transaction between market participants at the measurement date. Fair value is a market-based measurement, not an entity-specific measurement so assumptions that market participants would use should be applied in measuring fair value.

77
IFRS 13 is effective for annual periods on or after January 1, 2013, with earlier application permitted. This IFRS is to be applied prospectively as of the beginning of the annual period in which it is initially applied and the disclosure requirements do not need to be applied in comparative periods before initial application. We are currently assessing the impact of this standard on our financial statements.
Post-employment benefits
In June 2011, the IASB issued an amended version of IAS 19, Employee Benefits (“IAS 19”). The amendments to IAS 19 are meant to improve the quality, transparency and comparability of information presented for post-employment benefits. For defined benefit plans, the amendments eliminate the option to defer actuarial gains and losses on the balance sheet through the “corridor method”. The amendments also require any remeasurement gains or losses, including actuarial gains and losses, to be recognized immediately and presented in other comprehensive income, eliminating the option to recognize and present these through the income statement. Additional disclosures will also be required to present better information about the characteristics, amounts recognized and risks related to defined benefit plans.
The amendments to IAS 19 are effective for financial years beginning on or after January 1, 2013 with earlier application permitted. The amendment to eliminate the “corridor method” does not impact our financial statements as we do not employ it. We are currently assessing the impact of the other amendments to IAS 19 noted above on our financial statements.
Other comprehensive income
In June 2011, the IASB and the Financial Accounting Standards Board (“FASB”) issued amendments to standards to align the presentation requirements for other comprehensive income (“OCI”). The IASB issued amendments to IAS 1, Presentation of Financial Statements (“IAS 1”) to require companies preparing financial statements under IFRS to group items within OCI that may be reclassified to the profit or loss. The amendments also reaffirm existing requirements that items in OCI and profit or loss should be presented as either a single statement or two consecutive statements.
The amendments to IAS 1 set out in Presentation of Items of Other Comprehensive Income are effective for fiscal years beginning on or after July 1, 2012 with earlier application permitted. We are currently assessing the impact of these amendments on our financial statements.
Stripping costs
In October 2011, the IASB issued International Financial Reporting Issues Committee (“IFRIC”) 20, Stripping Costs in the Production Phase of a Surface Mine. The interpretation provides guidance on how to account for overburden waste removal (stripping) costs in the production phase of a mine. Stripping activity related to inventory produced is accounted for in accordance with IAS 2, Inventories. Stripping activity that improves access to ore is accounted for as an addition to or enhancement of an existing asset. IFRIC 20 is effective for annual periods on or after January 1, 2013 with earlier application permitted. We are currently assessing the impact of IFRIC 20 on our financial statements.
4. Critical Accounting Estimates and Judgments
In preparing these consolidated financial statements, we make estimates and judgments that affect the amounts recorded. Actual results could differ from our estimates. Our estimates and judgments are based on historical experience and other factors we consider to be reasonable, including expectations of future events. The estimates and assumptions that could result in a material impact to the carrying amounts of assets and liabilities are outlined below.
Goodwill Impairment Testing
Goodwill impairment testing is based on discounted cash flow models prepared by internal experts with help from third-party advisors when required. Note 15 outlines the significant judgments and assumptions made in performing goodwill impairment testing. The assumptions used are based on management’s best estimates and are reviewed by senior management. Changes in these assumptions may alter the results of goodwill impairment testing, impairment charges recorded in the income statement and the resulting carrying values of assets.

78 Teck 2011 Annual Report
Notes to Consolidated Financial Statements Years ended December 31, 2011 and 2010
4. Critical Accounting Estimates and Judgments (continued)
Estimated Recoverable Reserves and Resources
Mineral reserve and resource estimates are based on various assumptions relating to operating matters, including, with respect to production costs, mining and processing recoveries, cut-off grades, as well as assumptions relating to long-term commodity prices and, in some cases, exchange rates, inflation rates and capital costs. Cost estimates are based on feasibility study estimates or operating history. Estimates are prepared by appropriately qualified persons, but will be impacted by forecasted commodity prices, inflation rates, exchange rates, capital and production costs and recoveries amongst other factors. Estimated recoverable reserves and resources are used to determine the depreciation of property, plant and equipment at operating mine sites, in accounting for deferred stripping costs, in performing impairment testing and for forecasting the timing of the payment of decommissioning and restoration costs. Therefore, changes in the assumptions used could impact the carrying value of assets, depreciation and impairment charges recorded in the income statement and the carrying value of the decommissioning and restoration provision.
Decommissioning and Restoration Provisions
The decommissioning and restoration provision is based on future cost estimates using information available at the balance sheet date. The decommissioning and restoration provision is adjusted at each reporting period for changes to factors such as the expected amount of cash flows required to discharge the liability, the timing of such cash flows and the discount rate. The decommissioning and restoration provision requires other significant estimates and assumptions such as: requirements of the relevant legal and regulatory framework, and the timing, extent and costs of required decommissioning and restoration activities. To the extent the actual costs differ from these estimates, adjustments will be recorded and the income statement may be impacted (Note 20).
Retirement Benefit Plans
Actuarial assumptions used in the determination of defined benefit pension plan assets and obligations and non-pension post-retirement benefit obligations are based upon management’s best estimates, which includes factors such as discount rates, expected plan performance, salary escalation, expected health care costs, retirement dates of employees and life expectancy. Refer to Note 19 for further discussion of significant assumptions.
Current and Deferred Taxes
We calculate current and deferred tax provisions for each of the jurisdictions in which we operate. Actual amounts of income tax expense are not final until tax returns are filed and accepted by the relevant authorities. This occurs subsequent to the issuance of financial statements. Therefore, profit in subsequent periods will be affected by the amount that estimates differ from the final tax return.
Judgment is required in assessing whether deferred tax assets and certain deferred tax liabilities are recognized on the balance sheet. We also evaluate the recoverability of deferred tax assets based on an assessment of the ability to use the underlying future tax deductions before they expire against future taxable income. Deferred tax liabilities arising from temporary differences on investments in subsidiaries, joint ventures and associates are recognized unless the reversal of the temporary differences are not expected to occur in the foreseeable future and can be controlled. Assumptions about the generation of future taxable profits and repatriation of retained earnings depend on management’s estimates of future production and sales volumes, commodity prices, reserves, operating costs, decommissioning and restoration costs, capital expenditures, dividends and other capital management transactions. Judgment is also required about the application of income tax legislation. These estimates and judgments are subject to risk and uncertainty and could result in an adjustment to the deferred tax provision and a corresponding credit or charge to profit.
Fair Value of Derivatives
Derivative instruments are valued using pricing models or discounted cash flow models. These models require a variety of inputs, including, but not limited to, contractual items, market prices, forward price curves, yield curves and credit spreads. These inputs are obtained from or corroborated with the market where possible. Changes in these assumptions could impact the carrying value of derivative instruments and the amount of unrealized gains or losses recognized in other operating income (expense) and non-operating income (expense).

79
5. Dispositions
a) Completed Dispositions in 2011
Disposition
Date of Sale
Consideration
Pre-tax Gain (Cdn$ in millions)
Carrapateena project May 2011 US$134 million in cash and future contingent payment of up to US$25 million
$ 110
Total $ 110
In May 2011, we sold our entire 34% interest in the Carrapateena project in Southern Australia to an affiliate of Oz Minerals Ltd. We received cash proceeds of US$134 million and may receive future contingent payments of up to US$25 million based on future production from the property. We have not recorded any value related to the contingent consideration.
b) Completed Dispositions in 2010
Disposition
Date of Sale
Consideration
Pre-tax Gain (Cdn$ in millions)
Andacollo Gold Stream (i)
January 2010
US$218 million in cash and approximately 1.2 million Royal Gold Inc. (“Royal Gold”) common shares valued at US$53 million at the date of sale
$ –
Entire 60% interest in Agi Dagi and Kirazli gold projects
January 2010
US$24 million in cash and approximately 2.4 million shares of Alamos Gold Incorporated (“Alamos”) valued at US$30 million at the date of sale
50
One-third interest in Waneta Dam (ii)
March 2010 $825 million in cash 656
Total $ 706
i. Andacollo gold stream
In January 2010, Andacollo sold an interest in the gold reserves and resources of the Andacollo mine to Royal Gold. Under the agreement, Royal Gold will be entitled to 75% of the payable gold produced until total cumulative production reaches 910,000 ounces of gold, and 50% thereafter. We recorded the transaction as a sale of a partial mineral property interest and the total consideration was accounted for as a recovery of mineral property costs. Accordingly, no gain or loss was recognized on this transaction.
ii. Interest in Waneta Dam
In March 2010, we sold a one-third interest in the Waneta Hydroelectric Dam to BC Hydro, which supplies power to our smelter operations at Trail. The one-third interest approximately represents the excess generating capacity of the Dam, which was surplus to the Trail smelter’s requirements. Our remaining two-thirds interest in the Waneta Dam is a jointly controlled asset. We account for our proportionate share of the Waneta Dam assets, liabilities and operating costs in our consolidated financial statements (Note 25).

80 Teck 2011 Annual Report
Notes to Consolidated Financial Statements Years ended December 31, 2011 and 2010
6. Expenses by Nature
(Cdn$ in millions) 2011 2010
Wages and salaries $ 824 $ 738
Wage-related costs 165 133
Bonus payments 95 62
Post-employment benefits 111 41
Raw material purchases 1,045 622
Transportation 1,028 1,042
Depreciation and amortization 911 916
Fuel and energy 724 513
Contractors and consultants 620 439
Maintenance and repair supplies 578 510
Operating supplies 420 352
Overhead costs 373 344
Royalties 166 222
Other operating costs 68 140
7,128 6,074
Less:
Capitalized mining costs (108) (160)
Change in inventory (136) –
Total cost of sales, general and administration, exploration and research and development expenses
$ 6,884
$ 5,914
7. Other Operating Income (Expense)
(Cdn$ in millions) 2011 2010
Gain on sale of operating assets $ 130 $ 721
Commodity derivatives 7 8
Pricing adjustments (Note 26(c)) (210) 116
Share-based compensation 21 (124)
Provision for closed properties (30) (47)
Asset write-downs (30) –
Other (62) (34)
$ (174) $ 640
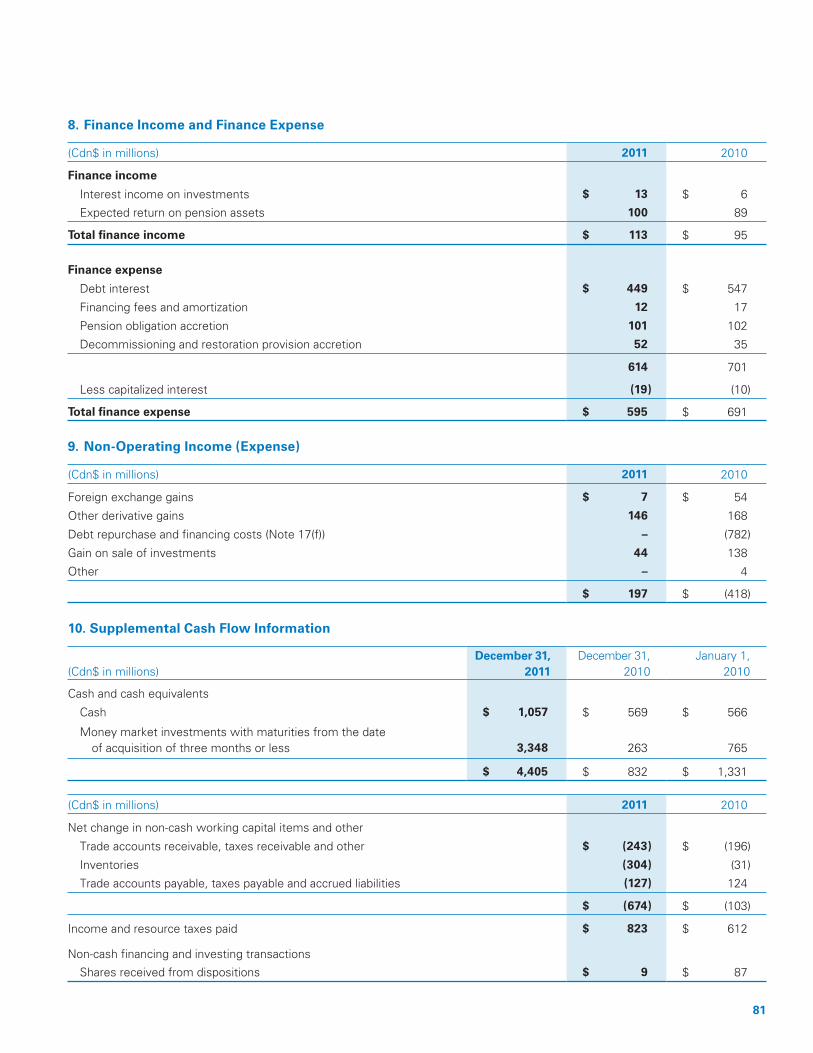
81
8. Finance Income and Finance Expense
(Cdn$ in millions) 2011 2010
Finance income
Interest income on investments $ 13 $ 6
Expected return on pension assets 100 89
Total finance income $ 113 $ 95
Finance expense
Debt interest $ 449 $ 547
Financing fees and amortization 12 17
Pension obligation accretion 101 102
Decommissioning and restoration provision accretion 52 35
614 701
Less capitalized interest (19) (10)
Total finance expense $ 595 $ 691
9. Non-Operating Income (Expense)
(Cdn$ in millions) 2011 2010
Foreign exchange gains $ 7 $ 54
Other derivative gains 146 168
Debt repurchase and financing costs (Note 17(f)) – (782)
Gain on sale of investments 44 138
Other – 4
$ 197 $ (418)
10. Supplemental Cash Flow Information
(Cdn$ in millions)
December 31, 2011
December 31, 2010
January 1, 2010
Cash and cash equivalents
Cash $ 1,057 $ 569 $ 566
Money market investments with maturities from the date of acquisition of three months or less
3,348
263
765
$ 4,405 $ 832 $ 1,331
(Cdn$ in millions) 2011 2010
Net change in non-cash working capital items and other
Trade accounts receivable, taxes receivable and other $ (243) $ (196)
Inventories (304) (31)
Trade accounts payable, taxes payable and accrued liabilities (127) 124
$ (674) $ (103)
Income and resource taxes paid $ 823 $ 612
Non-cash financing and investing transactions
Shares received from dispositions $ 9 $ 87

82 Teck 2011 Annual Report
Notes to Consolidated Financial Statements Years ended December 31, 2011 and 2010
11. Inventories
(Cdn$ in millions)
December 31, 2011
December 31, 2010
January 1, 2010
Raw materials $ 190 $ 162 $ 211
Supplies 455 315 315
Work in process 475 392 385
Finished products 572 523 474
1,692 1,392 1,385
Less long-term portion (Note 12) (51) (18) (19)
$ 1,641 $ 1,374 $ 1,366
Cost of sales of $6.6 billion (2010 – $5.7 billion) include $6.3 billion (2010 – $5.4 billion) of inventories recognized as an expense during the period.
Total inventories held at net realizable value amounted to $237 million at December 31, 2011 (2010 – $74 million; January 1, 2010 – $5 million).
Long-term inventories consist of ore stockpiles that are not planned to be processed within one year.
12. Financial and Other Assets
(Cdn$ in millions)
December 31, 2011
December 31, 2010
January 1, 2010
Long term receivables and deposits $ 203 $ 190 $ 189
Investments carried at fair value:
Available-for-sale instruments
Marketable equity securities 511 344 245
Held for trading instruments
Warrants – 3 2Derivative assets (net of current portion of $4 million) (2010 – $21 million (Note 26(c)))
314
174
95
Pension assets (Note 19) 6 29 31
Long-term inventories 51 18 19
Other 53 47 47
$ 1,138 $ 805 $ 628
Derivative assets consist primarily of the prepayment rights in our 10.25% notes due May 2016 and our 10.75% notes due May 2019. These prepayment rights are considered embedded derivatives that require separation and valuation (Note 26(c)).

83
13. Investments in Associates
(Cdn$ in millions) 2011 2010
At January 1 $ 659 $ 650
Contributions 61 14
Share of profit (loss) (5) (5)
At December 31 $ 715 $ 659
Our share of the assets and liabilities of our associates and their results are as follows:
(Cdn$ in millions)
December 31, 2011
December 31, 2010
January 1, 2010
Share of associates’ financial position
Total assets $ 723 $ 682 $ 678
Total liabilities 8 23 28
Carrying amount of the investment $ 715 $ 659 $ 650
Our share of our associates’ losses was $5 million in 2011 and $5 million in 2010. Our associates had no revenue in 2011 and 2010.
Fort Hills Energy Limited Partnership
In November 2005, we acquired a 15% interest in the Fort Hills Energy Limited Partnership, which is developing the Fort Hills oil sands project in Alberta, Canada. Fort Hills is our only significant investment in an associate. As consideration for our initial 15% interest, we contributed 34% of the first $2.5 billion of project expenditures. In September 2007, we acquired an additional 5% interest, bringing our interest to 20%. In consideration for our additional 5% interest, we are required to contribute 27.5% of project expenditures after project spending reaches $2.5 billion and before project spending reaches $7.5 billion. Thereafter, we are responsible for funding our 20% share of development costs. In the event that the project is abandoned, all limited partners are required to make additional contributions such that the aggregate contributions of all partners equal $7.5 billion and any unexpended amount will be distributed to the partners according to their partnership interest. Project spending totalled $2.8 billion as of December 31, 2011, of which our share was $961 million.
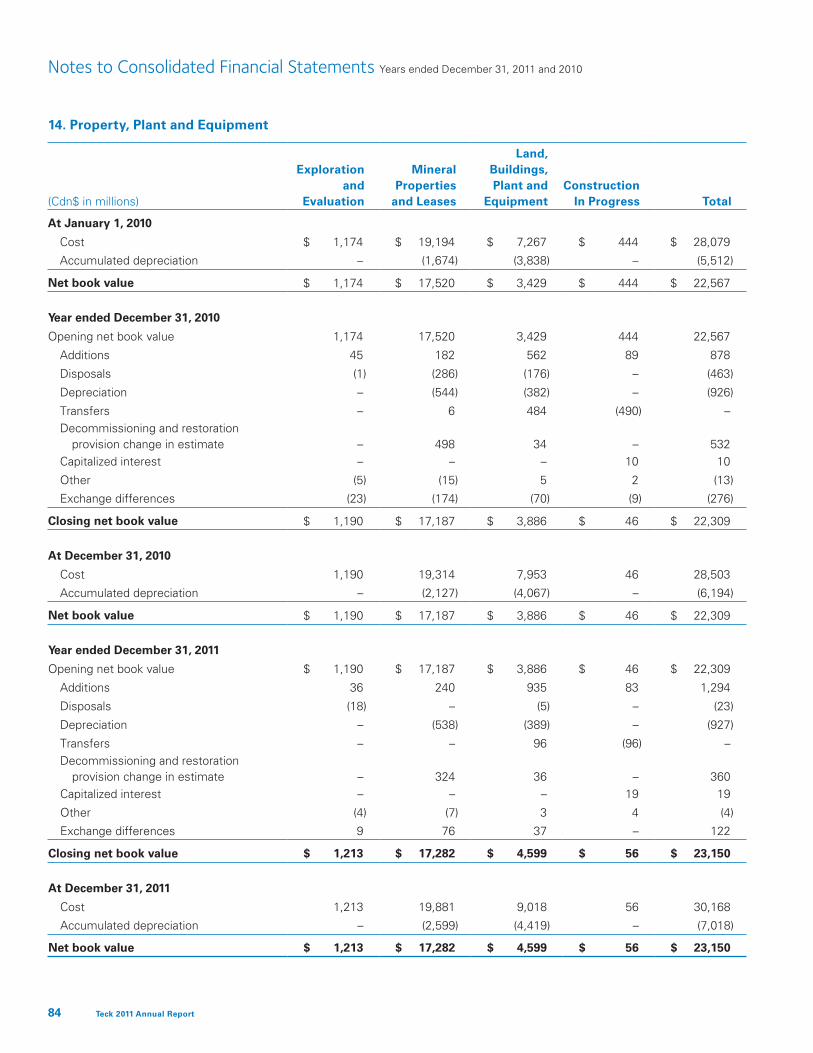
84 Teck 2011 Annual Report
Notes to Consolidated Financial Statements Years ended December 31, 2011 and 2010
14. Property, Plant and Equipment
(Cdn$ in millions)
Exploration
and Evaluation
Mineral
Propertiesand Leases
Land,Buildings,Plant and
Equipment
ConstructionIn Progress
Total
At January 1, 2010
Cost $ 1,174 $ 19,194 $ 7,267 $ 444 $ 28,079
Accumulated depreciation – (1,674) (3,838) – (5,512)
Net book value $ 1,174 $ 17,520 $ 3,429 $ 444 $ 22,567
Year ended December 31, 2010
Opening net book value 1,174 17,520 3,429 444 22,567
Additions 45 182 562 89 878
Disposals (1) (286) (176) – (463)
Depreciation – (544) (382) – (926)
Transfers – 6 484 (490) –Decommissioning and restoration
provision change in estimate –
498
34
–
532
Capitalized interest – – – 10 10
Other (5) (15) 5 2 (13)
Exchange differences (23) (174) (70) (9) (276)
Closing net book value $ 1,190 $ 17,187 $ 3,886 $ 46 $ 22,309
At December 31, 2010
Cost 1,190 19,314 7,953 46 28,503
Accumulated depreciation – (2,127) (4,067) – (6,194)
Net book value $ 1,190 $ 17,187 $ 3,886 $ 46 $ 22,309
Year ended December 31, 2011
Opening net book value $ 1,190 $ 17,187 $ 3,886 $ 46 $ 22,309
Additions 36 240 935 83 1,294
Disposals (18) – (5) – (23)
Depreciation – (538) (389) – (927)
Transfers – – 96 (96) –Decommissioning and restoration
provision change in estimate –
324
36
–
360
Capitalized interest – – – 19 19
Other (4) (7) 3 4 (4)
Exchange differences 9 76 37 – 122
Closing net book value $ 1,213 $ 17,282 $ 4,599 $ 56 $ 23,150
At December 31, 2011
Cost 1,213 19,881 9,018 56 30,168
Accumulated depreciation – (2,599) (4,419) – (7,018)
Net book value $ 1,213 $ 17,282 $ 4,599 $ 56 $ 23,150

85
The carrying value of property, plant and equipment held under finance lease at December 31, 2011 is $117 million (2010 – $106 million; January 1, 2010 – $87 million). Ownership of leased assets remains with the lessor.
Borrowing costs are capitalized at a rate based on our cost of borrowing or at the rate on the project specified debt, where applicable. Our weighted average borrowing rate used for capitalization of borrowing costs in 2011 was 7.84% (2010 – 11.55%).
The January 1, 2010 balance in construction in progress primarily relates to the copper concentrator project at Andacollo. The project was commissioned and first began production in early 2010.
Significant exploration and evaluation projects include Relincho, Galore Creek and oil sands properties.
15. Goodwill
(Cdn$ in millions)
Teck Coal
Quebrada Blanca
Andacollo
Total
January 1, 2010 $ 1,203 $ 322 $ 137 $ 1,662
Foreign exchange translation – (17) (8) (25)
December 31, 2010 $ 1,203 $ 305 $ 129 $ 1,637
Foreign exchange translation – 7 3 10
December 31, 2011 $ 1,203 $ 312 $ 132 $ 1,647
The allocation of goodwill to cash generating units or groups of cash generating units reflects how goodwill is monitored for internal management purposes.
We have performed our annual goodwill impairment testing and did not identify any impairment losses. The recoverable amounts for our goodwill impairment testing were determined based on the fair value less cost to sell basis. The fair value less cost to sell was calculated using a discounted cash flow methodology taking account of assumptions that would be made by market participants.
Cash flow projections are based on life of mine plans covering the expected life of each operation. For Teck Coal the cash flows cover a period of 30 years, after which a terminal value is determined. For Quebrada Blanca and Andacollo cash flows include periods in excess of 27 years.
The key assumptions used to determine fair value less cost to sell are as follows:
Commodity Prices
Commodity price assumptions are based on management’s best estimates and are within the range of available analyst forecasts.
Reserves and Resources
Mineral reserves and mineral resources are included in projected cash flows based on mineral reserve and mineral resource estimates and exploration and evaluation work, undertaken by appropriately qualified persons. Mineral resources are included where management has a high degree of confidence in their economic extraction, even though additional evaluation is still required to meet the requirement of reserve classification.
Operating Costs and Capital Expenditures
Operating costs and capital expenditures are based on life of mine plans and internal management forecasts. Cost assumptions incorporate management experience and expertise, current operating costs, the nature and location of each operation and the risks associated with each operation. Future capital expenditure is based on management’s best estimate of required future capital requirements which generally is for the extraction and processing of existing reserve and resources. All committed and anticipated capital expenditures adjusted for future cost estimates have been included in the projected cash flows.

86 Teck 2011 Annual Report
Notes to Consolidated Financial Statements Years ended December 31, 2011 and 2010
15. Goodwill (continued)
Discount Rates
Cash flow projections are discounted using a real, post-tax discount rate of 7%. Adjustments to the rate are made for any risks that are not reflected in the underlying cash flows. These rates are based on the weighted average cost of capital for a mining industry group and were calculated with reference to market information from third-party advisors.
Foreign Exchange Rates
Foreign exchange rates are based on latest internal forecasts for foreign exchange, benchmarked with external sources of information.
Inflation Rates
Inflation rates are based on management’s best estimate, in conjunction with information provided by third-party advisors, and take into account the average historical inflation rates for the location of each operation and central banks’ inflation targets.
Given the nature of expected future cash flows, the expected future cash flows used to determine the recoverable amount could change materially over time as they are significantly affected by the key assumptions described above.
16. Trade Accounts Payable and Other Liabilities
(Cdn$ in millions)
December 31, 2011
December 31, 2010
January 1, 2010
Trade accounts payable $ 787 $ 758 $ 542
Payroll related liabilities 153 185 162
Accrued interest 132 75 89
Commercial and government royalties 113 173 156
Capital project accruals 104 40 10
Current portion of provisions (Note 20) 59 60 37
Current derivative liabilities (Note 20) 4 28 33
Other 83 28 67
$ 1,435 $ 1,347 $ 1,096

87
17. Debt
(Cdn$ in millions) December 31, 2011 December 31, 2010 January 1, 2010
CarryingValue
FairValue
CarryingValue
FairValue
CarryingValue
FairValue
7.0% notes due September 2012 (US$200 million) (c)
$ 203
$ 211
$ 198
$ 216
$ 209
$ 223
9.75% notes due May 2014 (US$530 million) (b)(h)
514
635
494
657
1,280
1,574
5.375% notes due October 2015 (US$300 million) (c)
304
336
297
329
313
308
10.25% notes due May 2016 (US$659 million) (b)
629
780
608
813
1,025
1,270
3.15% notes due January 2017 (US$300 million) (a) 303 316
–
–
–
–
3.85% notes due August 2017 (US$300 million) (c)(f)
300
326
293
304
–
–
10.75% notes due May 2019 (US$1,043 million) (b)(h)
991
1,304
962
1,350
1,799
2,276
4.5% notes due January 2021 (US$500 million) (b)(f)
504
539
492
509
–
–
4.75% notes due January 2022 (US$700 million) (a)
706
765
–
–
–
–
6.125% notes due October 2035 (US$700 million) (c)
696
797
681
737
719
635
6.0% notes due August 2040 (US$650 million) (b)(f)
658
742
643
681
–
–
6.25% notes due July 2041 (US$1,000 million) (a)
1,005
1,166
–
–
–
–
Revolving credit facility due July 2015 (d)
–
–
55
55
–
–
Antamina senior revolving credit facility due August 2012 and April 2015 (e)
117
117
114
114
97
97
Term loan (f) – – – – 2,443 2,486
Other 105 105 111 111 120 120
7,035 8,139 4,948 5,876 8,005 8,989
Less current portion of long-term debt (359) (367) (65) (65) (1,121) (1,132)
$ 6,676 $ 7,772 $ 4,883 $ 5,811 $ 6,884 $ 7,857

88 Teck 2011 Annual Report
Notes to Consolidated Financial Statements Years ended December 31, 2011 and 2010
17. Debt (continued)
The fair values of debt are determined using market values where available and cash flows based on our expected cost of borrowing for other items. The fair values of the 10.25% notes and the 10.75% notes are net of $99 million and $214 million, respectively, of fair value of prepayment rights (Note 12).
a) In July 2011, we issued US$300 million of senior unsecured notes due January 2017, US$700 million of senior unsecured notes due January 2022, and US$1.0 billion of senior unsecured notes due July 2041. The 2017 notes bear interest at 3.15% per annum and were issued at 99.964% of face value. The 2022 notes bear interest at 4.75% per annum, were issued at 99.843% of face value and are callable at 100% at any time on or after October 15, 2021. The 2041 notes bear interest at 6.25%, were issued at 99.715% of face value and are callable at 100% at any time on or after January 15, 2041. All of these notes can be called at any time by repaying the greater of the principal amount plus accrued interest and the present value of the principal and interest amounts discounted at a comparable treasury yield plus a stipulated spread. Net proceeds from these three issues were US$1.98 billion after underwriting discounts and issue costs. Our obligations under these notes are guaranteed by TML.
b) The 10.25% notes are callable on or after May 15, 2013 and the 10.75% notes are callable on or after May 15, 2014, both at pre-defined prices based on the date of redemption (Note 26(c)). The 4.50% notes are callable on or after October 15, 2020 and the 6.0% notes are callable on or after February 15, 2040, both at 100% of the face value. All of these notes can be called at any time by repaying the greater of the principal amount plus accrued interest and the present value of the principal and interest amounts discounted at a comparable treasury yield plus a stipulated spread. With our current investment grade ratings, certain restrictive covenants under the 9.75%, 10.25% and 10.75% notes were suspended in 2010 and the senior secured pledge bonds that secured our notes and the guarantees and liens supporting those pledge bonds were released. There is no default or event of default under the notes. Our obligations under these notes are guaranteed by TML.
c) The 3.85%, 5.375%, 6.125% and 7.0% notes are callable at any time by repaying the greater of the principal amount plus accrued interest and the present value of the principal and interest amounts discounted at a comparable treasury yield, plus a stipulated spread. These notes are supported by an arrangement pursuant to which the trustee under these notes will, in the event of a default under the governing indenture, have the right to make a demand against Teck Metals in an amount equal to the amount due under the notes.
d) Any funds drawn under the revolving credit facility are due in full at maturity and are guaranteed by TML. Any outstanding amounts under the facility bear interest at LIBOR plus an applicable margin based on our credit ratings. The facility requires a maximum total debt to total capitalization ratio of 0.5 to 1. As at December 31, 2011, we are in compliance with all debt covenants and default provisions.
At December 31, 2011, we had committed revolving credit facilities aggregating $1.19 billion, of which $1.00 billion is available until 2015. Net of $116 million of letters of credit, the unused portion of the credit facilities is $1.07 billion as at December 31, 2011. In addition, we have issued stand-alone letters of credit for $549 million in respect of environmental and other bonding requirements.
In 2011, we entered into a new $100 million uncommitted demand revolving credit facility, which is available only for the issuance of letters of credit.
Our obligations under these facilities are guaranteed by TML.
e) The Antamina revolving credit facilities are our proportionate share of Antamina’s five-year revolving term bank facilities with full repayments due at maturity dates in 2012 and 2015 and are the obligation of Antamina. The facilities, which are denominated in U.S. dollars, are non-recourse to us and the other Antamina project sponsors and may be renewed and extended annually with the concurrence of the participating banks. The outstanding amounts under the facilities bear interest at LIBOR plus a margin.

89
f) During 2010, we acquired and cancelled US$1.99 billion of the aggregate principal amount of the notes we issued in May 2009. We funded these acquisitions with US$1.06 billion of cash and the issuance of US$1.45 billion of notes maturing in 2017, 2021 and 2040. Net proceeds from the notes issued, after discounts and underwriting expenses, were US$1.44 billion. Our obligations under these notes are guaranteed by TML.
During 2010, we repaid the US$2.37 billion outstanding balance on our term loan. As a result of the early payment of the term loan and the acquisitions of the notes described above, we incurred a $782 million pre-tax charge to profit related to the write-off of unamortized discounts and issuance costs, capitalized prepayment options and the premium paid to acquire the notes (Note 9).
g) At December 31, 2011 the scheduled principal payments during the next five years and thereafter are as follows:
($ in millions) US$ Cdn$
2012 $ 353 $ 359
2013 14 14
2014 535 544
2015 325 331
2016 661 673
Thereafter 5,212 5,300
Total $ 7,100 $ 7,221
h) On February 28, 2012, we issued US$500 million of senior unsecured notes due March 1, 2019 and US$500 million of senior unsecured notes due March 1, 2042. The 2019 notes bear interest at 3.0% per annum and the 2042 notes bear interest at 5.2% per annum. We received aggregate net proceeds of approximately US$987 million from the offering after deducting underwriting fees and estimated offering expenses. Our obligations under these notes are guaranteed by TML. We also issued a notice of redemption to redeem, on March 19, 2012, all of the approximately US$530 million principal amount of our outstanding 9.75% senior notes due 2014 and approximately US$521 million principal amount, or half, of our outstanding 10.75% senior notes due 2019. We intend to use the net proceeds from our offering of the US$1.0 billion principal amount of notes noted above, plus cash on hand, to fund the redemptions. We expect to record an after-tax accounting charge of approximately US$340 million in the first quarter of 2012 in connection with the redemption.
18. Income and Resource Taxes
a) Provision for Income and Resource Taxes:
(Cdn$ in millions) 2011 2010
Current
Current taxes on profits for the year $ 702 $ 714
Adjustments for current tax of prior periods (5) (2)
Total current tax $ 697 $ 712
Deferred
Origination and reversal of temporary differences $ 706 $ 262
Adjustments to deferred tax of prior periods 8 (1)
Tax losses not recognized (recognition of previously unrecognized losses) (13) 10
Impact of newly enacted change in tax rates – 11
Total deferred tax 701 282
$ 1,398 $ 994

90 Teck 2011 Annual Report
Notes to Consolidated Financial Statements Years ended December 31, 2011 and 2010
18. Income and Resource Taxes (continued)
b) Reconciliation of income and resource taxes calculated at the statutory rates to the actual tax provision:
(Cdn$ in millions) 2011 2010
Tax expense at the Canadian statutory income tax rate of 26.68% (2010 – 28.56%) $ 1,111 $ 837
Tax effect of:
Resource taxes, net of resource and depletion allowances 253 163
Non-temporary differences including one-half of capital gains and losses 13 (74)
Tax losses not recognized (recognition of previously unrecognized losses) (13) 10
Impact of newly enacted change in tax rates – 11
Benefit of change in expected timing of temporary difference reversals (42) (33)
Difference in tax rates in foreign jurisdictions 94 101
Other (18) (21)
$ 1,398 $ 994
The Canadian statutory tax rate decreased to 26.68% due to legislated changes.
c) The analysis of deferred tax assets and deferred tax liabilities is as follows:
(Cdn$ in millions) 2011 2010
Deferred tax assets
Expected to be reversed after more than a year $ 316 $ 471
Expected to be reversed within a year (136) (126)
$ 180 $ 345
Deferred tax liabilities
Expected to be reversed after more than a year 5,114 4,749
Expected to be reversed within a year 228 150
5,342 4,899
Net deferred tax liabilities $ 5,162 $ 4,554
d) The amount of deferred tax expense charged (credited) to the income statement is as follows:
(Cdn$ in millions) 2011 2010
Net operating loss carry forwards $ 24 $ (333)
Capital allowances in excess of depreciation 473 403
Decommissioning and restoration provisions 18 8
Amounts relating to non-coterminous partnership year ends 80 135
Unrealized foreign exchange losses (25) (55)
Other temporary differences 131 124
$ 701 $ 282
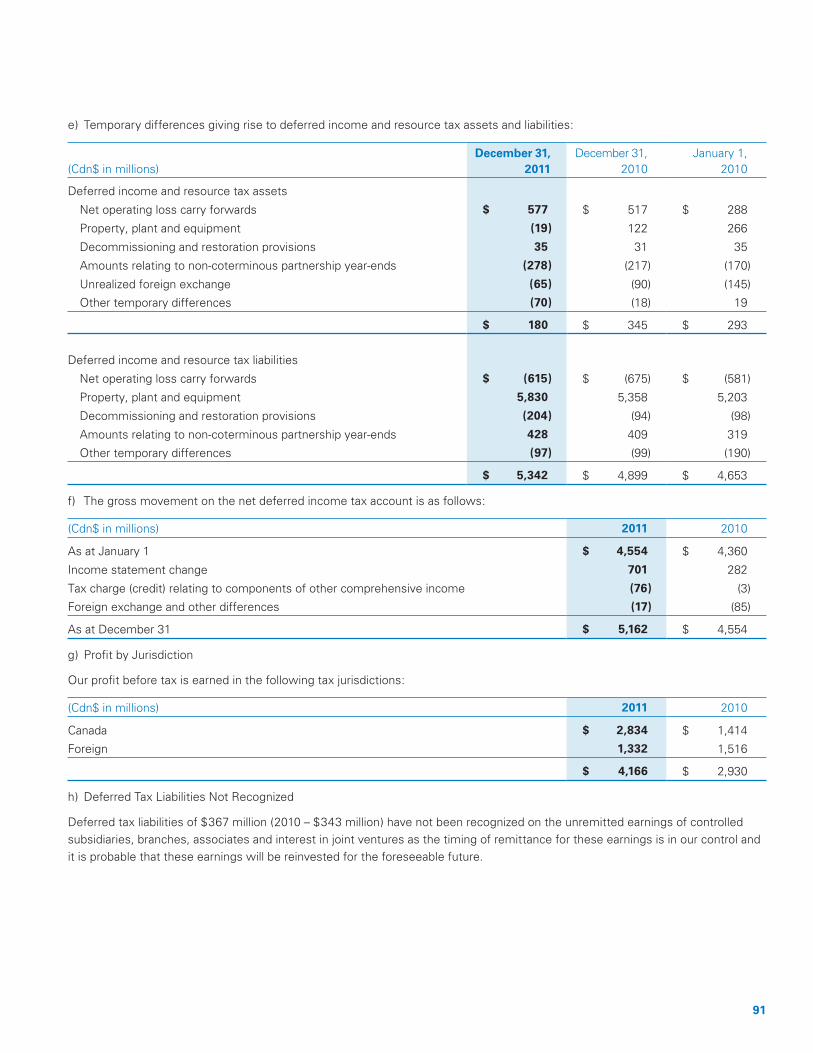
91
e) Temporary differences giving rise to deferred income and resource tax assets and liabilities:
(Cdn$ in millions)
December 31, 2011
December 31, 2010
January 1, 2010
Deferred income and resource tax assets
Net operating loss carry forwards $ 577 $ 517 $ 288
Property, plant and equipment (19) 122 266
Decommissioning and restoration provisions 35 31 35
Amounts relating to non-coterminous partnership year-ends (278) (217) (170)
Unrealized foreign exchange (65) (90) (145)
Other temporary differences (70) (18) 19
$ 180 $ 345 $ 293
Deferred income and resource tax liabilities
Net operating loss carry forwards $ (615) $ (675) $ (581)
Property, plant and equipment 5,830 5,358 5,203
Decommissioning and restoration provisions (204) (94) (98)
Amounts relating to non-coterminous partnership year-ends 428 409 319
Other temporary differences (97) (99) (190)
$ 5,342 $ 4,899 $ 4,653
f) The gross movement on the net deferred income tax account is as follows:
(Cdn$ in millions) 2011 2010
As at January 1 $ 4,554 $ 4,360
Income statement change 701 282
Tax charge (credit) relating to components of other comprehensive income (76) (3)
Foreign exchange and other differences (17) (85)
As at December 31 $ 5,162 $ 4,554
g) Profit by Jurisdiction
Our profit before tax is earned in the following tax jurisdictions:
(Cdn$ in millions) 2011 2010
Canada $ 2,834 $ 1,414
Foreign 1,332 1,516
$ 4,166 $ 2,930
h) Deferred Tax Liabilities Not Recognized
Deferred tax liabilities of $367 million (2010 – $343 million) have not been recognized on the unremitted earnings of controlled subsidiaries, branches, associates and interest in joint ventures as the timing of remittance for these earnings is in our control and it is probable that these earnings will be reinvested for the foreseeable future.

92 Teck 2011 Annual Report
Notes to Consolidated Financial Statements Years ended December 31, 2011 and 2010
18. Income and Resource Taxes (continued)
i) Loss Carry Forwards and Canadian Development Expenses
At December 31, 2011, we had $4,736 million of Canadian federal net operating loss carry forwards (2010 – $4,744 million). These loss carry forwards expire at various dates between 2013 and 2031. Incorporated in our deferred income tax assets and liabilities we also had $3,618 million of cumulative Canadian development expenses at December 31, 2011 (2010 – $5,162 million), which are deductible for income tax purposes on a declining balance basis at a maximum rate of 30% per year.
j) Deferred Tax Assets Not Recognized
We have not recognized $237 million (2010 – $325 million) of deferred tax assets in jurisdictions and entities that do not have established sources of taxable income.
k) Taxation Assessments
In the normal course of business we are subject to audit by taxation authorities. These audits may alter the timing or amount of taxable income or deductions. The amount ultimately reassessed upon resolution of issues raised may differ from the amounts accrued.
For our significant operating subsidiaries, audits by various taxation authorities have not been completed as follows:
Canada 2006 – present
United States 2006 – present
Peru 2007 – present
Chile 2008 – present
19. Retirement Benefit Plans
We have defined contribution pension plans for certain groups of employees. Our share of contributions to these plans is expensed in the year it is earned by the employee.
We have various defined benefit pension plans that provide benefits based principally on employees’ years of service. These plans are only available to certain qualifying employees. The plans are “flat-benefit” or “final-pay” plans. Annual contributions to these plans are actuarially determined and made at or in excess of minimum requirements prescribed by legislation. All of our defined benefit pension plans are actuarially evaluated for funding purposes on a three-year cycle. The most significant plan, which accounts for 34% of our accrued benefit obligation at December 31, 2011, was last actuarially evaluated on December 31, 2010. The measurement date used to determine all of the accrued benefit obligation and plan assets for accounting information was December 31, 2011. We also have several post-retirement plans, which provide post-retirement medical and life insurance benefits to certain qualifying employees.

93
a) Actuarial Valuation of Plans:
(Cdn$ in millions) 2011 2010
DefinedBenefit
PensionPlans
Non-pensionPost-
RetirementBenefit Plans
DefinedBenefit
PensionPlans
Non-pensionPost-
RetirementBenefit Plans
Accrued benefit obligation
Balance at beginning of year $ 1,588 $ 377 $ 1,428 $ 312
Current service cost 33 9 29 7
Benefits paid (94) (11) (93) (9)
Interest cost 81 20 83 19
Obligation experience adjustments 15 (38) (2) 8
Past service costs arising from plan improvements 56 14 – –
Foreign currency exchange rate changes 2 2 (5) (2)
Effect of change in actuarial assumptions 140 39 148 42
Balance at end of year 1,821 412 1,588 377
Plan assets
Fair value at beginning of year 1,452 – 1,304 –
Expected return on plan assets 100 – 89 –
Asset experience adjustments (27) – 70 –
Benefits paid (94) (11) (93) (9)
Contributions by the employer 111 11 82 9
Foreign currency exchange rate changes 1 – – –
Fair value at end of year 1,543 – 1,452 –
Funding surplus (deficit) (278) (412) (136) (377)
Unvested past service costs – 5 – –
Net accrued retirement benefit liability $ (278) $ (407) $ (136) $ (377)
Represented by:
Pension assets (Note 12) $ 6 $ – $ 29 $ –
Accrued retirement benefit liability (284) (407) (165) (377)
Net accrued retirement benefit liability $ (278) $ (407) $ (136) $ (377)

94 Teck 2011 Annual Report
Notes to Consolidated Financial Statements Years ended December 31, 2011 and 2010
19. Retirement Benefit Plans (continued)
Additional information about our plans:
(Cdn$ in millions) 2009 2008 2007
DefinedBenefit
PensionPlans
Non-pensionPost-
RetirementBenefit Plans
DefinedBenefit
PensionPlans
Non-pensionPost-
RetirementBenefit Plans
DefinedBenefit
PensionPlans
Non-pensionPost-
RetirementBenefit Plans
Accrued benefit obligationObligation experience
adjustments $ (3)
$ 13
$ 20
$ 3
$ 2
$ (43)
Effect of change in actuarial assumptions
205
44
(257)
(65)
(36)
(9)
Accrued benefit obligation at year end
1,428
312
1,224
248
1,260
272
Plan assetsAsset experience
adjustments 54
–
(240)
–
(66)
–
Fair value of plan assets at year end
1,304
–
1,213
–
1,257
–
Funding surplus (deficit) (124) (312) (11) (248) (3) (272)
b) Funded Status
The funded status of our defined benefit pension plans is as follows:
(Cdn$ in millions) 2011 2010
Plans WhereAssets Exceed
Retirement Benefit
Obligations
Plans whereRetirement
Benefit Obligations
Exceed Assets
Total
Plans WhereAssets Exceed
Retirement Benefit
Obligations
Plans WhereRetirement
Benefit Obligations
Exceed Assets
Total
Plan assets $ 39 $ 1,504 $ 1,543 $ 833 $ 619 $ 1,452
Retirement benefit obligations
(33)
(1,788)
(1,821)
(804)
(784)
(1,588)
Excess (deficit) of plan assets over retirement benefit obligations
$ 6
$ (284)
$ (278)
$ 29
$ (165)
$ (136)
The $284 million (2010 – $165 million) pension liability and $407 million (2010 – $377 million) post-retirement benefit liability include a current portion of $4 million (2010 – $1 million) and $11 million (2010 – $9 million), respectively, representing the expected benefits payable in the next 12 months under plans that are not pre-funded.
Our total cash payments for pension and other employee future benefits for 2011, including cash contributed to defined benefit and defined contribution pension plans and cash payments made directly to beneficiaries, were $149 million (2010 – $107 million). We expect to contribute $117 million to our defined contribution and defined benefit pension plans in 2012 based on minimum funding requirements.

95
c) Significant Assumptions
The assumptions used to calculate annual expenses are those used to calculate the accrued retirement benefit obligation at the end of the previous year. The expected long-term rate of return on plan assets is developed based on the historical and projected returns for each asset class, as well as the target asset allocation for the pension portfolio. Projected rates of return for fixed income securities and equities are developed using a model that factors in long-term government debt rates, real bond yield trend, inflation and equity premiums, based on a combination of historical experience and future long-term expectations. The discount rate used to determine the accrued retirement benefit obligation is determined by reference to the market interest rates of high-quality debt instruments at the measurement date.
Weighted average assumptions used to calculate the accrued retirement benefit obligation at the end of each year are as follows:
2011 2010
DefinedBenefit
PensionPlans
Non-PensionPost-
RetirementBenefit Plans
DefinedBenefit
PensionPlans
Non-PensionPost-
RetirementBenefit Plans
Discount rate 4.41% 4.43% 5.10% 5.12%
Inflation rate 2.25% 2.25% 2.50% 2.50%
Assumed long-term rate of return on assets 7% –% 7% –
Rate of increase in future compensation 4% 4% 4% 4%
Initial medical trend rate – 8% – 8%
Ultimate medical trend rate – 5% – 5%
Years to reach ultimate medical trend rate – 6% – 7
Dental trend rates – 4% – 5%
d) Employee Future Benefits Expense
The amount of employee future benefits expense recognized in profit is as follows:
(Cdn$ in millions) 2011 2010
DefinedBenefit
PensionPlans
Non-PensionPost-
RetirementBenefit Plans
DefinedBenefit
PensionPlans
Non-PensionPost-
RetirementBenefit Plans
Current service cost $ 33 $ 9 $ 29 $ 7
Interest cost 81 20 83 19
Expected return on plan assets (100) – (89) –
Past service cost 56 9 – –
$ 70 $ 38 $ 23 $ 26
Of the total expense, $103 million (2010 – $33 million), $4 million (2010 – $3 million), and $1 million (2010 – $13 million) was included in operating expenses, general and administration expenses and finance expenses, respectively.
The defined contribution expense for 2011 was $27 million (2010 – $18 million), which is included in operating expenses ($20 million (2010 – $14 million)) and general and administration expenses ($7 million (2010 – $4 million)).

96 Teck 2011 Annual Report
Notes to Consolidated Financial Statements Years ended December 31, 2011 and 2010
19. Retirement Benefit Plans (continued)
The amounts recognized in other comprehensive income during the year are as follows:
(Cdn$ in millions) 2011 2010
DefinedBenefit
PensionPlans
Non-PensionPost-
RetirementBenefit Plans
DefinedBenefit
PensionPlans
Non-PensionPost-
RetirementBenefit Plans
Actuarial losses $ 182 $ 1 $ 71 $ 48
Total amount recognized in other comprehensive income 182 1 71 48
Total cumulative amount recognized in retained earnings $ 253 $ 49 $ 71 $ 48
e) Health Care Sensitivity
A 1% change in the initial and ultimate medical trend rate assumptions would have the following effect on our post-retirement obligations and expense:
(Cdn$ in millions)
Increase (Decrease) in Service and
Interest Cost
Increase (Decrease)
in Obligation
Effect of 1% increase in medical trend rate 5 67
Effect of 1% decrease in medical trend rate (4) (52)
f) Investment of Plan Assets
The assets of our defined benefit pension plans are managed by pension asset fund managers under the oversight of the Teck Resources Limited Executive Pension Committee.
Our pension plan investment strategies support the objectives of each defined benefit plan and are related to the plan demographics and timing of expected benefit payments to plan members. The objective for the plan asset portfolios is to achieve annual portfolio returns over a four-year period in excess of the annual percentage change in the Consumer Price Index plus a certain premium.
To achieve this objective, a strategic asset allocation policy has been developed for each defined benefit plan. The asset allocation is monitored quarterly and rebalanced if the funds in an asset class exceed their allowable allocation ranges. We review the investment guidelines for each plan at least annually, and the portfolio and investment managers’ performance is monitored quarterly.
The composition of the defined benefit pension plan assets at December 31, 2011 and 2010, and the weighted average target composition for 2012 are as follows:
2012 Target 2011 Actual 2010 Actual
Equity securities 53% 48% 54%
Debt securities 35% 39% 35%
Real estate and other 12% 13% 11%
100% 100% 100%
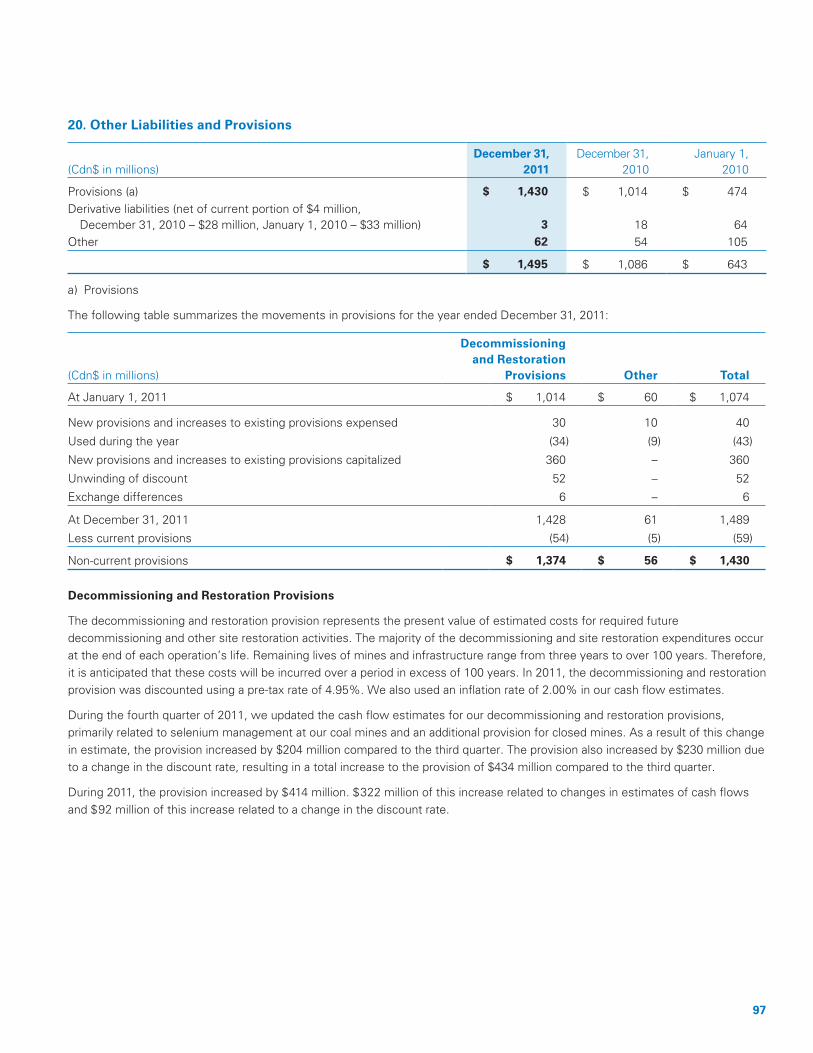
97
20. Other Liabilities and Provisions
(Cdn$ in millions)
December 31, 2011
December 31, 2010
January 1, 2010
Provisions (a) $ 1,430 $ 1,014 $ 474Derivative liabilities (net of current portion of $4 million, December 31, 2010 – $28 million, January 1, 2010 – $33 million)
3
18
64
Other 62 54 105
$ 1,495 $ 1,086 $ 643
a) Provisions
The following table summarizes the movements in provisions for the year ended December 31, 2011:
(Cdn$ in millions)
Decommissioning and Restoration
Provisions
Other
Total
At January 1, 2011 $ 1,014 $ 60 $ 1,074
New provisions and increases to existing provisions expensed 30 10 40
Used during the year (34) (9) (43)
New provisions and increases to existing provisions capitalized 360 – 360
Unwinding of discount 52 – 52
Exchange differences 6 – 6
At December 31, 2011 1,428 61 1,489
Less current provisions (54) (5) (59)
Non-current provisions $ 1,374 $ 56 $ 1,430
Decommissioning and Restoration Provisions
The decommissioning and restoration provision represents the present value of estimated costs for required future decommissioning and other site restoration activities. The majority of the decommissioning and site restoration expenditures occur at the end of each operation’s life. Remaining lives of mines and infrastructure range from three years to over 100 years. Therefore, it is anticipated that these costs will be incurred over a period in excess of 100 years. In 2011, the decommissioning and restoration provision was discounted using a pre-tax rate of 4.95%. We also used an inflation rate of 2.00% in our cash flow estimates.
During the fourth quarter of 2011, we updated the cash flow estimates for our decommissioning and restoration provisions, primarily related to selenium management at our coal mines and an additional provision for closed mines. As a result of this change in estimate, the provision increased by $204 million compared to the third quarter. The provision also increased by $230 million due to a change in the discount rate, resulting in a total increase to the provision of $434 million compared to the third quarter.
During 2011, the provision increased by $414 million. $322 million of this increase related to changes in estimates of cash flows and $92 million of this increase related to a change in the discount rate.

98 Teck 2011 Annual Report
Notes to Consolidated Financial Statements Years ended December 31, 2011 and 2010
21. Equity
a) Authorized Share Capital
Our authorized share capital consists of an unlimited number of Class A common shares without par value, an unlimited number of Class B subordinate voting shares (“Class B shares”) without par value and an unlimited number of preferred shares without par value issuable in series.
Class A common shares carry the right to 100 votes per share. Class B shares carry the right to one vote per share. Each Class A common share is convertible, at the option of the holder, into one Class B share. In all other respects, the Class A common shares and Class B shares rank equally.
The attributes of the Class B shares contain so called “coattail provisions,” which provide that, in the event that an offer (an “Exclusionary Offer”) to purchase Class A common shares, which is required to be made to all or substantially all holders thereof, is not made concurrently with an offer to purchase Class B shares on identical terms, then each Class B share will be convertible into one Class A common share.
The Class B shares will not be convertible in the event that an Exclusionary Offer is not accepted by holders of a majority of the Class A common shares (excluding those shares held by the person making the Exclusionary Offer). If an offer to purchase Class A common shares does not, under applicable securities legislation or the requirements of any stock exchange having jurisdiction, constitute a “takeover bid,” or is otherwise exempt from any requirement that such offer be made to all or substantively all holders of Class A common shares, the coattail provisions do not apply.
b) Class A Common Shares and Class B Subordinate Voting Shares Issued and Outstanding:
Shares (in 000’s)
Class A Common
Shares
Class B Subordinate
Voting Shares
At December 31, 2009 9,353 579,779
Options exercised (c) – 1,468
At December 31, 2010 9,353 581,247
Options exercised (c) – 245
Normal course issuer bid (e) – (4,288)
At December 31, 2011 9,353 577,204
c) Share Options
Under our share option plan, 10 million Class B shares have been set aside for the grant of share options to full-time employees, of which 4.2 million remain available for granting. The exercise price for each option is the closing price for our Class B shares on the last trading day before the date of grant. Our share options are settled through the issuance of Class B shares.
During the year ended December 31, 2011, we granted 910,275 Class B share options at market prices to employees. These share options have a weighted average exercise price of $58.71, vest in equal amounts over three years and have a term of 10 years.
The weighted average fair value of Class B share options granted in the year was estimated at $19.44 per option (2010 – $11.81) at the grant date based on the Black-Scholes option-pricing model using the following assumptions:
2011 2010
Weighted average exercise price $ 58.71 $ 35.54
Dividend yield 1.02% 2.10%
Risk free interest rate 2.63% 2.54%
Expected option life 4.2 years 6.0 years
Expected volatility 41% 37%
Forfeiture rate 2.13% 2.10%

99
The volatility measured at the standard deviation of continuously compounded share returns is based on statistical analysis of daily share prices over a period equal to the expected life of the options.
Outstanding share options:
2011 2010
Shares
(in 000’s)
WeightedAverageExercise
Price
Shares
(in 000’s)
WeightedAverageExercise
Price
Outstanding at beginning of year 5,228 $ 24.79 5,534 $ 21.58
Granted 910 58.71 1,290 35.54
Exercised (245) 15.75 (1,468) 22.31
Forfeited (122) 24.75 (110) 20.37
Expired (3) 43.74 (18) 37.84
Outstanding at end of year 5,768 $ 30.51 5,228 $ 24.79
Vested and exercisable at end of year 3,334 $ 27.56 1,984 $ 31.36
Class B share options were exercised on a regular basis throughout the year. The weighted average share price during the year was $45.69 (2010 – $39.76).
Information relating to share options outstanding at December 31, 2011:
Outstanding Share Options (in 000’s)
Exercise Price Range
Weighted Average Remaining Life of Outstanding Options (months)
1,658 $ 4.15 – $ 12.35 9 86
1,757 $ 12.36 – $ 33.19 9 89
1,453 $ 33.20 – $ 35.54 9 44
1,755 $ 35.55 – $ 49.17 9 78
1, 895 $ 49.18 – $ 58.80 110
5,768 $ 4.15 – $ 58.80 9 77
Total share option compensation expense recognized for the year was $14 million (2010 – $11 million).
d) Deferred Share Units and Restricted Share Units
Under our Deferred Share Unit (“DSU”) or Restricted Share Unit (“RSU”) plan, directors and employees may receive either DSUs or RSUs, each of which entitle the holder to a cash payment equal to the market value of one Class B share at the time they are redeemed. DSUs vest immediately for directors and after three years for employees. RSUs vest after three years for employees and directors. On retirement units vest on a pro-rata basis. Units vest on a pro-rata basis should employees be terminated without cause and are forfeited if employees resign or are terminated with cause.
DSUs may only be redeemed within 12 months from the date a holder ceases to be an employee or director while RSUs must be redeemed at the end of a 3-year period measured from the end of the year immediately preceding the grant.
Additional units are issued to holders of DSUs and RSUs to reflect dividends paid on Class B subordinate voting shares and other adjustments to Class B shares.

100 Teck 2011 Annual Report
Notes to Consolidated Financial Statements Years ended December 31, 2011 and 2010
21. Equity (continued)
Total DSU and RSU activity:
2011 2010
DSUs
and RSUs (in 000’s)
Weighted Average
Grant Date Fair Value
DSUs
and RSUs (in 000’s)
Weighted Average
Grant DateFair Value
Total units at beginning of year 3,683 $ 12.62 3,625 $ 11.10
Granted 415 58.30 531 36.68
Forfeited (91) 16.13 (63) 11.28
Redeemed (2,101) 4.81 (441) 29.09
Dividends and other adjustments 51 21.50 31 19.46
Total units at end of year 1,957 $ 30.72 3,683 $ 12.62
In 2011, we recognized a net recovery of compensation costs of $36 million for our DSUs and RSUs (2010 – $113 million compensation costs recognized). The total liability for vested DSUs and RSUs as at December 31, 2011 was $56 million (2010 – $164 million). The fair value of the DSUs and RSUs is based on the closing price of our Class B shares.
At December 31, 2011, we had 1,241,662 DSUs (2010 – 2,441,816) and 714,862 RSUs outstanding (2010 – 1,240,813).
e) Normal Course Issuer Bid
During 2011, we purchased 4.8 million Class B shares at a cost of $171 million pursuant to a normal course issuer bid. Of the shares purchased, 4.3 million were cancelled prior to December 31, 2011 and the remaining 0.5 million were cancelled in early 2012. The normal course issuer bid, which commenced on June 27, 2011, allows for a purchase of up to 40 million Class B shares and will continue until June 26, 2012 or an earlier date if we complete such purchases.
f) Accumulated Comprehensive Income:
(Cdn$ in millions) 2011 2010
Accumulated other comprehensive income – beginning of year $ 45 $ 117
Currency translation differences:
Unrealized gains (losses) on translation of foreign subsidiaries 103 (324) Foreign exchange differences on debt designated as a hedge of our investment
in foreign subsidiaries (net of tax of $3 for 2011 and $(36) for 2010) (26)
256
77 (68)
Available-for-sale financial assets:
Unrealized gains (losses) (net of tax of $13 for 2011 and $(18) for 2010) (57) 128
Gains reclassified to profit (net of tax of $(1) for 2011 and $17 for 2010) (49) (120)
(106) 8
Derivatives designated as cash flow hedges:
Unrealized gains (net of taxes of $nil for 2011 and $(3) for 2010) 7 8
Gains reclassified to profit on realization (net of tax of $2 for 2011 and $7 for 2010) (9) (20)
(2) (12)
Total other comprehensive loss before actuarial gain (loss) on retirement benefit plans (31) (72)
Accumulated other comprehensive income – end of year 14 45
Retained earnings – end of year 10,858 8,840
Accumulated comprehensive income $ 10,872 $ 8,885
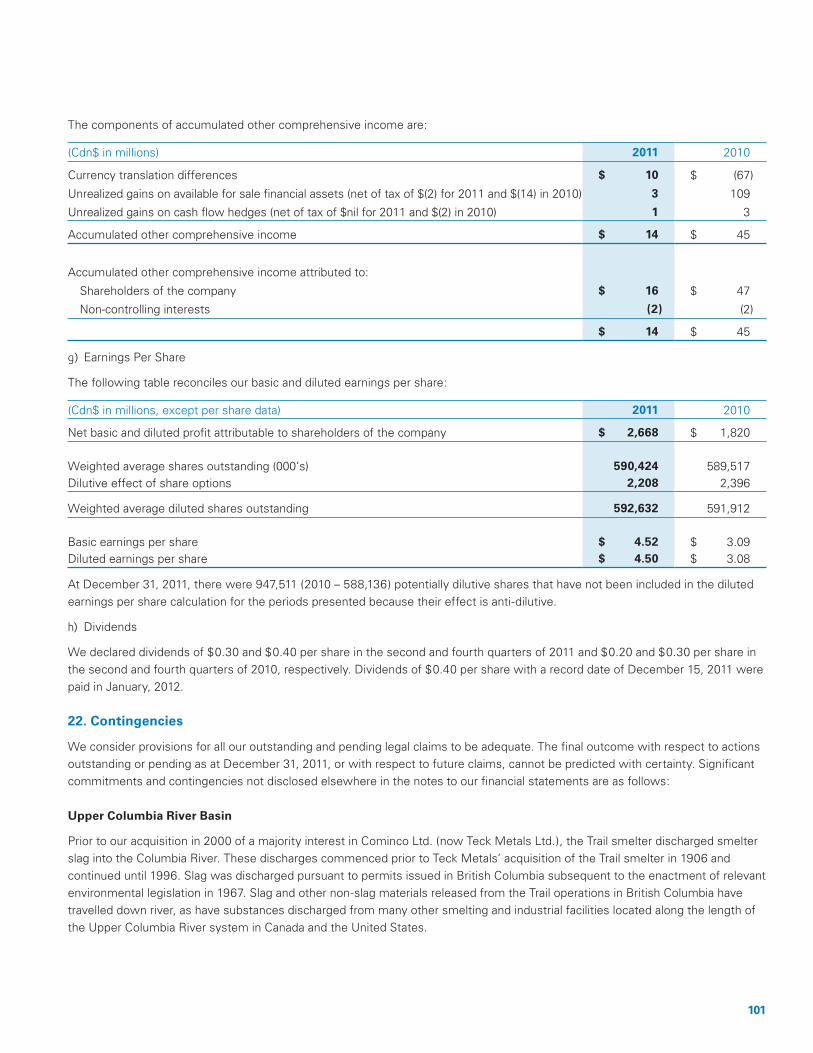
101
The components of accumulated other comprehensive income are:
(Cdn$ in millions) 2011 2010
Currency translation differences $ 10 $ (67)
Unrealized gains on available for sale financial assets (net of tax of $(2) for 2011 and $(14) in 2010) 3 109
Unrealized gains on cash flow hedges (net of tax of $nil for 2011 and $(2) in 2010) 1 3
Accumulated other comprehensive income $ 14 $ 45
Accumulated other comprehensive income attributed to:
Shareholders of the company $ 16 $ 47
Non-controlling interests (2) (2)
$ 14 $ 45
g) Earnings Per Share
The following table reconciles our basic and diluted earnings per share:
(Cdn$ in millions, except per share data) 2011 2010
Net basic and diluted profit attributable to shareholders of the company $ 2,668 $ 1,820 Weighted average shares outstanding (000’s)
590,424
589,517
Dilutive effect of share options 2,208 2,396
Weighted average diluted shares outstanding 592,632 591,912 Basic earnings per share
$ 4.52
$ 3.09
Diluted earnings per share $ 4.50 $ 3.08
At December 31, 2011, there were 947,511 (2010 – 588,136) potentially dilutive shares that have not been included in the diluted earnings per share calculation for the periods presented because their effect is anti-dilutive.
h) Dividends
We declared dividends of $0.30 and $0.40 per share in the second and fourth quarters of 2011 and $0.20 and $0.30 per share in the second and fourth quarters of 2010, respectively. Dividends of $0.40 per share with a record date of December 15, 2011 were paid in January, 2012.
22. Contingencies
We consider provisions for all our outstanding and pending legal claims to be adequate. The final outcome with respect to actions outstanding or pending as at December 31, 2011, or with respect to future claims, cannot be predicted with certainty. Significant commitments and contingencies not disclosed elsewhere in the notes to our financial statements are as follows:
Upper Columbia River Basin
Prior to our acquisition in 2000 of a majority interest in Cominco Ltd. (now Teck Metals Ltd.), the Trail smelter discharged smelter slag into the Columbia River. These discharges commenced prior to Teck Metals’ acquisition of the Trail smelter in 1906 and continued until 1996. Slag was discharged pursuant to permits issued in British Columbia subsequent to the enactment of relevant environmental legislation in 1967. Slag and other non-slag materials released from the Trail operations in British Columbia have travelled down river, as have substances discharged from many other smelting and industrial facilities located along the length of the Upper Columbia River system in Canada and the United States.

102 Teck 2011 Annual Report
Notes to Consolidated Financial Statements Years ended December 31, 2011 and 2010
22. Contingencies (continued)
Slag is a glass-like compound consisting primarily of silica, calcium and iron, and also contains small amounts of base metals including zinc, lead, copper and cadmium. It is sufficiently inert that it is not characterized as a hazardous waste under applicable Canadian or U.S. regulations and is sold to the cement industry.
While slag has been deposited into the river, further study is required to assess what effect the presence of metals in the river has had and whether they pose an unacceptable risk to human health or the environment.
A large number of studies regarding slag deposition and its effects have been conducted by various governmental agencies on both sides of the border. The historical studies of which we are aware have not identified unacceptable risks resulting from the presence of slag in the river. In June 2006, Teck Metals and its affiliate, TAI, entered into a Settlement Agreement (the “EPA Agreement”) with the U.S. Environmental Protection Agency (“EPA”) and the United States under which TAI is paying for and conducting a remedial investigation and feasibility study (“RI/FS”) of contamination in the Upper Columbia River under the oversight of the EPA.
The RI/FS is being prepared by independent consultants approved by the EPA and retained by TAI. TAI is paying the EPA’s oversight costs and providing funding for the participation of other governmental parties: the Department of Interior, the State of Washington and two native tribes, the Confederated Tribes of the Colville Nation (the “Colville Tribe”) and the Spokane Tribe. Teck Metals has guaranteed TAI’s performance of the EPA Agreement. TAI has also placed US$20 million in escrow as financial assurance of its intention to discharge its obligations under the EPA Agreement. We have accrued our estimate of the costs of the RI/FS.
Two citizens of Washington State and members of the Colville Tribe have commenced an enforcement proceeding under the Comprehensive Environmental Response, Compensation and Liability Act (“CERCLA”) to enforce an EPA administrative order against Teck and to seek fines and penalties against Teck Metals for non-compliance. In 2006, an amended complaint was filed in District Court adding the Colville Tribe as a plaintiff and seeking natural resource damages and costs. Teck Metals sought to have the claims dismissed on the basis that the court lacked jurisdiction because the CERCLA statute, in Teck Metals’ view, was not intended to govern the discharges of a facility in another country. That case proceeded through U.S. Federal District Court and the Federal Court of Appeals for the 9th Circuit. The 9th Circuit found that CERCLA could be applied to Teck Metals’ disposal practices in British Columbia because they may have resulted in a release of toxic materials to a facility in Washington State.
The litigation continues. The hearing of the plaintiffs’ claims for natural resource damages and costs has been deferred until the RI/FS has been substantially advanced or completed and a decision on liability is rendered. The first phase of the case, dealing with liability under CERCLA for cost recovery and natural resource damages, is now scheduled to be tried in September 2012. If no liability is found, the damages hearing will not proceed. Natural resource damages are assessed for injury to, destruction of, or loss of natural resources including the reasonable cost of a damage assessment. TAI commissioned a study by recognized experts in damage assessment in 2008. Based on the assessment performed, Teck Metals estimates that the compensable value of such damage will not be material.
TAI intends to fulfill its obligations under the EPA Agreement reached with the United States and the EPA in June 2006 and to complete the RI/FS mentioned above. The EPA Agreement is not affected by the litigation.
There can be no assurance that Teck Metals will ultimately be successful in its defense of the litigation or that Teck Metals or its affiliates will not be faced with further liability in relation to this matter. Until the studies contemplated by the EPA Agreement and additional damage assessments are completed, it is not possible to estimate the extent and cost, if any, of remediation or restoration that may be required or to assess our potential liability for damages. The studies may conclude, on the basis of risk, cost, technical feasibility or other grounds, that no remediation should be undertaken. If remediation is required and damage to resources found, the cost of remediation may be material.

103
23. Commitments
a) Capital Commitments
As at December 31, 2011, we had contracted for $115 million (2010 – $70 million) of capital expenditures that have not yet been incurred for property, plant and equipment.
b) Operating Lease Commitments
We lease office premises, mobile equipment and rail cars under operating leases. The lease terms are between one year and 20 years. The future aggregate minimum lease payments under non-cancellable operating leases are as follows:
(Cdn$ in millions) 2011 2010
Less than one year $ 43 $ 42
1 to 5 years 91 49
Thereafter 26 21
$ 160 $ 112
Lease rentals amounting to $9 million (2010 – $8 million) for office premises, $29 million (2010 – $35 million) for mobile equipment and $5 million (2010 – $5 million) for rail cars are included in the income statement.
c) Red Dog Commitments
In accordance with the operating agreement governing the Red Dog mine, TAK pays a royalty to NANA Regional Corporation Inc. (“NANA”) of 25% of net proceeds of production. The 25% royalty became payable in the third quarter of 2007 after we had recovered cumulative advance royalties previously paid to NANA. The net proceeds of production royalty rate will increase by 5% every fifth year to a maximum of 50%. The increase to 30% of net proceeds of production will occur in the fourth quarter of 2012. An expense of US$129 million was recorded in 2011 (2010 – US$173 million) in respect of this royalty.
TAK leases road and port facilities from the Alaska Industrial Development and Export Authority through which it ships all concentrates produced at the Red Dog operation. The lease requires TAK to pay a minimum annual user fee of US$18 million, but has no minimum tonnage requirements.
TAK has also entered into agreements for the transportation and handling of concentrates from the mill site. These agreements have varying terms expiring at various dates through 2015 and include provisions for extensions. There are minimum tonnage requirements and the minimum annual fees amount to approximately US$4 million from 2011 through 2014 and US$2 million thereafter with adjustment provisions based on variable cost factors.
d) Antamina Royalty
Our interest in the Antamina mine is subject to a net profits royalty equivalent to 7.4% of our share of the project’s free cash flow. An expense of $19 million was recorded in 2011 (2010 – $24 million) in respect of this royalty.
e) Forward Purchase Commitments
We have a number of forward purchase commitments for the purchase of concentrates and for shipping and distribution of products, which are incurred in the normal course of business. The majority of these contracts are subject to force majeure provisions.
f) Sale of Interest in Gold Reserves and Resources
In 2010, Andacollo sold an interest in the gold reserves and resources of the Andacollo operation to Royal Gold. Under the agreement, Royal Gold is entitled to 75% of the payable gold produced until total cumulative production reaches 910,000 ounces of gold, and 50% thereafter (Note 5).

104 Teck 2011 Annual Report
Notes to Consolidated Financial Statements Years ended December 31, 2011 and 2010
24. Segmented Information
Based on the primary products we produce and our development projects, we have five reportable segments – copper, coal, zinc, energy and corporate – which is the way we report information to our Chief Executive Officer. The corporate segment includes all of our initiatives in other commodities, our corporate growth activities and groups that provide administrative, technical, financial and other support to all of our business units. Other operating expenses include general and administration costs, exploration, research and development, and other operating income (expense). Sales between segments are carried out at arm’s length.
(Cdn$ in millions) December 31, 2011
Copper Coal Zinc Energy Corporate Total
Segment revenues $ 3,108 $ 5,641 $ 3,015 $ – $ – $ 11,764
Less: Inter-segment revenues – – (250) – – (250)
Revenues 3,108 5,641 2,765 – – 11,514
Gross profit
1,369
2,800
708
–
–
4,877
Other operating income (expenses) (102) (10) (76) – (233) (421)
Profit from operations 1,267 2,790 632 – (233) 4,456
Net finance expense (5) (31) (19) – (427) (482)
Non-operating income (expenses) – – – – 197 197
Share of losses of associates – – – – (5) (5)
Profit before tax 1,262 2,759 613 – (468) 4,166
Capital expenditures 538 524 106 49 19 1,236
Goodwill 444 1,203 – – – 1,647
Total assets 7,538 17,186 4,952 1,152 3,391 34,219
(Cdn$ in millions) December 31, 2010
Copper Coal Zinc Energy Corporate Total
Segment revenues $ 2,509 $ 4,351 $ 2,593 $ – $ – $ 9,453
Less: Inter-segment revenues – – (230) – – (230)
Revenues 2,509 4,351 2,363 – – 9,223 Gross profit
1,190
1,713
619
–
–
3,522
Other operating income (expenses) 98 35 641 – (347) 427
Profit from operations 1,288 1,748 1,260 – (347) 3,949
Net finance expense (11) (15) (18) – (552) (596)
Non-operating income (expenses) – – – – (418) (418)
Share of losses of associates – – – – (5) (5)
Profit before tax 1,277 1,733 1,242 – (1,322) 2,930
Capital expenditures 375 285 91 45 14 810
Goodwill 434 1,203 – – – 1,637
Total assets 7,089 16,346 2,816 1,057 1,747 29,055

105
(Cdn$ in millions) January 1, 2010
Copper Coal Zinc Energy Corporate Total
Goodwill 459 1,203 – – – 1,662
Total assets 7,280 16,136 3,267 1,006 1,781 29,470
The geographical distribution of our non-current assets and external sales revenue with revenue attributed to regions based on location of the customer are as follows:
(Cdn$ in millions) Non-Current Assets
December 31, 2011
December 31, 2010
January 1, 2010
Canada $ 19,460 $ 18,821 $ 18,693
Chile 4,565 4,409 4,934
United States 883 853 765
Other 604 522 487
$ 25,512 $ 24,605 $ 24,879
Non-current assets attributed to geographical locations exclude deferred tax assets, financial assets and pension assets.
Revenues are attributed to regions based on the location of the customer and are as follows:
(Cdn$ in millions) Revenues
2011 2010
Asia
Japan $ 2,145 $ 1,786
China 1,724 1,808
South Korea 1,416 1,048
Other 1,029 682
Americas
United States 1,673 1,353
Latin America 707 588
Canada 678 440
Europe
Germany 803 187
Italy 334 225
United Kingdom 212 494
Other 793 612
$ 11,514 $ 9,223

106 Teck 2011 Annual Report
Notes to Consolidated Financial Statements Years ended December 31, 2011 and 2010
25. Joint Ventures
Our Antamina operation, in which we have a 22.5% interest, and the Galore Creek Partnership, in which we have a 50% interest, are the primary entities accounted for using the proportionate consolidation method. We also proportionately consolidate the Greenhills operation (80%), Waneta Dam (66.7%) and Wintering Hills Wind Power Project (30%), which are all assets that we jointly control. Our share of the assets, liabilities, revenues, expenses and cash flows of these operations is as follows:
(Cdn$ in millions)
December 31, 2011
December 31, 2010
January 1, 2010
Assets
Cash and cash equivalents $ 80 $ 100 $ 108
Other current assets 291 241 248
Goodwill 181 181 181
Other long-term assets 3,321 3,229 2,843
$ 3,873 $ 3,751 $ 3,380
Liabilities and equity
Current liabilities $ 276 $ 157 $ 114
Long-term debt 26 116 99
Other long-term liabilities 255 234 124
Equity 3,316 3,244 3,043
$ 3,873 $ 3,751 $ 3,380
2011 2010
Profit
Revenues $ 1,814 $ 1,341
Operating and other expenses (761) (601)
Provision for income and resource taxes (181) (165)
Profit $ 872 $ 575
Cash flow
Operating activities $ 1,047 $ 794
Investing activities (292) (168)
Financing activities (10) 24
Distributions to Teck (767) (654)
Effect of exchange rates on cash 2 (4)
Increase (decrease) in cash $ (20) $ (8)
We have commitments of approximately $167 million over the next five years relating to our interests in joint ventures.

107
26. Accounting for Financial Instruments
a) Financial Risk Management
Our activities expose us to a variety of financial risks, which include foreign exchange risk, interest rate risk, commodity price risk, credit risk, liquidity risk and other risks associated with capital markets. From time to time, we may use foreign exchange, commodity price, and interest rate contracts to manage exposure to fluctuations in these variables. We do not have a practice of trading derivatives. Our use of derivatives is based on established practices and parameters to mitigate risk and is subject to the oversight of our Hedging Committee and our Board of Directors.
Liquidity Risk
Liquidity risk arises from our general and capital financing needs. We have planning, budgeting and forecasting processes to help determine our funding requirements to meet various contractual and other obligations. Note 17 details our available credit facilities as at December 31, 2011.
Contractual undiscounted cash flow requirements for financial liabilities as at December 31, 2011 are as follows:
(Cdn$ in millions)
Less Than 1 Year
2-3 Years
4-5 Years
More Than5 Years
Total
Trade accounts payable, accrued liabilities and dividends payable
$ 1,670
$ –
$ –
$ –
$ 1,670
Debt (Note 17) 359 558 1,004 5,300 7,221
Estimated interest payments on debt 385 752 654 2,397 4,188
Foreign Exchange Risk
We operate on an international basis and therefore, foreign exchange risk exposures arise from transactions denominated in a foreign currency. Our foreign exchange risk arises primarily with respect to the U.S. dollar and to a lesser extent, the Chilean peso. Our cash flows from Canadian and Chilean operations are exposed to foreign exchange risk as commodity sales are denominated in U.S. dollars, and the majority of operating expenses are denominated in local currencies.
We hedge a portion of our U.S. dollar denominated future cash flows on a quarterly basis with U.S. dollar forward sales contracts. We have elected not to actively manage other foreign exchange exposures at this time.
We also have various investments in U.S. dollar foreign operations, whose net assets are exposed to foreign currency translation risk. This currency exposure is managed in part through our U.S. dollar denominated debt as a hedge against net investments in foreign operations. As at December 31, 2011, $6.6 billion of U.S. dollar debt was designated in this manner.
U.S. dollar financial instruments subject to foreign exchange risk:
(US$ in millions) 2011 2010
Cash $ 792 $ 68
Accounts receivable 588 390
Accounts payable (269) (253)
U.S. dollar forward sales contracts, net of forward purchase contracts (185) (419)
Long-term debt, net of discounts and prepayment rights (6,605) (4,794)
Net investment in self-sustaining foreign operations 8,450 5,389
Net U.S. dollar assets (liabilities) exposed $ 2,771 $ 381
As at December 31, 2011, with other variables unchanged, a $0.10 strengthening (weakening) of the Canadian dollar against the U.S. dollar would have a $7 million effect (2010 – $45 million) on profit before tax resulting from our financial instruments. There would also be a $19 million (2010 – $42 million) decrease (increase) in other comprehensive income from our U.S. dollar forward sales contracts designated as cash flow hedges and there would be a $215 million (2010 – $51 million) decrease (increase) in other comprehensive income resulting from our net U.S. dollar investments in self-sustaining operations.

108 Teck 2011 Annual Report
Notes to Consolidated Financial Statements Years ended December 31, 2011 and 2010
26. Accounting for Financial Instruments (continued)
Interest Rate Risk
Our interest rate risk mainly arises from our cash and cash equivalents. Our interest rate management policy is generally to borrow at fixed rates. However, floating rate funding may be used to fund short-term operating cash flow requirements or, in conjunction with fixed to floating interest rate swaps, be used to offset interest rate risk from our cash. The fair value of fixed-rate debt fluctuates with changes in market interest rates, but unless we make a prepayment, the cash flows, denominated in U.S. dollars, do not. Cash flows related to floating rate debt fluctuate with changes in market interest rates, but the fair value, denominated in U.S. dollars, does not (Note 17).
We separately value the prepayment options on our 2016 and 2019 notes (Note 12). The value of these options fluctuates with both market interest rates and our credit spread.
Cash and cash equivalents have short terms to maturity and receive interest based on market interest rates.
The fair value of our derivative interest rate swap changes with fluctuations in market interest rates.
As at December 31, 2011, with other variables unchanged, a 1% change in the LIBOR rate would have a $2 million effect (2010 – $2 million) on profit. There would be no effect on other comprehensive income.
Commodity Price Risk
We are subject to price risk from fluctuations in market prices of the commodities that we produce. From time to time, we may use commodity price contracts to manage our exposure to fluctuations in commodity prices. At the balance sheet date, we had zinc and lead forward contracts outstanding.
Our commodity price risk associated with financial instruments primarily relates to changes in fair value caused by final pricing adjustments to receivables and payables and forward contracts for zinc and lead.
The following represents the effect of financial instruments on profit attributable to shareholders from a 10% increase to commodity prices, based on the December 31, 2011 prices. There is no effect on other comprehensive income.
Price on December 31,
Increase inProfit Attributable to
Shareholders
(Cdn$ in millions, except for US$/lb data) 2011 2010 2011 2010
Copper US$3.43 US$4.39/lb $ 34 $ 25
Zinc US$0.83 US$1.11/lb 2 6
Lead US$0.90 US$1.17/lb 1 –
Credit Risk
Credit risk arises from the non-performance by counterparties of contractual financial obligations. Our primary counterparties related to our money market investments and derivative contracts carry investment grade ratings as assessed by external rating agencies. There is ongoing review to evaluate the creditworthiness of these counterparties. We manage credit risk for trade and other receivables through established credit monitoring activities. We do not have a significant concentration of credit risk with any single counterparty or group of counterparties. Our maximum exposure to credit risk at the reporting date is the carrying value of our cash and cash equivalents, receivables and derivative assets. While we are exposed to credit losses due to the non-performance of our counterparties, we do not consider this to be a material risk.

109
b) Factoring of Trade Receivables
In 2011, we renewed a US$150 million facility with a third-party for the sales of certain trade receivables from export coal sales. We have accounted for these transactions as a sale since we have transferred the risks and rewards of ownership over the receivables. Accordingly, we have derecognized the receivables at the date of the transactions. Total receivables sold during 2011 under the facility were US$422 million (2010 – US$652 million) none of which had due dates falling after December 31, 2011. No gain or loss has been recognized on these transactions during 2011 or 2010.
c) Derivative Financial Instruments and Hedges
Sale and Purchase Contracts
Sales and purchases of metals in concentrates and cathodes are recognized on a provisional pricing basis when title transfers and the rights and obligations of ownership pass to the customer, which usually occurs on shipment. However, the final pricing for the product sold and purchased is not determined at that time as it is contractually linked to market prices at a subsequent date. These arrangements have the characteristics of a derivative instrument as the value of our receivables and payables will vary as prices for the underlying commodities vary in the metal markets. These pricing adjustments result in gains (losses from purchases) in a rising price environment and losses (gains for purchases) in a declining price environment and are recorded as other operating income (expense). The profit impact of gains and losses on these contracts is mitigated by smelter price participation, royalty interests, taxes and non-controlling interests. It should be noted that while these effects arise on the sale of concentrates, we also purchase concentrates at our Trail operation where the opposite effects occur.
The table below outlines our outstanding receivable and payable positions, which were provisionally valued at December 31, 2011 and at December 31, 2010, respectively.
Outstanding atDecember 31, 2011
Outstanding atDecember 31, 2010
(pounds in millions) Pounds US$/lb Pounds US$/lb
Receivable positions
Copper 164 3.43 98 4.39
Zinc 184 0.83 140 1.11
Lead 41 0.90 2 1.17
Payable positions
Zinc payable 108 0.83 35 1.11
Lead payable 10 0.90 2 1.17
At December 31, 2011, total outstanding settlement receivables were $559 million and total outstanding settlement payables were $35 million, both of which are included in trade accounts receivable and trade accounts payable, respectively, on the consolidated balance sheet.
Economic Hedge Contracts
We entered into lead forward sales contracts to mitigate the risk of price changes for a portion of our concentrate sales. These contracts economically lock in prices for a portion of our lead sales. We do not apply hedge accounting to commodity forward sales contracts.
Certain customers purchase refined zinc and lead products at fixed forward prices from our smelter and refinery operations. The forward purchase commitments for these metal products are matched to these fixed price sales commitments to customers.

110 Teck 2011 Annual Report
Notes to Consolidated Financial Statements Years ended December 31, 2011 and 2010
26. Accounting for Financial Instruments (continued)
The fair value of our fixed commodity forward sale and purchase contracts is calculated using a discounted cash flow method based on forward metal prices. A summary of our free-standing derivative contracts and related fair values as at December 31, 2011 is as follows:
2012
2013
Total
Fair Value Asset
(Liability) (Cdn$ in millions)
Derivatives not designated as hedging instruments
Zinc (millions of lbs)
Fixed forward sales contracts 5 – 5
Average price (US$/lb) 0.63 – 0.63 $ (2)
Zinc (millions of lbs)
Fixed forward purchase contracts 18 – 18
Average price (US$/lb) 0.89 – 0.89 –
Lead (millions of lbs)
Fixed forward sales contracts 6 – 6
Average price (US$/lb) 0.92 – 0.92 –
Lead (millions of lbs)
Fixed forward purchase contracts 16 – 16
Average price (US$/lb) 1.03 – 1.03 (2)
Interest rate contracts (millions of US$) 104 – 104 3
U.S. dollars (millions of US$)
Forward sales contracts 2 4 6
Average rate (CLP/US$) 551 664 613 1
–
Derivatives designated as cash flow hedges
U.S. dollars (millions of US$)
Forward sales contracts 185 – 185
Average rate (Cdn$/US$) 1.02 – 1.02 1
$ 1
Derivatives designated as cash flow hedges are recorded in trade accounts receivable on the consolidated balance sheet. Free-standing derivatives not designated as hedging instruments are recorded in trade accounts receivable of $3 million, other assets of $1 million, and trade accounts payable and accrued liabilities of $4 million on the consolidated balance sheet.
In addition to the above, one of our road and port contracts contains a contingent zinc escalation payment that is considered to be an embedded derivative. The fair value of this embedded derivative was $3 million at December 31, 2011 (2010 – $18 million), and is included in other liabilities and provisions on the consolidated balance sheet.
Prepayment Rights on Notes Due 2016 and 2019
Our 2016 and 2019 notes (Note 17(b)) include prepayment rights that are considered to be embedded derivatives. At December 31, 2011, these prepayment rights are recorded as other assets (Note 12) on the balance sheet at a fair value of $313 million based on current market interest rates for similar instruments and our credit spread. Changes in the fair value of the embedded derivatives are recorded in non-operating income (expense). In 2011, we recorded a gain of $146 million (2010 – $168 million) based on the increase in value of these rights. In 2010, we wrote off $66 million of the value of these rights on the repurchase of the underlying notes (Note 17(f)).

111
Derivatives Not Designated as Hedging Instruments
(Cdn$ in millions) 2011
Zinc Forward
Sales and Purchases
Copper Forward
Sales
Debt Prepayment
Option
Other
Settlements Receivable
and Payable
Total
Amount of gain recognized in other operating income (expense)
$ 7
$ –
$ –
$ –
$ (210)
$ (203)
Amount of gain recognized in non-operating income (expense)
$ –
$ –
$ 146
$ 2
$ –
$ 148
(Cdn$ in millions) 2010Zinc
Forward Sales and
Purchases
Copper Forward
Sales
Debt Prepayment
Option
Other
Settlements Receivable
and Payable
Total
Amount of gain recognized in other operating income (expense)
$ 8
$ –
$ –
$ –
$ 116
$ 124
Amount of gain recognized in non-operating income (expense)
$ –
$ –
$ 168
$ 5
$ –
$ 173
Hedges
Cash flow hedges
At December 31, 2011, U.S. dollar forward sales contracts with a notional amount of US$185 million remained outstanding. The contracts mature in early 2012. These contracts have been designated as cash flow hedges of a portion of our future cash flows from anticipated U.S. dollar coal sales. We have determined that they are highly effective hedges from inception to December 31, 2011.
Unrealized gains and losses on the majority of our U.S. dollar forward sales contracts are recorded in other comprehensive income. Realized gains and losses on settled contracts are recorded in revenue.
The following table provides information regarding the effect of U.S. dollar forward sales contracts that are derivative instruments designated as cash flow hedges on our consolidated statements of income and comprehensive income in 2011 and 2010:
(Cdn$ in millions) 2011 2010
Gains recognized in OCI (effective portion) $ – $ 11
Gains reclassified from AOCI into income (effective portion) 6 27
Location of gains reclassified from AOCI into income Revenue Revenue
Net investment hedge
Our hedges of net investments in foreign operations were effective, and no ineffectiveness was recognized in profit for the period.
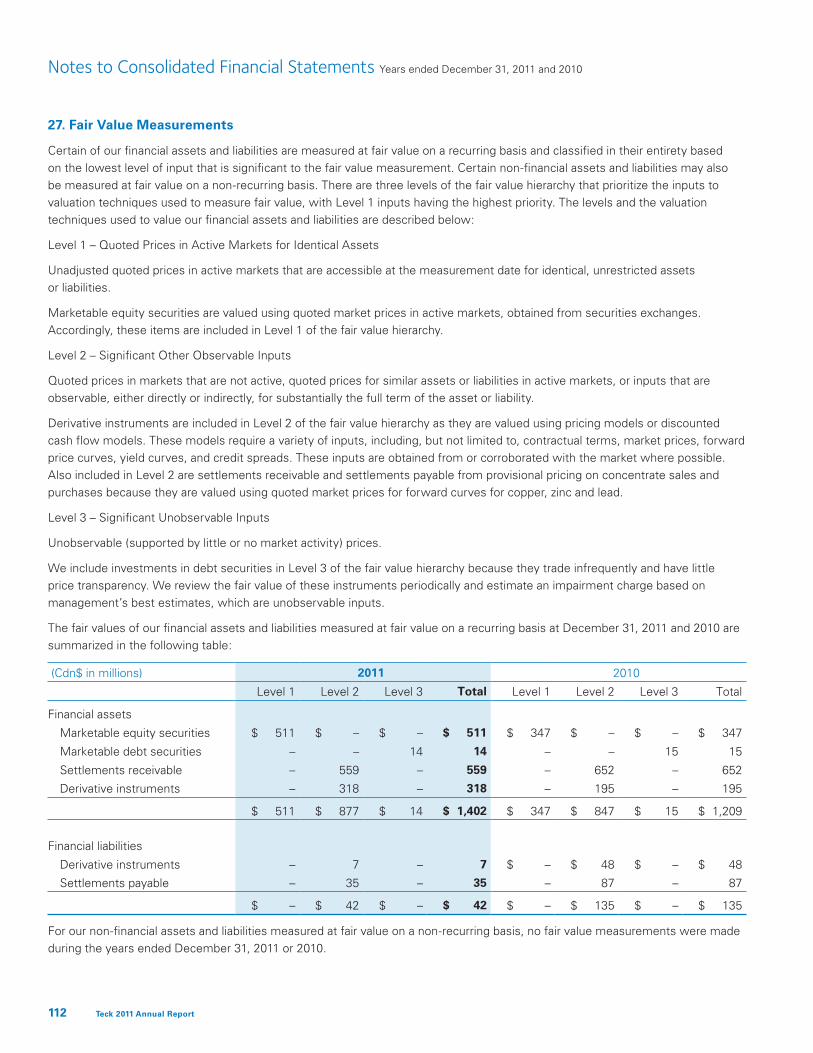
112 Teck 2011 Annual Report
Notes to Consolidated Financial Statements Years ended December 31, 2011 and 2010
27. Fair Value Measurements
Certain of our financial assets and liabilities are measured at fair value on a recurring basis and classified in their entirety based on the lowest level of input that is significant to the fair value measurement. Certain non-financial assets and liabilities may also be measured at fair value on a non-recurring basis. There are three levels of the fair value hierarchy that prioritize the inputs to valuation techniques used to measure fair value, with Level 1 inputs having the highest priority. The levels and the valuation techniques used to value our financial assets and liabilities are described below:
Level 1 – Quoted Prices in Active Markets for Identical Assets
Unadjusted quoted prices in active markets that are accessible at the measurement date for identical, unrestricted assets or liabilities.
Marketable equity securities are valued using quoted market prices in active markets, obtained from securities exchanges. Accordingly, these items are included in Level 1 of the fair value hierarchy.
Level 2 – Significant Other Observable Inputs
Quoted prices in markets that are not active, quoted prices for similar assets or liabilities in active markets, or inputs that are observable, either directly or indirectly, for substantially the full term of the asset or liability.
Derivative instruments are included in Level 2 of the fair value hierarchy as they are valued using pricing models or discounted cash flow models. These models require a variety of inputs, including, but not limited to, contractual terms, market prices, forward price curves, yield curves, and credit spreads. These inputs are obtained from or corroborated with the market where possible. Also included in Level 2 are settlements receivable and settlements payable from provisional pricing on concentrate sales and purchases because they are valued using quoted market prices for forward curves for copper, zinc and lead.
Level 3 – Significant Unobservable Inputs
Unobservable (supported by little or no market activity) prices.
We include investments in debt securities in Level 3 of the fair value hierarchy because they trade infrequently and have little price transparency. We review the fair value of these instruments periodically and estimate an impairment charge based on management’s best estimates, which are unobservable inputs.
The fair values of our financial assets and liabilities measured at fair value on a recurring basis at December 31, 2011 and 2010 are summarized in the following table:
(Cdn$ in millions) 2011 2010
Level 1 Level 2 Level 3 Total Level 1 Level 2 Level 3 Total
Financial assets
Marketable equity securities $ 511 $ – $ – $ 511 $ 347 $ – $ – $ 347
Marketable debt securities – – 14 14 – – 15 15
Settlements receivable – 559 – 559 – 652 – 652
Derivative instruments – 318 – 318 – 195 – 195
$ 511 $ 877 $ 14 $ 1,402 $ 347 $ 847 $ 15 $ 1,209
Financial liabilities
Derivative instruments – 7 – 7 $ – $ 48 $ – $ 48
Settlements payable – 35 – 35 – 87 – 87
$ – $ 42 $ – $ 42 $ – $ 135 $ – $ 135
For our non-financial assets and liabilities measured at fair value on a non-recurring basis, no fair value measurements were made during the years ended December 31, 2011 or 2010.

113
28. Capital Risk Management
We manage the equity and long-term debt on our balance sheet as part of our capital risk management program. Our capital management objectives are to maintain access to the capital we require to operate and grow our business, while minimizing the cost of such capital. Our debt is rated investment grade by independent rating agencies who assess, among other things, our ability to meet our interest and principal obligations and our financial policies. These policies include, over the medium and long term, a target debt to debt plus equity ratio of less than 30% and a target ratio of debt to EBITDA of below 2.5. These ratios are expected to vary from their target levels from time to time reflecting commodity price cycles and corporate activity, including the development of major projects.
As at December 31, 2011, our debt to debt plus equity ratio was 28% (2010 – 24%) and our debt to EBITDA ratio was 1.3 (2010 – 1.2).
Currently, there are no externally imposed financial ratio covenants in our notes. Covenants would come into effect should our credit rating fall below investment grade or should we incur an event of default. Our revolving credit facility maintains financial ratio covenant requirements, which were met as at December 31, 2011 (Note 17(d)).
We manage the risk of not meeting our financial targets through the issuance and repayment of debt and equity capital, as well as through the ongoing management of operations, investments and capital expenditures.
29. Key Management Compensation
Key Management includes directors and senior vice presidents. The compensation for key management in respect of employee services is as follows:
(Cdn$ in millions) 2011 2010
Salaries, director fees and other short-term benefits $ 12 $ 12
Post-employment benefits 3 2
Share-based compensation (8) 25
$ 7 $ 39
30. Subsequent Event
Acquisition of SilverBirch Energy
On January 9, 2012, we announced the acquisition of SilverBirch Energy (“SilverBirch”) by way of a plan of arrangement under the Canadian Business Corporation Act. Under the arrangement, SilverBirch shareholders will receive Cdn$8.50 in cash and one share of a new company, SilverWillow Energy Corporation (“SilverWillow”), per SilverBirch common share. SilverWillow will hold substantially all of the assets of SilverBirch other than SilverBirch’s 50% interest in the Frontier and Equinox oils sands project. In connection with the arrangement, we will contribute to SilverWillow Cdn$25 million in working capital and its 50% interest in several oil sands leases that are currently jointly owned with SilverBirch. The Board of Directors of SilverBirch has unanimously approved the plan of arrangement and recommends that SilverBirch shareholders vote in favour of it. Completion of this project is subject to receipt of the necessary regulatory approvals and approval by SilverBirch shareholders, as well as other customary conditions. The transaction is expected to close on or before April 16, 2012, and result in a cash outlay of $435 million.
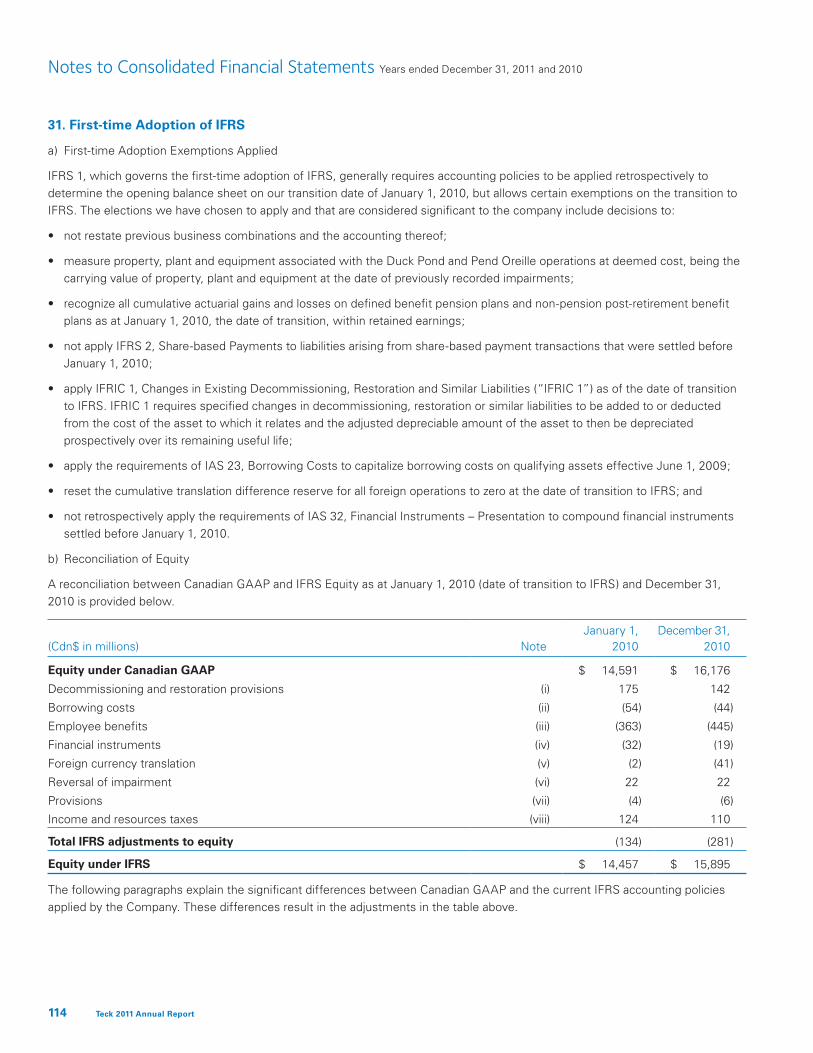
114 Teck 2011 Annual Report
Notes to Consolidated Financial Statements Years ended December 31, 2011 and 2010
31. First-time Adoption of IFRS
a) First-time Adoption Exemptions Applied
IFRS 1, which governs the first-time adoption of IFRS, generally requires accounting policies to be applied retrospectively to determine the opening balance sheet on our transition date of January 1, 2010, but allows certain exemptions on the transition to IFRS. The elections we have chosen to apply and that are considered significant to the company include decisions to:
• notrestatepreviousbusinesscombinationsandtheaccountingthereof;
• measureproperty,plantandequipmentassociatedwiththeDuckPondandPendOreilleoperationsatdeemedcost,beingthecarrying value of property, plant and equipment at the date of previously recorded impairments;
• recognizeallcumulativeactuarialgainsandlossesondefinedbenefitpensionplansandnon-pensionpost-retirementbenefitplans as at January 1, 2010, the date of transition, within retained earnings;
• notapplyIFRS2,Share-basedPaymentstoliabilitiesarisingfromshare-basedpaymenttransactionsthatweresettledbeforeJanuary 1, 2010;
• applyIFRIC1,ChangesinExistingDecommissioning,RestorationandSimilarLiabilities(“IFRIC1”)asofthedateoftransitionto IFRS. IFRIC 1 requires specified changes in decommissioning, restoration or similar liabilities to be added to or deducted from the cost of the asset to which it relates and the adjusted depreciable amount of the asset to then be depreciated prospectively over its remaining useful life;
• applytherequirementsofIAS23,BorrowingCoststocapitalizeborrowingcostsonqualifyingassetseffectiveJune1,2009;
• resetthecumulativetranslationdifferencereserveforallforeignoperationstozeroatthedateoftransitiontoIFRS;and
• notretrospectivelyapplytherequirementsofIAS32,FinancialInstruments–Presentationtocompoundfinancialinstrumentssettled before January 1, 2010.
b) Reconciliation of Equity
A reconciliation between Canadian GAAP and IFRS Equity as at January 1, 2010 (date of transition to IFRS) and December 31, 2010 is provided below.
(Cdn$ in millions)
Note
January 1,2010
December 31,2010
Equity under Canadian GAAP $ 14,591 $ 16,176
Decommissioning and restoration provisions (i) 175 142
Borrowing costs (ii) (54) (44)
Employee benefits (iii) (363) (445)
Financial instruments (iv) (32) (19)
Foreign currency translation (v) (2) (41)
Reversal of impairment (vi) 22 22
Provisions (vii) (4) (6)
Income and resources taxes (viii) 124 110
Total IFRS adjustments to equity (134) (281)
Equity under IFRS $ 14,457 $ 15,895
The following paragraphs explain the significant differences between Canadian GAAP and the current IFRS accounting policies applied by the Company. These differences result in the adjustments in the table above.
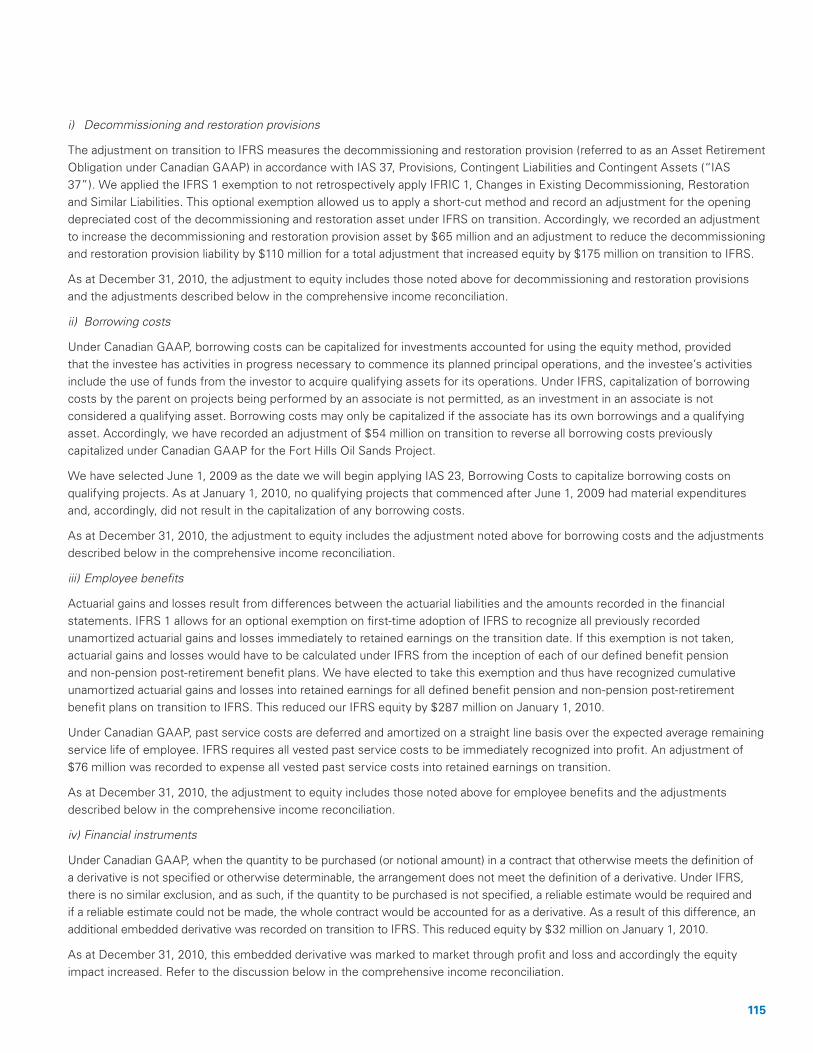
115
i) Decommissioning and restoration provisions
The adjustment on transition to IFRS measures the decommissioning and restoration provision (referred to as an Asset Retirement Obligation under Canadian GAAP) in accordance with IAS 37, Provisions, Contingent Liabilities and Contingent Assets (“IAS 37”). We applied the IFRS 1 exemption to not retrospectively apply IFRIC 1, Changes in Existing Decommissioning, Restoration and Similar Liabilities. This optional exemption allowed us to apply a short-cut method and record an adjustment for the opening depreciated cost of the decommissioning and restoration asset under IFRS on transition. Accordingly, we recorded an adjustment to increase the decommissioning and restoration provision asset by $65 million and an adjustment to reduce the decommissioning and restoration provision liability by $110 million for a total adjustment that increased equity by $175 million on transition to IFRS.
As at December 31, 2010, the adjustment to equity includes those noted above for decommissioning and restoration provisions and the adjustments described below in the comprehensive income reconciliation.
ii) Borrowing costs
Under Canadian GAAP, borrowing costs can be capitalized for investments accounted for using the equity method, provided that the investee has activities in progress necessary to commence its planned principal operations, and the investee’s activities include the use of funds from the investor to acquire qualifying assets for its operations. Under IFRS, capitalization of borrowing costs by the parent on projects being performed by an associate is not permitted, as an investment in an associate is not considered a qualifying asset. Borrowing costs may only be capitalized if the associate has its own borrowings and a qualifying asset. Accordingly, we have recorded an adjustment of $54 million on transition to reverse all borrowing costs previously capitalized under Canadian GAAP for the Fort Hills Oil Sands Project.
We have selected June 1, 2009 as the date we will begin applying IAS 23, Borrowing Costs to capitalize borrowing costs on qualifying projects. As at January 1, 2010, no qualifying projects that commenced after June 1, 2009 had material expenditures and, accordingly, did not result in the capitalization of any borrowing costs.
As at December 31, 2010, the adjustment to equity includes the adjustment noted above for borrowing costs and the adjustments described below in the comprehensive income reconciliation.
iii) Employee benefits
Actuarial gains and losses result from differences between the actuarial liabilities and the amounts recorded in the financial statements. IFRS 1 allows for an optional exemption on first-time adoption of IFRS to recognize all previously recorded unamortized actuarial gains and losses immediately to retained earnings on the transition date. If this exemption is not taken, actuarial gains and losses would have to be calculated under IFRS from the inception of each of our defined benefit pension and non-pension post-retirement benefit plans. We have elected to take this exemption and thus have recognized cumulative unamortized actuarial gains and losses into retained earnings for all defined benefit pension and non-pension post-retirement benefit plans on transition to IFRS. This reduced our IFRS equity by $287 million on January 1, 2010.
Under Canadian GAAP, past service costs are deferred and amortized on a straight line basis over the expected average remaining service life of employee. IFRS requires all vested past service costs to be immediately recognized into profit. An adjustment of $76 million was recorded to expense all vested past service costs into retained earnings on transition.
As at December 31, 2010, the adjustment to equity includes those noted above for employee benefits and the adjustments described below in the comprehensive income reconciliation.
iv) Financial instruments
Under Canadian GAAP, when the quantity to be purchased (or notional amount) in a contract that otherwise meets the definition of a derivative is not specified or otherwise determinable, the arrangement does not meet the definition of a derivative. Under IFRS, there is no similar exclusion, and as such, if the quantity to be purchased is not specified, a reliable estimate would be required and if a reliable estimate could not be made, the whole contract would be accounted for as a derivative. As a result of this difference, an additional embedded derivative was recorded on transition to IFRS. This reduced equity by $32 million on January 1, 2010.
As at December 31, 2010, this embedded derivative was marked to market through profit and loss and accordingly the equity impact increased. Refer to the discussion below in the comprehensive income reconciliation.

116 Teck 2011 Annual Report
Notes to Consolidated Financial Statements Years ended December 31, 2011 and 2010
31. First-time Adoption of IFRS (continued)
v) Foreign currency translation
The foreign currency adjustment of $2 million relates to integrated foreign operations under Canadian GAAP. IFRS does not distinguish between integrated and self-sustaining foreign operations and the current rate method is required to be applied to all entities where the functional currency is different from the presentation currency, resulting in an adjustment on transition to IFRS. This applies to only a few of our foreign exploration operations.
As at December 31, 2010, the adjustment to equity includes the one noted above for foreign currency and the adjustments described below in the comprehensive income reconciliation.
vi) Reversal of impairment
Under IFRS, impairment losses recognized must be reversed if the circumstances leading to the impairment change and cause the impairment to be reduced. This is not permitted under Canadian GAAP. This applies to property, plant and equipment, as well as to exploration and evaluation assets. An adjustment of $22 million has been recorded on transition to IFRS to reverse an impairment loss previously recorded for an exploration and evaluation property that is no longer impaired at the date of transition to IFRS. No additional impairment reversals were identified on transition to IFRS.
As at December 31, 2010, no additional impairment reversals were identified under IFRS.
vii) Provisions
On transition to IFRS on January 1, 2010, an additional provision was identified under IAS 37 relating to a constructive obligation. Accordingly, a provision of $4 million was recorded on January 1, 2010.
As at December 31, 2010, the adjustment to equity includes the one noted above for provisions and the adjustments described below in the comprehensive income reconciliation.
viii) Income and resource taxes
The income and resource taxes adjustment as at January 1, 2010 includes the following items:
• TaxeffectofIFRSadjustments–Anadjustmentof$65millionrelatingtothedeferredincomeandresourcetaximpactoftheCanadian GAAP and IFRS reconciling differences discussed above was recorded, increasing equity on transition to IFRS.
• Reversalofadeferredtaxliabilityonacquisitionofanasset–UnderIFRS,deferredtaxescannotberecognizedfortheacquisition of assets that do not constitute a business combination. There is no similar prohibition under Canadian GAAP. Accordingly, on transition to IFRS, we have reversed the deferred tax liability recorded on the acquisition of an asset in a prior period that did not constitute a business combination. This increased equity by $6 million on transition to IFRS.
• Differencesonwhatconstitutesanincometax–ThedefinitionofwhatconstitutesanincometaxisdifferentunderIFRSandCanadian GAAP. As a result, two items have been identified that will be accounted for differently under IFRS. The first is the workers’ participation at Antamina, which was accounted for as an income tax under Canadian GAAP. Worker’s participation will no longer be considered an income tax under IFRS and will instead be accounted for as an employee benefit. As a result, an adjustment of $12 million has been recorded to derecognize the deferred tax liability relating to our share of Antamina’s workers’ participation and increase equity on transition to IFRS. The second item is the Alaska Mining License Tax (“AMLT”), which was accounted for as an operating cost under Canadian GAAP. AMLT is considered a resource tax accounted for as an income tax under IFRS and accordingly, an adjustment has been recorded to recognize a deferred tax liability of $20 million for AMLT and reduce equity on transition to IFRS.
• Uncertaintaxpositions–TherecognitionandmeasurementofuncertaintaxpositionsisinterpreteddifferentlyunderIFRScompared to Canadian GAAP. Under IFRS there is no specific standard relating to uncertain tax positions and therefore, we have applied the recognition and measurement criteria for provisions in IAS 37 to account for uncertain tax positions. As a result, an adjustment has been recorded to recognize additional assets from uncertain tax positions on transition to IFRS. This increased equity by $61 million on transition to IFRS.

117
As at December 31, 2010, the adjustment to equity includes those noted above for income and resource taxes and the adjustments described below in the comprehensive income reconciliation.
c) Reconciliation of Total Comprehensive Income
A reconciliation between the Canadian GAAP and IFRS total comprehensive income for the year ended December 31, 2010 is provided below.
(Cdn$ in millions)
Note
Year endedDecember 31,
2010
Total comprehensive income under Canadian GAAP $ 1,928
Profit adjustments
Decommissioning and restoration provision (i) (33)
Employee benefits (ii) 37
Financial instruments (iii) 13
Foreign exchange (iv) (13)
Borrowing costs (v) 10
Provisions (vi) (2)
Income and resource taxes (vii) (51)
Other comprehensive income adjustments
Currency translation adjustments (viii) (26)
Employee benefits (ix) (119)
Income and resource taxes (x) 37
Total IFRS adjustments to comprehensive income (147)
Total comprehensive income under IFRS $ 1,781
i) Decommissioning and restoration provision
Under IFRS, the decommissioning and restoration provision is required to be recalculated using a new discount rate at each reporting period. The change in the discount rate for operating sites is adjusted through the decommissioning and restoration provision asset and decommissioning and restoration provision liability. The change in the discount rate for dormant sites is adjusted through profit and loss and the decommissioning and restoration provision liability. The change in the discount rate for dormant sites reduced comprehensive income by $28 million for the year ended December 31, 2010. The decommissioning and restoration provision asset amortization and decommissioning and restoration provision accretion expense increased by $5 million for the year ended December 31, 2010, compared to Canadian GAAP.
ii) Employee benefits – amortization of actuarial gains (losses)
As noted above, we applied the IFRS 1 optional exemption to recognize cumulative actuarial gains (losses) into retained earnings on transition to IFRS. Accordingly, the amortization of the cumulative actuarial gains (losses) recorded under the corridor method (see below) for Canadian GAAP has been reversed under IFRS. This increased comprehensive income by $37 million for the year ended December 31, 2010, compared to Canadian GAAP.
iii) Financial instruments
As noted above, we recorded an additional embedded derivative on transition to IFRS on January 1, 2010. This embedded derivative is marked to market every reporting period under IFRS and accordingly, gains of $13 million were recorded for the year ended December 31, 2010.
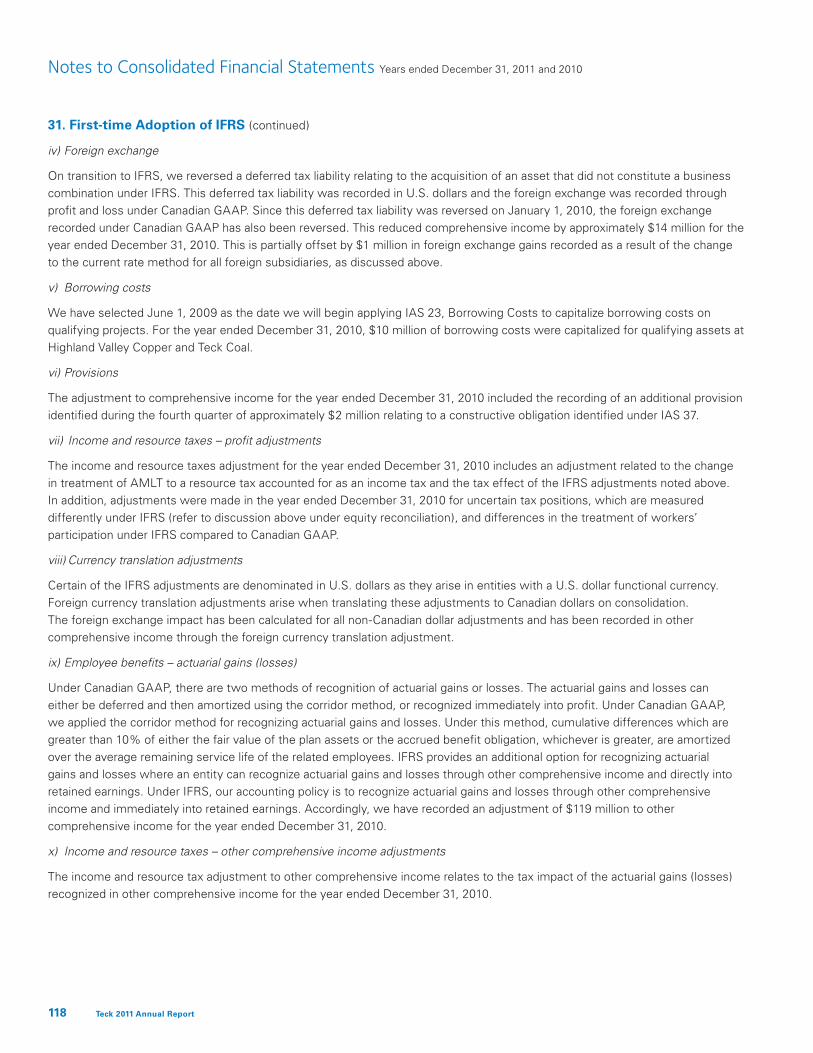
118 Teck 2011 Annual Report
Notes to Consolidated Financial Statements Years ended December 31, 2011 and 2010
31. First-time Adoption of IFRS (continued)
iv) Foreign exchange
On transition to IFRS, we reversed a deferred tax liability relating to the acquisition of an asset that did not constitute a business combination under IFRS. This deferred tax liability was recorded in U.S. dollars and the foreign exchange was recorded through profit and loss under Canadian GAAP. Since this deferred tax liability was reversed on January 1, 2010, the foreign exchange recorded under Canadian GAAP has also been reversed. This reduced comprehensive income by approximately $14 million for the year ended December 31, 2010. This is partially offset by $1 million in foreign exchange gains recorded as a result of the change to the current rate method for all foreign subsidiaries, as discussed above.
v) Borrowing costs
We have selected June 1, 2009 as the date we will begin applying IAS 23, Borrowing Costs to capitalize borrowing costs on qualifying projects. For the year ended December 31, 2010, $10 million of borrowing costs were capitalized for qualifying assets at Highland Valley Copper and Teck Coal.
vi) Provisions
The adjustment to comprehensive income for the year ended December 31, 2010 included the recording of an additional provision identified during the fourth quarter of approximately $2 million relating to a constructive obligation identified under IAS 37.
vii) Income and resource taxes – profit adjustments
The income and resource taxes adjustment for the year ended December 31, 2010 includes an adjustment related to the change in treatment of AMLT to a resource tax accounted for as an income tax and the tax effect of the IFRS adjustments noted above. In addition, adjustments were made in the year ended December 31, 2010 for uncertain tax positions, which are measured differently under IFRS (refer to discussion above under equity reconciliation), and differences in the treatment of workers’ participation under IFRS compared to Canadian GAAP.
viii) Currency translation adjustments
Certain of the IFRS adjustments are denominated in U.S. dollars as they arise in entities with a U.S. dollar functional currency. Foreign currency translation adjustments arise when translating these adjustments to Canadian dollars on consolidation. The foreign exchange impact has been calculated for all non-Canadian dollar adjustments and has been recorded in other comprehensive income through the foreign currency translation adjustment.
ix) Employee benefits – actuarial gains (losses)
Under Canadian GAAP, there are two methods of recognition of actuarial gains or losses. The actuarial gains and losses can either be deferred and then amortized using the corridor method, or recognized immediately into profit. Under Canadian GAAP, we applied the corridor method for recognizing actuarial gains and losses. Under this method, cumulative differences which are greater than 10% of either the fair value of the plan assets or the accrued benefit obligation, whichever is greater, are amortized over the average remaining service life of the related employees. IFRS provides an additional option for recognizing actuarial gains and losses where an entity can recognize actuarial gains and losses through other comprehensive income and directly into retained earnings. Under IFRS, our accounting policy is to recognize actuarial gains and losses through other comprehensive income and immediately into retained earnings. Accordingly, we have recorded an adjustment of $119 million to other comprehensive income for the year ended December 31, 2010.
x) Income and resource taxes – other comprehensive income adjustments
The income and resource tax adjustment to other comprehensive income relates to the tax impact of the actuarial gains (losses) recognized in other comprehensive income for the year ended December 31, 2010.

119
d) Statement of Cash Flows
The IFRS transition adjustments noted above did not have an impact on cash and cash equivalents.
The only change in cash and cash equivalents is as a result of our accounting policy to proportionately consolidate joint ventures, including jointly controlled entities. The Galore Creek Partnership (“Galore Creek”) in which we own a 50% partnership interest was previously equity accounted under Canadian GAAP as a variable interest entity and is now proportionately consolidated under IFRS as a jointly controlled entity. This change does not impact IFRS equity on January 1, 2010 or throughout 2010 and does not impact comprehensive income in 2010. The change does impact cash and cash equivalents as we proportionately consolidate Galore Creek’s cash balance under IFRS. Cash and cash equivalents increased by $2 million on January 1, 2010 and were not impacted as at December 31, 2010 as a result of this change.
We present cash interest paid as a financing activity in our statements of cash flows under IFRS. Under Canadian GAAP, cash interest paid was included as an operating activity. This change in classification under IFRS increased our cash flow from operating activities and decreased our cash flow from financing activities by $533 million for the year ended December 31, 2010 compared to Canadian GAAP. There is no net impact on cash and cash equivalents as a result of this presentation change.
e) Financial Statement Presentation Changes
The transition to IFRS has resulted in numerous financial statement presentation changes in our financial statements, most significantly on the consolidated statement of income. The changes to the balance sheet relate to the further break-out of balances on the face of the balance sheet including retirement benefit provisions, deferred tax assets and investments in associates. In addition, we combined components of other assets and our investment balance into the financial and other assets line. The changes to our cash flow statement are outlined above.
The following is a summary of the significant changes to our consolidated statement of income:
• Expensesbyfunctionandnature–ourstatementofincomepresentsexpensesbyfunction.Accordingly,depreciationandamortization is no longer presented as a separate item on the statement of income but is included in cost of sales.
• Otheroperatingincome(expense)includesitemsweconsidertoberelatedtotheoperationofourbusiness,suchaspricingadjustments from settlement receivables, share-based compensation, commodity derivatives, gains or losses on sale of operating assets, and provisions for our closed properties. Non-operating income (expense) includes items we consider to arise from financial and other matters and includes items such as foreign exchange, debt refinancing costs, marketable securities gains and losses, and gains and losses on the revaluation on other derivatives.
• Financeexpense–underIFRS,financeexpenseincludesinterestondebt,accretionexpensefordecommissioningandrestoration and other provisions and interest associated with pension and post-retirement benefit obligations. Accretion and interest associated with pension and post-retirement benefit obligations were previously included in cost of sales and general and administration expense.
• Financeincome–financeincomeunderIFRSincludesinterestincomeandreturnonpensionplanassets.
The above changes are reclassifications within our statement of income so there is no net impact to our profit as a result of these changes.
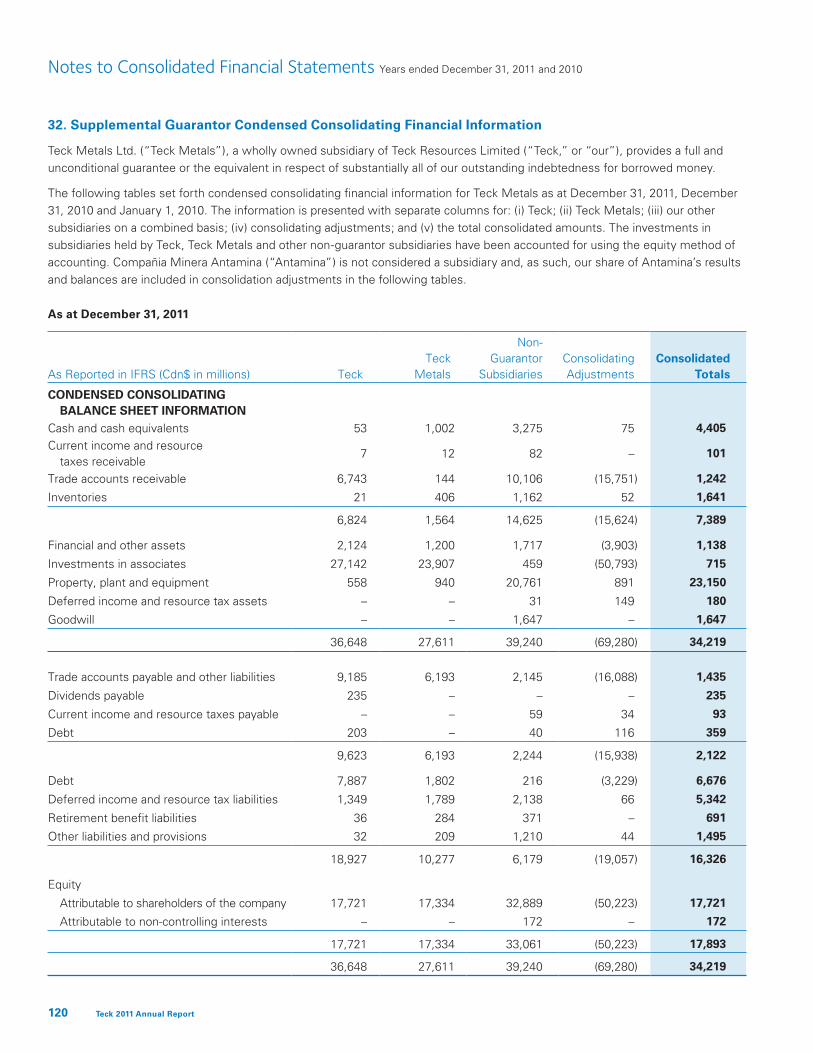
120 Teck 2011 Annual Report
Notes to Consolidated Financial Statements Years ended December 31, 2011 and 2010
32. Supplemental Guarantor Condensed Consolidating Financial Information
Teck Metals Ltd. (“Teck Metals”), a wholly owned subsidiary of Teck Resources Limited (“Teck,” or “our”), provides a full and unconditional guarantee or the equivalent in respect of substantially all of our outstanding indebtedness for borrowed money.
The following tables set forth condensed consolidating financial information for Teck Metals as at December 31, 2011, December 31, 2010 and January 1, 2010. The information is presented with separate columns for: (i) Teck; (ii) Teck Metals; (iii) our other subsidiaries on a combined basis; (iv) consolidating adjustments; and (v) the total consolidated amounts. The investments in subsidiaries held by Teck, Teck Metals and other non-guarantor subsidiaries have been accounted for using the equity method of accounting. Compañia Minera Antamina (“Antamina”) is not considered a subsidiary and, as such, our share of Antamina’s results and balances are included in consolidation adjustments in the following tables.
As at December 31, 2011
As Reported in IFRS (Cdn$ in millions)
Teck
Teck
Metals
Non-Guarantor
Subsidiaries
ConsolidatingAdjustments
Consolidated
Totals
CONDENSED CONSOLIDATING BALANCE SHEET INFORMATION
Cash and cash equivalents 53 1,002 3,275 75 4,405Current income and resource
taxes receivable7 12 82 – 101
Trade accounts receivable 6,743 144 10,106 (15,751) 1,242
Inventories 21 406 1,162 52 1,641
6,824 1,564 14,625 (15,624) 7,389
Financial and other assets 2,124 1,200 1,717 (3,903) 1,138
Investments in associates 27,142 23,907 459 (50,793) 715
Property, plant and equipment 558 940 20,761 891 23,150
Deferred income and resource tax assets – – 31 149 180
Goodwill – – 1,647 – 1,647
36,648 27,611 39,240 (69,280) 34,219
Trade accounts payable and other liabilities 9,185 6,193 2,145 (16,088) 1,435
Dividends payable 235 – – – 235
Current income and resource taxes payable – – 59 34 93
Debt 203 – 40 116 359
9,623 6,193 2,244 (15,938) 2,122
Debt 7,887 1,802 216 (3,229) 6,676
Deferred income and resource tax liabilities 1,349 1,789 2,138 66 5,342
Retirement benefit liabilities 36 284 371 – 691
Other liabilities and provisions 32 209 1,210 44 1,495
18,927 10,277 6,179 (19,057) 16,326
Equity
Attributable to shareholders of the company 17,721 17,334 32,889 (50,223) 17,721
Attributable to non-controlling interests – – 172 – 172
17,721 17,334 33,061 (50,223) 17,893
36,648 27,611 39,240 (69,280) 34,219

121
Year Ended December 31, 2011
As Reported in IFRS (Cdn$ in millions)
Teck
Teck
Metals
Non-Guarantor
Subsidiaries
ConsolidatingAdjustments
Consolidated
Totals
CONDENSED CONSOLIDATING STATEMENT OF INCOME INFORMATION
Revenues 142 2,002 8,821 549 11,514
Cost of sales (108) (1,793) (4,752) 16 (6,637)
Gross profit 34 209 4,069 565 4,877
Other operating expenses
General and administration (90) (15) (19) (1) (125)
Exploration (18) (1) (85) (1) (105)
Research and development (4) (13) – – (17)
Other operating income (expense) 18 13 (104) (101) (174)
Profit (loss) from operations (60) 193 3,861 462 4,456
Finance income 117 136 56 (196) 113
Finance expense (578) (172) (77) 232 (595)
Non-operating income (expense) (169) 211 (41) 196 197
Share of profit (losses) of associates 3,538 2,013 388 (5,944) (5)
Profit before tax 2,848 2,381 4,187 (5,250) 4,166
Provision for income and resource taxes (180) (513) (541) (164) (1,398)
Profit for the year 2,668 1,868 3,646 (5,414) 2,768
Profit attributable to:
Shareholders of the company 2,668 1,868 3,546 (5,414) 2,668
Non-controlling interests – – 100 – 100
Profit for the year 2,668 1,868 3,646 (5,414) 2,768

122 Teck 2011 Annual Report
Notes to Consolidated Financial Statements Years ended December 31, 2011 and 2010
32. Supplemental Guarantor Condensed Consolidating Financial Information (continued)
Year Ended December 31, 2011
As Reported in IFRS (Cdn$ in millions)
Teck
Teck
Metals
Non-Guarantor
Subsidiaries
ConsolidatingAdjustments
Consolidated
Totals
CONDENSED CONSOLIDATING STATEMENT OF CASH FLOWS INFORMATION
Operating activities (532) 488 6,031 (2,030) 3,957
Investing activities
Purchase of property, plant and equipment (77) (51) (936) (172) (1,236)Purchase of financial investments and
other assets (378) (5) (80) – (463)Proceeds from the sale of investments and
other assets 47 17 225 – 289
Decrease in restricted cash – – – – –
(408) (39) (791) (172) (1,410)
Financing activities
Issuance of debt 1,907 – – – 1,907
Repayment of debt (54) – (42) (8) (104)
Debt interest paid (370) – (5) (2) (377)Issuance of Class B subordinate
voting shares 4 – – – 4Purchase and cancellation of Class B
subordinate voting shares (171) – – – (171)
Dividends paid (354) – – – (354)
Distributions to non-controlling interests – – (54) – (54)
Interdivision distributions – 420 (2,648) 2,228 –
962 420 (2,749) 2,218 851
Effect of exchange rate changes on cash and cash equivalents
16 138 20 1 175
Increase in cash and cash equivalents 38 1,007 2,511 17 3,573
Cash and cash equivalents at beginning of year 15 (5) 764 58 832
Cash and cash equivalents at end of year 53 1,002 3,275 75 4,405

123
As at December 31, 2010
As Reported in IFRS (Cdn$ in millions)
Teck
Teck
Metals
Non-Guarantor
Subsidiaries
ConsolidatingAdjustments
Consolidated
Totals
CONDENSED CONSOLIDATING BALANCE SHEET INFORMATION
Cash and cash equivalents 15 (5) 764 58 832Current income and resource
taxes receivable 4 5 7 – 16Trade accounts receivable 5,935 102 7,267 (12,226) 1,078
Inventories 23 408 908 35 1,374
5,977 510 8,946 (12,133) 3,300
Financial and other assets 1,740 1,151 3,416 (5,502) 805
Investments in associates 23,347 21,893 338 (44,919) 659
Property, plant and equipment 517 903 20,146 743 22,309
Deferred income and resource tax assets – – 17 328 345
Goodwill – – 1,637 – 1,637
31,581 24,457 34,500 (61,483) 29,055
Trade accounts payable and other liabilities 6,446 5,658 1,553 (12,310) 1,347
Dividends payable 177 – – – 177
Current income and resource taxes payable 2 17 130 12 161
Debt – – 38 27 65
6,625 5,675 1,721 (12,271) 1,750
Debt 7,922 1,765 206 (5,010) 4,883
Deferred income and resource tax liabilities 1,215 1,347 2,256 81 4,899
Retirement benefit liabilities 26 239 275 2 542
Other liabilities and provisions 20 146 894 26 1,086
15,808 9,172 5,352 (17,172) 13,160
Equity
Attributable to shareholders of the company 15,773 15,285 29,026 (44,311) 15,773
Attributable to non-controlling interests – – 122 – 122
15,773 15,285 29,148 (44,311) 15,895
31,581 24,457 34,500 (61,483) 29,055

124 Teck 2011 Annual Report
Notes to Consolidated Financial Statements Years ended December 31, 2011 and 2010
32. Supplemental Guarantor Condensed Consolidating Financial Information (continued)
Year Ended December 31, 2010
As Reported in IFRS (Cdn$ in millions)
Teck
Teck
Metals
Non-Guarantor
Subsidiaries
ConsolidatingAdjustments
Consolidated
Totals
CONDENSED CONSOLIDATING STATEMENT OF INCOME INFORMATION
Revenues 135 1,476 7,201 411 9,223
Cost of sales (99) (1,384) (4,207) (11) (5,701)
Gross profit 36 92 2,994 400 3,522
Other operating expenses
General and administration (95) (34) (8) – (137)
Exploration (11) – (45) – (56)
Research and development (2) (10) (8) – (20)
Other operating income (expense) (788) 591 214 623 640
Profit (loss) from operations (860) 639 3,147 1,023 3,949
Finance income 86 130 43 (164) 95
Finance expense (735) (157) (25) 226 (691)
Non-operating income (expense) 582 53 6 (1,059) (418)
Share of profit (losses) of associates 2,726 1,874 320 (4,925) (5)
Profit before tax 1,799 2,539 3,491 (4,899) 2,930
Provision for income and resource taxes 21 (431) (440) (144) (994)
Profit for the year 1,820 2,108 3,051 (5,043) 1,936
Profit attributable to:
Shareholders of the company 1,820 2,108 2,935 (5,043) 1,820
Non-controlling interests – – 116 – 116
Profit for the year 1,820 2,108 3,051 (5,043) 1,936

125
Year Ended December 31, 2010
As Reported in IFRS (Cdn$ in millions)
Teck
Teck
Metals
Non–Guarantor
Subsidiaries
ConsolidatingAdjustments
Consolidated
Totals
CONDENSED CONSOLIDATING STATEMENT OF CASH FLOWS INFORMATION
Operating activities 3,353 470 3,557 (4,106) 3,274
Investing activities
Purchase of property, plant and equipment (67) (48) (626) (69) (810)Purchase of financial investments and
other assets (39) – (7) – (46)Proceeds from the sale of investments
and other assets 148 826 265 – 1,239 Decrease in restricted cash 91 – – – 91
133 778 (368) (69) 474
Financing activities
Issuance of debt 1,537 – – 23 1,560
Repayment of debt (5,019) – (35) – (5,054)
Debt interest paid (525) – (7) (1) (533)Issuance of Class B subordinate
voting shares 33 – – – 33Purchase and cancellation of Class B
subordinate voting shares – – – – –Dividends paid (118) – – – (118)
Distributions to non-controlling interests – – (89) – (89)
Interdivision distributions – (1,310) (2,839) 4,149 –
(4,092) (1,310) (2,970) 4,171 (4,201)Effect of exchange rate changes on cash
and cash equivalents – – (42) (4) (46)
Increase (decrease) in cash and cash equivalents (606) (62) 177 (8) (499)
Cash and cash equivalents at beginning of year 621 57 587 66 1,331
Cash and cash equivalents at end of year 15 (5) 764 58 832
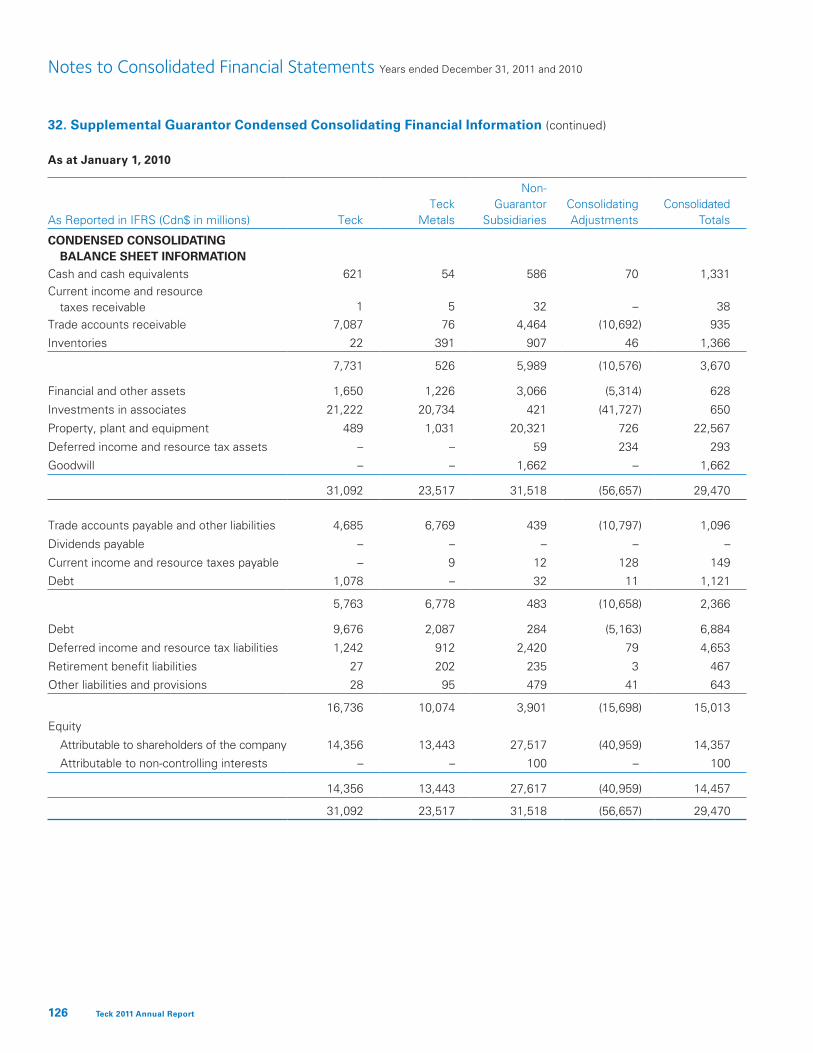
126 Teck 2011 Annual Report
Notes to Consolidated Financial Statements Years ended December 31, 2011 and 2010
32. Supplemental Guarantor Condensed Consolidating Financial Information (continued)
As at January 1, 2010
As Reported in IFRS (Cdn$ in millions)
Teck
Teck
Metals
Non-Guarantor
Subsidiaries
ConsolidatingAdjustments
Consolidated
Totals
CONDENSED CONSOLIDATING BALANCE SHEET INFORMATION
Cash and cash equivalents 621 54 586 70 1,331Current income and resource
taxes receivable 1 5 32 – 38Trade accounts receivable 7,087 76 4,464 (10,692) 935
Inventories 22 391 907 46 1,366
7,731 526 5,989 (10,576) 3,670
Financial and other assets 1,650 1,226 3,066 (5,314) 628
Investments in associates 21,222 20,734 421 (41,727) 650
Property, plant and equipment 489 1,031 20,321 726 22,567
Deferred income and resource tax assets – – 59 234 293
Goodwill – – 1,662 – 1,662
31,092 23,517 31,518 (56,657) 29,470
Trade accounts payable and other liabilities 4,685 6,769 439 (10,797) 1,096
Dividends payable – – – – –
Current income and resource taxes payable – 9 12 128 149
Debt 1,078 – 32 11 1,121
5,763 6,778 483 (10,658) 2,366
Debt 9,676 2,087 284 (5,163) 6,884
Deferred income and resource tax liabilities 1,242 912 2,420 79 4,653
Retirement benefit liabilities 27 202 235 3 467
Other liabilities and provisions 28 95 479 41 643
16,736 10,074 3,901 (15,698) 15,013
Equity
Attributable to shareholders of the company 14,356 13,443 27,517 (40,959) 14,357
Attributable to non-controlling interests – – 100 – 100
14,356 13,443 27,617 (40,959) 14,457
31,092 23,517 31,518 (56,657) 29,470
127
Board of Directors
Norman B. Keevil Chairman of the Board | Director Since: 1963 (1)
Warren S. R. Seyffert Q.C. Deputy Chairman and Lead Director | Director Since: 1989 (1) (2) (3) (5) (6)
Donald R. Lindsay President and Chief Executive Officer | Director Since: 2005 (1)
Ichiro Abe | Director: 1998 to 2002, 2011 (6) (7)
Mayank M. Ashar | Director Since: 2007 (2) (6) (7)
J. Brian Aune | Director Since: 1995 (1) (3) (4)
Jalynn H. Bennett | Director Since: 2005 (3) (4) (5)
Hugh J. Bolton | Director Since: 2001 (2) (5)
Felix P. Chee | Director Since: 2010 (4)
Jack L. Cockwell | Director Since: 2009 (7)
Norman B. Keevil III | Director Since: 1997 (4) (6) (7)
Takashi Kuriyama | Director Since: 2006 (6) (7)
Janice G. Rennie | Director Since: 2007 (2) (3) (5)
Chris M. T. Thompson | Director Since: 2003 (1) (2) (3) (5) (7)
NOTES:
(1) Member of the Executive Committee
(2) Member of the Audit Committee
(3) Member of the Compensation Committee
(4) Member of the Pension Committee
(5) Member of the Corporate Governance and Nominating Committee
(6) Member of the Safety and Sustainability Committee
(7) Member of the Reserves Committee
More information on our directors can be found in our most recent Annual Information Form,
or Management Proxy Circular, which are available on our website at www.teck.com, or on the
Canadian Securities Administrators website at www.sedar.com and on the EDGAR section of
the SEC’s website at www.sec.gov.

128 Teck 2011 Annual Report128 Teck 2011 Annual Report

129129
Teck’s Board of Directors: (back, left to right) Jack Cockwell, Hugh Bolton, Mayank Ashar, Brian Aune, Norman Keevil III, Chris Thompson, Felix Chee, Janice Rennie; (front, left to right) Jalynn Bennett, Ichiro Abe, Norman Keevil, Donald Lindsay, Warren Seyffert, Takashi Kuriyama.
130 Teck 2011 Annual Report
Officers
Norman B. Keevil | Chairman of the Board
Warren S. R. Seyffert Q.C. | Deputy Chairman and Lead Director
Donald R. Lindsay | President and Chief Executive Officer
Michael E. Agg | Senior Vice President
Roger J. Higgins | Senior Vice President, Copper
Douglas H. Horswill | Senior Vice President
Ian C. Kilgour | Senior Vice President, Coal
Ronald A. Millos | Senior Vice President, Finance and Chief Financial Officer
Raymond A. Reipas | Senior Vice President, Energy
Peter C. Rozee | Senior Vice President, Commercial and Legal Affairs
Robert G. Scott | Senior Vice President, Zinc
Marcia M. Smith | Senior Vice President, Sustainability and External Affairs
Ronald J. Vance | Senior Vice President, Corporate Development
Timothy C. Watson | Senior Vice President, Project Development
Michael J. Allan | Vice President, Engineering
Dale E. Andres | Vice President, Copper Strategy and North American Operations
David R. Baril | Vice President, Copper Chile Operations
Robert W. Bell | Vice President and Chief Commercial Officer, Coal
Anne J. Chalmers | Vice President, Risk and Security
Fred S. Daley | Vice President, Exploration
Karen L. Dunfee | Corporate Secretary
William A. Fleming | Vice President, Coal Operations and Engineering
Réal Foley | Vice President, Coal Marketing

131
Graham P. Foyle-Twining | Vice President, Human Resources
John F. Gingell | Vice President and Corporate Controller
Ralph J. Lutes | Vice President, Asian Affairs and Chief Representative, China
David R. Parker | Vice President, Sustainability
Douglas J. Powrie | Vice President, Tax
Robin B. Sheremeta | Vice President, Health and Safety Leadership
Andrew A. Stonkus | Vice President, Base Metals Marketing
John F. H. Thompson | Vice President, Technology and Development
Gregory A. Waller | Vice President, Investor Relations and Strategic Analysis
Scott R. Wilson | Vice President and Treasurer
Anthony A. Zoobkoff | Senior Counsel and Assistant Secretary
More information on our directors and officers can be found in our most recent Annual Information
Form, or Management Proxy Circular, which are available on our website at
www.teck.com, or on the Canadian Securities Administrators website at www.sedar.com
and on the EDGAR section of the SEC’s website at www.sec.gov.

132 Teck 2011 Annual Report
Corporate Information
2011 Share Prices and Trading Volume
Class B subordinate voting shares-TSX-C$/share
High Low Close Volume
Q1 $ 64.62 $ 47.50 $ 51.39 191,384,478
Q2 $ 57.35 $ 41.96 $ 49.02 194,838,614
Q3 $ 51.38 $ 29.60 $ 30.92 187,594,976
Q4 $ 42.79 $ 27.39 $ 35.91 190,238,960
764,057,028
Class B subordinate voting shares-NYSE-US$/share
High Low Close Volume
Q1 $ 65.37 $ 47.96 $ 53.02 253,728,347
Q2 $ 59.75 $ 42.84 $ 50.74 233,222,262
Q3 $ 53.89 $ 28.33 $ 29.19 263,490,182
Q4 $ 43.05 $ 25.76 $ 35.19 253,145,179
1,003,585,970
Class A common shares-TSX-C$/share
High Low Close Volume
Q1 $ 65.31 $ 48.50 $ 52.25 311,793
Q2 $ 57.80 $ 43.00 $ 49.45 214,301
Q3 $ 52.35 $ 30.69 $ 31.94 205,882
Q4 $ 44.00 $ 27.53 $ 37.38 156,433
888,409

Transfer AgentsInquiries regarding change of address, stock transfer, registered shareholdings, dividends or lost certificates should be directed to our Registrar and Transfer Agent:
CIBC Mellon Trust Company1600-1066 West Hastings StreetVancouver, British ColumbiaV6E 3X1
CIBC Mellon Trust Company provides an Answerline Service for the convenience of shareholders:
Toll-free in Canada and the U.S.1.800.387.0825Outside Canada and the U.S.1.416.643.5500Email: [email protected]
ComputershareP.O. Box 358015Pittsburgh, Pennsylvania15252-8015Or:480 Washington BoulevardJersey City, New Jersey07310-19001.800.589.9836Email: [email protected]: www.bnymellon.com
AuditorPricewaterhouseCoopers LLPChartered AccountantsSuite 700250 Howe StreetVancouver, British ColumbiaV6C 3S7
Annual Information FormWe prepare an Annual Information Form (AIF) that is filed with the securities commissions or similar bodies in all the provinces of Canada. Copies of our AIF and annual and quarterly reports are available on request or on our website at www.teck.com, on the Canadian Securities Administrators website at www.sedar.com and on the EDGAR section of the SEC’s website at www.sec.gov.
Stock ExchangesOur Class A common and Class B subordinate voting shares are listed on the Toronto Stock Exchange under the symbols TCK.A and TCK.B respectively.
Our Class B subordinate voting shares are listed on the New York Stock Exchange under the symbol TCK.
Dividends on Class A and B sharesAmount per share Payment Date$0.30 July 5, 2011$0.40 January 3, 2012
These dividends are eligible for both the federal and provincial enhanced dividend tax credits.
Shares Outstanding at December 31, 2011Class A common shares 9,353,470Class B subordinate voting shares 577,204,051
The Board of Directors and the management of Teck are committed to leadership in corporate governance. As a Canadian reporting issuer with securities listed on the Toronto Stock Exchange (TSX), we have in place a system of corporate governance practices that meets or exceeds all applicable Canadian requirements.
Teck is classified as a foreign private issuer in connection with its listing on the NYSE and as a result, many of the corporate governance rules in the NYSE Listed Company Manual (NYSE Corporate Governance Rules) that apply to United States (U.S.) domestic companies do not apply to us. The differences between our practices and the NYSE Rules are not material or are more a matter of form than substance.
Shareholder RelationsKaren L. Dunfee, Corporate Secretary
Annual MeetingOur annual meeting of shareholders will be held at 11:00 a.m. on Wednesday, April 25, 2012, in the Waterfront Ballroom, Fairmont Waterfront Hotel, 900 Canada Place Way, Vancouver, British Columbia.

Teck Resources LimitedSuite 3300, 550 Burrard StreetVancouver, British Columbia, Canada V6C 0B3+1.604.699.4000 Tel+1.604.699.4750 Faxwww.teck.com
Setting Possibilities in Motion