Global MRI Market Size, Share and Forecast 2026 | TechSci Research
TechSci Research
http://www.marketresearch.com/TechSci Research -v3895/
Publisher Sample
Phone: 800.298.5699 (US) or +1.240.747.3093 or +1.240.747.3093 (Int'l)
Hours: Monday - Thursday: 5:30am - 6:30pm EST
Fridays: 5:30am - 5:30pm EST
Email: [email protected]
MarketResearch.com
R e s e a r c h M e t h o d o l o g y
© TechSci Research
7
Baseline Methodology :
For the study, TechSci Research gathered information through secondary research surveys with Power
Management IC distributors and counter validated that information using company financial statements and
other reliable secondary sources. We also put through exhaustive search of credible paid databases such as
Business Week, Factiva, Hoovers, etc. including our internal database. Our team of analysts has then
prudently evaluated all the collected information and presented the same in chronological order to depict a
meaningful and clear picture of the India power management IC market.
While compiling the data, we have also cross checked all the collected information from multiple sources and
data warehouses, so as to present the most accurate and precise information of the concerned industry.
Sources :
IESA (Indian Electronic Semiconductor Association), Department of Electronics and Information
Technology, News Articles, Company annual reports and paid data sources such as Factiva, LexisNexis, etc.
Companies InterviewedTexas Instruments, STMicroelectronics and technical experts fromsemiconductor Industry.
*Note: The year 2010 represents FY10 (1 April 2009 to 31 March 2010) throughout the report and the same goes for all the years.
* Dollar exchange rate is kept constant at 1USD= INR60 for the forecast period 2015-2020.

© TechSci Research
8
Global Power Management IC market XXXXX to USD XXX billion in 2012 from USD XXX billion in 2011 due to
XXXXXX demand for consumer electronics in the US and Europe; XXXXXX prices and XXXXXX in energy initiatives in
Asia; and the 2011 earthquake that Japan witnessed was another major reason for the XXXXX of the market.
Manufacturing was halted in many parts of Japan, which is home to many semiconductor plants.
However, the market registered a XXXXXX during 2010-14, growing at a CAGR of around X%. XXXXX migration of
enterprises from physical data storage structure to cloud is a XXXXX demand XXXXX for Power Management ICs
since cloud storage requires installation of a XXXX number of servers.
G l o b a l P o w e r M a n a g e m e n t I C M a r k e t O u t l o o k
10.0020.00
30.0040.00
50.0060.00
70.0080.00
90.00100.00
110.00
2010 2011 2012 2013 2014 2015E 2016F 2017F 2018F 2019F 2020F
CAGR X%CAGR X%
Figure 1: Global Power Management IC Market Size, By Value, 2010 – 2020F (USD Billion)
Source: XXXXXX Note: These are dummy figures; please purchase our report for actual data

© TechSci Research
9
India semiconductor market generated revenues worth USD XXX billion in 2010, has XXXXX steadily at a CAGR of
X% during 2010-2014. XXXXXX demand for portable devices such as smartphones, tablets and consumer devices
has contributed XXXXX to the XXXXXXX demand for semiconductors in India.
Share of India is estimated to be less than X% in global semiconductor market. India semiconductor market is
forecast to generate USD XXX billion in 2020.
I n d i a S e m i c o n d u c t o r M a r k e t O u t l o o k
1020
3040
5060
70 7080
90100
2010 2011 2012 2013 2014 2015E 2016F 2017F 2018F 2019F 2020F
CAGR X%CAGR X%
Figure 2: India Semiconductor Market Size, By Value, 2010 – 2020F (USD Billion)
Source: XXXXXX Note: These are dummy figures; please purchase our report for actual data
© TechSci Research
10
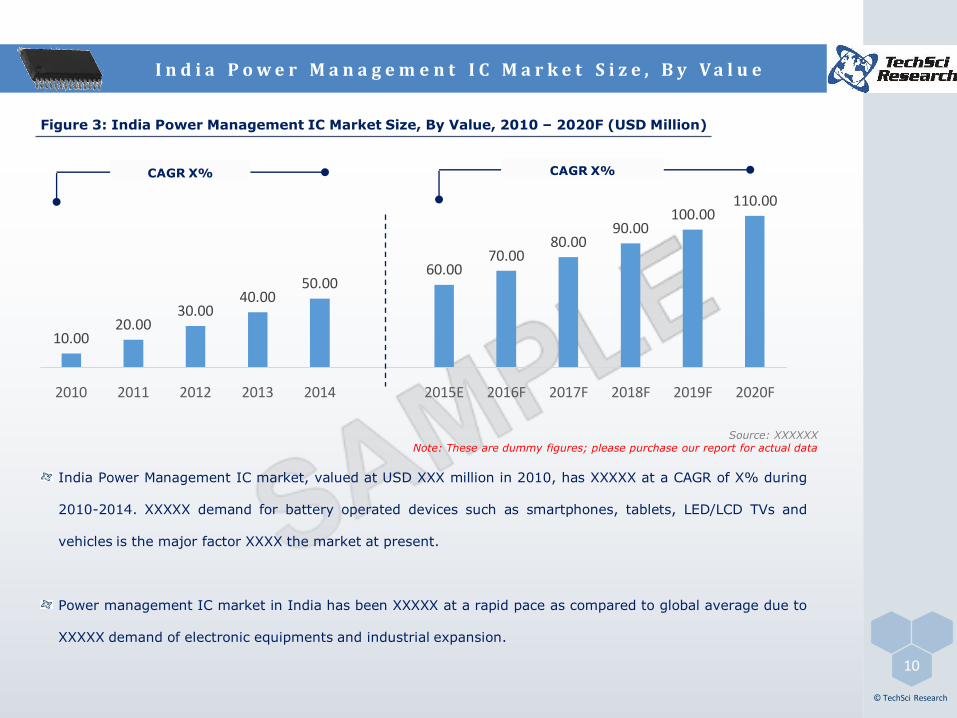
I n d i a P o w e r M a n a g e m e n t I C M a r k e t S i z e , B y V a l u e
India Power Management IC market, valued at USD XXX million in 2010, has XXXXX at a CAGR of X% during
2010-2014. XXXXX demand for battery operated devices such as smartphones, tablets, LED/LCD TVs and
vehicles is the major factor XXXX the market at present.
Power management IC market in India has been XXXXX at a rapid pace as compared to global average due to
XXXXX demand of electronic equipments and industrial expansion.
Figure 3: India Power Management IC Market Size, By Value, 2010 – 2020F (USD Million)
Source: XXXXXX Note: These are dummy figures; please purchase our report for actual data
10.0020.00
30.0040.00
50.0060.00
70.0080.00
90.00100.00
110.00
2010 2011 2012 2013 2014 2015E 2016F 2017F 2018F 2019F 2020F
CAGR X%CAGR X%

© TechSci Research
11
Power management IC is amongst the most prominent segment in semiconductor market. It has been
segmented into four types of ICs namely voltage regulator, battery management IC, motor control IC and AC/DC
converter. The Others segment include ICs such as ASSP IC (Application Specific Standard Products), gate
driver, LED driver, etc.
XXXXX and XXXXXXX are amongst the most prominent ICs in Power IC market. These are used to maintain
constant voltage level in XXXXXX and battery management IC are used for managing power supply in XXXXX
electronic devices.
I n d i a P o w e r M a n a g e m e n t I C M a r k e t S h a r e , B y T y p e
Voltage Regulator20.00%
Battery Managemnt
IC20.00%
Motor control IC
20.00%
AC/DC convertor 20.00%
Others20.00%
2014
Figure 4: India Power Management IC Market Share, By Type, By Value, 2014 & 2020F
Source: XXXXXX Note: These are dummy figures; please purchase our report for actual data
Voltage Regulator20.00%
Battery Managemnt
IC20.00%
Motor control IC
20.00%
AC/DC convertor 20.00%
Others20.00%
2020F

© TechSci Research
12
Voltage Regulator IC
Voltage regulators are the XXXXX contributors in India power management IC revenues. Voltage regulators
includes Linear Regulator, Switching Regulator and Voltage Reference. These are used to maintain constant
voltage level in circuits. This segment accounted for about X% market share in India power management IC
market in 2014. However, the market share of voltage regulator is expected to XXXXXX to X% by 2020. This
has been a consequence of XXXXXX of other segment of power management IC.
I n d i a P o w e r M a n a g e m e n t I C M a r k e t S h a r e , B y T y p e
Figure 5: India Voltage Regulator IC Market Size, By Value, 2010-20F (USD Million)
10.0020.00
30.0040.00
50.0060.00
70.0080.00
90.00100.00
110.00
2010 2011 2012 2013 2014 2015E 2016F 2017F 2018F 2019F 2020F
CAGR X%
CAGR X%
Source: XXXXXX Note: These are dummy figures; please purchase our report for actual data

© TechSci Research
13
Battery Management IC
Battery management ICs accounted for around X% market share in the overall PMIC market in 2014 and this
share is projected to XXXXXXX to X% by 2020. The demand for battery supported equipment is considered to
be the major factor XXXXX of battery management ICs. Integration of high-end features in portable devices
like processors, high-end cameras and high pixel density displays require enhanced power. This, in
turn, creates the requirement for power management ICs for optimized battery performance. Battery
management ICs are also implemented in XXXXXXXX.
I n d i a P o w e r M a n a g e m e n t I C M a r k e t S h a r e , B y T y p e
Figure 6: India Battery Management IC Market Size, By Value, 2010-20F (USD Million)
10.0020.00
30.0040.00
50.0060.00
70.0080.00
90.00100.00
110.00
2010 2011 2012 2013 2014 2015E 2016F 2017F 2018F 2019F 2020F
CAGR X%CAGR X%
Source: XXXXXX Note: These are dummy figures; please purchase our report for actual data

© TechSci Research
14
Motor Control IC
Motor control IC accounted for a market share of X% in value terms in 2014, which is expected to XXXX
to X% by 2020. Motor control ICs find application in automotive, industrial and consumer electronics.
Implementation of power windows and electric power steering in cars, introduction of XXXXX and XXXXXX
demand for consumer electronic equipment such as air conditioners, microwave oven, washing machines
is expected to XXXXXX the demand for motor control ICs during the forecast period.
I n d i a P o w e r M a n a g e m e n t I C M a r k e t S h a r e , B y T y p e
Figure 7: India Motor Control IC Market Size, By Value, 2010-20F (USD Million)
10.0020.00
30.0040.00
50.0060.00
70.0080.00
90.00100.00
110.00
2010 2011 2012 2013 2014 2015E 2016F 2017F 2018F 2019F 2020F
CAGR X%
CAGR X%
Source: XXXXXX Note: These are dummy figures; please purchase our report for actual data

© TechSci Research
15
AC/DC Converter
AC/DC converters XXXXXX power consumption and XXXXX system efficiency. They include power factor
correctors, PWM controllers and offline converters. These convertors are majorly installed in XXXXX
equipment's. AC-DC converter accounted for about X% market share in the total PMIC market in 2014
and is expected to XXXXX to X% due to rise in demand of consumer electronics.
I n d i a P o w e r M a n a g e m e n t I C M a r k e t S h a r e , B y T y p e
Figure 8: India AC/DC Convertor Market Size, By Value, 2010-20F (USD Million)
10.0020.00
30.0040.00
50.0060.00
70.0080.00
90.00100.00
110.00
2010 2011 2012 2013 2014 2015E 2016F 2017F 2018F 2019F 2020F
CAGR X%CAGR X%
Source: XXXXXX Note: These are dummy figures; please purchase our report for actual data

© TechSci Research
16
Figure 9: India Power Management IC Market Share, By Application, By Value, 2014 & 2020F
Source: XXXXXX Note: These are dummy figures; please purchase our report for actual data
Others
Others segment includes military, aerospace, medical, etc., which contributed around X% to the overall PMIC
market and is expected to XXXXX due to technological advancement in these sectors. Airplanes and medical
facilities are becoming XXXXXX with XXXXX systems such as control panels. XXXXXXX of these sectors is
expected to XXXXX the demand of PMIC from these sectors.
I n d i a P o w e r M a n a g e m e n t I C M a r k e t S h a r e , B y A p p l i c a t i o n
Mobile devices, 14.0
0%
IT & OA, 14.00%
Networking & Telecommunications, 14.0
0%
Consumer Electronics,
17.00%
Industrial, 14.00%
Automotive, 14.00%
Others, 16.00%
2014
Mobile devices, 14.0
0%
IT & OA, 14.00%
Networking & Telecommunications, 14.0
0%
Consumer Electronics,
17.00%
Industrial, 14.00%
Automotive, 14.00%
Others, 16.00%
2014
© TechSci Research
17
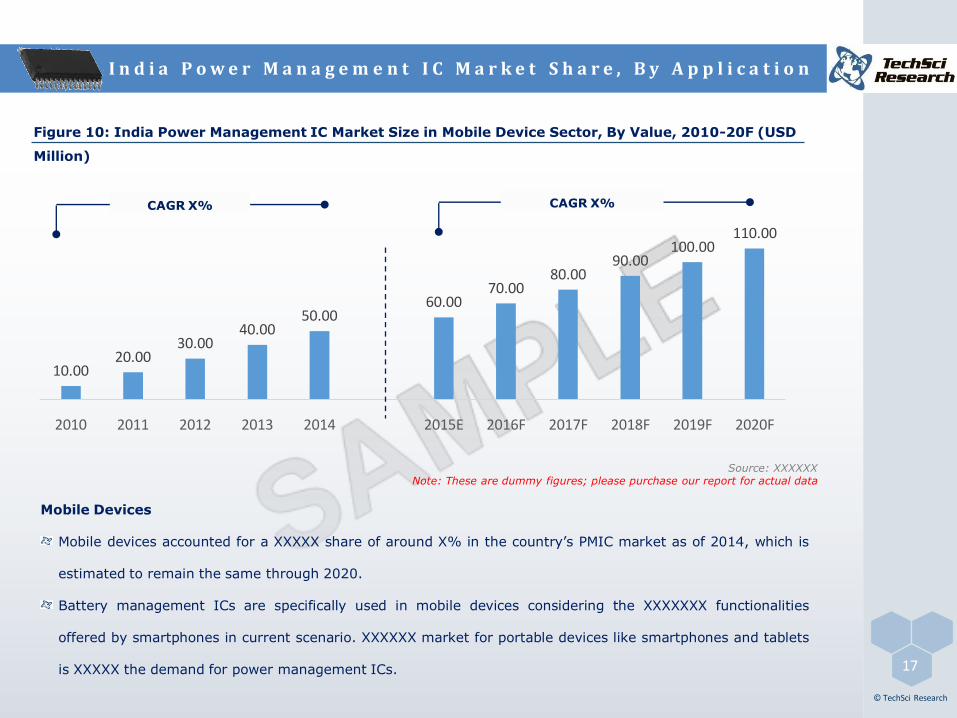
Figure 10: India Power Management IC Market Size in Mobile Device Sector, By Value, 2010-20F (USD
Million)
Source: XXXXXX Note: These are dummy figures; please purchase our report for actual data
Mobile Devices
Mobile devices accounted for a XXXXX share of around X% in the country’s PMIC market as of 2014, which is
estimated to remain the same through 2020.
Battery management ICs are specifically used in mobile devices considering the XXXXXXX functionalities
offered by smartphones in current scenario. XXXXXX market for portable devices like smartphones and tablets
is XXXXX the demand for power management ICs.
I n d i a P o w e r M a n a g e m e n t I C M a r k e t S h a r e , B y A p p l i c a t i o n
10.0020.00
30.0040.00
50.0060.00
70.0080.00
90.00100.00
110.00
2010 2011 2012 2013 2014 2015E 2016F 2017F 2018F 2019F 2020F
CAGR X%CAGR X%
© TechSci Research
18
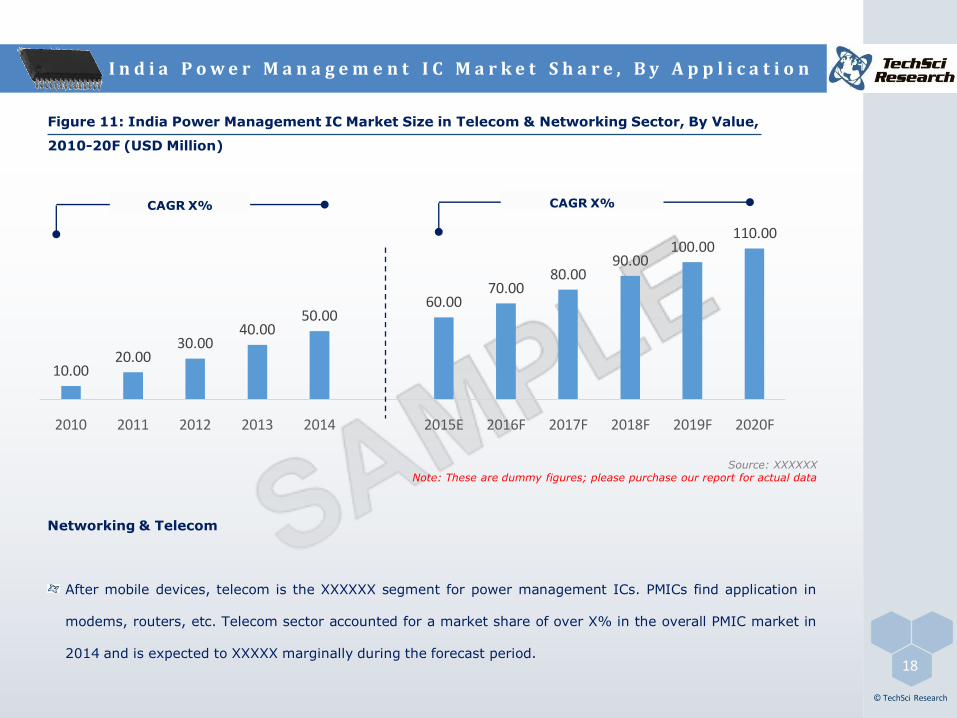
Figure 11: India Power Management IC Market Size in Telecom & Networking Sector, By Value,
2010-20F (USD Million)
Source: XXXXXX Note: These are dummy figures; please purchase our report for actual data
Networking & Telecom
After mobile devices, telecom is the XXXXXX segment for power management ICs. PMICs find application in
modems, routers, etc. Telecom sector accounted for a market share of over X% in the overall PMIC market in
2014 and is expected to XXXXX marginally during the forecast period.
I n d i a P o w e r M a n a g e m e n t I C M a r k e t S h a r e , B y A p p l i c a t i o n
10.0020.00
30.0040.00
50.0060.00
70.0080.00
90.00100.00
110.00
2010 2011 2012 2013 2014 2015E 2016F 2017F 2018F 2019F 2020F
CAGR X%CAGR X%

© TechSci Research
19
Figure 12: India Power Management IC Market Size in IT & OA Sector, By Value, 2010-20F (USD Million)
Source: XXXXXX Note: These are dummy figures; please purchase our report for actual data
Information Technology & Office Automation
Information Technology & Office Automation (IT&OA) accounted for around X% market share of India’s PMIC
market in 2014. IT&OA contribution to the total semiconductor revenue is expected to XXXX from X% in 2014
to X% in 2020 due to consolidation in this sector.
I n d i a P o w e r M a n a g e m e n t I C M a r k e t S h a r e , B y A p p l i c a t i o n
10.0020.00
30.0040.00
50.0060.00
70.0080.00
90.00100.00
110.00
2010 2011 2012 2013 2014 2015E 2016F 2017F 2018F 2019F 2020F
CAGR X%CAGR X%

© TechSci Research
20
Figure 13: India Power Management IC Market Size in Consumer Electronics Sector, By
Value, 2010-20F (USD Million)
Source: XXXXXX Note: These are dummy figures; please purchase our report for actual dataConsumer Electronics
Consumer electronics like air conditioners, washing machine, refrigerator, LED/LCD TV, set top
box, etc., integrate power management ICs for efficient operation. These equipment generally require
XXXXX, XXXXXXX, XXXXXXX and XXXXXX.
In 2014, consumer electronics sector accounted for nearly X% share in India’s PMIC market, which is further
forecast to hold a XXXXXX share through 2020.
I n d i a P o w e r M a n a g e m e n t I C M a r k e t S h a r e , B y A p p l i c a t i o n
10.0020.00
30.0040.00
50.0060.00
70.0080.00
90.00100.00
110.00
2010 2011 2012 2013 2014 2015E 2016F 2017F 2018F 2019F 2020F
CAGR X%CAGR X%
© TechSci Research
21
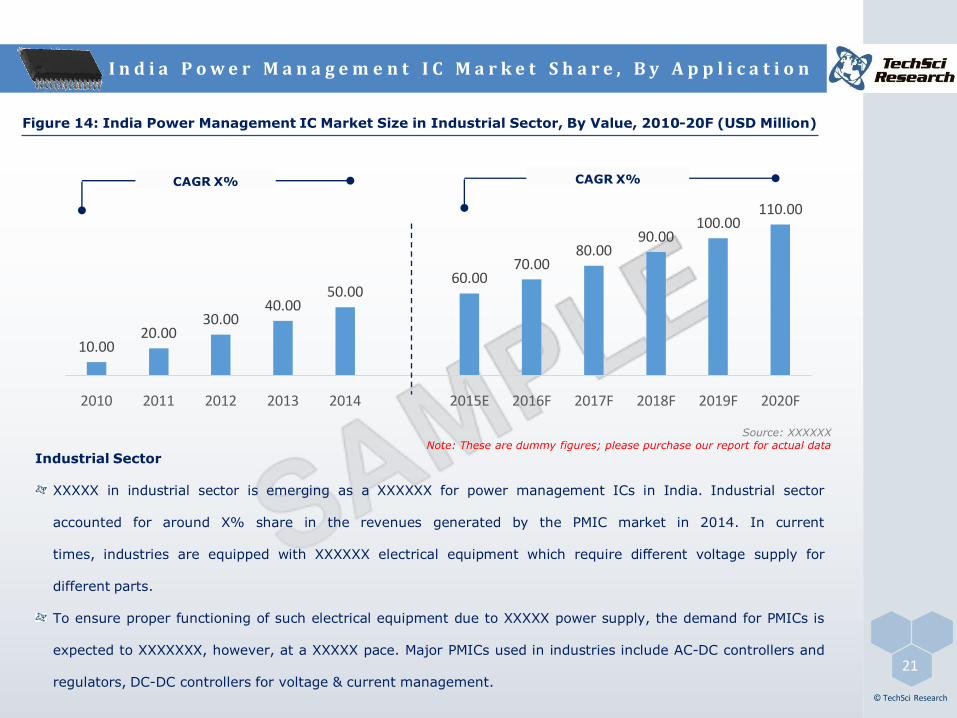
Figure 14: India Power Management IC Market Size in Industrial Sector, By Value, 2010-20F (USD Million)
Source: XXXXXX Note: These are dummy figures; please purchase our report for actual data
Industrial Sector
XXXXX in industrial sector is emerging as a XXXXXX for power management ICs in India. Industrial sector
accounted for around X% share in the revenues generated by the PMIC market in 2014. In current
times, industries are equipped with XXXXXX electrical equipment which require different voltage supply for
different parts.
To ensure proper functioning of such electrical equipment due to XXXXX power supply, the demand for PMICs is
expected to XXXXXXX, however, at a XXXXX pace. Major PMICs used in industries include AC-DC controllers and
regulators, DC-DC controllers for voltage & current management.
I n d i a P o w e r M a n a g e m e n t I C M a r k e t S h a r e , B y A p p l i c a t i o n
10.0020.00
30.0040.00
50.0060.00
70.0080.00
90.00100.00
110.00
2010 2011 2012 2013 2014 2015E 2016F 2017F 2018F 2019F 2020F
CAGR X%CAGR X%
© TechSci Research
22
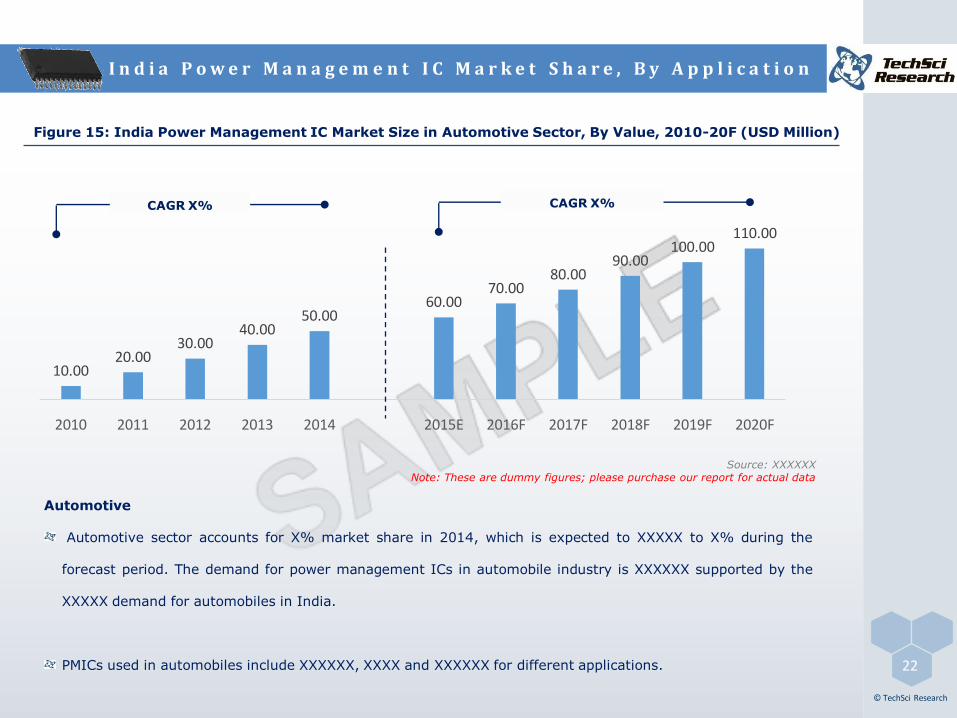
Figure 15: India Power Management IC Market Size in Automotive Sector, By Value, 2010-20F (USD Million)
Source: XXXXXX Note: These are dummy figures; please purchase our report for actual data
Automotive
Automotive sector accounts for X% market share in 2014, which is expected to XXXXX to X% during the
forecast period. The demand for power management ICs in automobile industry is XXXXXX supported by the
XXXXX demand for automobiles in India.
PMICs used in automobiles include XXXXXX, XXXX and XXXXXX for different applications.
I n d i a P o w e r M a n a g e m e n t I C M a r k e t S h a r e , B y A p p l i c a t i o n
10.0020.00
30.0040.00
50.0060.00
70.0080.00
90.00100.00
110.00
2010 2011 2012 2013 2014 2015E 2016F 2017F 2018F 2019F 2020F
CAGR X%CAGR X%
23
© TechSci Research
Source: XXXXXXX
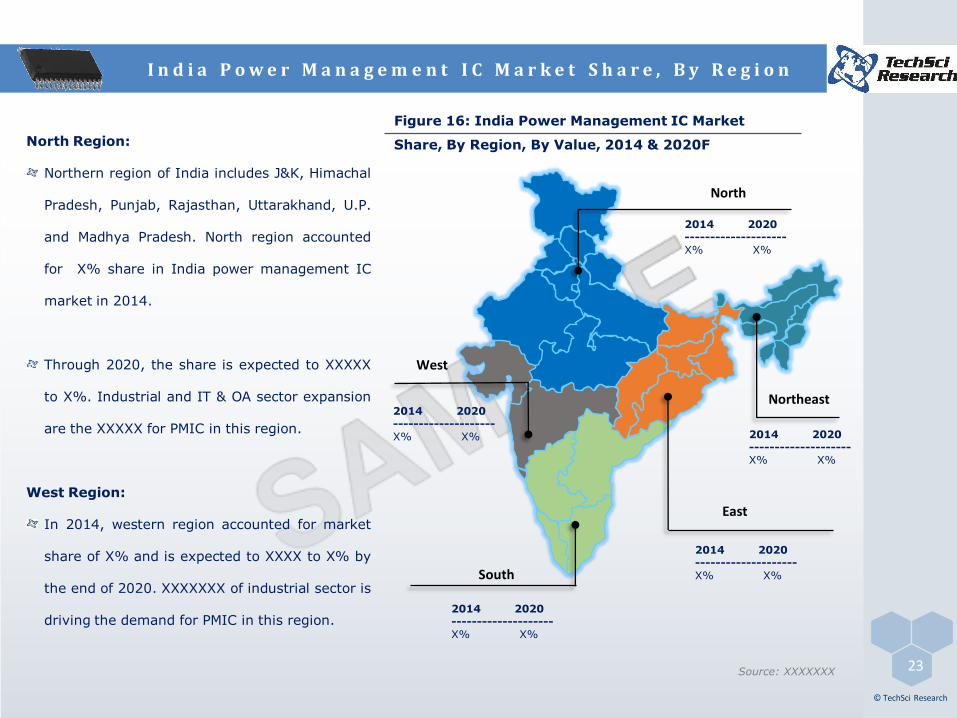
Figure 16: India Power Management IC Market
Share, By Region, By Value, 2014 & 2020FNorth Region:
Northern region of India includes J&K, Himachal
Pradesh, Punjab, Rajasthan, Uttarakhand, U.P.
and Madhya Pradesh. North region accounted
for X% share in India power management IC
market in 2014.
Through 2020, the share is expected to XXXXX
to X%. Industrial and IT & OA sector expansion
are the XXXXX for PMIC in this region.
West Region:
In 2014, western region accounted for market
share of X% and is expected to XXXX to X% by
the end of 2020. XXXXXXX of industrial sector is
driving the demand for PMIC in this region.
I n d i a P o w e r M a n a g e m e n t I C M a r k e t S h a r e , B y R e g i o n
West
2014 2020--------------------X% X%
Northeast
2014 2020--------------------X% X%
East
2014 2020--------------------X% X%South
2014 2020--------------------X% X%
North
2014 2020--------------------X% X%

24
© TechSci Research
Figure 17: India Power Management IC Market Share, By Company, By Value, 2014
I n d i a P o w e r M a n a g e m e n t I C M a r k e t S h a r e , B y C o m p a n y
Texas Instruments,
20.0%
Maxim Integrated, 2
0.0%
STMicroelectronics, 20.0%
ROHM, 20.0%
Others , 20.0%
2014
Texas Instruments
Texas Instruments is currently the XXXXX with a share of X% in India Power management IC market in 2014. TI
India is involved in the development of state-of-the-art solutions for use in
XXXXXXX, XXXXXXX, XXXXXXX, XXXXX, XXXXXXX.
Source: XXXXXX Note: These are dummy figures; please purchase our report for actual data

T e x a s I n s t r u m e n t s I n c o r p o r a t e d
Company Brief
© TechSci Reserch
•Texas Instruments IncorporatedRegistered Name
•1951Founded
•SemiconductorsBusiness Line
•Analog electronics, Calculators, Digital signal processors, Integrated circuits
Product Portfolio
•Mr. Rich Templeton: Chairman, President and CEO
Key Personnel 25
Texas Instruments Inc. (TI) is an
American electronics company that
designs and manufactures XXXXXX , and
operates in over XXX countries
worldwide.
TI has set up a R&D facility in XXXXX in
1985. TI is operating in India by
XXXXXX and XXXXXXX.
TI develops solutions for applications
like wireless handsets, wireless base
stations, video surveillance, IP
phones, set top boxes, High
Performance Analog, etc.

Texas Instruments ranked XXX in
Fortune’s World’s Most Admired
Companies for consecutive XXX years.
Company has spend more than USD XXX
billion in research & development in 2014.
T e x a s I n s t r u m e n t s I n c o r p o r a t e d
© TechSci Reserch
•XXXXXXX
•XXXXXXXMajor Competitors
•XXX manufacturing units in XXX countries
Manufacturing facility
•2014: XXX approximately(worldwide)
No. of Employees
•ISO 9001:2008
•ISO 14001Certification
•12500 TI Boulevard Dallas, Texas–75243, USA
•Tel: 972-995-2011
•Website: http://www.ti.com
Contact Details
Company Brief
26

Revenues (USD million)
Business Revenue Share, By End Use Segment, 2014 Debt-Equity Ratio
T e x a s I n s t r u m e n t s I n c o r p o r a t e d
© TechSci Research
Source: XXXXXX Note: These are dummy figures; please purchase our report for actual data
100
200
300
400
500
2010 2011 2012 2013 2014
100
200
300
400
500
2010 2011 2012 2013 2014
EBITDA (USD million)
10.00
20.00
30.00
40.00
2011 2012 2013 2014
17%
17%
17%17%
17%
15% Industrial
Automotive
Personal electronics Communications equipment Enterprise systems Other 27
Figure 18: Texas Instruments Incorporated, Financial Analysis, 2010-2014
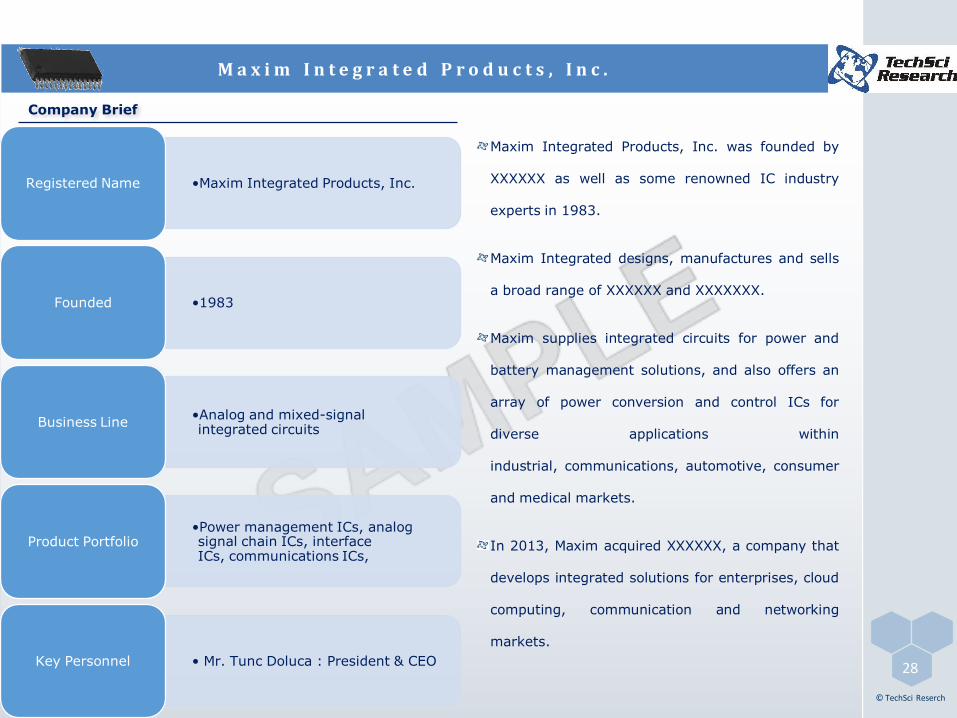
M a x i m I n t e g r a t e d P r o d u c t s , I n c .
Company Brief
© TechSci Reserch
•Maxim Integrated Products, Inc.Registered Name
•1983Founded
•Analog and mixed-signal integrated circuits
Business Line
•Power management ICs, analog signal chain ICs, interface ICs, communications ICs,
Product Portfolio
• Mr. Tunc Doluca : President & CEOKey Personnel 28
Maxim Integrated Products, Inc. was founded by
XXXXXX as well as some renowned IC industry
experts in 1983.
Maxim Integrated designs, manufactures and sells
a broad range of XXXXXX and XXXXXXX.
Maxim supplies integrated circuits for power and
battery management solutions, and also offers an
array of power conversion and control ICs for
diverse applications within
industrial, communications, automotive, consumer
and medical markets.
In 2013, Maxim acquired XXXXXX, a company that
develops integrated solutions for enterprises, cloud
computing, communication and networking
markets.

Maxim design center was founded in March of
2003 at XXXXXXX in India. Another design
center was opened in XXXXXX in 2006.
Manufacturing team at both centers
designs, develops and supports high-end
automated solutions, management
dashboards, and multiple reports.
Both design centers have approximately XXX
engineers. Design team provides XXX
application specific tier-1 support for critical
applications across various Maxim
manufacturing facilities worldwide.
M a x i m I n t e g r a t e d P r o d u c t s , I n c .
© TechSci Reserch
•XXXXXXXX
•XXXXXXXMajor Competitors
•2014 : XXX(approx.)No. of Employees
•XXX wafer fab & test facilitiesManufacturing Plant
•ISO 9001:2000
•ISO/TS 16949
•ISO 14001
Certification
•160 Rio Robles San Jose, CA 95134 USA
•Tel: 408-601-1000
•Website:www.maximintegrated.com
Contact Details
Company Brief
29
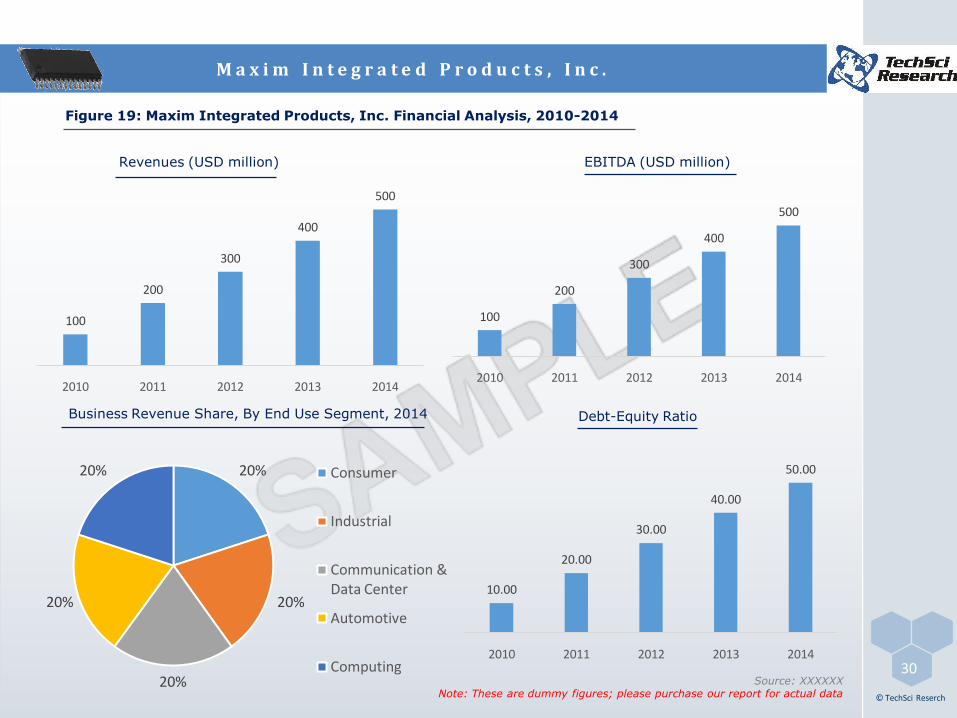
M a x i m I n t e g r a t e d P r o d u c t s , I n c .
© TechSci Reserch
Source: XXXXXX Note: These are dummy figures; please purchase our report for actual data
30
Business Revenue Share, By End Use Segment, 2014 Debt-Equity Ratio
100
200
300
400
500
2010 2011 2012 2013 2014
Revenues (USD million)
10.00
20.00
30.00
40.00
50.00
2010 2011 2012 2013 2014
100
200
300
400
500
2010 2011 2012 2013 2014
20%
20%
20%
20%
20% Consumer
Industrial
Communication & Data Center
Automotive
Computing
Figure 19: Maxim Integrated Products, Inc. Financial Analysis, 2010-2014
EBITDA (USD million)