Technology-to-Market Advisor · Technology-to-Market Advisor ... Accelerate transformational...
30
www.arpa-e.energy.gov/ Carlton Reeves, Ph.D. Technology-to-Market Advisor Advanced Research Projects Agency - Energy National Association of State Energy Officials (NASEO) Briefing September 13, 2016
Transcript of Technology-to-Market Advisor · Technology-to-Market Advisor ... Accelerate transformational...

www.arpa-e.energy.gov/Carlton Reeves, Ph.D.
Technology-to-Market Advisor
Advanced Research Projects Agency - Energy
National Association of State Energy Officials (NASEO) Briefing September 13, 2016

About ARPA-E
Goals: Ensure America’s
▸Economic Security
▸Energy Security
▸Technological Lead in Advanced
Energy Technologies
Mission: To overcome long-term and high-risk technological barriers in the
development of energy technologies
Means:
▸ Identify and promote revolutionary advances in fundamental and applied sciences
▸Translate scientific discoveries and cutting-edge inventions into technological
innovations
▸Accelerate transformational technological advances in areas that industry by itself
is not likely to undertake because of technical and financial uncertainty
2
Reduce Emissions
Improve Energy
Efficiency
Reduce Energy Imports

Investm
ent
TimeConcept
$1M
ARPA-E now
ARPA-E Future?
Private Sector
3
$10M
$100M
Energy Technology “Mountains of Opportunity”
Commercialization
Technology
De-RiskCommercialization
De-Risk
Manufacturing/Market
De-Risk
Demonstration
Prototype
Research

ARPA-E’s History
In 2007, The National Academies recommended Congress establish an
Advanced Research Projects Agency within the U.S. Department of Energy*
4
…“The new agency proposed herein [ARPA-E] is patterned after that
model [of DARPA] and would sponsor creative, out-of-the-box,
transformational, generic energy research in those areas where industry by
itself cannot or will not undertake such sponsorship, where risks and
potential payoffs are high, and where success could provide dramatic
benefits for the nation.”…
2007Rising Above the Gathering Storm Published
America COMPETES Act Signed
2009American Recovery & Reinvestment Act Signed
2011 2012 2013 20142010
1
37
712
1620
23
ProgramsTo Date
Awards Announced
2015
32
America COMPETES Reauthorization Signed
$400 Million
(Recovery Act)
$180 Million
(FY2011)
$275 Million
(FY2012)
$251 Million
(FY2013)
$280 Million
(FY2014)
$280 Million
(FY2015)
500+
2016Anticipated
39
$291 Million
(FY2016)
1st T2M Hires
1st Deputy Director for Commercialization
1st Programs with T2M from Inception

Program Portfolio
5
ELECTRICITY
GENERATION
ELECTRICAL GRID
& STORAGE
EFFICIENCY
&
EMISSIONS
TRANSPORTATION
& STORAGE
2010 - 2012
ALPHA
ARID
DELTA
FOCUS
METALS
MONITOR
CHARGES
RANGE
REMOTE
SWITCHES
TERRA
GENSETSREBELS
NODES
MOSAIC
TRANSNET
2013-2014 2015 2016
GRID DATA
IONICS
SHIELD ENLITENED
REFUEL
ROOTS
NEXTCAR
ADEPT
AMPEDBEEST
BEETIT
ELECTROFUELS
GENI
GRIDS HEATS
IMPACCT
MOVEPETRO
REACT
SOLAR ADEPT

Program Portfolio by Lead Organization
Small Businesses (<500 Employees)
31%
Large Businesses (>500 Employees)
15%
Federally Funded Research and Development Centers (FFRDC)
7%
Non-Profit Organizations4%
University 43%
6
ARPA-E supports multi-institutional teams with substantial involvement from the private sector:
• 72% of projects involve more than one institution
• 84% of projects include the private sector, as leads or partners

ARPA-E’s Success
‣ New Companies formed (Public,
Acquired, or Private)
7
‣ Over $1.25 Billion in Private
Sector Funding
‣ Follow-on Funding from
Other Government Agencies

Motivation: Megatrends In America
U.S. Department of Transportation. (2015). Beyond traffic 2045: Trends and choices.

Motivation: Technology is Changing
9
Co
nn
ecti
vit
yIm
pro
ved
Safe
ty
Big
Da
taA
uto
no
my
Mo
bilit
y
U.S. Department of Transportation. (2015). Beyond traffic 2045: Trends and choices.
3D
Pri
nti
ng

Motivation: Energy Used Per Traveler
4.4
11
0.058 0.053
1.5
0.011 0.0074
23
3237
47 48
77
108
0
30
60
90
120
0
3
6
9
12
MP
Ge
(p
er
trav
ele
r)
Qu
ad
s U
sed
4

Future Mobility: Vehicle Ownership vs. Control
Private Autonomy
Shared Autonomy
Private Drivers
Shared Drivers
11
Private Ownership Shared Ownership
Autonomous Control
Human Control
Baseline Current Trend
Sub-Optimal Optimal

What are the Energy Implications of Future Mobility?
2050 Baseline Energy Consumption
Potential Increase in
Energy Consumption
Potential Decrease in
Energy Consumption
+200%
-90%

What are the Energy Implications of Technology?
13
-60 -40 -20 0 20 40 60
Infrastructure Footprint
Changed Mobility Services
New User Groups
Travel Cost Reduction
Increased Features
Higher Highway Speeds
Vehicle Right-Sizing
Improved Crash Avoidance
De-Emphasized Performance
Congestion Mitigation
Eco-Driving
Platooning
% Change in Energy Consumption Due to Vehicle Automation
Does increased Connectivity, Automation, and MaaS lead to
increased or reduced transportation energy use and GHG emissions?
Data from: http://www.qualenergia.it/sites/default/files/articolo-doc/Automation%20manuscript-accepted.pdf
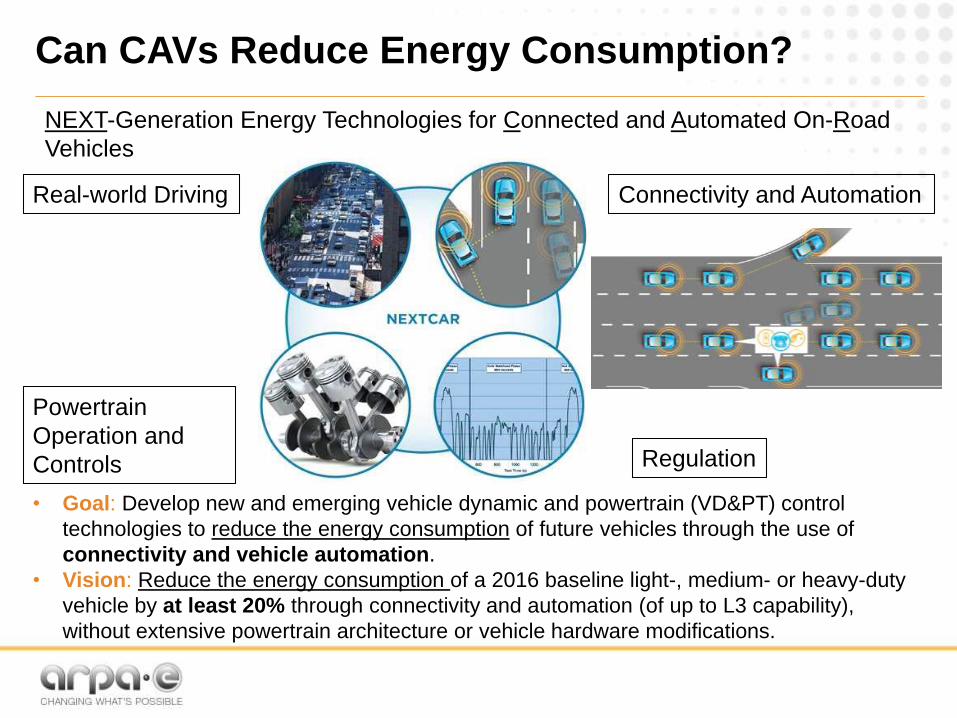
Can CAVs Reduce Energy Consumption?
• Goal: Develop new and emerging vehicle dynamic and powertrain (VD&PT) control
technologies to reduce the energy consumption of future vehicles through the use of
connectivity and vehicle automation.
• Vision: Reduce the energy consumption of a 2016 baseline light-, medium- or heavy-duty
vehicle by at least 20% through connectivity and automation (of up to L3 capability),
without extensive powertrain architecture or vehicle hardware modifications.
Real-world Driving
Powertrain
Operation and
Controls
Connectivity and Automation
Regulation
NEXT-Generation Energy Technologies for Connected and Automated On-Road
Vehicles

Can Commuter’s be Optimized for
Energy Efficiency?
TRANSNET Program
Traveler Response Architecture
using Novel Signaling for
Network Efficiency in Transportation

TRANSNET Overview
‣ Optimize the energy efficiency of urban, multi-modal
transportation, while maintaining expected quality-of-service
– Embed system-level energy optimization into the daily
commute and emerging urban mobility services
– Provide high accuracy mobility and energy simulations for
planning and evaluation purposes
16
Traveler
Information &
Incentives
Urban Transportation System
Mode
Route

Improve Efficiency
(Control)
Measure Energy Use
(Model)
The Solution Elements of TRANSNET
17
Data Aggregation Traveler Incentives
Mode Route
Decentralized Predictive Models
Interpret Data
(Prediction)
Traveler

‣ TRANSNET:
– System Model (SM): A parameterized model of a
multi-modal urban transportation network with
accurate energy estimation per traveler
– Control Architecture (CA): Network control that
enables system-level energy reductions via
personalized information and incentives to
individual travelers
‣ Approach (initial phase):
Build SM and use it to benchmark the energy
effects of the CA in silico, for various scenarios
‣ Some challenging problems:
– Quality-of-Service Combining unconstrained &
constrained modes (e.g., car transit)
– Integration across scales Macro-, meso-, and
micro-scale, computed concurrently &
dynamically
– Influencing traveler behavior What can really
motivate significant behavioral shifts?
18
Program Structure
Washington, D.C. Travel Network: Modes and
transport options available to personal travelers
WalkingBikingDriving

TRANSNET vs. Traditional Approaches to
Simulating and Controlling Traffic
“Traditional” TRANSNET
Simulation Long-term planningReal-time
predictive
Focus Vehicle Traveler
Controls Tolls/LawsInformation &
Incentives
Optimization Time Energy (+Time)
19

TRANSNET: 5 Projects; $14.5M
‣Modes: Walk, Bicycle, Car, Bus, Rail, Rideshare
‣ Variables: Departure Time & Location, Route, Arrival Time &
Location, Travel Mode, Number of Travelers, Traffic
Incidents, Congestion, Events, Parking, Weather, etc.
‣ Data: INRIX, RITIS, Metro Services, DOT, Vehicles,
Smartphones, & other Intelligent Transportation Systems
‣ Controls: Departure Times, Alterative Routes, Travel Modes
‣ Traveler Incentives: Personalized Info, Rewards, Points
20
BostonLos
Angeles
Atlanta DC-BaltimoreAustin

PARC: Collaborative Optimization and Planning
Solution: Develop planning and incentive algorithms to promote energy
efficient collaborative travel behavior and adoption of efficient modes.
Project Description• Developing a SOA multi-modal travel and energy use microsimulation for Los
Angeles to analyze system energy effects of personalized incentive strategies.
• New multi-trip/multi-agent planning and optimization algorithms for collaborative
mobility and new forms of dynamic ridesharing.
• Phone app and algorithms will pair transportation options and predict energy use
to offer a personalized energy saving portfolio of paths through the network.
• Personality analysis will enable the optimization of messaging strategies to
maximize the likelihood of adoption.
Problem: Lack of knowledge about energy impacts and mobility options
exacerbates independent travel behavior and sub-optimal energy use.
Uses decision-
theoretic trip
planning
algorithms to
optimize
collaborative and
individual travel
over public,
private, and
personal options.
shared vanA
A
A
A
B
B
B
B
Project Outcomes
• Improved QOS and happier
travelers.
• Real time energy reduction
responses to changing network
conditions.
• Quantified energy impacts of
transportation decisions for citizens
and cities.
• Access to new transportation
service providers and collaborative
travel options.
Supporting Partners
• LA Metro
• LA DoT
• LA Mayor
• SCAG
• INRIX
Greater information about available options and associated energy
use will allow travelers to optimize commute and energy.
9

Georgia Institute of Technology:
Network Performance Monitoring & Distributed Simulation
Solution: Develop a distributed simulation system deployed on network and mobile
devices to scalably predict conditions and influence efficient traveler behavior.
Problem: Centralized simulations are not sufficiently cost/compute scalable for
population level personalized transportation prediction and energy advising.
Project Description
• Link big data analysis and pattern recognition with simulation (traditional and distributed)
to scalably connect traveler behavior to future network states and energy use.
• Estimate energy, time, and cost tradeoffs for alternative departure times, modes, driving
styles, and routes.
• Use the phone app to deliver personalized messages to influence travel decisions and
monitor outcomes and the associated energy costs.
Project Outcomes
• More accurate and
efficient prediction of real
time energy use and on
road conditions.
• Cost and compute
scalable real-time
transportation energy and
cost advising using
monitored traveler
responses and benefits
assessment.
Supporting Partners
• Morehead State
• Wyle Consulting
Conceptual overview of a system linking data, simulations, and
models via an efficient precomputed summary of network states.
Existing Commute Warrior app will be used
as the platform for monitoring and advising.
10

NREL: The Connected Traveler
Solution: Pair NREL energy estimation methods with adaptations of Metropia
congestion reduction techniques to promote energy smart travel behavior.
Project Description• Will estimate energy savings resulting from incentivized traveler behavior for
an existing real world user base rather than from modeling and simulations.
• Available phone app allows for A/B type testing of new personalized incentive
strategies, potential for widespread adoption, and revealed traveler behavior.
• NREL data and engineering tools capture individual energy consumption in
response to incentives and estimate system energy effects.
• Will use similar principles and incentive based techniques already shown to
be effective in reducing congestion to promote energy reductions.
Problem: Energy effects are not yet directly connected to the daily commute
or the emerging “Mobility As a Service” economy.
Project Outcomes
• Austin TX test bed will evaluate
potential energy reductions
matched to incentive strategies
• A greater understanding of revealed
commuter preferences w.r.t.
tradeoffs of ease, energy, and cost.
• A fully developed energy saving
commuter app that contributes to
system wide congestion and energy
benefits.
Personalized incentives
will leverage
demographics,
personal preference,
and available options
to optimize energy use.
11

University of Maryland: Integrated and
Personalized Traveler Information and Incentives
Solution: Apply modern behavioral research to the design and presentation of
incentives to guide travelers towards choices aligned with system optima.
Problem: Energy reduction requires targeted personalized information
integrated with centralized intelligent transportation systems.
Project Outcomes
• Demonstrate a technology resulting
in 10% overall energy savings with
20% market penetration.
• A greater understanding of stated
and revealed commuter
preferences w.r.t. tradeoffs of ease,
energy, and cost.
• A fully developed regional model
that will incorporate energy savings
into day to day operations and
planning.
Behavior research and
optimization techniques
will focus on
personalized
monetary/non-
monetary rewards and
information on travel
conditions and options.
Supporting Partners
• WMATA
• TomTom
• here
• RubryRide.
• INRIX
• Virginia DOT
• Maryland SHA. The RITIS integration system allows the incorporation of public and
private data types into transportation and energy management strategies.
Project Description• Large-scale multimodal traveler and vehicle simulation for DC and Baltimore
allows for the modeling and optimization of energy use and quality of service.
• Simulated individual energy profiles from multi-modal trajectories will indicate
how route, driving style, and mode choices can be altered to optimize energy.
• An app will provide information and incentives, as well as information from
social networks, to increase user adoption and incentive effectiveness.
• Cloud computing based prediction and optimization techniques will allow for
eventual real world deployment of the incentive structure paired with an
existing ITS infrastructure..
12

Massachusetts Institute of Technology: Mobility
Electronic Market for Optimized Travel
Solution: Create a market place of commercial, social, and independent
incentives based on fungible units pegged to energy saving behaviors.
Problem: Commercial and municipal stake holders lack a forum in which to
advertise and leverage personalized incentives to change traveler behavior.
Project Outcomes
• System-wide energy optimization
in response to real-time data.
• Quantification of the effect of
personalized information and
incentives on energy savings.
• Flexible platform for reward.
exchange using an app based tool.
• Energy performance assessment
for Boston.
Project Description
• Developing an open-source agent-based simulator for multi-modal transportation
networks, vehicle energy performance, and a wide set of traveler behaviors.
• A simulation-based system optimization framework that predicts traffic, energy
consumption and the effect of different incentive strategies in real-time.
• Energy saving choices “pay out” at different token rates according to real-time
system based optimization and personalized reward optimization.
• A personalized trip menu with real-time information and incentives integrated with a
travel diary and an electronic mobility market in a smartphone app.
Proposed mobility market place will offer a variety of commercial
and civic incentives that are pegged to the network state and travel
decisions facing a user.
Supporting Partners
• City of Boston
• MPO
• MBTA
Conceptual framework showing the relationship between the energy and mobility
simulations, system optimal states, and user needs linked by the token system.
13

Multi-Modal Commuter Dashboard
26
Deloitte Services LP. (2014). Digital-Age Transportation: The Future of Urban Mobility.
Shared Drivers
Shared Autonomy
Current Trend
Optimal

Policy Levers to Aid the Transportation Evolution
Invest in alternative fuel research and infrastructure and the development of fuel efficient technologies
Subsidize the purchase of electric and alternative-fuel vehicles
Tax carbon emissions
Support pricing and operational strategies that reduce congestion on roadways
Increase and extend fuel efficiency standards across all modes
27

Policy Levers to Aid the Transportation Evolution
Support zoning and development policies that discourage urban sprawl and private autonomy
Encourage companies to adopt telework policies
Invest in transit, rail and maritime infrastructure to support mode shifts
Increase international government-to-government engagement to pursue joint commitments to control greenhouse gas emissions
28

Accelerate the Transportation Evolution
29
Deloitte Services LP. (2014). Digital-Age Transportation: The Future of Urban Mobility.

Questions?
30
www.arpa-e.energy.gov
Thank You
“Hang on—I’ll Uber us a school bus.”