Technology Review: Ultra-Urban Stormwater Treatment ... · PDF filemethodologies for...
55
Technology Review: Ultra-Urban Stormwater Treatment Technologies Prepared by: Christopher C. Brueske Department of Civil and Environmental Engineering University of Washington Seattle, WA September 1, 2000
Transcript of Technology Review: Ultra-Urban Stormwater Treatment ... · PDF filemethodologies for...

Technology Review:Ultra-Urban Stormwater Treatment Technologies
Prepared by:Christopher C. Brueske
Department of Civil and Environmental EngineeringUniversity of Washington
Seattle, WA
September 1, 2000

Stormwater Treatment Technology Review
1
Table of Contents
Section Page
Section 1: Introduction 2Scope and Organization 2
Section 2: Gravity Separation Technologies 4Stormceptor® System 4BaySaver® Separation System 7Treatment Mechanism 9Reported Performance and Design Methods 10
Section 3: Swirl Concentration Technologies 12Vortechs™ Stormwater Treatment System 12Downstream Defender™ 14Treatment Mechanism 16Reported Performance and Design Methods 19
Section 4: Screening Technologies 26Continuous Deflective Separation (CDS®) 26Treatment Mechanism 28Reported Performance and Design Methods 30
Section 5: Filtration Technologies 33Stormfilter™ 33Treatment Mechanism 36Reported Performance and Design Methods 36
Section 6: Performance Evaluation Procedures 39Storm-Event Mass-Based Removal Efficiency 39Hydrology-Based Removal Efficiency 40Proposed Protocol for Evaluating New Technologies 41
Section 7: Application of Technology Review Findings 44
Section 8: Summary and Conclusion 48Research Needs 48
References 50
Appendix: “Ultra-Urban” Stormwater Treatment Technology Manufacturer List 54

Stormwater Treatment Technology Review
2
Section 1: Introduction
The following document was compiled to provide a review of “ultra-urban” stormwatertreatment technologies. “Ultra-urban” technologies are designed to remove pollutantsfrom wet weather runoff in highly developed areas where land values are high andavailable space is limited. These technologies differ from traditional stormwatertreatment methods (e.g., water quality ponds and grass swales) in that they are extremelycompact and can be retrofitted into existing stormwater collection systems.
The technologies included in this review were developed primarily to remove suspendedsolids from urban runoff. Several of the units also include design features to remove oilsand other floatable contaminants. Generally speaking, these technologies remove metals,nutrients, and other contaminants only to the extent that these contaminants are adsorbedto suspended solids. A notable exception to this is certain filtration systems, which canbe operated with an adsorptive media specific to dissolved metals, organics, andnutrients.
1.1 Scope and Organization
This document examines stormwater treatment units similar to those that will be tested aspart of the Environmental Technology Evaluation Center (EvTEC)/Washington StateDepartment of Transportation (WSDOT) Technology Evaluation Project in Seattle,Washington. The units examined are designed to operate “in-line” with the stormwatercollection system and provide treatment of stormwater flow on a continuous basis duringa storm event. Generally speaking, the units are compact and do not require pumping orother energy input. This document examines in detail the following four types oftreatment technologies, categorized according to their underlying solids removalmechanism:
• Gravity separation (Section 2)• Swirl concentration (Section 3)• Screening (Section 4)• Filtration, combined in some cases with dissolved contaminant removal by an
adsorptive media (Section 5)
For each of these categories, the following information is provided:
• Detailed examination of one or two representative trademark units to illustrate thetreatment mechanism
• Summary of hydraulic principles involved in the treatment mechanism• Literature review, including a summary of reported treatment performance data
Section 6 of this document examines issues associated with monitoring stormwatertreatment units, including the following:

Stormwater Treatment Technology Review
3
• Examination of both “storm event mass-based” and “hydrology-based”methodologies for calculating removal efficiency
• Summary of a proposed protocol for evaluating new stormwater treatmenttechnologies, developed specifically for the Puget Sound region by theStormwater Managers Committee of the Washington Chapter of the AmericanPublic Works Association (APWA)
Section 7 applies the findings of the technology review to develop a design protocol forselecting and installing an “ultra-urban” treatment technology. The purpose of the designprotocol is to illustrate the factors that must be considered and the data limitations thatadd uncertainty to the design process.
Section 8 provides conclusions and highlights research needs applicable to “ultra-urban”stormwater treatment technologies.
Appendix A provides a list of contact information for manufacturers and vendors ofstormwater treatment units similar to those examined in this paper.

Stormwater Treatment Technology Review
4
Section 2: Gravity Separation Technologies
Gravity separation is a common approach to stormwater treatment, although traditionalgravity separation technology has relied on the use of detention basins and water qualityponds to achieve solids removal. “Ultra-urban” gravity separation units are designed toachieve solids removal without the land requirement associated with traditionaltechnologies. Two representative gravity separation technologies selected forexamination in this review are the Stormceptor® System, manufactured by CSR, KansasCity, Missouri, and the BaySaver® System, manufactured by BaySaver®, Inc., MountAiry, Maryland.
2.1 Stormceptor® System
A schematic of the Stormceptor® System is provided in Figure 2-1. The systemcomprises a lower treatment chamber and an upper bypass chamber, separated by afiberglass disc insert. The lower chamber is always full of water. Stormwater enters thetreatment unit, and normal design flows are diverted into the lower treatment chamber bya weir and drop pipe. The drop pipe diverts flow along the wall of the lower treatmentchamber to reduce turbulent eddies and the associated potential for sediment re-entrainment. As water flows through the lower chamber, sediment is removed by gravityseparation, and floating oil is retained under the fiberglass disc insert. Water exits thetreatment chamber through a submerged outlet pipe and exits the unit. Flow in excess ofthe weir capacity bypasses the treatment chamber and flows through the bypass chamberdirectly to the unit outlet. This bypass reduces the potential for scouring of sedimentfrom the lower chamber during high flow conditions. The unit requires periodic cleanout by a vacuum truck to remove oil and sediment. CSR manufactures nine model sizesof the conventional in-line Stormceptor®, ranging in maximum treatment capacity from0.18 – 2.5 cfs and with diameters between 4 – 12 ft. These dimensions correspond to ahydraulic application rate (HAR) of 6.3 – 9.8 gpm/ft2 of treatment chamber. Sedimentand oil storage capacities range from 1.7 – 30.7 yd3 and 85 – 1096 gal, respectively.
CSR has developed a computer model that incorporates the U.S. EnvironmentalProtection Agency’s (EPA) surface water management model (SWMM) to selectappropriately-sized Stormceptor® units for individual applications. Build-up and wash-off calculations for particles in urban runoff were incorporated into SWMM; thedistribution of solids build-up is a function of antecedent dry days. The model uses adatabase of historical rainfall data for stations across the United States; fifteen-minutedata are used to simulate rainfall over a period of several years. Settling calculations,based on Stokes Law (see Section 2.3 for a discussion of Stokes Law) determine theparticle removal efficiency that will be achieved for several different sizes ofStormceptor® units, based on the detention time in the units. A uniform distribution ofinfluent particles is assumed so that the mass of particles that bypasses the treatmentchamber is proportional to the bypass flow. The model output is an overall estimatedsolids removal efficiency for various Stormceptor® unit sizes, allowing the designer todecide which unit is most appropriate. The Stormceptor® System Technical Manualprovides model calibration data that suggests the model provides reasonable estimates of

Stormwater Treatment Technology Review
5
Normal Flow Conditions
Bypass Conditions
Figure 2-1: Schematic of Stormceptor® System during normal flow conditions andbypass conditions (Source: Stormceptor® Internet Page:www.csra.com/csrstormceptor/products/inline.htm )

Stormwater Treatment Technology Review
6
actual field performance. Values of SWMM parameters used in the CSR model areprovided in Table 2-1. The model user is able to select between two particle sizedistributions, shown in Table 2-2.
The settling velocities in Table 2-2 are based on Stokes Law (see Section 2.3). Toaccount for the potential for coagulation of smaller particles, CSR uses an empiricalcoagulation equation to determine the settling velocity of 20-µm particles:
Vs = 0.35 + 1.77 Ps (2-1)
whereVs = settling velocity, mm/sPs = particle size, mm
Table 2-1: SWMM Parameters usedin CSR’s Stormceptor® Design Model
Area (acre) Variable-entered by userImperviousness 99 %Slope 2 %Impervious depression storage (inches) 0.19Pervious depression storage (inches) 0.02Impervious Mannings n 0.015Pervious Mannings n 0.25Maximum infiltration rate (inches/hour) 2.46Minimum infiltration rate (inches/hour) 0.39Decay rate of infiltration (seconds –1) 0.00055Source: CSR, The Stormceptor® System Technical Manual
Table 2-2: Particle Size Distribution Options forCSR’s Stormceptor® Design Model
Particle size (µm) Percent by mass (%) Specific gravity Settling velocity(cm/sec) a
Option 1: “Typical” Particle Size Distribution20 20 b 0.03560 20 1.8 0.158150 20 2.2 1.07400 20 2.65 6.50
2000 20 2.65 28.7Option 2: “Coarse” Particle Size Distribution
150 60 2.65 1.44400 20 2.65 6.50
2000 20 2.65 28.7Notes:a Settling velocity based on Stokes Lawb Flocculated settling velocity based on Vs = 0.35 + 1.77 Ps , where Vs = settling velocity (mm/sec) and Ps =particle size (mm)Source: CSR, The Stormceptor® System Technical Manual

Stormwater Treatment Technology Review
7
2.2 BaySaver® Separation System
A schematic of the BaySaver® System is provided in Figure 2-2. The system comprisestwo precast manholes (referred to as the primary manhole and the storage manhole) and ahigh-density polyethylene (HDPE) separator unit. The primary manhole is placed in-linewith the storm drain, and the storage manhole is placed off-line. The system has threeoperational phases:
• Low flow operation: Stormwater enters the primary manhole, where coarsesediments settle out. Water leaves the primary manhole by flowing over atrapezoidal weir in the HDPE separator unit into the storage manhole, where finersediments and floatable oils are removed. Water exits the storage manhole by asubmerged effluent pipe and is returned to the storm drain.
• Moderate flow operation: Stormwater enters the primary manhole, and a portionof the flow is routed through the storage chamber; flow in excess of the storagechamber’s capacity is treated only in the primary manhole. As with lowoperation, water flows over the weir and into the storage chamber. However,during moderate flow, a pair of submerged elbow pipes draws water in excess ofthe storage manhole’s capacity from the center of the primary manhole. Thiswater, having been treated for coarse sediment removal in the primary manhole,bypasses the storage manhole and is returned to the storm drain. By not divertinghigh flows through the storage manhole, the potential for re-entrainment ofsediment from the storage manhole is reduced. In addition, by routing water fromthe top of the primary manhole to the storage manhole, removal of floatablecontaminants such as oil and grease can continue during moderate flowoperations.
• Bypass operation: During high flows, the treatment unit operates in a bypassmode. Stormwater exits the primary manhole by flowing over the HDPEseparation unit; in addition, water enters the submerged elbow pipes from both thetop and bottom, thus reducing the potential for resuspension of sediments fromthe primary manhole. During bypass operation, pollutant removal efficiency iseffectively zero (BaySaver®, Inc., 1999).
Periodic cleaning by a vacuum truck is required to removed sediments and oils from theprimary and storage manholes. BaySaver® Inc. manufactures HDPE separation units inthree different sizes, and the size of the primary and storage manholes are varieddepending on the design treatment flow. The storage manhole is typically the same sizeor larger than the primary manhole. Increasing the size of the storage manhole increasesthe overall system HAR and allows additional time to achieve solids settling. Thecapacity of the HDPE separation units ranges from 1.0 – 3.8 cfs for low flow operation,2.4 – 11.1 for moderate flow operation, and 10 – 50 cfs for bypass operation. Thediameters of the primary and storage manholes range from 4 – 8 ft, with a total systemvolume of 1,475 – 5,950 gal and a sediment storage capacity of 1.86 – 7.44 yd3. HAR (interms of flow per total manhole area) varies depending on the diameter of the primary

Stormwater Treatment Technology Review
8
Storage Manhole Primary Manhole
Figure 2-2: Schematic of BaySaver® Separation System during low flow operations(Source: BaySaver® Internet Page: www.baysaver.com/bss/oper/mf02.html )

Stormwater Treatment Technology Review
9
and storage manholes, but based on standard BaySaver® manhole sizing guidelines(BaySaver®, Inc., 1999) a general range of low flow operation HAR is 11 –18 gpm/ft2
for the smallest HDPE separation unit, 19 – 29 gpm/ft2 for the middle unit, and 17 – 30gpm/ft2 for the largest unit. Oil storage capacity in the storage manhole ranges from 280– 1,110 gal.
BaySaver® Inc. recommends that HDPE separation units be sized to convey the twoyear, one hour storm under moderate flow operations. The intent of this specification isto allow the unit to operate under low flow conditions during smaller, more commonstorms. The size of the primary and storage manholes can also be modified if additionaldetention time is required. For example, a site with a high concentration of fine particlesmay require additional detention capacity to achieve gravity separation of these particles.
2.3 Treatment Mechanism
The solids removal efficiency of a gravity separation treatment unit is a function of thedetention time of the unit and the settling velocity of particles in the influent. Thedetention time (td, sec) is calculated from the volume of a treatment unit (V, m3) and theflow rate to the system (Q, m3/sec):
td = V / Q (2-2)
A design settling velocity (vo, m/s) for a gravity separation process is described byWanielista and Yousef (1993) in terms of the height of settling (ho, m) and the detentiontime (td, sec):
vo = ho / td (2-3)
This equation is typically used in the design of gravity separation systems such as wetponds. Stokes Law is used to calculate the settling velocity of a particle undergravitational effects:
vo2 = (4gds/3Cd)(SG-1) (2-4)
where:vo = terminal settling velocity, m/secg = acceleration due to gravity, m/sec2
ds= particle diameter, mCd = drag coefficient, unitlessSG = specific gravity of particle, unitless (SG = density of particle, kg/m3 / density ofwater, kg/m3)
Stokes Law, as originally derived, describes laminar flow around discrete sphericalparticles. In this form, the drag coefficient, Cd, is defined as:

Stormwater Treatment Technology Review
10
Cd = 24/Re (2-5)
Where Re is the Reynolds number defined in terms of the fluid density (ρ, kg/m3), the fallvelocity (vo, m/s), the particle diameter (ds, m/s), and the dynamic viscosity of the fluid(µ, Pa sec):
Re = ρvods/µ (2-6)
This definition of Cd is generally applicable for fine particles (e.g., clay and silt) thatsettle in a laminar flow. In order to apply Stokes Law to larger sediment particles (e.g.,sand and gravel) that settle in a turbulent flow, empirical formulas to define Cd have beenderived. For example, Engelund and Hansen (1967) measured fall velocity of sand andgravel particles and derived the following best fit for the observed data:
Cd = (24/Re) + 1.5 (2-7)
As shown in Stokes Law, the settling velocity of a particle is a function of both theparticle size and the particle density, expressed in terms of specific gravity. It is possiblefor two particles of different size to settle at the same rate, based on a difference inspecific gravity. For example, a 100-µm sand particle (SG = 2.65) and a 280-µm organicparticle (SG = 1.2) settle at approximately the same rate (0.8 cm/sec).
As the concentration of particles in a fluid increases, the probability of interactionbetween particles increases. This interaction can result in two phenomena that affect thesettling velocity of a particle:
1) “Hindered settling,” in which the settling of a high concentration of particlescauses an upward flow of displaced water and reduces settling velocity.
2) Flocculation, in which particles agglomerate to form larger and heavier particleswith higher settling velocities.
Hindered settling is not expected at solids concentrations less than 1,000 mg/L (EPA,1978), and therefore should not affect the operation of stormwater treatment units.However, flocculation has been observed to influence the removal of particles in gravityseparation processes by increasing settling velocities (EPA, 1978). In practice, it iscommon to use empirical equations to describe the effect of flocculation on the settlingvelocity of fine particles, as discussed previously for the Stormceptor® System.
2.4 Reported Performance and Design Methods
The Massachusetts Strategic Envirotechnology Partnership (STEP) conducted a review ofperformance data submitted by CSR for the Stormceptor® treatment system (STEP,1998). A Stormceptor® unit in Westwood, Massachusetts demonstrated an average TSSremoval efficiency of 77% for 6 storm events, with removal efficiencies for individualstorms ranging between 28% and 99%. Average total petroleum hydrocarbon (TPH)

Stormwater Treatment Technology Review
11
removal efficiency for 5 storms during the same study period was 80%. A Stormceptor®unit in Edmonton, Canada demonstrated an average TSS removal efficiency of 52% over4 storms. Removal efficiencies for individual metals (Fe, Pb, Zn, Cr, and Cu) rangedfrom 39% - 53%, and average oil and grease removal efficiency was 43%. TheEdmonton unit was estimated to be undersized by a factor of 3 based on Stormceptor®sizing guidelines, which specified that the unit was intended to receive runoff from animpervious drainage area of 3.35 acre. The Edmonton unit was treating runoff from animpervious drainage are of 9.8 acres.
A laboratory study reported by Marcalek et al. (1994) demonstrated a decline in solidsremoval efficiency with increased flow rate for a 1:4 model-scale Stormceptor® unit.Froude similarity was used to calculate appropriate flow rates for the models, and ABSresin pellets were used to simulate medium sand (80 – 230 µm) in the stormwater.Reported solids removal efficiencies were 95% at 3.4 gpm/ft2, 77% at 7.3 gpm/ft2, 68% at10.1 gpm/ft2, and 6% at 22.4 gpm/ft2. Bypass flow through the upper chamber occurredabove 10.1 gpm/ft2. A laboratory study by Pratt (1996) and reviewed by STEP (1998)evaluated a full-scale Stormceptor® unit receiving approximately one-half of itsmaximum treatment flow rate during a simulated 20-minute storm event. Sand and oilwere used to create an influent with a TSS concentration of 210 mg/L and an oilconcentration of 4,100 mg/L. HAR was approximately 5 gpm/ft2. Removal efficienciesof 83% and 98% were reported for sand and oil, respectively.

Stormwater Treatment Technology Review
12
Section 3: Swirl Concentration Technologies
Swirl concentration technologies have been used since the early 1960s, when acylindrical vortex unit was used for the treatment of combined sewer overflow (CSO) inBristol, England. The EPA Municipal Environmental Research Laboratory in Cincinnati,Ohio, in conjunction with the LaSalle Hydraulics Laboratory in Montreal, Quebec andthe General Electric Company in Philadelphia, Pennsylvania, conducted a series ofhydraulic and mathematical modeling studies in the 1970s to develop and demonstrateswirl concentration technology. This work resulted in the design of the EPA swirl CSOflow regulator/settleable-solids concentrator. The original CSO treatment units weredesigned with a “foul-water” outlet in the bottom center of the unit and a circular weir atthe top of the unit, similar to a clarifier. During dry weather, all flow entering the unitwas diverted through the “foul-water” outlet and conveyed to the wastewater treatmentplant. During high flows, the unit served to concentrate solids in a portion of the flow,which exited the unit through the “foul-water” outlet and was conveyed to the wastewatertreatment plant; the clearer supernatant overflowed the weir and was discharged to thereceiving waters.
During the 1980s, swirl concentration technology was advanced and marketed by agrowing number of private companies. A notable change to the original design is thatcommercially available swirl concentrators for stormwater treatment do not have aseparate “foul-water” outlet; rather, accumulated sediments are stored in the unit andrequire periodic removal. Numerous swirl concentration units are commerciallyavailable. Of these, two representative technologies were selected for detailedexamination in this paper. These are the Vortechs TM Stormwater Treatment Systemmanufactured by Vortechnics, Inc., Portland, Maine and the Downstream Defender TM
manufactured by H.I.L. Technology, Inc., Portland, Maine.
3.1 Vortechs TM Stormwater Treatment System
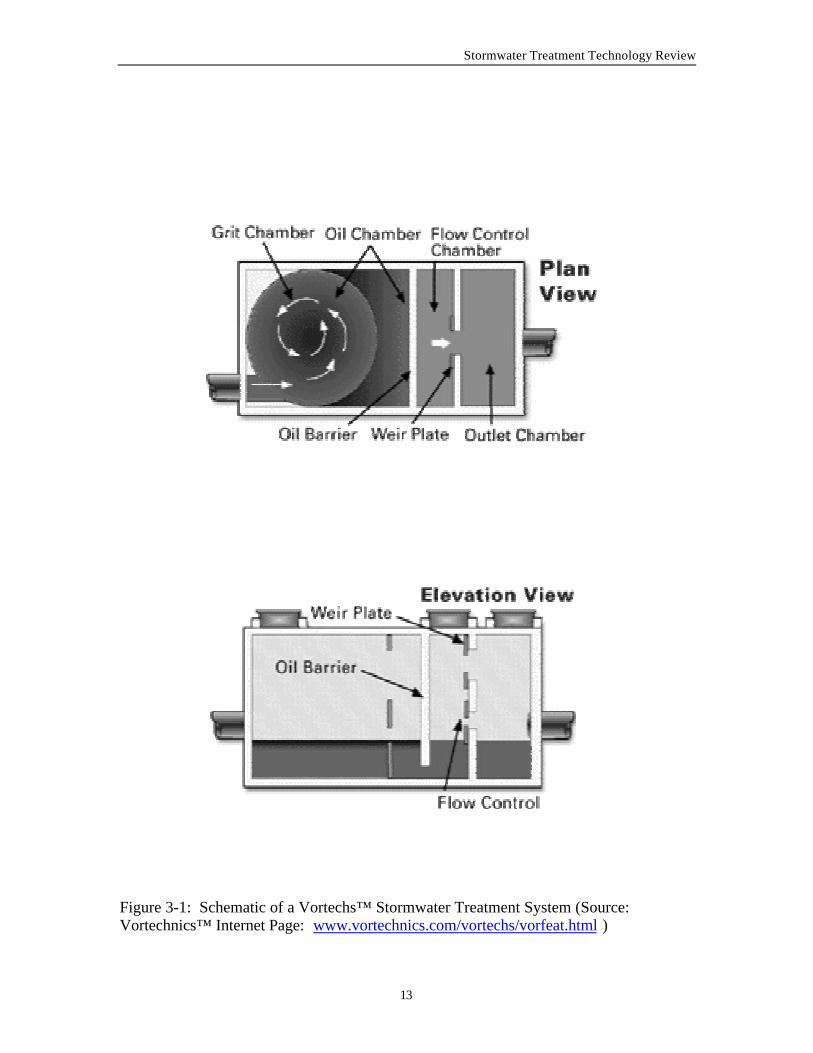
A schematic of a Vortechs TM Stormwater Treatment System is shown in Figure 3-1. TheVortechs TM unit is designed to remove sediment and oil from stormwater and to preventre-entrainment of these contaminants. Water enters the grit chamber through a tangentialinlet and initiates the swirling fluid field. Settleable solids are concentrated at the centerof the chamber, and the effluent exits through an orifice on the outside of the gritchamber. As flows through the unit increase, the effluent also exits over the top of thegrit chamber wall. Oil and floatable contaminants collect at the water surface and areprevented from exiting by the underflow baffle in the flow control chamber.Accumulated sediment and floatable contaminants are periodically removed by a vacuumtruck.
Vortechnics™ manufactures pre-cast units with a design treatment flow of 0.4 – 6.25 cfsand a corresponding peak flow capacity from 1.6 – 25.0 cfs. The grit chambers rangefrom 3 – 12 ft in diameter and have sediment storage capacities of 0.75 – 7.0 yds3. Thepermanent wet pool in the grit chamber is approximately 3-4 ft deep for all units. Cast-in-place designs are available for larger applications.
Stormwater Treatment Technology Review
13
Figure 3-1: Schematic of a Vortechs™ Stormwater Treatment System (Source:Vortechnics™ Internet Page: www.vortechnics.com/vortechs/vorfeat.html )

Stormwater Treatment Technology Review
14
Vortechs™ units can be installed either on-line, where all flow in a stormwaterconveyance system passes through the unit, or off-line, where a portion of the flow in astormwater conveyance system, up to a design flow, is diverted into the unit. In the caseof an off-line installation, flow in excess of the unit’s design flow continues in theconveyance system without treatment. Design of a Vortechs™ unit is based on HAR,expressed in terms of gpm / ft2 of grit chamber area. Vortechnics™ (1999a) recommendsthe following design guidelines for sizing a unit, depending on the type of installation:
1) For on-line installations, size the system such that the maximum HAR during thedesign storm will be 100 gpm/ft2.
2) For off-line installations, size the system such that it will operate at a maximumHAR of 24 gpm/ft2 during a 2-month storm.
On-line installations are intended to provide treatment for all storms up to the designstorm, including large, infrequent storms. The upper HAR limit of 100 gpm/ft2 for on-line installations is based on laboratory tests conducted by Vortechnics™ that showedthis to be the maximum HAR for which some degree of treatment (5-10% solids removalefficiency) was achieved. Off-line installations are intended to provide treatment only forsmaller, more frequent storms and typically allow the use of smaller, less expensivetreatment units. The HAR limit of 24 gpm/ft2 for off-line installations corresponded to amuch higher treatment efficiency in the same laboratory tests (65-98% solids removalefficiency). Additional discussion of these results is provided in Section 3.4.
3.2 Downstream Defender™
A schematic of the Downstream Defender™ is shown in Figure 3-2. The generaloperation of this unit is similar to the Vortechs™ unit; water enters the treatmentchamber through a tangential inlet and induces a rotating fluid field. Water initiallyflows around the outer annular space between the manhole wall and the dip plate. Oiland floatable contaminants accumulate on the water surface in the outer annular space.Water continues to flow downward, depositing sediment in the bottom center of the unit.Water exits the unit by passing under the dip plate and spiraling upward through the innerannular space to the outlet pipe. The center cone serves to direct flow to the innerannular space and to protect accumulated sediment from re-entrainment. As with theVortechs™ unit, accumulated sediments and floatable contaminants are periodicallyremoved by a vacuum truck.
H.I.L. Technology manufactures pre-cast units for design flows of 0.75 – 13.0 cfs andcorresponding peak flow capacities from 3.0 – 25 cfs. The units range in diameter from 4– 10 ft, with sediment storage capacities of 0.7 – 8.7 yds3. HAR for the units ranges from26 – 74 gpm/ft2 at the design flows. Cast-in-place units are available for largerapplications. The specified design flows are based on a 90% removal efficiency for solidslarger than 150-µm with a specific gravity of 2.65 for all flows up to the design flow(H.I.L. Technology, 2000).

Stormwater Treatment Technology Review
15
Figure 3-2: Schematic of a Downstream Defender™ unit (Source: H.I.L Technology,2000)

Stormwater Treatment Technology Review
16
3.3 Treatment Mechanism
Solids are removed from stormwater in a swirl concentrator by two distinct treatmentmechanisms:
1) Gravity settling, which draws solids toward to floor of the treatment unit2) Secondary currents, which concentrate settling solids in the center of the
treatment unit
Gravity settling processes are discussed in Section 2 of this report. Secondary currentsare the primary mechanism by which solids are removed by a vortex unit (Wong, 1997;Andoh and Smisson, 1994). Secondary currents are commonly known for their effect onriver meandering, where they scour sediment from the outside of a river bend and depositit on the inside of the bend. To examine the origin of secondary flows, it is necessary tounderstand vorticity. Mathematically, vorticity (ω) is defined as the curl of the velocityvector (V):
ω = ∇ x V (3-1)
In 2-dimensional flow, vorticity is the sum of the angular velocities of any pair ofmutually-perpendicular, infinitesimal fluid lines that pass through a single fluid particle(Shapiro, 1969). Figure 3-3 illustrates the origin of vorticity in a viscous boundary layer.As shown in Figure 3-3, the non-uniform velocity distribution in the boundary layerimparts angular velocity perpendicular to the boundary; using the definition that vorticityis the sum of angular velocities of perpendicular fluid lines, this results in a component ofvorticity in a vector transverse to the boundary.
In a vortex separator, secondary currents develop as a result of the vorticity caused by theboundary layer at the bottom of the treatment unit. Figure 3-4 illustrates the origin ofsecondary flows in a curved flow path (Shapiro, 1969). As fluid approaches a curve,there is no vertical component of vorticity (C, normal to page) and no streamwisecomponent of vorticity (B). However, there does exist a transverse component ofvorticity (A), which is generated by the viscous boundary layer at the bottom of thechannel. As the fluid element moves through the curve, the vertical component ofvorticity (C’) remains zero, but the streamwise vector (B’) rotates counterclockwise. Tomaintain the net vertical vorticity (C’) as zero, the existing transverse vorticity mustrotate an equal amount clockwise. In so doing, the transverse vector develops astreamwise component of vorticity. This vorticity manifests itself as a clockwisecirculation (looking downstream). In a bend of a river channel, this streamwisecomponent of vorticity acts to scour sediment from the outside of the bend and deposit iton the inside of the bend.

Stormwater Treatment Technology Review
17
Figure 3-3: Generation of a transverse component of vorticity by shear forces in theboundary layer. As a pair of mutually perpendicular, infinitesimal fluid lines move fromposition 1 to position 2, frictional effects in the boundary layer impart an element ofvorticity in a direction transverse to the boundary (normal to the page) (Adapted fromShapiro, 1969).
VelocityProfile
BoundaryLayer
Wall
(1) (2)

Stormwater Treatment Technology Review
18
Figure 3-4: Generation of a streamwise component of vorticity in a curved channel. As afluid element approaches a curve, there is no vertical component of vorticity (C, normalto page) and no streamwise component of vorticity (B). There does exist a transversecomponent of vorticity (A), which is generated by the viscous boundary layer at thebottom of the channel. As the fluid element moves through the curve, the verticalcomponent of vorticity (C’) remains zero, but the streamwise vector (B’) rotatescounterclockwise. To maintain the net vertical vorticity (C’) as zero, the existingtransverse vorticity must rotate an equal amount clockwise. In so doing, the transversevector develops a streamwise component of vorticity. (Source: Shapiro, 1969)
B’
C’
A’
C
B
A
Flow Direction

Stormwater Treatment Technology Review
19
In a swirl concentrator, the primary current is the visible swirl generated by the flow ofstormwater through the tangential inlet. Because this primary current is a continuouscircular flow field, secondary currents are maintained in the treatment unit. A conceptualrepresentation of the effect of secondary currents in a vortex treatment unit is shown inFigure 3-5. Sediment settles to the bottom of the unit by gravity and is then concentratedin the center of the unit by secondary currents.
3.4 Reported Performance and Design Methods
As stated previously, gravity separation is a necessary component of the treatmentmechanism of a swirl concentrator. Particles with a slow settling velocity and non-settleable particles (i.e., particles on which gravitational forces and buoyant forces ofapproximately the same magnitude act) may escape treatment for the following reasons:
1) The particles do not settle into the zone of influence of the secondary currents2) The particles do not remain in the accumulated sediment pile
It has been reported (Vortechnics TM, 1998; Deamer et. al., 1994; H.I.L Technology,2000) that removal efficiencies decrease with particle size in swirl concentrators. H.I.L.Technology (2000) states that vortex separation technology is not expected to achieveremoval of non-settleable solids. Generally defined, non-settleable solids are those thatremain in suspension after a specified settling time of 1 hour (APHA, 1987). These aregenerally particles less than 10-20 µm. Based on a review of existing performance data,Field and O’Connor (1996) report the limit of suspended solids removal effectiveness ina vortex separator is for particles with a settling velocity of 0.10 – 0.14 cm/sec (3.6 – 5.0m/hr). Particles with a settling velocity lower than this are not expected to be effectivelyremoved in a swirl concentrator. Based on Stokes Law, this minimum settling velocity isassociated with a particle with spherical diameter of approximately 40-µm and a specificgravity of 2.65 at 20oC (Wanielista and Yousef, 1993).
Figures 3-6 and 3-7 illustrate the effect of decreasing particle size and increasing flowrate on solids removal efficiency for a Vortechs™ unit and a Downstream Defender™unit, respectively. These results, obtained by the respective manufacturers underlaboratory conditions, illustrate that solids removal efficiency declines with decreasingparticle size and increasing flow rate. In both cases, a decline in removal efficiency is notobserved at very low flow rates. These data indicate that there is not a minimum flowrate necessary to establish secondary currents and achieve treatment in a swirlconcentrator. Rather, gravity separation remains the primary removal mechanism at lowflow rates.
The following section provides an overview of modeling efforts, laboratory tests, andfield evaluations conducted on swirl concentrators. The modeling efforts are importantdesign tools for the development and testing of swirl concentrators. Designs of swirlconcentrators are frequently based on data derived from the testing of model-scale unitsand on the use of dimensionless parameters to scale-up the design to larger units.

Stormwater Treatment Technology Review
20
Plan View
Accumulated Sediment
Secondary Currents
Figure 3-5: Conceptual representation of primary and secondary currents in a swirlconcentrator. Secondary currents, generated by circular flow path of the primarycurrents, act to concentrate solids in the center of the treatment unit.
Cross Section View
AccumulatedSediment
Primary Currents
Inlet Pipe
Stormwater Treatment Technology Review
21
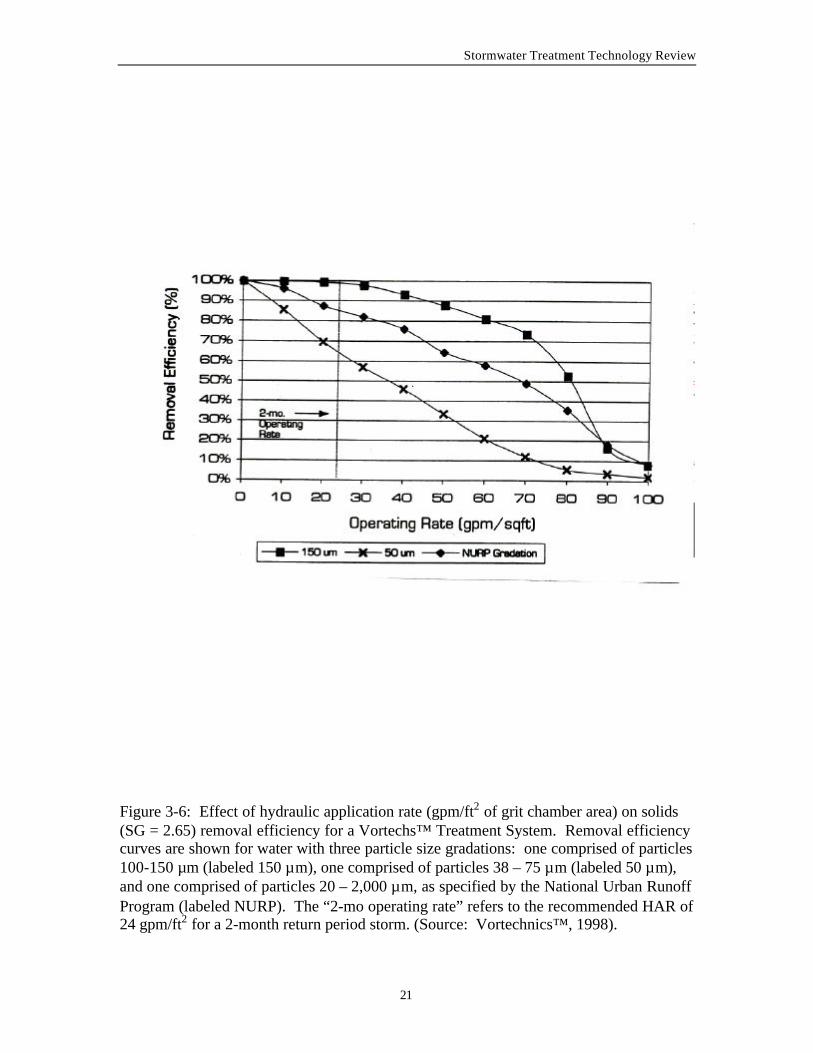
Figure 3-6: Effect of hydraulic application rate (gpm/ft2 of grit chamber area) on solids(SG = 2.65) removal efficiency for a Vortechs™ Treatment System. Removal efficiencycurves are shown for water with three particle size gradations: one comprised of particles100-150 µm (labeled 150 µm), one comprised of particles 38 – 75 µm (labeled 50 µm),and one comprised of particles 20 – 2,000 µm, as specified by the National Urban RunoffProgram (labeled NURP). The “2-mo operating rate” refers to the recommended HAR of24 gpm/ft2 for a 2-month return period storm. (Source: Vortechnics™, 1998).

Stormwater Treatment Technology Review
22
Figure 3-7: Effect of hydraulic application rate (gpm/ft3 of treatment unit volume) onremoval efficiency of a Downstream Defender™ for total suspended solids and forparticles greater than 150 µm (Source: H.I.L. Technology, 2000).

Stormwater Treatment Technology Review
23
In the original design of the CSO flow regulator/settleable-solids concentrator, EPA(1978) conducted hydraulic and mathematical modeling to develop an optimum designconfiguration. Results of the modeling were then tested at a large pilot facility receivinguntreated sewage in Toronto, Canada. Pilot testing indicated that the 12-ft diameterswirl concentrator achieved 60% and 42% removal of settleable solids for an HAR of 1.8gpm/ft2 and 2.8 gpm/ft2, respectively. Further, TSS removal efficiencies of 43% and25% were observed for the same two HARs. Analysis of the settling velocity of influentsolids to the pilot facility indicated that 60-80% of the solids had a settling velocity of 0.2cm/sec or greater. The study concluded that the primary advantages of swirlconcentrators over traditional primary settling tanks were a higher HAR and a lowerdetention time to achieve comparable solids removal. However, it was also concludedthat the swirl concentrator was less economical than conventional settling tanks forapplications where greater than 60% removal of suspended solids is required.
Based on the results of the modeling and pilot evaluations, EPA (1978) developed adesign procedure based on empirical design charts relating solids removal efficiency towastewater flow rate for units of varying diameters. Once the desired removal efficiencyis picked, the corresponding diameter can be chosen, the remaining unit dimensions (e.g.,inflow pipe diameter, weir height, etc.) are given in proportion to the unit diameter. Asstated previously, however, these design procedures and performance estimates werebased on the analysis of swirl concentrators receiving untreated sewage and thereforemay not be applicable to the evaluation of “ultra-urban” technologies. Solids in sewageare lighter, more organic, and have different settling characteristics than those instormwater. This is believed to be the main factor that allows “ultra-urban” units such asthe Vortechs™ and Downstream Defender™ to achieve higher solids removalefficiencies at higher HARs than the original EPA swirl concentrator.
Andoh and Smisson (1994) reported results comparing removal efficiencies based on asemi-empirical design model to observed removal efficiencies at several wastewatertreatment sites. The model was developed for the Storm King TM unit, a precursor toH.I.L. Technology’s Downstream Defender TM, but with a separate underdrain for solidsremoval (similar to the original EPA CSO swirl concentrator). The general form of themodel is as follows:
D2Sv/Q = KaKb[(N/R)(1-P/P)]0.5 (3-2)
where:D = diameter of separator, ftSv = settling velocity of particle, ft/secQ = flow rate, ft3/secN = ratio between solids concentration in the underflow to that in the overflowR = ratio of overflow to underflow flow ratesP = underflow proportion (underflow flow rate / Q)Ka = empirical coefficient, unitlessKb = empirical coefficient, unitless

Stormwater Treatment Technology Review
24
The empirical coefficients Ka and Kb were derived for several tank arrangements andgeometries based on calibration of separator units. The reported comparisons betweenmodel predictions agreed closely with observed removal efficiencies for several operatingunits. Both this study and the EPA (1978) design guidelines discussed earlier illustratethe practical value of empirical design models to describe the complex flow field andsolids removal mechanism of swirl concentrators.
Deamer et. al. (1994) conducted a detailed dimensional analysis, involving 13 parametersand 3 dimensions, to model the hydrodynamics of vortex separators. The relationshipbetween the Froude number and removal efficiency was examined for three differentlysized units and two particle size ranges. The relationship was found to be similar for thedifferently sized separators for particles with settling velocities in the range of 0.26 – 0.57cm/sec; however, the relationship did not hold between different separators for largerparticles (settling velocity range of 0.79 – 1.97 cm/sec). The authors speculated that therelationship did not hold because of different inlet Reynolds numbers between units.This illustrates conflicting design requirements between Froude similarity and Reynoldssimilarity.
Vortechnics Inc. (2000) reported results for 7 months of monitoring a Vortechs™ unitreceiving runoff from a building and parking lot in Yarmouth, Maine. An overallremoval efficiency of 80% was reported based on flow-weighed influent and effluentsamples for 20 storms.
Brombach et al. (1993) monitored a pair of vortex separators receiving CSO in Tengen,Germany during 6 storms over a four-month period. The units were equipped withseparate “foul-water” underflows to remove concentrated solids. Based on massremoval, efficiencies were reported for TSS (32% - 91%), settleable solids (29 – 97 %),chemical oxygen demand (30% - 92%), and phosphorous (46%; one storm only).Comparison of particle size distributions between underflow and overflow samplesindicated that separation was achieved only for particles with a diameter greater than 30microns.
Pisano et. al. (1984) reported results for a pilot-scale swirl concentrator (10.5-ft diameter)with solids underflow receiving stormwater from a separate storm sewer. A non-flowweighted average TSS mass removal of 28% was reported. This low removal efficiencywas attributed to the silty nature of the stormwater and the associated low settlingvelocities (Field and O’Connor, 1996).
A large swirl concentrator facility in Washington D.C. (Pisano et al., 1984) exhibited anet TSS removal efficiency of 12%. This was attributed to low settling velocities ofparticles in the influent (Field and O’Connor, 1996). Fifty percent of the influent TSShad settling velocities less that 0.1 cm/sec (3.6 m/hr).
Vortechnics Inc. (1999b) conducted laboratory tests on a full-scale (2.8 cfs) Vortechs™unit to evaluate oil and grease removal. 10w40 motor oil was added to the influent to

Stormwater Treatment Technology Review
25
produce concentrations between 15 – 90 mg/L. Removal efficiency was observed todecline with HAR; for example, 90% removal was observed at HAR = 24 gpm/ft2, and10% removal was observed at HAR = 100 gpm/ft2.

Stormwater Treatment Technology Review
26
Section 4: Screening Technologies
For the purposes of this review, screening technologies are considered separately fromfiltration technologies. This distinction is based fundamentally on the size of individualparticles removed by each technology. Screening refers to the removal of largerparticles, gross debris, and trash via flow through a permanent separation element (i.e.,screen). Filtration (Section 5) refers to removal of finer particles by a replaceable filtermedia. The application of direct screening processes is common in stormwater andcombined sewer systems. Direct screening refers to the alignment of screen aperturesdirectly into the flow path. “Trash racks” are the most commonly used direct screeningprocess; other direct screening systems, with bar spacings as fine as 6mm, are also used(Wong, 1997). However, direct screening mechanisms are susceptible to blocking andassociated discharge reduction and potential for flooding. Continuous DeflectiveSeparation (CDS®), manufactured by CDS Technologies®, Morgan Hill, California, wasselected for detailed evaluation in this review because of an innovative design approachto prevent blocking of a screen system.
4.1 Continuous Deflective Separation (CDS®)
CDS® involves the removal of solids from stormwater by an indirect, non-blocking, andnon-mechanical screening mechanism. A schematic of a CDS® unit is shown in Figure4-1. Stormwater is diverted from the conveyance system by a weir, enters the treatmentunit through a tangential inlet, and flows in a circular path across a stainless steel screen.Available screen apertures range from 0.6 - 4.7 mm. Selection of the appropriate screensize is based on site-specific characterization of particles and debris in the stormwater tobe treated. A screen aperture of 4.7 mm is typically used for CSO applications or forrunoff with large amounts of gross trash and debris. A screen aperture of 1.2 mm is morecommonly used for stormwater applications. Settleable solids that do not pass throughthe screen accumulate in the catchment sump, and floatable contaminants, trash, anddebris remain on the water surface. Oil can be removed in the unit if optional sorbentsare added to the treatment chamber. Stormwater flow in excess of the design flowbypasses the unit over the diversion weir and continues in the conveyance system. Theunit is periodically cleaned out with a vacuum truck to remove accumulatedcontaminants. CDS Technologies® manufactures pre-cast units with treatment capacitybetween 1.1 – 50 cfs, ranging in diameter from 6 – 17.5 ft, with a sump capacity of 5.3 –14.1 yd3. The corresponding HARs range from 17 – 93 gpm/ft2. Cast-in-place units withpeak treatment capacity up to 300 cfs are also available.
CDS Technologies® recommends sizing the unit to treat smaller, frequent storms, suchas the 3- or 6-month storm events. This recommendation is based on hydraulic modelingreported by Wong (1997), in which 100 years of recorded rainfall data for Melbourne,Australia were used to assess the “diversion efficiency” of a stormwater treatment deviceas a function of the diversion weir height. Diversion efficiency is defined as thepercentage of total runoff that is diverted from the conveyance system to the treatmentunit. Results indicated that a weir height set to bypass flow in excess of a 3-month eventachieved a diversion efficiency of 93% (i.e., 93% of the volume of stormwater over a

Stormwater Treatment Technology Review
27
Figure 4-1: Schematic of CDS® unit (Source: CDS Technologies® Internet Page:www.cdstech.com.au/usa/index.html )

Stormwater Treatment Technology Review
28
100-year period was diverted into the treatment unit). These results indicate that themajority of stormwater flow over a 100-year period will receive treatment even if theweir is set to bypass the unit as frequently as four times per year. As will be shown in thediscussion of the CDS® treatment mechanism (Section 4.2), inlet velocity to thetreatment chamber is an important factor in preventing screen blockage. Sizing a CDS®unit to treat only smaller, more frequent storms helps to prevent long periods duringwhich the unit receives a flow much lower than its design flow (i.e., long periods duringwhich the inlet velocity is very low).
4.2 Treatment Mechanism
In contrast to vortex separators, the CDS® unit does not rely on secondary currents toconcentrate solids in the center of the treatment unit. Rather, trash, debris, and particlesin the influent are removed by a non-blocking stainless steel screening mechanism. Thescreen apertures are elliptical and are aligned with the longer ellipse axis in the verticaldirection. The width of the shorter ellipse axis is a design specification that depends onsite-specific needs and stormwater characteristics. The available width range of screenapertures is 0.6 - 4.7 mm.
The screen surface area is large relative to the inlet pipe area, resulting in a radial flowvelocity through the screen that is an order of magnitude lower than the inlet pipevelocity (Wong, 1997). A surface velocity distribution for a CDS® unit from Wong(1997) is provided in Figure 4-2. As shown in Figure 4-2, the highest tangentialvelocities are observed on the outer unit wall, adjacent to the separation screen. Thisvelocity distribution maintains a constant shear force across the screen when water isflowing into the unit. Because of the slow radial velocity of water through the screen, thepressure differential force acting on particles in a direction perpendicular to the screen issmall relative to the tangential shear force. Particles are prevented from being heldagainst the screen by this significantly higher tangential shear force compared to lowpressure differential force perpendicular to the screen (Wong, 1997). This mechanismallows the unit to achieve removal of particles and debris without blocking the screen.
The mechanism by which particles smaller than the screen aperture size are removed by aCDS® unit is not well understood (Wong, 1997). Particles with a higher settling velocitywill tend to settle to the collection sump more quickly and will thus have less “exposuretime” near the screen; consequently, there is a lower probability of these particles passingthrough the screen. Conversely, particles with a low settling velocity will not settle to thecollection sump as quickly and will therefore be exposed to the screen for a longer periodof time. This will increase the probability that these particles will pass through the screenand not be removed by the unit.
Wong (1997) states that the relationships between inlet pipe velocity and tangentialvelocity are “near-linear” relationships, and that the ratio of tangential velocity to radialvelocity is consistent for a wide range of discharges. Further, Wong (1997) reports thattracer studies have indicated that flow rates through the screen are highest near the inlet

Stormwater Treatment Technology Review
29
Figure 4-2: Surface velocity profile for a CDS® unit, showing that the highest tangentialvelocities are maintained adjacent to the screen. The units of velocity are m/sec (Source:Wong, 1997).

Stormwater Treatment Technology Review
30
and decrease with increasing distance along the screen from the inlet. However, furtherdetails on this work are not available.
4.3 Reported Performance and Design Methods
Wong (1997) and researchers at UCLA and Portland State University (Stein, 1999) havereported removal efficiencies for CDS® units as a function of particle size and screenaperture size. Results of both studies are summarized in Table 4-1 (from Stein, 1999).The tests were conducted under laboratory conditions using graded sand and coarsesediment particles (SG = 2.65). For the 4.7 mm screen evaluation, the particle sizereported in Table 4-1 is the average size of the particles in a particular gradation. For the1.2 mm screen evaluation, the range of particle sizes in each gradation is reported.
Table 4-1: Screening Efficiencies as a Function of Particle Size (S.G. = 2.65)for 1.2 mm and 4.7 mm Screen Apertures for a CDS® Unit
4.7 mm Screen 1.2 mm ScreenAverage Particle Size
(µm)Particle Removal
Efficiency (%)Particle Size Range
(µm)Particle Removal
Efficiency (%)>4,700 100 >1,200 1002,350 100 420-600 931,567 93 300-420 85940 50 144-300 30
84-144 22Source: Stein, 1999
The data in Table 4-1 illustrate that the CDS® unit is capable, under laboratoryconditions, of removing particles that are smaller than the aperture size. Further, removalefficiency is observed to decline with decreasing particle size. Wong (1997) conducted asimilar laboratory evaluation to determine the effect of inlet pipe velocity on sandtrapping efficiency for a CDS® unit with screen apertures of 2.4 mm. The removalefficiency for six sand gradations, with mean diameters ranging from 200-780 µm, wascalculated at inlet pipe velocities of 0.5, 1.0, and 1.4 m/sec. The results of this evaluationare provided in Figure 4-3 and indicate that the unit removed particles smaller than thescreen aperture size. Further, removal efficiency was observed to decline with decreasingparticle size, and removal efficiency was observed to be largely independent of inflowvelocities for the range tested (Wong, 1997).
Jago (1997) conducted an analysis of litter and sediments captured from a CDS® unitreceiving runoff from a 50-hectare mixed commercial/residential suburb of Melbourne,Australia. Litter and sediment that accumulated in the unit over a 97-day period werecollected during a routine cleanout and sampled for laboratory analysis. Theaccumulation rate of litter and sediment in the unit was calculated as 0.1m3/ha/year,based on an assumed bulk density of litter and sediment of 1,500 kg/m3. Dry-weightpercent compositions of gross litter (26%), vegetative matter (39%), and inorganicsediments (35%) were reported. Particle size analysis of the captured sediments,conducted after combustion at 700 oC, indicated that 85% of the particles (by weight) was

Stormwater Treatment Technology Review
31
Figure 4-3: Relationship between pipe inlet velocity and solids removal efficiency for aCDS® unit with screen apertures of dimension 2.4 mm by 7.0 mm. Results for 6 sandgrain (SG = 2.65) size ranges and 3 inlet pipe velocities are shown, indicating thatremoval efficiency declines with decreasing particle size, and that removal efficiency islargely independent of inflow velocities for the range tested (Source: Wong, 1997).

Stormwater Treatment Technology Review
32
smaller than the screen aperture size of 4.7 mm, with 50% of the material being smallerthan 200-µm and 11% being smaller than 50 µm.
Jago (1998) conducted an analysis of sediments collected in a CDS® unit with receivingrunoff from a 217-hectare catchment at the Melbourne Airport in Australia. Sedimentthat accumulated over a 33-day period, during which 1.5 cm of rain fell, was collectedand sampled for laboratory analysis. Particle size distribution of the sediment, conductedafter combustion at 600 oC, indicated that a wide range of particle sizes were captured inthe unit, from less than 50 µm up to 10 mm. Approximately 90% of the particles (byweight) were larger than 0.5 mm, and 50% were larger than 2 mm. The unit wasequipped with a 4.7-mm aperture screen.
Allison et al. (1998) monitored a CDS® unit in Australia for a period of 12 months andconcluded that it achieved a 99% removal efficiency for gross pollutants larger than thescreen aperture size (the remaining 1% that was not removed was contained in water thatbypassed the unit during high flows). Water quality monitoring was also conducted bycollecting influent and effluent samples for 7 storms during the evaluation. The samples,collected during the initial phase of the storms, indicated that the CDS® unit reducedTSS concentrations from above 200 mg/L to a range of 150 – 200 mg/L. When influentTSS concentrations were below 150 mg/L, the CDS® unit did not appear to achieve anyfurther reduction in TSS. This limited removal efficiency may be a function of the screenaperture size in the unit, which was 4.7 mm, and the concentration of fine particles in thestormwater. The data in Table 4-1 for a 4.7 mm screen indicate that removal efficiencydeclines with decreasing particle size, with only a 50% removal efficiency observed forparticles with an average diameter of 940 µm. Therefore, the reduction in TSS fromabove 200 mg/L to 150 mg/L observed by Allison et. al (1998) may have been related tothe removal of larger particles in the stormwater. However, particle size distributionresults for the stormwater were not reported, so this cannot be confirmed.
An evaluation at UCLA (reported in Stein, 1999) found that 80% of free oil and greasewas removed by a CDS® unit under laboratory conditions by adding polypropylene andco-polymer sorbent material to the separation chamber.

Stormwater Treatment Technology Review
33
Section 5: Filtration Technologies
As discussed in Section 4, filtration technologies are distinguished from screeningmechanisms in two regards:
• Filtration technologies are typically capable of removing finer particles thanscreening
• Filtration is accomplished by a replaceable filter media
Effective removal of TSS and other parameters from stormwater has been achieved hasbeen achieved with sand filters; however, these systems are expensive to construct andrequire frequent maintenance to ensure proper hydraulic performance (e.g., Keblin et al.,1997). “Ultra-urban” filtration systems are designed to required less space and requireless maintenance than traditional filters. The Stormfilter™ system, manufactured byStormwater Management, Portland, Oregon, was selected for detailed examination in thisreview because of the innovative filter cartridge design and the range of available filtermedias.
5.1 Stormfilter™ System
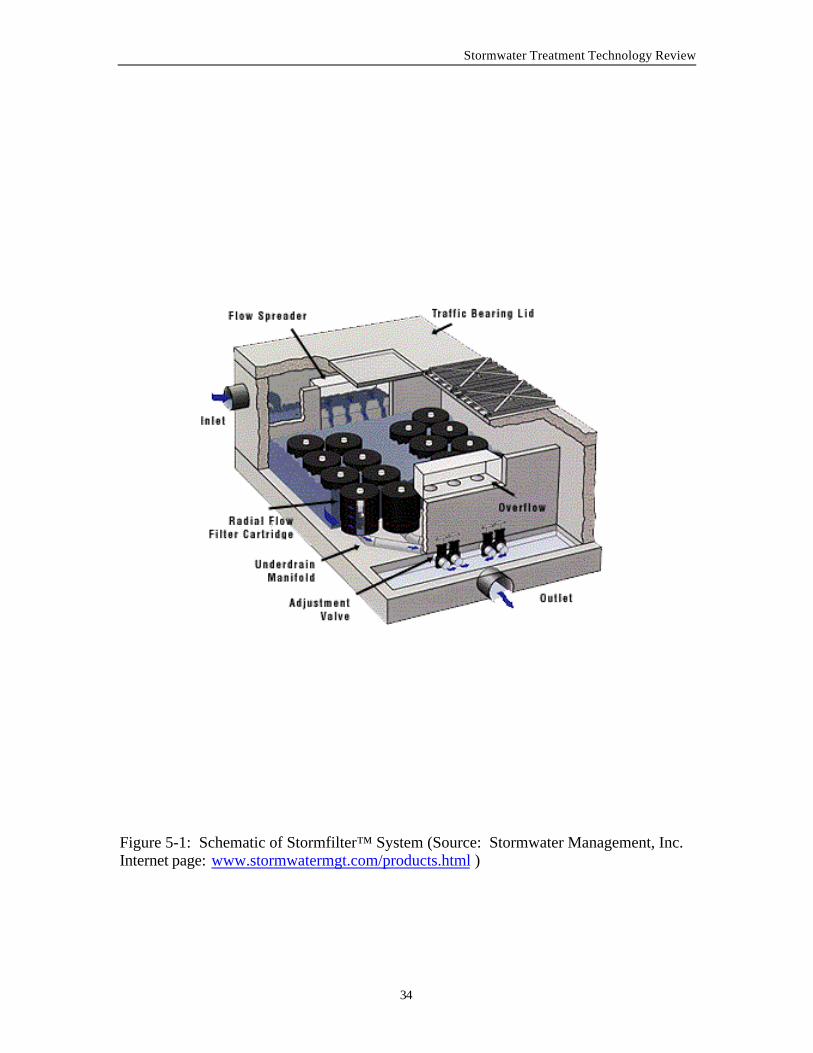
A schematic of the Stormfilter™ system is shown in Figure 5-1. Influent first enters apretreatment bay, where heavy sediments settle out and floatable contaminants aretrapped. Water exits the pretreatment bay via a flow spreader into the main filtrationvault and gravity flows through filter cartridge units. The effluent from each filtercartridge is collected in an underdrain system and flows to the outlet bay. Flow in excessof the filtration capacity bypasses the filter cartridges and flows directly to the outlet bay.The treatment capacity of pre-cast units is variable and depends on the number ofcartridges in the treatment unit. Each filter cartridge is approximately 19” in height and19” in diameter (corresponding to an approximate cartridge surface area of 7.9 ft2), andhas a design hydraulic capacity of 15 gpm. This corresponds to a HAR of approximately1.9 gpm/ft2 of cartridge surface area. Maintenance for the units involves minor pump-outof water from the unit and replacement of the filter cartridges. Stormwater Managementestimates that maintenance for an 8’ x 16’ unit with 30 cartridges (treatment capacityapproximately 1 cfs) is typically required once per year (depending on contaminantloads) and takes approximately 2.5 hours.
The primary operational feature of the Stormfilter™ unit is the filter cartridge (Figure 5-2). During a storm, the float system in the center of the filter cartridge primes a siphonthat draws stormwater through the filter media to the central drainage tube. As thetreatment vault fills with water, trapped air is purged from the beneath the cartridge hoodthrough the air relief valve. No filtration occurs until the water level rises to near the topof the cartridge; at this point, buoyant forces lift the float and allow water to exit throughthe underdrain. The air relief valve closes simultaneously and creates the siphon effect,which increases flow potential across the media and helps to distribute contaminantsalong the entire height of the filter media. The siphon effect continues until the waterlevel drops to the bottom lip of the cartridge hood. At this point, the siphon is broken and
Stormwater Treatment Technology Review
34
Figure 5-1: Schematic of Stormfilter™ System (Source: Stormwater Management, Inc.Internet page: www.stormwatermgt.com/products.html )

Stormwater Treatment Technology Review
35
Figure 5-2: Cross Section of Stormfilter™ filter cartridge (Source: StormwaterManagement, Inc. Internet page: www.stormwatermgt.com/engin.html )

Stormwater Treatment Technology Review
36
air bubbles are forced under the hood, agitating the surface of the filter media. Thiscreates a self-cleaning mechanism that causes a portion of the accumulated sediment todrop to the floor of the vault.
5.2 Treatment Mechanism
The mechanism by which contaminants are removed by a Stormfilter™ system dependson the type of media being used. Stormwater Technology manufactures several types offilter media that can be placed interchangeably in the filter cartridges. The appropriatefilter media depends on site-specific discharge requirements and stormwatercharacteristics. Available media and the associated treatment mechanisms aresummarized as follows:
• Perlite, or aluminum silicate, a naturally occurring volcanic ash; used for TSS andoil/grease removal. Suspended particles are trapped in angular projections on themedia.
• CSF® Leaf Media, made of deciduous leaves that are composted and granulated;used for TSS, oil/grease, and soluble metals. Suspended particles are trapped onprojections on the media, and soluble metals and oil/grease adsorb to the media.A disadvantage of this media is that it can increase phosphorous and nitrateconcentrations in treated water.
• Zeolite, a naturally-occurring mineral; used to remove soluble metals, ammonium,and some organics. A modified zeolite, termed surface modified zeolite (SMZ),has a positive charge on the surface that attracts and captures anions such asortho-phosphorous and nitrate.
• Pleated fabric insert, for removal of finer TSS. Two pore sizes are available: 30µm and 70 µm. The fabric insert fits inside the standard filter cartridge, leaving aspace between the insert and the central drainage tube where granular media canbe placed.
• GAC, granular activated carbon. Organics and oil/grease adsorb to the surface ofthe media.
• Iron-Infused Media, an open-cell media infused with small bit of iron; this mediacarries a 3+ surface charge and is used to remove phosphorous, soluble copper andzinc.
5.3 Reported Performance and Design Methods
Many reports exist in engineering trade journals regarding the Stormfilter™ system (e.g.,ENR, 1997; Water, Environment, and Technology, 1997; Pollution Engineering, 1997).However, these reports do not typically contain water quality monitoring data. Onestudy, conducted by the Unified Sewerage Agency of Washington County, Oregon, wasreported in ENR (1997). This study, conducted over a three-year period, concluded that a
Stormwater Treatment Technology Review
37
Stormfilter™ system using CSF® media exhibited removal efficiencies up to 90% forTSS, 85% for oils and grease, and 82-98% for metals.
Wigginton and de Ridder (1999) reported and overall TSS removal efficiency of 73.8%(mass basis) for a single Perlite-filled Stormfilter™ cartridge under laboratory conditions.The influent particle gradation was comprised of 3.5% clay, 60% silt, 30% fine tomedium sand, and 6.5% coarse sand, with 82% of the particles smaller than 106 microns.TSS removal efficiency did not decline as sediment accumulated in the unit. Thefiltration rate through the cartridge was initially14.1 gpm (1.79 gpm/ft2) and dropped byonly 3.5% after 13 lbs (dry wt) of sediment had been removed. A 44% decrease infiltration rate was observed after 20 lbs of sediment were removed, and the filtration rateapproached zero after 23.6 lbs of sediment had been removed. Of the total mass ofsediment removed (23.6 lbs), 65% (15.4 lbs) were removed by the filter cartridge and35% (8.3 lbs) settled out on the floor of the treatment tank. It was estimated that themajority of particles removed were greater than 30 microns.
Stormwater Management (2000) conducted laboratory tests to evaluate equilibriumadsorption of phosphorous to iron-infused media. Adsorption is typically modeled by thestudy of isotherms, or equilibrium relationships between contaminant concentration in thefluid phase and concentration in the adsorbent particles. Isotherms that are convexupward are considered favorable, because a relatively high contaminant loading on themedia can be obtained at low contaminant concentrations in the fluid. Conversely,isotherms that are concave upward are unfavorable because relatively low contaminantloadings on the media are obtained. Isotherm data collected by Stormwater Management(2000) are shown in Figure 5-3. A near linear adsorption isotherm was observed up to amedia loading of 779 mg P / kg media and a fluid concentration 42 mg ortho-P / L.
Stormfilter™ (2000) also conducted laboratory tests to assess removal efficiencies forTSS and dissolved phosphorous on a horizontal flow column containing 4 inches ofPerlite media surrounding 3 inches of iron-infused media. The particle size distributionof the test water was similar to that of Wigginton and de Ridder (1999), with 82% of theparticles being smaller than 106 µm. Ten trials were conducted, each involving thefiltration of 12 L of water at a flow rate set to simulate the design flow rate of 15 gpm.TSS removal efficiencies increased from 23% to 60% over the first 5 filtration cycles,indicating that the filter media matured and stabilized. Removal efficiency then rangedbetween 60 – 76% for 5 subsequent filtration cycles, with an overall efficiency of 58%.Average dissolved phosphorus removal was 47% for 10 experiments with an influentconcentration range of 0.02 – 0.32 mg ortho-P/L.

Stormwater Treatment Technology Review
38
Figure 5-3: Ortho-phosphorus equilibrium adsorption isotherm for iron-infused media(Source: Stormwater Management, Inc., 2000).

Stormwater Treatment Technology Review
39
Section 6: Performance Evaluation
The following section provides an overview of procedures used to evaluate theperformance of stormwater treatment technologies. A discussion of “storm event mass-based” and “hydrology-based” performance monitoring methodologies is provided, and aproposed procedure for demonstrating the effectiveness of new stormwater treatmenttechnologies is summarized.
6.1 Storm Event Mass-Based Calculation of Removal Efficiency
A number of publications (Minton, 2000; APWA, 1999; Field and O’Connor, 1996;Brombach et. al., 1993) have recommended that the performance evaluation ofstormwater treatment technologies be based on the mass of contaminants removed by atreatment unit during an entire storm event. Performance results for several of thetechnologies discussed in this paper indicate that contaminant removal efficiency isaffected by both the hydraulic load to the unit and the concentration and nature ofsuspended solids in the influent. Efficiency declines with increasing flow rate throughthe unit and increases as the influent contaminant concentration increases (Minton, 2000).Thus, storm event mass-based removal efficiency has three main limitations:
1) For each monitored parameter, only one removal efficiency calculation isobtained per storm event.
2) The calculated removal efficiency represents not only the treatment efficiency ofthe unit, but also the characteristics of the storm event with possibly varying flowrate and influent contaminant concentrations.
3) Because regional storm hydrographs vary widely, the ability to use mass-basedperformance data from one site to predict performance at another site is limited.
Storm event mass-based evaluation requires that both concentration and flow rate bemeasured for the duration of each monitored storm. Field and O’Connor (1996)summarize a mass-based performance monitoring approach to calculate a flow-weighted,average pollutant concentration, or event mean concentration (EMC), for a storm:
M = ∑j [ cj Qj ∆tj ] (3-1)
V = ∑j [ Qj ∆tj ] (3-2)
EMC = M / V (3-3)
where:M = storm-flow-event pollutant mass loading, kgV = storm-flow-event volume, m3
EMC = storm-flow-event flow-weighted average concentration, kg/m3
cj = average pollutant concentration between samples, kg/m3
Qj = average flow rate between samples, m3/sec∆tj = time interval between samples, sec

Stormwater Treatment Technology Review
40
Removal efficiency for a given storm event is then calculated as:
Removal Efficiency = [ (Mi – Me)/Mi ] * 100% (3-4)
where:Mi = storm event mass loading for influent, kgMe = storm event mass loading for effluent, kg
6.2 Hydrology-Based Calculation of Removal Efficiency
The Environmental Technology Evaluation Center (EvTEC), in conjunction with theWashington State Department of Transportation (WSDOT) has developed a hydrology-based performance monitoring procedure to mitigate the limitations of storm event mass-based performance monitoring in the upcoming “Ultra-Urban” Stormwater TreatmentTechnology Evaluation in Seattle, WA.
The hydrology-based performance monitoring methodology to be used for theEvTEC/WSDOT evaluation is described fully by EvTEC (2000). As with the stormevent mass-based evaluation, the hydrology-based evaluation methodology requires thatboth concentration and flow rate be measured for the duration of each monitored storm.An automated time-paced sampling strategy will be used to monitor the concentrations ofTSS, metals, and other pollutants in the influent and effluent of multiple treatment units.The basic premise of the method is to monitor changes in contaminant concentration forindividual parcels of water that pass through the treatment unit. Influent and effluentsamples will be collected from treatment units at regular time intervals during the courseof a storm, and the influent hydrograph will be used to pair influent and effluent samplesfor individual “storm sampling periods.” The procedure for pairing influent and effluentsamples is as follows:
• Within the storm sampling period, inflow to the unit will vary by less than 20% ofthe peak flow for that storm sampling period.
• The storm sampling period will be at least 8 times the estimated detention time ofthe unit.
Once the hydrograph has been used to identify the storm sampling periods, samplescollected during each storm sampling period will be flow-weight composited into a singleinfluent sample and a single effluent sample for each storm sampling period. Thesecomposite samples will then be analyzed for individual pollutants. Removal efficiencyfor each storm sampling period will be calculated as:
Removal Efficiency (%) = [ (Ci – Co) / Ci ] * 100 (3-5)

Stormwater Treatment Technology Review
41
where:Ci = Flow-weighted influent concentration for the storm sampling period, mg/LCo = Flow-weighted effluent concentration for the storm sampling period, mg/L
To evaluate the data, removal efficiency will be correlated with the mean flow rate foreach storm sampling period. Because removal efficiency is affected by both theoperating flow rate and the influent concentration, results from the entire evaluation willbe grouped into multiple concentration ranges for each pollutant, and removal efficiencyas a function of operating flow rate will be determined for each concentration range. Asa hypothetical example, three separate graphs of removal efficiency versus operating flowrate may be generated for TSS data: one for samples with influent concentration less than50 mg/L, one for samples with influent concentration in the range 50 – 100 mg/L, andone for samples with influent concentration greater than 100 mg/L.
The intent of the EvTEC data evaluation procedure is to provide relationships betweenthe reduction of contaminant concentrations and the flow rate through a given treatmentunit for multiple influent concentration ranges. It is expected that these relationships canthen be applied for different stormwater flows and contaminant concentrations at otherlocations.
6.3 Proposed Protocol for Evaluating New Technologies
The Stormwater Managers Committee of the Washington Chapter of the American PublicWorks Association (APWA) developed a proposed protocol for local jurisdictions in thePuget Sound region to use for evaluation of new stormwater treatment technologies(APWA, 1999; the protocol is available at www.mrsc.org/environment/water/water-s/apwa/protocol.htm ). This protocol was developed to provide a tool by whichregulators can compare alternatives and select the most appropriate treatment technologyfor a given application. Traditionally, reliance has been placed on the application of“Best Management Practices (BMP),” whereby a specific technology is required for anapplication, but a treatment standard is not associated with the BMP. This practice isemployed because there is not currently a well-defined or enforceable performancestandard for stormwater treatment technologies. One existing informal standard is “anaggregate removal of 80% total suspended solids (TSS) over all storms” (APWA, 1999).The origin of this standard is obscure (APWA, 1999), but the 80% removal standard wasadopted in the Coastal Zone Act Reauthorization Amendments of 1990 and has also beeninformally adopted by some jurisdictions around the United States. However, thisstandard does not provide adequate guidance, such as sampling methodologies and dataevaluation procedures, to assess compliance.
Rather than attempting to establish formal performance criteria, the basic premise of theAPWA protocol is that in order to be acceptable, any new technology must perform aswell as an existing technology that has been approved by the Washington Department ofEcology (DOE) for stormwater treatment. These technologies are detailed in DOE(1992) and generally include infiltration systems, wet ponds, sand filtration systems,swales, and wetlands. However, performance data on these “approved” systems are

Stormwater Treatment Technology Review
42
sparse, including only 3 studies on grass swales, 2 studies on wet ponds, and 3 studies onsand filters (Minton, 2000). AWPA used these data to generate performance curvesrelating removal efficiency to influent concentration for TSS, phosphorus, and zinc (asurrogate measurement for other metals and contaminants). The performance curves(referred to as the “line of comparative performance”) are not based on a statisticalrelationship; rather, the line was manually drawn so that the majority of data fromapproved systems falls above the line (Minton, 2000).
The procedure to determine the performance of a new technology is to plot removalefficiency points as a function of influent concentration on the performance curves thatwere generated for grass swales, wet ponds, and sand filters. The data point to be plottedfor each storm is calculated as follows:
Storm Removal Efficiency = [ (EMCi – EMCe) / EMCi ] * 100% (3-6)
where:EMCi = event mean concentration for influent, kg/m3
EMCe = event mean concentration for effluent, kg/m3
The APWA protocol recommends that if 90% of the data points (80% for phosphorous)fall above the “line of comparative performance,” then the technology should beconsidered equivalent to an approved technology. The APWA protocol outlines datarequirements to be used in the comparison. These requirements are briefly summarizedas follows:
• One to three test sites, including medium density residential, retail commercial,and non-retail commercial areas
• A minimum of 10 storms per site, or 30 storms if only one site is studied
• Storm depth between 0.25 – 1.00 in; larger storms permitted if the technology’sdesign flow is not exceeded
• Storm runoff duration between 7.5 – 30 hr
• Average rainfall intensity between 0.02 – 0.08 in/hr; higher intensities permittedif the technology’s design flow is not exceeded
• A minimum of 10 sub-samples per storm; flow-weighted composite of these sub-samples to determine the EMC
• At least 75% of the volume of each storm must be sampled
• Analyses for TSS, pH, zinc, copper, cadmium, total phosphorus, bioavailablephosphorus, and total nitrogen
To calculate an overall efficiency based on all storms that were monitored for a givenunit, Minton (2000) and APWA (1999) recommend that the following formula beapplied:

Stormwater Treatment Technology Review
43
Overall Efficiency = [ (A-B) / A] * 100% (3-7)
where:A = geometric mean of all influent EMCs, kg/m3
B = geometric mean of all effluent EMCs, kg/m3
It is evident that this evaluation methodology requires an extensive investment of timeand money to establish the equivalency of a technology. As of May 2000, no“unapproved” technology had completed the comparison procedure.
Stormwater Treatment Technology Review
44
Section 7: Application of Technology Review Findings
The following section applies the findings of the technology review to develop anexample design protocol. This protocol is intended to illustrate the factors that must beconsidered when selecting and sizing an “ultra-urban” stormwater treatment unit. It alsoillustrates data limitations that complicate and add uncertainty to the selection and designof a treatment unit. In addition to the design steps presented below, individualtechnology vendors may have additional data requirements and design steps that shouldbe considered.
The following design protocol does not address the motivation for providing treatment toa specific stormwater source. There are numerous reasons why stormwater treatmentmay be required, primarily related to compliance with local, state, or federal water qualityregulations. Full consideration of these factors is beyond the scope of this paper;therefore, the protocol outlined below assumes that a decision has been reached thatimprovement of the water quality of a specific stormwater source is necessary.
Design Step 1: Characterize the Source
It is necessary to understand both the hydrology and the pollutant loads of the stormwatersource. When selecting an “ultra-urban” treatment unit, the peak flow rate, rather thanthe total runoff volume, is the most important hydrologic parameter. The peak flow ratecan be determined by a standard hydrological evaluation such as the rational method, inwhich runoff flow rate is calculated based on the intensity of rainfall, the size of thedrainage basin, and the basin land use (for example, the amount of impervious surface).Runoff flow rates should be calculated for rainfall intensities associated with variousdesign storms, such as the 3- and 6-month and the 1-, 2-, 5-, 10-, and 100- year returnperiod storms. To check the hydrology calculations, flows should be monitored at thepoint in the stormwater conveyance system where the treatment unit will be installed. Acomparison of flow in the system to rainfall intensity for several storms will allowcalibration of the hydrology evaluation. The end product of the hydrology evaluation is atable of peak runoff flow rates associated with several different design storms.
Water quality evaluations are necessary to characterize the type, concentration, andvariability of pollutants in the stormwater source. Analyses that may be conducted,depending on water quality and regulatory issues, include TSS, metals (dissolved andtotal), and nutrients. In addition, the results of this technology review suggest thatsettleable solids and particle size distribution analyses should be conducted. Waterquality samples should be collected during different portions of the storm hydrograph;specifically, samples should be collected during the onset of runoff, during the risinglimb of the hydrograph, and during the period of peak runoff. This will determine howcontaminant concentrations vary during the course of a storm. Sampled storms should bepreceded by an antecedent dry period of 2-3 days to allow for pollutant build-up in thedrainage basin.

Stormwater Treatment Technology Review
45
Design Step 2: Determine Treatment Goals
Specific treatment goals will depend on the regulations motivating the installation of thestormwater treatment unit. Two types of treatment goals are possible. The first is basedon achieving a specific water quality goal, such as an 80% reduction in TSS. This type ofrequirement for mass reduction based on a percent of the influent contaminant load istypical for stormwater applications. As discussed in Section 6, stormwater BMPs havebeen required to achieve 80% removal of TSS, but specific methods to measure thisremoval efficiency have not been formalized.
A second type of treatment goal is to achieve some degree of treatment for a specificdesign storm. For example, the Stormwater Management Manual for the Puget SoundBasin (DOE, 1992) requires that a BMP be used to provide treatment for flow up to the 6-month, 24-hr return period. However, there is not an associated water quality treatmentgoal for this requirement. It is important to note that these two types of treatment goalsare not necessarily mutually exclusive. For example, it is possible to have a requirementto achieve 80% TSS reduction for all storms up to a design storm. In addition, if sourcecharacterization (Design Step 1) indicated that the majority of pollutants are carriedduring the initial stages of a storm, it may not be necessary for a treatment unit to treatthe peak flow of a design storm to achieve a significant mass-reduction in pollutants. Theresearch conducted for this technology review indicated that there is currently no clearconsensus on what appropriate treatment goals should be applied to stormwater treatmentunits.
Design Step 3: Identify Site-Specific Constraints
Several site-specific factors must be considered for the location in the stormwaterconveyance system where a treatment unit is to be installed. First, it is necessary todetermine whether the unit can be installed in a parallel arrangement with the mainstormwater conveyance system so that only flows up to the unit’s design flow arediverted into the unit. Flows in excess of the unit’s design flow remain in the conveyancesystem and bypass the treatment unit. Vortechnics™ Inc. refers to this type ofinstallation as “off-line.” As discussed in Section 4, hydraulic modeling indicated thatdiverting flows only up to the 3-month storm event to a treatment unit still resulted intreatment of 93% of the total volume of stormwater over a 100-year period. Therecommendation to treat smaller, more frequent storm events and bypass larger,infrequent events, was noted in this technology review several times. This type ofinstallation allows better control of HAR and an increased ability to achieve consistenttreatment. It also permits the use of smaller, less expensive treatment units.
If site conditions are such that the unit must be installed directly in the conveyancesystem, it must be sized to convey the maximum design storm for the stormwaterconveyance system (for example, the 100-yr return period storm). It is important to notethat all of the units reviewed include an internal bypass, whereby peak flows are routedthrough the unit with minimal treatment. In some cases, however, internal bypasses havethe potential to allow resuspension and export of sediments from a treatment unit.

Stormwater Treatment Technology Review
46
Another site-specific constraint that must be considered is the available hydraulic head atthe point in the stormwater conveyance system where the treatment unit will be installed.“Ultra-urban” treatment units are designed to minimize head requirements; however, it isnecessary to contact a technology manufacturer in order to ensure that sufficient head isavailable for each application. Finally, the availability of electricity at the installation siteshould be considered. Although none of the units reviewed require electricity to operate,electrical power may allow process modifications or the installation of automatedmonitoring equipment.
Design Step 4: Select Treatment Unit
Selecting a specific treatment unit is perhaps the most difficult step in this designprotocol, due primarily to a lack of performance data that can be compared between units.Based on research included in this technology review, all of the units are capable ofachieving some degree of water quality improvement; however, it is not possible todetermine which units are most effective. Of the data that have been reported for theseunits, much of it was collected under laboratory conditions with synthetic stormwater.Data from field applications do exist, as reported in this technology review, but tests ofvarious units under standardized conditions of flow and pollutant concentration have notbeen conducted. Without sound comparative data, only a few general observations canbe made to compare the performance of the treatment units included in this technologyreview:
• Only the Stormfilter™ system addresses the removal of dissolved metals,nutrients, and organics.
• Stormfilter™ cartridges equipped with a 30-µm pleated fabric insert may be mosteffective at capturing fine and non-settleable solids, although specific data on thiswas not located.
• All units except CDS® include hydraulic controls to trap floatable debris and oil.CDS® has a physical control that captures floatable debris larger than the screenaperture size, and sorbents can be added to capture floatable oils.
• Due to the presence of secondary flows that augment gravity separation, swirlconcentration technologies are conceptually capable of achieving a higher degreeof treatment than technologies that are based strictly on gravity separation;however, no comparative data was located to verify this.
• A CDS® unit may be better suited for a stormwater source that carries excessiveamounts of gross trash and debris than for a stormwater source with a highconcentration of fine particles.
In the event that a CDS® unit is selected, it is necessary to select the screen aperture size,based on the particle size distribution of the stormwater. Also, if a Stormfilter™ unit is

Stormwater Treatment Technology Review
47
selected, the appropriate media must be chosen to obtain the treatment goals. In theabsence of comparative performance data, the final selection of a treatment unit may bebased more on cost (capital and maintenance) and other site-specific factors such asavailable space and hydraulic head.
Design Step 5: Size the Unit
Once a specific treatment unit is selected, correct sizing of the unit is essential to obtainreliable water quality improvement. The data from Design Steps 1-3 must be evaluatedto address the following specific design issues and to properly size a treatment unit:
• What is maximum flow rate to be treated? This flow rate may correspond to thepeak flow rate from a design storm, or to a “first-flush” flow rate (i.e., the flowrate from the rising limb of a storm hydrograph that carries the majority ofpollutants for that storm).
• What HAR should be used to achieve the treatment goals? Relationships betweenremoval efficiency and HAR were reported in this technology review forVortechs™ and Downstream Defender™, and the Stormceptor® model canproduce similar data for different sized units. Data similar to these are needed forother units to determine what size unit will achieve the treatment goals for thedesign flow rate. In addition, the effect of influent concentration on removalefficiency must be considered. For swales and wet ponds, removal efficiency isobserved to increase with increasing influent concentration (Section 6); however,no similar relationships were located for “ultra-urban” technologies. This datalimitation adds uncertainty to the process of sizing a unit to achieve a specifictreatment goal.
Well-documented relationships between HAR and removal efficiency for various influentconcentrations would provide a designer with valuable tools to size an “ultra-urban” unit;however, in lieu of such data, the designer and the technology manufacturer must worktogether to select an appropriately-sized unit. Technology manufacturers have specificprocedures that are employed in sizing a unit, many of which were discussed in thisreview. However, it is necessary for the designer to be aware of those factors outlinedabove when working with a manufacturer to ensure that the project goals are met.

Stormwater Treatment Technology Review
48
Section 8: Summary and Conclusion
Based on the technology review of “ultra-urban” stormwater treatment technologiespresented in this paper, the following conclusions are drawn:
1) Solids removal efficiency for several treatment units was observed to decline withincreasing hydraulic application rate (HAR) and with decreasing particle size. Nostudies were found that reported substantial removal of particles smaller than 30microns. Particle size distribution and settleable solids analyses should beundertaken as part of an analysis of the capability of an “ultra-urban” treatmentprocess. For stormwater with high concentrations of fine or non-settleableparticles (i.e., < 30 µm), “ultra-urban” technologies may not achieve acceptableperformance.
2) There is insufficient performance data for “ultra-urban” treatment processes todevelop a rational design approach that can be used for all treatment units. HARis a fundamental mechanistic design parameter, but is currently used only on alimited basis. Well-documented relationships between removal efficiency andHAR are needed to guide the selection and sizing of treatment units.
3) A design methodology that uses a peak flow rate based on a design storm eventand HAR versus treatment efficiency relationships would provide a rationaldesign basis for “ultra-urban” treatment technologies.
4) There is a lack of data relating the effect of influent concentration on removalefficiency for “ultra-urban” treatment units. This adds uncertainty to the sizing ofa unit to achieve a specific treatment goal.
5) There is a need for a streamlined process by which “ultra-urban” technologies canbe evaluated for their equivalency to existing BMPs. The time and expenseassociated with the proposed APWA protocol may deter technologymanufacturers from attempting to demonstrate BMP equivalency. Further,treatment performance should not be the only factor considered when comparing“ultra-urban” technologies to traditional stormwater treatment technologies suchas wet ponds and swales. “Ultra-urban” units can provide treatment in locationswhere the installation of traditional technologies may not be possible due to a lackof available space. This advantage should be recognized in any protocol designedto assess the equivalency of “ultra-urban” units.
7.1 Research Needs
Currently, there are a limited number of independent evaluations of “ultra-urban”stormwater treatment technologies. The upcoming EvTEC/WSDOT project has thepotential to fill a large gap in stormwater treatment research under controlled fieldconditions. In addition to the data limitations described in the above conclusions,research is needed to evaluate removal efficiencies for various particle sizes. It iscommonly reported (e.g., Characklis and Wiesner, 1997; Sansalone and Buchberger,1997) that certain stormwater pollutants such as metals and nutrients are associated with

Stormwater Treatment Technology Review
49
finer particles. If the goal of stormwater treatment is to removed metals and nutrients, inaddition to TSS, then it is critical to identify technologies capable of removing smallparticles.
Finally, expanded use of stormwater models is needed to evaluate the large-scaleeffectiveness of treatment units such as those discussed in this review. Urban wet-weather flow models, such as SWMM, are widely used to generate hydrographs andcontaminant distributions for urban runoff (Heaney et. al., 1999). However, theapplication of these models to “ultra-urban” stormwater treatment technologies has beenlimited. It appears, based on the research presented in this paper, that the limitedapplication of stormwater models is dictated by the lack of performance data fortreatment units. Without a thorough understanding of how these treatment units operateunder a range of flow rates and influent concentrations, model evaluations are potentiallysubject to a high level of uncertainty.

Stormwater Treatment Technology Review
50
References
Allison, R., T. Walker, F. Chiew, I. O’Neill, and T. McMahon. 1998. From Roads toRivers: Gross Pollutant Removal from Urban Waterways. Cooperative ResearchCenter for Catchment Hydrology, Department of Civil Engineering, MonashUniversity, Clayton, Australia.
American Public Works Association. 1999. Protocol for the Acceptance of UnapprovedStormwater Treatment Technologies for Use in the Puget Sound Watershed.Washington Chapter, APWA, Stormwater Managers Committee.
American Public Health Association, American Water Works Association, and WaterPollution Control Federation. 1987. Standard Methods for the Examination ofWater and Wastewater, 17th ed., American Public Health Association, Inc., NewYork.
Andoh, R.Y.G. and R.P.M. Smisson. 1994. High rate sedimentation in hydrodynamicseparators. In: A.J. Saul, ed., 2nd International Conference on HydraulicModeling, Mechanical Engineering Publications Limited, London, UnitedKingdom.
BaySaver®, Inc. 1999. BaySaver® Separation System Technical and Design Manual.Mount Airy, Maryland.
Brombach, H., C. Xanthopoulos, H.H., Hahn, and W.C. Pisano. 1993. Experience withvortex separators for combined sewer overflow control. Water Science andTechnology, 27: 93-104.
Characklis, G.W., and M.R. Wiesner. 1997. Particles, metals, and water quality inrunoff from large urban watershed. Journal of Environmental Engineering, 123:753-759.
CSR, Inc. The Stormceptor® System Technical Manual, Kansas City, Missouri.
Deamer, A.P., R.A. Fenner, S. Edwards. 1994. Hydrodynamic separators, dimensionalanalysis, and scaling laws. In: A.J. Saul, ed., 2nd International Conference onHydraulic Modeling, Mechanical Engineering Publications Limited, London,United Kingdom.
DOE. 1992. Stormwater Management Manual for the Puget Sound Basin. WashingtonDepartment of Ecology.
Engelund, F. and E. Hansen. 1967. A Monograph on Sediment Transport in AlluvialStreams. Teknisk Forlag, Copenhagen, Denmark.

Stormwater Treatment Technology Review
51
Environmental Protection Agency (EPA). 1978. The Swirl Primary Separator:Development and Pilot Demonstration. Municipal Environmental ResearchLaboratory, Cincinnati, Ohio. EPA-600/2-78-122.
EPA. 1978. The Swirl Primary Separator: Development and Pilot Demonstration.Municipal Environmental Research Laboratory, Cincinnati, Ohio. EPA-600/2-78-122.
ENR. 1997. Low-tech filtration system uses leaves to remove solids. September 1,1997, p. 12.
EPA. 1982. Swirl and Helical Bend Pollution Control Devices. MunicipalEnvironmental Research Laboratory, Cincinnati, Ohio. EPA-600/8-82-013.
EvTEC. 2000. EvTEC Draft Evaluation Plan for Ultra-Urban Storm WaterTechnologies. Prepared by the Environmental Technology Evaluation Center,Washington, D.C. and David Evans and Associates, Bellevue, Washington.
Field, R. and T.P. O’Connor. 1996. Swirl technology: Enhancement of design,evaluation, and application. Journal of Environmental Engineering, 122: 741-748.
Heaney, J.P., L. Wright, and D. Sample. 1999. Research needs in urban wet weatherflows. Water Environment Research, 71: 241-250.
H.I.L. Technology, Inc., 2000. Proceedings of the short course, “New Technologies andConcepts in Stormwater Treatment ©”, May 11-12, 2000, Lynwood, Washington.
Jago, R. 1997. Litter analysis from suburban CDS unit. Report on CDS web page:www.cdstech.com.au/articles/coburg/coburgan.htm .
Jago, R. 1998. Litter analysis case study-Melbourne Airport CDS unit. Report on CDSweb page: www.cdstech.com.au/articles/MelbAirport/Melb_Airport.html.
Keblin, V., M. Barrett, J. Malina, and R. Charbeneau. 1997. The effectiveness ofpermanent highway runoff controls: sedimentation/filtration systems. CRWROnline Report 97-4. University of Texas at Austin:www.ce.utexas.edu/centers/crwr/reports/online.html .
Marsalek, J., R. Long, and D. Doede. 1994. Laboratory development of Stormceptor.National Waster Research Institute (Environment Canada), In: Stormceptor StudyManual. CSR, Kansas City, MO.
Minton, G. 2000. Lecture notes for the short course, “New Technologies and Conceptsin Stormwater Treatment ©”, May 11-12, 2000, Lynwood, Washington.

Stormwater Treatment Technology Review
52
McCabe, W.L., J.C. Smith, and P. Harriot. 1985. Unit Operations of ChemicalEngineering, 4th ed., McGraw-Hill, Inc., New York. 960 pp.
Pisano, W. C., D.J. Connick, and G.L. Aronson. 1984. Swirl and helical bendregulator/concentrator for storm and combined sewer overflow control. Rep. No.EPA-600/2-84/151 (NTIS PB 85-102 523), USEPA, Edison, New Jersey.
Pollution Engineering. 1997. Space-saving filters handle high-volume storm runoff.August 1997, p. 39.
Pratt, C. 1996. Laboratory tests on X-Ceptor concrete bypass interceptor. ConventryUniversity, Coventry, United Kingdom.
Sansalone, J.J. and S.G. Buchberger. 1997. Characterization of solid and metal elementdistributions in urban highway stormwater. Water Science and Technology, 36:155-160.
Shapiro, A.H. 1969. Film Notes for Vorticity. Encyclopedia Britannica EducationalCorporation, Chicago, Illinois.
Stein, W. 1999. CDS® General Information and Discussion: Continuous DeflectiveSeparation (CDS®) – Treatment of Storm Water Runoff. CDS® Technologies,Inc., Morgan Hill, California.
STEP. 1998. Technology Assessment for Stormceptor®. The Massachusetts StrategicEnvirotechnology Partnership, 13 pp.
Stormceptor® Design Manual. CSR, Kansas City, MO ( www.csra.com/csrstormceptor)
Stormwater Management, Inc. 2000. Preliminary testing of iron-infused filtration mediafor the removal of dissolved phosphorus. Portland, Oregon.
Vortechnics TM, 1998. Technical Bulletin No. 1: Vortechs TM stormwater treatmentsystem performance: Removal efficiencies for selected particle gradations.Portland, ME.
Vortechnics TM, 1999a. Technical Bulletin No. 3: Sizing Vortechs TM systems. Portland,Maine.
Vortechnics TM, 1999b. Technical Bulletin No. 5: Vortechs™ System Oil RemovalEfficiencies. Portland, Maine.
Wanielista, M.P. and Y.A. Yousef. 1993. Stormwater Management. John Wiley andSons, Inc., New York. 579pp.

Stormwater Treatment Technology Review
53
Water Environment and Technology. 1997. Compost media capture pollutants fromstormwater runoff. July 1997, p. 21.
Wigginton, B.O. and S. de Ridder. 1999. Sediment loading on a Perlite filledStormfilter™ cartridge. Stormwater Management, Portland, Oregon.
Wong, T.H.F. 1997. Continuous deflective separation: Its mechanism and applications.Water Environment Federation 70th Annual Conference and Exposition, Chicago,Illinois.

Stormwater Treatment Technology Review
54
Appendix: “Ultra-Urban” Stormwater Treatment TechnologyManufacturer List
Note: The following table contains information on all manufacturers whose stormwatertreatment technologies were reviewed in this document; in addition, information isprovided on a few other manufacturers. This list does not necessarily contain allmanufacturers of “ultra-urban” technologies.
Product Treatment Mechanism Contact InformationBaySaver® Separation System Gravity Separation BaySaver®, Inc
1010 Deer Hollow DriveMt. Airy, MD 21771(800) 229-7283www.BaySaver.com
Stormceptor ® System Gravity Separation CSR, Inc.P.O. Box 9187Kansas City, MO 64168(816) 741-5557www.csrstormceptor.com
Vortechs™ Stormwater TreatmentSystem
Swirl Concentration Vortechnics, Inc.41 Evergreen Dr.Portland, ME 04103(207) 878-3662www.vortechnics.com
Downstream Defender™ Swirl Concentration H.I.L. Technology, Inc.94 Hutchins Dr.Portland, ME 04102(800) [email protected]
Continuous Deflective Separation® Screening CDS Technologies, Inc.16360 S. Monterey Rd.Suite 250Morgan Hill, CA 95037(888) 535-7559www.cdstech.com
Stormfilter™ Filtration and Adsorption Stormwater Management, Inc.2035 NE Columbia Blvd.Portland, OR 97211(800) 548-4667www.stormwatermgt.com
Aqua-Filter™ Stormwater FiltrationSystem
Swirl Concentration andFiltration
AquaShield™ Inc.2733 Kanasita Dr.Suite AHixson, TN 37343(423) 870-8888http://www.aquashieldinc.com/
V2B1 Stormwater Treatment System Swirl Concentration Environment XXI™8713 Read Rd.PO Box 218East Pembroke, NY 14056(800) 809-2801www.kistner.com