
TECHNOLOGY READINESS EVALUATION
27
Transcript of TECHNOLOGY READINESS EVALUATION


i
TECHNOLOGY READINESS EVALUATION (TRE) 09-1 FOR BIO-AGENT IDENITIFICATION TECHNOLOGIES ITI RAZOR EX VENDOR REPORT
December 2009
Prepared for: CBR Technology Evaluation Branch, Edgewood Chemical Biological Center and Joint Project Manager for Biological Defense
Prepared by: National Assessment Group Kirtland AFB, New Mexico
Director: Col Douglas W. Jaquish (505) 262-4600
Program Manager: Mr. Tom Stiles (505) 262- 4684 [email protected]
Project Officer: CW3 Leticia McCray
Project Analyst: Mr. Keith Rivenbark
The National Assessment Group is an independent DoD activity, chartered by the Deputy Secretary of Defense to provide planning, assessment support, and evaluation capabilities to selected programs and projects within DoD and other government activities. The National Assessment Group has an objective role as an independent National-level activity headquartered at Kirtland AFB, New Mexico.
NAG2009-R-1413

ii
TABLE OF CONTENTS
Background .......................................................................................1
Methodology ......................................................................................1
Results Summary ............................................................................15
LoI/False Positive Rate Data ..........................................................17
Overall Rank ...................................................................................19
Appendices
A. Spider Chart .................................................................... A-1
B. Acronyms ..........................................................................B-1
1
BACKGROUND The U.S. Army Edgewood Chemical/Biological Center (ECBC), Chemical Biological Radiological (CBR) Technology Evaluation Branch (TEB), in support of the Joint Project Manger (JPM) for Biological Defense, sponsored Technology Readiness Evaluation 09-1 (TRE 09-1) for bio-agent identification technologies. The ECBC TEB requested the National Assessment Group (NAG) plan and conduct TRE 09-1 and provide a final written report of the results, with summary reports for the participating vendors. This report provides detailed results for the Idaho Technologies Incorporated (ITI) RAZOR EX system.
The test phase of the TRE was conducted from 17 July 2009 to 5 August 2009 in the vicinity of Salomon Life Sciences Test Facility on Dugway Proving Ground (DPG). The NAG and TEB evaluated five technologies from four vendors for the following:
• Technological maturity of each system
• Performance as a BWA identifier
• Suitability of the system for use in JBTDS
• The costs to operate the system
METHODOLOGY TRE Scope Candidate technologies were evaluated for maturity, performance, suitability, and cost using a variety of methodologies including testing, observation, interviews, and questionnaires. The mission statement for TRE 09-1 was:
To evaluate the technological readiness and maturity of improved biological identifier systems against selected liquid Agent-Like Organisms.1
Each system was presented with either 315 or 385 blinded liquid samples2 in a buffer solution, each containing one of the following target agents at various concentrations: Gamma irradiated Bacillus anthracis (Ba) (Ames) both crude (Lot # 20Apr09Crude) and washed (Lot # 20Apr09Washed), Gamma irradiated Venezuelan Equine Encephalitis (VEE) (Trinidad – Lot # AGD0000108), Gamma irradiated Orthopox vaccinia (Vac) (Lister – Lot # AGD0000200), and inactivated Yersinia Pestis (Yp) (Kim D5 – Lot # AGD0001099). A sample of each target agent was provided to each vendor prior to the start of the TRE to optimize their assays. Randomly mixed with the positive samples were blank samples (only buffer solution). Each vendor had eight hours each day to analyze approximately 26 samples.
During the last week of testing, each vendor was also presented with six interferent samples mixed in with their regular blind samples. These samples were introduced as one-for-one replacements of blank samples. One each of the following interferents (supplied by the Critical Reagents Program) was presented to each vendor:
• Burning Vegetation (Lot # IND 0000004)
• Burning Diesel (Lot # IND0000005)
• Clay Soil (Lot # IND0000008)
• Signal Smoke – Red (Lot # IND0000019)
1 Source: ECBC TEB. 2 Two systems did not have assays for VEE and so did not receive samples containing this target.
2
• Signal Smoke – Violet (Lot # IND0000018)
• 50% burning vegetation/50% burning diesel
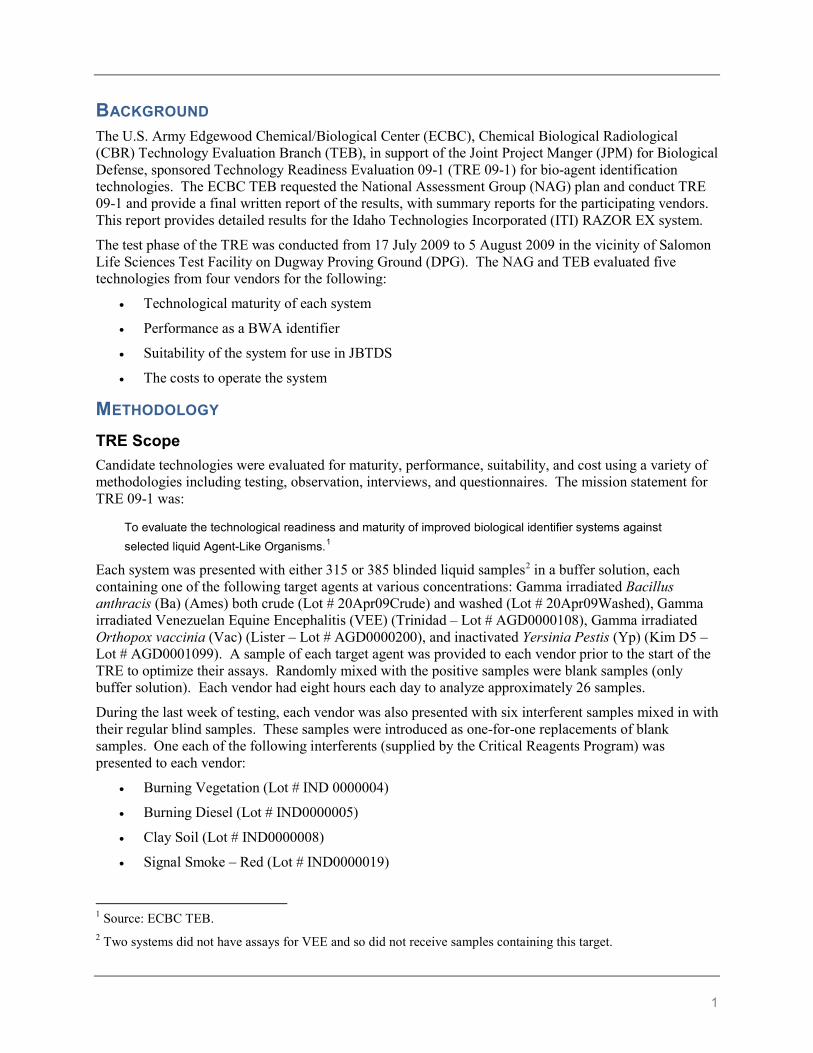
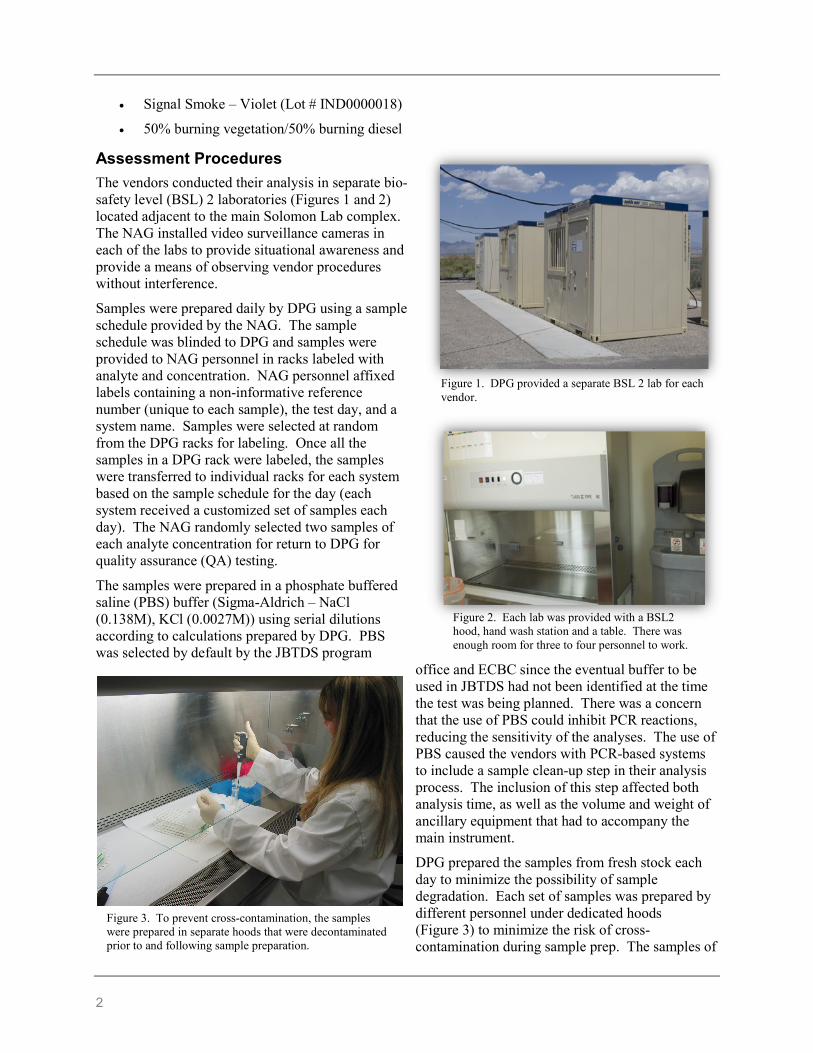
Assessment Procedures The vendors conducted their analysis in separate bio-safety level (BSL) 2 laboratories (Figures 1 and 2) located adjacent to the main Solomon Lab complex. The NAG installed video surveillance cameras in each of the labs to provide situational awareness and provide a means of observing vendor procedures without interference.
Samples were prepared daily by DPG using a sample schedule provided by the NAG. The sample schedule was blinded to DPG and samples were provided to NAG personnel in racks labeled with analyte and concentration. NAG personnel affixed labels containing a non-informative reference number (unique to each sample), the test day, and a system name. Samples were selected at random from the DPG racks for labeling. Once all the samples in a DPG rack were labeled, the samples were transferred to individual racks for each system based on the sample schedule for the day (each system received a customized set of samples each day). The NAG randomly selected two samples of each analyte concentration for return to DPG for quality assurance (QA) testing.
The samples were prepared in a phosphate buffered saline (PBS) buffer (Sigma-Aldrich – NaCl (0.138M), KCl (0.0027M)) using serial dilutions according to calculations prepared by DPG. PBS was selected by default by the JBTDS program
office and ECBC since the eventual buffer to be used in JBTDS had not been identified at the time the test was being planned. There was a concern that the use of PBS could inhibit PCR reactions, reducing the sensitivity of the analyses. The use of PBS caused the vendors with PCR-based systems to include a sample clean-up step in their analysis process. The inclusion of this step affected both analysis time, as well as the volume and weight of ancillary equipment that had to accompany the main instrument.
DPG prepared the samples from fresh stock each day to minimize the possibility of sample degradation. Each set of samples was prepared by different personnel under dedicated hoods (Figure 3) to minimize the risk of cross-contamination during sample prep. The samples of
Figure 1. DPG provided a separate BSL 2 lab for each vendor.
Figure 2. Each lab was provided with a BSL2 hood, hand wash station and a table. There was enough room for three to four personnel to work.
Figure 3. To prevent cross-contamination, the samples were prepared in separate hoods that were decontaminated prior to and following sample preparation.

3
the two viruses (VEE and Vaccinia) were prepared in a different lab space than Yp and the two Ba samples.
QA samples were analyzed each day by DPG to ensure quality control of the dilution process. Samples were analyzed by both PCR and ORIGEN ECL assay.
One Operational Readiness Inspection (ORI) day preceded the start of actual testing. This day provided an opportunity to test sample preparation and labeling procedures and assess system sensitivity groupings. The ORI day also gave each vendor an opportunity to fine tune their procedures and get a first-hand look at the samples before blind testing began. The ORI day consisted of giving each vendor a complete set of samples (one at each concentration for each target agent they were able to identify) and a key so they knew the identity and concentration of each sample. Based on the results of the ORI, concentration ranges for several vendors were adjusted to better align the test samples with the individual system sensitivities.
For each test day, the NAG provided each vendor a data collection sheet corresponding to the sample schedule for the day. Participants returned the completed data collection forms to test control daily. The results were entered into a database maintained by the NAG and data confirmation reports were returned to the participants the same day. Results were spot checked each day for indications of problems with system operation or sample QA.
Evaluation Methodology The evaluation methodology for TRE 09-1 was based on the Analytical Hierarchy Process (AHP). AHP is a structured process for making complex decisions that, rather than prescribing a “right” decision, helps the decision maker identify the decision that best meets their needs. The overarching analysis goal of the TRE was to evaluate the technological readiness of each identification system with respect to the performance goals of the JBTDS program. This goal became the top level of the analytical hierarchy (Figure 4). There were three groups of criteria supporting the decision goal: Performance, Suitability, and Analysis Cost.
Under Performance there were four evaluation metrics: Limit of Identification, False Positive Rate, Simultaneous Identification, and Threat Coverage.
Under Suitability there were five evaluation metrics: Analysis Throughput, Size, Weight, Power, and Set up Time.
Under Analysis Cost there were two evaluation metrics: Single Sample Analysis Cost and Batch Analysis Cost.
The Performance of each system was considered by the program office to be the most important characteristic and was weighted at 50%. Suitability follows Performance in importance at 40% and Analysis Cost was weighted at 10%.
Under Performance, Limit of Identification was weighted the heaviest at 50%, followed by False Positive Rate and Simultaneous Identification at 20% each, and Threat Coverage at 10%. Each target agent was considered equally important for both Limit of Identification and False Positive Rate.
Bio Identifier EvaluationPerformance (L: .500)
Limit of Identification (L: .500)Ba (washed) (L: .200)Ba (crude) (L: .200)Yp (L: .200)VEE (L: .200)Vac (L: .200)
False Positive Rate (L: .200)Ba (washed) (L: .200)Ba (crude) (L: .200)Yp (L: .200)VEE (L: .200)Vac (L: .200)
Simultaneous Identification (L: .200)Threat Coverage (L: .100)
Suitability (L: .400)Analysis Throughput (L: .200)
Single Sample Analysis Time (L: .500)Batch Analysis Time (L: .500)
Size (L: .200)Weight (L: .200)Power (L: .200)
Battery (L: .800)Identifier (L: .500)Prep Hardware (L: .500)
Line (L: .200)Identifier (L: .500)Prep Hardware (L: .500)
Set up Time (L: .200)Analysis Cost (L: .100)
Single Sample (L: .600)
Batch (L: .400)
Figure 4. The AHP model used to score the TRE systems.

4
Under Suitability, Analysis Throughput, Size, Weight, Power, and Set up Time were equally weighted at 20% each.
Under Analysis Cost, the Single Sample Analysis Cost was considered the most important at 60%, with the Batch Analysis Cost weighted at 40%.
Technology Readiness Level Evaluation The initial TRL assessment was conducted in April 2009 at ECBC by a four member panel of subject matter experts. Three of the four original members were available to reconvene the TRL panel in September 2009 to review NAG recommendations concerning TRL assignments.
Evaluation Metrics
Performance Limit of Identification
Definition: Limit of Identification (LoI) is defined as the lowest concentration at which a specified probability of correct identification is achieved. For TRE 09-1, LoI was based on a probability of correct identification of 90% using an upper bound of an 80% confidence interval.
Rationale: Credible aerosol attack scenarios produce a wide range of BWA aerosol concentrations in air that are then collected and concentrated into liquid. An identifier with a low LoI will be able to detect and positively identify a higher percentage of attacks.
Methodology: Five concentrations were used to bracket the expected threshold of detection for each system as reported by the system vendors. The samples were distributed across these five concentrations so that the majority of the samples were at or within one log of the threshold of detection.
The results of the analysis of each sample were aggregated by concentration level to determine the percentage of correct identifications at each level. These results were then used in a logistic regression to predict the concentration at which the system achieved a 90% probability of correct identification.
The regression analysis was conducted for each antigen for each system. The results were used to score the system as shown in Figures 5, 6, and 7. Scoring was based on a 0 to 100 scale, where a LoI equal to or better than the JBTDS goal equals 100 pts. The JBTDS operational performance goal for each agent is indicated in the figures by a vertical dashed red line.
Figure 5. Scoring function for Ba (washed and crude).
-20
0
20
40
60
80
100
0 2000 4000 6000 8000 10000 12000 14000 16000 18000 20000
Scor
e
cfu/ml
Ba (washed & crude)

5
Figure 6. Scoring function for Yp.
Figure 7. Scoring function for VEE and Vac.

6
False Positive Rate Definition: False Positive Rate is defined as the total number of incorrect positive results divided by the total number of analyses conducted that should actually be negative for the agent in question. This definition includes false positives due to cross-reactivity, as well as those that occur with blank samples.
Rationale: False positive rate is an important metric of system performance due to the operational cost of an erroneous positive result. While it does not define the probability that a given positive result is incorrect, it does provide a familiar way of comparing system performance and represents a measure of the intrinsic accuracy of the system.
Methodology: Table 1 presents a generic “confusion” matrix used to organize the results from a diagnostic test. The variables in the table can be defined as follows: ‘a’ represents the number of actual positives found by the system under test (SUT) to be positive (“true positives”), ‘b’ represents the number of actual negatives determined by the SUT to be positive (“false positives”), ‘c’ represents the number of actual positives found by the SUT to be negative (“false negatives”), ‘d’ represents the number of actual negatives found by the SUT to be negative (“true negatives”), ‘a + b’ is the total number of positive test results, ‘c + d’ is the total number of negative test results, ‘a + c’ is the total number of positive samples, ‘b + d’ is the total number of negative samples, and ‘a + b + c + d’ is the total number of samples tested.
The false positive rate is equal to b/(b + d) or the number of negative samples found to be positive divided by the total number of negative samples.
There were two possible sources of false positive results during this TRE. The first source was a positive result from a blank sample. These results are straightforward and were recorded as part of cell ‘b’ in Table 3. The second source was a positive result due to cross-reactivity of an assay with another target agent. These results are less straightforward in that it is possible to both get the analysis correct (i.e., correctly identify the targeted agent) and get it wrong (i.e., indicate the presence of a wrong agent) simultaneously. What this means is that the number of samples in Table 3 (the quantities ‘a + c’ and ‘b + d’) need to reflect the total number of analyses conducted rather than just the total number of samples.
Scoring for False Positive Rate was as shown in Figure 8. Rates less than or equal to 5% received 100 pts.
Table 1. Generic Confusion Matrix for Identifier Accuracy
Test Result Actual Number of Samples Pos (+) Neg (-) Pos (+) a b a + b Neg (-) c d c + d
Totals a + c b + d a + b + c + d
Figure 8. False Positive Rate scoring function.
0
10
20
30
40
50
60
70
80
90
100
0 0.01 0.02 0.03 0.04 0.05 0.06 0.07 0.08 0.09 0.1
Scor
e
False Positive rate
All Challenge Agents

7
Simultaneous Identification
Definition: Simultaneous Identification measures a system’s capability to analyze a single sample for more than one target agent simultaneously. The metric is the number of target agents the technology can look for concurrently in one analysis cycle.
Rationale: Simultaneous identification minimizes delays in decision making due to laboratory analysis. Systems that can conduct multiple analyses in parallel are preferred to those that require multiple individual analyses to look for the same threats. In addition, parallel analysis allows some technologies to look for more than one biomarker simultaneously, thus improving the reliability of analysis results.
Methodology: Vendors were queried regarding their system’s capability to conduct parallel analyses, and NAG analysts made direct observations of this capability during the laboratory testing at DPG. Systems were scored as shown in Figure 9.
Figure 9. Simultaneous Identification scoring function.

8
Threat Coverage
Definition: Threat Coverage is the percent of the current threat list for which the vendor has operational assays available.
Rationale: Systems need to be able to identify as many of the threat agents as possible to ensure complete coverage of the threat spectrum. A system that can identify more of these targets is preferred to one that can identify fewer.
Methodology: Each vendor was asked to confirm whether their system can identify a list of threat agents. For the threats they claim success against, additional data was requested to corroborate that success. The claimed sensitivity against each agent was not a factor in the evaluation. The percentage of the Threshold3 threat agents that each system can identify was used for evaluation. Scoring for this metric was based on the criteria in Table 2.
Suitability Analysis Throughput Definition: Analysis Throughput consists of two components: the time required to prepare and analyze a single sample for four agents and the time required to prepare and analyze 10 samples for four agents. The analysis time includes all tasks associated with sample handling and processing, including any sample preparation that may be necessary prior to analysis. The clock started when the system operator began the process of preparing the sample(s) for analysis and stopped when the final results for all four agents were available.
Rationale: Speed of analysis is critical in the decision-making process – the sooner results are available, the sooner decisions can be made concerning appropriate treatment and protective measures to be taken. It is expected that when fielded, the identifier will need to analyze samples for 10 agents simultaneously. Only four agents were used during the TRE so the metric is based on the time to analyze for these four agents.
Methodology: The NAG directly observed the processing and analysis of samples for this metric. Vendors were notified when data collection for this metric was to occur. On the day that data collection was planned, the vendor was asked to first process a single sample with a NAG data collector present to record preparation and analysis times. The vendor was next asked to process 10 samples. For both steps the vendor was restricted to using only the processes and equipment that would be available in a fielded system. At the conclusion of the analysis for the 10 samples, the vendor was allowed to process the remaining samples for the day using their standard methods.
Scoring for this metric was based on the criteria in Figures 10 and 11.
3 Appendix E (Joint Biological Point Detection System (JBPDS) Capability Production Document (CPD): Agent List)
Table 2. Scoring for Threat Coverage
Threat Coverage Score 100% 100 90% 90 80% 80 70% 70 60% 60 50% 50 40% 40 30% 30 20% 20 10% 10
< 10% 0

9
Figure 10. Single Sample Analysis Time scoring function.
Figure 11. Batch Analysis Time scoring function.

10
Size Definition: Size is the system’s volume when configured for transport. The volume includes all consumables and required ancillary equipment (batteries, cables, sample preparation hardware, etc.) required to analyze 10 samples for 10 agents using battery power.
Rationale: The physical size of the system is of concern given the desire for JBTDS to be man-portable.
Methodology: System size was confirmed during the TRE by physical observation and measurement. Scoring for Size was based on Figure 12.
Figure 12. Size scoring function.

11
Weight Definition: Weight is the system’s weight when configured for transport. The weight includes all consumables and required ancillary equipment (batteries, cables, sample preparation hardware, etc) required to analyze 10 samples for 10 agents using battery power, but does not include the weight of the transport case.
Rationale: The physical size of the system is of concern given the desire for JBTDS system to be man-portable.
Methodology: NAG analysts measured system weight during the TRE. Scoring for Weight was based on Figure 13.
Figure 13. Weight scoring function.

12
Power Definition: Power assesses the system’s capability to operate on both battery and line power. There are no requirements for continuous operation using either power source. The evaluation includes consideration of power requirements for sample preparation hardware as well as the identifier system.
Rationale: The JBTDS system is intended to be used in tactical environments where line power may not be available. The system (and all of its ancillary equipment) must be capable of operating on battery power.
Methodology: One day for each vendor was devoted to operations on battery power. Vendors were instructed to conduct analyses for 10 samples using battery power only. NAG analysts observed and recorded how many batteries were required and documented any difficulties encountered in operating using battery power for each of the systems. If a system was not able to complete the analyses using only battery power, the vendor was allowed to continue using line power in order to complete the sample matrix. Power was scored in two parts: battery and line. The identifier and sample prep hardware were scored separately. The scoring criteria were as follows:
Battery: • If the sample prep hardware is capable of operating off batteries or does not require a power
source, it received 100 points.
• If the sample prep hardware only operates off line power, it received 0 points.
• If the identifier hardware is capable of operating off batteries, it received 100 points.
• If the identifier hardware only operates off line power, it received 0 points.
Line: • If the sample prep hardware is capable of operating off line power or does not require a power
source, it received 100 points.
• If the sample prep hardware only operates off battery power, it received 0 points.
• If the identifier hardware is capable of operating off line power, it received 100 points.
• If the identifier hardware only operates off battery power, it received 0 points.
If either set of hardware required more than one battery to complete the analysis of 10 samples, then the number of batteries used was included in the measurements for size and weight as well.
Set Up Time
Definition: Set Up Time is the time required to prepare the system for operation from a transport configuration. Setup time includes any sample prep equipment that is necessary to prepare samples for analysis. If more than one system was required to meet throughput goals (JBTDS, not TRE), time measured was the total time for all systems.
Rationale: The JBTDS system is intended to be used in tactical environments where rapid and straightforward setup is desired.
Methodology: The vendors were timed by NAG analysts at the start of the TRE to determine how long it takes to set up their equipment from a transport configuration using batteries. Scoring was as shown in Figure 14.

13
Figure 14. Setup Time scoring function.
Analysis Cost Single Sample Analysis Cost
Definition: Single Sample Analysis Cost is the cost to analyze one sample for 10 agents. The cost of reusable consumables was distributed as appropriate to arrive at a cost to analyze a single sample.
Rationale: Because of the large number of JBTDS units to be deployed and the potentially large number of analyses to be performed, the operating costs of the identifier are an important concern.
Methodology: Questionnaires and vendor interviews solicited cost information for each system that was used to determine the cost to conduct ten analyses of a single sample. Scoring was as shown in Figure 15.
Figure 15. Single Sample Analysis Cost scoring function.
0
10
20
30
40
50
60
70
80
90
100
0 50 100 150 200 250 300 350 400 450 500 550 600
Scor
e
Dollars
Single Sample Analysis Cost

14
Batch Analysis Cost Definition: Batch Analysis Cost is the cost to analyze 10 samples for 10 agents. This cost may or may not be a simple linear function of the single sample analysis cost depending on the technology. As with the single simple cost, costs for consumables was distributed as appropriate to account for reusable components.
Rationale: Because of the large number of JBTDS units to be deployed and the potentially large number of analyses to be performed, the operating costs of the identifier are an important concern.
Methodology: Questionnaires and vendor interviews solicited cost information for each system that was used to determine the cost to conduct ten analyses for ten samples. Scoring was as shown in Figure 16.
Figure 16. Batch Analysis Cost scoring function.
0
10
20
30
40
50
60
70
80
90
100
0 200 400 600 800 1000 1200 1400 1600 1800 2000 2200 2400 2600 2800 3000
Scor
e
Dollars
Batch Analysis Cost

15
RESULTS SUMMARY
Physical Properties:
Main Instrument
Size (in) Volume (cu ft) Weight (lbs) Line Power Battery 9 x 4-1/2 x 7 0.16 8.19
Misc Equipment
Size (in) Volume (cu ft) Weight (lbs) Description 6-1/4 x 5-1/4 x 3-3/4 0.07 2.81 Main instrument battery
5 x 6 x 7-1/2 0.13 9.52 Bead beater for sample prep ----- 0.10 1.64 Consumables for 10 samples
5 x 7 x 2 0.04 3.08
Power Inverter for bead beater 3 x 6 x 1-1/2 0.02 Prototype battery pack for bead beater

16
Limit of Identification:
Ba-crude Ba-washed Yp Vac VEE 2000 cfu/ml 1160 cfu/ml 190 cfu/ml 1640 pfu/ml 1.3 x 10⁶ pfu/ml
False Positive Rate:
Ba-crude Ba-washed Yp Vac VEE 0 % 0 % 0 % 0 % 0 %
Time Factors:
Set-up Time Average Sample Prep Time
Average Sample Analysis Time
Average Total Processing Time
10-Sample Analysis Time
< 5 min 18 min 35 min 53 min 242 min Cost Factors:
Single-Sample Analysis Cost
10-Sample Analysis Cost
$210 $2100 Threat Coverage:
Simultaneous ID Assays Available 10 7 of 8
TRL Evaluation:
The ECBC TEB convened a four-member panel of subject matter experts to assign TRLs to each of the participating systems. Following is the final TRL Panel worksheet showing the individual evaluator assessments for each component of the overall TRL, as well as the panel consensus for each component. The overall TRL was determined from the lowest component TRL.
21 Sep 2009

17
LOI/FALSE POSITIVE RATE DATA Table 3 presents a summary of the analysis results for the ITI RAZOR EX.
Table 3. Analysis Summary Ba-C ITI RAZOR EX – Results Summary
Concentration Attempts Correct 101 5 1 (20%) 102 15 6 (40%) 103 30 27 (90%) 104 15 15 (100%) 105 5 5 (100%)
Ba-W 101 5 0 (0%) 102 15 5 (33%) 103 30 28 (93%) 104 15 15 (100%) 105 5 5 (100%)
Vac 101 5 3 (60%) 102 15 9 (60%) 103 30 28 (93%) 104 15 15 (100%) 105 5 5 (100%)
VEE 103 5 0 (0%) 104 15 1 (7%) 105 30 15 (50%) 106 15 14 (94%) 107 5 5 (100%)
Yp 101 5 3 (60%) 102 15 15 (100%) 103 30 29 (97%) 104 15 15 (100%) 105 5 5 (100%)

18
Table 4 presents the data summary for false positive performance.
Table 4. False Positive Rate Data ITI RAZOR EX
Ba-Crude
Test Outcome Actual
Positive Negative
Positive 54 0 54 Negative 16 315 331
70 315 385 Ba-Washed
Test Outcome Actual
Positive Negative
Positive 53 0 53 Negative 17 315 332
70 315 385 Vaccinia
Test Outcome Actual
Positive Negative
Positive 60 0 60 Negative 10 315 325
70 315 385 VEE
Test Outcome Actual
Positive Negative
Positive 35 0 35 Negative 35 315 350
70 315 385 Yp
Test Outcome Actual
Positive Negative
Positive 67 0 67 Negative 3 315 318
70 315 385

19
OVERALL RANK
Overall Rank
RAZOR EX
JBTDS Objective
TRL 7

20
This page intentionally left blank.

Appendix A – Spider Chart A-1
APPENDIX A – SPIDER CHART
Spider charts provide a means to quickly assess how well a system performs both versus a standard as well as versus other systems. The spider charts that follow plot the performance of each TRE system against each of the evaluation metrics. The plots are based on how the system scored for each metric – not the raw result in the units of the metric. For example, the point plotted for Limit of Identification represents the score from the Expert Choice AHP model rather than the raw result in cfu or pfu/ml. Each chart also has plotted the score for the JBTDS objective for each metric (blue dashed line) so that the reader can quickly assess how the systems did against these objectives. The green spokes are the Performance metrics, the orange spokes are the Suitability metrics and the purple spokes are the Analysis Cost metrics.
ITI RAZOR EX
Limit of Identification
Size
Threat CoverageSet U
p Ti
me
50%
25%
75%

Appendix A – Spider Chart A-2
This page intentionally left blank.
Appendix B – Acronyms B-1
APPENDIX B – ACRONYMS
AC alternating current
AHP Analytical Hierarchy Process
Ba Bacillus anthracis
BSL biosafety level
BWA biological warfare agent
CBR Chemical Biological Radiological
cfu colony forming unit
cu ft cubic feet
DC direct current
DoD Department of Defense
DPG Dugway Proving Ground
ECBC Edgewood Chemical/Biological Center
FPR false positive rate
in inches
ITI Idaho Technologies, Inc.
JBTDS Joint Biological Tactical Detection System
JPM Joint Project Manager
LxWxH length x width x height
lbs pounds
LoI limit of identification
min minutes
ml milliliter
NAG National Assessment Group
ORI Operational Readiness Inspection
PBS phosphate buffer solution
PCR polymerase chain reaction
pfu plaque forming unit
TEB Technology Evaluation Branch
TRE Technology Readiness Evaluation
Vac Orthopox vaccinia
VEE Venezuelan Equine Encephalitis
Yp Yersinia pestis

Appendix B - Acronyms B-2
This page intentionally left blank.