Technology, Media, and Telecommunications Quarterly Update · • TMT Trends • Economic Outlook...
13
Technology, Media, and Telecommunications Quarterly Update Deloitte Corporate Finance LLC | www.investmentbanking.deloitte.com Q3 2017
Transcript of Technology, Media, and Telecommunications Quarterly Update · • TMT Trends • Economic Outlook...

Technology, Media, and Telecommunications Quarterly Update
Deloitte Corporate Finance LLC | www.investmentbanking.deloitte.com
Q3 2017

Quarterly Update | Q3 2017 | TMT
www.investmentbanking.deloitte.com | Page 2
Who We Are
Deloitte Corporate Finance LLC is a leading global middle market M&A adviser. The firm’s professionals have extensive knowledge in the TMT space and use their experience to help the firm’s clients maximize value.
Contacts
Ron RiveraManaging [email protected]+1 (404) 631-3710
Jonathan OhmManaging [email protected]+1 (212) 436-2287
Byron NelsonSenior Vice [email protected]+1 (469) 417-2462
In the News
July 30, 20175 – Discovery Communications, Inc. (NasdaqGS:DISC.A) (“Discovery”), a renowned mass media company based in Maryland, entered into a definitive agreement to acquire Scripps Network Interactive, Inc. (NasdaqGS:SNI) (“Scripps”) from Scripps family, Miramar Services, Inc. and other shareholders for $15.1 billion. Combined, Discovery is expected to have nearly 20% of ad-supported pay-TV ownership in the US. In addition, Discovery will be provided the optionality for next-generation
growth opportunities through exploitation of brands, formats, talent, and over 8,000 hours of original programming, annually.
August 9, 20176 – Vantiv, Inc. (NYSE:VNTV) (“Vantiv”), a US credit card processing company, signed a definitive agreement to acquire Worldpay Group plc (LSE:WPG) (“Worldpay”), the UK’s largest payment processing company, for $10.4 billion. The acquisition is anticipated to bolster Vantiv’s position in the US and gain significant access to the UK, markets where Worldpay processes millions of payments daily in stores, online, and on mobile phones.
Cybersecuirty1 Financial Technologies (“Fintech”)2
Cloud Adoption4Automotive Technology3
A series of highly publicized security breaches has shed light on the importance of cyber security. Corporations are becoming increasingly aware of the importance of putting in place enhanced security measures to
protect business critical data. It is estimated that data breaches cost, on average, $3.6 million per instance.
Many financial services companies are pouring money into fintechinvestments, embracing the agility and flexibility fintech solutions offer. It is estimated that fintechstartups could generate up
to $4.6 trillion in revenue and $470 billion in profit.
Although still in the early stages of adoption, the continued development and application of the cloud can provide small-to-medium sized enterprises access to sophisticated capabilities once only available to large multinational corporations. The future of cloud will represent a combination of cloud-based software and on-premises platforms to create a hybrid IT solution that balances the scalability and flexibility associated with cloud.
In This Update
• TMT Trends
• Economic Outlook
• Industry Analysis
• Select M&A Transactions
• Appendix
This update will focus on news and trends in the following areas:
• Software
• Internet
• IT Services
• Hardware
• Media & Telecommunications
• Automotive Technology
TMT Trends
The increasing global adoption of smartphone technologies is forcing the automotive industry to rethink how cars are made, bought, and driven. Software competence is increasingly becoming one of the most important differentiating factors
for the industry. Driven by shared mobility, connectivity services, and feature upgrades, new business models could expand automotive revenue pools by $1.5 trillion.
Quarterly Update | Q3 2017 | TMT
www.investmentbanking.deloitte.com | Page 3
55
65
75
85
95
105
115
125
135
48
50
52
54
56
58
60
62
64
Con
su
mer C
on
fid
en
ce
IS
M N
on
-Man
ufa
ctu
rin
g*
ISM Non-Manufacturing Consumer Confidence
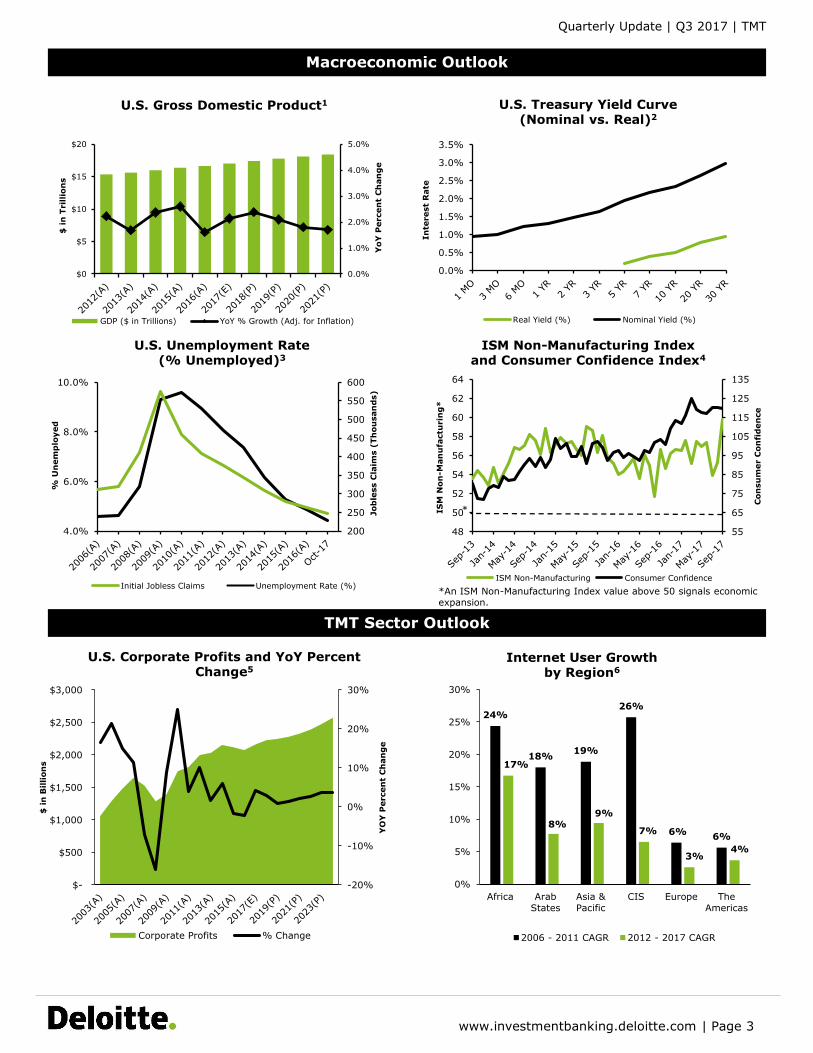
U.S. Treasury Yield Curve(Nominal vs. Real)2
U.S. Gross Domestic Product1
U.S. Unemployment Rate(% Unemployed)3
ISM Non-Manufacturing Indexand Consumer Confidence Index4
U.S. Corporate Profits and YoY Percent Change5
Internet User Growth by Region6
TMT Sector Outlook
*An ISM Non-Manufacturing Index value above 50 signals economicexpansion.
*
Macroeconomic Outlook
$0
$5
$10
$15
$20
0.0%
1.0%
2.0%
3.0%
4.0%
5.0%
$ in
Tril
lion
s
YoY
Percen
t C
han
ge
GDP ($ in Trillions) YoY % Growth (Adj. for Inflation)
0.0%
0.5%
1.0%
1.5%
2.0%
2.5%
3.0%
3.5%
In
terest
Rate
Real Yield (%) Nominal Yield (%)
200
250
300
350
400
450
500
550
600
4.0%
6.0%
8.0%
10.0%Job
less C
laim
s (
Th
ou
san
ds)
% U
nem
plo
yed
Initial Jobless Claims Unemployment Rate (%)
24%
18%19%
26%
6%6%
17%
8%9%
7%
3%4%
0%
5%
10%
15%
20%
25%
30%
Africa Arab
States
Asia &
Pacific
CIS Europe The
Americas
2006 - 2011 CAGR 2012 - 2017 CAGR
-20%
-10%
0%
10%
20%
30%
$-
$500
$1,000
$1,500
$2,000
$2,500
$3,000
YO
Y P
ercen
t C
han
ge
$ in
Billion
s
Corporate Profits % Change

Quarterly Update | Q3 2017 | TMT
www.investmentbanking.deloitte.com | Page 4
*TMT Index companies listed on pages 6 & 7 in the Appendix.
TMT Sector Breakdown & Trading Statistics1
Public Comparables Three-Year Stock Market Performance2
S&P 500 Index 33.5%
NASDAQ Composite Index 53.87%
TMT Index* 47.92%
($M)
LTM NTM
Sector Number of % of 52 Median Median Median Median EV/ EV/ EV/
Companies Week High Revenue CAGR LTM EBITDA EBITDA Margin EV Revenue EBITDA EBITDA
(3 Yr) ($M) ($M)
Application Software/SaaS 15 98.0 % 10.9 % $1,371 29.6 % $31,207 7.0 x 19.9 x 16.6 x
Internet & Digital Media 12 94.8 27.7 3,054 28.6 77,009 7.2 37.1 20.8
IT Services 9 95.1 7.2 2,722 19.8 28,958 2.5 13.5 10.6
Hardware 18 94.8 4.2 5,572 25.3 39,106 2.4 9.0 7.8
Traditional Media 27 84.9 2.3 1,394 18.0 15,240 1.8 9.1 9.6
Telecommunications 23 88.7 2.4 12,442 27.9 82,043 1.8 7.2 6.8
Automotive Technology 9 96.2 2.0 335 15.0 10,531 3.0 18.1 12.8
TMT Index 113 93.4 % 4.2 % $2,408 23.2 $30,009 2.6 x 10.6 x 9.9 x

Quarterly Update | Q3 2017 | TMT
www.investmentbanking.deloitte.com | Page 5
Annual TMT M&A Transaction Volume2
0
1,000
2,000
3,000
4,000
5,000
6,000
7,000
8,000
2008 2009 2010 2011 2012 2013 2014 2015 2016 2016
YTD
2017
YTD
Num
ber
of D
eals
Undisclosed <$100M $100M-$250M $250M-$500M $500M-$1B >$1B
Recent Transactions1
6,665
4,981
6,2436,782 6,662
6,107
7,2627,587
6,993
5,0094,743
Select TMT M&A Transactions
Close Date Target/Acquiror Industry Target Business DescriptionEnterprise
Value ("EV")
EV /
EBITDA
($ in millions)
Pending Scripps Network Interactive, Inc.
Discovery Communications, Inc.
Pending Tribute Media Company
Sinclair Broadcast Group, Inc.
Pending Worldpay Group plc
Vantiv, Inc.
Pending NXP Semiconductors N.V.
QUALCOMM Incorporated
Pending Siliconware Precision Industries Co., Ltd.
Advanced Semiconductor Engineering, Inc.
Pending Nets A/S
Advent International Corporation
Pending General Communication, Inc.
Liberty Ventures
Sep-17 WebMD Health Corp.
MH SUB I, LLC
Aug-17 Whole Foods Market, Inc.
Amazon.com, Inc.
Aug-17 Mobileye N.V.
Intel Corporation
Aug-17 NeuStar, Inc.
GIC Special Investments Pte. Ltd.
x
Application Software/ SaaS
Automotive Technology
9.3$14,920.1Traditional MediaScripps Network Interactive, Inc. develops lifestyle-
oriented television content.
Traditional Media
Tribute Media Company, through its subsidiaries,
operates as a media and entertainment company in
the United States.
6,570.9 11.7
Software
Worldpay Group plc, together with its subsidiaries,
provides payments processing technology and
solutions for merchant customers.
11,710.9 19.7
TelecommunicationsGeneral Communication, Inc., provides a range of
wireless, data, video, voice, and managed services.2,716.6 10.0
Automotive TechnologyNXP Semiconductors N.V., provides high-performance
mixed signal and standard product solutions. 48,009.0 20.4
HardwareSiliconware Precision Industries Co., Ltd. provides
semiconductor packaging and testing services.5,310.0 6.5
Whole Foods Market, Inc. operates natural and
organic foods supermarkets. 13,732.7 10.3
Nets A/S provides digital payment services and
related technology solutions.6,349.6 19.0
Internet & Digital Media
WebMD Health Corp. provides health information
services through its websites, mobile platforms, and
health-focused publications.
2,641.2 14.3
Mobileye N.V. develops technology solutions for
advanced driver assistance systems and autonomous
driving technologies.
14,195.7 120.2
Application Software/ SaaSNeuStar, Inc. provides various real-time information
services worldwide.2,885.9 6.9
Internet & Digital Media

Quarterly Update | Q3 2017 | TMT
www.investmentbanking.deloitte.com | Page 6
Software Acquisition Activity – Strategic Acquirors1,2
5 59 9 8 9
59
19
28
106 4 9 4
1
8
3
12
1813
10 33
6
3
4
1
15
914
78
69
2
8
5
7
82
54
3 2 1
9
67
50
44
3532
2523 23 22
18
0
10
20
30
40
50
60
70
Google Microsoft IBM Cisco Oracle Intel Salesforce intuit Constellation SAP
Top 10 Most Active Strategic Acquirors of Software Assets by Volume 2013
2014
2015
2016
YTD 2017
Software Acquisition Activity – Financial Acquirors1,2
Internet & Digital Media Acquisition Activity – Strategic Acquirors1,2
Internet & Digital Media Acquisition Activity – Financial Acquirors1,2
53
51 1 1 2 3
1
5
3
7
55 4 3
4
7
2
6
6
4
17
3 6 3
2
4
11
7
4
7 42
2
1
3
23
11 1 1 2 1
1
30
2123
1513 13 13 13 13
9
0
5
10
15
20
25
30
35
Vista Equity Thoma Bravo Insight Warburg Pincus Spectrum Francisco PartnersProvidence Equity HGGC TCV Great Hill
Top 10 Most Active Financial Acquirors of Internet & Digital Media Assets by Volume 2013
2014
2015
2016
YTD 2017
Deal Volu
me
Deal Volu
me
Deal Volu
me
Deal Volu
me
73 4
15
2 3 3 2 1
9
5 35
46 3 3 4 4
6
5 73
3 5 72
76
12
7 4
85 5
34
11
9
4 65
2
3 1
43
24 2422
19 1816 15 14 13
0
10
20
30
40
50
Vista Equity Thoma Bravo FP Providence Equity Insight Accel-KKR Marlin Equity Summit Partners JMI Equity LLR Partners
Top 10 Most Active Financial Acquirors of Software Assets by Volume 2013
2014
2015
2016
YTD 2017
7
19
7 5 4 2 2 3 2
17
13
96
41 4 3 3 4
7
6
4
22
34 2 2 4
144
3
76
32 3 1
7
1
1
6 31
2 1
52
43
24
20
16 15 1512
9 10
0
10
20
30
40
50
60
Google Oath Twitter ebay Facebook Liberty Interactive Amazon TripAdvisor Alibaba Priceline
Most 10 Active Strategic Acquirors of Internet & Digital Media Assets by Volume 2013
2014
2015
2016
YTD 2017
Constellation Software Inc.
Liberty Interactive Corporation
FranciscoPartners
ProvidenceEquity
InsightVenturePartners
ProvidenceEquity
InsightVenturePartners
FranciscoPartners
eBay
SpectrumEquity

Quarterly Update | Q3 2017 | TMT
www.investmentbanking.deloitte.com | Page 7
Public Comparables Analysis1
Appendix
Last Twelve Months NTM x
Company (Ticker)
% of 52
Week High
LTM
Revenue
Revenue
CAGR (3 Yr)
LTM
EBITDA
EBITDA
Margin
Enterprise
Value
("EV")(1)
EV/
EBITDA
EV/
EBITDA
($ in Millions)
Application Software/SaaS (15)
Adobe Systems Incorporated (NasdaqGS:ADBE) 92.7 % $6,903 18.8 % $2,316 33.6 % $68,706 10.0 x 29.7 x 19.4 x
Autodesk, Inc. (NasdaqGS:ADSK) 99.3 1,956 (6.2) (342) NM 25,959 13.3 NM 157.3
Cerner Corporation (NasdaqGS:CERN) 98.5 4,898 16.8 1,371 28.0 23,697 4.8 17.3 13.1
Check Point Software Technologies Ltd. (NasdaqGS:CHKP) 99.6 1,808 8.0 893 49.4 17,648 9.8 19.8 16.6
Fiserv, Inc. (NasdaqGS:FISV) 98.0 5,591 4.1 1,749 31.3 31,207 5.6 17.8 14.6
Intuit Inc. (NasdaqGS:INTU) 98.2 5,177 6.9 1,626 31.4 36,448 7.0 22.4 16.9
Microsoft Corporation (NasdaqGS:MSFT) 96.8 89,950 1.2 30,432 33.8 525,826 5.8 17.3 12.9
Oracle Corporation (NYSE:ORCL) 90.3 38,320 (0.2) 14,893 38.9 186,742 4.9 12.5 9.8
Red Hat, Inc. (NYSE:RHT) 99.7 2,644 16.6 490 18.5 20,492 7.7 41.8 24.4
Salesforce.com, inc. (NYSE:CRM) 98.5 9,388 25.3 464 4.9 68,608 7.3 147.8 26.8
SAP SE (DB:SAP) 95.1 27,436 10.9 6,836 24.9 131,291 4.8 19.2 13.1
ServiceNow, Inc. (NYSE:NOW) 99.6 1,632 44.4 (32) NM 20,270 12.4 NM 40.7
Symantec Corporation (NasdaqGS:SYMC) 96.2 4,310 (13.7) 714 16.6 24,100 5.6 33.8 9.9
VMware, Inc. (NYSE:VMW) 97.4 7,093 10.9 1,850 26.1 37,214 5.2 20.1 12.2
Workday, Inc. (NasdaqGS:WDAY) 97.5 1,853 44.3 (230) NM 21,048 11.4 NM 56.3
Median 98.0 % $5,177 10.9 % $1,371 29.6 % $31,207 7.0 x 19.9 x 16.6 x
Mean 97.2 % $13,931 12.5 % $4,202 28.1 % $82,617 7.7 x 33.3 x 29.6 x
Internet & Digital Media (12)
Alibaba Group Holding Limited (NYSE:BABA) 94.3 % $26,768 45.3 % $11,073 41.4 % $422,493 15.8 x 38.2 x 24.0 x
Alphabet Inc. (NasdaqGS:GOOGL) 93.9 99,275 17.7 32,251 32.5 565,461 5.7 17.5 11.9
Altaba Inc. (NasdaqGS:AABA) 97.2 2,774 (15.6) 331 11.9 59,646 21.5 180.1 254.9
Amazon.com, Inc. (NasdaqGS:AMZN) 87.4 150,124 22.5 12,301 8.2 456,823 3.0 37.1 21.5
Baidu, Inc. (NasdaqGS:BIDU) 98.5 11,270 23.0 3,226 28.6 72,941 6.5 22.6 20.8
eBay Inc. (NasdaqGS:EBAY) 97.7 9,157 (10.4) 2,883 31.5 43,100 4.7 14.9 12.1
Facebook, Inc. (NasdaqGS:FB) 95.0 33,173 49.1 18,084 54.5 448,779 13.5 24.8 16.3
Netflix, Inc. (NasdaqGS:NFLX) 94.8 10,190 27.7 707 6.9 81,077 8.0 114.7 56.6
Snap Inc. (NYSE:SNAP) 47.5 625 NA (2,920) NM 13,966 22.3 NM NM
Tencent Holdings Limited (SEHK:700) 96.8 28,910 39.2 11,938 41.3 405,898 14.0 34.0 25.9
Twitter, Inc. (NYSE:TWTR) 66.8 2,455 36.1 143 5.8 10,055 4.1 70.5 14.2
Yelp Inc. (NYSE:YELP) 94.7 787 38.4 43 5.5 2,917 3.7 67.7 17.4
Median 94.8 % $10,730 27.7 % $3,054 28.6 % $77,009 7.2 x 37.1 x 20.8 x
Mean 88.7 % $31,292 24.8 % $7,505 24.4 % $215,263 10.2 x 56.6 x 43.2 x
IT Services (9)
Accenture plc (NYSE:ACN) 98.4 % $34,850 5.1 % $5,944 17.1 % $80,219 2.3 x 13.5 x 12.3 x
Automatic Data Processing, Inc. (NasdaqGS:ADP) 89.4 12,380 6.6 2,722 22.0 47,612 3.8 17.5 17.1
Capgemini SE (ENXTPA:CAP) 96.7 15,035 7.7 1,913 12.7 21,521 1.4 11.3 10.2
Cognizant Technology Solutions Corporation (NasdaqGS:CTSH) 98.3 14,131 13.8 2,775 19.6 38,978 2.8 14.0 12.3
DXC Technology Company (NYSE:DXC) 97.8 11,590 (3.7) 1,218 10.5 28,958 2.5 23.8 6.7
HCL Technologies Limited (NSEI:HCLTECH) 94.3 7,169 NA 1,608 22.4 17,728 2.5 11.0 10.1
Infosys Limited (NSEI:INFY) 83.1 10,358 7.3 2,811 27.1 26,224 2.5 9.3 9.0
Tata Consultancy Services Limited (NSEI:TCS) 92.1 18,164 11.2 4,901 27.0 68,111 3.7 13.9 13.1
Wipro Limited (BSE:507685) 95.1 8,459 7.1 1,679 19.8 17,864 2.1 10.6 10.6
Median 95.1 % $12,380 7.2 % $2,722 19.8 % $28,958 2.5 x 13.5 x 10.6 x
Mean 93.9 % $14,682 6.9 % $2,841 19.8 % $38,580 2.6 x 13.9 x 11.3 x
Hardware (18)
Amphenol Corporation (NYSE:APH) 97.6 % $6,514 9.5 % $1,541 23.7 % $27,034 4.2 x 17.5 x 16.4 x
Apple Inc. (NasdaqGS:AAPL) 93.4 223,507 7.9 70,206 31.4 827,294 3.7 11.8 10.3
Applied Materials, Inc. (NasdaqGS:AMAT) 97.8 13,865 16.4 3,949 28.5 48,698 3.5 12.3 9.9
Canon Inc. (TSE:7751) 96.3 33,021 (0.3) 4,865 14.7 36,284 1.1 7.5 6.8
Hewlett Packard Enterprise Company (NYSE:HPE) 60.2 48,287 NA 6,921 14.3 33,115 0.7 4.8 7.7
Hitachi, Ltd. (TSE:6501) 97.5 81,193 (1.9) 8,924 11.0 34,287 0.4 3.8 3.2
Intel Corporation (NasdaqGS:INTC) 96.8 61,711 4.6 24,705 40.0 180,976 2.9 7.3 7.0
International Business Machines Corporation (NYSE:IBM) 79.4 78,439 (6.8) 17,194 21.9 168,613 2.1 9.8 8.6
Juniper Networks, Inc. (NYSE:JNPR) 90.3 5,201 2.3 1,206 23.2 9,627 1.9 8.0 6.5
Lenovo Group Limited (SEHK:992) 80.6 42,991 2.2 804 1.9 7,469 0.2 9.3 5.4
Murata Manufacturing Co., Ltd. (TSE:6981) 90.8 10,234 9.6 2,762 27.0 28,055 2.7 10.2 8.6
Nokia Corporation (HLSE:NOKIA) 84.0 27,860 26.6 3,232 11.6 27,885 1.0 8.6 7.9
NXP Semiconductors N.V. (NasdaqGS:NXPI) 99.2 9,322 22.0 2,704 29.0 41,928 4.5 15.5 12.7
QUALCOMM Incorporated (NasdaqGS:QCOM) 71.6 22,571 (4.9) 7,146 31.7 76,742 3.4 10.7 9.1
Samsung Electronics Co., Ltd. (KOSE:A005930) 96.3 187,975 (1.8) 51,347 27.3 264,852 1.4 5.2 3.6
Taiwan Semiconductor Manufacturing Company Limited (TSEC:2330) 96.4 32,154 14.9 20,746 64.5 169,991 5.3 8.2 7.2
Texas Instruments Incorporated (NasdaqGS:TXN) 99.7 14,184 4.2 6,279 44.3 87,866 6.2 14.0 13.0
Xerox Corporation (NYSE:XRX) 81.6 10,384 (18.5) 1,462 14.1 12,305 1.2 8.4 7.2
Median 94.8 % $30,007 4.2 % $5,572 25.3 % $39,106 2.4 x 9.0 x 7.8 x
Mean 89.4 % $50,523 5.1 % $13,111 25.6 % $115,723 2.6 x 9.6 x 8.4 x
EV/
Revenue

Quarterly Update | Q3 2017 | TMT
www.investmentbanking.deloitte.com | Page 8
Public Comparables Analysis (Cont.)1
Last Twelve Months NTM x
Company (Ticker)
% of 52
Week High
LTM
Revenue
Revenue
CAGR (3 Yr)
LTM
EBITDA
EBITDA
Margin
Enterprise
Value
("EV")(1)
EV/
EBITDA
EV/
EBITDA
($ in Millions)
Traditional Media (27)
CBS Corporation (NYSE:CBS) 82.7 % $13,202 (1.1) % $3,049 23.1 % $32,296 2.4 x 10.6 x 9.7 x
Cumulus Media Inc. (NasdaqCM:CMLS) 12.4 1,140 (0.5) 204 17.9 2,258 2.0 11.1 10.0
Discovery Communications, Inc. (NasdaqGS:DISC.A) 69.8 6,586 3.5 2,483 37.7 19,622 3.0 7.9 7.7
Fuji Media Holdings, Inc. (TSE:4676) 94.3 5,798 0.4 324 5.6 3,665 0.6 11.3 10.0
Hakuhodo DY Holdings Inc (TSE:2433) 91.5 11,373 4.8 504 4.4 3,724 0.3 7.4 7.1
Havas SA (ENXTPA:HAV) 98.7 2,721 8.6 392 14.4 4,687 1.7 12.0 10.7
iHeartMedia, Inc. (OTCPK:IHRT) 35.2 6,217 (0.2) 1,476 23.7 20,248 3.3 13.7 11.0
Lagardère SCA (ENXTPA:MMB) 95.6 8,888 0.0 770 8.7 6,165 0.7 8.0 7.9
Meredith Corporation (NYSE:MDP) 81.1 1,713 5.3 358 20.9 3,077 1.8 8.6 9.6
News Corporation (NasdaqGS:NWSA) 89.4 8,139 (1.4) 738 9.1 6,015 0.7 8.2 6.6
Omnicom Group Inc. (NYSE:OMC) 83.8 15,411 1.1 2,320 15.1 20,435 1.3 8.8 8.5
Pearson plc (LSE:PSON) 72.4 6,232 (1.3) 1,082 17.4 9,004 1.4 8.3 9.8
Publicis Groupe S.A. (ENXTPA:PUB) 84.9 11,634 12.2 2,044 17.6 18,065 1.6 8.8 8.5
RTL Group SA (BDL:006146252) 83.1 7,506 3.3 1,398 18.6 12,687 1.7 9.1 7.5
Sirius XM Holdings Inc. (NasdaqGS:SIRI) 93.1 5,222 9.3 1,857 35.6 31,719 6.1 17.1 14.8
The Interpublic Group of Companies, Inc. (NYSE:IPG) 81.8 7,826 2.3 1,092 13.9 9,432 1.2 8.6 8.0
The New York Times Company (NYSE:NYT) 96.8 1,609 0.5 230 14.3 2,820 1.8 12.3 10.2
The Walt Disney Company (NYSE:DIS) 85.0 55,500 5.0 16,823 30.3 170,223 3.1 10.1 9.4
Thomson Reuters Corporation (TSX:TRI) 90.6 11,201 (4.0) 2,520 22.5 39,505 3.5 15.7 11.1
Time Inc. (NYSE:TIME) 63.1 2,955 (4.1) 384 13.0 2,237 0.8 5.8 5.7
Time Warner Inc. (NYSE:TWX) 99.3 30,123 3.4 8,694 28.9 101,150 3.4 11.6 11.2
Tribune Media Company (NYSE:TRCO) 94.4 1,909 8.3 370 19.4 6,200 3.2 16.8 13.3
Twenty-First Century Fox, Inc. (NasdaqGS:FOXA) 82.6 28,500 (3.7) 7,108 24.9 63,571 2.2 8.9 8.4
Viacom, Inc. (NasdaqGS:VIAB) 59.5 13,170 (0.7) 2,925 22.2 21,930 1.7 7.5 7.0
Vivendi SA (ENXTPA:VIV) 97.2 13,280 3.6 989 7.4 30,010 2.3 30.3 14.8
Wolters Kluwer N.V. (ENXTAM:WKL) 93.6 5,246 7.8 1,394 26.6 15,240 2.9 10.9 10.5
WPP plc (LSE:WPP) 71.7 20,087 11.0 3,619 18.0 29,220 1.5 8.1 8.4
Median 84.9 % $7,826 2.3 % $1,394 18.0 % $15,240 1.8 x 9.1 x 9.6 x
Mean 80.9 % $11,229 2.7 % $2,413 18.9 % $25,378 2.1 x 11.0 x 9.5 x
Telecommunications (23)
Altice N.V. (ENXTAM:ATC) 73.0 % $28,303 123.9 % $9,572 33.8 % $90,615 3.2 x 9.5 x 7.8 x
América Móvil, S.A.B. de C.V. (BMV:AMX L) 97.1 55,163 9.0 14,012 25.4 89,370 1.6 6.4 6.0
ARRIS International plc (NasdaqGS:ARRS) 90.5 6,632 10.5 732 11.0 6,192 0.9 8.5 7.3
ASUSTeK Computer Inc. (TSEC:2357) 81.2 14,902 (1.1) 560 3.8 3,798 0.3 6.8 7.2
AT&T Inc. (NYSE:T) 89.9 161,933 7.5 49,371 30.5 358,176 2.2 7.3 6.7
CenturyLink, Inc. (NYSE:CTL) 57.8 16,970 (2.2) 6,061 35.7 35,353 2.1 5.8 6.1
China Mobile Limited (SEHK:941) 82.3 110,370 3.7 41,005 37.2 138,492 1.3 3.4 3.3
Comcast Corporation (NasdaqGS:CMCS.A) 90.0 83,972 7.6 27,787 33.1 239,865 2.9 8.6 8.2
Deutsche Telekom AG (DB:DTE) 86.6 91,719 8.2 25,620 27.9 154,780 1.7 6.0 5.8
Konica Minolta, Inc. (TSE:4902) 76.0 8,598 0.5 947 11.0 5,105 0.6 5.4 5.7
KT Skylife Co., Ltd. (KOSE:A053210) 76.5 588 1.4 151 25.6 507 0.9 3.4 3.4
Liberty Global plc (NasdaqGS:LBTY.A) 90.4 19,361 2.7 8,615 44.5 80,305 4.1 9.3 10.9
Motorola Solutions, Inc. (NYSE:MSI) 88.7 6,192 1.3 1,605 25.9 17,201 2.8 10.7 9.5
Nippon Telegraph and Telephone Corporation (TSE:9432) 93.6 102,235 1.6 27,215 26.6 120,765 1.2 4.4 4.2
Nokia Corporation (HLSE:NOKIA) 84.0 27,860 26.6 3,232 11.6 27,885 1.0 8.6 7.9
NTT DOCOMO, INC. (TSE:9437) 91.5 41,063 1.4 12,442 30.3 82,043 2.0 6.6 NA
Orange S.A. (ENXTPA:ORA) 87.8 48,697 0.9 14,393 29.6 73,998 1.5 5.1 4.9
Ricoh Company, Ltd. (TSE:7752) 99.3 18,105 (2.6) 1,355 7.5 13,711 0.8 10.1 11.7
Sky plc (LSE:SKY) 87.1 17,006 20.1 2,408 14.2 29,830 1.8 12.4 NA
SoftBank Group Corp. (TSE:9984) 94.9 79,770 4.8 22,807 28.6 208,970 2.6 9.2 8.7
Telefónica, S.A. (BME:TEF) 84.4 63,654 2.4 19,904 31.3 116,731 1.8 5.9 5.8
Verizon Communications Inc. (NYSE:VZ) 90.2 123,639 (0.0) 43,948 35.5 314,868 2.5 7.2 6.8
Vodafone Group Plc (LSE:VOD) 88.9 56,415 2.0 13,633 24.2 116,912 2.1 8.6 7.0
Median 88.7 % $41,063 2.4 % $12,442 27.9 % $82,043 1.8 x 7.2 x 6.8 x
Mean 86.2 % $51,441 10.0 % $15,103 25.4 % $101,107 1.8 x 7.4 x 6.9 x
Automotive Technology (9)
CDK Global, Inc. (NasdaqGS:CDK) 96.3 % $2,220 4.0 % $582 26.2 % $10,531 4.7 x 18.1 x 12.8 x
Delphi Automotive PLC (NYSE:DLPH) 93.6 17,014 1.7 3,062 18.0 29,194 1.7 9.5 9.4
DENSO Corporation (TSE:6902) 98.2 41,094 3.7 5,409 13.2 35,802 0.9 6.6 6.5
Inter-Gamma Investment Company Ltd. (TASE:INTR) 69.9 153 (0.8) 18 11.5 63 0.4 3.6 NA
MAM Software Group, Inc. (NasdaqCM:MAMS) 98.7 32 1.0 5 15.0 102 3.2 21.5 17.7
Mobileye N.V. (OTCPK:MBBY.F) 96.0 408 57.1 139 34.0 13,430 32.9 96.9 43.1
NVIDIA Corporation (NasdaqGS:NVDA) 97.0 8,344 23.7 2,816 33.7 107,433 12.9 38.2 37.5
Qiming Information Technology Co.,Ltd (SZSE:002232) 86.1 224 2.0 12 5.3 674 3.0 57.4 NA
Visteon Corporation (NYSE:VC) 96.5 3,170 (8.8) 335 10.6 3,521 1.1 10.5 9.1
Median 96.2 % $2,220 2.0 % $335 15.0 % $10,531 3.0 x 18.1 x 12.8 x
Mean 92.5 % $8,073 9.3 % $1,375 18.6 % $22,306 6.8 x 29.1 x 19.4 x
EV/
Revenue

Quarterly Update | Q3 2017 | TMT
www.investmentbanking.deloitte.com | Page 9
Recent Transactions1
Last Twelve Months
Target/Acquiror Close Date LTM Revenue
LTM
EBITDA
EBITDA
Margin
Enterprise
Value ("EV")
EV/
Revenue
EV/
EBITDA
($ in Millions)
Scripps Networks Interactive, Inc. Pending $3,472.0 $1,604.1 46.2 % $14,920.1 4.3 x 9.3 x
Discovery Communications, Inc.
Tribune Media Company Pending 1,919.4 562.9 29.3 6,570.9 3.4 11.7
Sinclair Broadcast Group, Inc.
Worldpay Group plc Pending 1,555.4 593.6 38.2 11,710.9 7.5 19.7
Vantiv, Inc.
NXP Semiconductors N.V. Pending 8,664.0 2,349.0 27.1 48,009.5 5.5 20.4
QUALCOMM Incorporated
Siliconware Precision Industries Co., Ltd. Pending 2,678.7 812.3 30.3 5,310.0 2.0 6.5
Advanced Semiconductor Engineering, Inc.
Nets A/S Pending 1,198.0 333.6 27.8 6,349.6 5.3 19.0
Advent International Corporation
General Communication, Inc. Pending 930.8 271.0 29.1 2,716.6 2.9 10.0
Liberty Ventures
WebMD Health Corp. Sep-17 709.0 184.5 26.0 2,641.2 3.7 14.3
MH SUB I, LLC
Westcon Group, Inc. Sep-17 2,234.7 88.8 4.0 830.0 0.4 9.3
SYNNEX Corporation
Whole Foods Market, Inc. Aug-17 15,856.0 1,333.0 8.4 13,732.7 0.9 10.3
Amazon.com, Inc.
Mobileye N.V. Aug-17 338.0 118.1 34.9 14,195.7 42.0 120.2
Intel Corporation
NeuStar, Inc. Aug-17 1,165.1 420.1 36.1 2,885.9 2.5 6.9
GIC Special Investments Pte. Ltd.
CardConnect Corp. Jul-17 616.0 27.0 4.4 716.3 1.2 26.6
First Data Corporation
RetailMeNot, Inc. May-17 295.4 30.7 10.4 455.1 1.5 14.8
Harland Clarke Holdings Corp.
CEB Inc. Apr-17 949.8 199.9 21.0 3,680.7 3.9 18.4
Gartner, Inc.
Linear Technology Corporation Mar-17 1,423.9 685.0 48.1 14,569.9 10.2 21.3
Analog Devices, Inc.
Everett Spinco, Inc. Mar-17 19,032.0 1,704.0 9.0 8,642.0 0.5 5.1
Computer Sciences Corporation
Intersil Corporation Feb-17 518.3 94.5 18.2 2,968.8 5.7 31.4
Renesas Electronics Corporation
Alcatel-Lucent Nov-16 16,025.8 1,467.2 9.2 15,540.3 1.0 10.6
Nokia Corporation
Median $1,423.9 $420.1 27.1 % $6,349.6 3.4 x 14.3 x
Mean $4,188.5 $677.8 24.1 % $9,286.6 5.5 x 20.3 x

Quarterly Update | Q3 2017 | TMT
www.investmentbanking.deloitte.com | Page 10
Select Deloitte Corporate Finance TMT Group Transactions
Wipro Limited
has acquired
NerveWire, Inc.
Deloitte Corporate Finance LLC
has been acquired by
The undersigned acted as advisor to
IPNet Solutions
a portfolio company of
Golden Gate Capital
IPNet Solutions
Inovis
Deloitte Corporate Finance LLC
NTT Communications Corporation
The undersigned acted as financial advisor to
NTT Communications
has acquired 70% of the
issued shares of
Frontline System Austalia Pty Ltd
Deloitte Corporate Finance LLC
has acquired
The undersigned rendered a fairness opinion
to Meredith Corporation
Allrecipes.com, Inc.
from
The Reader’s Digest Association, Inc.
Meredith Corporation
Deloitte Corporate Finance LLC
Information Builders, Inc.
The undersigned acted as exclusive financial
advisor to Information Builders, Inc.
has received a
minority investment from
Goldman, Sachs & Co.
Deloitte Corporate Finance LLC
BlackBerry Limited
Volkswagen AG
has acquired
Bochum, Germany Research and Development Center of
Deloitte Corporate Finance LLC
Deloitte Corporate Finance LLC
Meritus Payment Solutions
Optimal Payments Plc
has acquired
Deloitte Corporate Finance LLC
have been acquired by
Substantially all of the Assets ofRent A Toll, Ltd.
American Traffic Solutions
Tweddle Group, Inc.
Deloitte Corporate Finance LLC
has received an equity investment
from
The Gores Group, LLC
Deloitte Corporate Finance LLCDeloitte Tohmatsu Financial Advisory Co., Ltd.
EF Johnson Technologies, Inc.
has acquired
JVCKENWOOD Corporation
NWN Corporation
has been acquired by
New State Capital Partners, LLC
Deloitte Corporate Finance LLCDeloitte Corporate Finance LLC
Gold Club and International Gold Club
Win Advanced Systems Limited
has completed the acquisition of
has obtained senior debt financing from
General Information Services, Inc.
PNC Financial Services
Deloitte Corporate Finance LLC
Identity Finder, LLC
Deloitte Corporate Finance LLC
has been acquired by
Inverness Graham
Investments, Inc.
SureID, Inc.
Deloitte Corporate Finance LLC
has completed a unitranche
capital raise with
Goldman Sachs
Specialty Lending Group
Deloitte Corporate Finance LLC
Thompson Street Capital Partners
Global Software, Inc.
has completed a majority
recapitalization with
The undersigned acted as exclusive
financial advisor to SureID, Inc.
The undersigned acted as exclusive
financial advisor to Global Software, Inc.
The undersigned acted as financial advisor to
Optimal Payments Plc
The undersigned acted as advisor to
Wipro Limited
The undersigned acted as exclusive advisor to
BlackBerry Limited
The undersigned acted as exclusive
financial advisor to Rent A Toll, Ltd.
The undersigned acted as exclusive
financial advisor to Tweddle Group, Inc.
The undersigned acted as advisor to
JVCKENWOOD Corporation
The undersigned acted as exclusive
financial advisor to NWN Corporation
The undersigned acted as exclusive
financial advisor to Identity Finder, LLC
The undersigned acted as financial advisor to
General Information Services, Inc.
The undersigned acted as M&A and financing
advisor to Win Advanced Systems Limited
funded through a structured capital
raise backed by
Global Merchant Advisors
Metric Capital Partners

Quarterly Update | Q3 2017 | TMT
www.investmentbanking.deloitte.com | Page 11
Sources Cited
Page 2:
1. “2017 Ponemon Cost of Data Breach Study”, IBM. June 2017.
2. “The Future of Finance,” Goldman Sachs. March 2015.
3. “Disruptive Trends That Will Transform the Auto Industry,” McKinsey & Company. January 2016.
4. “Global TMT Predictions,” Deloitte. March 20, 2017.
5. “Discovery Communications to Acquire Scripps Networks Interactive for $14.6 Billion,” DiscoveryCommunications. July 31, 2017.
6. “Vantiv Seals $10.4 Billion Merger with Worldpay,” CNBC. August 9, 2017.
Page 3:
1. U.S. Bureau of Economic Analysis. September 30, 2017. Data as of September 30, 2017.
2. U.S. Department of the Treasury. September 30, 2017. Data as of September 30, 2017.
3. Bureau of Labor Statistics. September 30, 2017. Data as of September 30, 2017.
4. S&P Capital IQ. September 30, 2017. Data as of September 30, 2017.
5. IBISWorld. September 30, 2017. Data as of June 30, 2017.
6. ITU World Telecommunications. September 30, 2017. Data as of September 30, 2017.
Page 4:
1. S&P Capital IQ. October 9, 2017. Data as of October 9, 2017.
2. S&P Capital IQ. October 9, 2017. Data as of October 9, 2017.
Page 5:
1. S&P Capital IQ. October 9, 2017. Data as of October 9, 2017.
2. S&P Capital IQ. October 9, 2017. Data as of October 9, 2017.
Page 6:
1. “Q2 Technology, Media, & Telecom Sector Review”, Harris Williams & Co. Q2 2017.
2. S&P Capital IQ. October 9, 2017. Data as of October 9, 2017.
Pages 7-9:
1. S&P Capital IQ. October 9, 2017. Data as of October 9, 2017.

Quarterly Update | Q3 2017 | TMT
www.investmentbanking.deloitte.com | Page 12
Deloitte Corporate Finance LLC (“DCF”)
Phil [email protected]+1 704 333 0533
Jonathan [email protected]+1 214 840 1779
Keith [email protected]+1 404 631 3455
Tracy [email protected]+1 213 996 4939
Eric [email protected]+1 704 333 0518
Tony Blanchard [email protected]+1 313 396 3738
Doug [email protected]+1 704 731 7219
Hector [email protected]+1 404 631 3015
Nick [email protected]+1 212 436 3273
John [email protected]+1 704 333 0574
Lorin [email protected]+1 704 333 0591
Will [email protected]+1 312 486 4458
Mike [email protected]+1 213 996 4901
Simon Gisby [email protected]+1 212 436 2495
Bill [email protected]+1 980 312 3613
Jamie [email protected]+1 214 840 7057
Matt [email protected]+1 213 892 6053
James [email protected]+1 704 731 8230
Byron [email protected]+1 469 417 2462
Jonathan Ohm [email protected]+1 212 436 2287
Lou [email protected]+1 704 731 7202
Jason [email protected]+1 704 333 0136
Matt [email protected]+1 704 731 7186
Ron [email protected]+1 404 631 3710
Justin [email protected]+1 404 942 6960
Tom [email protected]+1 214 840 7014
Charlie [email protected]+1 704 731 7201
Brad [email protected]+1 704 333 0568
DCF provides deal execution and lead financial advisory services to large corporate, middle market, private equity and venture capital firms. DCF and its affiliates maintain a presence in key U.S. financial centers.
For additional information or to find out more about how DCF can assist the deal initiation and execution process, please contact one of our DCF Managing Directors:
Brad HestonSenior Vice President [email protected]+1 404 631 3839
Deloitte Corporate Finance Business Development Group:
www.investmentbanking.deloitte.com
John LindseySenior Vice [email protected]+1 469 417 2147
Bill PucciSenior Vice President [email protected]+1 973 602 4542

Quarterly Update | Q3 2017 | TMT
www.investmentbanking.deloitte.com | Page 13
This newsletter is a periodic compilation of certain completed and announced merger and acquisition activity. Information contained in this newsletter should not be construed as a recommendation to sell or a recommendation to buy any security. Anyreference to or omission of any reference to any company in this newsletter shall not be construed as a recommendation to sell, buy or take any other action with respect to any security of any such company. We are not soliciting any action with respect to any security or company based on this newsletter. This newsletter is published solely for the general information of clients andfriends of Deloitte Corporate Finance LLC. It does not take into account the particular investment objectives, financial situation, or needs of individual recipients. Certain transactions, including those involving early stage companies, give rise to substantial risk and are not suitable for all investors. This newsletter is based on information that we consider reliable, but we do not represent that it is accurate or complete, and it should not be relied upon as such. Prediction of future events is inherently subject to both known risks, uncertainties and other factors that may cause actual results to vary materially. We are under no obligation to update the information contained in this newsletter. We and our affiliates and related entities, partners, principals, directors, and employees, including persons involved in the preparation or issuance of this newsletter, may from time to time have “long” and “short” positions in, and buy or sell, the securities, or derivatives (including options) thereof, of companies mentioned herein. The companies mentioned in this newsletter may be: (i) investment banking clients of Deloitte Corporate Finance LLC; or (ii) clients of Deloitte Financial Advisory Services LLP and its related entities. The decision to include any company for mention or discussion in this newsletter is wholly unrelated to any audit or other services that Deloitte Corporate Finance LLC may provide or to any audit services or any services that any of its affiliates or related entities may provide to such company. No part of this newsletter may be copied or duplicated in any form by any means, or redistributed without the prior written consent of Deloitte Corporate Finance LLC.
About Deloitte
Deloitte Corporate Finance LLC, an SEC registered broker-dealer and member of FINRA and SIPC, is an indirect wholly-owned subsidiary of Deloitte Financial Advisory Services LLP and affiliate of Deloitte Transactions and Business Analytics LLP. Investment banking products and services within the United States are offered exclusively through Deloitte Corporate Finance LLC. For more information, visit www.investmentbanking.deloitte.com. Please see www.deloitte.com/us/about for a detailed description of our legal structure. Certain services may not be available to attest clients under the rules and regulations of public accounting.
Copyright © 2017 Deloitte Corporate Finance LLC. All rights reserved.