Technology Industry Cluster Study
44
Technology Industry Cluster Study Joe Cortright November 2013 Prepared for The Oregon Business Council, the Technology Association of Oregon, and Oregon State University. This project was funded in part with Oregon State Lottery Funds administered by the Oregon Business Development Department.
Transcript of Technology Industry Cluster Study

Technology Industry Cluster Study
Joe Cortright November 2013
Prepared for The Oregon Business Council, the Technology Association of Oregon, and Oregon State University.
This project was funded in part with Oregon State Lottery Funds administered by the Oregon Business Development Department.

Road map
• Definition • Recent performance • Knowledge strengths • Industry dynamics • Competitor regions

Principal 4-digit NAICS codes • 3341 Computer and peripheral equipment manufacturing • 3342 Communications equipment manufacturing • 3344 Semiconductor and other electronic component manufacturing • 3345 Navigational, measuring, electro-medical, and control
instruments manufacturing • 5112 Software publishers • 5161 Internet publishing and broadcasting • 5179 Other telecommunications • 5181 Internet service providers and web search portals • 5182 Data processing, hosting, and related services • 5415 Computer systems design and related services
ICT: Information and Communication Technology
Most Oregon ICT employment is in these four digit industries; Other tabulations in this report focus on these three NAICS codes, 334 (Electronics Manufacturing), 5112 (Software), 5415 (Information Services)

Size
• Number of firms • Employees • Wages, Average Wage • Productivity • Exports

Firms and jobs
• 3,000 Firms • 58,000 Workers • $6 Billion Annual Payroll • Average Wage: $105,000 Data for three leading NAICS codes, 334 (Electronics Manufacturing), 5112 (Software), 5415 (Information Services)

Regional scope
• Electronics (NAICS 334) • Tri-County Area
– 66% of Firms – 88% of Employment – 92% of Payroll

Distribution of electronics firms
Copyright: ©2012 Esri, DeLorme, NAVTEQ
1 Dot = 75
ZIP_EMP
N0 60 12030 Miles
Oregon Hardware Employment

Distribution of software/IT firms
Copyright: ©2012 Esri, DeLorme, NAVTEQ
Computer Programming & Data Processing Firms
Oregon's High-Tech FirmsComputer Programming & Data Processing
0 30 6015 Miles XData from American Business Database 2011
Make dots correspond to employment
Copyright: ©2012 Esri, DeLorme, NAVTEQ
1 Dot = 75
ZIP_EMP
N0 60 12030 Miles
Oregon Software Employment

Highly paid

A sea change in pay levels

Major components Annual Payroll: • Electronics (334) $4.2 billion • Software (5112) $850 million • IT Services (5145) $144 million

Value-added
• Electronics $19.3 Billion • All other Mfg $17.8 Billion • Total Mfg. $37.1 Billion
Source: Census Bureau, Annual Survey of Manufactures, 2011


Portland most productive metro

Corvallis, Portland most productive
Per capita GDP Growth, 2001-2011

Productivity gains due to ICT
Actual Ex. ICT Portland 5.8% 3.5% United States 3.8% 3.7%
Annual GDP Growth Rate, 2001-2011, Source: Bureau of Economic Analysis

Firm Size & Employment: Electronics

Firm Size & Employment, Software

Self-employment in software-related industries
Source: Census Nonemployer data, 2011, Portland-Vancouver MSA


KNOWLEDGE STRENGTHS Analysis of patent data

Top knowledge specializations
18 of 20 top patent specializations are in information and communication technology


Intel Patents Down Since 2005

RECENT PERFORMANCE Job Growth

Electronics

Software
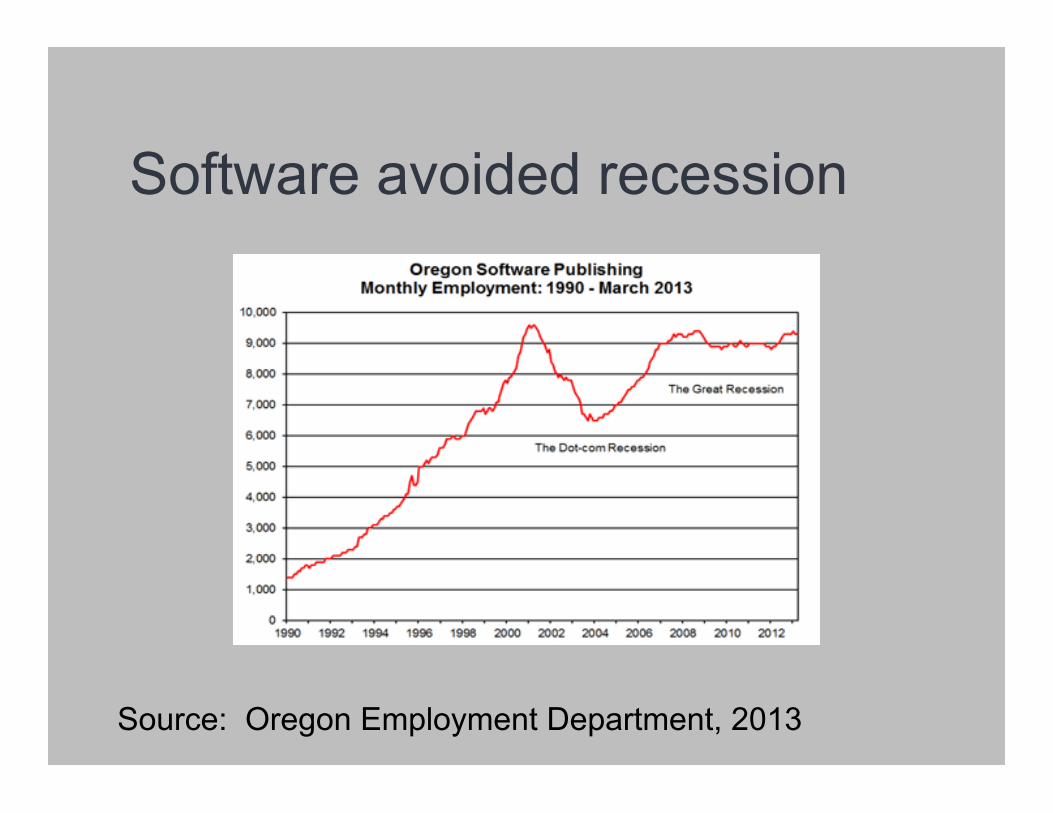
Software avoided recession
Source: Oregon Employment Department, 2013

INDUSTRY DYNAMICS Long Term Change

Oregon’s economic transformation Employment in Oregon(Thousands)
-102030405060708090
1975 1980 1985 1990 1995 2000
Wood ProductsHigh Tech

A Continuing Transformation

The ecology of the silicon forest
© Heike Mayer. 2002 -- used by permission

The universe is expanding
© Heike Mayer. 2008 -- used by permission 2008

The top 40 (1998)

1998’s top 40 today
Note: all data compiled from public sources
Firms 1998 2013 Change Pct. FirmsExpanded 5 13,221<<< 20,380< 7,159<<<<<<<<< 54% Intel,<TriCQuint,<WafertechContracted 11 10,045<<< 4,287<<<< (5,758)<<<<<<<< C57% HP,<PlanarAcquired 16 15,675<<< 5,180<<<< (10,495)<<<<<< C67% Tektronix,<Sequent,<MerixClosed 8 3,535<<<<< C<<<<<<<< (3,535)<<<<<<<< C100% NEC,<Fujitsu,<IDT
Total 40 42,476<<<<<<<<<<<< 29,847<<<<<<<<<< (12,629)<<<<<< C30%
Employment

40% of jobs at firms new to Oregon since 2001

Evolution Decade Major Changes 1940s Radio pioneers, Forest Service, Iron Fireman 1950s Birth of Tektronix, ESI 1960s Tek is majority of high tech 1970s Tek reaches its peak 1980s Tek declines, Intel arrives, Japanese transplants 1990s Intel booms, Spinoffs, dot-com bubble, Semi growth 2000s 2010s
Dot-com bust, Semi retrenches, Mobile grows

COMPETITOR REGIONS

Second Largest Output, Fastest Growing
Source: Bureau of Economic Analysis, (* - values imputed)

Location Quotients
Source: Bureau of Labor Statistics, 2012, except as noted (*, **)

Stronger specialization

Competitors: Leading Patenters
US Patent & Trademark Office, Total Patents for 2001-2011 in Parentheses

Top 10 metros for ICT startup density, 2010 Rank 1 San Jose 2.9 2 Seattle 2.7 3 Washington, DC 2.6 4 San Francisco 2.5 4 Denver 2.5 6 Raleigh 2.1 7 Salt Lake 1.9 8 Austin 1.8 9 Portland 1.7 10 Kansas City 1.5
Source: Kauffman Foundation, 2013

www.impresaconsulting.com