
TECHNOLOGY IN RURAL TRANSIT: LINKING … · LINKING PEOPLE WITH THEIR COMMUNITY ... Technology in...
50
TECHNOLOGY IN RURAL TRANSIT: LINKING PEOPLE WITH THEIR COMMUNITY U.S.Department of Transportation Federal Transit Administration Federal Highway Administration
-
Upload
duongtuong -
Category
Documents
-
view
216 -
download
0
Transcript of TECHNOLOGY IN RURAL TRANSIT: LINKING … · LINKING PEOPLE WITH THEIR COMMUNITY ... Technology in...
TECHNOLOGY IN RURAL TRANSIT: LINKING PEOPLE WITH THEIR COMMUNITY
U.S.Department of Transportation Federal Transit Administration Federal Highway Administration

Notice
This document is disseminated under the sponsorship of the U.S. Department of Transportation, Federal Transit Administration, in the interest of information exchange. The United States Government assumes no liability for the contents or use thereof.
The United States Government does not endorse manufacturers or products. Trade names appear in the document only because they are essential to the contents of the report.
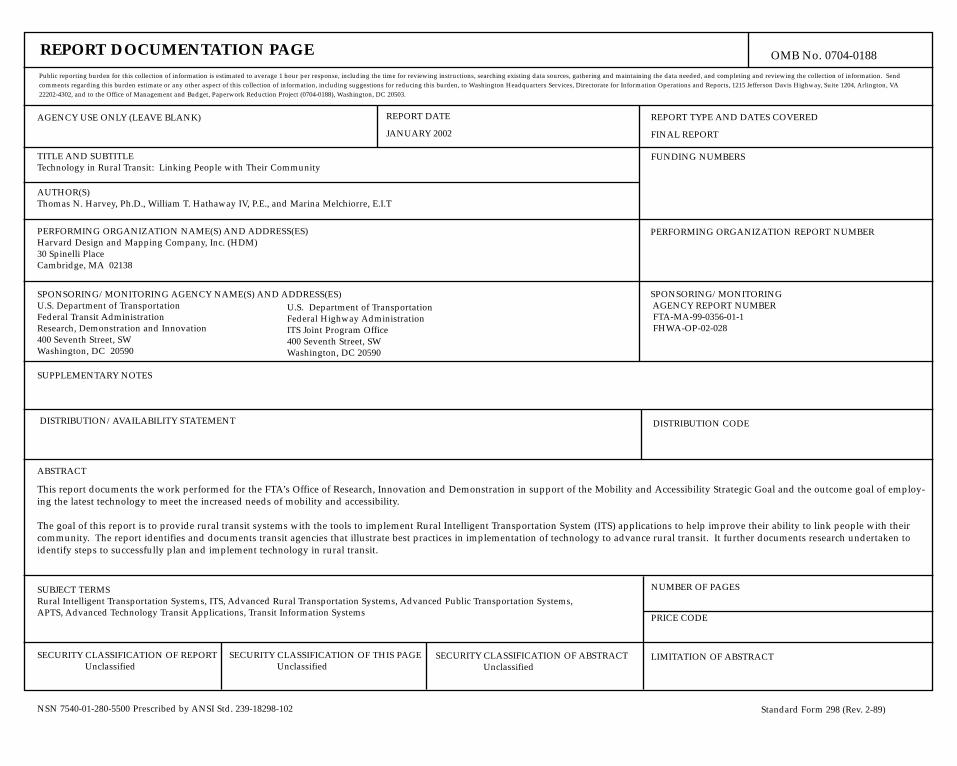
REPORT DOCUMENTATION PAGE OMB No. 0704-0188
Public reporting burden for this collection of information is estimated to average 1 hour per response, including the time for reviewing instructions, searching existing data sources, gathering and maintaining the data needed, and completing and reviewing the collection of information. Send comments regarding this burden estimate or any other aspect of this collection of information, including suggestions for reducing this burden, to Washington Headquarters Services, Directorate for Information Operations and Reports, 1215 Jefferson Davis Highway, Suite 1204, Arlington, VA 22202-4302, and to the Office of Management and Budget, Paperwork Reduction Project (0704-0188), Washington, DC 20503.
AGENCY USE ONLY (LEAVE BLANK) REPORT DATE
JANUARY 2002
REPORT TYPE AND DATES COVERED
FINAL REPORT
TITLE AND SUBTITLE Technology in Rural Transit: Linking People with Their Community
FUNDING NUMBERS
AUTHOR(S) Thomas N. Harvey, Ph.D., William T. Hathaway IV, P.E., and Marina Melchiorre, E.I.T
PERFORMING ORGANIZATION NAME(S) AND ADDRESS(ES) Harvard Design and Mapping Company, Inc. (HDM) 30 Spinelli Place Cambridge, MA 02138
PERFORMING ORGANIZATION REPORT NUMBER
SPONSORING/MONITORING AGENCY NAME(S) AND ADDRESS(ES) U.S. Department of Transportation Federal Transit Administration Research, Demonstration and Innovation 400 Seventh Street, SW Washington, DC 20590
U.S. Department of Transportation Federal Highway Administration ITS Joint Program Office 400 Seventh Street, SW Washington, DC 20590
SPONSORING/MONITORING AGENCY REPORT NUMBER FTA-MA-99-0356-01-1 FHWA-OP-02-028
SUPPLEMENTARY NOTES
DISTRIBUTION/AVAILABILITY STATEMENT DISTRIBUTION CODE
ABSTRACT
This report documents the work performed for the FTA’s Office of Research, Innovation and Demonstration in support of the Mobility and Accessibility Strategic Goal and the outcome goal of employing the latest technology to meet the increased needs of mobility and accessibility.
The goal of this report is to provide rural transit systems with the tools to implement Rural Intelligent Transportation System (ITS) applications to help improve their ability to link people with their community. The report identifies and documents transit agencies that illustrate best practices in implementation of technology to advance rural transit. It further documents research undertaken to identify steps to successfully plan and implement technology in rural transit.
SUBJECT TERMS Rural Intelligent Transportation Systems, ITS, Advanced Rural Transportation Systems, Advanced Public Transportation Systems, APTS, Advanced Technology Transit Applications, Transit Information Systems
NUMBER OF PAGES
PRICE CODE
SECURITY CLASSIFICATION OF REPORT Unclassified
SECURITY CLASSIFICATION OF THIS PAGE Unclassified
SECURITY CLASSIFICATION OF ABSTRACT Unclassified
LIMITATION OF ABSTRACT
NSN 7540-01-280-5500 Prescribed by ANSI Std. 239-18298-102 Standard Form 298 (Rev. 2-89)

Technology in Rural Transit: Linking People with Their Community
Report No. FTA-MA-99-0356-01-1 FHWA-OP-02-028
Prepared by
Harvard Design and Mapping Company, Inc. 30 Spinelli Place Cambridge, MA 02138 www.hdm.com Elena Bleakley, Editor
Prepared for
U.S.Department of Transportation Federal Transit Administration Federal Highway Administration
Federal Transit Administration Office of Research, Demonstration and Innovation 400 Seventh Street, SW Washington, DC 20590 www.fta.dot.gov
Designed by KBB Communications Design, Newton, MA
January 2002
Federal Highway Administration Intelligent Transportation System Joint Program Office 400 Seventh Street, SW Washington, DC 20590 www.its.dot.gov

Foreword
Dear Colleague:
For millions of people living in rural communities, public transit is the vital link that connects them to work, school, health care, services, resources, friends and families. As reflected in the U.S. Department of Transportation’s Strategic Goals, the Federal Transit Administration and Federal Highway Administration is committed to ensuring that these individuals, like all Americans, have access to transit to meet their basic mobility and accessibility needs.
Working together with our local and state partners, we can ensure that we have credible programs to meet this demand for reliable, safe and convenient transit. Many rural transit systems have explored the use of technology to improve transportation service efficiency and human mobility. There is much to be gained by sharing the experiences of these systems and establishing a shared body of knowledge.
The work that is presented in this report supports these efforts and will provide a valuable tool for rural transit systems.
Edward L. Thomas Associate Administrator Office of Research, Demonstration and Innovation Federal Transit Administration
Christine M. Johnson Program Manager, Operations Director ITS Joint Program Office Federal Highway Administration

Preface
The disappearance of jobs in rural areas and the urbanization of our society have combined to isolate individuals and small communities. Not having access to transportation in a rural area frequently means not having access to essential needs such as health care, jobs, education, and even family and friends – the most basic human needs.
However, the innovations in technology, notably Intelligent Transportation Systems (ITS), during the past two decades have made possible major changes in the transportation system. The application of the personal computer and the expanding capabilities of computer hardware and software have provided powerful tools for rural transit managers.
These innovations in technology, the establishment of ITS America, and the Intermodal Surface Transportation Efficiency Act of 1991 have resulted in the United States Department of Transportation’s initiative in ITS. ITS applies current and emerging technologies in the fields of electronics, communications, navigation, information processing, information displays, computers and control systems to all forms of transportation. The ITS subset applicable to transit created by the Federal Transit Administration has been labeled Advanced Public Transportation System (APTS) technologies. The term, Transit ITS, is used to designate APTS deployed in the actual day-to-day provision of public transportation. Effectively integrated and deployed, ITS technologies can enhance safety and make transportation more widely and efficiently available to rural areas.1
Initial applications of Transit ITS took place within urban systems that, for the most part, developed and applied the technology. Since the implementation within urban systems proved successful and additional applications for Transit ITS were identified, it became apparent that the application to rural transit systems would enhance not only their operations, but also the workforce’s quality of life.
Each tool has advantages and related implications. The most widely used of these is the transit operations software for the scheduling and dispatching of trips. It is important to note the tools described above may not necessarily address the needs of or be appropriate for every system. Each system is unique and has its own needs and capabilities that must be examined to determine the technology that will be most beneficial.
1“Rural Public Transportation Technologies: User Needs and Applications,” TECHBRIEF, September 1998, FHWA-RD-98-146. Highest priority needs are the Rural Transit Operator Information Kit (Planning Guidebook), the Rural APTS Success Story Booklet (Best Practices) and demonstrations of low-cost technologies.
Transit ITS technologies most relevant to rural systems include:
• Accounting Software • Automatic Passenger Counters • Automatic Vehicle Location Systems (AVL) • Communications • Customized Spreadsheet and Databases • Demand-Responsive Transit Software • Geographic Information Systems (GIS) • Internet Web site • Maintenance Software • Silent Alarm System • Mobile Data Terminal • Palmtop Electronic Manifest Device • Personnel Management Software • Signal Priority • Transit Operations Software • Traveler Information Systems

Organization of this Report
This report is designed to act as a planning tool for implementing Transit ITS in rural systems. While presented as a single integrated document it contains four distinct sections as described below:
A Guidebook for Planning Rural Transit ITS Applications A Guidebook for Planning Rural Transit ITS Applications contains an ordered set of suggestions for choosing new information-management technology to improve the performance of a rural transit system. It is built on the experience of transit professionals from throughout the United States.
Best Practices in Rural Transit ITS The Best Practices in Rural Transit ITS document is the result of a review of Transit ITS and its application to rural transit operations in the field. The document is organized to address the planning, research, procurement, implementation and evaluation of technologies and applications. Included are a series of best practices, consisting of suggestions and guidelines, intended to provide guidance and to minimize the learning curve in evaluating, selecting and implementing Transit ITS technologies and applications.
Transit ITS Case Studies The Transit ITS Case Studies were derived from interviews with transit systems at various stages of Transit ITS implementation. The case studies are intended to showcase the approach used by individual systems. They describe the motivations for considering Transit ITS, approaches taken, final results, and lessons learned. Each case study also summarizes the transit system’s characteristics including the service area, fleet description, service types, passenger trip statistics, and project funding sources.
Transit ITS Resources The Transit ITS Resources contain a variety of information useful to the planners of Transit ITS applications. Included is a copy of a Transit ITS field survey questionnaire, a bibliography of relevant print and Internet publications, a useful list of federal and state agency rural transit contacts, and a glossary of terms and acronyms.
The information contained in this report will be an important resource to help improve and ensure mobility and access in rural communities.

Acknowledgements
The authors would like to thank the many individuals and organizations who assisted in the development of this report. Their input was invaluable in creating a practical planning tool for implementing Transit ITS technology in rural transit systems.
Our sincere appreciation is extended to William Wiggins of the Office of Research, Demonstration Innovation for his direction and guidance throughout this project.
We are also grateful to the individuals who participated in the expert panel to kick off this effort. They provided insight into the challenges facing rural transit systems and helped guide this project. The field personnel lending their expertise included:
• Michael Connelly, Blacksburg (Virginia) Transit • David Eckern, Minnesota Department of Transportation • Annette Emery, California Department of Business and Transportation • Edward Griffin, Florida Commission on Transportation for the Disadvantaged • Dr. Ann Hamilton, Forsyth County (North Carolina) Social Services • Susan Jeffers, Blue Grass Community Action Organization, Kentucky • Michael Landry, OATS, Missouri • Robin Phillips, Oregon Department of Transportation • Dennis Walsh, Cape Cod (Massachusetts) Regional Transit Authority • Pamela Ward, Ottumwa (Iowa) Transit Authority
FTA staff participating in the expert panel included William Wiggins, Charlene Wilder, Douglas Bernie, Paul Verchinski and Charles Goodman. Michael Freitas and Dianne McSwain of FHWA and HHS, respectively, and Joseph Coughlin, Ph.D. of the Massachusetts Institute of Technology Center for Transportation Studies provided additional support. Individuals who provided assistance in setting up the panel and visiting the transit systems include Jean Palmateer, William Gardner, Peter Spaulding, and Chris Ziegler.
A special note of appreciation goes to the rural transit system operators and their associates who participated in the interview process. Without the time that they took to candidly recount their experiences implementing technology in rural transit, this document would be incomplete. These individuals included:
• Larry Alflen - Zuni Transit, Zuni, NM • Julie Brown - Rogue Valley Transportation District, Medford, OR • Donna Cart - Marion County Senior Services, Ocala, FL • Thomas Cruikshank - St. Cloud Metropolitan Transit Commission, St. Cloud, MN • Dale DeRoest - South Lane Wheels, Cottage Grove, OR

• Ramona Dillard, Melissa Talahaftewa, Brandon Mariano - Shaa'srk'a ("Roadrunner") Transit, Laguna, NM • Elizabeth Falk - Montachusett Regional Transit Authority, Fitchburg, MA • Mark Hoisser - Dakota Area Resources & Transportation for Seniors, West St. Paul, MN • Ric Ingham - Central Oregon Intergovernmental Council, Redmond, OR • Steven Jones - Lorraine Toner Flagler County Transit, Palm Coast, FL • Jack Larson - Arrowhead Transit ,Virginia, MN • Richard Maddern and Don Mohawk - Minnesota DOT • Brian Nourse - St. John's Council on Aging, St. Augustine, FL • Terry Parker - Lane Council of Governments and Lane Transit District, Florence, OR • Dawn Pike - Josephine County Health & Community Action, Grants Pass, OR • Fred Stoffer - Special Mobility Services, Inc., Eugene, OR • Sandra Strieby - Sunset Empire Transit District, Astoria OR Sunset Empire Transportation District • Dennis Walsh - Cape Cod Regional Transit Authority, Cape Cod, MA • Perry B. Yazzie - Navajo Transit System, Window Rock, AZ
Special thanks go also to Elaine Brouillard, Amy D. Estelle, Judith M. Espinosa, Miguel F. Sarria, and Mary E. White from the ATR Institute at the University of New Mexico, and Josette Lucero from the New Mexico State Highway and Transportation Department Public Transit Programs Bureau.
Finally, thanks to Carol Schweiger of Multisystems, and Matthew Hardy of Mitretek Systems for their review and comments on this report.

A GUIDEBOOK FOR PLANNING RURAL TRANSIT ITS APPLICATIONS
U.S.Department of Transportation Federal Transit Administration Federal Highway Administration

TABLE OF CONTENTS A Guidebook for Planning Rural Transit ITS Applications
1 INTRODUCTION 1 1.1 Purpose of the Guidebook 1 1.2 Overview of the Guidebook 1
2 THE CHALLENGE OF IDENTIFYING TRANSIT SYSTEM NEEDS 3 2.1 The Nature of the Challenge for Transit Managers 3 2.2 Identifying the Needs for New Technology 4
2.2.1 Assess the Existing System 4 2.2.2 Predict Future Needs 5 2.2.3 Analyze Current Business Processes 6
2.3 One Manager’s Approach to Identifying Transit System Needs 9
3 IDENTIFYING THE TECHNOLOGIES AVAILABLE TO ADDRESS THE NEEDS 13 3.1 What Can Transit ITS Technologies Do? 13 3.2 Sorting Out the Implications 15
3.2.1 Software and Hardware 15 3.2.2 New Capabilities and Skills Needed 16 3.2.3 Sources of New Capabilities and Skills 16
3.3 One Manager’s Approach to Identifying the Available Technologies 17
4 PLANNING THE IMPLEMENTATION 20 4.1 Key Considerations 20 4.2 Availability of Financial Resources 21 4.3 Identifying Alternative Solutions for Each Need 23 4.4 Estimating Impacts 25
4.4.1 Costs 25 4.4.2 Benefits 26
4.5 Making Your Selection 27 4.5.1 Focus on Your Goal 27 4.5.2 Examine Your Priority of Needs 27 4.5.3 Compare the Preferred Alternatives 28 4.5.4 Making Your Choice 31
4.6 One Manager’s Approach to Planning for Implementation 32

5 EVALUATING THE IMPLEMENTATION 34 5.1 Purpose of Evaluation 34 5.2 Database Development 34
5.2.1 Data Acquisition 34 5.2.2 Database Creation 35
5.3 Creating and Reporting Evaluation Measures 36 5.3.1 Creating Evaluation Measures 36 5.3.2 Reporting Evaluation Measures 36
5.4 Performing the Evaluation 36 5.4.1 Defining the Base Case 36 5.4.2 Measuring Progress 36
5.5 Backing-Up the Database 37 5.6 One Manager’s Approach to Evaluating Implementation 37
6 WHERE DOES RURAL TRANSIT ITS PLANNING GO FROM HERE? 38
INTRODUCTION1
1
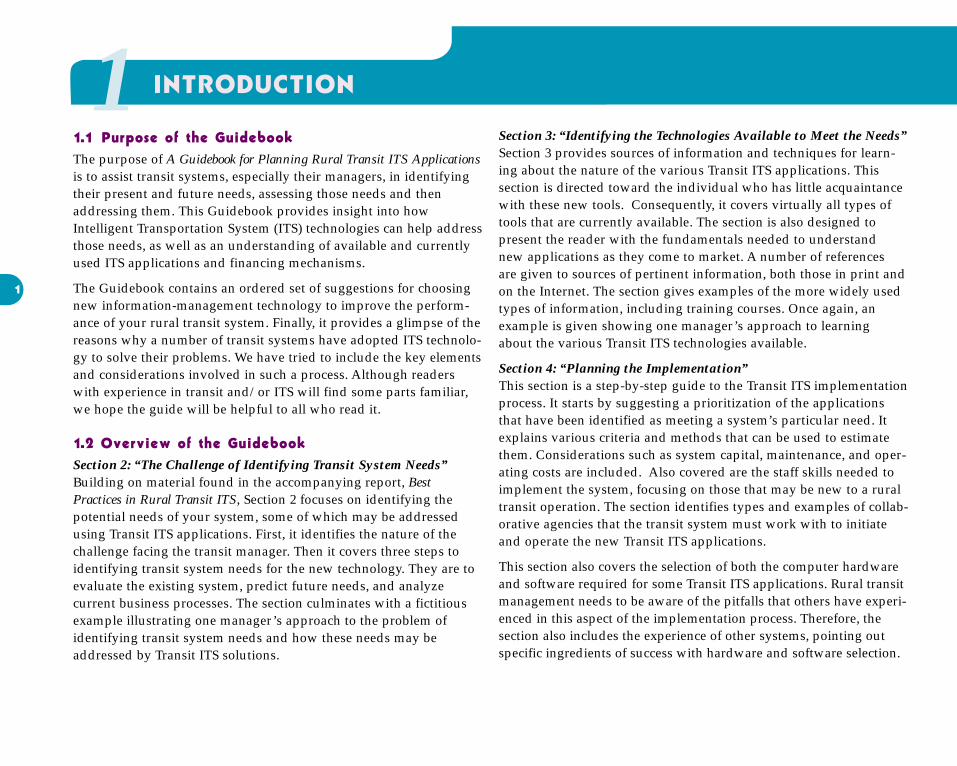
1.1 Purpose of the Guidebook The purpose of A Guidebook for Planning Rural Transit ITS Applications is to assist transit systems, especially their managers, in identifying their present and future needs, assessing those needs and then addressing them. This Guidebook provides insight into how Intelligent Transportation System (ITS) technologies can help address those needs, as well as an understanding of available and currently used ITS applications and financing mechanisms.
The Guidebook contains an ordered set of suggestions for choosing new information-management technology to improve the performance of your rural transit system. Finally, it provides a glimpse of the reasons why a number of transit systems have adopted ITS technology to solve their problems. We have tried to include the key elements and considerations involved in such a process. Although readers with experience in transit and/or ITS will find some parts familiar, we hope the guide will be helpful to all who read it.
1.2 Overview of the Guidebook Section 2: “The Challenge of Identifying Transit System Needs” Building on material found in the accompanying report, Best Practices in Rural Transit ITS, Section 2 focuses on identifying the potential needs of your system, some of which may be addressed using Transit ITS applications. First, it identifies the nature of the challenge facing the transit manager. Then it covers three steps to identifying transit system needs for the new technology. They are to evaluate the existing system, predict future needs, and analyze current business processes. The section culminates with a fictitious example illustrating one manager’s approach to the problem of identifying transit system needs and how these needs may be addressed by Transit ITS solutions.
Section 3: “Identifying the Technologies Available to Meet the Needs” Section 3 provides sources of information and techniques for learning about the nature of the various Transit ITS applications. This section is directed toward the individual who has little acquaintance with these new tools. Consequently, it covers virtually all types of tools that are currently available. The section is also designed to present the reader with the fundamentals needed to understand new applications as they come to market. A number of references are given to sources of pertinent information, both those in print and on the Internet. The section gives examples of the more widely used types of information, including training courses. Once again, an example is given showing one manager’s approach to learning about the various Transit ITS technologies available.
Section 4: “Planning the Implementation” This section is a step-by-step guide to the Transit ITS implementation process. It starts by suggesting a prioritization of the applications that have been identified as meeting a system’s particular need. It explains various criteria and methods that can be used to estimate them. Considerations such as system capital, maintenance, and operating costs are included. Also covered are the staff skills needed to implement the system, focusing on those that may be new to a rural transit operation. The section identifies types and examples of collaborative agencies that the transit system must work with to initiate and operate the new Transit ITS applications.
This section also covers the selection of both the computer hardware and software required for some Transit ITS applications. Rural transit management needs to be aware of the pitfalls that others have experienced in this aspect of the implementation process. Therefore, the section also includes the experience of other systems, pointing out specific ingredients of success with hardware and software selection.

The final component of this section includes an emphasis on training. The time and cost of successful training are two requirements of system implementation that are most often underestimated. The types of options available and their relative merits are discussed. As well, key elements of system installation planning are covered, along with some of the “dos” and “dont's” emerging from prior experiences around the country. Finally, Section 4 concludes with an example of the approach taken by one system in implementation planning.
Section 5: “Evaluating the Implementation” This section focuses on the assessment of new applications after they are up and running. It includes recommendations on the type of information that should be kept to evaluate technology implementations. It also contains suggestions about parallel operations and other forms of back-up that help protect against early system flaws and installation failures. Examples are given of implementation problems, successes, and evaluations already experienced by rural transit systems around the country.
Section 6: “Where Does ITS Rural Planning Go from Here?” This section briefly explains how the Guidebook provides a framework for managing the future. It can help rural transit managers organize, assimilate, and make use of technological information coming at them at an ever increasing rate. It can help them plan for the future by participating in the development of new collaborative relationships with social service agencies, businesses, and other transit providers interested in improving services for rural area communities. 2

THE CHALLENGE OF IDENTIFYING TRANSIT SYSTEM NEEDS 2
3
2.1 The Nature of the Challenge for Transit Managers The expanding capabilities of computer hardware and software have created new and more powerful tools for rural transit managers. Many are described in the accompanying report, Best Practices in Rural Transit ITS. Better communications among drivers, dispatchers, and riders increase the potential for better service. Greater efficiencies can come from new routines for scheduling runs and trips. Geographic Information System-based vehicle locators as well as more comprehensive and accessible vehicle inspection and maintenance records can improve system safety and security. Even the use of e-mail and other features of the Internet can improve the efficiency and effectiveness of transit systems. These are just a few of the new capabilities.
The challenge for rural transit managers is how to take advantage of these new capabilities. One of the first things to be recognized is that computer-based technologies can be applied to virtually every aspect of rural transit system operations. Consequently, the first step that the transit manager should take is to identify current needs of the system for improvement. Any one of these identified needs could be a candidate for the application of one or more Transit ITS technologies. It is important to recognize that not every need will best be met with a Transit ITS application. Careful examination of administrative processes, for example, often reveals outdated, outmoded, or redundant procedures that merely need to be reorganized or replaced.
The manager should also keep in mind that a transit system is a constantly changing organization. He or she must not only respond to today’s needs but also recognize that the transit system will change over time. This change may be the result of modifications to operations, service area expansions, acquisition of new equipment, new customer groups, altered environmental regulations, and many other influences. The transit system will not be the same tomorrow or in one, five or ten years.
Transit ITS applications can assist managers in managing the development of their systems to respond to these anticipated changes. In order for a transit system to fully take advantage of the technologies and tools that are available do this, the needs of the transit system need to be identified.
Transit ITS can assist managers in managing change in their systems over time.
One means of approaching the challenges is given in: Schweiger and Marks, “Needs Assessment for Transit ITS: A Structured Approach,” World ITS Congress, Turin, Italy, 2000.

2.2 Identifying the Needs for New Technology 2.2.1 Assess the Existing System
The first level of identifying needs for new technology is the ongoing process of assessing your existing system for problems or opportunities for improvement. Those who operate or use the system, such as first line supervisors, employees and customers, may be most familiar with these problems and opportunities. Seeking out their concerns and suggestions often pays dividends. Not every need uncovered is going to have a good solution among Transit ITS applications, however. Consequently, it is good to approach needs identification in the first instance without concern for the type of solution it might have.
There are several questions to ask when looking at your existing operations to determine the extent to which the transit system is responding to patrons’ needs.
4• Are you meeting the service demand?
• Are there a lot of complaints?
• Where are complaints directed?
• Do you talk with and listen to the suggestions of your patrons, the communities you serve, or your employees?
Three Steps to Identifying Needs
• Assess the existing system
• Predict future needs
• Analyze current business processes
When you look at the following list of goals, which ones do you want to accomplish?
• Increased ridership?
• Fewer complaints?
• Happier employees?
• Lower operating costs?
• More service for the same or less cost? It is important to identify the goals that you have for your system.
Meeting these goals may require changes in the quantity and quality of transit service. ITS technologies and applications might be able to help you achieve them.
It is helpful to have objectives that will identify actions that lead toward the goal. Many of these actions may involve the additions of Transit ITS technology to your system. Particular changes call for particular types of computer hardware and software. Candidate activities for improvement include passenger booking, run scheduling, vehicle dispatching, vehicle routing, vehicle maintenance, and fare collection. Any choices that you make should be made with an eye toward the goal. The fulfillment of system needs should be directly related to achieving the goal.

5
2.2.2 Predict Future Needs
A second level of looking at what you need or how you might expect your system to change is to consider the planning that you or someone else has already done for the future. Although you may not have had the time to really plan anything, you have probably been thinking about possible changes. Whatever thoughts you have had about future needs and system changes should be put on a list and placed in a readily accessible file. You will later want to check this list to see if Transit ITS technology can meet some of the future demands placed on your system. Ask yourself how meeting each of those future needs will contribute to your goal for the system.
It is also important to take advantage of the fact that you are part of a larger community system. People may have done planning for you as part of another organization or have a vision of where they expect your system to be going as time progresses. In essence, your system may not have its own long-term plan, but be part of the plan of another planning or social service organization. This could identify your system’s direction in future years.
Planning organizations typically include agencies at the state, regional, metropolitan area, county, or local level. You will need to convert the plan - yours, the potential client’s or the planning organization’s - into appropriate terms for planning transit services. Their plans for future development in the area that your system serves will provide important clues about where residences, workplaces, and other activities of your future clients may be located. Expanding service to the developing areas should be added to your list of future needs. Any other changes that will be required to make the service expansion possible should be added to your list.
Social service agencies are another type of organization with plans that may affect your system. Many have clients with needs for transportation to and from locations where the agencies provide their various services. Some of these agencies may currently provide transportation for their clients. Several federal programs of assistance to people in rural areas are in operation around the country today. You may want to contact those agencies to
determine which ones have clients or facilities in your service area. If you think that any of these agencies and their clients may want your system to provide transportation for them in the future, you should add them to your list.
Each focus on a particular need, and most have transportation requirements. The transit planner and the transit-operating agency can benefit by mapping locations of beneficiary residences and service-delivery facilities using GIS software. Once these locations are acquired and plotted on a map using GIS, the transportation need can be easily visualized in operating terms.
The transit planner can use this same approach to plot the ends of trips for other purposes. These purposes include journeys to work, shopping, recreation, church and meetings, and also trips to clinics and other social services for persons who are not beneficiaries of social service agencies. One trip end is usually the residence of the trip-taker, while the other is the location of the activity. When the frequency and timing of the trips are added to the GIS database, the demand for transportation is visually presented in a form that directly supports transit service planning and transit operations.
The accompanying Transit ITS Resources contain lists of federal and state agencies as well as other organizations with potential needs for rural transit. The Community Transportation Association of America (CTAA) has an annually updated resource that offers more program details and contacts, particularly at the regional (multi-state) and state levels.3
Keep in mind that your system is part of a larger community. Other agencies and organizations could impact your system’s direction in future years.
3The CTAA publishes an annual guide that consists of a directory of federal funding resources along with federal, state and regional contacts. The “Resource Guide 2000” may be obtained by contacting the CTAA National Transit Resource Center at 1-800-527-8279 or emailing [email protected]. The CTAA is also on the web at www.ctaa.org.

2.2.3 Analyze Current Business Processes
The third facet of needs identification is to scrutinize the business processes performed by your agency. These include business functions such as billing, cash management, procurement, payroll, personnel records, and training. Cost-reduction opportunities may not always be obvious, yet business processes and the functions they encompass can be inefficient. Benchmarking, that is comparing the performance of your system with that of other systems, based on the prior experience of the managers or other staff members may be helpful. This requires an uncompromising look at how each process is organized and the resources that are being used to accomplish it.
Business Process Analysis – An Example Identify activities that appear to take too much staff time and/or cost to accomplish. Are the tasks involved unnecessarily complex or circuitous? Are the tasks redundant or just plain unnecessary? Any suspect process should be documented on an action chart. Figure 1 shows an example process action chart. Something similar can be done with pencil and paper.
6
To prepare a useful process action chart:
• Ensure that all actions are included in the process.
• Provide the time sequence and the flow of action in the process.
• Show the time required to perform each action.
• Indicate the level of expertise required to perform each action.
After you have prepared the process action chart, ask the following questions for each action:
• Is this action needed?
• Is the action flow unnecessarily circuitous or redundant?
• Can the required actions be simplified or eliminated?
• Can the time required to perform the action be reduced?
• Can the level of expertise be reduced?
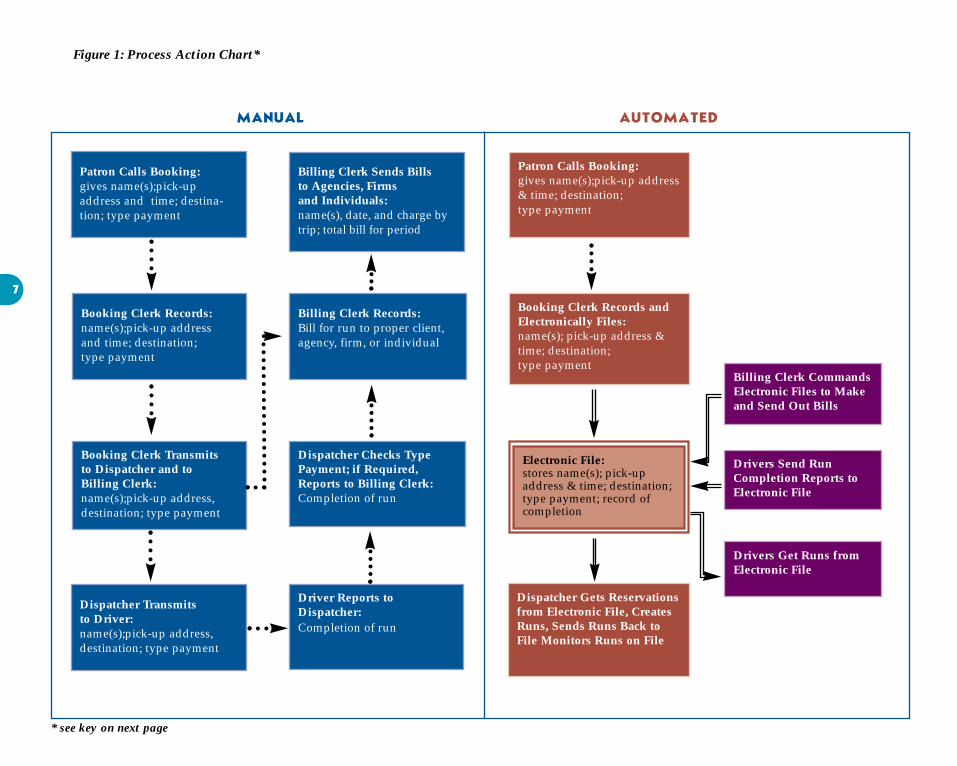
Figure 1: Process Action Chart*
MANUAL AUTOMATED
7
Patron Calls Booking: gives name(s);pick-up address and time; destination; type payment
Billing Clerk Sends Bills to Agencies, Firms and Individuals: name(s), date, and charge by trip; total bill for period
Patron Calls Booking: gives name(s);pick-up address & time; destination; type payment
Booking Clerk Records: name(s);pick-up address and time; destination; type payment
Booking Clerk Transmits to Dispatcher and to Billing Clerk: name(s);pick-up address, destination; type payment
Dispatcher Transmits to Driver: name(s);pick-up address, destination; type payment
Billing Clerk Records: Bill for run to proper client, agency, firm, or individual
Dispatcher Checks Type Payment; if Required, Reports to Billing Clerk: Completion of run
Driver Reports to Dispatcher: Completion of run
Booking Clerk Records and Electronically Files: name(s); pick-up address & time; destination; type payment
Electronic File: stores name(s); pick-up address & time; destination; type payment; record of completion
Dispatcher Gets Reservations from Electronic File, Creates Runs, Sends Runs Back to File Monitors Runs on File
Billing Clerk Commands Electronic Files to Make and Send Out Bills
Drivers Send Run Completion Reports to Electronic File
Drivers Get Runs from Electronic File
* see key on next page

Figure 1 depicts a demand-responsive transit service process chart for billing fares. It compares a manual system with an automated system. Note that it includes all the actors and their related actions. Fares can be billed to the rider’s sponsoring social service agency or employer. They can also be billed to the individual riders or paid into a farebox by the riders as they board the vehicle. The time line is more or less U-shaped for both the Manual and Automated cases, moving through the process down the left-hand column and back up the right-hand one.
Figure 1 shows the changes in the actions required of the booking clerk, the dispatcher, the driver, and the billing clerk due to the installation of transit operations software.
The impacts on resources required to perform booking, billing, and dispatch can be estimated by comparing the manual and automated processes shown in Figure 1. First, a personal computer (PC) equipped with the booking, billing, and dispatch software is required for the Automated version. A significant amount of training is needed for the staff members who will be working with the new electronic capabilities.
The Booking Clerk’s duties change from taking orders for service and transmitting them manually to the Dispatcher and Billing Clerk to taking orders for service and entering them directly into the electronic file at the time of the call. This reduces the human resource requirement by 50% or more.
Under the manual system, the Billing Clerk takes the billing and run completion information from the Booking Clerk and Dispatcher, respectively, enters billing information in a billing ledger, and prepares and sends out bills. With the automated system, the tasks are simplified to commanding the computer to send out the bills once each billing period. The human resource requirement is reduced by 99%, or is essentially eliminated.
The Dispatcher’s original tasks included taking trips from the Booking Clerk, preparing runs and delivering them to the drivers, followed by taking reports on run completion and forwarding them to the Billing Clerk. With the new electronic capabilities, the Dispatcher’s duties include preparing runs by working with the electronic file and run-development software. The Dispatcher’s requirement is comparable in terms of time spent, but the opportunity to improve driver and vehicle productivity within the same amount of time is greatly increased.
Process Action Chart Key
• A single-bordered rectangular box represents an action or set of actions by a person or persons.
• Arrows depict the flow of information.
• A double-lined box represents the personal computer.
• Bold dashed lines illustrate manual or telephone transmissions.
• Bolded, double line depict electronic transmissions.
Drivers can now get their runs and any updates by direct communication with the electronic files. Their time, along with that of their vehicles, can now be used more efficiently, thus impacting performance measures such as passenger-miles per vehicle-hour.
Similar analyses can be performed on the other business functions of a rural transit operation such as cash management, procurement, payroll, personnel records, and training.
Interagency Cost Comparisons Another form of benchmarking business practices is to compare performance and cost statistics of similarly sized systems. FTA, APTA, and CTAA maintain these statistics at the national level.
8

Many state DOTs maintain them for the rural transit operations in their state. Operating information can be shared directly with other systems as long as definitions of items being compared are consistent.
9
statisticsStatistics that deserve examination and comparison when pursuing cost savings include the following:
• purchase cost per purchase
• cost per employee
• booking process costs
• booking process costs per booking
• dispatching costs
• dispatching cost per vehicle-trip (route-based service)
• dispatching cost per person-trip (demand-based service)
• cost per passenger
• cost per passenger-mile
• cost per vehicle-mile
• vehicle maintenance costs
• vehicle maintenance costs per vehicle-mile
• billing costs
• cost per bill
• total purchase costs
Comparison of these costs with those of other rural transit systems can reveal the parts of your system that should be examined for cost-reduction opportunities.
2.3 One Manager’s Approach to Identifying Transit System Needs To illustrate, the process for estimating the potential for Transit ITS applications in a rural transit agency, we have included the following illustrative example based on the composite experience of several managers interviewed for this report. The example agency and manager are fictitious, but the situations are not. They include both best practices and lessons learned.
Our fictitious agency is Edgar County Rural Transit (ECRT) located in the northwestern quadrant of a midwestern state. The county contains about 800 square miles and has a population of about 90,000. While its main industry is agriculture, the County Seat, with a population of 40,300, has several small to mid-sized manufacturing plants that draw employees from the entire county. It also has the only full-service hospital in the county. A smaller town of 13,000 people has two clinics that serve its portion of the county in addition to a portion of two neighboring counties.
Tim Stark is the manager of ECRT. He is in his mid-forties, a college graduate, and has worked for social service agencies throughout his entire career. For five years, he has been in charge of various forms of person transportation, at least part-time. Just ten months ago, it became his full-time responsibility.
ECRT has thirty 21-passenger buses and ten 15-passenger vans. All are equipped with lifts. The operation is a combination of fixed routes and demand-responsive services. The staff includes drivers, dispatchers, mechanics, and administrative personnel.
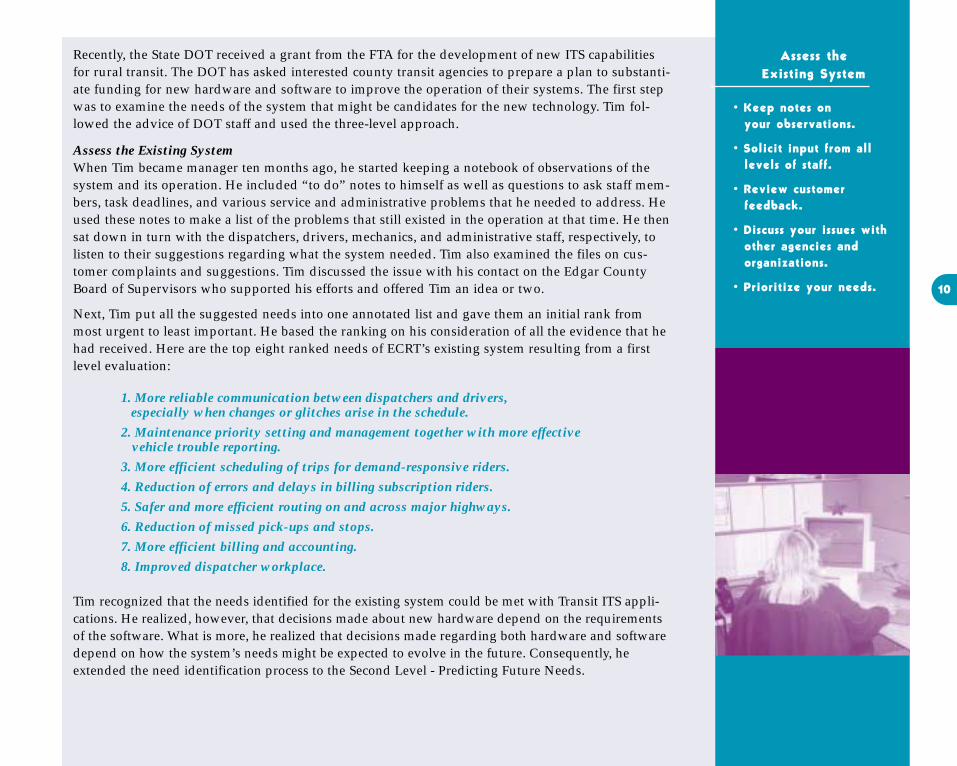
Recently, the State DOT received a grant from the FTA for the development of new ITS capabilities for rural transit. The DOT has asked interested county transit agencies to prepare a plan to substantiate funding for new hardware and software to improve the operation of their systems. The first step was to examine the needs of the system that might be candidates for the new technology. Tim followed the advice of DOT staff and used the three-level approach.
Assess the Existing System When Tim became manager ten months ago, he started keeping a notebook of observations of the system and its operation. He included “to do” notes to himself as well as questions to ask staff members, task deadlines, and various service and administrative problems that he needed to address. He used these notes to make a list of the problems that still existed in the operation at that time. He then sat down in turn with the dispatchers, drivers, mechanics, and administrative staff, respectively, to listen to their suggestions regarding what the system needed. Tim also examined the files on customer complaints and suggestions. Tim discussed the issue with his contact on the Edgar County Board of Supervisors who supported his efforts and offered Tim an idea or two.
Next, Tim put all the suggested needs into one annotated list and gave them an initial rank from most urgent to least important. He based the ranking on his consideration of all the evidence that he had received. Here are the top eight ranked needs of ECRT’s existing system resulting from a first level evaluation:
1. More reliable communication between dispatchers and drivers, especially when changes or glitches arise in the schedule.
2. Maintenance priority setting and management together with more effective vehicle trouble reporting.
3. More efficient scheduling of trips for demand-responsive riders.
4. Reduction of errors and delays in billing subscription riders.
5. Safer and more efficient routing on and across major highways.
6. Reduction of missed pick-ups and stops.
7. More efficient billing and accounting.
8. Improved dispatcher workplace.
Tim recognized that the needs identified for the existing system could be met with Transit ITS applications. He realized, however, that decisions made about new hardware depend on the requirements of the software. What is more, he realized that decisions made regarding both hardware and software depend on how the system’s needs might be expected to evolve in the future. Consequently, he extended the need identification process to the Second Level - Predicting Future Needs.
Assess the Existing System
• Keep notes on your observations.
• Solicit input from all levels of staff.
• Review customer feedback.
• Discuss your issues with other agencies and organizations.
• Prioritize your needs. 10

11
Predict Future Needs After talking with his contacts at the DOT and the County Board of Supervisors, Tim decided to focus on how ECRT might develop over the next five years thus adopting a five-year horizon for the Transit ITS plan. In reaching this decision, he noted that computer hardware and software capabilities have evolved rapidly. He expects that Transit ITS capabilities will change similarly as quickly. He also observed that the population of the county is aging so that incomes will likely increase. Tim was aware that new government programs could substantially increase the demand for rural transit. Due to the uncertainty associated with these factors, he did not want to base any decisions on what technology to acquire by looking too far into the future.
During his first few months as manager, Tim had recorded in his notebook the results of several conversations that he had with local citizens and other transportation professionals about the future of ECRT. Those discussions confirmed the selection of the five-year planning horizon. Tim’s notes also reminded him that he had talked with his DOT contact and fellow rural transit managers in the Community Transit Association of America (CTAA) concerning Transit ITS applications. He had spoken with these people regarding what others systems were already doing with Transit ITS and its impacts on their operations. In particular, Tim noted the use of mobile data terminals (MDTs) on vans and buses to improve communication and flow of digital information among dispatchers, drivers/vehicles, and riders. As well, he remembered his interests in automatic vehicle location systems (AVL) and Smart Cards.
Tim also remembered his visit with the planning staff at the Northwest Regional Planning Agency (NWRPA), which includes Edgar County in its area of responsibility. He now went back to them to obtain more information about the 5-year forecasts of activities and land use. He learned that one of the clinics not in the County Seat was expected to be purchased by the hospital. As a result, its services would be transferred to the County Seat in about two years. The planning staff also told him that developers had been looking at various sites around the county to build a large retirement community. Both projects could have significant effects
on the demand for rural transit Predict Future Needs in Edgar County and needed to be included in the estimate of • Establish a reasonable future transit needs. Tim also time frame. found assistance to estimate • Identify potential future demographics and demographics, economic economic base of Edgar and technological
changes.County that could impact the needs of ECRT. • Solicit feedback from
colleagues, state, local On the CTAA web site, Tim and federal government found contact information about agencies.
the several state and federal social services agencies that need transportation for their clients in rural areas. ECRT was already providing transportation for the clients of the State Agency for Assistance to the Elderly and Handicapped. He and his staff had been working with them to eliminate billing errors caused by both agencies. Tim called the offices of several other state and federal agencies to ascertain their plans. He went to the state capital to visit two agencies that were recommended to him by his state DOT contact as being interested in the possibilities of using public transit to serve their clients in Edgar County.
As a result of the second level look at the future, Tim was able to add the following items to his list of needs that could evolve over the next five years:
9. More accurate location of existing and potential rider origins and destinations as well as real-time vehicle location.
10. Improved communication with riders and client agencies.
11. Means for drivers to immediately notify the dispatcher of emergencies.
12. Improved fare collection and management.
12
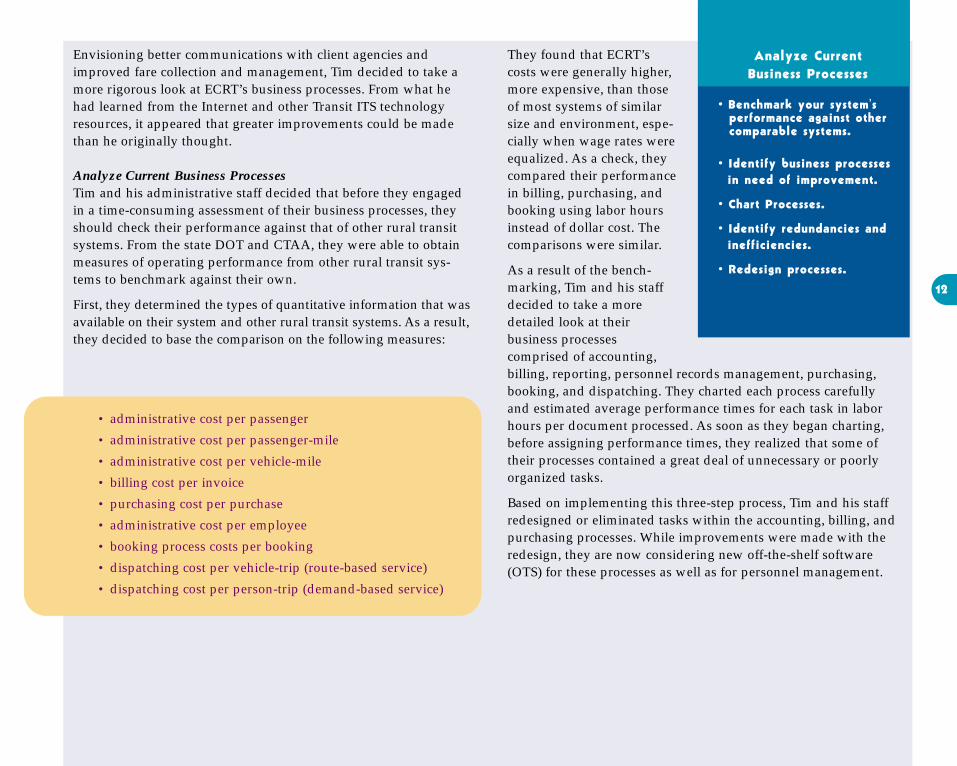
Envisioning better communications with client agencies and improved fare collection and management, Tim decided to take a more rigorous look at ECRT’s business processes. From what he had learned from the Internet and other Transit ITS technology resources, it appeared that greater improvements could be made than he originally thought.
Analyze Current Business Processes Tim and his administrative staff decided that before they engaged in a time-consuming assessment of their business processes, they should check their performance against that of other rural transit systems. From the state DOT and CTAA, they were able to obtain measures of operating performance from other rural transit systems to benchmark against their own.
First, they determined the types of quantitative information that was available on their system and other rural transit systems. As a result, they decided to base the comparison on the following measures:
They found that ECRT’s costs were generally higher, more expensive, than those of most systems of similar size and environment, especially when wage rates were equalized. As a check, they compared their performance in billing, purchasing, and booking using labor hours instead of dollar cost. The comparisons were similar.
As a result of the benchmarking, Tim and his staff decided to take a more detailed look at their business processes comprised of accounting, billing, reporting, personnel records management, purchasing, booking, and dispatching. They charted each process carefully and estimated average performance times for each task in labor hours per document processed. As soon as they began charting, before assigning performance times, they realized that some of their processes contained a great deal of unnecessary or poorly organized tasks.
Based on implementing this three-step process, Tim and his staff redesigned or eliminated tasks within the accounting, billing, and purchasing processes. While improvements were made with the redesign, they are now considering new off-the-shelf software (OTS) for these processes as well as for personnel management.
• administrative cost per passenger
• administrative cost per passenger-mile
• administrative cost per vehicle-mile
• billing cost per invoice
• purchasing cost per purchase
• administrative cost per employee
• booking process costs per booking
• dispatching cost per vehicle-trip (route-based service)
• dispatching cost per person-trip (demand-based service)
Analyze Current Business Processes
• Benchmark your system’s performance against other comparable systems.
• Identify business processes in need of improvement.
• Chart Processes.
• Identify redundancies and inefficiencies.
• Redesign processes.

IDENTIFYING THE TECHNOLOGIES AVAILABLE TO ADDRESS THE NEEDS 3 Once the needs of a system are identified, the next step is becoming aware of and understanding the available Transit ITS technologies and applications. It is important to recognize that not all of the applications presently available will be applicable to all transit systems. As described in the previous section, each system manager must be aware of the needs of his or her system to determine the best technical solution. At this stage, he or she must have access to sufficient knowledge and understanding of ITS applications to be able to determine which ones are appropriate for his or her system.
3.1 What Can Transit ITS Technologies Do? The most important facts about the new computer-based tools are just what functions they perform. The following list shows the major Transit ITS technologies grouped by function:4
• Accounting Software Electronically processes, stores, tracks, and reports standard accounting data.
• Automatic Passenger Counters Collect data on passenger boarding and alighting by time and location. This information can be used to increase the overall operating efficiency through better service planning.
• Automatic Vehicle Location Systems (AVL) Measure real-time positions of vehicles using onboard computers and a positioning system (such as global positioning system, signpost, or dead reckoning) and relay the information to a central location.
13
• Develop a relationship with local educational institutions.
• Educate yourself about ITS through training.
• Know your stakeholders and look at the possibilities.
• Work with and learn from your State and County governments.
• Apply for grants.
BestBest Practices in Rural Transit ITS identifies and elaborates upon the following ways to learn about Transit ITS:
• Read literature.
• Attend conferences.
• Visit other transit systems.
• Work with other systems.
Not all of the applications presently available will be applicable to all transit systems.
5National Research Council, Washington D.C. December, 2000 (Draft) Transportation Research Board. Transit Cooperative Research Program (TCRP) Project B-17 Report: Selecting Appropriate Technology Systems - A Guidebook. Washington DC: National Research Council, 2000 (Draft), Tables 2.0, pp. 18-19.
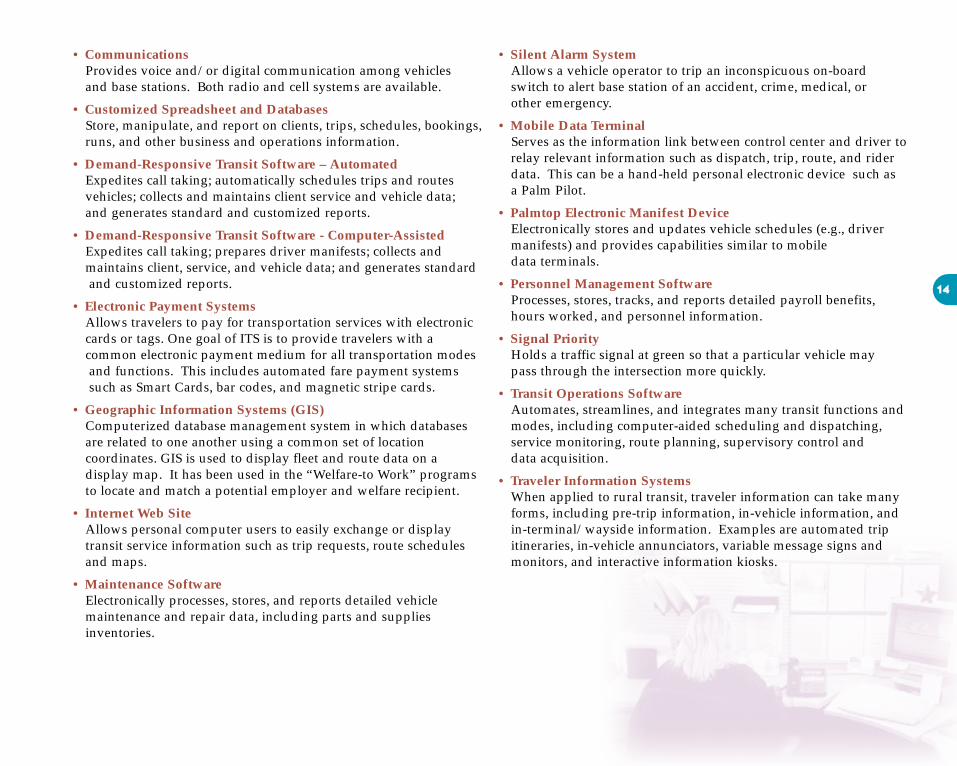
• Communications Provides voice and/or digital communication among vehicles and base stations. Both radio and cell systems are available.
• Customized Spreadsheet and Databases Store, manipulate, and report on clients, trips, schedules, bookings, runs, and other business and operations information.
• Demand-Responsive Transit Software – Automated Expedites call taking; automatically schedules trips and routes vehicles; collects and maintains client service and vehicle data; and generates standard and customized reports.
• Demand-Responsive Transit Software - Computer-Assisted Expedites call taking; prepares driver manifests; collects and maintains client, service, and vehicle data; and generates standard and customized reports.
• Electronic Payment Systems Allows travelers to pay for transportation services with electronic cards or tags. One goal of ITS is to provide travelers with a common electronic payment medium for all transportation modes and functions. This includes automated fare payment systems such as Smart Cards, bar codes, and magnetic stripe cards.
• Geographic Information Systems (GIS) Computerized database management system in which databases are related to one another using a common set of location coordinates. GIS is used to display fleet and route data on a display map. It has been used in the “Welfare-to Work” programs to locate and match a potential employer and welfare recipient.
• Internet Web Site Allows personal computer users to easily exchange or display transit service information such as trip requests, route schedules and maps.
• Maintenance Software Electronically processes, stores, and reports detailed vehicle maintenance and repair data, including parts and supplies inventories.
• Silent Alarm System Allows a vehicle operator to trip an inconspicuous on-board switch to alert base station of an accident, crime, medical, or other emergency.
• Mobile Data Terminal Serves as the information link between control center and driver to relay relevant information such as dispatch, trip, route, and rider data. This can be a hand-held personal electronic device such as a Palm Pilot.
• Palmtop Electronic Manifest Device Electronically stores and updates vehicle schedules (e.g., driver manifests) and provides capabilities similar to mobile data terminals.
• Personnel Management Software Processes, stores, tracks, and reports detailed payroll benefits, hours worked, and personnel information.
• Signal Priority Holds a traffic signal at green so that a particular vehicle may pass through the intersection more quickly.
• Transit Operations Software Automates, streamlines, and integrates many transit functions and modes, including computer-aided scheduling and dispatching, service monitoring, route planning, supervisory control and data acquisition.
• Traveler Information Systems When applied to rural transit, traveler information can take many forms, including pre-trip information, in-vehicle information, and in-terminal/wayside information. Examples are automated trip itineraries, in-vehicle annunciators, variable message signs and monitors, and interactive information kiosks.
14

The transit manager should understand the function of each technology on the preceding list. Visits to other transit systems with Transit ITS applications in operation can be highly enlightening. Perhaps most important is to see where each technology fits within the business processes, maintenance, or transportation operations of a transit system.
The answers to the following four questions essentially define the function of each technology:
• What data goes into it?
• What does it do with or to the data?
• What information does it provide?
• How is the information provided useful?
Once the manager can answer these questions, he or she can determine the implications of this array of technologies to his or her system.
15
Searching out those implications is the subject of the next section.
3.2 Sorting Out the Implications 3.2.1 Software and Hardware Each Transit ITS technology can be applied to meet one or more needs of a transit system. There are a number of suppliers of software for every tool. Some suppliers have ready-made, off-the-shelf (OTS) software. OTS software can usually be purchased and readily installed by people familiar with computers. Other tools for a particular system or particular group of systems must be built on a custom basis by software developers.
At this stage, the system manager should know the rough cost of purchasing, installing, activating, maintaining, and upgrading new software or hardware. He or she can then compare this cost to available resources to determine whether or not it is affordable. If it is not, he or she should probably set it aside as an option or he or she should search for additional resources to make its acquisition possible.
Before making a choice of either OTS or the custom software, it is essential to understand the implications that it will have for your system. In order for the new software to operate properly and produce its promised benefits, the transit system manager must be aware of the changes required in the entire system. These changes will encompass business processes, staff skills and training, job requirements, computers and related hardware, and all of the applicable costs, including maintenance contracts. The system manager should know the nature and magnitude of the expected benefits as well. At this point, the computer-literate individual who has all the capabilities described in the following section becomes important.
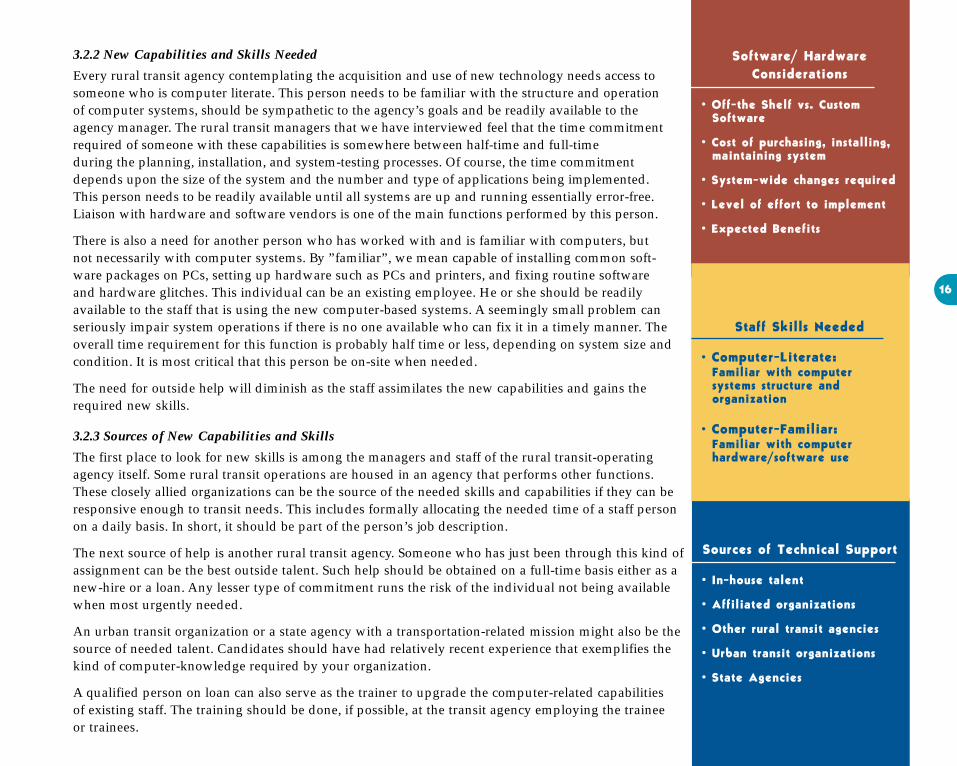
3.2.2 New Capabilities and Skills Needed
Every rural transit agency contemplating the acquisition and use of new technology needs access to someone who is computer literate. This person needs to be familiar with the structure and operation of computer systems, should be sympathetic to the agency’s goals and be readily available to the agency manager. The rural transit managers that we have interviewed feel that the time commitment required of someone with these capabilities is somewhere between half-time and full-time during the planning, installation, and system-testing processes. Of course, the time commitment depends upon the size of the system and the number and type of applications being implemented. This person needs to be readily available until all systems are up and running essentially error-free. Liaison with hardware and software vendors is one of the main functions performed by this person.
There is also a need for another person who has worked with and is familiar with computers, but not necessarily with computer systems. By ”familiar”, we mean capable of installing common software packages on PCs, setting up hardware such as PCs and printers, and fixing routine software and hardware glitches. This individual can be an existing employee. He or she should be readily available to the staff that is using the new computer-based systems. A seemingly small problem can seriously impair system operations if there is no one available who can fix it in a timely manner. The overall time requirement for this function is probably half time or less, depending on system size and condition. It is most critical that this person be on-site when needed.
Software/ Hardware Considerations
• Off-the Shelf vs. Custom Software
• Cost of purchasing, installing, maintaining system
• System-wide changes required
• Level of effort to implement
• Expected Benefits
The need for outside help will diminish as the staff assimilates the new capabilities and gains the required new skills.
3.2.3 Sources of New Capabilities and Skills
The first place to look for new skills is among the managers and staff of the rural transit-operating agency itself. Some rural transit operations are housed in an agency that performs other functions. These closely allied organizations can be the source of the needed skills and capabilities if they can be responsive enough to transit needs. This includes formally allocating the needed time of a staff person on a daily basis. In short, it should be part of the person’s job description.
The next source of help is another rural transit agency. Someone who has just been through this kind of assignment can be the best outside talent. Such help should be obtained on a full-time basis either as a new-hire or a loan. Any lesser type of commitment runs the risk of the individual not being available when most urgently needed.
An urban transit organization or a state agency with a transportation-related mission might also be the source of needed talent. Candidates should have had relatively recent experience that exemplifies the kind of computer-knowledge required by your organization.
A qualified person on loan can also serve as the trainer to upgrade the computer-related capabilities of existing staff. The training should be done, if possible, at the transit agency employing the trainee or trainees.
Staff Skills Needed
• Computer-Literate: Familiar with computer systems structure and organization
• Computer-Familiar: Familiar with computer hardware/software use
Sources of Technical Support
• In-house talent
• Affiliated organizations
• Other rural transit agencies
• Urban transit organizations
• State Agencies
16

It may also be possible for a transit manager to work closely with a qualified, computer-literate person currently employed at a trans-portation-related state agency to upgrade his or her knowledge. This should be done at the manager’s agency with some formal commitment of time on both sides. To work, the success of the effort has to be important to both individuals.
A determination of needed resources must be followed by efforts to obtain them within the allowable limits of affordability. The planning effort itself should not begin until resources, both financial and human, but especially the human, are secured.
The need for the system manager to have computer-literate expertise at his or her elbow to sort out the implications of the new technology for system operations cannot be overemphasized.
Consequently, Tim feels he needs some education about the
17 The manager needs to have rational and reasonable expectations of what affordable
computer-based technology can do for his or her organization.
3.3 One Manager’s Approach to Identifying the Available Technologies To illustrate the process for identifying available technologies, we continue with the experiences of our hypothetical Edgar County Rural Transit (ECRT) system and its manager, Tim Stark. While the location and individuals are fictitious, the situations represented in this example are based on the experience of several managers interviewed for this report.
Tim Stark, Manager of Edgar County Rural Transit (ECRT), has used a personal computer (PC) in his work for about 8 years. He has been using e-mail for over 2 years and occasionally surfs the web for news, weather forecasts, and information from various web sites including the FTA’s and the state DOT’s. In his prior job, he served on a committee overseeing the development and installation of a new database management system containing essential information on his agency’s clients. Tim has never been responsible for a project involving conversion of a manual function to an automated computer operation. In short, he is a user of computer systems, but has never been a systems developer to any significant extent.
computer-based tools that are potentially available to improve the operations of ECRT. A branch of the state university is located just 30 miles from the County Seat of Edgar County where his office is located. He called the Dean’s Office of the Business School and made an appointment to see the Associate Dean. The Dean reported that the Business School does have courses in business information systems, but he felt that Tim’s need was broader, deeper and more urgent than a single course could meet. He introduced Tim to Fred Posner, an Associate Professor in the School’s Computer Systems Department. In addition to his academic credentials, Fred was on the board of a community social service agency located near the university campus.
Tim and Fred went over both the list of needs that Tim and his staff had developed for ECRT, and the list of potential improvement tools that he had obtained from his contact at the state DOT. Tim and Fred agreed that finding the right solution or group of solutions was not an easy task. Tim asked Fred for ideas about the kind of assistance that he should get. Fred said that he would be glad to

advise Tim from time to time, but that he did not have the kind of time required. He recommended one of his brighter graduate students and a recent Master’s degree recipient who was in the process of making a career change.
The next day Tim contacted both people recommended by Fred. They were equally familiar with all of the applications on the tools list, at least in their basic forms. The recent graduate was looking for a full-time position, and Tim did not have the budget to support him for this purpose. The graduate student was available either to work as a part-time employee or to conduct the necessary research and analysis for credit at the university. Fred also considered hiring an individual on loan from another county transit agency in the state. This individual had recently participated in a Transit ITS development project there. In the end, Tim was able to obtain this individual on loan for the duration of the project.
Tim based his choice on several factors. The first was that the recent graduate, while quite competent, had fairly high salary expectations. Also, Tim was not sure just how the individual would fit into ECRT over the long term. Tim was concerned that the graduate student had too many obligations and might not be available when needed most. The experience, cost, availability, and longer-term disposition of the person from the other transit agency seemed to fit ECRT’s requirements. This individual, Mary Koppel, proved capable of filling in when needed in both operating and administrative capacities, in addition to carrying the ball on this project during her tenure at ECRT.
Mary had been Assistant Computer Systems Manager with the Calhoun County Vocational Rehabilitation Agency for five years when Calhoun County Rural Transit (CCRT) was created and put under its wing. That was about three years ago. Two years ago she went to CCRT to lead the upgrading of its systems. At that time, she became familiar with transit operations and administration, as well as with some of the applications on Tim’s tool list.
At ECRT, Mary worked directly for Tim. She arranged for each of them, at separate times, to work with the staffs at CCRT and at another county rural transit agency in the state. They learned about the data requirements, operations, outputs, and costs, both initial and ongoing, of each Transit ITS application on their list. They also learned of the difficulties that the other two counties had experienced in their Transit ITS efforts, as well as with various vendors. She also obtained publications that she had found helpful in the past as well as some more recent ones from the State DOT. She also visited the FTA, FHWA, APTA, TCRP, and CTAA web sites, among others, to obtain additional information. All this was accomplished in her first few weeks on the job.
In the meantime, Tim formed a Technology Task Force, made up of himself, Mary, and one individual from each part of the ECRT staff. Dispatchers, drivers, mechanics, and administrative staff were represented. The Task Force would serve to advise Tim and Mary during the ITS planning and implementation process. The Task Force along with Mary and Tim discussed the material that Mary had gathered in order to select the most appropriate new technologies to implement.
The Task Force also decided to ask Tim’s contacts on the County Board of Supervisors and at the state DOT, as well as Professor Fred Posner, to serve as advisors during the planning process. All three accepted. At Mary’s suggestion, Tim invited the Executive Director of the Northwest Regional Planning Agency, NWRPA, to provide a representative. The Executive Director selected the agency’s chief transportation planner to represent it on the Task Force.
They were now ready to begin the process of planning the implementation.
18

19
Learn from the experience of others. What tools and/or vendors have helped to achieve the desired results?

4 PLANNING THE IMPLEMENTATION
4.1 Key Considerations Having identified your transit system needs and the ITS technologies and applications available to address those needs, you can now decide what combination of Transit ITS applications is appropriate for your system.
There are several ways to evaluate and decide which application is the best match for a given need. Best Practices in Rural Transit ITS, the companion report to this guide, provides guidance from rural transit operators throughout the United States. The following suggestions are taken from that report. (The report contains more detail on each one.):
• Use local colleges or universities to • Understand what resources are get help and learn. available in your local area.
• Interview other transit systems. • Identify existing infrastructure that could be useful.
• Learn from urban transit systems. • Secure a project manager with the
• Learn from other, similar industries right expertise and capabilities. such as local trucking and package delivery firms. • Select a system that you can build on.
• Have a GIS specialist at hand before • Determine the level of finances allocated comparing alternative tools for your various activities such as or solutions. planning, purchase of equipment,
and training. • Be aware that Transit ITS is not a
stand-alone system. It must be integrated into transit system operations and business processes.
Considerations in Selecting Transit ITS Applications
• Availability of financial resources
• Identifying alternative solutions for each need
• Estimating impacts
• Making your choices
20

21
4.2 Availability of Financial Resources
Resource availability is often the key limiting factor for rural transit systems.
Any planning effort that does not start with identifying financial resources risks making its findings irrelevant. It is just as imprudent to underestimate your resources as to overestimate them. To err on the conservative side by ignoring sources of available funds, valuable knowledge and technical assistance, or potential alliance partners, limits the ability of a system to make highly beneficial technological improvements. On the other hand, setting your goals too high can lead to unnecessarily expensive planning efforts. It can produce expensive plans that cannot be implemented, in addition to widespread disappointment.
Funding for both the capital and operating expenses of rural transit systems is available at federal, state, and local levels. The critical factor with any transit-funding program is whether or not it covers expenditures on computer hardware and software, technology consultants, and training. When investigating new potential sources of funding, it is also important, of course, to determine the relevant requirements of each potential funding program. The eligibility of expenses may be limited, for example, by type, amount, or share.
Explore federal, state and local funding opportunities.
fundingFunding sources authorized by the Federal Transit Act are described below:
Section 5307 Section 5310 Authorizes grants to public transit systems in all Authorizes capital assistance to states for transportaurban areas. Funds authorized through Section 5307 tion programs that serve the elderly and people with are awarded to states to provide capital and operat- disabilities. States distribute Section 5310 funds to ing assistance to transit systems in urban areas with local operators in both rural and urban settings, who populations between 50,000 and 200,000. Transit are either nonprofit organizations or the lead systems in urban areas with populations greater agencies in coordinated transportation programs. than 200,000 receive their funds directly from FTA.
Section 5311 Section 5309 Authorizes capital and operating assistance grants to Authorizes discretionary grants to public transit public transit systems in rural areas with populations agencies for capital projects such as buses, bus of less than 50,000. facilities and rail projects.

In addition, FTA’s Rural Transit Assistance Program (RTAP) offers training materials, technical assistance and other support services for rural transit systems across the country. RTAP funds help to support the National Transit Resource Center.
Federal resources also include health management and social service agencies that offer various programs requiring transportation. The departments and sub-departmental agencies most likely to have such programs include the following:
• Department of Agriculture
• Department of Education
• Department of Health and Human Services
• Department of Housing and Urban Development
• Department of Labor
• Department of Veterans Affairs
• Administration on Developmental Disabilities
• Administration for Native Americans
• Head Start Bureau
• Office of Community Services
The U.S. Department of Agriculture also has funds available for rural transportation assistance through state Departments of Agriculture.
The accompanying Transit ITS Resources lists federal agencies with assistance programs for rural clientele that purchase transportation for
22
their clients from rural public transit agencies. The CTAA web site, (www.ctaa.org), maintains an up-to-date list of these contacts. These federal sources and their state counterparts are also listed in Transit ITS Resources.
Another key point is to investigate the possibility of sharing costs with other organizations. The basis for sharing costs is the common use of facilities or services. Some rural transit operators in Minnesota are sharing communications facilities and AVL systems with Minnesota highway maintenance forces and the Minnesota State Police.
Our field investigations revealed that a number of different funding sources are being used around the country. For example, the Dakota County United Way in the West St. Paul, MN area funnels private contributions into rural transit. The use of in-kind services by the grantee of up to 20% of the cost is frequently seen. Section 5311 funds coming from FTA through the state DOTs are common. State and local tax funds also go to support rural transit in many states.
Consult Transit ITS Resources for federal and state funding sources.his or her organization.
23
For rural transit operators that provide subscription transportation services to clients of federal, state, or local social service agencies, it may be possible to share the costs of installing computer and Internet-based systems that lower the cost or improve the efficiency of billing and payment.
Some legwork or telephone work is necessary to identify what funds are available, and when they are distributed, for the purpose of acquiring Transit ITS capabilities. In many states the most useful initial contact for questions on fund availability is the transit assistance office of the state DOT. In the absence of such an office, a good starting point may be to contact your Regional FTA Office.
Once sources of funds are identified, determine:
• The level and timing of funding available to your system for Transit ITS system development.
• The requirements for plans and other information in order to qualify for the various sources of funding.
You must, of course, know the availability of funds in order to choose new applications of Transit ITS technology that meet the needs of your transit system.
5TCRP Project B-17, op. cit., Tables 2.1 through 2.12, pp. 20-31. 6Ibid.
4.3 Identifying Alternative Solutions for Each Need Table 1 shows alternative solutions from the list for each of twelve generic transit system needs.5 There are several solutions for each generic need, because the actual needs of different transit systems can vary substantially. Transit systems vary by not only size, but organization, nature of their clientele, load factors, distances over which they operate, type of terrain in which they operate, and climate in which they operate, to name a few. A more extensive version of Table 1 can be found in the Transit ITS Guidebook recently produced by the Transit Cooperative Research Program.6
The column headed “Applications” shows the presumed relevance of the solution to the stated need. You can develop your solution, or set of solutions, for each of the needs that you identify. Table 1 shows one way to organize this information that will facilitate finding the preferred solution.
It appears that the choice can be made just by inspection of the information shown in Table 1. In most instances it is possible to eliminate several alternatives for each need just by inspection. In fact, it is not necessary to even consider all those shown in Table 1. Not every alternative applies to each rural transit system. However, more information on the consequences of a choice, such as cost, required skills, and some measure of benefit, can make the final choice more apparent by comparison of the remaining alternatives.
Explore the possibility of cost sharing with other organizations

Table 1: Needs and Alternative Solutions APPLICATIONS
NEEDS
Acc
ount
ing
Soft
war
e
Aut
omat
ic P
asse
nger
Cou
nter
s
Aut
omat
ic V
ehic
le L
ocat
ion
Syst
ems
(AV
L)
Com
mun
icat
ions
Cus
tom
ized
Spr
ead
shee
t an
d D
atab
ases
Dem
and
-Res
pons
ive
Tran
sit
Soft
war
e-A
utom
ated
Dem
and
-Res
pons
ive
Tran
sit
Soft
war
e- C
ompu
ter
Ass
iste
d
Ele
ctro
nic
Paym
ent S
yste
ms
Geo
grap
hic
Info
rmat
ion
Syst
ems
(GIS
)
Inte
rnet
web
site
Mai
nten
ance
Sof
twar
e
Sile
nt A
larm
Sys
tem
Mob
ile D
ata
Term
inal
Palm
top
Ele
ctro
nic
Man
ifes
t Dev
ice
Pers
onne
l Man
agem
ent
Soft
war
e
More Accurate, Easier Reporting and Record Keeping
X X X X
More Efficient Service Coordination X X X X X X X X
Safer, More, Accurate Cash Handling X X X
Improved Operations, Staff Performance, and Productivity X X X X X X X
More Effective Maintenance Tracking X X X
Clearer Communications X X X X
More Effective Dispatching X X X X X X X
Faster, More Efficient Trip Request Processing X X X X
Improved Scheduling Productivity X X X X X X
Improved Service Quality X X X X X X
Greater Safety X X X X X
More Accessible, More Useful Customer Information X X X X X X
24

25
4.4 Estimating Impacts Estimating the impacts, or consequences, of possible choices greatly eases the task of deciding what to do. Up front, you can decide which set of consequences is most important to your choice. We suggest a few of them here.7
Table 2 illustrates some of the impacts that may be important to rural transit systems. The set that you select should bear some direct relation to the goal you set for the Transit ITS applications that you are comparing and choosing. If your goal is to increase the effectiveness and the efficiency of your rural transit system, the impacts that you select should measure effectiveness and efficiency of the application in question.
TABLE 2: Impacts of Transit ITS Applications
COSTS BENEFITS
Purchase Price Capacity Maintenance Reliability Operating Recoverability*
Staff Training Increased performance
* Recoverability is the relative accessibility of information after it has been obtained and stored.
4.4.1 Costs
Cost impacts measure the expenses that must be incurred to obtain the benefits of the Transit ITS application that you are assessing. The costs included here are Capital, Maintenance, and Operating.
Capital Costs includes the initial purchasing price of the software or hardware involved and the cost to get them up and running, the so-called installation costs. Purchase price covers what it costs to obtain the computer software, whether it is OTS or must be developed by a software firm especially for your transit system. Purchase price also includes the cost of any new hardware you might need for the option you are costing, from general-purpose personal computers to Smart Card readers or mobile data terminals. Be sure to include the installation costs for all hardware and software.
Maintenance costs include just what you estimate it will cost to keep the new software and hardware up and running. If any bugs turn up in the software, what will it cost you to get it fixed? If a personal computer, mobile data terminal or card reader needs to be repaired, what will it cost? These costs can vary greatly among alternative pieces of software or hardware that do essentially the same job. The less experience there has been with any given piece of software or hardware, the more difficult it is to get a reliable estimate of these costs. The best sources of maintenance cost estimates are people who have been using the item in question for at least several months in essentially the same environment as you intend to use it. There are user groups, both formal and informal, that can provide good maintenance cost estimates. Your contacts at CTAA or the state DOT or FTA can put you in touch with some of them. Vendor estimates are not always reliable, because the information that they have may be for an entirely different environment than yours. Also, the product they offer may be too new to have an adequate maintenance history. Great care is needed to get reliable estimates of electronic hardware and software maintenance costs.
7Further information on the benefits of ITS applications is contained in the FTA publication, Benefits Assessment of Advanced Public Transportation System Technologies– Update 2000, listed in the Bibliography in Appendix C.

Operating costs includes Staff training as its the primary component. The level of complexity varies among different versions of computer hardware and software. Consequently, the cost of making staff members competent users of new systems, and keeping them that way, also varies. Both staff turnover and the release of new versions of the software, and sometimes of the hardware, add to this cost. It is important to recognize this cost and to account for it. The cost of staff training reflects the relative user-friendliness of the different systems. The training cost should include both classroom and on-the-job (OJT) training. Once again, the most reliable source of this information is another rural transit system that has a significant amount of experience with the software or hardware involved. Additional components of Operating Costs may include differences in electricity use from the local electrical utility or from increased consumption of batteries.
4.4.2 Benefits
Benefits are defined here as the improvements in system performance with new hardware or software in place compared to performance without that software or hardware.
Benefits can be described in terms of Capacity, Recoverability is an important benefit of Transit ITS applications. Reliability or Recoverability. Information kept on paper is subject to misplacement or loss and
can be difficult to find at times. It is also cumbersome to obtain Capacity refers primarily to the amount of work that can be done needed data from paper files for data analysis. Electronic data in a given amount of time or the time it takes to do a particular systems increase the accessibility, availability, and, therefore, the amount of work. For example, an Automatic Vehicle Location
recoverability of data and information. It directly impacts the (AVL) system might increase the capacity of the dispatcher to efficiency and effectiveness of transit system operation. schedule pick-ups from fifteen to twenty per hour. In this instance, the average time to schedule a pick-up goes from four minutes to The estimation and comparison of the impacts of each option is three. The use of AVL might also increase the average number of very important when choosing Transit ITS applications. The next pick-ups per vehicle-hour from twelve to fifteen. section covers the use of impact estimates to make choices.
Reliability is the benefit achieved through the reduction of errors. Automatic passenger counters typically reduce errors in counting. Errors per 100 passengers could go from ten to less than one, for example. Smart Cards reduce billing errors substantially. New accounting software together with customized spreadsheets and databases greatly increase the reliability of the data stored and developed. Transit system operations efficiency increases through improved reliability of the information that these applications provide.
26
27
4.5 Making Your Selection 4.5.1 Focus on Your Goal Whatever you have determined your goal to be, your choice of Transit ITS application(s) should make the best possible contribution to achieving it, subject to financial and other operating constraints. This may not be as easy as it sounds if your goal has more than one dimension to it. For example, your goal for Transit ITS may be to increase the effectiveness and the efficiency of your system. These two separate dimensions, effectiveness and efficiency, may require making a trade-off between two Transit ITS options. One option may provide the most additional effectiveness to the system and the other, the greatest increase in efficiency. Some form of compromise between effectiveness and efficiency, as they would accrue to the choice of one or the other option, must be made.
Focusing on a goal also requires that you determine how the impacts that you estimate will contribute to the achievement of that goal. It disciplines the comparison process and requires a causal chain between the impacts and the goal. You can also show the degree to which a certain level of a given impact contributes to the goal. For example, if you can apply monetary values to all the benefits and costs on a common time scale, you can obtain a monetary estimate of the degree to which the various alternatives contribute to the goal.8
Perhaps it is most important to be able to reason plausibly that your measurement of the impacts of alternative Transit ITS applications indicates which one best contributes to your goal. The staff and governing body of your system, as well as yourself, need to be convinced. Not every impact or reason needs to be “monetized”. You merely need to be able to distinguish between the two alternatives relative to their net contributions to your goal. Some of the training courses at NTI and in the FTA-FHWA Professional Capacity Building (PCB) Program teach students how to conduct these analyses.9
4.5.2 Examine Your Priority of Needs As you proceed, you need to ask yourself if the priority of needs that you developed before looking at the Transit ITS applications in depth is still valid. Are the needs ranked in some sort of a priority consideration of the relative contribution to meeting your goal with the new applications? If not, you may want to consider re-ranking them in terms of the estimated impacts of those applications under consideration at this stage.
Now, you should have an idea of the funding that you have available. As you estimate the impacts of the alternative ways of meeting the needs, you will be able to estimate the costs of meeting each successive need. Comparing available funding with expected costs will enable you to determine just how many of the needs you can meet now and in the future. Those needs that cannot be met will have to wait for further funding.
At the end of this step, you will have estimated the impacts of all the reasonable alternatives for meeting each need within the expected level of funding. Then, you are ready to make the comparisons and choose the preferred alternative for meeting each need that you can fund.
8Much thought has been given to applying benefit-cost analysis to choosing between alternative investments, particularly in the public sector. A large body of literature exists on the subject. One fairly succinct but rigorous coverage of the principles and fundamentals of benefit-cost analysis is given in the following book: Lee G. Anderson and Russell F. Settle: Benefit-Cost Analysis: A Practical Guide, Lexington Books, Washington DC: Heath and Company, Lexington, MA, 1977. 9One example is the NTI course entitled, “ITS for Transit: Solving Real Problems.”

4.5.3 Compare the Preferred Alternatives Beginning with the highest priority need, you now have the necessary information to choose among the two or more alternative ways of meeting it. Of course, if you are sure that there is only one way, then no comparison of alternatives is required. However, this is rarely the case. Not only are there different applications, there are also different vendors for the same application. Each vendor’s solution varies to some degree from the others, in aspects such as functionality, cost, or time to deliver and install.
Our goal is to improve our quality of service and the efficiency of our operations. We have selected electronic payment systems as the Transit ITS solution to meet our need. The analysis includes some of the impacts that may be important to rural transit systems as outlined in Table 2, page 25. For the purpose of this illustration, we will use both the incremental benefit-cost and net present value methods to make the comparison. Our example system includes a fleet of 20 vehicles and a 20-person staff. Table 3 illustrates a comparison of alternatives.
Table 3: Sample Comparison of Alternative Ways to Meet a Priority Need
Electronic Payment Systems
Costs Purchase Price Maintenance TrainingTotal
IMPACTS
$ 34,000 $ 34,000 $ 50,000 9,500 11,400 15,000
+ 30,000 + 26,100 + 35,000 $ 73,500 $ 71,500 $ 100,000
ALTERNATIVES A B C
A/B>C A>B>C B>A>C B>A>C
RANKINGS
Benefits Capacity $ 124,000 $ 124,000 $ 190,000 C>A/B Reliability 53,000 53,000 80,000 C>A/B Recoverability + 17,000 + 17,000 + 30,000 C>A/B Total $ 194,000 $ 194,000 $ 300,000 C>A/B
Benefit/Cost (B/C) 2.64 2.71 3 C>B>A Incremental B/C (B>A) 0 3.72 C>B>A
Ranking 3 2 1
PV Benefit PV Cost PV Net Benefit
$ 194,000 $ 194,000 $ 300,000 - 73,500 - 71,500 - 100,000 $ 120,500 $ 122,500 $ 200,000 C>B>A
Ranking 3 2 1
28
Interpreting Table 3
The “> “ symbol can be translated in this chart as “is preferred to.” “/ ” means “is equivalent to.”
The development of the comparison is explained on the following pages. To make it easier to understand, we have put the steps of development in bullet form.
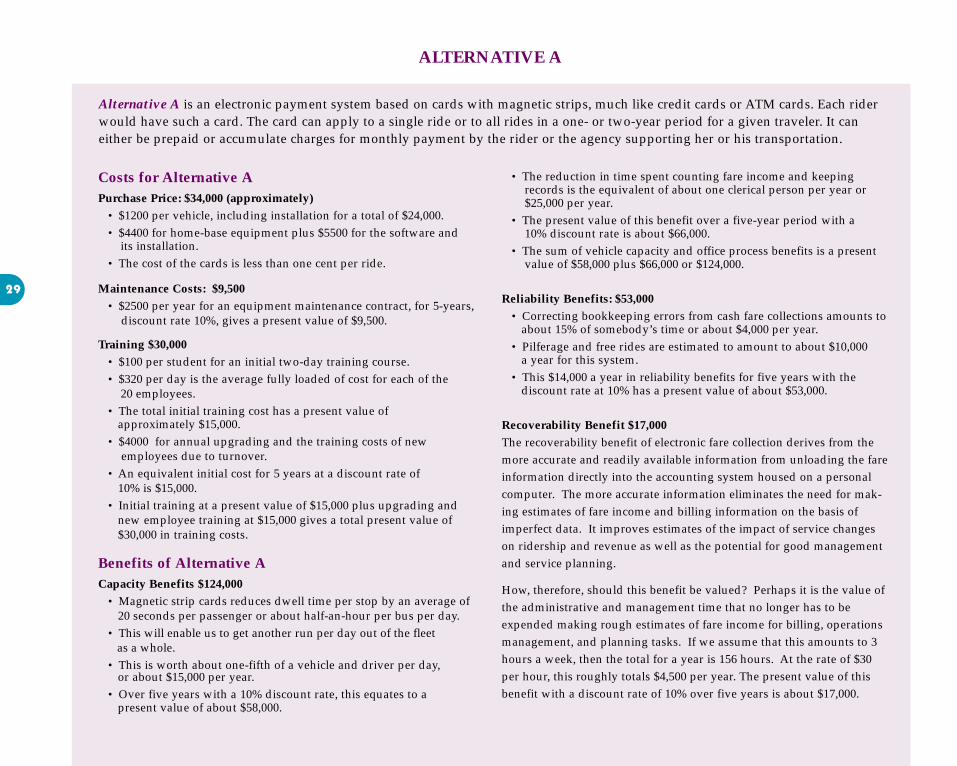
ALTERNATIVE A
Alternative A is an electronic payment system based on cards with magnetic strips, much like credit cards or ATM cards. Each rider would have such a card. The card can apply to a single ride or to all rides in a one- or two-year period for a given traveler. It can either be prepaid or accumulate charges for monthly payment by the rider or the agency supporting her or his transportation.
Costs for Alternative A Purchase Price: $34,000 (approximately)
• $1200 per vehicle, including installation for a total of $24,000. • $4400 for home-base equipment plus $5500 for the software and
its installation. • The cost of the cards is less than one cent per ride.
Maintenance Costs: $9,500 29 • $2500 per year for an equipment maintenance contract, for 5-years,
discount rate 10%, gives a present value of $9,500.
Training $30,000 • $100 per student for an initial two-day training course. • $320 per day is the average fully loaded of cost for each of the
20 employees. • The total initial training cost has a present value of
approximately $15,000. • $4000 for annual upgrading and the training costs of new
employees due to turnover. • An equivalent initial cost for 5 years at a discount rate of
10% is $15,000. • Initial training at a present value of $15,000 plus upgrading and
new employee training at $15,000 gives a total present value of $30,000 in training costs.
Benefits of Alternative A Capacity Benefits $124,000
• Magnetic strip cards reduces dwell time per stop by an average of 20 seconds per passenger or about half-an-hour per bus per day.
• This will enable us to get another run per day out of the fleet as a whole.
• This is worth about one-fifth of a vehicle and driver per day, or about $15,000 per year.
• Over five years with a 10% discount rate, this equates to a present value of about $58,000.
• The reduction in time spent counting fare income and keeping records is the equivalent of about one clerical person per year or $25,000 per year.
• The present value of this benefit over a five-year period with a 10% discount rate is about $66,000.
• The sum of vehicle capacity and office process benefits is a present value of $58,000 plus $66,000 or $124,000.
Reliability Benefits: $53,000 • Correcting bookkeeping errors from cash fare collections amounts to
about 15% of somebody’s time or about $4,000 per year. • Pilferage and free rides are estimated to amount to about $10,000
a year for this system. • This $14,000 a year in reliability benefits for five years with the
discount rate at 10% has a present value of about $53,000.
Recoverability Benefit $17,000 The recoverability benefit of electronic fare collection derives from the more accurate and readily available information from unloading the fare information directly into the accounting system housed on a personal computer. The more accurate information eliminates the need for making estimates of fare income and billing information on the basis of imperfect data. It improves estimates of the impact of service changes on ridership and revenue as well as the potential for good management and service planning.
How, therefore, should this benefit be valued? Perhaps it is the value of the administrative and management time that no longer has to be expended making rough estimates of fare income for billing, operations management, and planning tasks. If we assume that this amounts to 3 hours a week, then the total for a year is 156 hours. At the rate of $30 per hour, this roughly totals $4,500 per year. The present value of this benefit with a discount rate of 10% over five years is about $17,000.

We can now estimate the values of the costs and benefits of Alternatives B and C by comparing them with Alternative A.
ALTERNATIVE B ALTERNATIVE C
Alternative B is also electronic payment system based on the magnetic strip card. Its operation is essentially the same as Alternative A. However, the classroom training is free and the maintenance requirements are somewhat more complex.
Costs for Alternative B Purchase Price $34,000
• The purchase price of Alternative B is equal to Alternative A
Maintenance $11, 400 • Alternative B magnetic strip system is a bit more complex than
that of Alternative A. This results in a somewhat higher maintenance cost for Alternative B. The annual maintenance contract is $3,000, for a present value of approximately $11,400.
Training Reduced by $3,900 • The classroom training is free, which results in a reduction in
training cost of $2,400 in the first year and $400 per year thereafter (with a present value of $1,500). The total present value of these reductions is $2,400 plus $1,500, or $3,900, for a net training cost of $26,100.
Benefits of Alternative B The benefits of Alternative B are virtually equal to those for Alternative A.
Alternative C is an electronic payment system based on Smart Card Technology.
Costs of Alternative C Purchase Price $50,000
• The purchase price is higher than that for Alternative A or Alternative B.
Maintenance $15,000
Training $35,000 • The training costs are only slightly higher, primarily for the
administrative staff because of the additional capabilities of Smart Cards.
Benefits of Alternative C The benefits extend to the customer, particularly the agencies that subscribe to transportation for their clients. As a result they are a bit more difficult to quantify.
Capacity Benefits $190,000 • Required work is reduced by an additional clerk per year.
Half is estimated to come out of the Transit system administrative staff and the other half out of client staff.
• The capacity benefits reduce the required work by an additional clerk per year. Half is estimated to come out of the transit system administrative staff and the other half out of client staff. This additional gain has a present value of $66,000. Added to the gain for Alternatives A and B of $124,000, the capacity benefit for Alternative C equals $190,000.
The benefits of both reliability and recoverability increase also, because of the additional types of data they cover and because of the direct billing capability provided by Smart Card technology. The monetary values of these benefits are:
Reliability Benefits $80,000
Recoverability Benefit $30,000
30

31
4.5.4 Making Your Choice Which of the alternatives would best contribute to the goal of improving customer service and efficiency?
Looking at the Costs Rankings of Table 3, we note that:
• Purchase prices of Alternative A and B are identical and significantly less expensive than Alternative C.
• Maintenance cost for A is less than B, and both are significantly less than C.
• Training cost of B is less than A, and both are again significantly less than C.
• Total costs of A and B are equal and are significantly less than C.
Checking the ranking of benefits, we find C consistently higher than and preferred to A or B, which are ranked as equivalent.
The question is, does C best meet the goal? It clearly has both the greatest costs and the greatest benefits. It appears to give the greatest improvement in service to the customer. Now, does it do the best job of increasing the efficiency of operations? From the nature of the benefits, it appears that is the case. But we need to make sure that those benefits offset the increases in cost. From B to A, the costs go up by $2,000, but the benefits stay the same. Consequently, we get more net gain from B than A. When we move from B to C, we find that the benefits increase substantially more than the costs. Consequently, the additional cost is more than justified, and C is preferred to B. It is the best of the three alternatives. The row in Table 3 labeled, “Incremental B/C,” shows the benefit–to-cost ratios of each of those incremental moves, B to A and B to C.
Since we also have the benefits and costs of the three alternatives on the same time basis, in terms of their present value or “PV”, we can compare the alternatives on the basis of the present value of their net benefits. The row near the bottom of Table 3 marked “PV Net Benefit” shows the present value of the net benefits, “PV Benefit,” for each alternative. This value is obtained by subtracting the present value of the costs of the alternative, “PV Cost,” from the present value of its benefits, “PV Benefit.” It is clear that alternative C has the greatest net benefit followed by B, then C. This corresponds with the ranking using the incremental Benefit-Cost ratio.
For illustrative purposes, this numerical example employs benefit-cost and net benefit comparisons to decide which alternative best meets the overall goal of improving fare management in our example rural transit system. Different kinds of information can be used for choosing the best way to meet various needs of rural transit system. Many choices can be made without the kind of calculations we used in the example. 10
We now turn to our composite case study of the hypothetical Edgar County Rural Transit (ECRT) and its manager, Tim Stark, to illustrate how transit managers around the country are making choices about how to meet the needs of their system with the resources they have.
10A compact disk produced by the Western Transportation Institute is available. It contains adaptable presentations on several aspects of Rural ITS, including Transit Management. See web site: www.its.dot.gov for ordering information. A compact disk produced by the Western Transportation Institute is available. It contains adaptable presentations on several aspects of Rural ITS, including Transit Management. See website: www.its.dot.gov for ordering information.
Regardless of your quantitative analysis, you must be able to convince yourself, your staff, your governing Board, and your customers that you have chosen the best alternative.
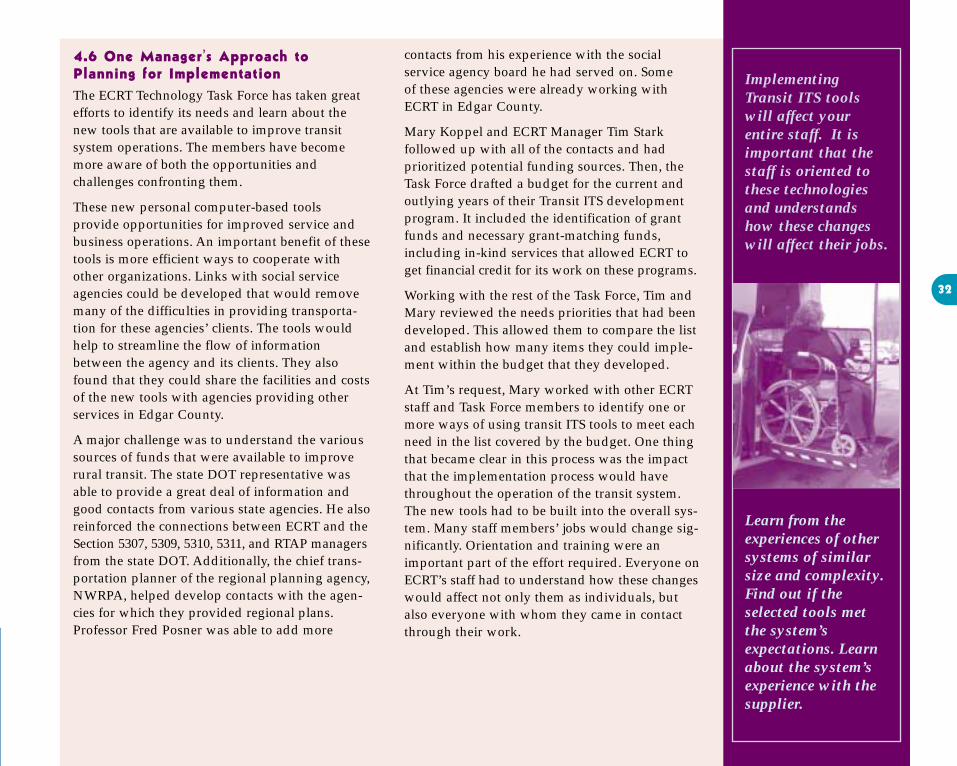
4.6 One Manager’s Approach to Planning for Implementation The ECRT Technology Task Force has taken great efforts to identify its needs and learn about the new tools that are available to improve transit system operations. The members have become more aware of both the opportunities and challenges confronting them.
These new personal computer-based tools provide opportunities for improved service and business operations. An important benefit of these tools is more efficient ways to cooperate with other organizations. Links with social service agencies could be developed that would remove many of the difficulties in providing transportation for these agencies’ clients. The tools would help to streamline the flow of information between the agency and its clients. They also found that they could share the facilities and costs of the new tools with agencies providing other services in Edgar County.
A major challenge was to understand the various sources of funds that were available to improve rural transit. The state DOT representative was able to provide a great deal of information and good contacts from various state agencies. He also reinforced the connections between ECRT and the Section 5307, 5309, 5310, 5311, and RTAP managers from the state DOT. Additionally, the chief transportation planner of the regional planning agency, NWRPA, helped develop contacts with the agencies for which they provided regional plans. Professor Fred Posner was able to add more
contacts from his experience with the social service agency board he had served on. Some of these agencies were already working with ECRT in Edgar County.
Mary Koppel and ECRT Manager Tim Stark followed up with all of the contacts and had prioritized potential funding sources. Then, the Task Force drafted a budget for the current and outlying years of their Transit ITS development program. It included the identification of grant funds and necessary grant-matching funds, including in-kind services that allowed ECRT to get financial credit for its work on these programs.
Working with the rest of the Task Force, Tim and Mary reviewed the needs priorities that had been developed. This allowed them to compare the list and establish how many items they could implement within the budget that they developed.
At Tim’s request, Mary worked with other ECRT staff and Task Force members to identify one or more ways of using transit ITS tools to meet each need in the list covered by the budget. One thing that became clear in this process was the impact that the implementation process would have throughout the operation of the transit system. The new tools had to be built into the overall system. Many staff members’ jobs would change significantly. Orientation and training were an important part of the effort required. Everyone on ECRT’s staff had to understand how these changes would affect not only them as individuals, but also everyone with whom they came in contact through their work.
32
Implementing Transit ITS tools will affect your entire staff. It is important that the staff is oriented to these technologies and understands how these changes will affect their jobs.
Learn from the experiences of other systems of similar size and complexity. Find out if the selected tools met the system’s expectations. Learn about the system’s experience with the supplier.

33
With the help of Fred and the graduate student that he had recommended earlier to Tim, Mary identified the impacts each alternative Transit ITS application would have on meeting the priority needs. For some needs and applications, the choice was almost a “nobrainer”, or in other words, very obvious. On the other hand, other needs and requirements called for more careful development and analysis. Mary took care to show how each choice supported the ECRT goal of improving both the quality of its service and the efficiency of operations.
Mary kept in mind that she wanted to avoid repetition of the near-disaster that had occurred at CCRT two years earlier. CCRT determined that they needed not only to book trips and dispatch vehicles more efficiently, but also to improve the billing and accounting system. The need for the latter set of capabilities, billing and accounting, was made urgent by the need to become Y2K-compliant. Time was running short. They found that another county in the state had engaged a software development firm to produce similar overall capabilities. The same source of funds was available to CCRT that was available to the other county to acquire the software and new hardware.
CCRT engaged the same software supplier to fulfill their needs. They purchased hardware that met the specifications of the software developer. When CCRT installed the software on the hardware, purchased from a hardware vendor, the application experienced some bugs. This was not an unusual occurrence in these situations. However, the booking and accounting operations inexplicably became very, very slow at times.
The developer was slow to take responsibility for this problem and to act upon it. The result was that CCRT had to spend a great deal of money for extra personnel and overtime to run the operation manually in order to keep the transit service going. CCRT finally was able to convince the state DOT, who provided the funding, to intervene.
It was found that the software developer had underestimated both the hardware and software requirements for the CCRT system. The under-specified system consequently worked very slowly when heavily loaded, which was often. The other county had a similar difficulty, but had caught it in time to avoid serious problems. The state DOT provided additional funds for the needed upgrade. Ultimately, the software vendor upgraded the software and fixed some of the other bugs. Now, after more than a year of problems and increased operating expenses, the CCRT system is running properly.
As Mary continued to identify and prioritize each alternative Transit ITS application for ECRT, GIS was included as one of the capabilities on the list for acquisition. It turned out that the NWRPA chief transportation planner, a member of the Technology Task Force, had in-depth experience with GIS. The planning agency had acquired the capability about ten years ago and found it highly valuable. He was able to show how GIS impacted the work of the planning agency and how it could benefit ECRT.
Once Mary had selected the tools she felt best supported ECRT’s goals, the Task Force carefully reviewed the array of choices and the analyses supporting them. Tim presented the choices to the County Board of Supervisors who subsequently approved them. Then, Tim asked Mary to coordinate the preparation of grant applications for the funds that they had identified. The NWRPA offered considerable assistance to this effort.
As part of this process, Tim had contacted several social service agencies serving Edgar County concerning their needs for public transit, particularly in the rural areas. He was able to work with the regional planning agency and their GIS specialist to identify some of the future needs with greater specificity than earlier.
After selecting a Transit ITS application, Tim began to prepare for evaluating the operation of the new technology that he expected to obtain over the next year or so. He wanted to be sure that he had adequate “before” information on system performance that he could use to conduct a good comparison with the “after” situation.
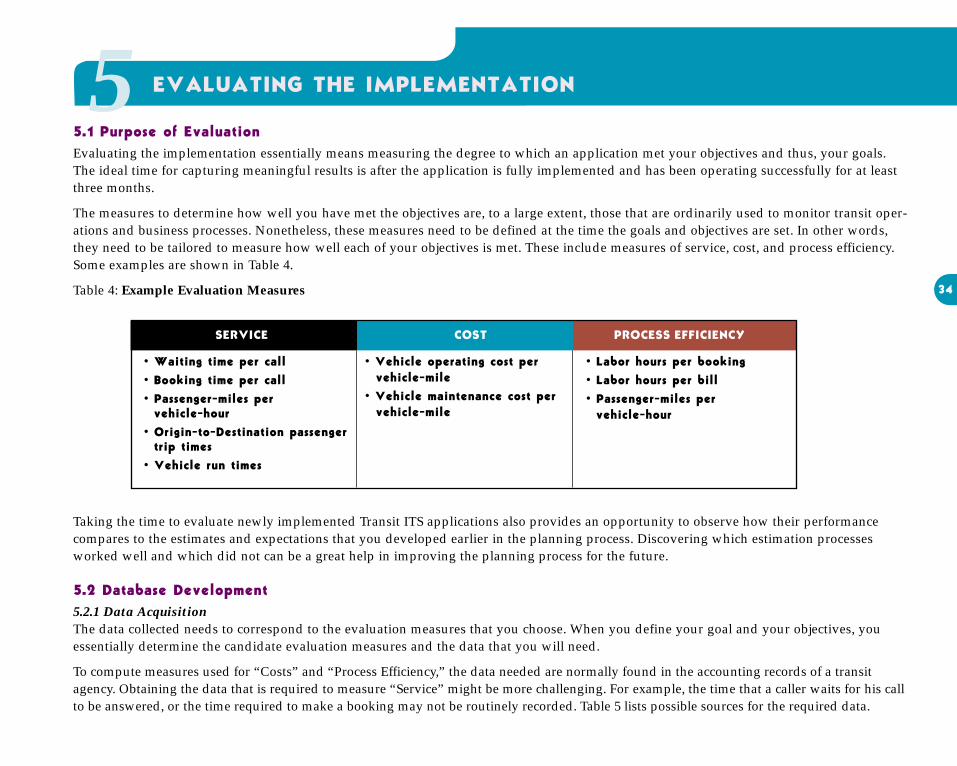
EVALUATING THE IMPLEMENTATION 5 5.1 Purpose of Evaluation Evaluating the implementation essentially means measuring the degree to which an application met your objectives and thus, your goals. The ideal time for capturing meaningful results is after the application is fully implemented and has been operating successfully for at least three months.
The measures to determine how well you have met the objectives are, to a large extent, those that are ordinarily used to monitor transit operations and business processes. Nonetheless, these measures need to be defined at the time the goals and objectives are set. In other words, they need to be tailored to measure how well each of your objectives is met. These include measures of service, cost, and process efficiency. Some examples are shown in Table 4.
Table 4: Example Evaluation Measures 34
• Waiting time per call • Booking time per call • Passenger-miles per
vehicle-hour • Origin-to-Destination passenger
trip times • Vehicle run times
• Vehicle operating cost per vehicle-mile
• Vehicle maintenance cost per vehicle-mile
• Labor hours per booking • Labor hours per bill • Passenger-miles per
vehicle-hour
SERVICE COST PROCESS EFFICIENCY
Taking the time to evaluate newly implemented Transit ITS applications also provides an opportunity to observe how their performance compares to the estimates and expectations that you developed earlier in the planning process. Discovering which estimation processes worked well and which did not can be a great help in improving the planning process for the future.
5.2 Database Development 5.2.1 Data Acquisition The data collected needs to correspond to the evaluation measures that you choose. When you define your goal and your objectives, you essentially determine the candidate evaluation measures and the data that you will need.
To compute measures used for “Costs” and “Process Efficiency,” the data needed are normally found in the accounting records of a transit agency. Obtaining the data that is required to measure “Service” might be more challenging. For example, the time that a caller waits for his call to be answered, or the time required to make a booking may not be routinely recorded. Table 5 lists possible sources for the required data.

Table 5: Data Sources
REQUIRED DATA ITEM SOURCE
35
Vehicle Operating Cost Driver wages, fuel cost, oil cost accounts Vehicle Miles Daily vehicle odometer readings Vehicle Maintenance Cost Mechanic wages/contract, parts accounts Booking agent and related clerk hours Time sheets Billing clerical and supervisory hours Time sheets Number of bookings Daily ride-booking record Number of bills by type and complexity Daily billing record Call waiting time Device or software from telephone company Booking time Same as call-waiting time or manually Number and length of calls Manual or automated call record Passenger miles Calculated from driver or billing records Vehicle hours Driver or vehicle records Origin-to-Destination passenger trip times Driver and/or dispatcher logs Vehicle run times Driver and/or dispatcher logs
5.2.2 Database Creation The first task of database development is to assure that all items of source data are available and kept up to date. It is also useful to create a separate file for each required data item. These files should be revised whenever constituent source items are updated. Some items should be stored within their respective files by date or by day-of-the-week. Others that vary significantly by time of day, such as call-waiting time and booking time, may need to be segregated into the peak and off-peak periods for each day. Still others may be recorded appropriately for intervals that are less frequent.
Some data items might be acquired on a sampled basis. A reason for doing so could be the difficulty or excessive cost of acquiring the data on a more frequent basis. For example, manually recorded booking times might fall into this category. Other items that can be sampled periodically include trip times for riders, run times for vehicles, and passenger counts at each bus stop.
The most important point is that the data present reliable estimates of whatever they purport to measure. This need for reliability applies to the measures of service, cost or process efficiency. The entire subject of statistics, as a tool or as an academic discipline, is devoted to obtaining reliable estimates. 11
Transit ITS and other computer software applications can result in potential increases in efficiency and reliability of data collection and information development. We use the term, potential, advisedly here, because the creation and the proper maintenance of such a database require considerable care and effort.
11See any basic statistics textbook or a chapter on statistics and performance measurement in a textbook on transportation management. An example is Clark, Jordan and Stockton, John R. and Charles T. Clark. Introduction to Business and Economic Statistics, 7th Edition. Cincinnati OH: South-Western Pub. Co., 1985. For a broader perspective on measurement, see Fielding, Gordon. Managing Public Transit Strategically. New York: Jossey-Boss. 1987 (out of print).

5.3 Creating and Reporting Evaluation Measures 5.3.1 Creating Evaluation Measures Evaluation measures are formed from the required data items. There are a number of OTS software programs available to organize data. One of the most versatile is the spreadsheet. It is possible to create an algebraic definition for each evaluation measure you want in a cell of the spreadsheet. The definition can represent each constituent data item in a form that automatically extracts it from its resident database for the purpose of the calculation. Similar capabilities exist in several OTS database programs.
5.3.2 Reporting Evaluation Measures The desired reports can be derived directly from the spreadsheet or other programs in which the evaluation statistics are calculated. In fact, reports can be the spreadsheets themselves or the output of database programs. No other means is necessary to prepare the desired reports.
The reports should be designed to arrange the measures so that progress toward objectives and goals can be determined. This requirement can be fulfilled for the example shown in Table 4 by listing the measures under the heading, “Service,” “Cost,” or “Process Efficiency” of the objective it measures. Each measure reports the value of one of the objectives, hence defining progress toward achieving its goal.
5.4 Performing the Evaluation 5.4.1 Defining the Base Case The Base Case defines the state of the system against which future progress and goal achievement is to be measured. Normally it is designated to be the existing system before any proposed Transit ITS applications are employed. Reliable estimates of the performance of the Base Case system are needed.
5.4.2 Measuring Progress As mentioned in section 5.1, the measurement of the impact of any new Transit ITS applications should not be made before the application has been in successful operation for at least three months. After that time, the same three steps done for the Base Case should be completed for the system with the new Transit ITS application(s). When comparing the system with the new Transit ITS applications with the Base Case, the change in the values of evaluation measures is the overall measure of progress toward achieving your goal.
Steps to establish Base Case
1. Create the database as depicted in Tables 4 and 5.
2. Populate the database with enough data to provide reliable performance estimates for the Base Case.
3. Prepare reports that provide values of the evaluation measures, and therefore, the Base Case status of goal achievement.
Steps to establish Progress Measurement
1. Create the database as depicted in Tables 4 and 5.
2. Populate the database with enough data to provide reliable performance estimates for the new Transit ITS application. The evaluation should cover system performance for at least three months.
3. Prepare reports that provide values of the evaluation measures, and therefore, the level of goal achievement for the new Transit ITS applications.
36

37
5.5 Backing-Up the Database The development and maintenance of the evaluation database requires considerable time and effort. It is important to protect this investment against destruction or damage. Power failures, lightning strikes, computer viruses, computer failures, software bugs, and operator errors are possible sources of computer system failure that could harm or eliminate the evaluation database.
5.6 One Manager’s Approach to Evaluating Implementation Once again, to illustrate the process of evaluating Transit ITS implementation, we will continue with the experiences of our hypothetical Edgar County Rural Transit (ECRT) system and its manager, Tim Stark.
After months of planning, obtaining funds, and selecting tools, ECRT is about to implement a number of Transit ITS applications. Tim recognizes that it is important to be able to measure the impact of these applications on improving service and process efficiency, as well as on decreasing costs.
To lay the groundwork for the eventual evaluation of these Transit ITS capabilities, Tim is developing Base Case information. Tim reviewed the performance measures that he had developed to assess the needs of ECRT during the Transit ITS planning process. He selected a set of measures that he thought would enable ECRT to track its progress toward meeting its objectives and achieving its goal of improving both the quality of transit service and the efficiency of ECRT operations.
Tim reviewed the set of evaluation measures with his Information Technology (IT) assistant, Mary Koppel, and then with the Technology Task Force. After incorporating their suggestions, Tim and Mary identified the data items that ECRT needed to calculate the evaluation measures. They checked the ECRT database that they had developed early in the Transit ITS planning process to be sure the required data items were all there. A few were missing, but Mary and the graduate student were able to establish them using the required source data now available and accessible in the ECRT database.
At Tim’s request, the Technology Task Force determined that three months of source data were needed to develop reliable estimates of the evaluation measures for the Base Case. Consequently, the Base
Consequently, we recommend that the evaluation database be backed-up daily. For very small systems weekly back-ups may be adequate. As many readers know, backing up the database merely means copying it onto a disk, tape or CD. To guard against fire, theft, or some other disaster, the database back-up disk should be stored off-site in a bank or some other fireproof vault.
Case recording period began once the database file structure for all the required source data was established. At the end of the three-month recording period, the evaluation measures for the Base Case were computed. These measures were based solely on the information from the operation of ECRT for that three-month period.
From that point on, the evaluation measures have been reported on a monthly basis. The reports are developed in-house with some technical assistance from the State DOT. Because of the structure of the database, ECRT was able to produce the report containing the measures for a given month on the first business day following the close of the month. The report showed the results for all the previously reported months as well. When a full year has elapsed, the report contains results for only the subject month and each of the previous twelve months. Later on, a rolling annual summary was developed. It was reported each month for the prior twelve months. The entire ECRT database is now backed up at the close of each business day with zip disks deposited for safekeeping in a local bank.
Under Tim’s overall direction, Mary continued to supervise the installation of the selected Transit ITS applications. All of the applications, except that for Smart Card technology, were readily available in off-the-shelf versions. The Smart Card application was a joint development of the state DOT and three social service agencies operating in the state.
As the new applications have come into use, the evaluation report has continued to show their collective impact on the service quality and efficiency of ECRT. It has also served as a guide for ECRT management and staff to measure the transit system’ s effectiveness.
Mary has become the permanent full-time IT Director at ECRT. At this point, Tim is seeking greater and more effective collaboration with the agencies, business firms, and groups of citizens served by ECRT.
6 WHERE DOES RURAL TRANSIT ITS PLANNING GO FROM HERE?
The needs for public transportation in rural areas continue to emerge and grow. New technology for providing and managing rural transit continues to develop with encouragement from FTA programs. Rural transit managers have growing opportunities to serve their communities. They also have continuing challenges to manage improvement through technological and organizational change.
New institutions are emerging in order to help rural transit managers locate and benefit from the information that is most useful to them. State transportation agencies are helping in diverse ways by managing financial assistance and cooperatively developing new Transit ITS tools. Increasing collaboration among federal and state transportation and social service agencies are producing, not only new riders, but also innovations in transit and transit-related services. Industry associations, such as APTA and CTAA, produce publications and sponsor conferences that are increasingly addressing rural Transit ITS and other topics of value to rural transit operators.
The flow of this information is ever increasing and sometimes seems to reach unimaginable proportions. This Guidebook provides a framework for assimilating new information and managing change. We hope that rural transit managers will find the framework useful. It can accommodate the results of research, development, and the experience of rural transit managers around the world.
We have a continuing interest in the development of better methods and techniques for planning rural Transit ITS applications. The Federal Transit Administration is also beginning work on an interactive web site that will enable transit systems to share their experiences in implementing Rural Transit ITS.
38


