Technology and Politics: Incentives for Youth Participation
24
Technology and Politics: Incentives for Youth Participation Shanto Iyengar and Simon Jackman Stanford University Prepared for presentation at the International Conference on Civic Education Research, New Orleans, November 16-18, 2003 We gratefully acknowledge the financial support of CIRCLE (Center for Information and Research on Civic Learning and Engagement, University of Maryland). No other group is as disengaged from elections as youth. Voter turnout in the United States trails that of other industrialized societies, and is particularly anemic among youth between the ages of 18 and 24. The under-representation of youth voters has been observed ever since eighteen year olds were enfranchised in 1972 (for evidence, see Levine and Lopez, 2002; Bennett, 1997). In the 1976 election, 18-24 year olds made up 18 percent of the eligible electorate, but only 13 percent of the voting electorate, reflecting under-representation by one- third. In the subsequent off-year election of 1978, under-representation of 18-24 year-olds increased to 50%. Twenty years later, youth voters numbered 13 percent of the voting age population, and a mere five percent of those who voted. The consequences of age-related imbalances in political participation for the democratic process are obvious. Elected officials respond to the preferences of voters, not non-voters. As rational actors, candidates and parties tend to ignore the young and a vicious cycle ensues. As William Galston puts it, “Political engagement is not a sufficient condition for political effectiveness, but it is certainly necessary.” (2002a, p. 6)
Transcript of Technology and Politics: Incentives for Youth Participation

Technology and Politics: Incentives for Youth Participation
Shanto Iyengar and Simon Jackman
Stanford University
Prepared for presentation at the International Conference on Civic Education Research, New Orleans, November 16-18, 2003
We gratefully acknowledge the financial support of CIRCLE (Center for Information and
Research on Civic Learning and Engagement, University of Maryland).
No other group is as disengaged from elections as youth. Voter turnout in the United
States trails that of other industrialized societies, and is particularly anemic among youth
between the ages of 18 and 24. The under-representation of youth voters has been observed ever
since eighteen year olds were enfranchised in 1972 (for evidence, see Levine and Lopez, 2002;
Bennett, 1997). In the 1976 election, 18-24 year olds made up 18 percent of the eligible
electorate, but only 13 percent of the voting electorate, reflecting under-representation by one-
third. In the subsequent off-year election of 1978, under-representation of 18-24 year-olds
increased to 50%. Twenty years later, youth voters numbered 13 percent of the voting age
population, and a mere five percent of those who voted.
The consequences of age-related imbalances in political participation for the democratic
process are obvious. Elected officials respond to the preferences of voters, not non-voters. As
rational actors, candidates and parties tend to ignore the young and a vicious cycle ensues. As
William Galston puts it, “Political engagement is not a sufficient condition for political
effectiveness, but it is certainly necessary.” (2002a, p. 6)

2
There are several possible reasons for political avoidance by the youngest portion of the
electorate (see Bennett, 1997; Galston, 2002 for a general discussion). Elections and campaigns
are thought to have little relevance for youth because they are preoccupied by short-term factors
associated with the transition to adulthood, including residential mobility, the development of
significant interpersonal relationships outside the family, the college experience, and the search
for permanent employment. Against the backdrop of such significant personal milestones,
political campaigns appear remote and inconsequential.
Rivaling life cycle factors as a cause of apathy is the political subculture of youth. In
particular, youth lack the psychological affiliations so important for political engagement (see
Beck and Jennings, 1982; Stoker and Jennings, 1999). Partisanship is what bonds voters to
campaigns, and the sense of party identification is more firmly entrenched among older
Americans who have had multiple opportunities to cast partisan votes (Niemi and Jennings,
1991; Keith et al., 1992). The young are also less likely to have internalized relevant “civic”
incentives -- beliefs about the intrinsic value of keeping abreast of public affairs (Jennings and
Markus, 1984; Sax et al., 1999). Because adolescence and early adulthood are especially
formative phases for the development of personal, group, and political identity (see Sears and
Valentino, 1997; Niemi and Junn, 1998; Stoker and Jennings, 1999; Putnam, 2000), it is
particularly important that participant attitudes and norms take root if today’s youth are not to
remain tomorrow’s non-voters.
The question of potential “treatments” for the problem of politically disengaged youth
has attracted considerable attention. Much of the literature focuses on civic education and efforts
to make the curricula more “hands-on.” The most recent nationwide evidence suggests that
civics courses do impart information and foster development of attitudes known to encourage

3
participation (Niemi and Junn, 1998; Niemi and Campbell, 1999; cross-cultural evidence from
28 countries is summarized in Torney-Purta et al., 2001; for a critique of the mainstream civic
education model, see Hibbing, 1996, Conover and Searing, 2000). An important innovation to
classroom-based civic learning extends the curriculum to the community. Some have argued that
participation in non-political community service programs can be a catalyst for the development
of pro-social and participant orientations (Merrill, Simon and Adrian, 1994; Astin and Sax, 1998;
Niemi, Hepburn and Chapman, 2000). Yet, it is clear that the gains from near-universal
exposure to civic education are insufficient to get young voters to the polls.
An alternative treatment strategy -- unrelated to civic education -- is to rely on
conventional voter mobilization campaigns. When “get out the vote” efforts are directed at
young, first-time voters (e.g. college students), the payoffs are considerable. Using a series of
field experiments, Donald Green and Alan Gerber have demonstrated that in-person and
telephone-based canvassing both provide a significant impetus to youth turnout (an increase of
over five percent), and at a fraction of the cost of national media campaigns (Green and Gerber,
2001; Green, Gerber, and Nickerson, 2002). However, as noted below, by providing the
recipient of the contact with a salient situational rationale for voting, mobilization campaigns
may actually impede the development of participant attitudes and motives.
In sum, civic education contributes to the development of participant attitudes, but at
least in the near-term, does not boost youth turnout. Voter mobilization campaigns boost
turnout, but leave little mark on the attitudes of young voters. Can both outcomes be achieved
simultaneously? We argue that the revolution in information technology provides a significant
new opportunity for connecting youth to the electoral process.

4
Technological Literacy as a Potential Political Resource
There is no doubt that youth are in the vanguard of computer-based media. School-age
children and young adults are considerably over-represented among all computer and Internet
users. Three out of four Americans under the age of 18 have access to a computer; on average,
they use it for some thirty minutes every day (Dept. of Commerce, 2002). Thus, in contrast to
their under-representation in any form of political action, youth enjoy a massive advantage when
considering the daily use of information technology. As suggested in Figure 1, should the
worlds of technology and politics be combined, youth and adults would be equally active!1
Figure 1
Not only are the young especially adept with new technologies, but they have also
integrated technology into their personal lives as never before. From carrying out school
assignments, chatting with friends, playing games, listening to or creating music, to downloading
and watching the latest movies, “multi-tasking” with a personal computer is a core element of
1. The representation ratio measures the degree of over or under-representation of any particular group. A value of 1.0 indicates that the group in question participates in proportion to its share of the population, e.g. a group that accounts for 25 percent of the voting-eligible population makes up 25 percent of those that voted. Values below 1.0 indicate under-representation and vice-versa (see Rosenstone and Hansen, 1993). The turnout data are for 1996; the pc usage data are from 1997 (Dept. of Commerce, 2002).

5
contemporary youth culture. In the words of a 17 year-old respondent in a recent Pew Internet
and American Life survey, “I multi-task every single second I am online. At this very moment I
am watching TV, checking my email every two minutes, reading a newsgroup about who shot
JFK, burning some music to a CD, and writing this message” (Lenhart, Rainie and Lewis, 2001,
p. 10).
The fact that new media require an active rather than passive audience has important
implications not only for the users’ sense of community (see Putnam, 2000, p. 411), but also for
their own personal identity. The social psychological literature demonstrates unequivocally that
behavioral cues exert powerful effects on beliefs about the self (for a review of self perception
research, see Schneider, Hastorf, and Ellsworth, 1979; Ross and Nisbett, 1991). Typically,
individuals attribute their actions to either dispositional (internal) or situational (external) causes.
Someone who votes, for instance, may believe that she was motivated to vote on her own or,
alternatively, that she was pressured to vote by a phone call or campaign worker. Attributing the
act to dispositional factors contributes to “intrinsic motivation” which encourages the person to
repeat the act in question (for a recent review of the intrinsic motivation literature, see Lepper
and Henderlong, 2000). In one of the classic attributional studies, pre-schoolers who were
promised rewards for drawing were later found to approach drawing materials less frequently
than those not led to expect any reward (Lepper et al., 1973; Lepper and Greene, 1978). The
extensions to youth political participation are clear: young people who encounter campaign
information on their own accord and spend time interacting with political material may come to
see themselves as interested in politics. The relatively inexpensive “act” of using a campaign
CD (Iyengar, 2001) or visiting a political website (Lupia and Baird, 2003; Shah et al., 2001) may
then lead to more significant acts including registering to vote and discussing the campaign with

6
parents or friends. In this respect, a trivial and unobtrusive addition to one’s “technology space”
such as a CD, which young people are able to turn on and off at will, promises far greater long-
term payoff than conventional efforts at mobilization. The locus of causation for technology use
is relatively personal; an eighteen year old, who in the course of playing a computer game, learns
that certain groups or causes he dislikes are on a particular candidate’s “team,” has some basis
for claiming an interest in politics. An eighteen year old who receives a phone call urging him to
vote has some basis for claiming precisely the opposite.
Research Design
We designed this study to assess whether young people’s expertise with information
technology could be harnessed to stimulate a greater sense of involvement in political
campaigns. We provided a representative sample of California youth with an interactive CD
featuring the 2002 gubernatorial election. Participants were sent the CD two weeks in advance
of the election. Following the election, they completed a survey of their political attitudes and
opinions.
The experimental treatment was a multimedia “ebook” about the 2002 California
gubernatorial election. Compiled on a CD, the ebook presented an exhaustive and easily
searchable database about each of the two major candidates (Democrat Gray Davis and his
Republican opponent Bill Simon) including televised advertisements, interviews with broadcast
news sources, excerpts from the party platforms, and the audio of their one public debate.
Participants had to only place the CD in the drive for the ebook software to self-install.2
The ebook was organized into four chapters. The opening chapter (“Politics in the
Golden State”) provided a general overview of electoral law and procedure (i.e. how to register
2. The software (TK3 Reader) is a product of Nightkitchen.com.

7
to vote), the composition and partisan sentiments of the California electorate, a historical survey
of gubernatorial elections, and a brief discussion of campaign strategy. The second chapter
(“The Candidates”) provided biographical and career information about Davis and Simon. Next
(“The Issues”), we provided excerpts from the candidates’ stump speeches on the economy,
energy shortages, public education and other major issues. Finally, Chapter 4 (“The Media”)
featured the one debate between Davis and Simon, as well as a series of news reports (taken from
newspapers across the state) about the candidates and the state of their respective campaigns
Using this format, we produced two versions of the CD. The “adult” version, as
described above, provided extensive information about the candidates. The “youth” version
provided the identical information, but supplemented with a variety of interactive games,
contests and quizzes all designed to make the presentation especially appealing to youth.
Specifically, the youth version featured two different “whack-a-pol” games in which the user
seeks to hit as many moving targets (politicians or interest groups) with a hammer (see Figure 2
below), a music quiz asking users to identify popular songs and associate the artists with
candidates or causes, a similar “celebrity quiz,” and a self-administered “rate your campaign IQ”
test in which users first watched well-known (and amusing) television ads from past political
campaigns and then explained the strategy behind the ads. Thus, although the adult and youth
versions provided identical substantive content (both text and multimedia), the latter was
designed to both inform and entertain. Naturally, we expected that exposure to the youth CD
would prove especially influential among younger CD users.

8
Figure 2: Whack-a-Pol Screen Shot
We contracted with a research firm, Knowledge Networks, to mail each version of the
CD to a representative sample of Californians between the ages of 16 and 29.3 Potential
participants were contacted in advance and offered $10 for participating in a Stanford University
study about voter reactions to an election CD. Those who agreed were further informed that they
would receive the CD in the mail two weeks before the election, that they were free to use the
CD as they saw fit, and that they would be asked to complete a brief survey about their use and
evaluation of the CD shortly after the election.
3. As originally planned, we hoped to limit the sample to 16-24 year-olds, but the sample size would have been too small because the Knowledge Networks panel is designed to be representative of the adult population.

9
Each version of the CD was mailed to 350 participants on October 21st.4 Following the
election, Knowledge Networks administered a web-based survey to all recipients of the CD in
addition to a parallel (in terms of age) control group of 250 participants. The survey included a
series of questions concerning their engagement in the campaign, and more generally, their
feelings about the role of ordinary citizens in the political process. For the purposes of this
analysis, we focus on actual (i.e. validated) turnout,5 interest in the campaign, the sense of civic
duty and political efficacy as our measures of political involvement.6 These questions were also
administered to the control group. In all cases, the measures were re-scaled to range between 0
and 1.
4. The assignment to either of the CD conditions was randomized.
5. We used the Secretary of State’s turnout database to trace study participants based on their street address and date of birth. The level of over-reporting of actual turnout was approximately 25 percent. That is, self-reported vote exceeded actual vote by that amount. 6. The interest index consisted of four items: (1) Which of the following best describes how often you follow what's going on in government? Responses ranged from “most of the time” to “hardly at all.” (2) How many days in the past week did you talk about politics with family or friends? Responses ranged from “every day” to “none.” (3) Generally speaking, how much did you care about who won the presidential elections this fall? (4) How much did you personally care about the way the 2000 election to the U.S. House of Representatives came out? Responses to both these items ranged from “very much” to “not at all.” We summed the four responses and then converted scores to a 0-1 scale. The average inter-item correlation (r) was .54. We used three items to measure the sense of efficacy: (1) Sometimes politics and government seem so complicated that a person like me can't really understand what's going on. (2) Public officials don't care much what people like me think. (3) People like me don't have any say about what the government does. The response options ranged from “strongly agree” to “strongly disagree.” We summed across the items and transformed scores to a 0-1 scale. The average inter-item correlation was .32. Finally, our index of civic duty consisted of three items: (1) If people don't care how an election comes out he they shouldn't vote in it, (2) It isn't so important to vote when you know your party doesn't have any chance to win, and (3) A good many local elections aren't important enough to bother with. Response options for all three items ranged from “strongly agree” to “strongly disagree.” We summed across items and transformed the index scores to a 0-1 scale. The average inter-item correlation for the civic duty set was .33.

10
152 of the participants mailed the CD completed the survey for a response rate of 22
percent.7 We know for certain that these respondents received the CD. Unfortunately, we do not
have any reliable indicator of the extent of their CD use.8 Accordingly, in the analyses that
follow, we consider respondents assigned to either of the CD conditions as “exposed” to the CD.
Using the conventional logic of experimental design, we can attribute, ipso facto, differences in
measures of political engagement between the treated and control groups to exposure to the CD.
Methodology and Results
At the heart of any scientific experiment is random assignment. Randomization
ensures that differences between the treatment group and the control group only reflect the
effects of treatment; bias in the estimated treatment effect is not an issue (i.e., the experiment is
valid), and the only issue concerns statistical significance (i.e., is the realized treatment effect big
enough such that it is unlikely to have been generated by chance). Of course, when working
with human subjects, random assignment often fails. People fail to comply with their assignment
status, usually refusing treatment (or receiving treatment even when assigned to the control
group, as sometimes occurs in medical trials). The problem posed by outcome-related selection
into the treatment condition is obvious. In the case of the youth CD, for instance, actual turnout
7. Failure to use the CD is the most likely explanation for the relatively low response rate in the treatment conditions. That is, most participants opted out of the survey for the simple reason that they had not used the CD. Note the substantially higher response rate in the control group (62 percent). Non-response can further be attributed to the general lack of interest in the election, and the fact that our participants were drawn disproportionately from the ranks of the politically disengaged (the young). 8. Unlike an earlier study of the 2000 presidential campaign, we did not have the necessary resources to monitor participants’ actual use of the 2002 CDs. In the earlier study, we retrieved usage files from the participants’ computers. Using that behavioral measure, we found that 38 percent of the participants actually used their CD. Considering the differences between the 2000 presidential and 2002 gubernatorial campaigns, most notably the considerably lower salience of the latter (with a 36 percent turnout rate), and the age distribution of the participants in the 2002 study, we believe the imputed exposure rate of 22 percent is plausible.

11
among treated subjects exceeded turnout among the control group by 15 percentage points. This
observed difference is not only attributable to the treatment, but also to the ex-ante level of
political interest among participants who chose to use the CD. When acceptance rates for
experimental treatments are less than universal, it becomes necessary to estimate the average
treatment effect after adjusting for self-selection into the treatment group.
In our experiment, 78 percent of those assigned to the treatment conditions did not
participate, due to general disinterest in the subject matter, insufficient time to use the CD, or
other such factors. This means that the subjects who did accept the treatment were drawn
disproportionately from those generally more interested in politics than the typical subject, and,
more importantly, than the typical member of the control group. Put simply, not only is
exposure to the treatment non-random, it is correlated with the outcome variables of interest
(voter turnout, political efficacy, etc).
Fortunately, in recent years there has been a tremendous surge of interest among
statisticians and econometricians in estimating treatment effects in non-randomized settings (i.e.,
experiments where randomization has failed, and non-experimental or observational settings).
Recent surveys include Imbens (2003), Angrist and Krueger (2000), Heckman, Lalonde and
Smith (2000) and Heckman, Ichimura and Todd (1998). The general idea is straightforward:
although respondents have self-selected into treatment, after we control for factors that
predispose assignees to accept or refuse treatment, the outcomes of interest and treatment are no
longer confounded. That is, if we have data on variables that structure receipt of treatment
(covariates), we can overcome the failure of random assignment into treatment or control groups,
and recover an unbiased estimate of the treatment effect. In particular, we can form matched
comparisons of treated and controls (matching on the covariates); under a set of conditions

12
defined below, averaging over these matched comparisons produces an unbiased estimate of the
causal effect of treatment.
In the context of our CD study, the relevant covariates included self-reported voting
histories, the respondents’ propensity to participate in surveys, and social-structural indicators
related to political participation (i.e. age, marital status, education, etc). In comparison with non-
participants, CD users were older, more frequent survey takers, more educated, and with higher
incomes. Together, these factors correctly classified 89 percent of all participants as either “CD
acceptors” or “non-acceptors.”
We adjusted for the compositional bias in exposure to the treatment by computing the
average outcomes for treated participants and control participants who share the same values on
the relevant covariates. Thus, we estimated the treatment effect as the averaged difference in the
outcome variables between subgroups of treated and control subjects with identical covariate
values.
When the available covariates for predicting acceptance of treatment are plentiful and/or
continuous, the resulting matching estimators are biased, since it may not be possible to come up
with exact matches. Abadie and Imbens (2002) demonstrate that subject to some regularity
assumptions, the simple matching estimators defined above are inconsistent if the number of
(continuous) covariates available for matching exceeds two. They develop a hybrid matching-
regression estimator that has better statistical properties. Their bias-corrected matching estimator
is consistent and asymptotically normal. Of particular importance, Abadie and Imbens (2002)
provide expressions for computing the variance of the bias-corrected estimator making it
possible to test the significance of the treatment effect without resorting to bootstrapping.9
9. Software for the Abadie-Imbens estimators is available in STATA and Matlab (Abadie et al.

13
Matching is hardly a new idea (e.g., Cochran 1968), but recent technical and applied
work has established it as the dominant technique for analyzing experiments in which random
assignment to treatment has failed. The underlying ideas are actually quite simple -- we make a
series of comparisons between treatment and control groups, within subgroups defined by
covariates that predict participation in the study. This means we are in fact comparing cases that
are essentially indistinguishable with respect to the phenomenon of interest, save for the fact that
some were treated and some were not.
We present matched estimates of the treatment effects in Table 1. For purposes of
comparison, we also report the “naïve” or unmatched estimate, namely, the simple difference in
the average value of the outcome variable between the control and CD groups.
Table 1: Matched and Unmatched Average Treatment Effects
Turnout (in %) Pol. Interest(0-1) Civic Duty (0-1) Pol Efficacy (0-1) Control Group Mean
18
(N=137)
.24
(N=161)
.50
(N=161)
.35
(N=122)
Youth CD Effect
Unmatched Matched
+15 (06)** +11 (07)*
(N=199)
Unmatched Matched
+.07 (.03)** +.07(.03)*
(N=237)
Unmatched Matched
+.03 (.02) + + .01 (.02)
(N=237)
Unmatched Matched
+.00 (.03) -.01 (.03)
(N=187)
Adult CD Effect
+11(06)* +05(06)
(N=199)
+.08(.03)** +.05 (.03)*
(N=237)
+.03 (.02) + + .02 (.02)
(N=237)
+.02 (.03) +.02 (.03)
(N=185)
** p<.01; * p<.05; + p< .10
The unmatched estimates indicate powerful effects of both treatments for two of the four
outcomes. Participants exposed to the youth CD were more likely to vote by a margin of fifteen
percent; in the case of the adult CD, the turnout boost was eleven percent. Both CD groups also
2003) and we are implementing these estimators in R.

14
expressed significantly higher levels of interest in the campaign (by seven percent over the
control group). Exposure to either CD also made participants more likely to claim that voting
was a duty (by three percent), but these effects proved only marginally significant. Both
interventions failed, however, in the case of political efficacy; participants in the CD conditions
were no more likely to perceive themselves as capable of political influence than their
counterparts in the control condition. This is an important failure, given the literature concerning
the role of behavioral cues in self-perception.
The matching estimates demonstrated considerable attenuation of the original effects.
The attenuation ranged from 25 to 50 percent and, given the small samples, often transformed
significant into non-significant differences. More specifically, the use of the matching procedure
erased the simple effects of the adult CD treatment. Of the three significant unmatched effects of
exposure to the adult CD, only one (on political interest) survived the matching procedure. In
contrast, two of the three original significant effects associated with exposure to the youth CD
survived the matching procedure with only slight attenuation. As a result, the matched turnout
effect of exposure to the youth CD (11 percent) doubled that of the adult CD! Thus, the
matched results suggest an important revision of the initial findings: the simple effects of the
adult CD were, in good part, artifacts of self-selection into the CD group. In contrast, the
treatment effects of the youth CD were uncontaminated by self selection; even after adjusting for
the over-representation of especially “participant” subjects among the ranks of the treated, the
youth CD boosted turnout and interest. The adult and youth CDs were identical in terms of
substantive content; therefore, we may appropriately conclude that a synthesis of entertaining
games and substantive information is necessary for election handbooks to influence the
15
development of civic attitudes among youth. With a relatively young audience, a purely
substantive presentation is less engaging than one that is more entertaining.
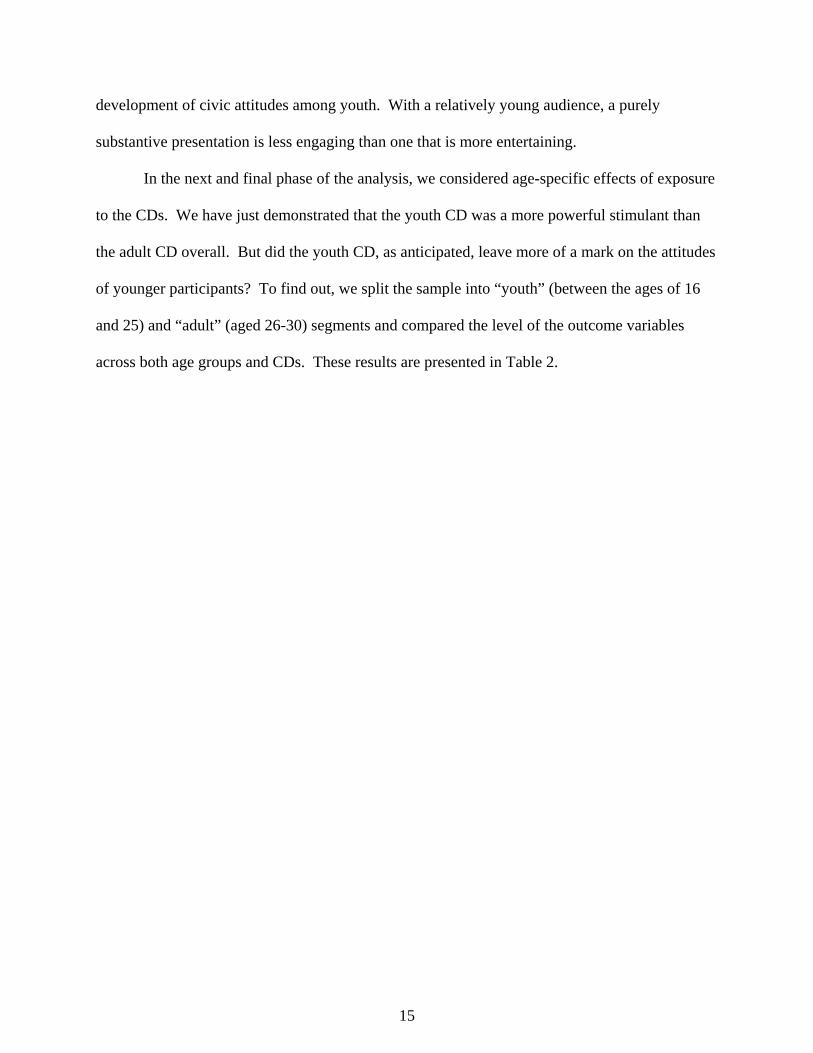
In the next and final phase of the analysis, we considered age-specific effects of exposure
to the CDs. We have just demonstrated that the youth CD was a more powerful stimulant than
the adult CD overall. But did the youth CD, as anticipated, leave more of a mark on the attitudes
of younger participants? To find out, we split the sample into “youth” (between the ages of 16
and 25) and “adult” (aged 26-30) segments and compared the level of the outcome variables
across both age groups and CDs. These results are presented in Table 2.

16
Table 2: Effects of CD Treatments By Age Group
Control Group Mean
Youth CD Effect Adult CD Effect
Turnout (18-25)
(26-30)
11
(N=68)
24
(N=69)
Unmatched Matched
+22 (08)** +18 (08)**
(N=102)
+06 (10) +05 (11)
(N=97)
Unmatched Matched
+13 (08)* +06 (08)
(N=98)
+09 (10) +02 (11)
(N=101)
Pol. Interest (16-25)
(26-30)
.21
(N=91)
.28
(N=70)
Unmatched Matched
+.10 (.03)** +.09 (.04)**
(N=140)
+.03 (.04) +.03 (.05)
(N=97)
Unmatched Matched
+.05 (.03) +.05 (.03)
(N=136)
+.09 (.04)** +.06 (.05)
(N=101)
Pol Efficacy (16-25)
(26-30)
.33
(N=62)
.36
(N=60)
Unmatched Matched
+.00 (.02) -.01 (.04)
(N=101)
+.00 (.04) -.02 (.04)
(N=86)
Unmatched Matched
+.02 (.04) -.02 (.04)
(N=98)
+.05 (.04) +.06 (.05)+
(N=87)
Civic Duty (16-25)
(26-30)
.46
(N=91)
.54
(N=70)
Unmatched Matched
+.06 (.03)** +.03 (.03)
(N=140)
+.00 (.04) -.02 (.04)
(N=97)
Unmatched Matched
+.02 (.03) -.01 (.03)
(N=136)
+.06 (.03)* +.05 (.04)+
(N=101)
** p < .01; * p < .05; + p < .10

17
Given the limited size of our sample, any analysis of subgroups is inherently unstable.
However, the pattern of results in Table 2 is suggestive -- the youth CD provided a stronger
boost to the responses of youth. Thus, exposure to the interactive CD actually reversed the
typical “age gap” in political engagement: age differences in turnout, interest and civic duty
were nonexistent in the youth CD condition! Older participants’ efficacy and civic duty scores,
on the other hand, were influenced more reliably by the adult version. Clearly, the interactive
elements of the youth CD “worked” especially well for youth. Total turnout in the 2002
gubernatorial election was 36 percent. Among youth in the Youth CD condition, the level of
turnout was similar -- 33 percent. Given the typical shortfall in turnout among the young, the
fact that turnout in the youth CD treatment nearly matched statewide turnout is revealing of the
power of the treatment. A more appropriate comparison would be limited to 18-24 year olds: in
1998, the last off-year election for which the Federal Election Commission has compiled age-
differences in turnout, the turnout rate for 18-24 year olds was 18.5 percent
(http://www.fec.gov/pages/98demog/98demog.htm), considerably below the youth turnout rate
in either CD condition.
Conclusion
We undertook this exploratory study to test whether young Americans’ enthusiasm for
digital technology can provide a meaningful opportunity to engage them in the world of politics.
Our evidence suggests that the answer is in the affirmative. The findings presented here, of
course, are subject to any number of limiting conditions. The evidence was derived from a
single campaign in California, a state that can hardly be considered a microcosm of American or
youth culture; the size of the sample was too small to permit refined tests of the treatment
effects; and our measure of exposure to the CD was crude and necessarily imprecise. While

18
acknowledging the multiple limitations of our design, we are nevertheless encouraged by the
results. Providing teenagers and young adults with campaign materials in the form of an
interactive and entertaining campaign handbook did wonders for their political spirit. CD
recipients voted at a much higher rate, showed more interest in the campaign, and expressed
greater faith in the act of voting than members of the control group (or the same age group in the
general population).
Unlike conventional efforts at mobilizing the young, such as telephone or door-to-door
canvassing, election handbooks represent much more than a reminder to vote. They deliver
relevant information as well as the opportunity to encounter the candidates in their own words,
all with minimal effort. Thus, CD use raised interest in the election and civic mindedness,
neither of which can be influenced by traditional canvassing methods. Moreover, as we noted
earlier, in comparison with conventional methods of mobilization, the local of responsibility for
CD use is more dispositional (intrinsic) in the sense that CD users explore the information or try
out the games on their own accord. As suggested by attribution theorists, CD use can serve as a
behavioral cue; young people who enjoy playing “whack a pol” have some basis for calling
themselves interested in the campaign. In short, the election CD is an especially effective form
of youth mobilization.
In more practical terms, there are both advantages and disadvantages to the use of a
multimedia CD as a platform for civic education. On the positive side, CDs are cheap to produce
and distribute. They are simple to use and impose trivial opportunity costs (for example,
insertion of the CD into the drive does not impede other, more compelling functions of the user’s
computer). Providing similar materials on the Web would require both Internet access and
bandwidth (given the multimedia content of campaigns), neither of which is readily available

19
across a broad spectrum of voters. However, mass dissemination of CDs at the present time may
be a less effective tool for voter mobilization than targeted exposure techniques such as
telephone calls or direct mail. At present, there is no doubt that civic groups can target and reach
a greater number of young voters through the telephone than by giving away CDs. Moreover,
even with the multitude of barriers to unsolicited telephone calls, callers are likely to get through
to a considerable percentage of the names they call (see Green, Gerber and Nickerson, 2002;
Holbrook, Pfent, and Krosnick, 2003). In our study, only twenty percent of the targeted audience
was reached. Therefore, although campaign CDs represent a much richer and more powerful
political stimulus than a telephone call, their overall effect is attenuated by the lower “acceptance
rate.”10 Thus, if campaign CDs designed for youth are to have a real impact, their reach must be
expanded.
We think the goal of broadening the use of election CDs is realistic. Enlisting the
assistance of educators would be an obvious first step, given the pedagogical value of the CD.
The impact of the materials would be enhanced by incorporation into classroom discussions --
which would also, of course, serve to publicize the CD more widely. Sponsorship by a reputable
non-partisan organization, or by a media outlet with special appeal to youth (e.g., MTV) would
add further to outreach and visibility.
In conclusion, the results from this pilot study suggest that a synthesis of political content
and interactive technology can engage youth. When enlivened with games, music, and other
attention-getting diversions, a campaign CD provides a meaningful impetus for youth to become
10. On the basis of the observed 18-point increase in youth turnout (the matched estimate) and the twenty percent rate of exposure, a youth CD campaign aimed at 100 newly enfranchised voters would produce between three and four additional voters. A telephone campaign, with mobilization effects of some 5 percent, but a contact rate of 60 percent would yield a similar result.

20
more aware of the political world. Civic educators and campaign organizers take note: this form
of communication gets through to young people!

21
References
Astin, A. W. and Sax, L. J. (1998). How Undergraduates are Affected by Service Participation.
The Journal of College Student Development 39: 251-263.
Beck, P. A., and M. K. Jennings. 1982. Pathways to Participation. American Political Science
Review 76: 94-108.
Becker, S. O., and Ichino, A. 2002. Estimation of Average Treatment Effects Based on
Propensity Scores. The Stata Journal 7: 1-19.
Bennett, S. 1997. Why Young Americans Hate Politics and What We Should Do About It. P.S.
30: 47-53.
Conover, P. J., and D. D. Searing. 2000. A Political Socialization Perspective, pp. 91-126 in
Rediscovering the Democratic Purposes of Education, Eds. L. M. McDonnell et al. Lawrence,
KS: University of Kansas Press.
Galston, W. A. 2002. Civic Knowledge, Civic Education, and Civic Engagement, pp. 24-36 in
Constructing Civic Virtue: A Symposium on the State of American Citizenship. Eds. Keith
Bybee et al. Syracuse: Syracuse University Press.
___. 2002a. Political Knowledge, Political Engagement, and Civic Education. Available at
http: publicleaders.tcnj.edu/_documents/galston.pdf.
Green. D. P., and A. S. Gerber. 2001. Getting out the Youth Vote: Results From Randomized
Field Experiments. Institute for Social and Policy Studies: Yale University.
Green. D. P., Gerber, A. S., and D. W. Nickerson. 2002. Getting out the Youth Vote in Local
Elections: Results From Six Door-to-Door Canvassing Experiments. Institute for Social and
Policy Studies: Yale University.
Hibbing, J. 1996. Civics is not Enough: Teaching Barbarics in K-12. P.S. 29: 57-62.

22
Holbrook, A. L., Pfent, A., and Krosnick, J. A. 2003. Response Rates in Recent Surveys
Conducted by Major National News Media Survey Organizations and Government Contractors.
Presented at the Annual Meeting of the American Association for Public Opinion Research.
Iyengar, S. 2001. Making Voters Autonomous: The Possibility of Unmediated Political
Campaigns. Presented at the National Conference for Digital Government Research, Los
Angeles, May 21-23.
Jennings, M. K., and G. Markus. 1984. Partisan Orientations Over the Long Haul. American
Political Science Review 78: 1000-18.
Keith, B., Magleby, D., Nelson, C., Orr, E., Westlye, M., and R. Wolfinger. 1992. The Myth of
the Independent Voter. Berkeley: University of California Press.
Lenhart, A., Rainie, L., and O. Lewis. 2001. Teenage Life Online. Washington, D.C.: Pew
Internet and American Life Project.
Lepper, M. R., and J. Henderlong. 2000. Turning "play" into "work" and "work" into "play":
25 years of research on intrinsic versus extrinsic motivation. In C. Sansone and J. Harackiewicz
(Eds.), Intrinsic and Extrinsic Motivation: The Search for Optimal Motivation and Performance
(pp. 257-307). San Diego: Academic Press.
Lepper, M., Greene, D., and R. Nisbett. 1973. Undermining children’s intrinsic motivation with
extrinsic reward. Journal of Personality and Social Psychology 28: 129-37.
Levine, P., and M. H. Lopez. 2002. Youth Voter Turnout has Declined by any Measure.
Unpublished Report, Center for Information and Research on Civic Learning and Engagement.
Lupia, A., and Z. Baird. 2003. Can Websites Change Citizens? Implications of Web White and
Blue 2000. P.S. 36: 77-82.

23
Merrill, B. D., Simon, J., and E. Adrian. 1994. Boosting Voter Turnout: The Kids Voting
Program. Journal of Social Studies Research 18: 2-7.
Niemi, R. G., and M. K. Jennings. 1991. Issues and Inheritance in the Formation of Party
Identification. American Journal of Political Science 35: 970-89.
Niemi, R. G., Hepburn, M. A., and Chris Chapman. 2000. Community Service by High School
Students: A Cure for Civic Ills? Political Behavior 22: 45-69.
Niemi, R. G. and J. Junn. 1998. Civic Education. New Haven, CT: Yale University Press.
Niemi, R. G., and C. Chapman. 1998. The Civic Development of 9th Through 12th-Grade
Students in the United States: 1996. Washington, D.C.: National Center for Education
Statistics, U.S. Department of Education (NCES 1999-131).
Putnam, R. D. 2000. Bowling Alone. New York: Simon and Schuster.
Schneider, D., P. Ellsworth, and A. Hastorf. 1979. Person Perception. Menlo Park, Addison-
Wesley.
Rosenbaum, P. R., and Rubin, D. B. 1983. The Central role of the Propensity Score in
Observational Studies for Causal Effects. Biometrika 70: 41-55.
Rosenstone, S. J., and J. M. Hansen. 1993. Mobilization, Participation, and Democracy in
America. New York: MacMillan.
Ross, L., and R. E. Nisbett. 1991. The Person and the Situation: Perspectives of Social
Psychology. New York: McGraw-Hill.
Sax, L. J., Astin, A. W., Korn, W. S., and K. M. Mahoney. 1999. The American Freshman:
National Norms for Fall 1999. Higher Education Research Institute, UCLA.
Sears, D., and N. Valentino. 1997. Politics Matters: Political Events as Catalysts for Pre-adult
Socialization. American Political Science Review 91: 45-65.

24
Shah, D., Schmierbach, M., Hawkins, J., Espino, R., Donovan, J. and S Chung. 2001.
Untangling the Ties that Bind: Non-Recursive Models of Internet Use and Engagement in Public
Life. Presented at the Annual Meeting of the Association for Education in Journalism and Mass
Communication.
Stoker, L., and K. Jennings. 1999. The Persistence of the Past: The Class of 1965 Turns Fifty,
Presented at the Annual Meeting of the Midwestern Political Science Association.
Torney-Purta, J., Lehmann, R., Oswald, H., and W. Schulz. 2001. Citizenship and Education in
Twenty-Eight Countries: Civic Knowledge and Engagement at Age Fourteen. Amsterdam:
International Association for the Evaluation of Educational Achievement.
United States Department of Commerce. 2002. A Nation Online: How Americans Are
Expanding Their Use of the Internet. Washington, D.C.: Telecommunications and Information
Administration.