Technology And Economy Analysis Of Waste Truck Tires ...
147
University of North Dakota University of North Dakota UND Scholarly Commons UND Scholarly Commons Theses and Dissertations Theses, Dissertations, and Senior Projects 1-1-2019 Technology And Economy Analysis Of Waste Truck Tires Technology And Economy Analysis Of Waste Truck Tires Management Management Irina Tsiryapkina Follow this and additional works at: https://commons.und.edu/theses Recommended Citation Recommended Citation Tsiryapkina, Irina, "Technology And Economy Analysis Of Waste Truck Tires Management" (2019). Theses and Dissertations. 2489. https://commons.und.edu/theses/2489 This Thesis is brought to you for free and open access by the Theses, Dissertations, and Senior Projects at UND Scholarly Commons. It has been accepted for inclusion in Theses and Dissertations by an authorized administrator of UND Scholarly Commons. For more information, please contact [email protected].
Transcript of Technology And Economy Analysis Of Waste Truck Tires ...

University of North Dakota University of North Dakota
UND Scholarly Commons UND Scholarly Commons
Theses and Dissertations Theses, Dissertations, and Senior Projects
1-1-2019
Technology And Economy Analysis Of Waste Truck Tires Technology And Economy Analysis Of Waste Truck Tires
Management Management
Irina Tsiryapkina
Follow this and additional works at: https://commons.und.edu/theses
Recommended Citation Recommended Citation Tsiryapkina, Irina, "Technology And Economy Analysis Of Waste Truck Tires Management" (2019). Theses and Dissertations. 2489. https://commons.und.edu/theses/2489
This Thesis is brought to you for free and open access by the Theses, Dissertations, and Senior Projects at UND Scholarly Commons. It has been accepted for inclusion in Theses and Dissertations by an authorized administrator of UND Scholarly Commons. For more information, please contact [email protected].

TECHNOLOGY AND ECONOMY ANALYSIS OF WASTE TRUCK TIRES MANAGEMENT
by
Irina Vladimirovna Tsiryapkina
Bachelor of Information Systems, Siberian State Industrial University, 2014
Master of Information Systems and Technologies, Siberian State Industrial University,
2016
A Thesis
Submitted to the Graduate Faculty
of the
University of North Dakota
in partial fulfillment of the requirements
for the degree of
Master of Science in Energy Systems Engineering
Grand Forks, North Dakota
May, 2019

ii
© 2019 Irina Vladimirovna Tsiryapkina
iii
This thesis, submitted by Irina Tsiryapkina in partial fulfillment of the requirements for the Degree of Master of Science in Energy Systems Engineering from the University of North Dakota, has been read by the Faculty Advisory Committee under whom the work has been done and is hereby approved.
_________________________ Dr. Michael Mann
_________________________ Dr. Nikhil Patel
_________________________ Dr. Sean T. Hammond
_________________________ Dr. Haochi Zheng
This thesis is being submitted by the appointed advisory committee as having met all of the requirements of the School of Graduate Studies at the University of North Dakota and is hereby approved.
Dean of the School of Graduate Studies Date

iv
PERMISSION
Title Technology and economy analysis of waste truck tires
management
Department Energy Systems Engineering
Degree Master of Science
In presenting this thesis in partial fulfillment of the requirements for a graduate
degree from the University of North Dakota, I agree that the library of this University shall make it freely available for inspection. I further agree that permission for extensive copying for scholarly purposes may be granted by the professor who supervised my thesis work or, in his absence, by the Chairperson of the department or the dean of the School of Graduate Studies. It is understood that any copying or publication or other use of this thesis or part thereof for financial gain shall not be allowed without my written permission. It is also understood that due recognition shall be given to me and to the University of North Dakota in any scholarly use which may be made of any material in my thesis.
Irina Tsiryapkina
April 24, 2019

v
TABLE OF CONTENTS
LIST OF FIGURES ......................................................................................... viii
LIST OF TABLES ............................................................................................ ix
NOMENCLATURE .......................................................................................... xi
ACKNOWLEDGEMTS ................................................................................. xiii
ABSTRACT ....................................................................................................... x
CHAPTER I: INTRODUCTION ..................................................................... 13
1.1 GENERAL INFORMATION ABOUT THE PROBLEM ....................................... 13
1.2 AIMS AND OBJECTIVES ............................................................................ 14
1.3 ABOUT THE REGION AND THE COMPANY .................................................. 15
1.4 DESCRIPTION OF THE PROBLEM ............................................................... 17
CHAPTER II: METHODOLOGY ................................................................... 19
CHAPTER III: LITERATURE REVIEW ....................................................... 22
OVERVIEW OF THE CHAPTER ......................................................................... 22
3.1 TIRE COMPOSITION AND TRUCK TIRE BRANDS USED BY THE COMPANY .... 22
3.2 TECHNOLOGY ANALYSIS ......................................................................... 29
3.2.1 STOCKPILING, LANDFILLING AND DUMPING INTO OPEN AREAS ............. 29
3.2.2 RETREADING AND RECOVERY ............................................................... 33
3.2.3 MATERIAL RECOVERY .......................................................................... 33

vi
3.2.3.1 Reuse of whole tires ..................................................................... 33
3.2.3.2 Grinding ....................................................................................... 34
3.2.3.3 Rubber reclaiming or devulcanization ......................................... 38
3.2.4 THERMOCHEMICAL CONVERSION PROCESSES AND ENERGY RECOVERY 40
3.2.4.1 Combustion (incineration) ........................................................... 40
3.2.4.2 Hydrothermal liquefaction (HTL) ................................................ 42
3.2.4.3 Gasification .................................................................................. 43
3.2.4.4 Pyrolysis ....................................................................................... 46
CHAPTER IV: PROCESS DEVELOPMENT ................................................ 62
OVERVIEW .................................................................................................... 62
Raw materials and production capacity ................................................... 63
Main product ............................................................................................ 64
Operation time .......................................................................................... 65
Plant location ............................................................................................ 65
STRUCTURE OF THE RECYCLING PROCESS ...................................................... 66
Pre-treatment system ................................................................................ 70
Pyrolysis system ....................................................................................... 70
Separation system ..................................................................................... 72
CHAPTER V: ECONOMIC ANALYSIS ....................................................... 79
OVERVIEW .................................................................................................... 79
INITIAL ECONOMIC PARAMETERS .................................................................. 80
CAPITAL COST ESTIMATION ........................................................................... 81
OPERATING COST ESTIMATION ...................................................................... 89

vii
Fixed operating cost ................................................................................. 89
Variable operating cost ............................................................................ 92
REVENUE ...................................................................................................... 93
PROFITABILITY ANALYSIS ............................................................................. 95
SCENARIO ANALYSIS AND COMPARISON ........................................................ 97
Energy recovery scenario ......................................................................... 99
Additional pre-treatment ........................................................................ 104
Crumb purchase scenario ....................................................................... 108
TDO production ..................................................................................... 113
SENSITIVITY ANALYSIS ................................................................................ 118
CHAPTER VI: CONCLUSION AND RECOMMENDATIONS ................. 128
REFERENCES ............................................................................................... 135

viii
LIST OF FIGURES
Figure 1. Map of coal strip mines ......................................................................... 16
Figure 2. The simplified life cycle of truck tires at "SibTreidNK ........................ 18
Figure 3. Graphical representation of the scope of this study ............................... 21
Figure 4. Flowchart of stockpiling/ dumping of WTT together with economic and
pollution flows ......................................................................................................
32
Figure 5. Schematic representation of reclamation and devulcanization .............. 39
Figure 6. Overview of rubber reclaiming and devulcanization processes. ........... 40
Figure 7. The market distribution of TDF (use of tires as a direct energy source)
in the USA for the year 1996 ................................................................................
41
Figure 8. Generalized scheme of pyrolysis ........................................................... 47
Figure 9. Mass balance for the hydrogen production process from WT ............... 55
Figure 10. Input-output structure of the scrap truck tires ...................................... 66
Figure 11. Process flow diagram for recycling of waste truck tires into limonene
...............................................................................................................................
67
Figure 12. Energy recovery system for waste tires recycling into limonene
process ...................................................................................................................
68
Figure 13. Junction of gas by-products S112 and S116; junction of liquid by-
products S117, S120, and S127 .............................................................................
73
Figure 14. Algorithm for the estimation of economics for recycling facility ....... 79
Figure 15. Flowchart of the base case scenario ..................................................... 96
Figure 16. Flowchart of the energy recovery scenario .......................................... 103
Figure 17. Flowchart of the pre-treatment scenario .............................................. 107
Figure 18. Input-output structure of the crumb purchase scenario ....................... 109
Figure 19. Flowchart of the crumb purchase scenario .......................................... 112
Figure 20. Generalized input-output structure for the TDO production scenario . 114
Figure 21. Flowchart of the TDO production scenario ......................................... 117
Figure 22. Effect of variation of key parameters on NPV at 8% prime interest rate 128

ix
LIST OF TABLES
Table 1. Ingredient breakdown for a new truck tire [10] ..................................... 23
Table 2. Rubber composition of scrap tires, wt% [12] ......................................... 23
Table 3. Ultimate analysis of scrap truck tires [12] ............................................. 30
Table 4. Post-consumer truck tire material [12] ................................................... 30
Table 5. Tire model for trucks with a certain carrying capacity ........................... 32
Table 6. General methods of waste tire downsizing [11] ..................................... 37
Table 7. The energy required for cleaving carbon and sulfur bonds [11] [23] .... 39
Table 8. The energy needed at different stages of tires life cycle [24] ................ 42
Table 9. Gasification conditions and products ...................................................... 44
Table 10. TDO compounds and its possible further application [2] .................... 50
Table 11. Dipentene yields from truck tires in different literature sources.......... 54
Table 12. Yield of valuable chemicals in pyrolysis process ................................. 54
Table 13. Yield of valuable chemicals in pyrolysis process (continue) ............... 54
Table 14. Liquid fraction from pyrolysis of WTT under different temperatures
[12] .......................................................................................................................
59
Table 15. Effect on reactor operating temperature on the product yields [47] .... 59
Table 16. The design basis .................................................................................... 62
Table 17. Stream names of waste truck tires recycling into limonene .................. 68
Table 18. Equipment ............................................................................................. 69
Table 19. Stream table for pyrolysis and pre-treatment processes ........................ 71
Table 20. Parameters of the distillation columns .................................................. 75
Table 21. The power requirement of the equipment ............................................. 75
Table 22. Summary of power requirement ............................................................ 77
Table 23. Individual equipment cost ..................................................................... 84
Table 24. ISBL of the base scenario ..................................................................... 86
Table 25. Other direct costs ................................................................................... 87
Table 26. Total indirect cost .................................................................................. 88
Table 27. WC and land expenses .......................................................................... 88
Table 28. Fixed operating costs ............................................................................ 91

x
Table 29. Actual fixed operating costs for the recycling facility .......................... 92
Table 30. Unit cost of utilities and DEG ............................................................... 93
Table 31. Annual cost of variable expenses for base case scenario ...................... 93
Table 32. Product selling price .............................................................................. 94
Table 33. Revenue for the base case scenario ....................................................... 90
Table 34. Key economic indicators for the base case scenario ............................. 91
Table 35. TCI for the energy recovery scenario .................................................... 100
Table 36. Operating costs ...................................................................................... 101
Table 37. Key economic indicators for the energy recovery scenario .................. 102
Table 38. TCI for the pre-treatment scenario ........................................................ 104
Table 39. Operating costs ...................................................................................... 106
Table 40. Key economic indicators for the pre-treatment scenario ...................... 108
Table 41. TCI for the crumb purchase scenario .................................................... 109
Table 42. Operating costs of the crumb purchase scenario ................................... 111
Table 43. Key economic indicators for the crumb purchase scenario .................. 113
Table 44. TCI for the TDO production scenario ................................................... 114
Table 45. Operating costs of the TDO production scenario .................................. 116
Table 46. Key economic indicators for the TDO production scenario ................. 116
Table 47. Cash flow analysis for different scenarios ............................................ 119
Table 48. The range of parameters variation in sensitivity analysis ..................... 112
Table 49. Sensitivity analysis for the base case scenario by changing the price
of the reactor system ............................................................................................
114
Table 50. Sensitivity analysis for the base case scenario by changing the price
of the distillation columns ....................................................................................
114
Table 51. Sensitivity analysis for the base case scenario by changing the price
of the operating labor ...........................................................................................
115
Table 52. Sensitivity analysis for the base case scenario by changing the price
of limonene ...........................................................................................................
115
Table 53. Sensitivity analysis for the base case scenario by changing the yield
of limonene ...........................................................................................................
115

xi
NOMENCLATURE
Abbreviation Definition
BR butadiene rubber
BT benzothiazole
CB Carbon black
CEPCI Chemical Engineering plant cost index
CSBR Conical spouted bed reactor
DCFRR Discounted cash flow rate of return
DEG Diethylene glycol
ER Equivalent ratio
EPC Engineering, procurement, and construction
FOC Fixed operating costs
FR Feeding rate
GTR Ground tire rubber
HR Heating rate
HTL Hydrothermal liquefaction
HV Heating value
IRR Internal rate of return
ISBL Inside battery limits
MBR Moving bed reactor
MBT 2-mercaptobenzothiazole
MFSP Minimum fuel selling price
NPV Net present value
NR Natural rubber
OC Operating costs
OOM Order of magnitude

xii
P Pressure
PAH Polycyclic aromatic hydrocarbons
PBP Payback period
PCT Passenger scrap tires
PFD Process flow diagram
PM2.5 Particulate matter 2.5
PN Particle number
SBR Sliding bed reactor
SC Scrap tires
SE Study estimate
SPCT Scrap car tires
SS Sample size
T Temperature
TCI Total capital investment
TDC Total direct cost
TDF Tire derived fuel
TDO Tire derived oil
TFCI Total fixed capital investment
TIC Total investment capital
TT Truck tire
USSR Union of Soviet Socialist Republics
VOC Variable operating costs
WC Working capital
WT Waste tires
WTR Waste tire rubber
WTT Waste truck tires
XBR Fixed bed reactor
XBR-FT Fixed bed reactor – fire tubes
xiii
ACKNOWLEDGEMTS
I wish to express my sincere appreciation to the members of my advisory
Committee, Dr. Michael Mann, Dr. Nickil Patel, Dr. Sean T. Hammond, and Dr. Haochi
Zheng, for their guidance and support during my time in the master’s program at the
University of North Dakota. I would also like to thank the Fulbright and Institute of
International Education, for the opportunity to study at the University of North Dakota.
Also, I would like to personally thank my family and friends for their support.

x
ABSTRACT
The main objective of this work was to develop a waste truck tires recycling
facility for the Siberian coal transportation company “SibTreid NK” in the Kemerovo
region, Russia. For years, the company has been stockpiling old scrap tires at their
warehouse or dumping them into open strip mines. Taking this into account as well as
existing environmental concerns due to the continually growing coal industry in the
Kemerovo region, it is highly necessary to make an operational facility to deal with the
large number of accumulated waste truck tires.
To achieve this goal, this project reviewed different methods and technologies
for managing scrap tires, investigated economic feasibility for the most attractive
options, and provided a list of recommendations for the company.
The current practices that “SibTreid NK” uses are dumping, landfilling, and
retreading. To address the first part of the research, the strengths and weaknesses of the
following scrap tire management techniques have been analyzed: grinding,
thermochemical conversion processes that involve incineration, hydrothermal
liquefaction, gasification, and pyrolysis, as well as existing methods.
Taking into account interests of the company in converting waste truck tires into
oil, gas, and solids, the work is primarily focused on thermochemical processes such as
pyrolysis. In total five scenarios of the pyrolytic process are considered in the study.
For each scenario I developed the flowchart diagrams. These flowcharts show the

xi
following characteristics at each stage of the recycling practices: the feedstock flow
within the company, associated expenses, and relevant emissions.
In order to determine the size of the future facility, necessary equipment,
quantity of each by-product, and to evaluate the operating costs of the project, I
analyzed the most typical size of a recycling facility used in literature. According to
various literature sources, the most appropriate size of the future facility is 30 ton/day.
As input data to the process, I used the average composition of worn out truck
tires. In this case use of averages for data is acceptable for several reasons. First, for
study purpose ±30% accuracy is admissible. Second, it helps to avoid over-
complication of the model to keep the project feasible. The final reason is the inability
to obtain the data about the composition of a particular model truck tire by a particular
brand, as this information is protected by the tire companies. Also, in articles dedicated
to tire recycling, authors usually mention proximate and ultimate analysis of raw
material, but almost never talk about whether they used a truck or a car tire or what
brand. As the result the raw material was chosen to have steel concentration of 20%.
The distribution of the byproducts on steel-free bases is adopted from the research
dedicated to the pyrolysis of truck tires and equals 35.5% for the char, 12.5% for the
gas, and 52% for the liquid fraction.
The next step of my research was to investigate the viability of the project.
Economic analysis of all five scenarios for using the pyrolysis technology has
performed, including conversion of low-value waste tires to high-value chemicals, tire
derived oil, with and without pre-treatment of the initial feedstock. Using the minimum
possible lifetime of the chemical facility (10 years) and current economic indexes of
Russia, such as revenue tax, the exchange value of the ruble, fixed operating labor costs
xii
per year, I developed a program to calculate the internal rate of return (IRR), payback
period (PBP), and net present value (NPV) of the project. The result showed that the
most economically attractive option was the base case scenario option that considered
the pre-treatment of the raw material, pyrolysis process itself, and the separation of the
tire-derived oil. The NPV was 10.39 MM$, payback period was about 3.6 years, and
IRR was 31.5%. Then I conducted the sensitivity analysis for the base case scenario. It
showed that the process is extremely sensitive to the fluctuation of the limonene yield
and limonene price.
This study could be used by the company to produce extra revenue from selling
pyrolytic by-products like steel, char, tire-derived oil, steam, and high-value chemicals.
Variable costs of the company, such as fuel expenses, can also be decreased. The results
of this work will help to mitigate a series of environmental problems caused by dumping
and stockpiling in my region and decrease the amount of emissions that otherwise
would be emitted during production of steel, char, oil, and valuable chemicals, if waste
truck tires were not recycled. Reduction of total emission will contribute to the
obligation of the Russian Federation to address climate change and, ultimately, will
have a positive impact on humans’ health in the Kemerovo region.

13
CHAPTER I: INTRODUCTION
1.1 General information about the problem
Increased attention to the environment and sustainability made recycling a more
preferable option for various waste streams, including waste rubber, than disposal of
these streams [1]. Nowadays, the growing amount of waste tres (WT) worldwide is an
important subject of research. In total, as it was estimated in [2], the total number of WT
produced in 2011 was approximately 1,500,000,000 pieces. Until recently the majority
of WT were landfilled or illegally dumped into open areas. Approximately 4 billion of
WT are landfilled or stock-pilled worldwide [3]. This type of polymeric waste causes
serious environmental and public health problems, occupies large space, and it is not
biodegradable. Disposed tires are an ideal environment for the insects breeding.
Increasing number of tire fires represents one of the major problems associated with
dumping of WT in to open areas. Tire fires contaminate such important natural objects
for humans as soil, groundwater, and air, but also this type of fire emits up to 3-4 times
more mutagenic emissions than combustion of oil, coal, wood in utility boilers [4].
Nowadays there are several options of using scrap tires (ST). Due to such
characteristics as high energy content and excellent resistance to wide range of
disturbances, WT can be reused, recycled, and disposed in an appropriate facility [5].
Taking into account such a major political and economic issue as constantly growing
energy demand worldwide and finite amount of fossil fuels resources and its unequal

14
distribution, the waste refinery concept can be considered as one of the possible
solutions to mentioned problems, especially refining of waste tires [6].
This work is focused on finding the ways of possible waste truck tires (WTT)
management at Siberian coal transportation company “SibTreid NK”. For years, the
company has been stockpiling old waste tires at their warehouse on the territory of the
company or dumping them into open strip mines. Taking this into account as well as
existing environmental concerns due to the constantly growing coal industry in Kuzbass
[7], it is highly necessary that an operational decision will be taken how to deal with
large amount of WT producing every year.
1.2 Aims and objectives
In order to achieve the aim of this study, six main objectives are defined as
follows:
Objective 1: Description of the company and the location, including general
characteristics of Kemerovo region, status of coal mining industry for Kuzbass, and
company’s profile.
Objective 2: Characterization of tires’ disposal problem in the company, analysis
of WTT life cycle within and outside the company and description of the composition
of WTT.
Objective 3: Investigation of current technologies and methods for waste tire
management.
Objective 4: Economic evaluation of the future recycling facility.
Objective 5: Carry out sensitivity analysis for the most attractive scenarios.
Objective 6: Write a list of recommendations for the company.

15
1.3 About the region and the company
Kemerovo region is located in the south-west of Siberian Federal District,
Russia. The total area of the region is 95,500 square kilometers (36,900 sq mi). Relative
to most other nations, Russia has very large coal reserves. In the territory of Kemerovo
region (or Kuzbass), the Kuznetsk coal basin is located. The Kuznetsk coal basin is
considered as one of the major coal fields in Russia.
Since the collapse of the USSR, coal production has increased dramatically from
124 mln t in 1991 to 241.5 mln t of coal in 2017. Today the share of Kuzbass is over
50% in domestically produced coal and over 80% of coking coal. About 40% of the coal
is exported to more than 40 countries; this is over 80% of the national export of coal [7].
Most Russian coking coal is mined in the Kuznetsk Basin and used in coke production
[8].
Company “SibTreid NK” is located in Novokuznetsk agglomeration (Talgino
town) in the south of Kemerovo region where underground and opencast mines are
located in all urban and municipal areas. “SibTreid” is one of the major transportation
companies in Kemerovo region. Its’ main activities are:
1) Repair and maintenance of the dump trucks BelAZ (Belorussia);
2) Spare parts for BelAZ dump trucks with carrying capacity from 50 to 220 tons;
3) Transportation of coal and overburden.
This work is focused on the management of by-product of the third activity -
waste truck tires. “Transportation of coal and overburden” is carried out by “SibTreid
NK” sub-company “Region 42”. This company is fully responsible for the organization
and implementation of transport operations in the mining industry of Kemerovo region.

16
Capacity and characteristics of “Region 42”. The company has been operating
since 2006. Besides transportation service 24/7, “Region 42” provides constant
technical support, and repair service for both BelAZ trucks itself and their tires. "Region
42" has a constantly growing vehicles fleet. The company mostly uses BelAZ trucks of
55-, 120- and 220-ton carrying capacity. Nowadays the total number of 55- and 120/220-
ton trucks is 300 and 200 respectively. Due to the expansion of coal production in
Kuzbass, the company is going through replacement of its 55-trucks to larger capacity
120- and 220-ton trucks. All these dumps trucks daily serve 11 the largest open coal
strip mines of Kuzbass: “Zarechnij’, “Kamyshanskiy”, “Maiskiy”, “Yuzhnyy 1”,
“Yuzhnyy 2”, “Coke Section”, “Belovskaya”, “TD Sibir 3”, “TD Sibir 5”,
“Energougol”, and open strip mine “Taldinskij” (Figure 1).
Figure 1. Map of coal strip mines

17
1.4 Description of the problem
Since the beginning of the company functioning, all waste tires were either
stored on the territory of the company or illegally buried in strip mines. Due to the
building of the tires repair facility in 2012, the total number of waste truck tires per
month (and per year) has been considerably reduced but not completely eliminated.
Because there is no waste tire recycling facility on the territory of the company
or in Kuzbass, the constantly growing number of waste truck tires will eventually enter
the waste stream representing a major potential waste and environmental problem.
According to the company data, the exact total number of accumulated waste
truck tires is currently unknown for lack of the necessity to count it. An approximate
number of waste truck tires inflow is 2 tires per day, the approximate quantity of waste
tires on the company warehouse is many hundreds among them mostly from 120- and
220-ton trucks. The number of buried tires is many thousands. Fortunately, the cost of
their transportation to the company could be considered free as they are transported with
trucks which are needed the tire's service.
There are two types of worn out tires used in this work. The first type is partially
worn out tire that can be retreaded at the company’s facility and then used by the
company in its original purpose. The second type of used tires is "waste" or "scrap"
truck tire that cannot be retreated by the company and reused in the coal transportation
sector. Dealing with the second type of worn out tires is the main focus of this project.
The simplified scheme of truck tires life cycle within the company “SibTreidNK”
including several blocks “outside” the company (raw material extraction stage,
preparation of used tires by the third party, collecting of tires by the third party to reuse)
is shown in Figure 2 (adapted from [9]).

18
Figu
re 2
. The
sim
plifi
ed li
fe c
ycle
of t
ruck
tire
s at "
SibT
reid
NK

19
CHAPTER II: METHODOLOGY
The possible solution of the presented problem can be achieved by dividing the
problem into three parts as shown in Figure 3. All these should be accomplished in the
order shown in the figure. However, all of them are connected between each other.
The first part includes the description of the problem in general in order to
explain why it is important to deal with problems. Also, this chapter shows what are the
aims that should be achieved to develop a decision. Finally, the last component of the
first part is to describe the region where the future facility should be built in and the
company itself. The description of the company includes the trucks the company uses,
their quantity, what is the geography of the company, what types of the tires the
company uses, and what is the tire disposal rate. This data is necessary for the further
development of the recycling facility.
The second part includes the description of possible solutions of the problems,
the description of the current methods used by the company to deal with the problem of
disposal, and analysis of the raw material. The composition of the raw material is
analyzed by using other research dealing specifically with the truck tires due to the
inability to get a composition of all tires used by the company. The description of the
various methods to deal with scrap truck tires is used in the third part of the research to
choose the most applicable technology from maturity and company points of view. Later
the most applicable technology, in the framework of this study the most applicable
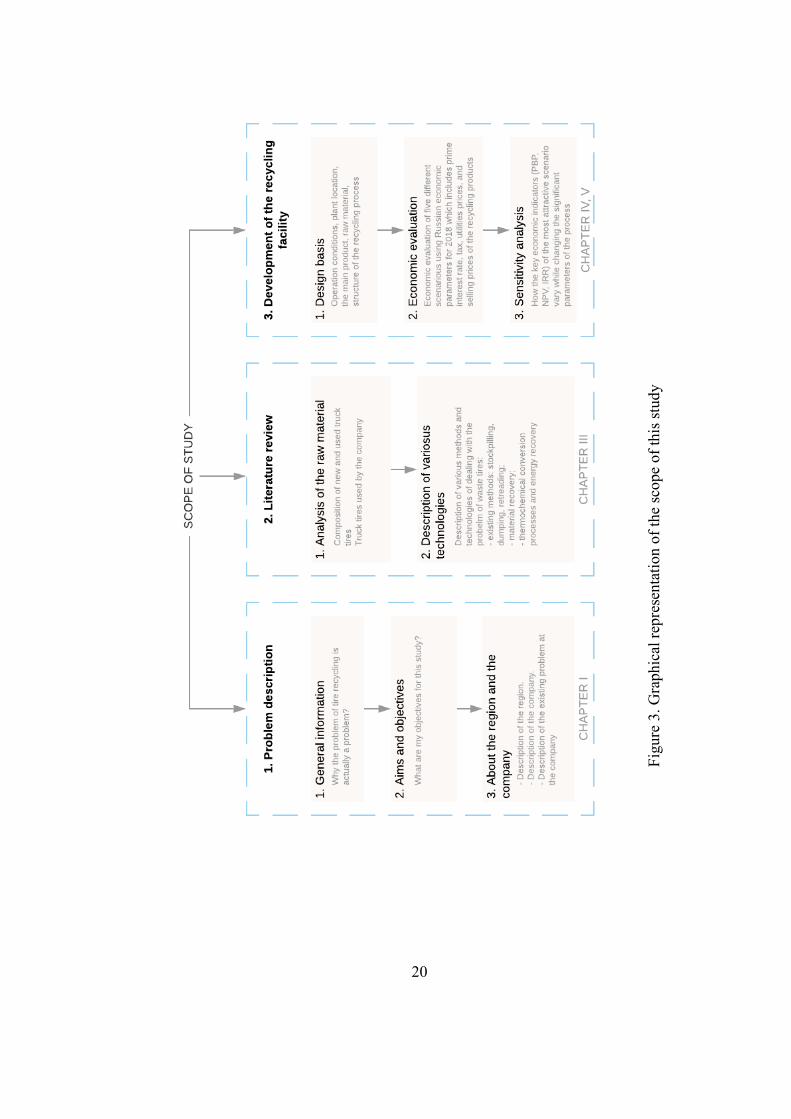
20
Figu
re 3
. Gra
phic
al re
pres
enta
tion
of th
e sc
ope
of th
is stu
dy

21
technology is pyrolysis treatment with further recovery of limonene, is used to generate
possible solutions of the problem that later would be analyzed for economic feasibility.
The third part includes the development of the future facility, economic
evaluation of the different scenarios, and conducting of the sensitivity analysis for the
most attractive option from the economic perspective of view. The development of the
future facility implies the description of working conditions, size of the facility, defining
of the targeted chemical, identification of the byproducts that later can be sold and create
extra revenue source for the company. In the economic evaluation of the system, I
defined the accuracy of the evaluation, the base year, the economic parameters of Russia
for the base year, the price of utilities of the Kemerovo region, and other costs. The costs
of the equipment are adjusted by using the CEPCI values. Five possible scenarios for
the pyrolysis process was developed. Each of this process is described in the fifth
chapter of the research. The profitability analysis is done by using the discounted cash
flow rate of return method using the prime interest of the Russian Federation for 2018.
In the economic analysis I used the least possible lifetime of the project. The
depreciation of the equipment is linear with zero salvage value at the end of the lifetime.
The key economic indicators that define the attractiveness of each scenario are payback
period, net present value, and internal rate of return.
After defining the most attractive option, I used the first-order sensitivity
analysis to check how the variation of the critical parameters affect the key economic
parameters.
22
CHAPTER III: LITERATURE REVIEW
Overview of the chapter
This chapter describes the composition of truck tires and waste truck tires, what
tires are used by the company. Also, in this chapter various methods of dealing with
waste truck tires are described.
3.1 Tire composition and truck tire brands used by the company
Before analyzing the various methods of scrap truck tires treatment, it is helpful
to know the composition of the material forming the tire and structure of the tire. Tires
are very complex product of engineering activity. In total there seven key parts of truck
tire: the inner liner, carcass, bead, sidewall, belts, undertread, and tread. Being
engineered over several decades, tires are able to withstand the stresses and at the same
time travel for a long distance before retreading or replacement.
The composition of tires varies significantly because of the different types of
applications [6]. Tire consists of different types of carbon black, different types of
rubber, steel cords and fabric for reinforcement, fillers like clay, silica, and minerals or
chemicals to allow or accelerate vulcanization [2], [10-14]. The amount of
reinforcement layers depends on tire type. Usually, truck tires require more steel.
The proportion of each compound depends on the tire application, for instance
composition of motorcycle, car, and truck tires are different [6], and on the
manufacturing company. Also, it is worthwhile to mention, each company has its own
way to make tires which is considered as company’s intellectual property and usually is

23
not in open access, however the ingredients that are mainly used in tire manufacturing
are the same (Table 1).
Table 1. Ingredient breakdown for a new truck tire [10]
Material Truck tire (%)
Natural rubber 27
Synthetic rubber 14
Fillers (carbon black, silica) 26-28
Plasticizers (oil, resin) 5-6
Chemical additives 5-6
Metal for reinforcement 25
Textile for reinforcement -
In tire manufacturing two types of rubber are used: natural and synthetic [10].
Thermal stability and high mechanical resistance are the benefits of using natural rubber
(NR). Synthetic rubber (SB) derived from oil enables resistance to mechanical
deformations. SB is found in a form of styrene-butadiene (SBR) and butadiene rubbers
(BR) [10]. The difference in car and truck tire scrap rubber composition according to
Ucar in [12] is given in Table 2. These differences will be important when the potential
methods of treating the tires. For example, Ucar showed that oil yield from WTT can be
7-8% higher than oil yield from scrap passenger car tires (SPCT) due to the higher NR
content.
Table 2. Rubber composition of scrap tires, wt% [12]
SPCT (car) TT (truck)
Natural rubber (NR) 35 51
Styrene butadiene rubber
(SBR)
- 39
Butadiene rubber (BR) 65 10

24
Therefore, the key prior to any treatment of scrap tire is understanding of the
initial material properties. The proximate and ultimate analysis of truck scrap tires
containing no steel and textile are shown in Table 3 [12].
Table 3. Ultimate analysis of scrap truck tires [12]
Proximate analysis Truck tire (wt%)
Moisture 0.82 - 1.40
Volatile matter 62.7 - 66.10
Fixed Carbon 27.50 - 32.31
Ash 4.17 - 5.00
Ultimate analysis Truck tire (dry, %)
C 80.30 - 83.20
H 7.18 - 7.70
N 0.5 - 1.50
O (calculated from difference) 6.16 – 10.8
S 1.19 - 1.44
Gross calorific value, MJ/kg 33.3-34.4
The composition of a waste truck tire is different from the new one (
Table 4). The main reasons are:
- Treadwear during operation. This increased share of non-rubber components
(metals and others);
- Crumb rubber of STT incorporates contamination of metals and fibers;
- Crumb rubber includes the rubber/elastomers, carbon black, the sulphur, the
“additives” and most of the zinc oxide;
- Unavoidably, a small share of rubber materials adheres to the metal.
25
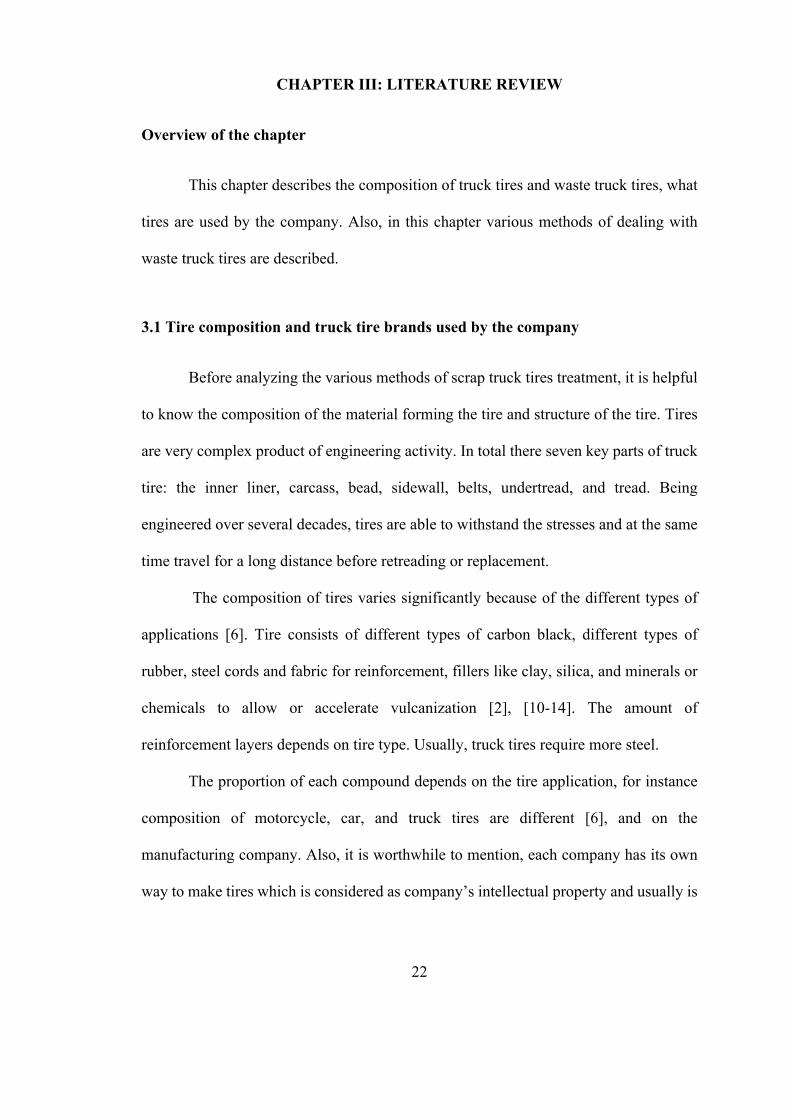
Table 4. Post-consumer truck tire material [12]
Product yield WTT (%)
Crumb rubber 70
Metal 27
Fiber & Scrap 3
The company uses three brands of truck tires: Micheline, Bridgestone, and
BELMASH (Belorussia). Table 5 represents which tire models truck with a particular
carrying capacity uses from each of the mentioned brands and how much tires are
required. This information will be necessary to make an approximate estimation of raw
material feedstock.
Knowledge about the waste rubber tires available is essential to decide the size
of the future facility as well as the type of disposal method. “Region 42” does not have
data about tire models the company uses and in which quantity. Also, there is no precise
information about amount and size of tires stored in the company’s warehouse or buried
in strip mines. Therefore, in this project average values for truck tires composition, and
weight will be used.
As can be noticed from

26
, tires for a truck with certain carrying capacity are almost the same in terms of
weight and size. Taking this into account, the following mean tire’s weight values will
be used:
1. 794 kg (1750 lbs) for a truck with carrying capacity 55 tons.
2. 1860 kg (4100 lbs) for a truck with carrying capacity 120 tons.
3. 3874 kg (8540 lbs) for a truck with carrying capacity 220 tons.

27
№
Ca
rryi
ng
capa
city
, ton
BeLA
Z
truck
mod
el
Num
ber o
f
tires
Mod
el o
f
tires
Brid
gesto
ne
Mic
helin
BE
LSH
INA
1 55
75
55A
7555
B
7555
D
7555
E
6 24
.00-
35
VRL
S E4
E2A
TL
1. W
eigh
t, kg
(lbs
):
748.
5 (1
930)
Dia
met
er, m
(inc
h):
2.2
(86.
4)
2. W
eigh
t, kg
(lbs
):
875.
4 (1
930)
Dia
met
er, m
(inc
h):
2.2
(86.
4)
3. W
eigh
t, kg
(lbs
):
775.
6 (1
710)
Dia
met
er, m
(inc
h):
2.16
(85.
6)
XD
T A
E4T
1. W
eigh
t, kg
(lbs
):
748.
5 (1
650)
Dia
met
er, m
(inc
h):
2 (8
1.18
)
2. W
eigh
t, kg
(lbs
):
774
(170
5)
Dia
met
er, m
(inc
h):
2.16
(85.
1)
3. W
eigh
t, kg
(lbs
):
839
(185
0)
Dia
met
er, m
(inc
h):
2.15
(84.
9)
FBEL
-150
E4
TL
1. W
eigh
t, kg
(lbs
):
743.
9 (1
640)
Dia
met
er, m
(inc
h):
2.18
(86.
6)
Tabl
e 5.
Tire
mod
el fo
r tru
cks w
ith a
cer
tain
car
ryin
g ca
paci
ty

28
№
Carr
ying
capa
city
, ton
BeLA
Z
truck
mod
el
Num
ber o
f
tires
Mod
el o
f
tires
Brid
gesto
ne
Mic
helin
BE
LSH
INA
1 55
75
55A
7555
B
7555
D
7555
E
6 24
.00-
35
Dia
met
er, m
(inc
h):
2.16
(85.
6)
5. W
eigh
t, kg
(lbs
):
784.
7 (1
730)
Dia
met
er, m
(inc
h):
2.1
(85.
4)
Dia
met
er, m
(inc
h):
2.16
(85.
1)
5. W
eigh
t, kg
(lbs
):
748
(165
0)
Dia
met
er, m
(inc
h):
2 (8
1.18
)
FBEL
-150
E4
TL
1. W
eigh
t, kg
(lbs
):
743.
9 (1
640)
Dia
met
er, m
(inc
h):
2.18
(86.
6)
2 12
0 75
14
7514
1
7514
5
6 33
.00-
51
Wei
ght,
kg (l
bs):
1723
(380
0)
XD
T B
E4 T
L
1. D
iam
eter
, m (i
nch)
:
3.0
(119
)
FT11
6AM
2 E4
TL
1. W
eigh
t, kg
(lbs
):
1995
(440
0)
Dia
met
er, m
(inc
h):
3.02
(119
.8)
3 22
0 75
302
7530
6
6 40
.00R
57;
46/9
0-57
VRD
P E4
E2A
1. W
eigh
t, kg
(lbs
):
3874
(854
0)
Dia
met
er, m
(inc
h):
3.55
(140
)
XD
R2 B
4 E4
TL
1. D
iam
eter
, m (i
nch)
:
3.55
(140
.9)
Tabl
e 5.
cont
.

29
3.2 Technology analysis
In this chapter the advantages, disadvantages, and characteristics of the
following techniques will be described: landfilling and dumping, retreading, grinding,
and thermochemical conversion processes that involves incineration, hydrothermal
liquefaction, gasification, and pyrolysis.
3.2.1 Stockpiling, landfilling and dumping into open areas
Landfilling is one of the least desirable options of managing scrap tires (ST) due
to countless environmental and humans’ health problems. Even though the tire itself is
not treated somehow this practice cannot be considered as environmentally neutral [9].
Although, this practice is unsustainable and is a waste of potentially valuable raw
material, landfilling is straightforward to implement, easy to achieve and does not
require any additional capital investment from a company. Stockpiling of waste truck
tires (WTT) is even worse than landfilling because of necessity to build depots. Other
than that, this practice is easy to achieve and cheaper option to deal with ST from capital
investment perspective than techniques which will be discussed below. Together with
stockpiling, landfilling and dumping are the current WTT managing techniques used by
“SibTreidNK."
Another type of landfilling that can be used for WTT disposal is monofilling.
This technique can be considered as more desirable one, as monofills could be used as
tire collection sites and distribution centers in the future [9].
The implications of stockpiling, landfilling and dumping.

30
1. As already mentioned before, landfilling and stockpiling is a waste of
potentially valuable raw materials [14]. WTT can be used as a construction material,
chemical feedstock, and energy source due to the high energy density of 29-37 MJ per
kg [15].
2. Tires are difficult to degrade. Preparation of the tire to be naturally destroyed
takes more than 100 years. The complex chemical composition, construction features of
tires, and vulcanization contribute to creating elastic and at the same time an extremely
resistant product to abrasion and water, exposure to chemicals, heat, electricity, actions
of microorganisms and the physical impacts. Each material constituent like carbon
black, natural and synthetic rubbers, steel, fabrics, silica, various organic and inorganic
compounds, curing compounds promote longer life and particular characteristics to the
final product. The proportions of compounds might vary from one brand to another. The
final quality and longevity of wear life of the product are correlated with the initial
composition [16] [10].
3. As a result of the previous point, ST could occupy a large amount of land.
Nearly 75 % of total tire volume is void space. The amount of space occupied during
landfilling and stockpiling of the whole tires cannot be reduced due to relative
incompressibility of tires. This characteristic is achieved during the vulcanization
process, adhesion of the fabrics to the rubber and steel to the structural components of
tires belts, and the total number of layers [10] [17]. According to the [17], the total
number of fabric layers and steel bed wire in truck tires could be up to 40.
4. Waste tires are a suitable environment for pests, rodents, mosquitos, and other
insects breeding that spread contagious and various diseases [10] [18]. The tires’ shape
and impermeability tend to hold water for long periods while providing an ideal

31
breeding environment. In addition, stockpiling could potentially introduce invasive
species to the region if used tires are imported to the area from other countries. These new
species could be more difficult to control and spread the non-usual disease for the particular
area.[17]
5. Contamination of soil and water by leaching [19]. Even though tires are a slow
degradable material, they are still degradable. The rate of leaching depends on the size
of tires. More fine crumbed tires or metal pieces are more toxic than the whole tires due
to the higher contact surface. Leaching of metals and other materials are eco-toxic for
the environment. The compounds used in tire manufacturing are benzothiazole (BT) and
BT derivatives as 3-methyl-1, 2-benzisothiazole, 2(3H)-benzothiazolone, 2-
mercaptobenzothiazole, 2,2-dithiobisbenzothiazole, etc. also are commonly found in
wastewaters derived from rubber additives manufacturing and in leaching at landfills.
These compounds are poorly degradable, and some of them are toxic. In [20] authors
showed that benzothiazole and 2-mercaptobenzothiazole (MBT) have toxic effects to
fish and bacteria with other microorganisms respectively.
6. Potential of uncontrolled fire which is very difficult to extinguish due to high
energy density of material (in some cases higher than coal) and 75% of void space in a
whole waste tire which makes it difficult to cut off access to the air or to quench the fire
with water [15][17]. The tire fire emits a dense smoke plume with an acrid and irritating
odor, releases pyrolytic oil to the environment, hazardous emissions to the atmosphere
which reflects the chemical composition of tires. As have been noticed in [15], during
the landfill fire in Iowa City in 2002 when approximately 1.3 million WT were burned
tires, the concentration of CO, CO2, SO2, particle number (PN), fine particulate (PM2.5)
mass, elemental carbon (EC), and polycyclic aromatic hydrocarbons (PAH) were

32
significantly increased. In [15] authors also found out that PM2.5 from tire combustion
could contain PAH with nitrogen heteroatoms and picene. Pollutions from tire burning
are toxic, carcinogenic, and mutagenic; together, they present significant health hazards
[15] [21]. The total amount of mutagenic emission from tire fire is up to 3-4 times bigger
than from combustion of coal, oil, and wood in utility boilers [4]. The generalized
process flowchart is shown in Figure 4. The diagram also includes environmental and
economic flows for the process.
Figure 4. Flowchart of stockpiling/ dumping of WTT together with economic and
pollution flows
33
3.2.2 Retreading and recovery
The process of replacement of the outer layer of the used tire with a new rubber
layer by vulcanization is called retreading [10]. Retreading is a very efficient method to
save energy on the production of a new tire. The amount of used energy is 2.3 times less
to retread the used tire than to produce a new one. This technique is an efficient way to
save resources on the production of the new tires, thereby cutting the worldwide tire
manufacturing emissions. Installation of truck tires retreading equipment can
significantly reduce the operating costs of the companies as truck tires can be retreaded
three to four times [9][10].
Within the framework of this project, retreading as a separate technology is not
described because it is already set up by the company. Therefore, the technology is not
discussed in further detail. Retreading will be taken into account during the development
of recycling facility model as essential part of the system that affects the flow of raw
material, in our case the flow of WTT in the company.
3.2.3 Material recovery
3.2.3.1 Reuse of whole tires
Due to WTT physical characteristics they can be used as an artificial reef,
playground equipment, erosion control, highway crash barriers, breakwaters and
floatation, noise barriers, and bales [7], [8], [11], [16].

34
3.2.3.2 Grinding
As have been mentioned before, WTT are resistant to mildew, heat, moisture,
sunlight, bacterial growth, oils, acids; ST have good elastic and impact-protected
properties. All of these make WTT suitable for use in civil infrastructure projects [10],
[16]. The reuse application of ground tires closely relates to the tire’s particle size [17].
Rubber chips (pieces about 20-50 mm) are commonly used in drainage and
insulation [16].
Rubber granules (particles of about 0.8-20 mm) are typically used in solid
wheels, livestock mattresses, floor tiles, roofing materials, vibration, articles for road
marking, asphalt, sports flooring, rubber asphalt, curbs, road barriers, and crash cushions
[16].
Rubber powder (particles less than 0.8 mm) can be used as a compound to mix
with virgin material. For instance in road construction, waterproofing agent, paint,
spray, sports facilities, cables, automobile parts, etc. [16] The final physical quality of
the produced rubber is significantly reduced in comparison with a virgin rubber [17].
WTT downsizing is a technologically sophisticated process. It requires
specialized equipment which can shred and grid to a required size [11]. In conjunction
the with grinding process, removing of the textile and steel is carried out. Pneumatic
separators are used to remove textile from WTT, and the electromagnetic separator is
necessary to remove steel [22].
The general scheme of ST downsizing consists of shredding, separation,
granulation, and classification [23]. Also, in some cases before grinding to smaller
particles, the tire should be cut into smaller pieces [23].
There are several different types of grinding:

35
1. Mechanical grinding.
The process takes place at ambient temperature [10]. Equipment includes
shredder, mills, knife granulators, and rolling mills with ribbed rollers. The system is
set up in a way that grinding will repeat till the necessary size of particles is obtained
[24]. The minimum size of particles that one can get is 0.2 - 0.3 mm with very rough
surface [23]. Steel and textile are taken out with separator and electromagnetic
equipment respectively.
Disadvantages: temperature during the process could increase to 130 °C and can
cause oxidation of the rubber particles. To prevent spontaneous combustion of the
process line, additional cooling mechanism of the crumb rubber should be implemented
[10], [11], [22].
2. Cryogenic grinding.
First, waste tires are cooled below its glass transition temperature to -80- (-100)
°C in liquid nitrogen to get hard and relatively brittle "glassy" tires. Second, frozen waste
tires are crushed down into small particles following which steel and textile are removed
in the same way as in mechanical grinding. The final size of particles is less than 50 mm
and with a smooth surface [10]. Cooling of the rubber up to -80°C reduces the energy
needed for grinding. Additionally, the removed steel and fiber are "cleaner" in the
cryogenic process due to the absence of oxidation and the surface/mass ratio [23]. Grains
obtained in this method have a smooth surface and sharp edges [24].
Disadvantages: the use of liquid nitrogen makes operational cost very high. To
reduce nitrogen consumption, the liquid nitrogen can be replaced with a compressor
system [10]. Another disadvantage is the presence of moisture in particles and the
necessity to dry them before the extraction of textile and steel [10], [11].

36
3. Wet grinding.
This process uses pre-shredded waste tires [10]. The rubber granulate obtained
by this method is treated with stationary and moving grindstones [24]. Water is used to
cool the product and the system. The final product is very fine rubber dust with the grain
size of 10-20 µm, large specific grain area and with a low level of granulate degradation
[10], [11]. Recycled rubber could be used as a filler to rubber mixtures where high
quality of the end material is necessary, for instance in tire's manufacturer [24].
Disadvantages: this method requires shredding of tires before grinding and
drying of final particles [11].
4. Water-jet grinding.
This method was developed to recycle highly resistant and large size tires [24].
Waste tires are shredded into narrow strips by the jet of water with high velocity and
pressure (> 2000 bar) [10]. This process is environmentally-friendly, less energy
intensive than other processes, has low noise pollutions, and does not generate other
pollutants [10]. The final ground rubber is of a high degree of purity because only rubber
is ground while steel banding is remaining unaffected [24].
Disadvantages: this method requires high pressure and trained personnel [10],
[11].
5. Berstoff’s method.
This method is considered as an improved version of mechanical grinding [24].
Waste tires are shredded by a rolling mill equipped with ribbed rollers and a twin-screw
extruder. The process consists of three steps: 1) removing of the steel parts and cutting
tires in a knife mill into 85´50 mm pieces; 2) further processing of the particles in ribbed
rolling mills into 6 mm size pieces, additional removing the steel and textile cord from

37
the particles; 3) further downsizing of the particles in twin-screw extruders [24]. The
final particles are irregular-shaped, dust size, with a large specific area and low humidity
[10].
The summary table of all popular grinding methods with a short description,
advantages, and disadvantages is represented below (Table 6 ).
Table 6. General methods of waste tire downsizing [11]
Method Description Advantages Disadvantages
Mechanical
grinding
• Particles size: 0.2 - 0.3 mm
with rough surface.
• Repeating grinding with
shredder, mills, knife
granulators, and rolling mills
with ribbed rollers.
• High surface area and volume
ratio.
• Oxidation of the rubber particles.
• Temperature could increase to 130
°C.
• The necessity to introduce cooling
mechanism into the system.
Cryogenic
grinding
• Particles size: 50 mm with a
smooth surface and sharp edges.
• Tires are cooled down to a
glass transition temperature and
then crushed down into small
particles.
• No surface oxidation of
granulates.
• Cleaner granulates.
• High operating costs.
• Moisture in particles.
Wet grinding • Particles size: 10-20 µm.
• The rubber granulate is
treated by mills with stationary
and moving grindstones.
• High surface area and volume
ratio.
• Low granulate degradation.
• The necessity of pre-treatment.
• Drying step of shredded tires.
Water-jet
grinding • Tires are shredded into
narrow strips.
• For large tires.
• Use of high pressure (>2000
bar) and velocity water jet.
• Recycled rubber has high
purity.
• Environmentally safe.
• Low noise pollution.
• Low energy consumption.
• Requires high pressure.
• Requires trained staff.
Berstoff’s
method • Dust size particles.
• Steel removing, first cutting.
• Further downsizing of the
particles in ribbed rolling mills.
• Twin screw extruders.
• Low humidity content in
particles.
• Large specific area.

38
3.2.3.3 Rubber reclaiming or devulcanization
In addition to reuse of whole WTT and grinding them, another common type of
material recovery technology exists which is devulcanization and reclaiming [14]. Prior
to the description of devulcanization and reclaiming, the brief outline of the
vulcanization process is given below.
The vulcanization process is used to cross-link polymer chains that have been
formed in the desired shape, in our case the shape of the tire, to get an elastic and at the
same time a final product resistant to physical impacts. The most common material used
in vulcanization is sulfur. Utilization of sulfur helps to create a bridge between large
chains of the polymer, linking them together in a fixed pattern [17].
The necessity for reclaiming natural rubber was caused by the scarcity and price
of the natural rubber. Any rubber products including ground tire rubber (GTR) can be
used as a source for reclaiming and devulcanization [10]. Devulcanization and
reclamation degrade the properties of GTR, therefore, the quality of devulcanized and
reclaimed rubber, in general, is lower than of a virgin material [24], however, there are
some advantages of using reclaimed and devulcanized rubber: lower energy
consumption, lower heat generation, shorter mixing time, faster extrusion, and reduced
variable costs [10].
Reclamation is decomposition of carbon-carbon bonds to reduce the total
molecular weight and to achieve plasticity of the rubber. Devulcanization is breaking
down of sulfur-sulfur and carbon-sulfur bonds of the three-dimensional structure formed
during the vulcanization process. Scission of the main chain and crosslink bonds
happens on the surface; therefore, the core remains three dimensional. The schematic
picture of the process is shown in Figure 5 [11].

39
During the reactions, it is impossible to specify which bond you want to cleave,
and always these two reactions occur simultaneously.
Figure 5. Schematic representation of reclamation and devulcanization
The energy needed for the reactions is shown in Table 7. As can be noticed from
the table, the energy required for the reclamation is higher than for the vulcanization.
Table 7. The energy required for cleaving carbon and sulfur bonds [11] [23]
Type of bond Energy required for cleavage (kJ/mol)
C-C (reclamation) 348
C-S-C (devulcanization) 273
C-S-S-C (devulcanization) 227
C-Sx-C (devulcanization) 251
In total there are four processes of reclaiming and devulcanization. All of them
are shown in Figure 6 [11].

40
Figure 6. Overview of rubber reclaiming and devulcanization processes.
3.2.4 Thermochemical conversion processes and energy recovery
These processes are used to produce chemicals or to recover energy from WTT
feedstock. Thermochemical conversion and energy recovery can be divided into
combustion (incineration), hydrothermal liquefaction (HTL), pyrolysis and gasification
[10].
3.2.4.1 Combustion (incineration)
Due to the high heating value of 32.6 MJ/kg, which is higher than coal (30
MJ/kg), waste tires could be used as a fuel in the incinerators, especially for high energy-
consuming industries such as cement, and power generation.

41
Figure 7. The market distribution of TDF (use of tires as a direct energy source) in the
USA for the year 1996
In incineration, shredded tires as well as full-size tires can be used, for example
in cement kilns [10], [11]. Use of the whole tire requires a temperature above 1200°C
to ensure the complete combustion [11]. Besides the cement industry ST incineration
can be used in industrial and utility boilers, lime kilns, pulp and paper mills, and waste-
to-energy[25]. Figure 7 shows the use of tires as a direct energy source in the USA in
1996 [15].
The burning of tires instead of coal is more environmentally friendly, and it emits
less pollutions [14]. Among disadvantages of waste tires combustion are a large capital
investment, necessity for flue-gas cleaning, and relatively high operating cost [14].
Moreover, according to [24] energy recovery through scrap tires combustion is not the
most desirable option because only 30-38% of the energy that was initially invested in
the tire production could be recovered. In Table 8 the energy balance for different stages
of tires’ life cycle is demonstrated.
1%4%
10%
30%
23%
19%
13%
1
2
3
4
5
6
7
Dedicated tire to energy plants Waste to energy plants
Industrial boile
Cement kilns
Utility boilers Pulp and paper mills
Lime kilns

42
Table 8. The energy needed at different stages of tires life cycle [24]
Stage of the life cycle Amount of energy
required
Amount of energy required to produce a tire 87-115 MJ/kg
Amount of energy required to produce rubber goods 80-90 MJ/kg
Amount of energy obtained from the combustion of tires 32 MJ/kg
Amount of energy needed to grind tires to grain size <
1.5 mm
1.8-4.3 MJ/kg
One option for waste tire incineration is co-combustion with coal, which not only
helps to utilize scrap tires and recover energy stored in tires but also to reduce air
pollution and increase the thermal efficiency of boilers and furnaces [10]. The co-firing
of coal with tire rubber in [26] in a pilot plant with the total capacity of 80kW showed
pollution reduction up to 80% including reduction of NOx.
Examples of co-incineration of coal and scrap tires.
1. South Africa. The total percentage of recycled rubber is about 6% [27].
2. The cement manufacturing company Pretoria Portland Cement Limited (PPC
Ltd). Partial use of ST in their plant in De Hoek in the Western Cape (PPC
Ltd, 2014) [27].
The relatively small use of ST in the co-combustion process creates the necessity
to find other ways to utilize ST, conversion into high-value chemicals for instance.
3.2.4.2 Hydrothermal liquefaction (HTL)
The final product of HTL is bio-oil. The process is usually carried out at
subcritical water conditions and high pressure around 200-300 bar [28]. The favorable
feedstock is wet or lignocellulosic material [5]. The maximum amount of oil obtained

43
during HTL of scrap tires using a stainless-steel batch reactor was 52.73 wt % with a
heating value of approximately 45 MJ/kg at 400 °C [29].
Advantages:
1. There is no necessity to dry the feedstock before.
2. Relatively high yields of liquid fuel [10].
Disadvantages:
1. Poor quality of final oil for transportation compared to diesel. The fuel can be
improved by application of upgrading technologies such as separation,
hydrogenation/hydrotreating, catalytic cracking, and hybrid processes.
2. The process requires expensive equipment because of high pressure [10].
3. Even though in [29] was shown that scrap tires could be effectively converted
into liquid fuel in sub- and supercritical water without catalysts, a limited number of
research in this area makes it high risk for implementation on a real project like "Region
42” [10].
3.2.4.3 Gasification
Gasification is reduced air combustion of carbonaceous materials into a mixture
of combustible gases called syngas (CH4, C2 H6, H2, CO, CO2, O2), tar, chars.
Gasification is not a common technology to deal with scrap tires, and therefore just a
few studies have been done using scrap tires gasification [10]. Reactors that can be used
in gasification are fixed bed, fluidized bed, and entrained bed reactors. In general, yield
increases with increasing the process temperature. The quality and amount of syngas
depend on other parameters of the process. Among these parameters are the equivalence

44
ratio (ER), tire feed rate, feedstock properties, particle size, type of oxidizer, gasifier,
and steam/ tire ration [10].
In Table 9 some examples of different gasification technologies to recycle ST
are demonstrated.
Table 9. Gasification conditions and products
Gasifier type Initial conditions Results
Fluidized bed
reactor
Particles size: 3 mm
diameter and 5 mm
length.
Temperature: 900–
1060 K with steam.
The increase in the temperature caused
an increase in gas yield and decrease of
syngas heating value — the highest gas
yield among other reactors.
Heating value (HV) range: 39.6 to 22.2
MJ/m3.
Yield range: 0.21 to 0.76 m3/ kg [30].
Particles size: tire
powder with
diameters 0.4, 0.9,
and 2.1 mm.
Temperature range:
350-900°C.
Operational parameters of the reactor
and particle size the most important
parameters to increase the gas yield.
HV of syngas was 6MJ/m3 under the
highest yield rate of 11 m3/h.
Products: gas mainly contained CO, H2,
CH4, C2H6, and longer chain
hydrocarbon.
Char yield: 24-37%.
Oil yield: 0-37% [31].
Particles size: 0.3
mm.
Temperature range:
400-800°C.
Equivalence ratio
(ER): 0.2–0.6
The yield of syngas and heating value
increased with temperature increase and
ER increase. Gas yield at 700°C was
5.5% higher when ER value was
increased from 0.2 to 0.6, and the
amount of carbon black decreased from
600 to 450 g/kg.

45
Table 9. cont.
Gasifier type Initial conditions Results
Fluidized bed
reactor
Particles size: 0.3
mm.
Temperature range:
400-800°C.
Equivalence ratio
(ER): 0.2–0.6
The yield of carbon black decreased with
the increase of temperature or ER.
The most suitable conditions for tire
gasification: ER – 0.2-0.4; temperature –
650-700 °C. In this case, yield was 1.8–
3.7 Nm3/kg, HV was 4000–9000
kJ/Nm3 [32].
Particles size: 2 mm
in diameter.
Bottom heater
temperature: 790 and
820 °C.
Top heater
temperature: 720 and
740 °C.
The heating value of the syngas depends
on the agent one use during the process.
The HV air/CO2, air/steam and steam
agents were 9.59, 7.34 and 15.21
MJ/Nm3, respectively.[33]
Particles size: 0.25-
1.2 mm
Sample weight: 0.3 –
2.0 g
Temperature range:
850-1000°C.
CO2 pressure range:
0.3-1.0 atm.
The reaction is independent of char sizes
less than 0.65 mm and mass less than
1.0g. [34]
Particle size: 2 mm. Syngas had high H2, CH4 and C2H6
content [35].
Thermobalance
reactor
Particle size: 1–2 cm
from cold mechanical
grinding
Increasing of ER increased CO and H2
content in syngas [36]
Table 9. cont.

46
Gasifier type Initial conditions Results
Thermobalance
reactor
Mass flow rate: 3 kg/
hour.
Temperature: 850 °C.
Rotary Kiln Particle size: 2 mm. Syngas had high H2, CH4 and C2H6
content [35].
Particle size: 1–2 cm
from cold mechanical
grinding
Mass flow rate: 3 kg/
hour.
Temperature: 850 °C.
Increasing of ER increased CO and H2
content in syngas [36]
3.2.4.4 Pyrolysis
According to [14], pyrolysis has a promising future compared to other available
recycling options. It is also considered as an environmentally friendly process of ST
recycling [37]. Pyrolysis is the process of decomposing the rubber component in the
presence of heat and the absence of oxygen [11]. Pyrolysis breaks down the scrap tires
into liquid products, solid products, and gas [38]. The generalized scheme of the
pyrolysis process is shown in Figure 8.

47
Figure 8. Generalized scheme of pyrolysis
Pyrolysis gas
Pyrolysis gas or pyrogas is the gas remaining after liquid recovery [27] [39].
Pyrogas is generally composed of paraffin and olefin compounds with carbon from one
to four [39][40]. The most typical compounds are methane (CH4), ethane (C2H6),
ethene(C2H4), propane(C3H8), propene(C3H6), butane (C4H10), butenes (C4H8) and
butadiene(C4H6), low concentrations of sulfur(H2S, SO2, COS,CS2), nitrogen (NH3),
and some CO, CO2 [41]. The calorific value of the gas might vary from 29.9 to 42.1
MJ/m3 [27] to very high (68-84 MJ/m3) [41]. Such a big difference in calorific values
can be explained by the presence of heavier hydrocarbons in the number of experiments.
The calorific value of the gas depends on pyrolysis conditions and the initial feedstock
[27]. Pyrogas is mostly used as fuel to provide the heat for the pyrolysis [40].
48
Pyrolytic liquid
The liquid product or tire derived oil (TDO) is a complex mixture consisting of
complex organic compounds with carbon from 5 to 20. TDO is a dark brown colored
product similar to petroleum fractions, has a sulfur/aromatic smell due to the presence
of sulfur-containing compounds and high medium viscosity [41]. The relative
proportions of aromatics and aliphatic compounds depends on pyrolytic conditions,
including temperature, pressure, volatile residence time, and the quality of rubber
particulates [39]. The calorific value of the TDO in general is higher than the calorific
value of waste tire itself and the value is around 42 - 44MJ/kg depending on tire
composition and pyrolysis conditions [12] [39] [41].
The boiling point of the TDO is in range 50°C to above 350°C. TDO can be used
as a fuel if it is blended in small proportions with diesel in order not to affect the
performance of the engine and not to increase total pollution level. Due to the high
content of sulfur and high viscosity the TDO should be upgraded before use. Pure TDO
can be used only in diesel engines that can work with the fuel of less quality or/and have
less stringent pollution regulation, such as, stationary engines and marine propulsion
engines [5].
Solid products
The composition and characteristics of the pyrolytic char also depends on
pyrolysis conditions and the composition of tires [39]. According to [2], the amount of
pyrolytic char varies from 22 to 49 wt.%, with a typical range of 38-40 wt.%.There are
two main components of pyrolytic char: the inorganic matter of the tire (ash, zinc oxide,
steel, silicates, etc.) and the non-volatile carbon black added during tire manufacture.

49
The carbon content in char is up to 90 wt.%. The ash content is in a range between 8.27
and 15.33 wt.% due to additives during tire manufacturing and dirt material found with
the WT [2]. Also, pyrolytic char from WT is rich in sulphur (1.9 – 2.7 wt.%) resulting
from use of sulphur in vulcanization process [2]. In general recycled and recovered char
from WT can be used in production of activated carbon, as a reinforcing filler for low-
value rubber goods, as a filler in road pavement, as a printing ink pigment or blended
with bitumen in order to improve its rheological properties [39].
As has been mentioned earlier, the quality of char depends on pyrolytic
conditions. In [39] the author mentioned that only vacuum pyrolysis gives char with
similar concentration of carbon as in virgin carbon black and the quality of char also can
be compared to commercial of the N300 series.
It is worthwhile to mention that pyrolytic char is a heterogeneous material
regarding to particle size, impurities, absorption properties, structure and both surface
chemistry and activity because of use various carbon black grades during tire’s
manufacturing. The pyrolysis process itself also changes the initial characteristics of the
virgin rubber. Most of the time, use of pure pyrolytic char in manufacturing without
further upgrading is impossible [39].
Higher value products from waste tire pyrolysis
Chemicals from tire pyrolysis oil
There is limited direct use of TDO due to its low quality making the selling price
of TDO low. Also, the process of recycling might be not economically viable. Due to
these reasons, further processing of TDO and its use as a chemical feedstock is
considered as a more favorable option [2] [42].

50
In [2] the author showed that TDO composition could be very complex with a
wide range of different chemicals in it. The total number of compound in oil can be up
to 132 [43], with the concentration of the most compounds generally less than 1%.
However, the concentrations of valuable chemicals such as, benzene, toluene, xylenes
or BTX, styrene and limonene are in significant amount.
The possible application of each of these chemicals is shown in Table 10.
Table 10. TDO compounds and its possible further application [2]
Name of the compound Possible application
Benzene Production of derivatives such as ethylbenzene,
cyclohexane and cumene which are used for the
production of plastics, resins, fibres, surfactants,
dyestuffs and pharmaceuticals
Toluene
Xylenes Plastics industry – production of plasticisers, polyester
resins and fibres and for use in the dyes and pigments
industries.
Styrene Production of plastic materials and is also used to make
synthetic rubber and other polymers
Limonene Production of industrial solvents, resins and adhesives
and for the production of fragrances and flavourings
The yields of chemicals mentioned in Table 10 depend on reactor design,
pyrolysis conditions, and raw material. Different studies used different brands and types
of tires. Tables 11 -Table 13 show the yields of valuable chemicals, such as benzene,
toluene, xylenes, styrene, and limonene from different literature sources.
The demand for BTX, especially for xylene, is constantly growing due to its use
in plastic/polymer industry [44]. According to the studies, the concentration of
dipentene (or limonene) for low temperatures pyrolysis is predominant [44] [3].

51
Dipentene consists of d- and l-limonene. Dipentene is a monoterpene which is a dimer
of two isoprene units. Dipentene can be obtained from polyisoprene tire content which
in its term can be natural or synthetic. Limonene is very unstable in high temperatures.
The common yield of limonene for low temperatures pyrolysis is in a range 2.5-5 wt.%
on the steel-free tire basis and can be as high as 27.97% (Tables 11 -Table 13). D-
limonene has an orange smell, l-limonene smells like pine. Limonene has wide
industrial application and the current constantly growing demand for it is mainly
supplied by citrus-derived limonene [3] [45]. Islam in his works [46], [47]showed that
amount of obtained limonene from WTT is highest among other types of tires.
Further details concerning economic aspect of limonene or other valuable
chemicals production will be discussed in chapter dedicated to economic analysis.
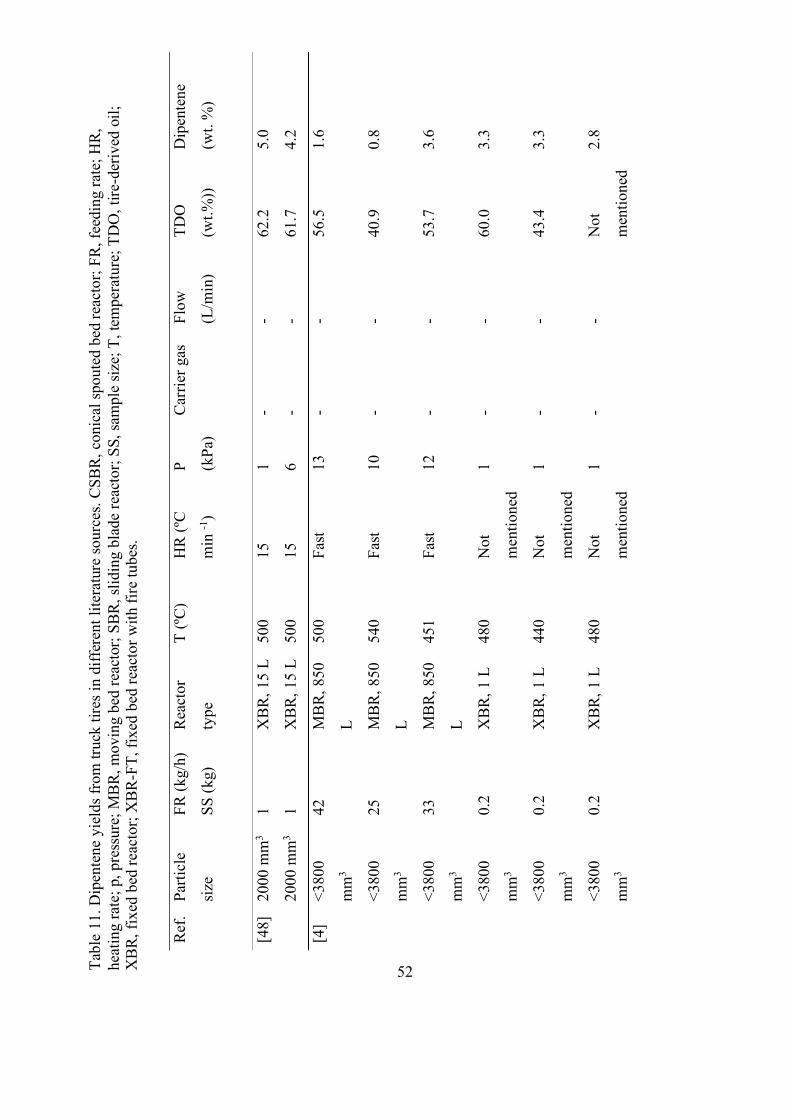
52
Tabl
e 11
. Dip
ente
ne y
ield
s fro
m tr
uck
tires
in d
iffer
ent l
itera
ture
sour
ces.
CSBR
, con
ical
spou
ted
bed
reac
tor;
FR, f
eedi
ng ra
te; H
R,
heat
ing
rate
; p, p
ress
ure;
MBR
, mov
ing
bed
reac
tor;
SBR,
slid
ing
blad
e re
acto
r; SS
, sam
ple
size;
T, t
empe
ratu
re; T
DO
, tire
-der
ived
oil;
X
BR, f
ixed
bed
reac
tor;
XBR
-FT,
fixe
d be
d re
acto
r with
fire
tube
s.
Ref.
Parti
cle
size
FR (k
g/h)
SS (k
g)
Reac
tor
type
T (ºC
) H
R (ºC
min
-1)
P (kPa
)
Carr
ier g
as
Flow
(L/m
in)
TDO
(wt.%
))
Dip
ente
ne
(wt.
%)
[48]
20
00 m
m3
1 X
BR, 1
5 L
500
15
1 -
- 62
.2
5.0
2000
mm
3 1
XBR
, 15
L 50
0 15
6
- -
61.7
4.
2
[4]
<380
0
mm
3
42
MBR
, 850
L
500
Fast
13
- -
56.5
1.
6
<380
0
mm
3
25
MBR
, 850
L
540
Fast
10
- -
40.9
0.
8
<380
0
mm
3
33
MBR
, 850
L
451
Fast
12
- -
53.7
3.
6
<380
0
mm
3
0.2
XBR
, 1 L
48
0 N
ot
men
tione
d
1 -
- 60
.0
3.3
<380
0
mm
3
0.2
XBR
, 1 L
44
0 N
ot
men
tione
d
1 -
- 43
.4
3.3
<380
0
mm
3
0.2
XBR
, 1 L
48
0 N
ot
men
tione
d
1 -
- N
ot
men
tione
d
2.8

53
Ref.
Parti
cle
size
FR
(kg/
h)
SS (k
g)
Reac
tor
type
T (ºC
) H
R (ºC
min
-1)
P (kPa
)
Carr
ier
gas
Flow
(L/m
in)
TDO
(wt.%
))
Dip
ente
ne
(wt.
%)
[12]
1.
5-2
mm
0.13
X
BR, 0
.6
L
650
7 10
1 N
2 0.
025
56
16.1
2
[49]
<1
0
mm
0.18
CS
BR
425
Fast
101
N2
9.5
62.8
12
.75
<10
mm
0.18
CS
BR
500
Fast
101
N2
9.5
60.9
11
.00
<10
mm
0.18
CS
BR
600
Fast
101
N2
9.5
54.9
0.
95
[38]
40
00
mm
3
0.75
X
BR-F
T,
2.1
L
475
Fast
101
N2
8 55
.0
27.9
7
[12]
1.5-
2.0
XBR
,
2.1
L
650
10
1 N
2 25
56
28
.78
Tabl
e 11
. con
t.

54
Table 12. Yield of valuable chemicals in pyrolysis process
Name of
the
compound
Yield from tire feed (wt.%)
Source - [43]. Raw
material - commercial car
tire (Firestone 155R13, F-
570).
Source - [40]. Conical spouted bed
reactor. Raw material is not specified.
500
ºC
600
ºC
700 ºC Thermal
pyrolysis,
500 ºC
HZSM-5
Catalyst,
500 ºC
HY
Catalyst,
500 ºC
Benzene 0.98 0.52 0.29 0.21 3.64 0.39
Toluene 4.4 2.81 2.09 0.78 7.39 1.04
Xylenes 3.48 2.05 1.49 1.23 9.00 2.09
Styrene 2.45 1.94 1.44 2.17 0.82 0.17
Limonene 5.12 3.19 3.29 26.8 8.34 3.86
Table 13. Yield of valuable chemicals in pyrolysis process (continue)
Name of
the
compound
Yield from tire feed (wt.%)
Source - [44]. Spouted
bed reactor. Raw material
is steel-free rubber crumb,
brand is unknown.
Source - [4]. Used
car and truck
tires. Vacuum and
in a continuous
feed reactor.
Source - [50]. The
pilot-scale
pyrolysis of scrap
tires in rotary kiln
reactor.
425 ºC 500 ºC 600 ºC 480 ºC 500 ºC
Benzene 0.14 0.27 0.76 2.09
Toluene 0.74 1.51 2.5 7.24
Xylenes 1.27 1.53 2.11 2.13
Styrene 4.49 6.08 4.22
Limonene 20.4 10.29 0.94 3.6 5.44

55
Hydrogen from waste tires
Another way to use TDO is to produce hydrogen from it. In [51] the author
showed that 1 kg of steel and fiber-free crumb tire can be converted into 0.158 kg of
hydrogen. The amount of obtained hydrogen is higher than the amount of hydrogen
originally present in the tire due to the additional hydrogen from the water gas shift
reaction of steam. The generalized scheme of the process is represented below (Figure
9). Also, in [52] the authors investigated the correlation between rubber type using in
tire manufacturing and amount of hydrogen produced from it. Although, hydrogen
production from WT is an interesting way to supply the possible future hydrogen
infrastructure, for now this process is not economically feasible [51] and therefore will
not be considered in this study further.
Figure 9. Mass balance for the hydrogen production process from WT

56
Pyrolysis conditions
In [53] the author mentioned that the main characteristics that influence the
pyrolysis of WT and the by-product of the process are temperature, pressure, residence
time and heating rate.
Pressure
The pyrolysis of WTT in different literature sources was carried out at pressures
from 1 kPa to normal atmospheric pressure 101 kPa (). Lopez in [42] investigated the
pyrolysis of tire material free of steel, carcass, and textiles under vacuum (25 and 50
kPa) and atmospheric pressure at 425°C and 500°C. He discovered that the reduction
of pressure leads to an increase in the yield of tar with C11+ and reduction of C5+ - C10+
(both aromatics and aliphatic compounds) fraction and slight increase of gas yield. The
amount of char in vacuum has not changed [44] while the quality of char, mainly
composed of carbon black, is higher. Zhang in [54] showed that despite the high ash
content CB under pyrolytic conditions has a surface area close to commercial, CB used
in tire manufacturing. Also, Roy noticed in [48] that oil yield under vacuum condition
is higher than under atmospheric conditions and when the amount of limonene has been
increased. All of these can be explained as the residence time of volatiles in vacuum is
shorter and the occurrence of secondary reactions is limited, but still can appear [39].
As result, the formation of carbonaceous deposits on the surface of the char are
minimized, thereby improving the surface area and increasing the number of active
sites. From the limonene perspective, lower vacuum pyrolysis temperatures and faster
removal of volatiles from the reaction zone prevent the secondary cracking reaction

57
which degrades limonene by so increasing the limonene content in the TDO. However,
Lopez in his works [42] showed that pyrolysis under close to vacuum conditions (25-
50kPa) actually decreased the total limonene yield.
Temperature
The reactor temperature is an important parameter. The optimum temperature
for WT pyrolysis in atmospheric pressure to achieve total conversion of the tire is 500ºC
[39]. Yield, heating value, and compounds of pyrolytic gas are sensitive to thermal
cracking. When the temperature increases the secondary reaction such as thermal
cracking occurs which leads to decrease of long chain hydrocarbons in favor of lighter
hydrocarbon C1 – C4 and H2 in the gas fraction. The heating value of the gas fraction
decreases when the temperature increases due to the decreasing concentration of heavy
hydrocarbons. The gas HV might drop from 50 to 36 MJ/m3 [39]. Simultaneously, the
total yield of gas fraction is increasing with higher temperature as a consequence of
cracking reaction [39].
According to [44], an increase of pyrolysis temperature does not have an
important effect on the yield of adulterated carbon black in the 400 – 600°C. In [41] the
authors reported a decrease of solid fracture with increase of temperature from 300 –
500°C and almost equivalent solid yield at 500-700°C even when they elongated the
reaction time. Gonzalez [53] also noticed that the solid fracture in his experiment was
rapidly decreasing from 350°C to 500°C, and was relatively stable at temperatures in
the range of 500-700°C. Simultaneously, the ash content was increasing from 350°C to
500°C while the volatiles content was decreasing at the same temperature range. Both
ash content and volatiles content reached their equilibrium at temperatures 500-700°C.
58
A decrease of solid yield with temperature also mentioned by Martinez in [39]. Authors
explained this as at 500°C tire decomposition is complete while at lower temperatures
one can observe heterogonous structure of rubber tire made of SBR, BR, and NR.
Ucar in his experiments on WTT showed that the ash content and fixed carbon
content did not change at temperature from 550°C to 800°C. The ash content was 13.5-
14.8 wt.% and fixed carbon content equaled 82.4 – 84.3 wt.%. The total solid fraction
was about 33.2-33.8 wt.% [12].
As Martinez mentioned in [39] the occurrence of secondary cracking reactions
promotes a decrease of liquid fraction, or TDO. It means an increase of gas yield
resulting in a decrease of oil yield. This correlation between the increase of gas and
decrease of oil yield with temperature increase is mentioned by Gonzalez in his research
[53] when the oil yield decreased from 55.2% at 450°C to 36.6% at 700°C while the
gas fraction increased from 4.5% at 450°C to 26.7% at 700°C. The same trend was
observed by Choi in his paper [55]. The author pyrolyzed steel and fiber free waste tire
rubber (WTR) in a fixed bed reactor. He showed that with temperature increase from
500°C to 800°C the char yield remained fairly constant (about 37 wt.%), liquid yield
decreased from 38.29 wt.% to 29.78 wt.%, and gas yield increased from 22.59 wt.% to
30.08 wt.%. Choi also pointed at that not only the amount of liquid fraction changed
but also the composition. The concentration of the aliphatic fraction decreased from
15.1 wt.% to 6.1 wt.%, whereas the aromatic fraction increased from 65.3 wt.% to 79.3.
wt.% with temperature increase. The explanation for this phenomenon is that
temperatures higher than 600°C favors formation of aromatics and as a consequence it
causes the decomposition of aliphatic compounds, including limonene.

59
At the same time in [12] Ucar, did not notice a relationship between temperature
changes and oil/gas yields fluctuations. In his case the liquid yield from WTT was 55.1-
56.0 wt.% and gas yield was 7.6 – 8.8 wt.% with a temperature change from 550°C to
800°C. However, in his research he mentioned that it is more common in other works
to find such relationship as decrease in TDO yield and increase of gas yield with
increase of temperature.
The effect of temperature change on oil from WTT is represented below in Table
14Table 15.
Table 14. Liquid fraction from pyrolysis of WTT under different temperatures [12]
Temperature, °C 550 650 800
Reaction products, wt.%
Gas 7.6±2.8 7.6±2.4 8.8±2.7
Oil 55.6±1.3 56.0±1.8 55.1±2.0
Water 3.0±0.5 2.6±1.1 2.9±0.9
Carbon black 33.8±2.8 33.8±2.8 33.2±2.7
Effect of temperature on the hydrocarbon types in the pyrolytic oils, vol.%
Tempereature, °C 550 650 800
Aroamtics 15.41 15.29 15.22
Paraffins 64.12 64.31 64.45
Olefins 20.47 20.40 20.33
Table 15. Effect on reactor operating temperature on the product yields [47]
Temperature,
°C
375 425 475 525 575
Reaction products, wt.%
Gas 7.5±1.0 8.0±1.1 9.0±1.6 12.5±1.5 18.0±2.0
Oil 47.5±3 53.0±2.2 55.0±1.5 52.21±2.1 47±3.0
Solid char 45.0±2.0 39.0±2.6 36.0±1.8 35.5±1.6 35.0±1.5

60
Temperature also affects the share of valuable chemicals in pyrolytic oils.
Limonene, for instance, is very unstable at temperature above 500°C and breaks down
into trimethylbenzene, m-cymene and indane [4].
Volatile residence time
Volatile residence time is connected with carrier gas flow rate and reactor type
[39]. According to Martinez, an increase of carrier gas flow rate causes the decrease of
volatile residence time due to the faster removal of volatiles and vice versa. Longer
volatile residence time favors the secondary cracking reactions which in its turn can
increase the gas fraction at the expanse of the oil fraction [56]. Pakdel in [4] said that
with a high reactor temperature (above 450°C) or/and long residence time the limonene
will degrade via secondary reaction.
Heating rate
According to Martinez [39] heating rate is one of the key pyrolysis variables that
determines the temperature profile within the particles and reaction rate. The increase
of the heating rate leads to higher pyrolysis temperature, increase degradation rate and
encourages secondary reactions which in its turn enhances the gas yield at the expense
of liquid yield [39]. In order to minimize secondary reactions at a higher heating rate,
the residence time should be decreased. This means that higher heating rate can be used
for limonene production but faster removal of primary volatiles is important in order to
avoid secondary reactions. The effect of heating rate on limonene yield was also

61
described in [3], Danon mentioned that the highest limonene yield was obtained with
the lower heating rate.
According to the information in the chapter, pyrolysis and grinding are the most
applicable technologies. Considering the desire of the company to look closer at the
conversion of WTT into oil, gas, and char, pyrolysis process was chosen to recycle scrap
tires.

62
CHAPTER IV: PROCESS DEVELOPMENT
Overview
The design basis for the project is shown below in Table 16 and discussed further
in this chapter. The initial conditions include a description of the raw material used in
the research, a tire feed rate of the future facility, the main product of the recycling
process, mode of the operation, and plant location.
Table 16. The design basis
Parameter Value Motivation
Raw
material
Truck tire.
Steel content – 15-
25%
(base case – 20%)
Average steel content in waste truck tires
Tire feed
rate
30 ton per day Flow rate for commercial recycle facility. In
[46] Islam mentioned that small private
recycling facilities are typically in a range
from 26 ton/day to 30 ton/day. In this study,
30 ton/day was used.
Main
product
Technical grade
limonene
Valuable chemical with the highest price.
Amount of limonene from STT is the highest
among other types of tires [46], [47].
Due to the market standard of technical
limonene, the purity of limonene should be
95%[45].

63
Table 16.cont.
Parameter Value Motivation
Mode of
operation,
operating
hours
24-hour continuous
8000 hours/ year.
In [57] Sinnott and Towler mentioned that
continuous plants usually have 90-95%
availability which approximately 7884 – 8332
hours per year. In the framework of the study
I used 8000 hours/year as a nominal value.
Plant
location
Close to the
company
All trucks of the company once in a while
come back to a company’s maintenance
facility. These trucks could provide a constant
flow of a raw material for the recycling
facility and at the same time eliminate
logistics cost associated with a delivery of
raw material.
Raw materials and production capacity
The raw material for the process in this study is scrap truck tires (STT) with steel
content of 20% wt.%. All tires are assumed to be supplied from the company’s
warehouses or delivered by the trucks from the strip mines with which the company
works. For a simplification of the future model and inability to gather the data about
composition and amount of particular tire of a specific brand, the average value for steel
content in TT was used for this study. The steel content of 15 wt.% to 27 wt.% is
commonly used in literature for waste truck tires studies and conceptual processes [2],
[6], [13]. In this model 20 wt.% steel content is used as the average value.
A feed rate of tires in the study equals 30 ton/day which is the average value for
the feed rate among other studies. Islam [46] made a comparative techno-economic

64
assessment for three different sizes of the plant: medium commercial scale (144
tons/day), small commercial scale (36 tons/day), and pilot scale (3.6 tons/day). He
noticed that the most feasible facility was of a medium commercial scale. Also, Islam
mentioned in his article [46] that there a number of researches used a feed rate of 24-30
ton/day in their works. A flow rate of 30 tons/day was also used in the economic analysis
for a scrap tires recycling facility by Pilusa in [58] and by Mulaudzi in [27]. 30 ton/day
was chosen as the initial scrap truck tires feed rate for their work to ensure sustainability
and to perform a realistic economic feasibility evaluation. The significant volume of
published research for a small commercial plant allowed validation of the economic
model.
The company does not track number of waste tires they have at their warehouse.
Therefore, scrap truck tires feed rate of 30 tons/day for the next 10-15 years would be
more feasible and realistic for the private company than 100-140 tons/day.
Main product
Recovery of valuable chemicals makes the pyrolysis process more economically
feasible, as the price of valuable chemicals is usually higher than the price of raw tire
derived oil. Technical grade limonene of 95% purity is the targeted product from the
pyrolysis of waste truck tires as this level of purity complies with market requirements
[45]. Limonene concentration in pyrolytic oil derived from truck tires is the highest
among other types of tires due to the significant content of natural rubber in the raw
material [38]. A yield of limonene from truck tires ranges from 0.8 wt.% to 28.78 wt.%
on the steel-free basis [2]. In this research, it was assumed that the yield of limonene is

65
5 wt.% on the steel free basis. Other targeted products that can be sold include steel,
pyrolytic char, and tire-derived oil.
Operation time
The plant operating time was adopted from [57]. Towler mentioned that
continuous processes are usually more economical due to less labor and operating costs
compared to the batch processes. Operation time for continuous processes is assumed
to be 24 hours a day, 7 days a week, throughout the year. However, because of the
necessity to carry out maintenance work and/or catalyst regeneration, the operating time
for the continuous process is 90-95% of the available hours per year, or the total
operating time of 7884 to 8322 hours per year. A common design basis would assume
8000 working hours per year [57].
Plant location
In this study, the possible location of the plant is a company property or nearby.
This location would allow the future recycling facility to have continuous access to the
raw material due to several reasons. First, all of the company’s trucks are going through
maintenance in the territory of the company. Trucks can bring tires that were dumped
into strip mines on the way back to the company. Secondly, there is a truck tire stockpile
near the territory of the company that creates an extra flow of raw material without extra
costs.

66
Structure of the recycling process
A simplified input-output scheme of pyrolysis is shown in Figure 10.
Figure 10. Input-output structure of the scrap truck tires
Compounds that make up the feed and the by-products of the process at various
stages were adopted from Islam [57], Danon [3], and Mulaudzi [27]. Islam work was
used as the base for the by-products values distribution. The amount of TDO, gas, and
char were chosen from [57] for pyrolysis process at 525°C for scrap truck tires and
equaled 52 wt.%, 12.5 wt.%, and 35.5 wt.% respectively on the steel-free basis. The
limonene yield criterion was adopted from Danon [3] (). In [3] the yield of limonene
from STT varies from 0.8wt.% to 28.78 wt.%. For this particular study, the limonene
rate production of 5.0 wt.% (or almost 10% of total TDO) was chosen for the initial
calculations.
Studies by Mulaudzi [27] and Ngwetjana [59] were used as the base literature
sources to develop a recycling process itself and for the further estimation of pre-

67
treatment process, pyrolysis, and limonene recovery. Figure 11 shows the final process
flow diagram (PFD) for recycling of waste tires to limonene made by Mulaudzi in [27].
Figure 11. Process flow diagram for recycling of waste truck tires into limonene [27]
Table 17 shows all streams of the waste tires recycling process into limonene
in Figure 11. Streams S112, S116, S133-134, S136-140 belong to the energy recovery
system in Figure 12. The energy recovery system also was adopted from the research
by Mulaudzi [27].

68
Figure 12. Energy recovery system for waste tires recycling into limonene process
[27]
Table 17. Stream names of waste truck tires recycling into limonene [27]
Stream
name Description
Stream
name Description
S101 Tire feed S123 Hot DEG feed
S102 Bed wire steel S124 Cool DEG feed
S103 Whole tires S125 Limonene product
S104 Tire chips S126 DEG-rich stream
S105 Pyrolysis reactor product S127 Aromatics product
S106 Char and steel S128 DEG product
S107 Char product S129 DEG purge
S108 Steel S130 DEG recycle
S109 Reactor volatiles S131 Hot TDO product
S110 Slightly cooled volatile
product S130 Cool TDO product
S111 Condensed volatiles S131 Flue gas to RX-101
S112 Pyrolysis gas S132 Cool TDO product
S113 Pressured pyrolysis oil S133 Fuel gas to RX-101

69
Table 17.cont.
Stream
name Description
Stream
name Description
S114 Pressured pyrolysis oil S134 Combustion air
S115 Warm pyrolysis oil feed S135 Hot flue gas
S116 T-101 vapor distillate S136 Hot flue gas
S117 T-101 liquid distillate S137 Flue gas discharge
S118 T-101 bottom product S138 Boiler feed water
S119 Limonene-rich stream S139 Pressurized boiler feed water
S120 T-102 bottom product S140 High pressure steam
S121 Pressurized limonene-rich
stream S141 Flue gas to flare
S122 DEG make-up
Table 18 shows what kind of equipment the recycling and energy recovery
systems use [27].
Table 18. Equipment
Equipment
name Description
Equipment
name Description
DB-101 Tire de-beader EX-105 Steam generator
ST-101 Tire shredder DM-101 Volatiles condenser
knockout drum
RX-101 Pyrolysis reactor PC-101 Lights remover feed pump
MG-101 Magnetic separator PC-102 Limonene column feed
pump
EX-000 Tube side of EX-101 PC-103 Boiler feed water pump
EX-001 RX-101 heating T-101 Light hydrocarbon remover
EX-002 EX-105 shell side T-102 Limonene-rich cut purifier
EX-101 T-101 feed preheater T-103 Limonene recovery column

70
Table 18. Cont.
Equipment
name Description
Equipment
name Description
EX-102 Reactor volatiles
condenser T-104 DEG regeneration column
EX-103 DEG cooler HT-101 RX-101 combustion
chamber
EX-104 TDP cooler
Pre-treatment system
The pre-treatment system consists of tire de-beader (DB-101) and tire shredder
(ST-101). A tire de-beader is necessary to extract the reinforcement high tensile steel
(stream S102) which will be later sold as a by-product of the recycling process. Free of
reinforcement steel WTT then go to the tire shredder. Tire chips stream (S104) then
flows to the pyrolysis reactor (RX-101).
Pre-treatment of the tire is the most energy consuming process in recycling. The
total energy consumption during tire grinding can reach up to 83% of the complete
overall process requirements. The most power consuming process in tire pretreatment
is shredding. Tire’s shredding accounts for almost 86% of total energy use in the pre-
treatment process [27],[58].
Pyrolysis system
The pyrolysis system consists of the pyrolysis reactor (RX-101), a magnetic
separator (MG-101), feed preheater (EX-101), reactor volatiles condenser (EX-102),

71
volatiles condenser knockout drum (DM-101). The final streams of the pyrolysis system
are char product (S107), steel (S108), pyrolysis gas (S112), and pyrolysis oil (S113).
Values for char (S107), steel (S102+S108), gas (S112), and oil (S113) are 355 kg/h,
250 kg/h, 125 kg/h, and 520 kg/h respectively [38] (Table 19).
Table 19. Stream table for pyrolysis and pre-treatment processes [27]
Stream
number
S101 S102+S108 S107 S112 S113
Mass flow
(kg/h)
1250 250 355 125 520
The reactor operating conditions were adopted from Islam [57]. Islam conducted
his research for the temperature in the range from 375°C to 575°C. A temperature of
525°C, was chosen for this work, as this represents the temperature when the total
conversion of WT occurs. The temperature favors limonene production [39] at a
pressure of 100 kPa (atmospheric pressure). The total energy used for the pyrolytic
reactor accounts for 70-73% (approximately 468-544 kW for pyrolysis of 30 ton/day)
of the total energy needed for a pyrolysis process [27], [60].
The truck tire chips after the shredder go to a pyrolysis reactor where they are
transformed into volatiles (stream S109) and a solid product (stream S106). When the
pyrolysis process is completed the magnetic separator (MG-101) divides solids (S106)
into steel (S108) and char (S107). Volatiles stream (S109) flows to a volatiles condenser
knockout drum (DM-101) where separation into pyrolytic gas (S112) and pyrolytic oil
(S113) occurs.

72
Separation system
The purpose of the separation system is to recover valuable chemicals out of raw
TDO. The valuable chemical for this study is limonene of 95%-99% purity as this is the
quality of market standard. The system was adopted from Mulaudzi study [27]. The
separation system consists of 4 distillation columns (T-101-104), pump (PC-102), and
heat exchangers (EX-103,104). The main streams of the recovery system are warm
pyrolysis oil feed (S115), DEG make-up (S122), DEG recycle (S130), limonene product
(S125), cool TDO product (S132), DEG purge (S129).
Distillation column T-101
T-101 removes compounds lighter than a limonene-rich fraction. Distillation
column T-101 operates in atmospheric pressure. The input to T-101 is pre-heated oil
stream S115. The output of T-101 is bottom product stream or limonene-rich fraction
(S118) and two distillate streams which are vapor (S116) and liquid distillates (S117)
[27]. Vapor distillate stream (S116) flows to the heat recovery where it combines with
pyrolysis gas stream (S112). The blue rectangle in Figure 13 demonstrates the joining
of S112 and S116. The liquid distillate stream (S117) combines with output streams
from distillation columns T-102 (S120) and T-104 (S127). The two orange rectangles
in Figure 13 show the location of streams’ connections. Limonene rich-fraction or T-
101 bottom products (S118) goes to further limonene enrichment in distillation column
T-102. The concertation of limonene in S118 is 10%.

73
Figure 13. Junction of gas by-products S112 and S116; junction of liquid by-products
S117, S120, and S127
Distillation column T-102
T-102 is a packed distillation column that removes compounds heavier than
limonene. T-102 operates under atmospheric pressure with 50 Pa pressure drop at each
stage. The input to T-102 is bottom products from T-101. The output of the column T-
102 is bottom stream S120 and limonene-rich fraction (S119).
Stream S120 combines with liquid distillate from T-101 and T-104 to make final
hot TDO stream (S131). Limonene- rich fraction S119 has an approximate
concentration of limonene about 39%. After the column T-102, S119 is pressurized in
limonene column feed pump (PC-102) and flows to the final limonene recovery column
T-103.

74
Distillation column T-103
Distillation column T-103 is also a packed column with 50 Pa pressure drop per
stage. The inputs of T-103 are a pressurized limonene-rich stream (S121) and cool DEG
stream (S124). The outputs of the system are 95% limonene product (S125) at a rate of
50 kg/h and a solvent rich stream or a DEG-rich stream (S126). Limonene can be sold
as a by-product. DEG-rich stream after the column T-103 flows to the column T-104
(Figure 11).
Distillation column T-104
Distillation column T-104 regenerates DEG used in limonene production by
filtering entrained impurities in the DEG-rich stream (S126). The input to the T-104 is
a solvent-rich stream (S126). The output of the T-104 is aromatics products (S127) and
DEG product (S128). The distillate aromatics products (S127) combine with liquid
distillate products from T-101 (S117) and T-102 (S120) into hot TDO product (S131).
The combined hot TDO product stream goes to the TDO cooler (EX-104) where it is
cooled. The final cool TDO stream (S132) at a rate of 510 liters/h and a temperature of
35°C can be sold as a by-product.
Recovered DEG product (S128) is separated into DEG recycle (S130) and DEG
purge (S129) streams. The total DEG purge stream (S129) accounts for 1% of the
solvent stream. The recycled solvent or DEG recycle stream (S130) after the separation
combines solvent make-up stream (S122) and forms hot DEG stream (S123). Hot
solvent stream (S123) in its turn flows to the solvent cooler (EX-103) where it is cooled
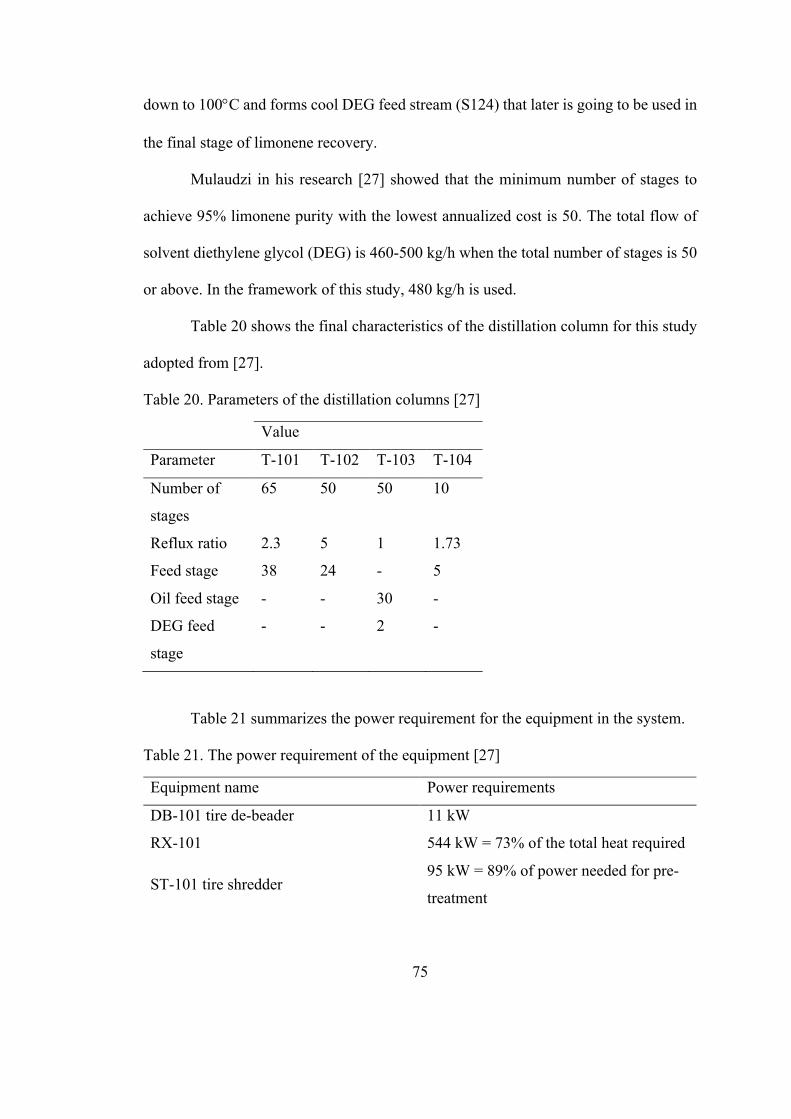
75
down to 100°C and forms cool DEG feed stream (S124) that later is going to be used in
the final stage of limonene recovery.
Mulaudzi in his research [27] showed that the minimum number of stages to
achieve 95% limonene purity with the lowest annualized cost is 50. The total flow of
solvent diethylene glycol (DEG) is 460-500 kg/h when the total number of stages is 50
or above. In the framework of this study, 480 kg/h is used.
Table 20 shows the final characteristics of the distillation column for this study
adopted from [27].
Table 20. Parameters of the distillation columns [27]
Value
Parameter T-101 T-102 T-103 T-104
Number of
stages
65 50 50 10
Reflux ratio 2.3 5 1 1.73
Feed stage 38 24 - 5
Oil feed stage - - 30 -
DEG feed
stage
- - 2 -
Table 21 summarizes the power requirement for the equipment in the system.
Table 21. The power requirement of the equipment [27]
Equipment name Power requirements
DB-101 tire de-beader 11 kW
RX-101 544 kW = 73% of the total heat required
ST-101 tire shredder 95 kW = 89% of power needed for pre-
treatment

76
Table 21. cont.
Equipment name Power requirements
T-101 distillate condenser
91 kW = 63% of the cooling
requirements for all 4-columns or 42%
of the whole separation system
T-101 reboiler
103 kW of heat input from high-pressure
steam = 51% of steam requirements in
the separation section
T-102 distillate condenser 36 kW
T-102 reboiler
37 kW. Low heat requirements because
input stream S118 is already of a high
temperature of approximately 200°C.
T-103 distillate condenser 2 kW = 2% of total cooling requirements
for 4 columns
T-103 reboiler 29 kW = 14% of the total steam usage in
the separation system
T-104 distillate condenser
13 kW = 6% of the cooling requirements
for all 4-columns or 3% of the overall
cooling requirements
T-104 reboiler 31 kW = 16% of the steam usage or 4%
of the overall steam requirements
EX-000 19 kW
EX-101 19 kW which is provided by contact
with the hot reactor volatiles
EX-102
235 kW = 100% requirements for
pyrolysis cooling or 52% of the total
cooling requirements

77
Table 21. cont.
Equipment name Power requirements
EX-103
42 kW = 19% of the cooling
requirements for the separation system
or 9% of the overall cooling
requirements. The energy usage is so
high because the recycled DEG stream
(S130) has a temperature of
approximately 240°C when the solvent
has to be 100°C for proper extraction in
T-103
EX-104
28 kW to cool down hot TDO product
stream (S131) = 13% of cooling
requirements in the separation system or
6% of the overall cooling process
Table 22 demonstrates the total power requirements for different processes and
the system itself.
Table 22. Summary of power requirement [27]
Name Power requirement
Cooling requirement for four distillation
columns
145 kW
Cooling requirements for the separation
system
217 kW
Cooling requirements for the whole
system
467 kW
Heat needed for the separation system 201 kW
Heat needed for the pyrolysis process 544 kW
Heat needed for the system in total 775 kW

78
Energy recovery system
In various works dedicated to pyrolysis the most common way to use pyrolytic
gas is to use it for a reactor heating while the excess gas is burned. The idea of an energy
recovery system (Figure 12) is to generate steam using the pyrolytic gas left after the
reactor heating requirements. The input to the energy recovery system is the rest of the
fuel gas to the reactor RX-101 (S133) and combustion air (S134). The output of the
system is flue gas discharge and high-pressure steam (S140) that might be sold as high-
pressure steam. The final decision on the implementation of the energy recovery system
is made in the economic analysis section.

79
CHAPTER V: ECONOMIC ANALYSIS
Overview
An economic analysis of the future recycling facility follows the algorithm
presented below (Figure 14).
Figure 14. Algorithm for the estimation of economics for recycling facility
All components of the algorithms are discussed in the respective subsections.
Each of the subsections represents an important step in the overall process of the
economic evaluation.

80
Initial economic parameters
Discounted cash flow rate of return (DCFRR) method is used to make an
economic analysis in this research [61], [62] as it considers the effect of time and gives
a more precise idea about the profitability of the project. Key economic indicators used
for DCFRR are payback period, internal rate of return, and net present value.
Net present value (NPV) is a cumulative discounted cash position at the end of
the project. At the end of each year of a project lifetime, the cash flow is discounted at
a specific discount rate and summed up [61].
𝑁𝑃𝑉 = −𝑃&'&( + ∑+,--
(/0&)23,45&67(&8797:;</ , 1
where Pinit is a total capital investment, Pann is a cumulative effect of annuity.
Payback period (PBP) shows the minimum time necessary to recover the
original capital investment in the form of cash flow [63]. Shorter PBP is better,
especially for such a high-risk project as a recycling facility where the payout period
should not exceed 2-4 years [61]. PBP can be calculated using equation 2 [64].
𝑃𝐵𝑃 = (𝑦𝑒𝑎𝑟 − 1) + EF+G23,4HIE(F+G23,4JF+G23,4HI)
2
The internal rate of return (IRR) is a discount rate at which net present value
equals zero. Optimum IRR value depends on the maturity of a technology. For example,
IRR of 12% is for a mature technology and up to 40% for very new technology [61]. In
this study, optimal value for IRR starts from 25%.
The base year for all calculations is 2018. Adjustment of all costs of a different
year was made by using the Chemical Engineering plant cost index (CEPCI) [65] [61]
(equation 3).
𝐶𝑜𝑟𝑟𝑒𝑐𝑡𝑒𝑑𝐸𝑞𝑢𝑖𝑝𝑚𝑒𝑛𝑡𝑐𝑜𝑠𝑡 = 𝑜𝑙𝑑𝑒𝑞𝑢𝑖𝑝𝑚𝑒𝑛𝑡𝑐𝑜𝑠𝑡 ∗ [\/]^_`(a'b7cG:5d7_5b&'b7ce:5d7
3

81
The average annual CEPCI in 2018 was 603.1 (www.chemengonline.com).
In cases when the equipment should be adjusted in size, the exponential scaling
was applied (equation 4).
𝑆𝑐𝑎𝑙𝑒 − 𝑢𝑝𝑒𝑞𝑢𝑖𝑝𝑚𝑒𝑛𝑡𝑐𝑜𝑠𝑡 = 𝑏𝑎𝑠𝑒𝑐𝑜𝑠𝑡 ∗ ij^:57Jdk^:k:^&(9l:`7^:k:^&(9
m', 4
where n is a scaling exponent that typically belongs to the range of 0.6 to 0.7
[27], [66].
A possible lifetime of the future chemical facility was adopted from [61] and
equaled 10,12, and 15 years. The initial calculation is done for the shortest lifetime to
get an idea about the least optimistic result. The operation time of the facility equals
8000 hours/year [57]. Straight-line depreciation over 10 years is used in calculations
with zero salvage value of the pyrolysis equipment at the last year [61], [62]. The project
is fully financed by the company itself; no loans have been considered in the
calculations. The conversion rate of R65/1USD is used where it is necessary. The
currency value was obtained from the Central Bank of Russia (2018).
Capital cost estimation
According to [63], the capital cost estimation may vary from a predesign
estimation to a very detailed estimation which includes all specifications and complete
drawings of all systems. In total there are five different levels of accuracy:
1) Order of magnitude (OOM). Used by project managers to estimate a future
project at the very beginning when information is limited, and everything
can change. Accuracy is about ±30%. OOM estimation uses historical
project data with analogous mathematics [63].
82
2) Study estimate. Accuracy is about ±30%. SE uses knowledge of major items
of equipment such as pumps, compressors, columns, and vessels, etc. [63].
Equipment is roughly sized to satisfy the chosen capacity of the future
facility.
3) Preliminary estimate. Accuracy is ±20% [63].
These first three levels of accuracy are significant for the further consideration
of the project [63]. The following two levels of estimation are used for a more detailed
evaluation
4) Definitive estimate. Accuracy is ±10%. Estimation is based on almost
complete data, but still, there is no explicit specification and drawings [63].
5) Detailed estimate. Accuracy is ±5%. Estimation is based on complete
engineering drawing, specifications, survey, and other information that is
available about the project [63].
In this study, OOM and study accuracies are used for a capital cost estimation.
Muluadzi used the same accuracy in his research for economic evaluation of scrap tires
pyrolysis in South Africa [27] and by Wright for economic analysis of biomass fast
pyrolysis [67].
Seider in [62] mentioned that total capital investment or TCI of a chemical
facility is a one-time expense for the design, construction, and startup of a new plant or
modification/modernization of an existing one. Formula 5 shows how to calculate TCI.
𝑇𝐶𝐼 = 𝑇𝐹𝐶𝐼 + 𝑙𝑎𝑛𝑑 + 𝑤𝑜𝑟𝑘𝑖𝑛𝑔𝑐𝑎𝑝𝑖𝑡𝑎𝑙 5
where TFCI is a total fixed capital cost, land is a price of land, and working
capital is the working capital of the company.

83
In [66] Dutta calculated total fixed capital cost or TFCI as a sum of total direct
cost (TDC) and total indirect cost (TIC) (equation 6).
𝑇𝐹𝐶𝐼 = 𝑇𝐷𝐶 + 𝑇𝐼𝐶 6
Total direct cost is a sum of all installed equipment in the main manufacturing
process also called installed battery limits (ISBL) and other direct costs such as a
warehouse, site development, and additional piping (equation 7) [66].
𝑇𝐷𝐶 = 𝐼𝑆𝐵𝐿 + 𝑜𝑡ℎ𝑒𝑟𝑑𝑖𝑟𝑒𝑐𝑡𝑐𝑜𝑠𝑡 7
Other direct costs can be calculated as a percentage of ISBL [66]. The whole
warehouse, site development, and additional piping expenses are 4%, 10%, and 4.5%
of ISBL (equations 8-10).
𝑤𝑎𝑟𝑒ℎ𝑜𝑢𝑠𝑒 = 4% ∗ 𝐼𝑆𝐵𝐿 8
𝑠𝑖𝑡𝑒𝑑𝑒𝑣𝑒𝑙𝑜𝑝𝑚𝑒𝑛𝑡 = 10% ∗ 𝐼𝑆𝐵𝐿 9
𝑎𝑑𝑑𝑖𝑡𝑖𝑜𝑛𝑎𝑙𝑝𝑖𝑝𝑖𝑛𝑔 = 4.5% ∗ 𝐼𝑆𝐵𝐿 10
shows all components used in the calculation of the inside battery limits for a
base scenario of WTT recycling into limonene. ISBL includes necessary pre-treatment
equipment, pyrolysis system, separation system. Prices of the machines were adopted
from the study of Mulaudzi [27]. CEPCI of 2016 is 556.8. Installed costs of heat
exchangers, pumps, drums, and columns Mulaudzi calculated in [27] using Aspen
Plus® Economic Analyzer.
The installed cost of the pre-treatment system and pyrolysis reactor were
calculated using formula 11 [66].
𝐼𝑛𝑠𝑡𝑎𝑙𝑙𝑒𝑑𝑐𝑜𝑠𝑡 = 𝑓&'`(:55:(&_' ∗ 𝑃𝑢𝑟𝑐ℎ𝑎𝑠𝑒𝑑𝑐𝑜𝑠𝑡, 11
where finstallation is an installation factor that equals 3.02 and 3.0 for pre-treatment
system and pyrolysis reactor respectively [68].

84
Mulaudzi obtained the purchased cost of pre-treatment equipment from Jiangyin
Xinda Machinery (2016) and for pyrolysis reactor he used Pyrocrat Systems LLP
(2016). I adjusted the prices of the equipment using formula 3 and chemical engineering
plant cost indexes for 2016 and 2018 for all pieces of equipment used in the process
(Table 23) [27].
Table 23. Individual equipment cost
Equipment item Installation
factor
Total scaled
installed cost in
2016
Total scaled
installed cost
in 2018
Pre-treatment system
Single hook de-beader 3.02 24,160 26,169
Tire conveyor 3.02 14,496 15,701
Tire shredder 3.02 157,644 170,753
Tire chip conveyor 3.02 10,872 11,776
Total: 224,399
Reactor system
Pyrolysis reactor 3.00 1,159,909 1,256,359
Magnetic separator 3.00 96,000 103,983
Reactor volatile
condenser
6.3 86,764 93,979
Volatiles condenser
knockout drum
6.9 108,455 117,473
Total: 1,571,794
Separation
Lights remover feed
pump
7.00 26,108 28,279

85
Table 23. cont.
Equipment item Installation
factor
Total scaled
installed cost in
2016
Total scaled
installed cost
in 2018
Limonene column feed
pump
7.2 26,991 29,235
T-101 reflux pump 6.3 26,598 28,809
T-102 reflux pump 6.5 27,482 29,767
T-103 reflux pump 6.5 27,482 29,767
T-104 reflux pump 6.5 27,482 29,767
T-101 feed preheater 6.1 55,258 59,852
DEG cooler 5.3 53,688 58,152
HFO cooler 7.4 78,617 85,154
T-101 condenser 6.7 80,090 86,749
T-102 condenser 5.7 52,412 56,770
T-103 condenser 5.9 7,253 7,856
T-104 condenser 4.8 16,592 17,971
T-101 reboiler 4.3 78,323 84,835
T-102 reboiler 4.3 70,078 75,905
T-103 reboiler 5.4 64,975 70,377
T-104 reboiler 3.7 73,710 79,839
T-101 condenser
accumulator
6.3 97,658 105,778
T-102 condenser
accumulator
6.9 106,492 115,347
T-103 condenser
accumulator
6.9 106,492 115,347
T-104 condenser
accumulator
6.9 106,492 115,347

86
Table 23. cont.
Equipment item Installation
factor
Total scaled
installed cost in
2016
Total scaled
installed cost
in 2018
Light hydrocarbon
remover
7.8 318,310 344,7785
Limonene-rich cut
purifier
7.8 255,331 276,562
Limonene column 7.8 255,331 276,562
DEG regeneration
column
8.2 76,087 82,413
Total: 2,291,218
Total for three
blocks:
4,087,411
Table 24. ISBL of the base scenario
Equipment item Installed cost, MM$ Percentage of total ISBL,
%
Pre-treatment system 0.23 5.6
Reactor system 1.36 33.3
Heat exchangers 0.29 7.1
Pumps 0.057 1.4
Drums 0.12 2.9
Columns 2.02 49.5
Total: 4.08 100
As can be seen from Table 24, the most significant contribution to the total ISBL
belongs to distillation columns used in the separation process (approximately 50%) and
to the pyrolytic reactor (34%).

87
According to [27], installed cost of the distillation columns includes not only the
price of columns itself, but also associated with columns equipment such as condensers,
reboilers, reflux pumps, and condenser accumulators. The power requirement of the
associated equipment is shown in Table 21.
Table 25 shows calculated results for the additional components of total direct
cost such as site-development, extra piping, and warehouse.
Table 25. Other direct costs
Component Percentage of ISBL, % Installed cost, MM$
Site-development 10 0.41
Additional piping 4.5 0.184
Warehouse 4 0.163
Total other direct costs: 0.76
Total direct costs: 4.84
Summing the results from Table 25, the total direct cost for the base scenario is
4.84 MM$.
Total direct cost is used to calculate the total indirect cost (TIC). TIC represents
a non-constructional cost. Total indirect costs represent expenses on such services as
management and engineering, procurement, and construction (EPC) services [66]. TIC
includes five components which are prorated expenses, home office and construction
fees, field expenses, project contingency, and other costs. Each of these components is
calculated as a percentage of the total direct cost. Table 26 shows what portion of total
direct cost is used to calculate each of the five parts. The total indirect cost is 2.9 MM$
(Table 26).

88
Table 26. Total indirect cost
Component Percentage of ISBL, % Cost, MM$
Prorated expenses 10 0.48
Home office and
construction fees
20 0.97
Field expenses 10 0.48
Project contingency 10 0.48
Other costs (start-up and
permits)
10 0.48
Total indirect cost: 60 2.9
The total indirect cost and the total direct cost are then used to find total fixed
capital investment (TFCI). Formula 6 shows the way how to find TFCI. Total fixed
capital investment equals approximately 7.73 MM$.
Working capital (WC) and land expenses can be calculated as a percentage of
TFCI (formulas 12-13) [62],[68]. WC and land expenses can be recovered at the end of
the project lifetime.
𝑊𝑜𝑟𝑘𝑖𝑛𝑔𝑐𝑎𝑝𝑖𝑡𝑎𝑙 = 2% ∗ 𝑡𝑜𝑡𝑎𝑙𝑓𝑖𝑥𝑒𝑑𝑐𝑎𝑝𝑖𝑡𝑎𝑙𝑖𝑛𝑣𝑒𝑠𝑡𝑚𝑒𝑛𝑡 12
𝐿𝑎𝑛𝑑 = 5% ∗ 𝑡𝑜𝑡𝑎𝑙𝑓𝑖𝑥𝑒𝑑𝑐𝑎𝑝𝑖𝑡𝑎𝑙𝑖𝑛𝑣𝑒𝑠𝑡𝑚𝑒𝑛𝑡 13
Table 27. WC and land expenses
Component Percentage of TFCI, % Cost, MM$
Working capital 2 0.15
Land 10 0.39
Total working capital and
land
12 0.54
Total capital investment 8.3

89
Using formula 5 and summarizing working capital, land expenses, and the total
fixed capital investment, the total capital investment for the base scenario is 8.3 MM$.
Operating cost estimation
In [61] Turton defines operating costs (OC) as the costs associated with the day-
to-day operation of a chemical facility and maintenance of the facility [66]. Wright
mentioned in [67] that there are two types of operating costs: variable operating costs
(VOC) and fixed operating costs (FOC). The VOC relates to the production rate,
whereas FOC is irrespective to the production rate or in our case recycling rate.
The total operating cost can be calculated as
𝑜𝑝𝑒𝑟𝑎𝑡𝑖𝑛𝑔𝑐𝑜𝑠𝑡 = 𝑣𝑎𝑟𝑖𝑎𝑏𝑙𝑒𝑜𝑒𝑟𝑎𝑡𝑖𝑛𝑔𝑐𝑜𝑠𝑡 + 𝑓𝑖𝑥𝑒𝑑𝑜𝑝𝑒𝑟𝑎𝑡𝑖𝑛𝑔𝑐𝑜𝑠𝑡 14
Fixed operating cost
Dutta showed in [66] that fixed operating costs include employee salaries and
benefits, overhead, plant maintenance costs, insurance, and taxes (formula 15). The
value of fixed operating costs does not depend on whether a facility works at full
producing capacity or not.
𝐹𝐼𝐶 = 𝑠𝑎𝑙𝑎𝑟𝑦 + 𝑠𝑢𝑝𝑒𝑟𝑣𝑖𝑠𝑜𝑟𝑦 + 𝑚𝑎𝑖𝑛𝑡𝑎𝑛𝑒𝑛𝑐𝑒 +
+𝑜𝑝𝑒𝑟𝑎𝑡𝑖𝑛𝑔𝑠𝑢𝑝𝑝𝑙𝑦 + 𝑙𝑎𝑏𝑐ℎ𝑎𝑟𝑔𝑒𝑠 + 𝑖𝑛𝑠𝑢𝑟𝑎𝑛𝑐𝑒 15

90
Salary
A number of people working at the facility was adopted from [27]. Muluadzi
mentioned in his study that an operational pyrolysis facility could provide work for 20
people by having 5 shifts with 4 people per shift. Generally, in Russia the number of
shifts per day equals 3 and each of them is 8-hour shift. However, Seider mentioned
that 5 shifts are necessary to consider leave, sick leave, and working hours [62]. The
cost of operating labor in this study is obtained as the average salary of the plant
operator from russia.trud.com (2018) and equals 80,000 RUB per month.
Direct supervisory
Peters and Timmerhaus in [63] emphasized that a direct supervisory is always
required. A number of people depends on the total number of operating labors. The total
expenses for the supervisory are no more than 15% of total operating labor expense.
Maintenance and repair
Another important fixed operating cost is maintenance. Maintenance is
necessary to keep the facility in efficient operating conditions. The expense includes
the cost for labor, materials, and supervision.
Annual expenses for the maintenance are in the range from 2% of the equipment
costs or TFCI and up to 20% in case of severe operating conditions [63]. In [68] James
used 3% of TFCI for the pyrolysis facility to estimate maintenance. The same number
of 3% is used in the current research. Possible expenses were adopted from [63] and
equal 3% of TFCI.

91
Operating supply
Among FIC Peters and Timmerhaus in [63] also emphasized operating supply
costs that cannot be considered as a raw material but still essential for the process.
Operating supply costs is 15% of the total maintenance and repair cost and include items
such as charts, lubricants, test chemicals, custodial supplies, and similar supplies.
Laboratory Charges
Laboratory charges allow to regularly check the quality of the pyrolytic by-
product. The possible value of the laboratory charges is in a range of 10% to 20% of
the total operating labor. In the framework of my study, the average number of 15%
was used [63].
Property insurance and tax
The total amount that should be paid for the property insurance and tax was
obtained from [68]. The percentage for property insurance and tax is 0.7% of the TFCI.
Table 28 shows different components of the fixed operating costs.
Table 28. Fixed operating costs
Component Value, $/year
Operating labor (OL) 80,000 RUB per month » 14,770 $/year
per one operator
Supervisory 15% of the total OL
Maintenance and repair 6% of the TFCI
Operating supply 15% of maintenance and repair
Laboratory charges 15% of the total OL
Property insurance and tax 0.7% of the TFCI
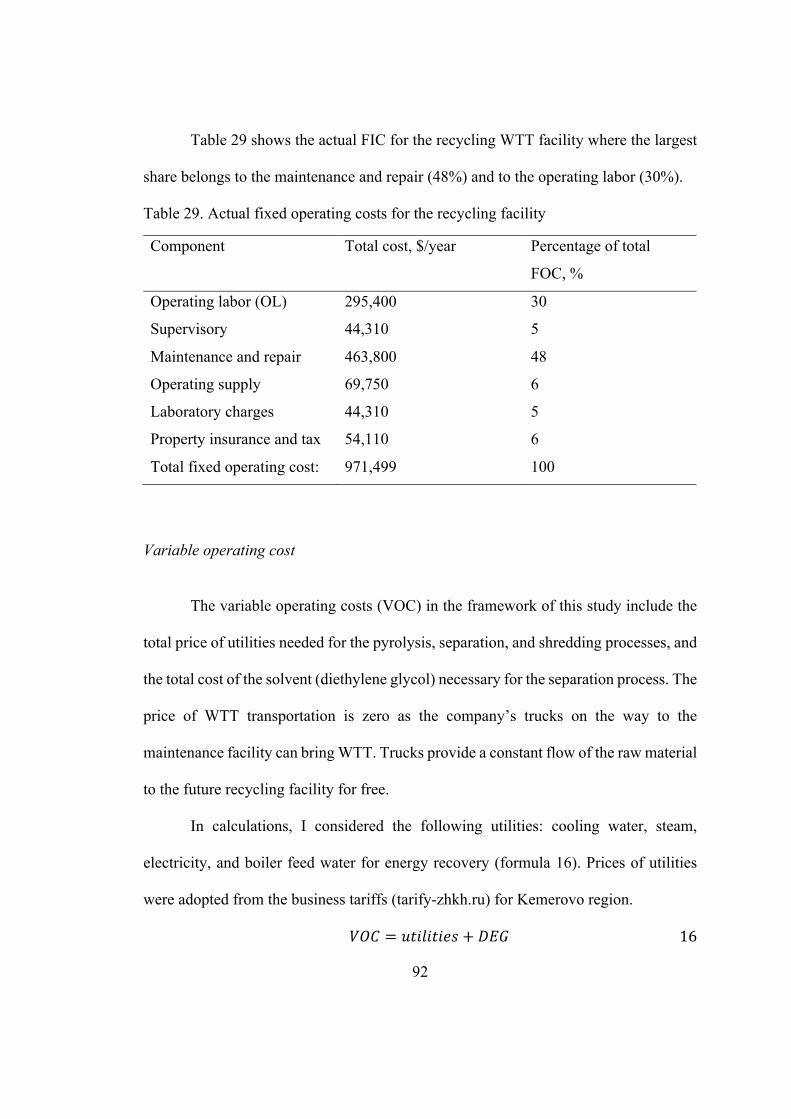
92
Table 29 shows the actual FIC for the recycling WTT facility where the largest
share belongs to the maintenance and repair (48%) and to the operating labor (30%).
Table 29. Actual fixed operating costs for the recycling facility
Component Total cost, $/year Percentage of total
FOC, %
Operating labor (OL) 295,400 30
Supervisory 44,310 5
Maintenance and repair 463,800 48
Operating supply 69,750 6
Laboratory charges 44,310 5
Property insurance and tax 54,110 6
Total fixed operating cost: 971,499 100
Variable operating cost
The variable operating costs (VOC) in the framework of this study include the
total price of utilities needed for the pyrolysis, separation, and shredding processes, and
the total cost of the solvent (diethylene glycol) necessary for the separation process. The
price of WTT transportation is zero as the company’s trucks on the way to the
maintenance facility can bring WTT. Trucks provide a constant flow of the raw material
to the future recycling facility for free.
In calculations, I considered the following utilities: cooling water, steam,
electricity, and boiler feed water for energy recovery (formula 16). Prices of utilities
were adopted from the business tariffs (tarify-zhkh.ru) for Kemerovo region.
𝑉𝑂𝐶 = 𝑢𝑡𝑖𝑙𝑖𝑡𝑖𝑒𝑠 + 𝐷𝐸𝐺 16

93
Table 30 shows the unit cost of each utility.
Table 30. Unit cost of utilities and DEG
Utility Unit Unit price, $
Cooling water m3 18.38 RUB*1.2 » 0.34$
Boiling water Ton 88.41 RUB*1.2 » 1.63$
HP steam Ton 12.1$
Electricity kWh 2.21RUB*1.2 » 0.041
DEG Kg 130 RUB » 2$
Table 31 shows the annual cost of each utility for the base case scenario.
Table 31. Annual cost of variable expenses for base case scenario
Utility Total number of units per
year
Total cost,
$/year
Percentage of
total VOC, %
Cooling water 206,900 m3/year 70,346 24
Boiling water - - -
HP steam 2,062 tons/year 24,950 9
Electricity 1,064,480 kWh 43,644 15
DEG 480+2%*480*8,000=77,280
kg/year
154,560 53
Total variable
operating cost:
293,500 100
The total operating cost is 1,264,999 $ per year (formula 14).
Revenue
Revenue is generated from selling the by-products of the pyrolytic process. In
the base case scenario, the by-products are limonene, steel, char, and TDO. The average
Russian prices of char, steel, and TDO were used in the revenue calculations. The price

94
of limonene used in the calculation of the revenue is the average selling price of
technical limonene of 95% purity. Table 32 shows the product selling prices.
Table 32. Product selling price
Product name Unit Unit price, $
Char kg 0.037 [27]
Steel kg 16,300 RUB per ton »
0.25$/ kg (sdaymetall.ru)
TDO liter 18 RUB » 0.28$ (rtut-
arb.ru)
Steam Ton 10.1 [62]
Limonene kg 455 RUB » 7$ (rusabs.ru)
Table 33 shows a breakdown of revenue generated in the base case scenario.
Table 33. Revenue for the base case scenario
Product
name
Total number of
units per year
Revenue generated,
$/year
Percentage of total
revenue, %
Char 2,840,000 105,080 2
Steel 2,000,000 94,000 2
TDO 4,080,000 1,101,600 24
Steam - - -
Limonene 400,000 3,200,000 71
Total
revenue:
- 4,500,680 100
Table 33 shows that limonene is the primary source of revenue (71%) even
though the total production of limonene is only 4.3% among all products for selling.
This can be explained by the high price of the limonene. Also, such a significant share
95
of limonene in the total revenue makes the whole process highly dependent on the
limonene quality, purity, and limonene demand on the market.
The second largest contributor to the total revenue is TDO (24%). This can be
explained by the high production of TDO which is approximately 44% of the full
products produced during the process.
Char and steel contribute only 4% of the total revenue when the total share of
these products in the total production is nearly 52%.
Profitability analysis
In this study, the prime interest rate of 8% is adopted as a minimum discount
used in DCFRR method for estimation of the economic feasibility of the project. Prime
interest rate of 8%, as well as a business tax rate of 20%, were obtained from the Central
Bank of Russia website (www.cbr.ru). However, to encourage an owner of the company
to invest in such a high-risk project as recycling, the final IRR should be more than the
prime interest rate. An IRR of 25% is used in this study as the minimum IRR to make
the project attractive for the owner [61]. The NPV is evaluated using DCFRR method
where the discount is in a range of 8% to 25%. The results are represented below in

96
Table 34. The flowchart of the base case scenario for WTT is in Figure 15.
Figure 15. Flowchart of the base case scenario

97
Table 34. Key economic indicators for the base case scenario
Discount, % Net present value,
(MM$)
Payback period,
years
8 10.39 3.6
10 8.79 3.77
12 7.4 4.0
14 6.18 4.2
16 5.11 4.46
18 4.16 4.74
20 3.32 5.07
22 2.56 5.5
24 1.89 5.98
25 1.58 6.3
IRR 31.0
The results in

98
Table 34 show that the base case scenario of the WTT recycling facility into
limonene is economically feasible and attractive. The payback period of the project
using the prime interest rate is 3.6 years which is in the range of acceptable payback
period length.
According to the results in

99
Table 34, the critical role in defining the attractiveness of the project belongs to
the limonene sell due to the high price of the chemical. But at the same time, such a
high contribution of the limonene in the total project revenue makes the feasibility and
attractiveness of the recycling process extremely correlated to the limonene market and
the limonene price. Due to these reasons, the analysis of the recycling process without
limonene production is necessary. The study of different scenarios based on Mulaudzi
[27] and shown in the next paragraph.
Scenario analysis and comparison
The additional scenarios adopted from [27] are the adding of the energy recovery
section, implementing of the better pre-treatment system to get better rubber granulate,
crumb purchase scenario, and scenario of tire-derived oil production without further
recovery of valuable chemicals. Payback period, internal rate of return, and net present
value are the key parameters to compare scenarios with each other.
Energy recovery scenario
The idea and structure of the energy recovery system were described earlier in
the research in the section “Structure of the recycling process”. The additional
equipment in this scenario is the item necessary for steam generation (EX-105 in), a
combustion chamber (HT-101), and boiler feed water pump (PC-103).
Extra revenue in energy recovery scenario is from the selling of excess steam.
The rate of generated steam is approximately 2881 kg/h, where only 258 kg/h is
necessary for the boiler and the rest 2623 kg/h can be sold [27]. Table 35 the calculations
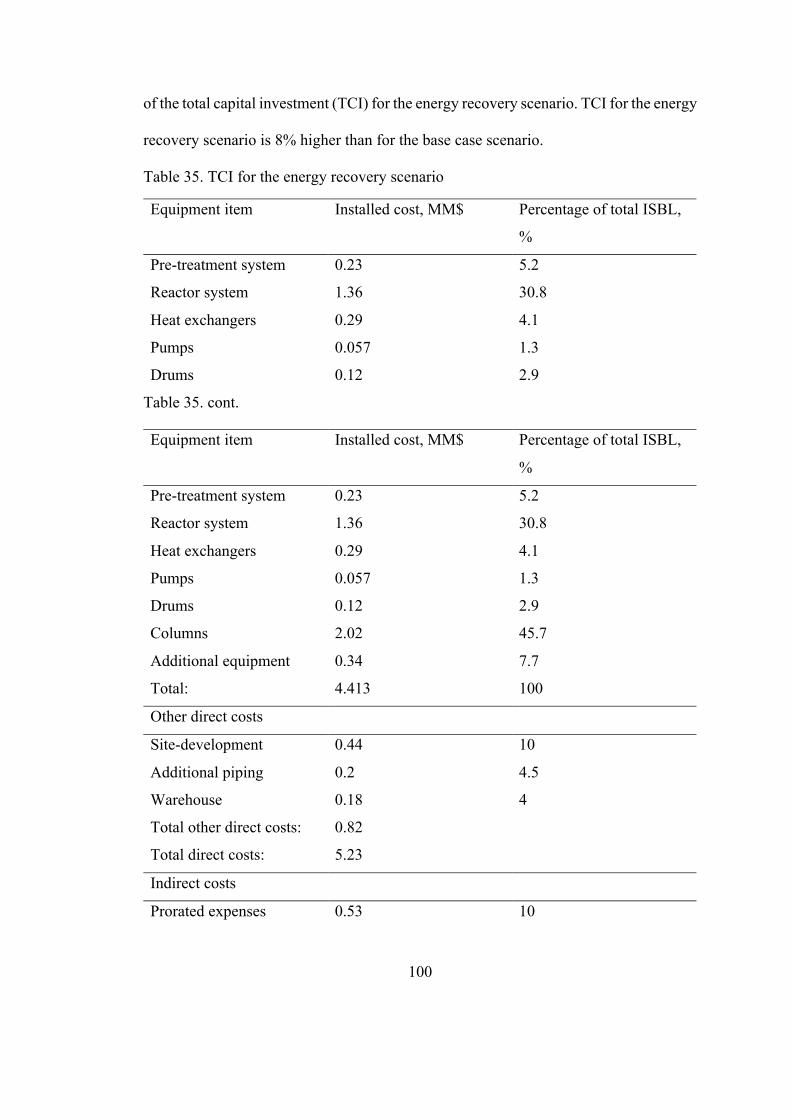
100
of the total capital investment (TCI) for the energy recovery scenario. TCI for the energy
recovery scenario is 8% higher than for the base case scenario.
Table 35. TCI for the energy recovery scenario
Equipment item Installed cost, MM$ Percentage of total ISBL,
%
Pre-treatment system 0.23 5.2
Reactor system 1.36 30.8
Heat exchangers 0.29 4.1
Pumps 0.057 1.3
Drums 0.12 2.9
Table 35. cont.
Equipment item Installed cost, MM$ Percentage of total ISBL,
%
Pre-treatment system 0.23 5.2
Reactor system 1.36 30.8
Heat exchangers 0.29 4.1
Pumps 0.057 1.3
Drums 0.12 2.9
Columns 2.02 45.7
Additional equipment 0.34 7.7
Total: 4.413 100
Other direct costs
Site-development 0.44 10
Additional piping 0.2 4.5
Warehouse 0.18 4
Total other direct costs: 0.82
Total direct costs: 5.23
Indirect costs
Prorated expenses 0.53 10

101
Home office and
construction fees
1.05 20
Field expenses 0.53 10
Project contingency 0.53 10
Other costs (start-up and
permits)
0.53 10
Total indirect cost: 3.14 60
Total fixed capital
investment
8.4
Table 35. cont.
Equipment item Installed cost, MM$ Percentage of total ISBL,
%
Working capital and land expenses
Percentage of TFCI, %
Working capital 0.17 2
Land 0.42 10
Total working capital and
land
0.59 12
Total capital investment 8.95
Table 36 shows the total operating costs for the energy recovery scenario that
includes variable operating costs and fixed operating costs.
Table 36. Operating costs
Type of the costs Amount, $/year
Total fixed operating costs 1,019,916
Total variable operating costs 330,242
Total operating costs 1,350,158

102
As you can see from Table 36, the total operating costs are 6.7% higher than for
the base case scenario due to the extra cost for electricity (approximately 7%) and use
of boiler feed water. The total revenue for the energy recovery scenario is 4.7 MM$
which is 4.5% higher than for the base case scenario due to the extra revenue from
selling steam.
Profitability analysis for the energy recovery scenario was done the same way
as for the base case scenario using DCFRR method where the discount is in a range of
8% to 25%. The results are represented below in Table 37.
Table 37. Key economic indicators for the energy recovery scenario
Discount, % Net present value,
(MM$)
Payback period,
years
8 10.4 3.77
10 8.78 3.96
12 7.3 4.18
14 6.06 4.4
16 5.11 4.72
18 3.96 5.04
20 3.09 5.45
22 2.3 5.92
24 1.6 6.55
25 1.28 6.91
IRR 29.0
The flowchart of the energy recovery scenario for WTT is in Figure 16.

103
Figure 16. Flowchart of the energy recovery scenario

104
The results in Table 37 also show that the energy recovery scenario of the WTT
recycling facility into limonene is economically feasible and attractive. The payback
period of the project with the prime interest rate is 3.77 years which is in the range of
acceptable payback period length, but the value is bigger than in the base case scenario
where the payback period is only 3.6 years. IRR in the energy recovery scenario is more
than 25% which complies with IRR of a high-risk project, but at the time IRR value for
the energy recovery is smaller than for the base case.
Additional pre-treatment
The additional equipment in the pre-treatment scenario would help to reduce the
tire chips to crumb size. Table 38 shows the total capital investment by the category.
The total capital investment of the pre-treatment scenario is almost 21% higher due to
the implementation of additional grinding units.
Table 38. TCI for the pre-treatment scenario
Equipment item Installed cost, MM$ Percentage of total ISBL,
%
Pre-treatment system 0.23 4.7
Reactor system 1.36 27.8
Heat exchangers 0.29 5.9
Pumps 0.057 1.16
Drums 0.12 2.45
Columns 2.02 41.3
Additional equipment 0.81 16.6
Total: 4.887 100

105
Table 38. Cont.
Equipment item Installed cost, MM$ Percentage of total ISBL,
%
Other direct costs
Site-development 0.49 10
Additional piping 0.22 4.5
Warehouse 0.2 4
Total other direct costs: 0.9
Total direct costs: 5.8
Indirect costs
Prorated expenses 0.58 10
Home office and
construction fees
1.16 20
Field expenses 0.58 10
Project contingency 0.58 10
Other costs (start-up and
permits)
0.58 10
Total indirect cost: 3.47 60
Total fixed capital
investment
9.26
Working capital and land expenses
Percentage of TFCI, %
Working capital 0.1852 2
Land 0.4633 10
Total working capital and
land
0.6486 12
Total capital investment 9.91

106
Table 39 shows the total operating costs for the pre-treatment scenario. The
operating costs of the pre-treatment scenario are 22% higher than the total operating
expenses for the base case scenario because of the extra electricity that
Table 39. Operating costs
Type of the costs Amount, $/year
Total fixed operating costs 1,088,217
Total variable operating costs 450,260
Total operating costs 1,538, 477
The total revenue for the pre-treatment scenario is the same as in the base case
scenario 4.5 MM$.
Profitability analysis for the pre-treatment scenario was done the same way as
for the base case and the energy recovery scenarios using DCFRR method where the
discount is in a range of 8% to 25%. The results are represented below in Table 40.
The flowchart of the pre-treatment scenario for WTT is in Figure 17.

107
Figure 17. Flowchart of the pre-treatment scenario

108
Table 40. Key economic indicators for the pre-treatment scenario
Discount, % Net present value,
(MM$)
Payback period,
years
8 7.5 4.83
10 6.03 5.16
12 4.7 5.54
14 3. 6 5.98
16 2.6 6.55
18 1.7 7.26
20 0.9 8.22
22 0.2 9.55
24 - -
25 - -
IRR 22.5
The results show that the pre-treatment scenario of the WTT recycling facility
into limonene is not economically attractive because of the high payback period (4.83
years) and low IRR value (22.5%).
Crumb purchase scenario
In this scenario, I assumed purchasing of necessary rubber material (30 ton/day)
instead of recycling of WTT. This assumption allows for reducing the total capital
investment by illuminating grinding equipment. Purchasing of crumb increases the
yield of the main valuable chemical limonene, as the purchased crumb is steel-free
material and instead of 24 ton/day as in the base case scenario, there are 30 ton/day of
the steel-free material. Figure 18 shows the generalized input-output structure of the
crumb purchase scenario. Products’ distribution is adopted from Islam [57].

109
Figure 18. Input-output structure of the crumb purchase scenario
Table 41 shows the total capital investment for the crumb-purchase scenario.
The ISBL of the crumb purchase scenario is 6% lower than in the base case. In total,
the total capital investment of the crumb purchase scenario is 6% lower than in the base
case scenario due to the absence of the pre-treatment system.
Table 41. TCI for the crumb purchase scenario
Equipment item Installed cost, MM$ Percentage of total ISBL,
%
Pre-treatment system 0.0 -
Reactor system 1.36 35.4
Heat exchangers 0.29 7.55
Pumps 0.057 1.5
Drums 0.12 3.1
Columns 2.02 52.6
Additional equipment 0.0 -
Total: 3.84 100

110
Table 41. Cont.
Other direct costs
Site-development 0.38 10
Additional piping 0.17 4.5
Warehouse 0.15 4
Total other direct costs: 0.7
Total direct costs: 4.55
Indirect costs
Prorated expenses 0.46 10
Home office and
construction fees
0.91 20
Field expenses 0.46 10
Project contingency 0.46 10
Other costs (start-up and
permits)
0.46 10
Total indirect cost: 2.73 60
Total fixed capital
investment
7.29
Working capital and land expenses
Percentage of TFCI, %
Working capital 0.15 2
Land 0.36 10
Total working capital and
land
0.51 12
Total capital investment 7.8
In the crumb purchase scenario, two factors differ the total operating cost of this
scenario and the base scenario.
1. Electricity. The crumb purchase reduces electricity consumption by 83% due
to the lack of grinding process.

111
2. Crumb purchase. The price of the crumb is 14RUB/kg »0.22$/kg
(shinopererabotka.ru). The total amount of crumb needed is 10,9 ton/year which equals
2.4 MM$ of additional variable operating cost per year. The crumb purchase is
responsible for 89% of the total variable operating expensses and for 66% of the total
operating costs.
Table 42 demonstrates the total operating costs per year for the crumb purchase
scenario. The total operating costs of the base case are almost 3 times less than in the
crumb purchase scenario. The flowchart of the crumb purchase scenario for WTT is in
Figure 19.
The primary revenue sources in this scenario are char, limonene, and TDO. The
total revenue is 5.5 MM$ which is 22% higher than in the base case. Extra limonene is
the main reason for the revenue increase. The total contribution of selling the additional
limonene in the overall revenue increase is 78%.
Table 42. Operating costs of the crumb purchase scenario
Type of the costs Amount, $/year
Total fixed operating costs 938,357
Total variable operating costs 2,700,482
Total operating costs 3,638,840

112
Figure 19. Flowchart of the crumb purchase scenario
Profitability analysis for this scenario has been done the same way as for the
base case, energy recovery, and pre-treatment scenarios using DCFFR method where
the discount is in a range of 8% to 25%. The results are represented below in Table 43.

113
Table 43. Key economic indicators for the crumb purchase scenario
Discount, % Net present value,
(MM$)
Payback period,
years
8 3.3 6.34
10 2.3 6.91
12 1.5 7.64
14 0.78 8.6
16 0.13 9.72
18 - -
20 - -
22 - -
24 - -
25 - -
IRR 16.5
Low IRR value (16.5%), the high payback period for the prime interest rate (8%)
of 6.34 years make the crumb purchase scenario not feasible and economically
attractive for further consideration.
TDO production
The main idea of this scenario is to illuminate the most expensive equipment
which in this case is the limonene recovery system. The share of the distillation columns
in the total ISBL for the base scenario is 49.5%. After the illumination of the distillation
columns, the recycling process products are steel, char, and TDO (Figure 20).

114
Figure 20. Generalized input-output structure for the TDO production scenario
Table 44 shows the total capital investment for the TDO production scenario.
The ISBL of the crumb purchase scenario is 50.2% lower than in the base case due to
illumination of the distillation columns. The total capital investment of the crumb
purchase scenario is two times less than in the base case scenario.
Table 44. TCI for the TDO production scenario
Equipment item Installed cost, MM$ Percentage of total ISBL,
%
Pre-treatment system 0.23 11.2
Reactor system 1.36 66.3
Heat exchangers 0.29 14.1
Pumps 0.057 2.8
Drums 0.12 5.8
Columns 0.0 -
Additional equipment 0.0 -
Total: 2.05 100

115
Table 44. Cont.
Other direct costs
Site-development 0.2 10
Additional piping 0.09 4.5
Warehouse 0.09 4
Total other direct costs: 0.38
Total direct costs: 2.43
Indirect costs
Prorated expenses 0.24 10
Home office and
construction fees
0.49 20
Field expenses 0.24 10
Project contingency 0.24 10
Other costs (start-up and
permits)
0.24 10
Total indirect cost: 1.46 60
Total fixed capital
investment
3.9
Working capital and land expenses
Percentage of TFCI, %
Working capital 0.08 2
Land 0.19 10
Total working capital and
land
0.27 12
Total capital investment 4.17
The total operating costs for the TDO production scenario are 38% less than for
the base due to the less amount of equipment. Even though the production of tire-
derived oil increased by 11% compared to the base case, the price of TDO is still low.

116
As a result, the total revenue is only 1.4 MM$ which is 3.2 times or 69% less than in
the base scenario.
Table 45. Operating costs of the TDO production scenario
Type of the costs Amount, $/year
Total fixed operating costs 680,425
Total variable operating costs 103,874
Total operating costs 784,299
Table 46 shows the results of profitability analysis for the TDO production
scenario using DCFFR method with a discount in a range of 8% to 25%. As can be
noticed from Table 46, the recycling process of the WTT to TDO without further
separation is not economically attractive and feasible. The flowchart of the TDO
production scenario for WTT is in Figure 21.
Table 46. Key economic indicators for the TDO production scenario
Discount, % Net present value,
(MM$)
Payback period,
years
8 -1.1 -
IRR 5.0
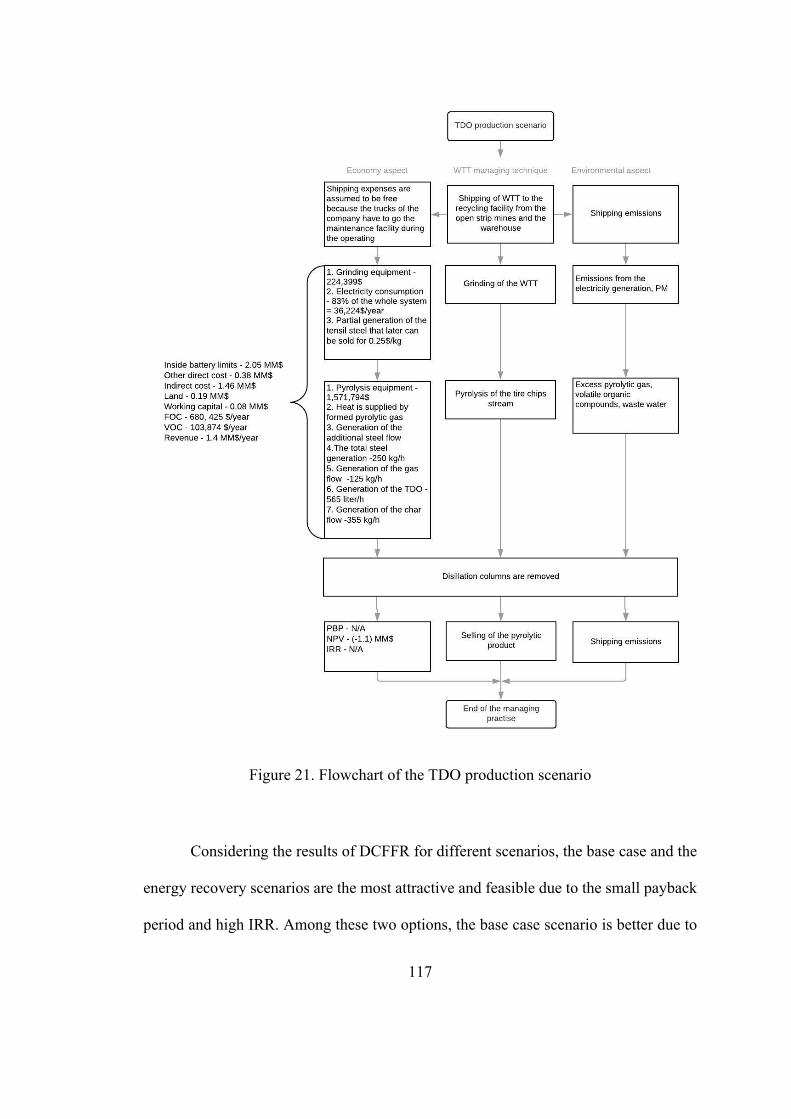
117
Figure 21. Flowchart of the TDO production scenario
Considering the results of DCFFR for different scenarios, the base case and the
energy recovery scenarios are the most attractive and feasible due to the small payback
period and high IRR. Among these two options, the base case scenario is better due to

118
the higher values of the key economic parameters. The sensitivity analysis of the base
case scenario is done in the next paragraph.
The least attractive scenario is the TDO production scenario. Table 47
demonstrates cash flows for all five scenarios (base case, energy recovery, pre-
treatment, crumb purchase, and TDO production).
Sensitivity analysis
Sensitivity analysis helps to identify how the fluctuation of the particular
parameter affects the key economic indicators of the process [66], [68]. In the
framework of this study, the first-order sensitivity analysis is used [61]. This type of
sensitivity analysis was used by Dutta [66] in the design of the pyrolytic process for the
conversion of lignocellulosic biomass to hydrocarbon fuels, by James [68] in his
research of the biomass conversion into hydrocarbon fuels, and by Mulaudzi [27] in his
study of the waste tire conversion. In [66], [68] the authors used minimum fuel selling
price (MFSP) as the critical parameter of the sensitivity analysis. In this study, the key
economic indicators that are used as the measure of the project profitability remain the
same as in the economic evaluation (NPV, IRR, and PBP) [61].
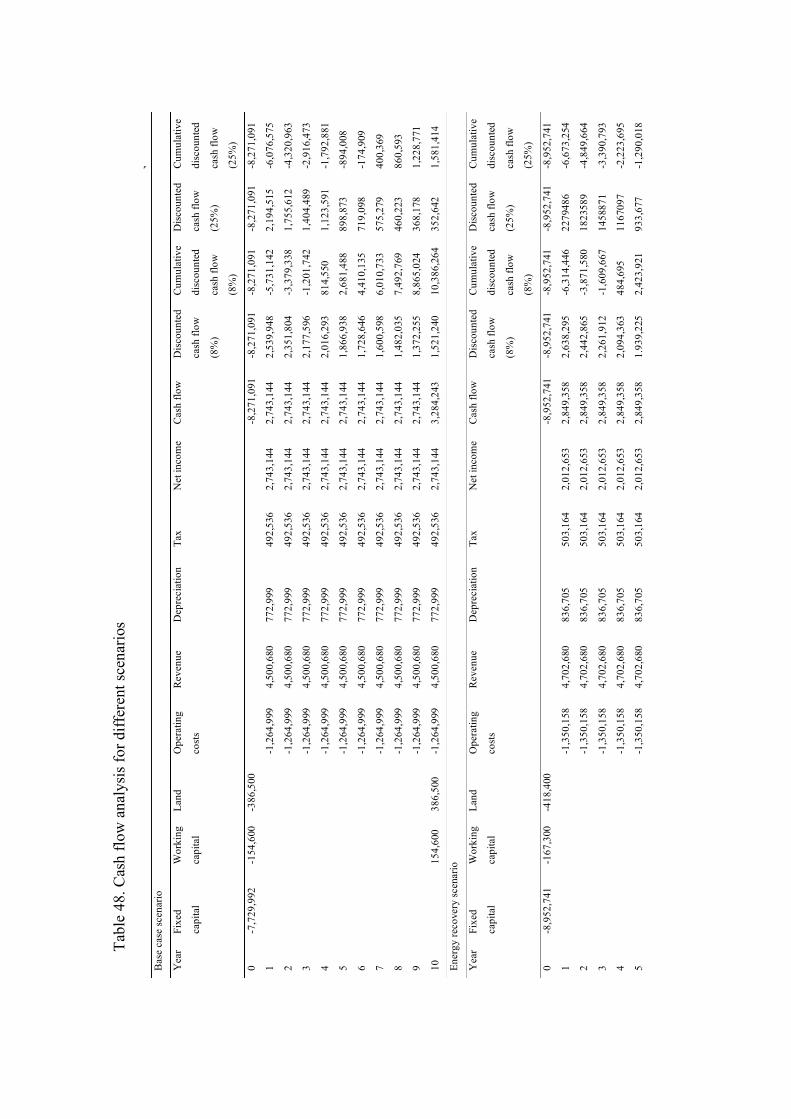
119
Table 47. Cash flow analysis for different scenarios
Tabl
e 48
. Cas
h flo
w a
naly
sis fo
r diff
eren
t sce
nario
s
Bas
e ca
se sc
enar
io
Yea
r Fi
xed
capi
tal
Wor
king
capi
tal
Land
O
pera
ting
cost
s
Rev
enue
D
epre
ciat
ion
Tax
Net
inco
me
Cas
h flo
w
Dis
coun
ted
cash
flow
(8%
)
Cum
ulat
ive
disc
ount
ed
cash
flow
(8%
)
Dis
coun
ted
cash
flow
(25%
)
Cum
ulat
ive
disc
ount
ed
cash
flow
(25%
)
0 -7
,729
,992
-1
54,6
00
-386
,500
-8,2
71,0
91
-8,2
71,0
91
-8,2
71,0
91
-8,2
71,0
91
-8,2
71,0
91
1
-1,2
64,9
99
4,50
0,68
0 77
2,99
9 49
2,53
6 2,
743,
144
2,74
3,14
4 2,
539,
948
-5,7
31,1
42
2,19
4,51
5 -6
,076
,575
2
-1,2
64,9
99
4,50
0,68
0 77
2,99
9 49
2,53
6 2,
743,
144
2,74
3,14
4 2,
351,
804
-3,3
79,3
38
1,75
5,61
2 -4
,320
,963
3
-1,2
64,9
99
4,50
0,68
0 77
2,99
9 49
2,53
6 2,
743,
144
2,74
3,14
4 2,
177,
596
-1,2
01,7
42
1,40
4,48
9 -2
,916
,473
4
-1,2
64,9
99
4,50
0,68
0 77
2,99
9 49
2,53
6 2,
743,
144
2,74
3,14
4 2,
016,
293
814,
550
1,12
3,59
1 -1
,792
,881
5
-1,2
64,9
99
4,50
0,68
0 77
2,99
9 49
2,53
6 2,
743,
144
2,74
3,14
4 1,
866,
938
2,68
1,48
8 89
8,87
3 -8
94,0
08
6
-1,2
64,9
99
4,50
0,68
0 77
2,99
9 49
2,53
6 2,
743,
144
2,74
3,14
4 1,
728,
646
4,41
0,13
5 71
9,09
8 -1
74,9
09
7
-1,2
64,9
99
4,50
0,68
0 77
2,99
9 49
2,53
6 2,
743,
144
2,74
3,14
4 1,
600,
598
6,01
0,73
3 57
5,27
9 40
0,36
9
8
-1,2
64,9
99
4,50
0,68
0 77
2,99
9 49
2,53
6 2,
743,
144
2,74
3,14
4 1,
482,
035
7,49
2,76
9 46
0,22
3 86
0,59
3
9
-1,2
64,9
99
4,50
0,68
0 77
2,99
9 49
2,53
6 2,
743,
144
2,74
3,14
4 1,
372,
255
8,86
5,02
4 36
8,17
8 1,
228,
771
10
15
4,60
0 38
6,50
0 -1
,264
,999
4,
500,
680
772,
999
492,
536
2,74
3,14
4 3,
284,
243
1,52
1,24
0 10
,386
,264
35
2,64
2 1,
581,
414
Ener
gy re
cove
ry sc
enar
io
Yea
r Fi
xed
capi
tal
Wor
king
capi
tal
Land
O
pera
ting
cost
s
Rev
enue
D
epre
ciat
ion
Tax
Net
inco
me
Cas
h flo
w
Dis
coun
ted
cash
flow
(8%
)
Cum
ulat
ive
disc
ount
ed
cash
flow
(8%
)
Dis
coun
ted
cash
flow
(25%
)
Cum
ulat
ive
disc
ount
ed
cash
flow
(25%
)
0 -8
,952
,741
-1
67,3
00
-418
,400
-8,9
52,7
41
-8,9
52,7
41
-8,9
52,7
41
-8,9
52,7
41
-8,9
52,7
41
1
-1,3
50,1
58
4,70
2,68
0 83
6,70
5 50
3,16
4 2,
012,
653
2,84
9,35
8 2,
638,
295
-6,3
14,4
46
2279
486
-6,6
73,2
54
2
-1,3
50,1
58
4,70
2,68
0 83
6,70
5 50
3,16
4 2,
012,
653
2,84
9,35
8 2,
442,
865
-3,8
71,5
80
1823
589
-4,8
49,6
64
3
-1,3
50,1
58
4,70
2,68
0 83
6,70
5 50
3,16
4 2,
012,
653
2,84
9,35
8 2,
261,
912
-1,6
09,6
67
1458
871
-3,3
90,7
93
4
-1,3
50,1
58
4,70
2,68
0 83
6,70
5 50
3,16
4 2,
012,
653
2,84
9,35
8 2,
094,
363
484,
695
1167
097
-2,2
23,6
95
5
-1,3
50,1
58
4,70
2,68
0 83
6,70
5 50
3,16
4 2,
012,
653
2,84
9,35
8 1.
939,
225
2,42
3,92
1 93
3,67
7 -1
,290
,018

120
Tabl
e 47
. con
t.
6
-1,3
50,1
58
4,70
2,68
0 83
6,70
5 50
3,16
4 2,
012,
653
2,84
9,35
8 1,
795,
579
4,21
9,50
0 74
6,94
2 -5
43,0
75
7
-1,3
50,1
58
4,70
2,68
0 83
6,70
5 50
3,16
4 2,
012,
653
2,84
9,35
8 1,
662,
573
5,88
2,07
4 59
7,55
3 54
,477
8
-1,3
50,1
58
4,70
2,68
0 83
6,70
5 50
3,16
4 2,
012,
653
2,84
9,35
8 1,
539,
419
7,42
1,49
3 47
8,04
3 53
2,52
0
9
-1,3
50,1
58
4,70
2,68
0 83
6,70
5 50
3,16
4 2,
012,
653
2,84
9,35
8 1,
425,
388
8,84
6,88
2 38
2,43
4 91
4,95
5
10
16
7,30
0 41
8,40
0 -1
,350
,158
4,
702,
680
836,
705
503,
164
2,01
2,65
3 3,
435,
058
1,59
1,03
8 10
,437
,976
36
8,83
5 1,
283,
791
Pre-
treat
men
t
Yea
r Fi
xed
capi
tal
Wor
king
capi
tal
Land
O
pera
ting
cost
s
Rev
enue
D
epre
ciat
ion
Tax
Net
inco
me
Cas
h flo
w
Dis
coun
ted
cash
flow
(8%
)
Cum
ulat
ive
disc
ount
ed
cash
flow
(8%
)
Dis
coun
ted
cash
flow
(25%
)
Cum
ulat
ive
disc
ount
ed
cash
flow
(25%
)
0 -9
,914
,354
-1
85,3
00
-463
,300
-9,9
14,3
54
-9,9
14,3
54
-9,9
14,3
54
-9,9
14,3
54
-9,9
14,3
54
1
-1,5
38,4
77
4,50
0,68
0 92
6,57
5 40
7,12
5 1,
628,
502
2,55
5,07
7 2,
365,
812
-7,5
48,5
42
- -
2
-1,5
38,4
77
4,50
0,68
0 92
6,57
5 40
7,12
5 1,
628,
502
2,55
5,07
7 2,
190,
567
-5,3
57,9
75
- -
3
-1,5
38,4
77
4,50
0,68
0 92
6,57
5 40
7,12
5 1,
628,
502
2,55
5,07
7 2,
028,
302
-3,3
29,6
72
- -
4
-1,5
38,4
77
4,50
0,68
0 92
6,57
5 40
7,12
5 1,
628,
502
2,55
5,07
7 1,
878,
058
-1,4
51,6
14
- -
5
-1,5
38,4
77
4,50
0,68
0 92
6,57
5 40
7,12
5 1,
628,
502
2,55
5,07
7 1,
738,
942
287,
328
- -
6
-1,5
38,4
77
4,50
0,68
0 92
6,57
5 40
7,12
5 1,
628,
502
2,55
5,07
7 1,
610,
132
1,89
7,46
0 -
-
7
-1,5
38,4
77
4,50
0,68
0 92
6,57
5 40
7,12
5 1,
628,
502
2,55
5,07
7 1,
490,
863
3,38
8,32
3 -
-
8
-1,5
38,4
77
4,50
0,68
0 92
6,57
5 40
7,12
5 1,
628,
502
2,55
5,07
7 1,
380,
428
4,76
8,75
2 -
-
9
-1,5
38,4
77
4,50
0,68
0 92
6,57
5 40
7,12
5 1,
628,
502
2,55
5,07
7 1,
278,
174
6,04
6,92
7 -
-
10
18
5,30
0 46
3,30
0 -1
,538
,477
4,
500,
680
926,
575
407,
125
1,62
8,50
2 3,
203,
608
1,48
3,92
3 7,
530,
851
- -
Cru
mb
purc
hase
Yea
r Fi
xed
capi
tal
Wor
king
capi
tal
Land
O
pera
ting
cost
s
Rev
enue
D
epre
ciat
ion
Tax
Net
inco
me
Cas
h flo
w
Dis
coun
ted
cash
flow
(8%
)
Cum
ulat
ive
disc
ount
ed
cash
flow
(8%
)
Dis
coun
ted
cash
flow
(25%
)
Cum
ulat
ive
disc
ount
ed
cash
flow
(25%
)
0 -7
,804
,485
-1
45,9
00
-364
,700
-7,8
04,4
85
-7,8
04,4
85
-7,8
04,4
85
-7,8
04,4
85
-7,8
04,4
85

121
Ta
ble
47. c
ont.
1
-3,6
38,8
40
5,47
9,66
4 72
9,39
1 22
2,28
6 88
9,14
6 1,
618,
537
1,49
8,64
5 -6
,305
,839
-
-
2
-3,6
38,8
40
5,47
9,66
4 72
9,39
1 22
2,28
6 88
9,14
6 1,
618,
537
1,38
7,63
5 -4
,918
,204
-
-
3
-3,6
38,8
40
5,47
9,66
4 72
9,39
1 22
2,28
6 88
9,14
6 1,
618,
537
1,28
4,84
7 -3
,633
,357
-
-
4
-3,6
38,8
40
5,47
9,66
4 72
9,39
1 22
2,28
6 88
9,14
6 1,
618,
537
1,18
9,67
3 -2
,443
,683
-
-
5
-3,6
38,8
40
5,47
9,66
4 72
9,39
1 22
2,28
6 88
9,14
6 1,
618,
537
1,10
1,54
9 -1
, 342
,134
-
-
6
-3,6
38,8
40
5,47
9,66
4 72
9,39
1 22
2,28
6 88
9,14
6 1,
618,
537
1,01
9,95
3 -3
22,1
80
- -
7
-3,6
38,8
40
5,47
9,66
4 72
9,39
1 22
2,28
6 88
9,14
6 1,
618,
537
944,
401
622,
220
- -
8
-3,6
38,8
40
5,47
9,66
4 72
9,39
1 22
2,28
6 88
9,14
6 1,
618,
537
874,
445
1,49
6,66
5 -
-
9
-3,6
38,8
40
5,47
9,66
4 72
9,39
1 22
2,28
6 88
9,14
6 1,
618,
537
809,
671
2,30
6,33
7 -
-
10
14
5,90
0 36
4,70
0 -3
,638
,840
5,
479,
664
729,
391
222,
286
889,
146
2,12
9,11
98
6,19
0 3,
292,
528
- -
Cru
mb
purc
hase
Yea
r Fi
xed
capi
tal
Wor
king
capi
tal
Land
O
pera
ting
cost
s
Rev
enue
D
epre
ciat
ion
Tax
Net
inco
me
Cas
h flo
w
Dis
coun
ted
cash
flow
(8%
)
Cum
ulat
ive
disc
ount
ed
cash
flow
(8%
)
Dis
coun
ted
cash
flow
(25%
)
Cum
ulat
ive
disc
ount
ed
cash
flow
(25%
)
0 -4
,173
,100
-7
8,00
0 -1
95,0
00
-4
,173
,100
-4
,173
,100
-4
,173
,100
-4
,173
,100
-4
,173
,100
1
-784
,299
1,
419,
480
390,
007
49,0
34
196,
138
586,
146
542,
727
-3,6
30,3
49
- -
2
-784
,299
1,
419,
480
390,
007
49,0
34
196,
138
586,
146
502,
525
-3,1
27,8
23
- -
3
-784
,299
1,
419,
480
390,
007
49,0
34
196,
138
586,
146
465,
301
-2,6
62,5
21
- -
4
-784
,299
1,
419,
480
390,
007
49,0
34
196,
138
586,
146
430,
834
-2,2
31,6
86
- -
5
-784
,299
1,
419,
480
390,
007
49,0
34
196,
138
586,
146
398,
921
-1,8
32,7
65
- -
6
-784
,299
1,
419,
480
390,
007
49,0
34
196,
138
586,
146
369,
371
-1,4
63,3
94
- -
7
-784
,299
1,
419,
480
390,
007
49,0
34
196,
138
586,
146
342,
010
-1,1
21,3
83
- -
8
-784
,299
1,
419,
480
390,
007
49,0
34
196,
138
586,
146
316,
676
-804
,707
-
-
9
-784
,299
1,
419,
480
390,
007
49,0
34
196,
138
586,
146
293,
218
-511
,488
-
-
10
78
,000
19
5,00
0 -7
84,2
99
1,41
9,48
0 39
0,00
7 49
,034
19
6,13
8 85
9,15
1 39
7,95
3 -1
13,5
35
- -

122
The main idea of this sensitivity method is to check how the chosen profitability
indicators are affected by the various parameters. In mathematical terms this can be
expressed by equation 17.
𝑆𝑛 = i�(7^_'_8&^&'b&^:(_;)�(c')
m, 17 Where 𝜕 (xn) is a change of an affecting economic parameter, n is the total
number of modifying parameters, and Sn is the sensitivity coefficient of the n affecting
parameter.
As has been mentioned in the previous paragraph, the base scenario was chosen
for the sensitivity analysis. The selected impact parameters are the installed cost of the
reactor system, distillation columns, the total price of operating labor, limonene price
per kg, and limonene yield.
The possible range of parameters variation is shown below in Table 48. The
prices of the reactor system and distillation columns are used as the most significant
contributors to the total capital investment of the system. The total operating labor is
used as another parameter to change because this item has the highest contribution to
the total operating costs. Finally, the price and yield of limonene are used as the last
two parameters to change in sensitivity analysis as the contribution of the limonene to
the total revenue is the highest. It is worthwhile to mention that the change of limonene
yield also influences the total yield of TDO what can be seen from Table 51.

123
Table 48. The range of parameters variation in sensitivity analysis
Name of the
parameter
Original value Min value Max value
Reactor system 1.36 MM$ 0.95 MM$ (-
30%)
1.77 MM$
(+30%)
Distillation
column
2.02 MM$ 1.4 MM$ (-
30%)
2.6 MM$
(+30%)
Operating labor 14,770 $/year 11,076 $/ year
(-25%)
18,463 $/year
(+25%)
Limonene yield 5% on steel-free basis 3% on steel-
free basis
15% on steel-
free basis
Limonene price 8 $/kg 3$/kg (-58%) 12 $/kg (+715)
The effect of each parameter on the NPV, PBP, and IRR is shown in Tables 49-
53. From Tables 49-53 it is evident that the economic feasibility and attractiveness of
the recycling project highly depends on the limonene price and its production volume.
Just 2% less of the total limonene production volume in Table 53 made the project not
feasible. The overall drop of NPV is almost 64% and decrease in IRR value to 17.5%
compared with the base case values.
However, the high sensitivity of the process to the total limonene production
volume makes the recycling facility highly attractive with the slightest increase of the
total limonene yield. Just 2% of extra produced limonene increased the NPV by 64%
compared the base value, decreased the payback to 2.55 years, and increased the IRR
by 13% (44.5%).
The effect of changing the highest operating cost item (the total operating labor)
on the fluctuation of the key economic indicators is negligible. The IRR of the process

124
altered by ±1%. The change of NPV is ±5%. The payback period remained almost the
same. This means that there is no reason for the company to change the salary of
employees to make the process feasible as it does not affect the key economic indicators
at all. The fluctuation of the price of the most expensive equipment has changed the key
parameters more than the total operating labor, but still, the lowest IRR values have
acceptable values of more than 25%. However, the payback in both cases for the highest
value of the parameter is more than 4 years (4.06 years with the highest installed cost
of the reactor system and 4.31 years with the highest installed cost of the distillation
columns). Figure 22 shows how the change of the economic parameters affects the NPV
values compared to the base case scenario.
Table 49. Sensitivity analysis for the base scenario by changing the price of the reactor system
reactor system
change
reactor system
price, MM$ NPV, MM$ PBP, year IRR, %
-30 0.95 11.4 3.14 35.5
-25 1.02 11.23 3.22 34.5
-20 1.09 11.06 3.29 34.5
-15 1.16 10.89 3.37 33.5
-10 1.22 10.72 3.44 32.5
-5 1.29 10.56 3.52 31.5
0 1.36 10.39 3.6 31.5
5 1.43 10.22 3.67 30.5
10 1.5 10.05 3.75 29.5
15 1.56 9.88 3.83 29.5
20 1.63 9.71 3.9 28.5
25 1.7 9.54 3.98 27.5
30 1.77 9.37 4.06 27.5
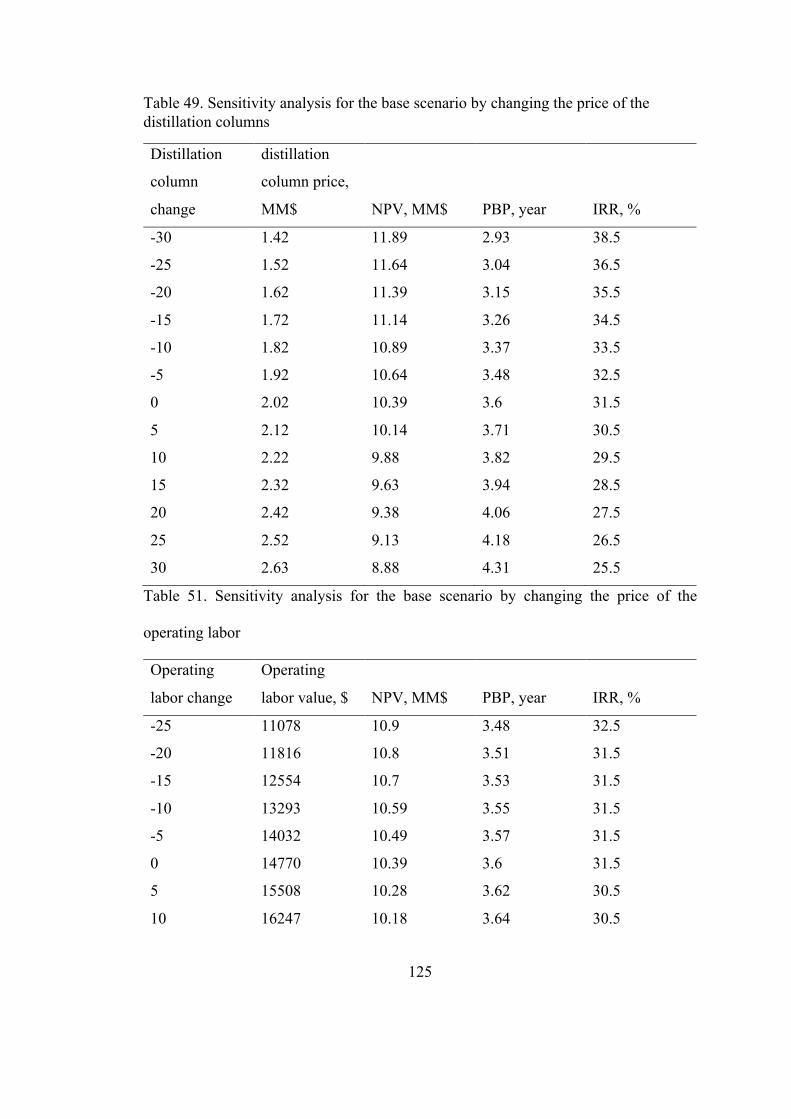
125
Table 49. Sensitivity analysis for the base scenario by changing the price of the distillation columns
Distillation
column
change
distillation
column price,
MM$ NPV, MM$ PBP, year IRR, %
-30 1.42 11.89 2.93 38.5
-25 1.52 11.64 3.04 36.5
-20 1.62 11.39 3.15 35.5
-15 1.72 11.14 3.26 34.5
-10 1.82 10.89 3.37 33.5
-5 1.92 10.64 3.48 32.5
0 2.02 10.39 3.6 31.5
5 2.12 10.14 3.71 30.5
10 2.22 9.88 3.82 29.5
15 2.32 9.63 3.94 28.5
20 2.42 9.38 4.06 27.5
25 2.52 9.13 4.18 26.5
30 2.63 8.88 4.31 25.5
Table 51. Sensitivity analysis for the base scenario by changing the price of the
operating labor
Operating
labor change
Operating
labor value, $ NPV, MM$ PBP, year IRR, %
-25 11078 10.9 3.48 32.5
-20 11816 10.8 3.51 31.5
-15 12554 10.7 3.53 31.5
-10 13293 10.59 3.55 31.5
-5 14032 10.49 3.57 31.5
0 14770 10.39 3.6 31.5
5 15508 10.28 3.62 30.5
10 16247 10.18 3.64 30.5

126
Table 51. cont.
Operating
labor change
Operating
labor value, $ NPV, MM$ PBP, year IRR, %
15 16986 10.08 3.67 30.5
20 17724 9.97 3.69 30.5
25 18462 9.87 3.71 30.5
Table 50. Sensitivity analysis for the base scenario by changing the price of limonene
Limonene
price change
Revenue from
limonene,
$/year NPV, MM$ PBP, year IRR, %
5$ 2000000 3.94 6.03 17.5
6$ 2400000 6.09 4.91 22.5
7$ 2800000 8.24 4.15 26.5
8$ the base
price 3200000 10.39 3.6 31.5
9$ 36000000 12.53 3.17 35.5
10$ 4000000 14.68 2.83 39.5
11$ 4400000 16.83 2.57 43.5
12$ 4800000 18.98 2.34 47.5
Table 53. Sensitivity analysis for the base scenario by changing the yield of limonene
Limonene
yield on
steel free
basis
Limonene
yield per
hour,
kg/h
Percentage
of
limonene
from
TDO, %
TDO
yield per
hour, l/h
NPV,
MM$
PBP,
year IRR, %
3% 30 5.8 533 3.78 6.14 17.5
4% 40 7.7 522 7.09 4.53 24.5

127
Table 53. cont.
Limonene
yield on
steel free
basis
Limonene
yield per
hour,
kg/h
Percentage
of
limonene
from
TDO, %
TDO
yield per
hour, l/h
NPV,
MM$
PBP,
year IRR, %
5% the
base 50 9.6 511 10.39 3.6 31.5
6% 60 11.5 500 13.71 2.97 37.5
7% 70 13.5 489 17.01 2.55 44.5
8% 80 15.4 478 20.32 2.22 50.5
9% 90 17.3 467 23.63 1.97 -
10% 100 19.2 457 26.95 1.77 -

128
Figu
re 2
2. E
ffec
t of v
aria
tion
of k
ey p
aram
eter
s on
NPV
at 8
% p
rime
inte
rest
rate

129
CHAPTER VI: CONCLUSION AND RECOMMENDATIONS
The aim of this study was to discover the possibility of recycling the waste truck
tires accumulating by Siberian coal transportation company “SibTreid NK” and
evaluate the economic feasibility of the most attractive option. As mentioned in the first
chapter, the goal was set out to be achieved through addressing the following objectives:
Objective 1: Description of the company and the location, including general
characteristics of Kemerovo region, status of coal mining industry for Kuzbass,
and company’s profile
In order to develop a project for a certain company, it is important to know not
only the initial data or conditions, but also take into account the specifics of the location.
It was demonstrated that the region, where the company “SibTreidNK” is located, is
one of the major coal regions of Russia. The mining industry of the region has been
dramatically increased over last 26 years and is still growing. It was mentioned that the
industry plays a crucial role in economic development of the Kemerovo region overall.
The company “SibTreidNK” is one of the biggest companies related to coal industry.
The company is responsible for three different activities including the transportation of
coal. Currently the company uses trucks of three different carrying capacities: 50-, 12-
, and 220-ton. Nowadays, the company goes through the replacement of trucks with
small carrying capacity to a big one due to the increased demand in transportation. The
geography of the company’s coal transportation activity was illustrated in the first
chapter.

130
Objective 2: Characterization of tires’ disposal problem in the company,
analysis of WTT life cycle within and outside the company and description of the
composition of WTT.
It was shown, that all waste truck tires produced by the company either
stockpiled or dumped into the open strip mines where the company is working. The rate
of tires disposal was reduced after the implementation of the retreading facility on the
territory of the company. The approximate rate of truck tires accumulation/dumping is
2 truck tires per day of the unknown size. According to the company, the total number
of dumped and stockpiled tires is many thousands, but the exact number is unknown.
The generalized scheme of the truck tires lifecycle within the company is shown in the
first chapter.
The company uses three brands of tires, but the number and the model of each
brand is also unknown. The truck tire composition was adapted from studies done
specially for this type of waste.
Objective 3: Investigation of current technologies and methods for waste
tire management.
A deep literature review of various methods and technologies for dealing with
scrap tires was conducted in this research. The investigation included the description
and analysis of advantages and disadvantages of current practices used by the company,
which are stockpiling, dumping, and retreading. Also, it contained the information
about other methods such as material recovery practices, which includes the use of tires
as whole, grinding, vulcanization, and reclaiming, and about thermochemical
conversion of the waste such as incineration, hydrothermal liquefaction, gasification,
and pyrolysis. The most attractive technology from the maturity and company

131
perspectives was the pyrolysis treatment of the waste tires, in particular with recovery
of valuable chemicals to make the process more feasible. As truck tires have the highest
content of natural rubber among other types, the most profitable chemical to recover is
limonene of a high purity.
Objective 4: Development of models/simulations for the scenarios with
targeted byproducts and economic evaluation of scenarios.
In this part of the research, I analyzed possible operating conditions of the future
recycling facility based on the same study done in different research. The operating
conditions include the total number of operating hours, total number of people, targeted
product, appropriate feed rate for the future facility, lifetime, composition of the raw
material. The plant location was chosen as the one to provide free and constant flow of
the raw material. The structure and the byproducts of the process were adopted from
literature sources.
For economic analysis, 2018 was chosen as the base year. In the economic
evaluation I used Russian economic parameters such as the prime interest rate (8%), tax
(20%), and currency course (65RUB = 1$). Also, I was using some indicators special
only for the Kemerovo region like the cost of utilities, the selling prices, the average
salary of operating labor that are shown in the fifth chapter.
For economic evaluation of the project discounted cash flow rate of return
method was used with 8% as the discount. The depreciation was assumed to be linear
during the minimum possible lifetime of the chemical facility which is 10 years. The
accuracy that was used in the study was the order of magnitude or ±30%. The economic
parameters to show the profitability of the project were the net present value, payback
132
period (2-4 years), and the internal rate of return that should be higher than 25% for
such a high-risk project as recycling.
Five different scenarios were compared in this study:
1) The base case scenario of conversion the waste tires into limonene.
2) The energy recovery scenario. It has additional energy recovery equipment
to deal with excess gas produced during the pyrolysis.
3) The additional pre-treatment scenario. This scenario implies the additional
module of equipment to get better rubber granulate.
4) The crumb purchase scenario. The raw material free of steel was assumed to
be supplied by the third company.
5) The TDO production scenario. In this scenario no further recovery of tire-
derived oil into valuable chemicals was assumed.
During economic evaluation of these five scenarios, the most feasible and
economically attractive was the base case scenario. The final distribution of the process
products is the following: 50kg/h for limonene, 510 l/h of TDO, 250 kg/h of steel, and
355 kg/h of char. The payback period of this option is 3.6 years, NPV by the end of the
lifetime is 10.39 MM$, and the internal rate of return is 31.5%.
The least favorable option was the TDO production scenario. In this case, the
project had negative NPV value by the end of lifetime using DCFRR with the prime
interest rate as a discount.
Objective 5: Carry out sensitivity analysis for the most attractive scenarios.
The sensitivity analysis was done only for the most attractive scenario which
was the base case scenario. In the framework of this study, the first-order sensitivity
analysis was used. The critical parameters for the methods were the key economic

133
indicators. The selected impact parameters were the installed cost of the reactor system,
distillation columns, the total price of operating labor, limonene price per kg, and
limonene yield.
According to the results, the most influencing parameters were the limonene
price and the total limonene yield. Even the slight change of these two parameters
affected the critical economic indicators. The impact parameters with the least influence
on NPV, PBP, and IRR was the cost of operating labor.
Objective 6: Write a list of recommendations for the company.
1. The current practices of dealing with WTT which are stockpiling and
dumping into open mines are not environmentally friendly, as well as economically
beneficial for the company. The tire is a valuable raw material that can be used to
produce extra revenue for the company. Also implementing the first truck tires
recycling facility in the private company would somehow improve the reputation of the
company among public.
2. The most attractive process to deal with scrap truck tires is pyrolysis with
further recovery of the limonene. Considering the feeding rate for the future facility of
30 ton/day, 20 as the total number of people, the current course of ruble, economic
parameters of Russia and the Kemerovo region, NPV, PBP, and IRR were 10.39 MM$,
3.6 years, and 31.5% respectively. The selling prices of the products were 8$ per 1 kg
of limonene, 0.037$ per 1 kg of char, 0.25$ per 1 kg of steel, and 0.28$ per 1 liter of
TDO. The final yields of the products were 50kg/h for limonene, 510 l/h of TDO, 250
kg/h of steel, and 355 kg/h of char. The slight decrease of limonene yield, for example
to 30 kg/hour caused the decrease of NPV by 64%. The same situation was observed
when the price of limonene was 5$ instead of 8$. The NPV dropped by 62%. I would

134
suggest with such high dependency of the project feasibility on the limonene price and
yield, to find a buyer of the product before making the decision to build the facility.

135
REFERENCES
[1] Williams P T ir Brindle A J 2003 Aromatic chemicals from the catalytic
pyrolysis of scrap tyres J. Anal. Appl. Pyrolysis 67 143–64
[2] Williams P T 2013 Pyrolysis of waste tyres: A review Waste Manag. 33 1714–
28
[3] Danon B, Van Der Gryp P, Schwarz C E ir Görgens J F 2015 A review of
dipentene (dl-limonene) production from waste tire pyrolysis J. Anal. Appl.
Pyrolysis 112 1–13
[4] Pakdel H, Pantea D M ir Roy C 2001 Production of dl-limonene by vacuum
pyrolysis of used tires J. Anal. Appl. Pyrolysis 57 91–107
[5] Frigo S, Seggiani M, Puccini M ir Vitolo S 2014 Liquid fuel production from
waste tyre pyrolysis and its utilisation in a Diesel engine Fuel 116 399–408
[6] Hita I, Arabiourrutia M, Olazar M, Bilbao J, Arandes J M ir Castaño Sánchez P
2016 Opportunities and barriers for producing high quality fuels from the
pyrolysis of scrap tires Renew. Sustain. Energy Rev. 56 745–59
[7] Churashev V N 2013 Scenarios for the development of the Kuznetsk coal basin
Reg. Res. Russ. 3 250–7
[8] Kozyreva E N, Nepeina E S, Tsuran E M ir Plaksin M S 2017 Assessing the
Sorption of Methane by Kuznetsk Basin Coking Coal 60 404–9
[9] Beukering P J H Van ir Janssen M A 2001 R E S E A R C H A N D A N A LY
S I S A Dynamic Integrated Analysis of Truck Tires in Western Europe 4
[10] Rowhani A ir Rainey T J 2016 Scrap tyre management pathways and their use
as a fuel - A review Energies 9 1–26

136
[11] Ramarad S, Khalid M, Ratnam C T, Chuah A L ir Rashmi W 2015 Waste tire
rubber in polymer blends: A review on the evolution, properties and future Prog.
Mater. Sci. 72 100–40
[12] Ucar S, Karagoz S, Ozkan A R ir Yanik J 2005 Evaluation of two different scrap
tires as hydrocarbon source by pyrolysis Fuel 84 1884–92
[13] Evans R ir Evans A 2006 The Composition of a Tyre : Typical Components 5
[14] Sharma V K, Fortuna F, Mincarini M, Berillo M ir Cornacchia G 2000 Disposal
of waste tyres for energy recovery and safe environment Appl. Energy 65 381–
94
[15] Downard J, Singh A, Bullard R, Jayarathne T, Rathnayake C M, Simmons D L,
Wels B R, Spak S N, Peters T, Beardsley D, Stanier C O ir Stone E A 2015
Uncontrolled combustion of shredded tires in a landfill - Part 1: Characterization
of gaseous and particulate emissions Atmos. Environ. 104 195–204
[16] Torretta V, Rada E C, Ragazzi M, Trulli E, Istrate I A ir Cioca L I 2015
Treatment and disposal of tyres: Two EU approaches. A review Waste Manag.
45 152–60
[17] Pennington D G 1996 Effects of Waste Tires, Waste Tire Facilities, and Waste
Tire Projects on The Environment
[18] Turer A 2011 Recycling of Scrap Tires Mater. Recycl. - Trends Perspect. 195–
212
[19] Baziene K ir Vaiškunaite R 2016 Research of sustainable use of tire shreds in
landfill Sustain. 8
[20] Sarasa J, Llabrés T, Ormad P, Mosteo R ir Ovelleiro J L 2006 Characterization
and photo-Fenton treatment of used tires leachate J. Hazard. Mater. 136 874–81

137
[21] Singh A, Spak S N, Stone E A, Downard J, Bullard R L, Pooley M, Kostle P A,
Mainprize M W, Wichman M D, Peters T M, Beardsley D ir Stanier C O 2015
Uncontrolled combustion of shredded tires in a landfill - Part 2: Population
exposure, public health response, and an air quality index for urban fires Atmos.
Environ. 104 273–83
[22] Sunthonpagasit N ir Duffey M R 2004 Scrap tires to crumb rubber: Feasibility
analysis for processing facilities Resour. Conserv. Recycl. 40 281–99
[23] Karger-Kocsis J, Mészáros L ir Bárány T 2013 Ground tyre rubber (GTR) in
thermoplastics, thermosets, and rubbers t 48
[24] Sienkiewicz M, Kucinska-Lipka J, Janik H ir Balas A 2012 Progress in used
tyres management in the European Union: A review Waste Manag. 32 1742–51
[25] Amari T, Themelis N J ir Wernick I K 1999 Resource recovery from used rubber
tires Resour. Policy 25 179–88
[26] Singh S, Nimmo W, Gibbs B M ir Williams P T 2009 Waste tyre rubber as a
secondary fuel for power plants Fuel 88 2473–80
[27] Mulaudzi L 2017 Process modelling and economic evaluation of waste tyres to
limonene via pyrolysis
[28] Tekin K, Karagöz S ir Bektaş S 2014 A review of hydrothermal biomass
processing Renew. Sustain. Energy Rev. 40 673–87
[29] Zhang L, Zhou B, Duan P, Wang F ir Xu Y 2016 Hydrothermal conversion of
scrap tire to liquid fuel Chem. Eng. J. 285 157–63
[30] Pattabhi Raman K, Walawender W P ir Fan L T 1981 Gasification of waste tires
in a fluid bed reactor Conserv. Recycl. 4 79–88
[31] Leung D Y C ir Wang C L 2003 Fluidized-bed gasification of waste tire powders

138
Fuel Process. Technol. 84 175–96
[32] Xiao G, Ni M J, Chi Y ir Cen K F 2008 Low-temperature gasification of waste
tire in a fluidized bed Energy Convers. Manag. 49 2078–82
[33] Karatas H ir Akgun F 2018 Experimental results of gasification of walnut shell
and pistachio shell in a bubbling fluidized bed gasifier under air and steam
atmospheres Fuel 214 285–92
[34] JUNG SO0 LEE S D K 1996 GASIFICATION KINETICS OF WASTE TIRE-
CHAR WITH CO2 IN A THERMOBALANCE REACTOR Energy 21 343–52
[35] Galvagno S, Casciaro G, Casu S, Martino M, Mingazzini C, Russo A ir
Portofino S 2009 Steam gasification of tyre waste, poplar, and refuse-derived
fuel: A comparative analysis Waste Manag. 29 678–89
[36] Donatelli A, Iovane P ir Molino A 2010 High energy syngas production by waste
tyres steam gasification in a rotary kiln pilot plant. Experimental and numerical
investigations Fuel 89 2721–8
[37] Haydary J, Jelemenský Ľ, Gašparovič L ir Markoš J 2012 Influence of particle
size and kinetic parameters on tire pyrolysis J. Anal. Appl. Pyrolysis 97 73–9
[38] Islam M R, Joardder M U H, Kader M A ir Sarker M R I 2011 Valorization of
solid tire wastes available in Bangladesh by thermal treatment . Proc. WasteSafe
– 2nd Int. Conf. Solid Waste Manag. Dev. Countries. 101 1‐9
[39] Martínez J D, Puy N, Murillo R, García T, Navarro M V ir Mastral A M 2013
Waste tyre pyrolysis - A review Renew. Sustain. Energy Rev. 23 179–213
[40] Olazar M, Aguado R, Arabiourrutia M, Lopez G, Barona A ir Bilbao J 2008
Catalyst effect on the composition of tire pyrolysis products Energy and Fuels
22 2909–16

139
[41] De Marco Rodriguez I, Laresgoiti M F, Cabrero M A, Torres A, Chomón M J ir
Caballero B 2001 Pyrolysis of scrap tyres Fuel Process. Technol. 72 9–22
[42] Lopez G, Olazar M, Aguado R, Elordi G, Amutio M, Artetxe M ir Bilbao J 2010
Vacuum pyrolysis of waste tires by continuously feeding into a conical spouted
bed reactor Ind. Eng. Chem. Res. 49 8990–7
[43] Laresgoiti M F, Caballero B M, De Marco I, Torres A, Cabrero M A ir Chomón
M J 2004 Characterization of the liquid products obtained in tyre pyrolysis J.
Anal. Appl. Pyrolysis 71 917–34
[44] López G, Olazar M, Aguado R ir Bilbao J 2010 Continuous pyrolysis of waste
tyres in a conical spouted bed reactor Fuel 89 1946–52
[45] Ciriminna R, Lomeli-Rodriguez M, Demma Carà P, Lopez-Sanchez J A ir
Pagliaro M 2014 Limonene: A versatile chemical of the bioeconomy Chem.
Commun. 50 15288–96
[46] Islam M R, Joardder M U H, Hasan S M, Takai K ir Haniu H 2011 Feasibility
study for thermal treatment of solid tire wastes in Bangladesh by using pyrolysis
technology Waste Manag. 31 2142–9
[47] Islam M R, Joardder M U H, Kader M A ir Sarker M R I 2011 Valorization of
solid tire wastes available in Bangladesh by thermal treatment . Proc. WasteSafe
– 2nd Int. Conf. Solid Waste Manag. Dev. Countries. 101 1‐9
[48] Roy C, Darmstadt H, Benallal B ir Amen-Chen C 1997 Characterization of
naphtha and carbon black obtained by vacuum pyrolysis of polyisoprene rubber
Fuel Process. Technol. 50 87–103
[49] Olazar M, Arabiourrutia M, Lôpez G, Aguado R ir Bilbao J 2008 Effect of acid
catalysts on scrap tyre pyrolysis under fast heating conditions J. Anal. Appl.

140
Pyrolysis 82 199–204
[50] Li S-Q, Yao Q, Chi Y, Yan J-H ir Cen K-F 2004 Pilot-Scale Pyrolysis of Scrap
Tires in a Continuous Rotary Kiln Reactor Ind. Eng. Chem. Res. 43 5133–45
[51] Mastral A M, Murillo R, García T, Navarro M V., Callen M S ir López J M 2002
Study of the viability of the process for hydrogen recovery from old tyre oils
Fuel Process. Technol. 75 185–99
[52] Elbaba I F, Wu C ir Williams P T 2010 Catalytic pyrolysis-gasification of waste
tire and tire elastomers for hydrogen production Energy and Fuels 24 3928–35
[53] Gonzalez J F, Encinar J M, Canito J L ir Rodriguez J J 2001 Pyrolysis of
automobile tires wastes. Influence of operating variable and kinetic study Int.
Symp. Anal. Appl. Pyrolysis 59 667–83
[54] Zhang X, Wang T, Ma L ir Chang J 2008 Vacuum pyrolysis of waste tires with
basic additives Waste Manag. 28 2301–10
[55] Choi G G, Jung S H, Oh S J ir Kim J S 2014 Total utilization of waste tire rubber
through pyrolysis to obtain oils and CO2activation of pyrolysis char Fuel
Process. Technol. 123 57–64
[56] Alsaleh A ir Sattler M L 2014 Waste Tire Pyrolysis: Influential Parameters and
Product Properties Curr. Sustain. Energy Reports 1 129–35
[57] Towler G ir Sinnott R Towler, Gavin; Sinnott, Ray K. Chemical Engineering
Design - Principles, Practice and Economics of Plant and Process Design
[58] Pilusa J, Shukla M ir Muzenda E 2014 Economic Assessment of Waste Tyres
Pyrolysis Technology : A Case study for Gauteng Province, South Africa Int. J.
Res. Chem. Metall. Civ. Eng. 1 41–9
[59] Ngwetjana M M 2017 Fractionation of tyre derived oil (TDO)

141
[60] Pilusa J, Shukla M ir Muzenda E 2014 Economic Assessment of Waste Tyres
Pyrolysis Technology : A Case study for Gauteng Province, South Africa Int. J.
Res. Chem. Metall. Civ. Eng. 1 41–9
[61] Turton R 2012 Analysis , Synthesis , and Design of Chemical Processes Fourth
Edition
[62] Seider W D Product and process design principles : synthesis, analysis, and
evaluation (Second edition. New York : Wiley, [2004] ©2004)
[63] Peters M S ir Timmerhaus K D 1991 Plant design and economic and economics
for chemical engineers
[64] Francis M. Vanek P D, Louis D. Albright P D ir Largus T. Angenent P D 2016
Economic and Social Dimensions of Wind Energy Feasibility Energy Syst. Eng.
Eval. Implementation, Third Ed.
[65] EPA 2011 Scrap Tires: Handbook on Recycling Applications and Management
for the U. S. and Mexico United States Environ. Prot. Agency 136
[66] Dutta A, Sahir A, Tan E, Humbird D, Snowden-swan L J, Meyer P, Ross J,
Sexton D, Yap R, Lukas J, Dutta A, Sahir A, Tan E, Humbird D, Snowden-swan
L J, Meyer P, Ross J, Sexton D, Yap R ir Lukas J 2015 Process Design and
Economics for the Conversion of Lignocellulosic Biomass to Hydrocarbon Fuels
Fast Pyrolysis Vapors Process Design and Economics for the Conversion of
Lignocellulosic Biomass to Hydrocarbon Fuels Thermochemical Research
Pathways with In Natl. Renew. Energy Lab. 1–275
[67] Wright M, Daugaard D, Satrio J ir Brown R 2010 Techno-economic analysis of
biomass fast pyrolysis to transportation fuels Fuel 89 S2–10
[68] Jones S, Meyer P, Snowden-swan L J, Padmaperuma A, Tan E, Dutta A,

142
Jacobson J ir Cafferty K 2013 Process Design and Economics for the Conversion
of Lignocellulosic Biomass to Hydrocarbon Fuels Natl. Renew. Energy Lab.