Techno-economic analysis of a wind–solar hybrid ...€¦ · Economic viability Wind–solar...
11
Techno-economic analysis of a wind–solar hybrid renewable energy system with rainwater collection feature for urban high-rise application q W.T. Chong ⇑ , M.S. Naghavi, S.C. Poh, T.M.I. Mahlia, K.C. Pan Department of Mechanical Engineering, University of Malaya, 50603 Kuala Lumpur, Malaysia article info Article history: Received 23 December 2010 Received in revised form 24 March 2011 Accepted 13 April 2011 Available online 10 May 2011 Keywords: Economic viability Wind–solar hybrid energy system Renewable energy Life cycle cost Green technology abstract The technical and economic feasibility study of an innovative wind–solar hybrid renewable energy gen- eration system with rainwater collection feature for electrical energy generation is presented in this paper. The power generated would supply part of the energy requirements of the high-rise building where the system is installed. The system integrates and optimizes several green technologies; including urban wind turbine, solar cell module and rain water collector. The design was conceptualized based on the experiences acquired during the development and testing of a suitable wind turbine for Malaysian applications. It is compact and can be built on top of high-rise buildings in order to provide on-site renewable power to the building. It overcomes the inferior aspect on the low wind speed by channeling and increasing the speed of the high altitude free-stream wind through the power-augmentation-guide- vane (PAGV) before it enters the wind turbine at the center portion. The shape or appearance of the PAGV that surrounds the wind turbine can be blended into the building architecture without negative visual impact (becomes part of the building). The design improves the starting behavior of wind turbines. It is also safer to people around and reduces noise pollution. The techno-economic analysis is carried out by applying the life cycle cost (LCC) method. The LCC method takes into consideration the complete range of costs and makes cash flows time-equivalent. The evaluations show that for a system with the PAGV (30 m diameter and 14 m high) and an H-rotor vertical axis wind turbine (17 m diameter and 9 m high) mounted on the top of a 220 m high building, the estimated annual energy savings is 195.2 MW h/year. Ó 2011 Elsevier Ltd. All rights reserved. 1. Introduction Alternative energy resources such as wind energy and solar en- ergy have made public and private sectors interested to invest in energy generation from these sources extensively. The common drawbacks to wind and solar energy options are their unforesee- able nature and they rely on the climate changes. However, there are daily and seasonal complementary relationships between wind energy and solar energy. In addition, stable power output could be expected through the hybrid power system [1]. So, the problems can be partially overcome by integrating two or more resources in a proper combination to form a hybrid system, using the strengths of one source to overcome the weaknesses of the other [2]. For certain locations, the hybrid solar–wind power generation systems with storage banks offer a highly reliable source of power, which is suitable for electrical loads that need higher reliability [3]. In order to combine and optimize these energies, various technical and economic methods could be applied to achieve a trustable hybrid renewable energy system. Presently, electricity is produced in rural power plants and transferred to urban areas. However, in many cases in developing countries, grid extension is impractical because of dispersed popu- lation, rugged terrain or both. Thus, on-site renewable energy sys- tems represent an important role for narrowing the electricity gap in rural parts of the developing world, where progress in grid extension remains slower than population growth [4]. The concept of on-site renewable energy generation is to extract energy from renewable sources close to the populated area where the energy is required. The proposed wind–solar hybrid renewable energy system in this paper is a new and feasible design. It is compact and can be built on the top of high-rise buildings in order to pro- vide on-site green power to that building or be fed into the national electricity grid line [5]. In this paper, the techno-economic characteristics of the pat- ented wind–solar hybrid energy system are reviewed. Economic analysis is done by using the life-cycle costing (LCC) method to cal- culate the entire life-cycle cost such as the net present value and payback period of both capital and operating expenses over the life of the system. A complete LCC analysis takes into consideration the discount rates, interest rates, operation and maintenance costs, 0306-2619/$ - see front matter Ó 2011 Elsevier Ltd. All rights reserved. doi:10.1016/j.apenergy.2011.04.042 q This paper is an extended and revised article presented at the 18th Annual International Conference on Mechanical Engineering (ISME 2010), 11–13 May, 2010, Sharif University of Technology, Tehran, Iran. ⇑ Corresponding author. Tel.: +60 12 7235038. E-mail address: [email protected] (W.T. Chong). Applied Energy 88 (2011) 4067–4077 Contents lists available at ScienceDirect Applied Energy journal homepage: www.elsevier.com/locate/apenergy
Transcript of Techno-economic analysis of a wind–solar hybrid ...€¦ · Economic viability Wind–solar...

Applied Energy 88 (2011) 4067–4077
Contents lists available at ScienceDirect
Applied Energy
journal homepage: www.elsevier .com/locate /apenergy
Techno-economic analysis of a wind–solar hybrid renewable energy systemwith rainwater collection feature for urban high-rise application q
W.T. Chong ⇑, M.S. Naghavi, S.C. Poh, T.M.I. Mahlia, K.C. PanDepartment of Mechanical Engineering, University of Malaya, 50603 Kuala Lumpur, Malaysia
a r t i c l e i n f o
Article history:Received 23 December 2010Received in revised form 24 March 2011Accepted 13 April 2011Available online 10 May 2011
Keywords:Economic viabilityWind–solar hybrid energy systemRenewable energyLife cycle costGreen technology
0306-2619/$ - see front matter � 2011 Elsevier Ltd. Adoi:10.1016/j.apenergy.2011.04.042
q This paper is an extended and revised article pInternational Conference on Mechanical Engineerin2010, Sharif University of Technology, Tehran, Iran.⇑ Corresponding author. Tel.: +60 12 7235038.
E-mail address: [email protected] (W.T
a b s t r a c t
The technical and economic feasibility study of an innovative wind–solar hybrid renewable energy gen-eration system with rainwater collection feature for electrical energy generation is presented in thispaper. The power generated would supply part of the energy requirements of the high-rise buildingwhere the system is installed. The system integrates and optimizes several green technologies; includingurban wind turbine, solar cell module and rain water collector. The design was conceptualized based onthe experiences acquired during the development and testing of a suitable wind turbine for Malaysianapplications. It is compact and can be built on top of high-rise buildings in order to provide on-siterenewable power to the building. It overcomes the inferior aspect on the low wind speed by channelingand increasing the speed of the high altitude free-stream wind through the power-augmentation-guide-vane (PAGV) before it enters the wind turbine at the center portion. The shape or appearance of the PAGVthat surrounds the wind turbine can be blended into the building architecture without negative visualimpact (becomes part of the building). The design improves the starting behavior of wind turbines. Itis also safer to people around and reduces noise pollution. The techno-economic analysis is carried outby applying the life cycle cost (LCC) method. The LCC method takes into consideration the complete rangeof costs and makes cash flows time-equivalent. The evaluations show that for a system with the PAGV(30 m diameter and 14 m high) and an H-rotor vertical axis wind turbine (17 m diameter and 9 m high)mounted on the top of a 220 m high building, the estimated annual energy savings is 195.2 MW h/year.
� 2011 Elsevier Ltd. All rights reserved.
1. Introduction
Alternative energy resources such as wind energy and solar en-ergy have made public and private sectors interested to invest inenergy generation from these sources extensively. The commondrawbacks to wind and solar energy options are their unforesee-able nature and they rely on the climate changes. However, thereare daily and seasonal complementary relationships between windenergy and solar energy. In addition, stable power output could beexpected through the hybrid power system [1]. So, the problemscan be partially overcome by integrating two or more resourcesin a proper combination to form a hybrid system, using thestrengths of one source to overcome the weaknesses of the other[2]. For certain locations, the hybrid solar–wind power generationsystems with storage banks offer a highly reliable source of power,which is suitable for electrical loads that need higher reliability [3].In order to combine and optimize these energies, various technical
ll rights reserved.
resented at the 18th Annualg (ISME 2010), 11–13 May,
. Chong).
and economic methods could be applied to achieve a trustablehybrid renewable energy system.
Presently, electricity is produced in rural power plants andtransferred to urban areas. However, in many cases in developingcountries, grid extension is impractical because of dispersed popu-lation, rugged terrain or both. Thus, on-site renewable energy sys-tems represent an important role for narrowing the electricity gapin rural parts of the developing world, where progress in gridextension remains slower than population growth [4]. The conceptof on-site renewable energy generation is to extract energy fromrenewable sources close to the populated area where the energyis required. The proposed wind–solar hybrid renewable energysystem in this paper is a new and feasible design. It is compactand can be built on the top of high-rise buildings in order to pro-vide on-site green power to that building or be fed into thenational electricity grid line [5].
In this paper, the techno-economic characteristics of the pat-ented wind–solar hybrid energy system are reviewed. Economicanalysis is done by using the life-cycle costing (LCC) method to cal-culate the entire life-cycle cost such as the net present value andpayback period of both capital and operating expenses over the lifeof the system. A complete LCC analysis takes into consideration thediscount rates, interest rates, operation and maintenance costs,

Nomenclature
Ac rain catchment areaAs array active area (solar panel)c scale parameterCp coefficient of power (wind rotor)Cr runoff coefficientCTR commercial tariff rateCUE cost of unit of energyd discount rateEsolar energy generated by solar systemETR effective tax rateGs annual mean global irradiationh(V) Weibull probability distribution functionHAWT horizontal-axis wind turbineI rainfall intensityi inflation rateIP interest paymentITS income tax savingsk shape parameterK solar power lossLCC life cycle costN period of economic analysis
NPV net present valueP powerPAGV power-augmentation-guide-vanePrmc power of wind (rmc)PT property taxPV photovoltaicPV present valuePWF present worth factorV wind velocityVrain rain water volumeVAWT vertical axis wind turbineWSRS wind–solar–rain savingsz height (above ground level)
Greek lettersa wind friction coefficientgps PV module conversion efficiencygtr bearing and transmission efficiencygg generator efficiencygPAGV PAGV efficiencyq density
4068 W.T. Chong et al. / Applied Energy 88 (2011) 4067–4077
present value of money, etc. Challenges in using LCC include poordata availability, erratic economic changes, uncertainties regardingdiscount rate, asset life, and estimating future operating and main-tenance costs [6]. This clean energy generation will definitely helpto reduce the greenhouse gas emissions that causing significantimpacts on global climate change. The intangible costs related tothe environmental impacts including greenhouse gas emissionsare omitted in this paper, although it is very important.
2. Existing wind energy and solar energy systems configurations
Besides wind–solar hybrid energy systems, other alternative re-sources are combined for a hybrid system with various configura-tions, such as solar–diesel, wind–diesel, wind–solar–diesel andsolar–diesel–hydro-fuel cell [7–10]. A lot of research works havebeen done on the performance of photovoltaic (PV) and wind en-ergy systems.
Compared to large scale wind turbines, small scale wind energysystems have been studied extensively as a part of hybrid systemsfor application in residential areas [11,12]. It is concluded that for asatisfactory benefit of a small scale wind system, the mean windspeed of the site needs to be close to the rated wind speed of powergeneration [13]. Besides technical feasibility of the small scalewind energy systems, financial and non-financial attributes ofthe systems are evaluated [14,15]. Up to this moment, the largesize wind turbine application in urban areas has not been studiedextensively.
Like all the alternative energy sources, wind and solar energiesare expensive in terms of initial capital cost, but relatively inexpen-sive in terms of operating costs [16]. The main technical work in astandalone wind–solar system is to obtain an optimum size andconfiguration for the system and a supplementary energy sourceto achieve the efficient and economical utilization in the hybridsystem [17]. Bekele and Palm [18] investigated the possibility ofsupplying electricity from a hybrid wind–solar system with a sup-plementary diesel generator to a remotely located place detachedfrom the main electricity grid in Ethiopia. Size optimization ofPV/wind hybrid energy conversion system with battery storageunder various load conditions in Turkey was performed bysimulations [19,20]. A new methodology in size optimization of
an autonomous hybrid wind–solar energy system integrated withbattery bank is developed and economic conditions of some casesare analyzed [21,22]. In addition, an economic comparison is madebetween two cases which are a standalone wind–solar hybrid en-ergy system and a grid connected electricity supply. It is concludedthat if the hybrid energy system is installed at a distance more than4817 m, it is more economical than laying cable from the electric-ity grid. Yang et al. [2] and Diaf et al. [23] studied on optimal designof wind–solar hybrid systems with the employment of batterybanks. Most of the studies analyzed their proposed configurationsin various meteorological conditions. Moreover, it is suggested toreduce the cost and risk of hybrid renewable energy system byincorporating a third energy source (auxiliary source such as elec-tricity grid) instead of increasing the hardware size [24].
Bakos and Tsagas [25] presented a feasibility study on a gridconnected solar energy system technically and economically.Based on the methodology used; the technical characteristics ofthe systems were defined. Then, based on the meteorological dataof solar radiation, extractable energy was calculated. Finally, thecost and payback period of energy generation of the system for dif-ferent financial scenarios were calculated and compared with theconventional electricity grid price. It was concluded that for alleconomic situations, the expensive initial capital and long paybackperiod of the solar system are an exorbitant factor for the imple-mentation of a project in commercial scale. Except for some iso-lated areas (e.g. islands) where the cost of energy generation orelectrical grid connection is high, the central grid-connected con-sumers would reluctant to purchase a solar system for their energydemands [26]. In a further research, Bakos and Tsagas [27] workedon a wind–solar hybrid system and used a similar methodology toevaluate it. The developed system is in parallel with the nationalelectricity grid and was used to supply the electricity to a typicaldwelling place. Based on the economic analysis, it was found thatthe period of time to make the system with positive turnover is lessthan for a single solar system. Therefore, the use of auxiliary en-ergy source made the system more competitive in comparisonwith the stand-alone system. However, some governmental subsi-dies help to reduce the negative cash flow and payback periods toencourage private investors to move towards larger investmentson renewable energy systems. From the reviews on current
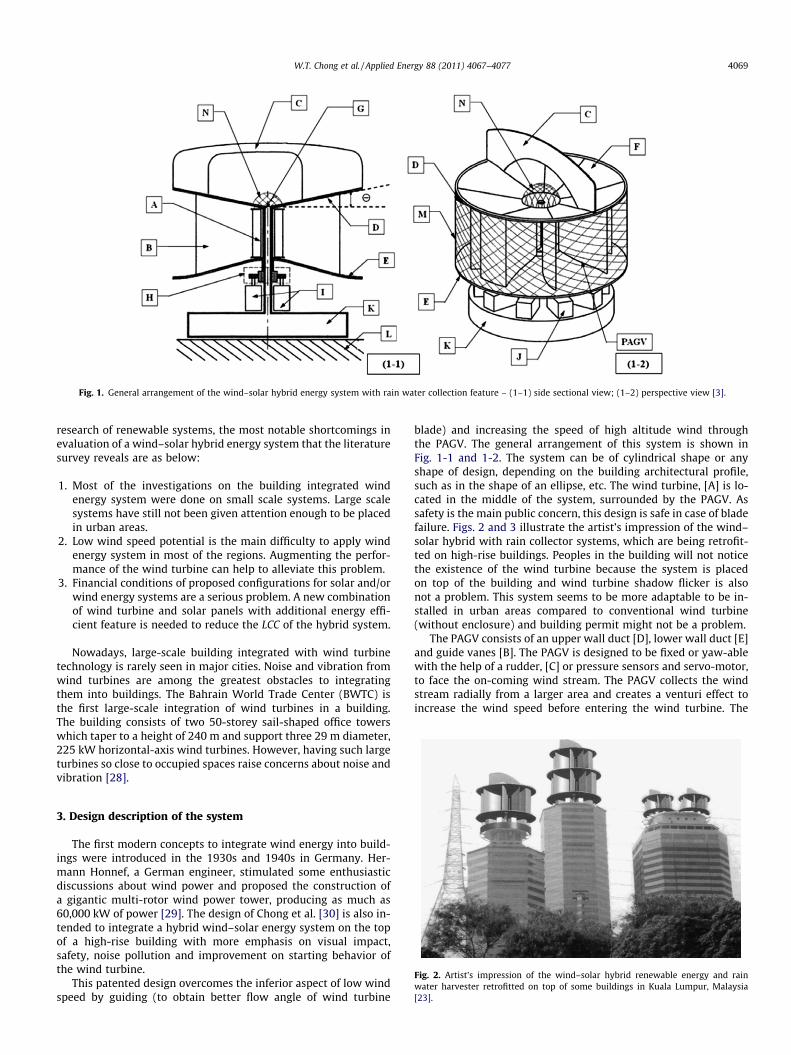
Fig. 1. General arrangement of the wind–solar hybrid energy system with rain water collection feature – (1–1) side sectional view; (1–2) perspective view [3].
W.T. Chong et al. / Applied Energy 88 (2011) 4067–4077 4069
research of renewable systems, the most notable shortcomings inevaluation of a wind–solar hybrid energy system that the literaturesurvey reveals are as below:
1. Most of the investigations on the building integrated windenergy system were done on small scale systems. Large scalesystems have still not been given attention enough to be placedin urban areas.
2. Low wind speed potential is the main difficulty to apply windenergy system in most of the regions. Augmenting the perfor-mance of the wind turbine can help to alleviate this problem.
3. Financial conditions of proposed configurations for solar and/orwind energy systems are a serious problem. A new combinationof wind turbine and solar panels with additional energy effi-cient feature is needed to reduce the LCC of the hybrid system.
Nowadays, large-scale building integrated with wind turbinetechnology is rarely seen in major cities. Noise and vibration fromwind turbines are among the greatest obstacles to integratingthem into buildings. The Bahrain World Trade Center (BWTC) isthe first large-scale integration of wind turbines in a building.The building consists of two 50-storey sail-shaped office towerswhich taper to a height of 240 m and support three 29 m diameter,225 kW horizontal-axis wind turbines. However, having such largeturbines so close to occupied spaces raise concerns about noise andvibration [28].
Fig. 2. Artist’s impression of the wind–solar hybrid renewable energy and rainwater harvester retrofitted on top of some buildings in Kuala Lumpur, Malaysia[23].
3. Design description of the system
The first modern concepts to integrate wind energy into build-ings were introduced in the 1930s and 1940s in Germany. Her-mann Honnef, a German engineer, stimulated some enthusiasticdiscussions about wind power and proposed the construction ofa gigantic multi-rotor wind power tower, producing as much as60,000 kW of power [29]. The design of Chong et al. [30] is also in-tended to integrate a hybrid wind–solar energy system on the topof a high-rise building with more emphasis on visual impact,safety, noise pollution and improvement on starting behavior ofthe wind turbine.
This patented design overcomes the inferior aspect of low windspeed by guiding (to obtain better flow angle of wind turbine
blade) and increasing the speed of high altitude wind throughthe PAGV. The general arrangement of this system is shown inFig. 1-1 and 1-2. The system can be of cylindrical shape or anyshape of design, depending on the building architectural profile,such as in the shape of an ellipse, etc. The wind turbine, [A] is lo-cated in the middle of the system, surrounded by the PAGV. Assafety is the main public concern, this design is safe in case of bladefailure. Figs. 2 and 3 illustrate the artist’s impression of the wind–solar hybrid with rain collector systems, which are being retrofit-ted on high-rise buildings. Peoples in the building will not noticethe existence of the wind turbine because the system is placedon top of the building and wind turbine shadow flicker is alsonot a problem. This system seems to be more adaptable to be in-stalled in urban areas compared to conventional wind turbine(without enclosure) and building permit might not be a problem.
The PAGV consists of an upper wall duct [D], lower wall duct [E]and guide vanes [B]. The PAGV is designed to be fixed or yaw-ablewith the help of a rudder, [C] or pressure sensors and servo-motor,to face the on-coming wind stream. The PAGV collects the windstream radially from a larger area and creates a venturi effect toincrease the wind speed before entering the wind turbine. The
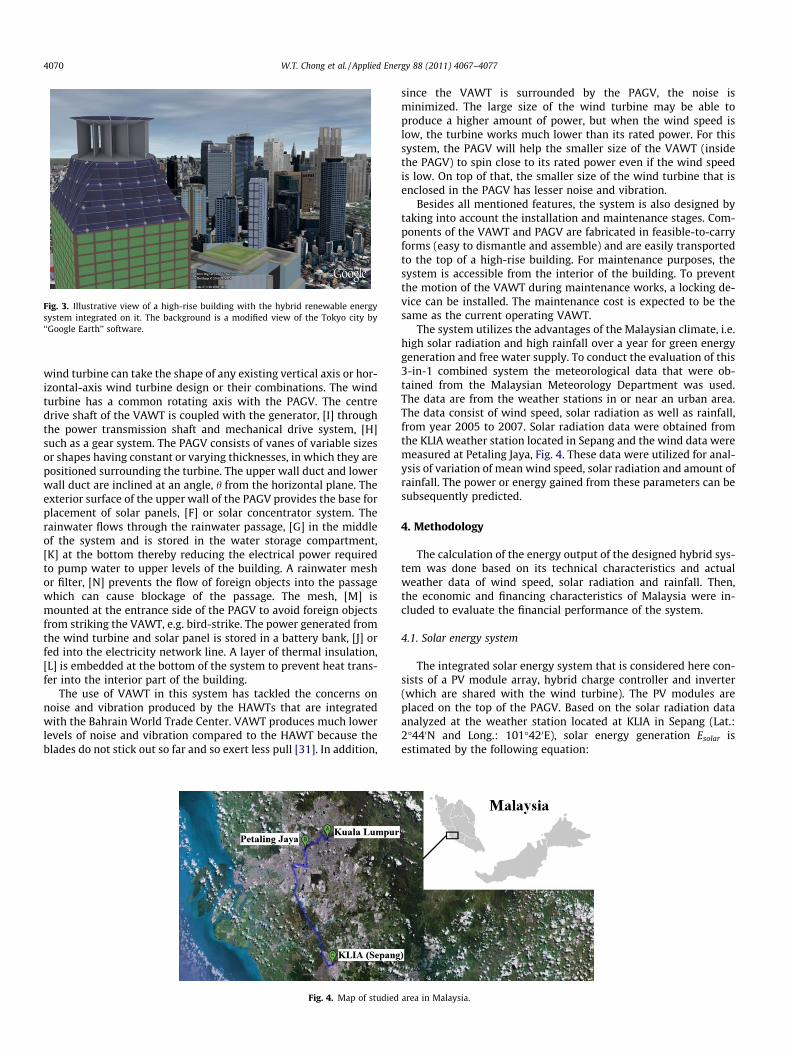
Fig. 3. Illustrative view of a high-rise building with the hybrid renewable energysystem integrated on it. The background is a modified view of the Tokyo city by‘‘Google Earth’’ software.
4070 W.T. Chong et al. / Applied Energy 88 (2011) 4067–4077
wind turbine can take the shape of any existing vertical axis or hor-izontal-axis wind turbine design or their combinations. The windturbine has a common rotating axis with the PAGV. The centredrive shaft of the VAWT is coupled with the generator, [I] throughthe power transmission shaft and mechanical drive system, [H]such as a gear system. The PAGV consists of vanes of variable sizesor shapes having constant or varying thicknesses, in which they arepositioned surrounding the turbine. The upper wall duct and lowerwall duct are inclined at an angle, h from the horizontal plane. Theexterior surface of the upper wall of the PAGV provides the base forplacement of solar panels, [F] or solar concentrator system. Therainwater flows through the rainwater passage, [G] in the middleof the system and is stored in the water storage compartment,[K] at the bottom thereby reducing the electrical power requiredto pump water to upper levels of the building. A rainwater meshor filter, [N] prevents the flow of foreign objects into the passagewhich can cause blockage of the passage. The mesh, [M] ismounted at the entrance side of the PAGV to avoid foreign objectsfrom striking the VAWT, e.g. bird-strike. The power generated fromthe wind turbine and solar panel is stored in a battery bank, [J] orfed into the electricity network line. A layer of thermal insulation,[L] is embedded at the bottom of the system to prevent heat trans-fer into the interior part of the building.
The use of VAWT in this system has tackled the concerns onnoise and vibration produced by the HAWTs that are integratedwith the Bahrain World Trade Center. VAWT produces much lowerlevels of noise and vibration compared to the HAWT because theblades do not stick out so far and so exert less pull [31]. In addition,
Fig. 4. Map of studied
since the VAWT is surrounded by the PAGV, the noise isminimized. The large size of the wind turbine may be able toproduce a higher amount of power, but when the wind speed islow, the turbine works much lower than its rated power. For thissystem, the PAGV will help the smaller size of the VAWT (insidethe PAGV) to spin close to its rated power even if the wind speedis low. On top of that, the smaller size of the wind turbine that isenclosed in the PAGV has lesser noise and vibration.
Besides all mentioned features, the system is also designed bytaking into account the installation and maintenance stages. Com-ponents of the VAWT and PAGV are fabricated in feasible-to-carryforms (easy to dismantle and assemble) and are easily transportedto the top of a high-rise building. For maintenance purposes, thesystem is accessible from the interior of the building. To preventthe motion of the VAWT during maintenance works, a locking de-vice can be installed. The maintenance cost is expected to be thesame as the current operating VAWT.
The system utilizes the advantages of the Malaysian climate, i.e.high solar radiation and high rainfall over a year for green energygeneration and free water supply. To conduct the evaluation of this3-in-1 combined system the meteorological data that were ob-tained from the Malaysian Meteorology Department was used.The data are from the weather stations in or near an urban area.The data consist of wind speed, solar radiation as well as rainfall,from year 2005 to 2007. Solar radiation data were obtained fromthe KLIA weather station located in Sepang and the wind data weremeasured at Petaling Jaya, Fig. 4. These data were utilized for anal-ysis of variation of mean wind speed, solar radiation and amount ofrainfall. The power or energy gained from these parameters can besubsequently predicted.
4. Methodology
The calculation of the energy output of the designed hybrid sys-tem was done based on its technical characteristics and actualweather data of wind speed, solar radiation and rainfall. Then,the economic and financing characteristics of Malaysia were in-cluded to evaluate the financial performance of the system.
4.1. Solar energy system
The integrated solar energy system that is considered here con-sists of a PV module array, hybrid charge controller and inverter(which are shared with the wind turbine). The PV modules areplaced on the top of the PAGV. Based on the solar radiation dataanalyzed at the weather station located at KLIA in Sepang (Lat.:2�440N and Long.: 101�420E), solar energy generation Esolar isestimated by the following equation:
area in Malaysia.

Fig. 5. Monthly global radiation in KLIA Sepang for years 2006–2009.
W.T. Chong et al. / Applied Energy 88 (2011) 4067–4077 4071
Esolar ¼ Gs � As � gps � K ð1Þ
where Gs is annual mean daily global irradiation (kW h m�2/day), As
is array active area (m2), gps is PV module conversion efficiency andK is solar power loss. The meteorological data of this site for fouryears is shown in Fig. 5. It illustrates that the monthly global radi-ation is in the range of 120–140 kW h m�2, with a daily solar radi-ation of 4.5–5.5 kW h m�2. Therefore, there is a stable output ofenergy from this source.
A commercial monocrystalline silicon solar cell is chosen toconvert solar radiation to electricity. Its specifications and esti-mated daily electrical energy generation are listed in Table 1. Byselecting monocrystalline silicon PV modules with efficiency of16.4%, the solar energy generation is approximately 108 MW h/year or 295.9 kW h/day.
4.2. Wind energy system
The wind data are obtained from the meteorological station atPetaling Jaya (Lat.: 3�060N and Long.: 101�390E) which is an urbanarea in Malaysia. Meteorological data at this site is recorded from
Table 1Solar cell specifications and estimated solar energy generated at KLIA weather station,Sepang (year 2007).
Peak power 160 WMaximum voltage 23.32 VMaximum current 6.86 AOpen-circuit voltage 28.89 VShort-circuit current 7.34 A
Module typical performance dataEstimated PV module conversion efficiency, gps 16.40%Estimated power/performance efficiency, K 80%Power density 48.99 W/m2
Module and cell dimensions and specificationsDimensions of module (single) 0.66 � 1.5 m2
External cell area 0.0275 m2
Estimated percentage of cell active area 68%Estimated cell active area 0.0187 m2
PAGV top surface area 700 m2
Estimated total active area, As 476 m2
No. of module 707
Estimated solar energy generation per day = Gs � gps � K � As 295.9 kW h
2006 until the end of 2009. The height of the wind sensor aboveground level is 46.2 m (height of wind sensor above mean sea le-vel: 60.8 m). As illustrated in Fig. 6, the mean monthly wind speedis calculated (from hourly average wind speed data) and shown inthe graph. This graph shows that the main portion of the windspeeds are in the range of 1.5–2 m/s.
From the analyzed data at the Petaling Jaya weather station, thewind speed is less than 4 m/s for more than 90% of the total hoursin a year. As mentioned before, the system was assumed to be in-stalled on the top of a high-rise building in an urban area (PetalingJaya), where the height of the building is 220 m. The wind shearboundary layer causes the wind speed to increase with height inaccordance to the following equation:
VðzÞ ¼ Vrðz=zrÞa ð2Þ
where V(z) is wind speed at height z, Vr is wind speed at the refer-ence height zr above the surface, and a is wind friction coefficientwhich depends on the roughness of the terrain and the stability ofthe atmosphere [32]. Thus, for a typical urban area like PetalingJaya, the value of a = 0.4. In this case study a high-rise building withthe height of 220 m was taken as reference, and the wind speed atthis height was calculated based on Eq. (2), Fig. 7. The wind speed iscalculated to be approximately 1.8 times higher than the windspeed at reference height of 46.2 m.
A comparative study by Eriksson et al. has shown that VAWTsare advantageous compared to HAWTs in several aspects. Gener-ally, the VAWTs have the advantages such as ease of installationand maintenance (due to the generator being located beneaththe turbine), omni-direction wind power extraction and no yawingmechanism is required. In comparison between H-rotor andDarrieus turbines, H-rotor seems more beneficial than theDarrieus. The possibility of simple structure and lower level ofmaintenance are the strength of the H-rotor turbine [33].
The variation in wind speed can be described by the Weibullprobability distribution function (h) with two parameters, the scaleparameter (c) and the shape parameter (k). The probability of windspeed (V) in an interval of time is obtained by the following [32]:
hðVÞ ¼ ðk=cÞ � ðV=cÞk�1 � e�ðV=cÞk ð3Þ
Wind power is proportional to the cube of the speed, and theenergy collected over the year is the integral of h � V3 � dV. There-fore, root mean cube (rmc) speed is defined in a manner similar

Fig. 6. Mean monthly wind speed at the height of 46.2 m above ground level (in Petaling Jaya) for years 2006–2009.
Fig. 7. Calculated mean monthly wind speed at the height of 220 m above ground level (in Petaling Jaya) for years 2006–2009.
Table 2Specifications of the VAWT.
Manufacturer Shanghai MUCE WindPower Equipment Co. Ltd.
Starting wind speed 1.8 m/sWorking wind speed 3.0–25 m/sRated wind speed 12 m/sMaximum wind speed 63 m/sSwept area (diameter � height), A 17 m � 9 mNo. of blades 4Generator efficiency, gG 0.8Efficiency due to PAGV loss, gPAGV 0.9Efficiency due to bearing and transmission
loss, gTR
0.9
Rotor efficiency, Cp 0.4Air density, q 1.201 kg/m3
Estimated wind energy generation per day
¼ 0:5 � q � Cp � gTR � :gG � gPAGV � A � V3i
236.2 kW h
4072 W.T. Chong et al. / Applied Energy 88 (2011) 4067–4077
to the root mean square (rms) value in alternating current (AC)electrical circuits. The rmc equivalent of the digital data loggingis as follows:
Vrmc ¼
ffiffiffiffiffiffiffiffiffiffiffiffiffiffiffiffiffiffiffiffiffiffi1=n
Xn
i¼1
V3i
3
vuut ð4Þ
where n is the number of the digital data. The rmc speed is useful inquickly estimating the annual energy potential of the site. By usingVrmc, the average power density is given by:
Prmc ¼ 1=2nXn
i¼1
q � Cp � gtr � gg � gPAGV � A � V3rmc ð5Þ
Then, the annual energy production potential of the site is ob-tained by multiplying the Prmc value by the total number of operat-ing hours in the year.
H-rotor was chosen due to the advantages of blade profile,noise, generator position and self-starting behavior. The technicalcharacteristics of a commercial VAWT are shown in Table 2. Theoperating wind speed of turbine is in the range of 3–25 m/s. The
wind speed is increased about 1.7 times after passing throughthe PAGV [34]. With the estimated efficiency of the sub-systems

Fig. 8. Wind direction frequency in Petaling Jaya (year 2008 and 2009).
Table 4Annual energy generated or saved in Petaling Jaya.
Energy source Solar(energygeneration)
Wind(energygeneration)
Rainwater(energysaving)
Total
Energy generated/saved(kW h/year)
108,000 86,200 1025 195,225
W.T. Chong et al. / Applied Energy 88 (2011) 4067–4077 4073
or components, the wind energy generation from a system(30 m � 14 m for PAGV, 17 m � 9 m for VAWT) installed on thetop of a building of 220 m height is calculated to be approximately86.2 MW h/year or 236.2 kW h/day.
Based on the weather data for the years 2008 and 2009, the fre-quency of wind direction is obtained and shown in Fig. 8. The dataillustrates that the variation of wind direction is mainly between120� and 180�. As was mentioned earlier, the PAGV is built ontop of high-rise buildings and is designed to be yaw-able. So, thePAGV will yaw to face the direction of the wind.
4.3. Rain water collection system
One of the energy consumption sources in a high-rise buildingis pumping water to the top levels of a building. By collecting dataon rainfall for eight years (2002–2009), it became obvious thatthere would be a significant amount of rainfall annually in theevaluated site, i.e. Petaling Jaya. So, investing on rainwater harvest-ing would be reasonable. Table 3 shows the annual rainfall at Petal-ing Jaya (2002–2009) in 1 m2. The volume of rainwater collectedVrain (for catchment area of 700 m2), is estimated by using Eq.(6), (Rational equation):
Vrain ¼ Ac � I � Cr ð6Þ
where Ac is rain catchment area (m2), I is the rainfall intensity (mm/month) and Cr is the runoff coefficient (assumed as 0.75). To calcu-late energy savings by collecting rainfall on the top of the buildingEq. (7) need to be used:
Erain ¼ q � Vrain � g � h � ð2:778� 10�4Þ ð7Þ
where q is water density, g is gravity, h is the height of building and(2.778 � 10�4) is the conversion factor of joule to watt-hour.
Table 3Mean monthly rainfall and energy savings (water pumping) at the height of 220 m in Pet
Month January February March April May June July
Rainfall (mm) 215 196 330 426 190 265 196Volume (m3) 113 103 173 224 100 139 103Energy (kW h) 67 62 104 134 60 83 62
Rainfall data for the years 2002–2009 are analyzed and results formean monthly rainfall volume and energy savings are tabulatedin Table 3. Based on the data analyzed in Petaling Jaya area, the esti-mated monthly rainwater collected in the roof area of 700 m2 is143 m3. Thus, energy used to pump this amount of water to thetop of a 220 m high building is about 1025 kW h/year.
As a summary, energy generation and savings by this system ina year is tabulated in table 4:
4.4. Economic assessment
The electricity generated by the proposed hybrid wind–solar–rain system is fed into the urban electricity network (Fig. 9). Forthe economic analysis of the proposed hybrid system, the LCCmethod is used and it takes into consideration the complete rangeof costs and makes cash flows time-equivalent.
Wind–solar–rain savings (WSRS) is the difference of the cost of aunit of produced energy (CUE) and commercial tariff rate (CTR) ofelectricity which is given in kW h by:
WSRS ¼ CTR� CUE ð8Þ
The mortgage payment consists of principal payment and inter-est of money on the loan borrowed for system installation. To keepthe system in operation condition some periodic costs such asoperation and maintenance needed to be paid. Income tax savingsfor the system can be stated as [35]:
ITS ¼ ETR� ðIP þ PTÞ ð9Þ
The present worth factor (PWF) is included in the calculation todetermine the entire gain of the system. If a payment repeats everyyear and inflates at a rate of i per annum, PWF of the payments isobtained by the following equation:
PWFðN; i;dÞ ¼XN
j¼1
ð1þ iÞj�1=ð1þ dÞj ð10Þ
where N is the period of economic evaluation. The inflation and dis-count rates are represented by i and d, respectively. Then, to deter-mine the present value (PV) of payment or income for Nth period(usually year) in the future, the following equation is used:
PV ¼ 1=ð1þ dÞN ð11Þ
PV is used to return the value of the future payments or incomes ona given period to present value. Then, the net present value (NPV) iscalculated to obtain the sum of the present values of the individualcash flow.
aling Jaya (Years 2002–2009).
August September October November December Annual
158 260 296 437 296 326583 137 155 229 155 171450 82 93 137 93 1025

Fig. 9. Schematic of the wind–solar hybrid energy system.
Table 6System components price.
Item Cost
4074 W.T. Chong et al. / Applied Energy 88 (2011) 4067–4077
5. Results and discussion
5.1. The effect of the PAGV on the performance of the system
The advantages of integrating the PAGV into an existing wind–solar system are illustrated and compared with similar character-istics of the system without the PAGV. The operating time andextractable energy of the wind turbine increase with the imple-mentation of the PAGV. Therefore, it affects initial capital and pay-back time of the system. Based on the original specifications of theselected wind turbine, the minimum operating wind speed is3.0 m/s. The average of operating hours and energy generation ofthis site in years 2007–2009 is tabulated in Table 5. The analysisis done based on the operating wind speed in the range of3–25 m/s. On average, the number of operating hours increasesabout 57.6% when the PAGV is applied. Likewise, energy generationincreases by about 327%.
Photovoltaic arrayPV panel $226,240.00Estimated installation $3000.00
Wind systemH-rotor wind turbine $223,280.00PAGV construction $50,000.00Yawing mechanism $55,000.00
Inverter $$15,200.00Hybrid controller $12,520.00Rainwater collector $15,000.00Estimated capital cost $600,240.00
Operation and maintenance (O&M)PV O&M cost per kW h ($/kW h) $0.001PV O&M cost per day $0.296Wind turbine O&M cost per kW h ($/kW h) $0.011Wind turbine O&M cost per day $2.598Yaw mechanism O&M (yearly) $1000.00
Estimated annual O&M costs $2050.00
Table 7Economic parameters.
5.2. Financial evaluation
The annual energy generated and saved by this wind–solar hy-brid energy generation system and rain water collector in a sitearound Petaling Jaya is estimated to be 195.2 MW h. According tothe annual report published by Tenaga Nasional Berhad (TNB) inyear 2009, the average annual electric energy consumption perunit domestic customer in Malaysia is approximately 2.86 MW h[36]. This amount of saved energy is sufficient to supply about68 units of domestic customer.
The whole system is estimated to cost about USD$600,240 with10% down payment is made. The rest of the capital is financed in aperiod of 25 years at an interest rate of 7%. It is expected to paygeneral operation and maintenance costs for components of thesystem annually with an inflation rate of 4% [37]. Energy pricingmechanism in Malaysia is a combination of market-driven and reg-ulated prices [38]. The commercial tariff of electricity, provided byTNB is $0.113/kW h [39]. According to the electricity price trend,tariff rate is predicted to rise by 10% annually. The extra property
Table 5The average of annual operating hour and energy generation of wind turbine inPetaling Jaya (z = 220 m) for years 2007–2009.
Number of operatinghours
Energy generation(MW h)
Without PAGV 4049 20.2With PAGV 6383 86.2
Increment percentage 57.6% 327%
tax is 2% of the initial capital. Operation and maintenance costsfor PV panels and wind turbine are estimated to be $0.001 and$0.011 per kW h respectively [40,41]. Details of these costs, main-tenance and economic parameters are shown in Table 6 and 7.
Inverters and hybrid controllers need to be replaced after cer-tain periods of time and are much more expensive than to be in-cluded into the maintenance annual fee. They are expected to bereplaced every five years. Their price is estimated to increase by4% annually. The effective income tax rate is estimated to be 45%through the life cycle.
The NPV of the energy system over a 25-year period is $29,528at the market discount rate of 8%. Financial calculations are shown
Item Value
Electricity price (per kW h) $0.1134Down payment 10%Inflation rate of electricity price 10%Inflation rate of controller price 4%Inflation rate of inverter price 4%Inflation rate of operation and maintenance 4%Inflation rate of extra property tax 4%Interest rate of principal 7%Discount factor 8%Extra property tax (percentage of principal) 2%

Table 8The economic analysis of the hybrid energy system (in US$) for Petaling Jaya (25-year life cycle).
Year Energygeneration(kW h/year)
Cost ofenergy ($)
Extra mortgagepayment
Interestin year
Principalpayment
Principalbalance
Inverterreplacement
Controllerreplacement
Maint. andoper.
Extra propertytax
Income taxsavings
WSRsavings
PV of WSRsavings
Cum. WSRsavings
Cum. energycost savings
0 540,216 (60,024) (60,024) (60,024) –1 195,220 22,138 (46,355) 37,815 8539 531,677 – – (2050) (12,005) 22,419 (15,852) (14,678) (75,876) 22,1382 195,220 24,352 (46,355) 37,217 9137 522,539 – – (2132) (12,485) 22,366 (14,254) (12,220) (90,130) 46,4903 195,220 26,787 (46,355) 36,578 9777 512,763 – – (2217) (12,984) 22,303 (12,466) (9896) (102,597) 73,2774 195,220 29,466 (46,355) 35,893 10,461 502,301 – – (2306) (13,504) 22,229 (10,470) (7696) (113,067) 102,7425 195,220 32,412 (46,355) 35,161 11,193 491,108 (18,493) (15,232) (2398) (14,044) 22,142 (41,968) (28,563) (155,034) 135,1546 195,220 35,653 (46,355) 34,378 11,977 479,131 – – (2494) (14,606) 22,042 (5759) (3629) (160,793) 170,8087 195,220 39,219 (46,355) 33,539 12,815 466,316 – – (2594) (15,190) 21,928 (2992) (1746) (163,784) 210,0268 195,220 43,141 (46,355) 32,642 13,712 452,603 – – (2698) (15,797) 21,798 89 48 (163,696) 253,1679 195,220 47,455 (46,355) 31,682 14,672 437,931 – – (2806) (16,429) 21,650 3515 1759 (160,180) 300,622
10 195,220 52,200 (46,355) 30,655 15,699 422,231 (22,500) (18,533) (2918) (17,087) 21,484 (33,707) (15,613) (193,888) 352,82211 195,220 57,420 (46,355) 29,556 16,798 405,433 – – (3035) (17,770) 21,297 11,558 4957 (182,330) 410,24212 195,220 63,162 (46,355) 28,380 17,974 387,459 – – (3156) (18,481) 21,088 16,258 6456 (166,072) 473,40413 195,220 69,478 (46,355) 27,122 19,232 368,226 – – (3282) (19,220) 20,854 21,476 7897 (144,596) 542,88314 195,220 76,426 (46,355) 25,776 20,579 347,648 – – (3413) (19,989) 20,594 27,263 9282 (117,332) 619,30915 195,220 84,069 (46,355) 24,335 22,019 325,628 (27,374) (22,548) (3550) (20,788) 20,306 (16,241) (5120) (133,573) 703,37816 195,220 92,476 (46,355) 22,794 23,561 302,068 – – (3692) (21,620) 19,986 40,796 11,908 (92,778) 795,85317 195,220 101,723 (46,355) 21,145 25,210 276,858 – – (3840) (22,485) 19,633 48,678 13,156 (44,100) 897,57718 195,220 111,896 (46,355) 19,380 26,975 249,883 – – (3993) (23,384) 19,244 57,408 14,366 13,308 1009,47219 195,220 123,085 (46,355) 17,492 28,863 221,021 – – (4153) (24,320) 18,815 67,073 15,542 80,381 1132,55720 195,220 135,394 (46,355) 15,471 30,883 190,138 (33,305) (27,433) (4319) (25,292) 18,344 17,034 3655 97,414 1267,95121 195,220 148,933 (46,355) 13,310 33,045 157,093 – – (4492) (26,304) 17,826 89,609 17,801 187,023 1416,88422 195,220 163,826 (46,355) 10,996 35,358 121,735 – – (4671) (27,356) 17,259 102,703 18,891 289,726 1580,71023 195,220 180,209 (46,355) 8521 37,833 83,901 – – (4858) (28,450) 16,637 117,183 19,958 406,909 1760,91924 195,220 198,230 (46,355) 5873 40,481 43,420 – – (5053) (29,588) 15,958 133,192 21,004 540,101 1959,14925 195,220 218,053 (46,355) 3039 43,315 105 – – (5255) (30,772) 15,215 150,887 22,032 690,988 2177,202
Sum 29,528
W.T.Chong
etal./A
ppliedEnergy
88(2011)
4067–4077
4075

Fig. 10. The annual present value of the system savings over the economic analysis period (25-years life cycle cost analysis).
Fig. 11. Changes in principal balance, cumulative WSR savings and cumulative energy cost savings as a function of time through the 25-years life cycle cost analysis.
4076 W.T. Chong et al. / Applied Energy 88 (2011) 4067–4077
in Table 8. The sum of the yearly present value of the wind–solar–rain system is the NPV of the gains from this hybrid system. Aremarkable portion of the energy demand of a high-rise buildingcould be supplied by this innovative hybrid energy system. Eco-nomic analysis of this system shows that for the first time at year8, cash flow becomes positive. But, because of the replacement ofhybrid controller and inverter it turned negative for some yearsafter that. After year 15 the cash flow becomes positive forever(Fig. 10). So, it shows the effect of the PAGV in improving the per-formance of this hybrid energy system. By improving the efficiencyof this system, it will become more economical. Based on recentpolicy by the government in Malaysia about feed-in tariff (FIT)for renewable energy to enable users to sell excess power to thepower grid, generated energy by renewable sources will be pur-chased in higher price than the selling price [42]. However, noneof these subsidies are included in this analysis. Payback time is de-fined in many ways. Below, some information that can be extractedfrom Table 8 and Fig. 11 are listed:
(a) The cumulative energy cost savings ($619,309) exceeds theinitial capital in year 14.
(b) The cumulative WSR system savings turns positive by year18.
(c) The cumulative WSR system savings ($187,023) exceeds theremaining principal balance ($157,093) by the end of year21.
6. Conclusion
In this paper, a techno-economic analysis has been carried outon an innovative wind–solar hybrid renewable energy generationsystem with rainwater collection feature for urban high-rise appli-cation. Technical viability of the system shows that by integratingthe available technologies of wind turbine, PV panels and rainwa-ter collector with the PAGV, this system can cover a significant por-tion of a building’s energy demands and helps to make the buildingindependent (or partially independent) from the urban electricitygrid. The analysis shows that for a system with the PAGV (30 mdiameter and 14 m high) and an H-rotor VAWT (17 m diameterand 9 m high) mounted on the top of a 220 m high buildingin Petaling Jaya, the estimated annual energy savings is195.2 MW h/year. The importance of the PAGV is determined bycomparing the system performance with another system whichis technically similar but without the PAGV. There was a 327% in-crease in energy generation when the PAGV is applied. The PAGValso improves the starting behavior and prolongs the operating
W.T. Chong et al. / Applied Energy 88 (2011) 4067–4077 4077
hour of the wind turbine. Economic analysis shows that manufac-turing, operation and maintenance costs of the system are coveredin the lifetime of the system. For this project, the NPV is $29,528 forthe 25-years lifetime.
This design is a reliable model for large scale systems placed inurban areas. The configuration solves or alleviates several prob-lems of wind–solar energy systems such as safety, visual impact,noise pollution and response to the wind. It is placed on top of ahigh-rise building to prevent any disturbance to surrounding. Inaddition, augmenting the performance of the wind turbine canhelp to address low wind speed potential of this site. Based onthe new FIT mechanism for green energy generation in Malaysia,there will be a considerable reduction in the payback period of ini-tial investment and a significant incentive for the private sector toinvest in renewable energy systems. Since the selected site for thisstudy is situated at low wind speed region, shorter payback periodcan be expected for sites with higher wind speed.
References
[1] Kimura Y, Onai Y, Ushiyama I. A demonstrative study for the wind and solarhybrid power system. Renew Energy 1996;9:895–8.
[2] Yang H, Zhou W, Lou C. Optimal design and techno-economic analysisof a hybrid solar–wind power generation system. Appl Energy 2009;86:163–9.
[3] Zhou W, Lou C, Li Z, Lu L, Yang H. Current status of research on optimum sizingof stand-alone hybrid solar–wind power generation systems. Appl Energy2010;87:380–9.
[4] Saheb-Koussa D, Haddadi M, Belhamel M. Economic and technical study of ahybrid system (wind-photovoltaic-diesel) for rural electrification in Algeria.Appl Energy 2009;86:1024–30.
[5] Chong WT, Kong YY, Tan LL. Wind, solar and rain harvester. Intel-lectual Property Corporation of Malaysia; 2009. Patent No.: PCT/MY2010/000059.
[6] Elcock D. Life-cycle thinking for the oil and gas exploration and productionindustry. Argonne National Laboratory; 2007. <www.evs.anl.gov/pub/dsp_detail.cfm?PubID=2154> [September 2010].
[7] Rehman S, Al-Hadhrami LM. Study of a solar PV-diesel-battery hybrid powersystem for a remotely located population near Rafha, Saudi Arabia. Energy2010;35:4986–95.
[8] Elhadidy MA, Shaahid SM. Parametric study of hybrid (wind + solar + diesel)power generating systems. Renew Energy 2000;21:129–39.
[9] Elhadidy MA, Shaahid SM. Optimal sizing of battery storage for hybrid(wind + diesel) power systems. Renew Energy 1999;18:77–86.
[10] Abdullah MO, Yung VC, Anyi M, Othman AK, Ab Hamid KB, Tarawe J. Reviewand comparison study of hybrid diesel/solar/hydro/fuel cell energy schemesfor a rural ICT telecenter. Energy 2010;35:639–46.
[11] Bahaj AS, Myers L, James PAB. Urban energy generation: Influence of micro-wind turbine output on electricity consumption in buildings. Energy Build2007;39:154–65.
[12] Beyer HG, Langer C. A method for the identification of configurations of PV/wind hybrid systems for the reliable supply of small loads. Solar Energy1996;57:381–91.
[13] Tripathy SC, Lakshmi SR, Balasubramanian R. Production costing and economicanalysis of power systems containing wind energy conversion systems. EnergyConvers Manage 1998;39:649–59.
[14] Bakos GC. A systematic techno-economic assessment of a WEC systeminstallation for low-cost electrification of a habitable dwelling. Appl Energy2002;72:609–19.
[15] Morrison ML, Sinclair K. Wind energy technology, environmental impacts of.In: Cutler JC, editor. Encyclopedia of energy. New York: Elsevier; 2004. p.435–48.
[16] Karlis AD, Dermentzoglou JC, Papadopoulos DP. Wind energy surveying andtechnoeconomic assessment of identifiable WEC system installations. EnergyConvers Manage 2001;42:49–67.
[17] Kalantar M, Mousavi GSM. Dynamic behavior of stand-alone hybrid powergeneration system of wind turbine, microturbine, solar array and batterystorage. Appl Energy 2010;87:3051–64.
[18] Bekele G, Palm B. Feasibility study for a standalone solar–wind-basedhybrid energy system for application in Ethiopia. Appl Energy 2010;87:487–95.
[19] Ekren BY, Ekren O. Simulation based size optimization of a PV/wind hybridenergy system with battery storage under various load and auxiliary energyconditions. Appl Energy 2009;86:1387–94.
[20] Ekren O, Ekren BY. Size optimization of a PV/wind hybrid energy conversionsystem with battery storage using simulated annealing. Appl Energy2010;87:592–8.
[21] Ekren O, Ekren BY. Size optimization of a PV/wind hybrid energy conversionsystem with battery storage using response surface methodology. Appl Energy2008;85:1086–101.
[22] Ekren O, Ekren BY, Ozerdem B. Break-even analysis and size optimization of aPV/wind hybrid energy conversion system with battery storage – a case study.Appl Energy 2008;86:1043–54.
[23] Diaf S, Notton G, Belhamel M, Haddadi M, Louche A. Design and techno-economical optimization for hybrid PV/wind system under variousmeteorological conditions. Appl Energy 2008;85:968–87.
[24] Celik AN. Optimisation and techno-economic analysis of autonomousphotovoltaic–wind hybrid energy systems in comparison to singlephotovoltaic and wind systems. Energy Convers Manage 2002;43:2453–68.
[25] Bakos GC, Tsagas NF. Technical feasibility and economic viability of a small-scale grid connected solar thermal installation for electrical-energy saving.Appl Energy 2002;72:621–30.
[26] Bakos GC, Soursos M, Tsagas NF. Technoeconomic assessment of a building-integrated PV system for electrical energy saving in residential sector. EnergyBuild 2003;35:757–62.
[27] Bakos GC, Tsagas NF. Technoeconomic assessment of a hybrid solar/windinstallation for electrical energy saving. Energy Build 2003;35:139–45.
[28] Wilson A. The folly of building-integrated wind. Environmental BuildingNews; 2009. <http://www.buildinggreen.com/auth/article.cfm/2009/4/29/The-Folly-of-Building-Integrated-Wind/?sidebar=1> [March 2011].
[29] Heymann M. Signs of Hubris: the shaping of wind technology styles inGermany, Denmark, and the United States, 1940–1990. Technol Culture1998;39:641–70.
[30] Chong WT, Mansor S, Omar WZW, Pan KC, Deep CH. Design features andrequirements of an innovative 3-in-1 wind-solar hybrid renewable energy andrain water harvester for urban high rise application. In: The 3rd internationalconference on ‘‘sustainable energy and environment (SEE 2009). Bangkok,Thailand; 2009.
[31] Knight J. Breezing into town. Nature 2004;430:12–3.[32] Patel M. Wind and solar power systems: design, analysis, and
operation. Florida: Taylor & Francis; 2006. p. 34–45.[33] Eriksson S, Bernhoff H, Leijon M. Evaluation of different turbine concepts for
wind power. Renew Sustain Energy Rev 2008;12:1419–34.[34] Chong WT, Zainon MZ, Poh SC, Soo CK, Wee SK, Pan KC. Innovative power-
augmentation-guide-vane design of wind-solar hybrid renewable energyharvester for urban high rise application. In: The 10th Asian internationalconference on fluid machinery. Malaysia; 2009.
[35] Duffie J, Beckman W. Solar engineering of thermal processes. NewJersey: Wiley; 2006. p. 453–74.
[36] Annual report. Tenaga Nasional Berhad (TNB). 2009. <http://www.tnb.com.my/investors-media/annual-reports.html> [November 2010].
[37] Malaysia inflation rate. Trading Economics. 2010. <http://www.tradingeconomics.com/economics/inflation-cpi.aspx?symbol=myr> [September 2010].
[38] Energy pricing practices. Asia Pacific Energy Research Centre (APERC). 2000.<http://www.ieej.or.jp/aperc/final/pricing.pdf> [July 2010].
[39] Commercial pricing & tariff. Tenaga Nasional Berhad. 2010. <http://www.tnb.com.my/tnb/business/for-commercial/pricing-tariff.html> [October 2010].
[40] Photovoltaic economics. PVresources. 2010. <http://www.pvresources.com/en/economics.php> [December 2010].
[41] Wind energy – the facts, cost and prices. European Wind Energy association.2010. <http://www.ewea.org/fileadmin/ewea_documents/documents/publications/WETF/Facts_Volume_2.pdf> [December 2010].
[42] Malaysia to introduce feed-in tariff for renewable energy in 2011. SuruhanjayaTenaga. 2010. <http://www.st.gov.my/index.php?option=com_content&view=article&id=5476%3Amalaysia-to-introduce-feed-in-tariff-for-renewable-ener-gy-in-2011-says-peter-chin&catid=794%3Aenergy-news&Itemid=1201&lang=en> [November 2010].