TECHNICAL SUPPORT DOCUMENT EMISSION INVENTORY DEVELOPMENT … II MARAMA Inventory TSD 201… ·...
100
TECHNICAL SUPPORT DOCUMENT EMISSION INVENTORY DEVELOPMENT FOR 2011 AND PROJECTIONS TO 2020 AND 2023 FOR THE NORTHEASTERN U.S. GAMMA VERSION Prepared by: Julie R. McDill, P.E. and Susan McCusker Mid-Atlantic Regional Air Management Association, Inc. (MARAMA) 8600 LaSalle Road, Suite 636 Towson, MD 21286 443.901.1882 [email protected] / [email protected] TSD January 29, 2018
Transcript of TECHNICAL SUPPORT DOCUMENT EMISSION INVENTORY DEVELOPMENT … II MARAMA Inventory TSD 201… ·...

TECHNICAL SUPPORT DOCUMENT
EMISSION INVENTORY DEVELOPMENT
FOR 2011 AND PROJECTIONS TO 2020 AND 2023
FOR THE NORTHEASTERN U.S.
GAMMA VERSION
Prepared by:
Julie R. McDill, P.E. and Susan McCusker
Mid-Atlantic Regional Air Management Association, Inc. (MARAMA)
8600 LaSalle Road, Suite 636
Towson, MD 21286
443.901.1882
[email protected] / [email protected]
TSD
January 29, 2018


Technical Support Document for the 2011 Northeastern U.S. Emission Inventory with projections to 2020 and 2023 GAMMA Version January, 2018
Page i
TABLE OF CONTENTS
1. INTRODUCTION ............................................................................................................................................... 9
2. 2011 BASE YEAR INVENTORY DEVELOPMENT .................................................................................. 15
2.1. Point Sources ................................................................................................................................... 16 2.1.1. Point On-Shore Oil & Gas Production Facilities ...................................................................................................... 17 2.1.2. Offshore Oil & Gas Drilling Platforms ...................................................................................................................... 17 2.1.3. Ethanol Production Facilities ................................................................................................................................... 17 2.1.4. Gasoline Unloading and Refueling .......................................................................................................................... 17 2.1.5. EGU, Small EGU and Other Point Sources Sub-Sectors ....................................................................................... 17 2.1.5.1. Electric Generation Units (EGU) ............................................................................................................................. 18 2.1.5.2. Non-ERTAC IPM Sources (Small EGUs) ................................................................................................................ 18 2.1.5.3. Other Point Sources ................................................................................................................................................ 18
2.2. Nonpoint Sources ........................................................................................................................... 19 2.2.1. Fugitive Dust ........................................................................................................................................................... 20 2.2.2. Agricultural Ammonia .............................................................................................................................................. 20 2.2.3. Nonpoint On-shore Oil and Gas Production ............................................................................................................ 20 2.2.4. Portable Fuel Containers (PFC) .............................................................................................................................. 21 2.2.5. Gasoline Unloading and Refueling .......................................................................................................................... 21 2.2.6. Residential Wood Combustion ................................................................................................................................ 21 2.2.7. Agricultural Burning ................................................................................................................................................. 21 2.2.8. Other Nonpoint Sources .......................................................................................................................................... 22 2.2.8.1. State refinements to the nonpoint inventory ............................................................................................................ 22
2.3. Aircraft, Locomotives, and Commercial Marine Vessels (Marine/Air/Rail – MAR)23 2.3.1. Aircraft and Related Equipment .............................................................................................................................. 24 2.3.2. Locomotives and Rail Yards ................................................................................................................................... 25 2.3.3. Commercial Marine Vessels ................................................................................................................................... 26
2.4. Nonroad Equipment ...................................................................................................................... 27
2.5. Onroad Vehicles .............................................................................................................................. 27
2.6. Fires .................................................................................................................................................... 28
2.7. Biogenic Sources............................................................................................................................. 29
3. FUTURE YEAR INVENTORY DEVELOPMENT ....................................................................................... 30
3.1. Overview of Inventory Projection Methodology ................................................................. 30
3.2. ERTAC EGU Emissions .................................................................................................................. 33 3.2.1. ERTAC EGU Inputs ................................................................................................................................................ 34 3.2.2. ERTAC EGU Tool Background ............................................................................................................................... 35 3.2.3. ERTAC EGU Tool –Continental United States (CONUS) V2.7 ................................................................. 38 3.2.3.1. Controls Applied Beyond State Input to Comply with CSAPR Update ...................................................... 39 3.2.3.2. Region and fuel specific Growth Factor Adjustments ................................................................................... 40 3.2.4. ERTAC to SMOKE Conversion ............................................................................................................................... 42
3.3. Indicators, Controls, Shutdowns ............................................................................................... 44 3.3.1. Projecting Sector Activity Change ........................................................................................................................... 44 3.3.1.1. Energy Consumption Projections ............................................................................................................................ 45 3.3.1.1. Population Projection .............................................................................................................................................. 52 3.3.1.2. Employment Projections ......................................................................................................................................... 55

Technical Support Document for the 2011 Northeastern U.S. Emission Inventory with projections to 2020 and 2023 GAMMA Version January, 2018
Page ii
3.3.2. Control Factors ........................................................................................................................................................ 60 3.3.3. National Control Factors ......................................................................................................................................... 60 3.3.3.1. USEPA NSPS Control Measures ............................................................................................................................ 60 3.3.3.2. Boiler Maximum Achieveable Control Technology (MACT) Rules .......................................................................... 60 3.3.3.3. RICE NESHAP Standards ...................................................................................................................................... 62 3.3.3.4. Consent Decrees and State Comments .................................................................................................................. 62 3.3.4. OTC and MANE-VU Control Measures ................................................................................................................... 63 3.3.4.1. State NOx Rules and Control Requirements .......................................................................................................... 63 3.3.4.2. State VOC Rules and Control Requirements ......................................................................................................... 64 3.3.4.3. State Fuel Oil Sulfur Rules ...................................................................................................................................... 65 3.3.4.1. Portable Fuel Container Rules ................................................................................................................................ 67
3.4. Closures and Emission Offsets ................................................................................................... 68
3.5. Growth Factor Spreadsheets and EMF packets ................................................................... 69
3.6. Point Source Sector Projection ................................................................................................. 70 3.6.1. State Preferences ................................................................................................................................................... 70 3.6.2. Other Point Sources ................................................................................................................................................ 71 3.6.3. Small EGUs Points .................................................................................................................................................. 72 3.6.4. Point On-Shore Oil & Gas Production Facilities ...................................................................................................... 72 3.6.5. Offshore Oil & Gas Drilling Platforms ...................................................................................................................... 73 3.6.6. Ethanol Production Facilities ................................................................................................................................... 73 3.6.7. Stand-Alone Inventories .......................................................................................................................................... 73
3.7. Non-Point Sector Projection ....................................................................................................... 73 3.7.1.1. State Preferences ................................................................................................................................................... 73 3.7.1.2. Reentrained Road Dust ........................................................................................................................................... 74 3.7.1.3. Agricultural Fertilizer and Livestock Waste ............................................................................................................. 74 3.7.1.4. Residential Wood Combustion ................................................................................................................................ 74 3.7.1.5. Oil and Gas Production ........................................................................................................................................... 75
3.8. Aircraft, Locomotives, and Commercial Marine Vessels Projection ............................ 76 3.8.1. Locomotives and C1, C2 & C3 Commercial Marine Vessels .................................................................................. 76 3.8.2. Aircraft Engines, GSE, and APUs ........................................................................................................................... 76
3.9. Nonroad Equipment ...................................................................................................................... 77
3.10. Onroad Projection.......................................................................................................................... 78
3.11. Sectors Where Base and Future Year Emissions are Identical ...................................... 78 3.11.1. Fires ........................................................................................................................................................................ 78 3.11.2. Biogenic Sources Projection ................................................................................................................................... 78
4. OTHER SECTORS AND FILES ..................................................................................................................... 79
5. DATA FILES ..................................................................................................................................................... 80
6. DATA SUMMARIES ........................................................................................................................................ 89
6.1. Carbon Monoxide ........................................................................................................................... 90
6.2. Ammonia ........................................................................................................................................... 91
6.3. Oxides of Nitrogen ......................................................................................................................... 92
6.4. PM10 ................................................................................................................................................... 93
6.5. PM2.5 .................................................................................................................................................. 94

Technical Support Document for the 2011 Northeastern U.S. Emission Inventory with projections to 2020 and 2023 GAMMA Version January, 2018
Page iii
6.6. Sulfur Dioxide .................................................................................................................................. 95
6.7. Volatile Organic Compounds...................................................................................................... 96
7. REFERENCES ................................................................................................................................................... 97

Technical Support Document for the 2011 Northeastern U.S. Emission Inventory with projections to 2020 and 2023 GAMMA Version January, 2018
Page iv
LIST OF FIGURES
Figure 1: Iterative development of the USEPA and Northeast Inventories ..................................................................................... 12 Figure 2: Data Sources for 2011, 2020, and 2023 Inventories by Source Sector ........................................................................... 14 Figure 3: Overview of Emission Projection Methodology for Each Source Sector ......................................................................... 30 Figure 4: Regional boundaries for coal generation, CONUSv2.7 which are based on the Electricity Market Module (EMM)
Regions ...................................................................................................................................................................................... 36 Figure 5: EMM to NERC Crosswalk – ERTAC EGU V2.7 .............................................................................................................. 37 Figure 6: Summary of Inputs to ERTAC EGU v2.7 Model Run ...................................................................................................... 41 Figure 7: EPA Emission Factors from AP-42 .................................................................................................................................. 43 Figure 8: AEO 2015 Commercial Energy Consumption Projections – New England States .......................................................... 47 Figure 9: AEO 2015 Commercial Energy Consumption Projections – Mid-Atlantic States ............................................................. 47 Figure 10: AEO 2015 Commercial Energy Consumption Projections – South-Atlantic Jurisdictions ............................................ 47 Figure 11: AEO 2015 Industrial Energy Consumption Projections – New England States ............................................................. 48 Figure 12: AEO 2015 Industrial Energy Consumption Projections – Mid-Atlantic States .............................................................. 48 Figure 13: AEO 2015 Industrial Energy Consumption Projections – South-Atlantic Jurisdictions .................................................. 48 Figure 14: AEO 2015 Electric Power Energy Consumption Projections – New England States .................................................... 49 Figure 15: AEO 2015 Electric Power Energy Consumption Projections – Mid-Atlantic States ....................................................... 49 Figure 16: AEO 2015 Electric Power Energy Consumption Projections – South-Atlantic Jurisdictions .......................................... 49 Figure 17: AEO 2015 Residential Energy Consumption Projections – New England States ......................................................... 50 Figure 18: AEO2015 Residential Energy Consumption Projections – Mid-Atlantic States ............................................................. 50 Figure 19: AEO2015 Residential Energy Consumption Projections – South-Atlantic Jurisdictions ................................................ 50 Figure 20: AEO2015 Transportation Energy Consumption Projections – New England States ..................................................... 51 Figure 21: AEO2015 Transportation Energy Consumption Projections – Mid-Atlantic States ........................................................ 51 Figure 22: AEO2015 Transportation Energy Consumption Projections – South-Atlantic Jurisdictions .......................................... 51 Figure 23: Population Data Sources ............................................................................................................................................... 52 Figure 24: Population Projections – New England States .............................................................................................................. 54 Figure 25: Population Projections – Mid-Atlantic States ................................................................................................................. 54 Figure 26: Population Projections – South Atlantic Jurisdictions .................................................................................................... 54 Figure 27: Employment Data Sources ............................................................................................................................................ 55 Figure 28: Employment Projections for Crop Production (NAICS=111) ......................................................................................... 57 Figure 29: Employment Projections for Oil & Gas Extraction (NAICS=211) ................................................................................... 57 Figure 30: Employment Projections for Manufacturing (NAICS=31x) Food, Beverage, Textiles, Apparel ..................................... 58 Figure 31: Employment Projections for Manufacturing (NAICS=32x) Wood, Paper, Petroleum, Chemicals, Plastics ................... 58 Figure 32: Employment Projections for Manufacturing (NAICS=33x) Metals, Machinery, Electronics, Transportation Equipment,
Furniture ..................................................................................................................................................................................... 59 Figure 33: Employment Projections for Repair and Maintenance (NAICS=811) including Automobile Repair and Maintenance .. 59 Figure 34: Boiler MACT Tune-up Percent Reductions .................................................................................................................... 61 Figure 35: Boiler MACT Conversion Percent Reductions ............................................................................................................... 62 Figure 36: Status of State Fuel Oil Sulfur Rules (as of April 2016) ................................................................................................. 66 Figure 37: State Totals of Emissions Offsets .................................................................................................................................. 68 Figure 38: State Preferences for nonERTAC Point Source Growth Factors .................................................................................. 71 Figure 39: Annual Emission Inventory Files for 2011 ..................................................................................................................... 81 Figure 40: Annual Emission Inventory Files for 2020 ..................................................................................................................... 83 Figure 41: Annual Emission Inventory Files for 2023 ..................................................................................................................... 86 Figure 42: Annual Emission Summary for Carbon Monoxide ......................................................................................................... 90 Figure 43: Annual Emission Summary for Ammonia ...................................................................................................................... 91 Figure 44: Annual Emission Summary for Oxides of Nitrogen ........................................................................................................ 92

Technical Support Document for the 2011 Northeastern U.S. Emission Inventory with projections to 2020 and 2023 GAMMA Version January, 2018
Page v
Figure 45: Annual Emission Summary for Unadjusted PM10 ......................................................................................................... 93 Figure 46: Annual Emission Summary for Unadjusted PM2.5 ........................................................................................................ 94 Figure 47: Annual Emission Summary for Sulfur Dioxide .............................................................................................................. 95 Figure 48: Annual Emission Summary for Volatile Organic Compounds ........................................................................................ 96

Technical Support Document for the 2011 Northeastern U.S. Emission Inventory with projections to 2020 and 2023 GAMMA Version January, 2018
Page vi
LIST OF APPENDICES
Appendix A – ERTAC, CAMD and NEI Cross Reference File
Appendix B – ERTAC Unit Availability File
Appendix C – CAMD 2011 Unit File
Appendix D – AP42 Coal Combustion
Appendix E – AP42 Fuel Oil Combustion
Appendix F – AP42 Natural Gas Combustion
Appendix G – AP42 Stationary Gas Turbines
Appendix H – UAF Emission Factors for Other Pollutants
Appendix I – ERTAC Controls File for Other Pollutants
Appendix J – AEO2015 Energy Consumption by Sector and Source New England
Appendix K – AEO2015 Energy Consumption by Sector and Source Mid-Atlantic
Appendix L – AEO2015 Energy Consumption by Sector and Source South Atlantic
Appendix M – State Employment Projections
Appendix N – State Preferences for Growth and Control Factors
Appendix O – Ozone Transport Commission State 2001 Rule Adoption
Appendix P – Ozone Transport Commission State 2006 Rule Adoption
Appendix Q – Ozone Transport Commission State 2009-2014 Rule Adoption
Appendix R – OTC/MANE-VU Control Matrix with State Recommendations
Appendix S – Low Sulfur Fuel Oil SO2 and NOx Reductions
Appendix T – State Population Projections
Appendix U – AEO2015 Crude Oil Production
Appendix V – AEO2015 Natural Gas Production
Appendix W – Emission Reduction Calculations for Portable Fuel Containers
Appendix X – CMV and Locomotive Growth and Control Factor Data
Appendix Y – EIS Quality Assurance Checks
Appendix Z – 2011 NEI Quality Assurance Plan
Appendix AA – Summary Spreadsheet of 2011, 2020, and 2023 emissions by Sector
Appendix BB – Assignment of SCCs to Inventory Sectors
Appendix CC – Assignment of Non-EGU Points missing from EPA platform
Appendix DD – New Jersey and North Carolina studies of the effect of Boiler MACT on point and area sources
Appendix EE – 2020 Nonroad and Onroad County Summaries

Technical Support Document for the 2011 Northeastern U.S. Emission Inventory with projections to 2020 and 2023 GAMMA Version January, 2018
Page vii
ACRONYMS
AEO Annual Energy Outlook
APU Auxiliary Power Unit
CAMD EPA Clean Air Markets Division
CAP Criteria Air Pollutant
CDB County Database
CEM Continuous Emission Monitoring
CMV Commercial Marine Vessel
CO Carbon Monoxide
CoST Control Strategy Tool
CSAPR Cross-state Air Pollution Rule
EGU Electric Generating Unit
EIA Energy Information Agency
EIS Emission Inventory System
EMF Emission Modeling Framework
EPA Environmental Protection Agency
ERTAC Eastern Regional Technical Advisory Committee
FAA Federal Aviation Administration
GSE Ground Support Equipment
HAP Hazardous Air Pollutant
ICI Industrial/commercial/institutional
IPM Integrated Planning Model
LTO Landing Takeoff
MACT Maximum Achievable Control Technology
MANE-VU Mid-Atlantic/Northeast Visibility Union
MARAMA Mid-Atlantic Regional Air Management Association
MMBtu Million British Thermal Units
NAAQS National Ambient Air Quality Standard
NAICS North American Industrial Classification System
NCD National County Database
NEI National Emission Inventory
NEI2011v1 Version 1 of the 2011 National Emission Inventory
NEI2011v2 Version 2 of the 2011 National Emission Inventory
NEMS National Energy Modeling System
NERC North American Electric Reliability Corporation
NH3 Ammonia
NMIM National Mobile Inventory Model
NOx Oxides of Nitrogen
OTC Ozone Transport Commission
PM10 Particles with diameter less than or equal to 10 micrometers

Technical Support Document for the 2011 Northeastern U.S. Emission Inventory with projections to 2020 and 2023 GAMMA Version January, 2018
Page viii
PM2.5 Particles with diameter less than or equal to 2.5 micrometers
RICE Reciprocating Internal Combustion Engines
RWC Residential Wood Combustion
S/L/T State/local/tribal
SCC Source Classification Code
SIP State Implementation Plan
SMOKE Sparse Matrix Operator Kernel Emissions
SO2 Sulfur Dioxide
TAF Terminal Area Forecast
TSD Technical Support Document
UAF Unit Availability File
VMT Vehicle Miles Travelled
VOC Volatile Organic Compound

Technical Support Document for the 2011 Northeastern U.S. Emission Inventory with projections to 2020 and 2023 GAMMA Version January, 2018
Page 9
1. INTRODUCTION
The Mid-Atlantic Regional Air Management Association (MARAMA) is coordinating the
development of Northeastern regional emissions inventories for air quality modeling. This
Technical Support Document (TSD) describes the development of a comprehensive Northeastern
regional emission inventory for 2011 and emission projections for 2020 and 2023. State, Local,
and Tribal (S/L/T) air agencies may use this inventory to address State Implementation Plan
(SIP) requirements for attaining national ambient air quality standards (NAAQS) for ozone and
fine particles, to evaluate progress towards long-term regional haze goals, and to support a single
integrated, one-atmosphere air quality modeling platform.
Key inventory attributes include:
Base Year: 2011
Projection Years: 2020 and 2023
Source Category Sectors: electric generating unit (EGU) point sources, other point sources,
nonpoint sources, nonroad mobile sources included in the NONROAD model, other nonroad
sources (aircraft, locomotives, commercial marine vessels), onroad mobile sources included
in the MOVES model, fire events, and biogenic sources.
Pollutants: ammonia (NH3), carbon monoxide (CO), oxides of nitrogen (NOx), filterable
plus condensable particles with diameter less than or equal to 10 and 2.5 micrometers (PM10
and PM25), sulfur dioxide (SO2), and volatile organic compounds (VOC).
Temporal Resolution: Variable by source sector. Most sectors are annual, however nonroad
emissions are monthly and biogenic, onroad and EGU emissions are hourly. Summaries
provided in this TSD are annual.
Geographic Area: 15 jurisdictions in the Northeastern U.S. (CT, DC, DE, MA, MD, ME,
NC, NH, NJ, NY, PA, RI, VA, VT, WV); additional states, Canadian provinces, and off-
shore sources are included in the complete modeling inventory for the Northeastern domain,
however, this detailed documentation is only for the states in the Northeastern US. A brief
summary of the projection methodology for emissions from other states and Canada within
the modeling domain is included in this document.
The guiding philosophy behind the development of both the MARAMA GAMMA 2011 and
future projection inventories was, where possible, to rely on the collaborative work of the S/L/T
air agencies and the U.S. Environmental Protection Agency (EPA) in developing the 2011
National Emissions Inventory (NEI) (EPA, 2015a) and the USEPA 2011 emissions modeling
platform (EPA, 2016a; EPA, 2016b; EPA, 2017).
This TSD does not attempt to duplicate the documentation available in EPA 2011 NEI and
modeling reports. Rather, it provides a brief summary of existing EPA documentation with
references to appropriate EPA documents. Copies of referenced documents are available on the
MARAMA website (http://www.marama.org/technical-center/emissions-inventory/projects-
overview).
This TSD contains the following Sections:
Section 1 is an introduction to the TSD

Technical Support Document for the 2011 Northeastern U.S. Emission Inventory with projections to 2020 and 2023 GAMMA Version January, 2018
Page 10
Section 2 documents the development of the 2011 inventory for each source sectors
Section 3 documents the development of the future year 2020 and 2023 inventories for each
source sector
Section 4 summarizes development of the sectors and files that were provided by others for
inclusion in the GAMMA inventory
Section 5 identifies the data files that make up the inventory which are stored on the
MARAMA Emission Modeling Framework (EMF)
Section 6 provides emissions data summaries by pollutant
Section 7 is a list of references
The development of both the USEPA and the regional MARAMA 2011 modeling inventory and
emission projections is an iterative process with multiple versions released as files are corrected
and refined. The following provides a summary of the EPA inventories used as resources in
development of MARAMA inventories. In general, MARAMA uses the EPA inventory as a
starting point, and further improves the base datasets and projection factors as a result of QA
checks and adjustments to account for improved interpretation of existing rules, or application of
state specific rules and controls not included in the national inventory. These changes are
described in detail for the GAMMA inventory in this TSD.
The EPA 2011 v6.3 or ‘en’ Modeling Platform (EPA, 2017) files were incorporated into the
MARAMA GAMMA 2011 inventory with projections to 2020 and 2023. The “e” in the
versioning stands for evaluation, meaning that year-specific data for fires and electric generating
units (EGUs) are used, and the “n” in the version designation indicates that this was the
fourteenth set of emissions modeled for a 2011-based modeling platform. Changes for this
inventory were primarily for states outside the Northeast except in the case of oil and gas
projections.
The EPA 2011 v6.3 or ‘el’ Modeling Platform (EPA, 2016b) was a key resource in preparing
the MARAMA GAMMA 2011 inventory with projections to 2020 and 2023. The “e” in the
versioning stands for evaluation, meaning that year-specific data for fires and electric generating
units (EGUs) are used, and the “l” in the version designation indicates that this was the twelfth
set of emissions modeled for a 2011-based modeling platform.1 For the northeast region, the
primary improvement to this platform is in its projection to future year, which made use of
updated 2023 growth and control factors, provided by MARAMA to EPA. Note that the USEPA
‘el’ inventory includes:
Updated fire emissions for Missouri
Updated biogenic emissions
Updated MOVES model
Changes to MOVES input files that were prepared by New Jersey for 13 counties in fall
2016
1 EPA made minor changes in the base year that did not warrant changing the version number from v6.3.

Technical Support Document for the 2011 Northeastern U.S. Emission Inventory with projections to 2020 and 2023 GAMMA Version January, 2018
Page 11
The EPA 2011 v6.3 or ‘ek’ Modeling Platform (EPA, 2016a) provided the emission factors
used in calculating mobile emissions in the MARAMA BETA2 inventory. The “k” in the
version designation indicates that this was the eleventh set of emissions modeled for a 2011-
based modeling platform. Table 2-2 of the EPA documentation provides a brief overview by
sector of the most significant differences between v6.3 and v6.2 of the 2011 emissions platforms.
Only the mobile emissions from the ‘ek’ inventory datasets were available in time for inclusion
in the MARAMA BETA2 modeling platform, the rest of the MARAMA BETA2 files are from
EPA v6.2 ‘eh’ inventory.
The EPA 2011 v6.2 or ‘eh’ Modeling Platform (EPA, 2015b) was a key resource in preparing
the MARAMA BETA2 2011 base year inventory. The “h” in the versioning represents that this
was the eighth set of emissions modeled for a 2011-based modeling platform. The EPA 2011
v6.2 platform integrates numerous datasets into a form useful for air quality modeling. The v6.2
platform, released in August 2015, was used by EPA to support ozone transport modeling for the
2008 National Ambient Air Quality Standards (NAAQS), the 2015 ozone NAAQS, and other
special studies. The inventory datasets include the 2011 NEI v2 emissions inventory updated
and corrected as a result of EPA QA and state input, as well as meteorological and other
supporting data. The improvements included elimination of some double counted sources.
The 2011 National Emissions Inventory (NEI) (EPA, 2015a) underlies all versions of the EPA
and MARAMA 2011 modeling inventories. The triannual NEI is prepared by the EPA based
primarily upon emission estimates and model inputs provided by S/L/T air agencies for sources
in their jurisdictions. To build the NEI, S/L/T submit their data to the EPA Emissions Inventory
System (EIS). The EIS stores the S/L/T data in a common format and performs hundreds of
automated QA checks to improve data quality. S/L/T agencies collaborate extensively with EPA
to avoid duplication of effort, use consistent data and methodologies, avoid duplication between
categories, ensure completeness and improve data quality. EPA reviews the S/L/T submittals
and provides feedback on data quality such as suspected outliers and missing data by comparing
to previously established emissions ranges and past inventories. EPA also augments the S/L/T
data to fill gaps. Data used for gap filling comes from other emission reporting programs
including the Acid Rain Program, the CAMD CEM database under 40 CFR Part 75, and EPA’s
regulatory development projects. In addition, EPA executes various emission estimation models
(EPA, 2015c) and blends data from these multiple sources, and performs quality assurance steps
that further enhance and augment the S/L/T data.
Figure 1 summarizes the parallel progression of USEPA and Northeast regional inventory
creation for the 2011 base inventory and future projection suites.

Technical Support Document for the 2011 Northeastern U.S. Emission Inventory with projections to 2020 and 2023 GAMMA Version January, 2018
Page 12
Figure 1: Iterative development of the USEPA and Northeast Inventories
The MARAMA ALPHA2 2011/2018/2028 inventory (MARAMA, 2015), was based on the
USEPA 2011 V2 platform, as released by EPA in October 2014. Growth factors used to create
future years 2018 and 2028 were based on EPA 2011/2018v1 and ERTAC EGU V2.3. Detailed
documentation of the ALPHA2 inventory can be found in the Technical Support Document
prepared in association with that inventory (MARAMA, 2015). The ALPHA2 inventory is
intended for Northeast regional visibility attainment demonstration modeling and preliminary
modeling to identify ozone control strategies.
The MARAMA BETA2 2011/2017 inventory (MARAMA, 2016), was based on the EPA
Version 6.2 or ‘eh’ 2011 platform (EPA, 2015b) as described earlier in this section. Growth
factors used to create future year 2017 were based on EPA 2011/2018v1 and ERTAC EGU
V2.5L2. The exception is mobile emissions for both 2011 and 2017 which rely on EPA's
Version 6.3 or ‘ek’ inventory. Detailed documentation of the BETA2 inventory can be found in
the Technical Support Document prepared in association with that inventory (MARAMA, 2016).
The BETA2 inventory is intended for Northeast regional modeling to identify ozone control
strategies.
The MARAMA GAMMA 2011 inventory with projections to 2020 and 2023 incorporates
datasets from EPA v6.3 2011 modeling platform inventory versions ‘ek’, ‘el’ and ‘en’ as
described earlier in this section. (EPA, 2016a; EPA, 2016b; EPA, 2017). For each subsector,
MARAMA GAMMA uses the latest, stable version of the files. For example, the ‘el’ inventory
Date EPA Platform Based On Date MARAMA Platform
November 2013USEPA 2011 Modeling
Platfrom V12011 NEI V1
January 2014USEPA 2018 Modeling
Platform V12011 NEI v1 April 2014 MARAMA V1
October 2014
USEPA 2011/2018
Modeling Platform V2
(Preliminary)
2011 NEI v2 Preliminary
March 2015
USEPA 2011/2018
Modeling Platform V2
(Final)
2011 NEI v2 Final March 2015 MARAMA Alpha 2011/2018
July 2015 MARAMA Alpha2 2011/2018
August 2015 2011 NEI v2 Final
December 2015MARAMA Alpha2
2011/2018/2028
January 2016 MARAMA Beta 2011
June 2016 MARAMA Beta 2017
Ocotober 2016
USEPA 2011/2023
Modeling Platform V6.3
'el'
August 2016MARAMA Beta 2023 Growth and
Control Factors
August 2017
USEPA 2011/2023
Modeling Platform V6.3
'en'
August 2017 MARAMA GAMMA 2011/2023
January 2018 MARAMA GAMMA 2011/2020
USEPA Inventory Development Northeast Inventory Development
Technical Support Document for the 2011 Northeastern U.S. Emission Inventory with projections to 2020 and 2023 GAMMA Version January, 2018
Page 13
included updated base year mobile and biogenic emissions so ‘ek’ was replaced with ‘el’ for
these sectors.
EPA files were used where possible. For 2011 and 2023, where EPA incorporated northeast
state information, GAMMA uses the resulting EPA inventory files unchanged. GAMMA also
uses MOVES input files, nonroad, fires and biogenics directly rather than independently creating
2011 or 2023 projections. Where MARAMA used the EPA datasets without change, then the
future year 2023 EPA datasets were also used. Where datasets were revised, MARAMA re-
projected the datasets to 2023. Refinements of the EPA or prior MARAMA inventory datasets
made by MARAMA for the GAMMA inventory are described in more detail in subsequent
sections of this document.
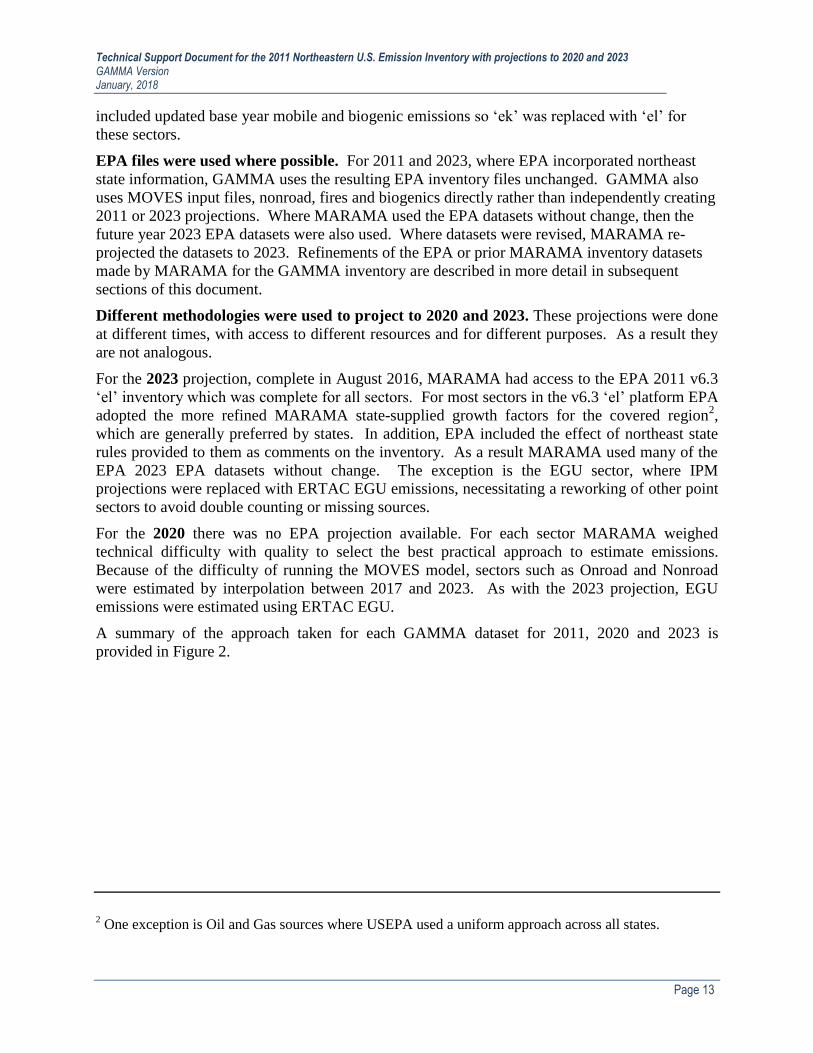
Different methodologies were used to project to 2020 and 2023. These projections were done
at different times, with access to different resources and for different purposes. As a result they
are not analogous.
For the 2023 projection, complete in August 2016, MARAMA had access to the EPA 2011 v6.3
‘el’ inventory which was complete for all sectors. For most sectors in the v6.3 ‘el’ platform EPA
adopted the more refined MARAMA state-supplied growth factors for the covered region2,
which are generally preferred by states. In addition, EPA included the effect of northeast state
rules provided to them as comments on the inventory. As a result MARAMA used many of the
EPA 2023 EPA datasets without change. The exception is the EGU sector, where IPM
projections were replaced with ERTAC EGU emissions, necessitating a reworking of other point
sectors to avoid double counting or missing sources.
For the 2020 there was no EPA projection available. For each sector MARAMA weighed
technical difficulty with quality to select the best practical approach to estimate emissions.
Because of the difficulty of running the MOVES model, sectors such as Onroad and Nonroad
were estimated by interpolation between 2017 and 2023. As with the 2023 projection, EGU
emissions were estimated using ERTAC EGU.
A summary of the approach taken for each GAMMA dataset for 2011, 2020 and 2023 is
provided in Figure 2.
2 One exception is Oil and Gas sources where USEPA used a uniform approach across all states.

Technical Support Document for the 2011 Northeastern U.S. Emission Inventory with projections to 2020 and 2023 GAMMA Version January, 2018
Page 14
Figure 2: Data Sources for 2011, 2020, and 2023 Inventories by Source Sector
Note: the specific files used for each sector and year are provided in Section 5.
MARAMA SectorPortion of modeling
domainSource for 2011 Inventory Source for the 2020 Inventory Source for 2023 Inventory
Point - ERTAC EGUs All states in modeling domain
ERTAC V2.5 with growth factors
set at 1.0 for NOx and SO2. State
provided emission rates for other
pollutants
ERTAC V2.7 for NOx and SO2, with
state provided emission rates for
other pollutants
ERTAC V2.7 for NOx and SO2, with state provided
emission rates for other pollutants
15 NE StatesProjected and controlled using
Gamma factors within the EMF tool.
Projected and controlled using Gamma factors within the
EMF tool
Other States in Modeling
Domain
Created and applied typical growth
factors. Applied EPA
Closure/controlv6.3 'ek' or 'en' where
updated. 2023 controls interpolated
where necessary.
Created and applied typical growth factors. Applied
EPA Closure/controlv6.3 'ek' or 'en' where updated.
15 NE StatesProjected and controlled using
Gamma factors within the EMF tool.
Projected and controlled using Gamma factors within the
EMF tool
Other States in Modeling
Domain
MARAMA Applied EPA v6.3 ‘ek’,‘en’
closure/control. Interpolated
2017/2023 growth and NSPS control
factors within the EMF tool.
Applied EPA v6.3 'ek'( 'en' where updated)
closure/growth control factors.
DE, DC, MD, NJ, NC, PA,
VA, WV
Projected and controlled using
Gamma factors within the EMF tool.
CT, ME, MA, NH, NY, RI, VT
and other states in the
Modeling Domain
Emissions were interpolated between
MARAMA 2017 Beta and 2023
GAMMA.
Point Non-IPM 15 NE StatesProjected and controlled 2011 using
Gamma factors within the EMF tool.
Projected and controlled 2011 using Gamma factors
within the EMF tool.
Point Non-IPM - Other States
in Modeling Domain
Applied EPA v6.3 ‘ek’,‘en’
closure/control. Interpolated
2017/2023 growth and NSPS control
factors.
Applied EPA v6.3 'ek'( 'en' where updated)
closure/growth control factors.
Point Refueling, all states EPA 2011 v6.3 (‘ek’)
New York DEC interpolation of
gridded emissions between 2017 and
2023.
EPA 2023 v6.3 (‘el’)
DE, DC, MD, NJ, NC, PA,
VA, WV
Projected and controlled using
Gamma factors within the EMF tool
Projected and controlled using Gamma factors within the
EMF tool
CT, ME, MA, NH, NY, RI, VT
and other states in the
Modeling Domain
MARAMA Applied EPA v6.3 ‘ek’,‘en’
closure/control. Interpolated
2017/2023 growth and NSPS control
factors within the EMF tool.
EPA 2023 v6.3 (‘en’)
15 NE StatesProjected and controlled using
Gamma factors within the EMF tool
Other States in Modeling
Domain
New York DEC interpolation of
gridded emissions between 2017 and
2023.
Nonroad – Commercial Marine Vessels
(C1,C2&C3) and Railroad LocomotivesAll states in modeling domain
EPA 2011 v6.3 ‘ek’ or ‘el’ where
updated
New York DEC interpolation of
gridded emissions between 2017 and
2023.
EPA 2023 v6.3 (‘el’)
Nonroad – NONROAD Model All states in modeling domain EPA 2011v6.3 (‘ek’) platform
New York DEC interpolation of
gridded emissions between 2017 and
2023.
EPA 2023 v6.3 (‘el’)
Onroad – MOVES Model All states in modeling domain
EPA 2011v6.3 (‘el’) platform
MOVES Model with updated New
Jersey data for 13 counties.
New York DEC interpolation of
gridded emissions between 2017 and
2023.
EPA 2023 v6.3 (‘el’) MOVES2014a emission factors
prepared for CB6 chemistry applied to EPA v6.2 county
level activity data.
Fire Events All states in modeling domain EPA 2011v6.2 (‘eh’) platformEPA 2011 v6.2 (‘eh’) platform (using
2011 inventory for 2020)
EPA 2011 v6.2 (‘eh’) platform (using 2011 inventory for
2023)
Biogenic All states in modeling domain EPA BEIS 3.61EPA BEIS 3.61 (using 2011
inventory for 2020)EPA BEIS 3.61 (using 2011 inventory for 2023)
Canadian SourcesCanadian sources in
modeling domain
EPA v6.3 (‘en’) platform - 2011
estimate
New York DEC interpolation of
gridded emissions between EPA v6.3
'en' 2011 and 2023.
EPA v6.3 (‘en’) platform - 2023 estimate
Because EPA had incorporated the MARAMA
growth/control/closure factors for northeast states
MARAMA was able to use the EPA v6.3 files
unchanged for all states.
EPA 2011 v6.3 (‘ek’) Nonpoint - Oil and Gas
Nonpoint – Area Sources (except Oil and
Gas)
EPA 2023 v6.3 (‘en’)
EPA 2011 v6.2 (‘eh’) subset of
EGU sectorPoint – Small EGUs
EPA 2011 v6.2 (‘eh’)
Point - Other sources not included in other
point subsectors
EPA 2011 v6.3 ‘ek’ or 'en' where
updated
Point - Oil and Gas EPA 2011 v6.3 (‘ek’)
EPA 2011 v6.2 (‘eh’) Point – Aircraft Engines, Ground Support
Equipment, Auxiliary Power Units

Technical Support Document for the 2011 Northeastern U.S. Emission Inventory with projections to 2020 and 2023 GAMMA Version January, 2018
Page 15
2. 2011 BASE YEAR INVENTORY DEVELOPMENT
As described in Section 1, MARAMA uses EPA's 2011 v6.3 inventory, which has a somewhat
different inventory source categorization than MARAMA's 2002 and 2007 legacy inventories, as
a starting point. The 2011 categorization is as follows, with differences between 2011 and the
legacy inventories noted:
Point Sources. This sector includes sources for which specific geographic coordinates (e.g.,
latitude/longitude) are specified, as in the case of an individual facility. A unit may have
multiple emission release points such as boilers, furnaces, spray booths, kilns, etc. In
addition, a unit may have multiple processes (e.g., a boiler that sometimes burns residual oil
and sometimes burns natural gas). The MARAMA GAMMA point source sector is further
partitioned into several subsectors to facilitate emission projection, comparison with the
USEPA inventory, and summarization. These include:
o Electric Generation Units (EGU)
o Non-ERTAC IPM sources (termed “Small EGUs” in the ALPHA2 inventory)
o Oil & Gas points (Onshore and Offshore)
o Ethanol Plants
o Stage 1 gasoline unloading ("refueling")
o Other Point Sources (Point Non-IPM)
Aircraft/GSE/APU Point Sources are included in the Other Point Sources
file. This sector includes emissions from aircraft engines, ground support
equipment (GSE) and auxiliary power units (APUs) that are identified as
point sources (e.g., emissions are located at specific airport locations). In
file summaries these are broken out for comparison with 2002 and 2007
legacy inventories. This sector also includes point Internal Combustion
Engines Railroad Equipment Diesel Yard Locomotives (SCC 28500201)
Nonpoint Sources. This sector includes sources which individually are too small in
magnitude or too numerous to inventory as individual point sources. Nonpoint sources
include smaller industrial, commercial and institutional facilities, as well as residential
sources. Nonpoint emissions are estimated at the county level. Rail yards are included with
this sector but not the locomotive emissions along rail lines. Both locomotive emissions
along rail lines and commercial marine vessel emissions are included in the nonroad sector
described below. The MARAMA GAMMA nonpoint source sector is further partitioned into
several subsectors as follows:
o Agriculture - livestock and fertilizer application
o Fugitive dust - building construction, road construction, agricultural dust, and
roadway dust
o Oil and gas processes
o Portable fuel containers
o Residential wood combustion
o Stage 1 gasoline unloading ("refueling")
o Agricultural field burning
o Remaining nonpoint sources not included in other subsectors

Technical Support Document for the 2011 Northeastern U.S. Emission Inventory with projections to 2020 and 2023 GAMMA Version January, 2018
Page 16
Nonroad Sources in the NONROAD Model. This sector contains mobile sources included
in the NONROAD model. Nonroad emissions result from the use of fuel in a diverse
collection of vehicles and equipment such as construction equipment, recreational vehicles,
and landscaping equipment.
Nonroad Rail/Commercial Marine Vessels. This sector includes internal combustion
engines used to propel commercial marine vessels (CMV) and locomotives when underway.
Railyards are not included in this subsector, rather they are included in the nonpoint sector.3
Onroad Sources. This sector contains mobile sources included in the MOVES model.
Onroad emissions result from the combustion and evaporation of fuel used by motorized
vehicles that are normally operated on public roadways, including passenger cars,
motorcycles, minivans, sport-utility vehicles, light-duty trucks, heavy-duty trucks, and buses.
Brake and tire wear are included. Roadway dust is not included with this category. Instead
roadway dust is included in nonpoint.
Fire Sources. This sector includes sources of pollution caused by the inadvertent or
intentional burning of biomass including forest and rangeland (e.g., grasses and shrubs).
There are two subsectors: Prescribed fires and Wild fires.
Biogenic Sources. This sector includes emissions from vegetation and soils computed via a
model that utilizes spatial information on vegetation and land use, and environmental
conditions of temperature and solar radiation.
Section 5 of this document relates each sector to the MARAMA Emission Modeling Framework
(EMF) dataset.
2.1. POINT SOURCES
S/L/T agencies are primarily responsible for developing the point source inventory for the
triannual NEI. S/L/T agencies obtain this data from the annual emissions statement reports
submitted by the owners of the source of air pollution. Individual S/L/T agencies compile and
quality assure the industry submittals, and maintain databases of both small and large air
emission sources. Furthermore, they maintain full documentation on point sources and emissions
located in their jurisdictions. Individual S/L/T agency staff and websites should be consulted for
detailed documentation on how each agency develops their point source emission inventories.
USEPA augments the S/L/T point source submissions to the NEI to ensure data completeness
and consistency across the national inventory. Augmentation occurred for PM2.5 and PM10
sources. This is more fully described in the USEPA NEI documentation (EPA, 2015a).
This section describes each point source sub-sector in the MARAMA GAMMA inventory.
3 Internal Combustion Engines Railroad Equipment Diesel Yard Locomotives (SCC 2285002010) is
included in the Nonroad Rail/CMV sector.

Technical Support Document for the 2011 Northeastern U.S. Emission Inventory with projections to 2020 and 2023 GAMMA Version January, 2018
Page 17
2.1.1. Point On-Shore Oil & Gas Production Facilities
Larger oil and gas production facilities, including pipeline compressor stations, are included in
the point source inventories. Emissions from these point source emissions units are subtracted
from emissions calculated using the nonpoint Oil and Gas tool to avoid double counting.
For the MARAMA GAMMA 2011 inventory EPA v6.3 ‘ek’ dataset was used. See the EPA
2011 Modeling Platform TSD (EPA, 2016a) for additional documentation of the on-shore oil and
gas production point source inventory.
2.1.2. Offshore Oil & Gas Drilling Platforms
EPA augments the point source sector by including point source offshore oil and gas drilling
platforms beyond U.S. state-county boundaries in the Gulf of Mexico. These sources are not in
the 15 Northeast states in this regional emission inventory. For the MARAMA 2011 GAMMA
inventory the EPA v6.3 ‘ek’ dataset was used.
2.1.3. Ethanol Production Facilities
EPA developed a list of corn ethanol facilities for 2011 as part of a rule making process. Many of
these ethanol facilities were included in the 2011NEIv2. EPA believes that these sources were
not included in the NEI point source sector because they did not meet the 100 ton/year potential-
to-emit threshold for NEI point sources. EPA added these sources to the 2011v6.2 platform.
While most of these additional corn ethanol facilities were located in the Midwestern states, two
were located in New York (Western New York Energy LLC and Sunoco Fulton Ethanol Plant).
For the MARAMA 2011 GAMMA inventory the EPA v6.3 ‘ek’ dataset was used. See the EPA
2011 Modeling Platform TSD (EPA, 2016a) for further documentation.
2.1.4. Gasoline Unloading and Refueling
S/L/T agencies submitted data for Bulk Gasoline Terminal and Gasoline Station facilities (Stage
1 gasoline distribution) which, for some facilities, EPA augmented to fill in PM species. Refer
to the 2011 NEIv2 TSD (EPA, 2015a) for further information. Note that Stage 2 refueling (e.g.,
transfer of gasoline into vehicle fuel tanks) is included in the onroad inventory since the
emissions are calculated using the MOVES model.
2.1.5. EGU, Small EGU and Other Point Sources Sub-Sectors
Where EPA uses IPM to estimate EGU emissions, the NE states prefer to use the ERTAC EGU
tool. Because there is not a one-to-one correspondence between the sources included in ERTAC
and IPM, MARAMA needed to combine the EPA point source sectors and re-partition them to
accommodate the ERTAC EGU dataset. The two EPA point source subsectors that were
reworked are 1) EGU-Point and 2) NonEGU-Point. These datasets were combined and then split
out into three subsectors as follows:
ERTAC Electric Generation Units (EGU)
Non-ERTAC IPM sources (this subsector is sometimes termed “Small EGUs”)
Other Point Sources
This partitioning occurred for all versions of the MARAMA 2011 inventories including
ALPHA2, BETA2 and now GAMMA. A cross-reference file for jurisdictions in the Northeast
regional emissions inventory was prepared to facilitate the split. The cross-reference matches
records in the ERTAC UAF (see Appendix B) with analogous records in the both the 2011 NEI
and EPA modeling platform. ORIS facility and boiler identifiers are used to match units across

Technical Support Document for the 2011 Northeastern U.S. Emission Inventory with projections to 2020 and 2023 GAMMA Version January, 2018
Page 18
the three data systems. Facility names and county assignments, as well as the magnitudes of the
SO2 and NOx emissions were checked to confirm preliminary matches. Note that the ERTAC
UAF input file flags units as either EGU or nonEGU. However, only units flagged as EGU in
the UAF input file are included in the ERTAC EGU forecasting tool projections. Units flagged
as nonEGU in the UAF are only included for informational purposes, and were not included in
the EGU modeling. S/L/T agencies reviewed and corrected the cross-reference. This cross-
reference file was further refined and extended to the continental United States by a coordinated
inter-regional and USEPA combined effort. The final cross-reference used to perform the split is
provided in Appendix A.
The “Other Point Source” file obtained from this process replaces the “Other Point Source” file
from the EPA modeling inventory. A series of quality assurance checks were done to remove
double counting or add back in missing sources. S/L/T feedback was used by MARAMA to
determine to which dataset each non-matching unit should be assigned as follows:
Double counted - elsewhere in the inventory, and MARAMA removed them from
consideration, or
Missing - added back to Non-ERTAC IPM or Other Point datasets.
Appendix CC indicates the assignments made by S/L/T. MARAMA then revised the datasets as
indicated by states.
2.1.5.1. Electric Generation Units (EGU)
This subsector includes boilers, combustion gas turbines, combined cycle units, and
reciprocating engines used to power an electrical generator that is connected to the electrical
grid. Only units that report data to the USEPA Clean Air Markets Division (CAMD) are
included in this subsector. The specific sources included in the EGU subsector are listed in the
Unit Availability File (UAF) contained in Appendix B to this document. Northeastern S/L/T
agencies use the ERTAC tool to estimate base and future year EGU emissions. These estimates
replace the estimates in the EPA modeling platform that are IPM-based forecasts. This is the
major difference between the MARAMA and USEPA developed inventories. Further detail on
the ERTAC EGU Tool is provided in Section 3.2 of this document.
2.1.5.2. Non-ERTAC IPM Sources (Small EGUs)
The Non-ERTAC IPM file contains sources included in EPA’s IPM modeling but not included in
either the ERTAC forecasting tool or Other Point Sources source sub-sector. Many sources in
this sector are small EGUs including those fueled by wood or landfill gas and municipal waste
combustors. In addition, the sub-sector includes some non-EGUs such as other combustion
units, some of which feed some power into the grid, located at smelters, paper mills, and
petroleum refineries that are included in the USEPA IPM files. This sub-sector was created so
that a direct comparison could be made between the IPM and ERTAC projections. This
subsector was termed the “Small EGUs” in the ALPHA2 inventory.
For the MARAMA 2011 GAMMA inventory the subsector includes sources selected from EPA
v6.2 ‘eh’ EGU sector.
2.1.5.3. Other Point Sources
This subsector includes the point sources that remain after the redistribution to the other point
subsectors described above. Sources in this subsector include industrial/commercial/institutional

Technical Support Document for the 2011 Northeastern U.S. Emission Inventory with projections to 2020 and 2023 GAMMA Version January, 2018
Page 19
boilers and engines; industrial processes such as cement manufacturing and petroleum refining;
surface coating facilities; organic liquids storage and transfer; and waste disposal facilities. The
inventory for these sources primarily uses data collected from the affected sources by the
applicable S/L/T agencies. However, this subsector is not completely analogous to the USEPA
NonEGU-Point subsector as a result of additional quality assurance checks undertaken by the
region in preparation for the GAMMA inventory.
EPA includes certain mobile sources located at airports and rail yards as point sources in its
NonEGU-point file in order to locate them geographically by latitude and longitude; the
GAMMA inventory includes these sources in the Other Point Sources file. Later sections of this
document describe the methodology for estimating emissions from airports and rail yards.
The MARAMA 2011 GAMMA uses the EPA 2011 v6.2 ‘eh’ ptnonipm dataset with some
elimination of double counting
2.2. NONPOINT SOURCES
Nonpoint sources are small stationary sources that individually do not emit significant amounts
of air pollution, but when aggregated can make an appreciable contribution to the emission
inventory. They are not included as point sources because the effort required to gather data and
estimate emissions for each individual source would be excessive. S/L/T agencies and EPA
combine emissions from these sources into broad categories, such as residential fuel combustion
or consumer solvent usage. Each of these broad groups of processes contains a number of more
specific subgroups that share similar emission processes and emission estimation methods. There
are literally hundreds of area source processes included in the nonpoint source inventory.
For the 2011 NEI, S/L/T agencies collaborated with EPA to develop best practices for estimating
nonpoint source emissions estimates. The collaboration, referred to as the ERTAC “Area Source
Comparability” project, facilitated agreement on emission estimation methodologies, data
source, emission factors, and SCCs for a number of important nonpoint sectors, allowing EPA to
prepare the emissions estimates for all states using the group’s final approaches. During the
2011 NEI inventory development cycle, S/L/T agencies could choose whether or not to accept
the ERTAC/EPA estimates to fulfill their nonpoint emissions reporting requirements. EPA
encouraged S/L/T agencies that did not use EPA’s estimates or tools to improve upon these
“default” methodologies and submit further improved data.
Nonpoint emissions are frequently estimated using detailed calculation tools that have been
developed for that purpose. EPA has provided the detailed activity data and emissions factors on
its Nonpoint Emissions Tools and Methods ftp site (EPA, 2015c).
As a starting point, the GAMMA Version of the Northeast regional emission inventory relies
upon EPA modeling platform v6.3 ‘ek’ or ‘en’ where there were updates. Detailed source
documentation of the base year nonpoint source inventory development included in the EPA v6.3
platform is provided in the 2011 NEIv2 TSD (EPA, 2015a). The NEI emissions were updated as
requested by states as part of development of the v6.3 platform. For the northeast states the
changes were minor.
The nonpoint inventory is sub-divided into several subsectors, as described in the following
subsections. Although EPA v6.3 modeling platform includes locomotives and commercial
marine vessels in the nonpoint inventory, in the GAMMA inventory these sources are considered

Technical Support Document for the 2011 Northeastern U.S. Emission Inventory with projections to 2020 and 2023 GAMMA Version January, 2018
Page 20
nonroad mobile sources that are described later in this document as part of the nonroad sector. In
addition, refinements were made by CT and NY for this GAMMA inventory. These refinements
are described in more detail below.
2.2.1. Fugitive Dust
The nonpoint source fugitive dust inventory contains unadjusted PM10 and PM2.5 emission
estimates for paved roads, unpaved roads and airstrips, construction (residential, industrial, road
and total), agriculture production, and mining and quarrying. The sector does not include fugitive
dust from grain elevators, coal handling at coal mines, or vehicular traffic on roads at industrial
facilities because these are treated as point sources so they are properly located.
The fugitive dust sector is separated from other nonpoint sectors to allow for the application of a
“transport fraction” and meteorological/precipitation reductions. Emission modelers apply these
adjustments to the unadjusted emissions with a script that applies land use-based gridded
transport fractions followed by another script that zeroes out emissions for days on which at least
0.01 inches of precipitation occurs or there is snow cover on the ground. The land use data used
to reduce the NEI emissions determines the amount of emissions that are subject to transport.
The purpose of applying the transport fraction and meteorological adjustments is to reduce the
overestimation of fugitive dust in the grid modeling as compared to ambient observations. Refer
to the 2011 NEIv2 TSD (EPA, 2015a) and the EPA 2011 Modeling Platform TSD (EPA, 2016a)
for further information.
The MARAMA 2011 GAMMA inventory uses the EPA 2011 v6.3 ‘ek’ dataset.
2.2.2. Agricultural Ammonia
The nonpoint source agricultural ammonia inventory contains NH3 emission estimates for
nonpoint SCCs identified by EPA staff. This sector includes fertilizer - any nitrogen-based
compound or mixture - that is applied to land to improve plant fitness. This category also
accounts for emissions from livestock waste from domesticated animals intentionally reared for
the production of food, fiber, or other goods or for the use of their labor. The livestock included
in the EPA–estimated emissions include beef cattle, dairy cattle, ducks, geese, goats, horses,
poultry, sheep, and swine. Refer to the 2011 NEIv2 TSD (EPA, 2015a) and the EPA 2011
Modeling Platform TSD (EPA, 2016a) for further information.
The MARAMA 2011 GAMMA inventory uses EPA 2011 v6.3 ‘ek’ dataset.
2.2.3. Nonpoint On-shore Oil and Gas Production
Onshore nonpoint oil and gas emissions were estimated using the USEPA Oil and Gas ACCESS
database tool. The tool is designed to estimate nonpoint emissions associated with the
exploration and drilling at oil and gas wells including the equipment used at the well sites to
extract the product and deliver it to a central collection point or processing facility. The types of
sources covered include drill rigs, workover rigs, artificial lift, hydraulic fracturing engines,
pneumatic pumps and other devices, storage tanks, flares, truck loading, compressor engines, and
dehydrators. EPA estimated emissions for all counties with 2011 oil and gas activity data with
the Oil and Gas Tool, and many S/L/T agencies also submitted nonpoint oil and gas data.
In some cases states replaced the tool estimates with their own state estimates. In the 15 state
region covered by this TSD Pennsylvania used its own state estimates. These state-specific
estimates were also provided to USEPA for the 2011 NEI. Pennsylvania replaced most tool
emissions with source-reported data.

Technical Support Document for the 2011 Northeastern U.S. Emission Inventory with projections to 2020 and 2023 GAMMA Version January, 2018
Page 21
For more information on the development of the oil and gas emissions in the GAMMA inventory
see the 2011 NEIv2 TSD (EPA, 2015a) and the EPA 2011 Modeling Platform TSD (EPA,
2016a).
The MARAMA 2011 GAMMA inventory uses the EPA 2011 v6.3 ‘ek’ dataset, which included a
correction to West Virginia SO2 emissions for SCC 2310121700 (On-Shore Gas Exploration/
Gas Well Completion: All Processes).
2.2.4. Portable Fuel Containers (PFC)
EPA developed emission estimates for portable fuel containers using the ERTAC “Area Source
Comparability” methodology. The EPA/ERTAC methodology accounts for state control
programs enacted prior to the Federal rule adoption in 2007. EPA extracted the portable fuel
container segment of the nonpoint inventory into a separate file because of their methodology for
projecting emissions. For more information on the development see the 2011 NEIv2 TSD (EPA,
2015a).
The MARAMA 2011 GAMMA inventory uses the EPA 2011 v6.3 ‘ek’ dataset.
2.2.5. Gasoline Unloading and Refueling
EPA developed emission estimates for gasoline service station Stage 1 fuel transfers (e.g.,
transferring fuel from tanker trucks into underground storage tanks) and underground storage
tank breathing evaporative losses using the ERTAC “Area Source Comparability” methodology.
EPA extracted the Stage 1 and underground tank breathing segment of the nonpoint inventory
into a separate file to facilitate review of this segment of the inventory by S/L/T agencies. Refer
to the 2011 NEIv2 TSD (EPA, 2015a) for further information. Note that Stage 2 refueling (e.g.,
transfer of gasoline into the vehicles’ fuel tank) is included in the onroad inventory since the
emissions are calculated using the MOVES model.
The MARAMA 2011 GAMMA inventory uses the EPA 2011 v6.3 ‘ek’dataset.
2.2.6. Residential Wood Combustion
The residential wood combustion sector includes residential wood burning devices such as
fireplaces, fireplaces with inserts (inserts), free standing woodstoves, pellet stoves, outdoor
hydronic heaters (also known as outdoor wood boilers), indoor furnaces, and outdoor burning in
firepots and chimeneas. Free-standing woodstoves and inserts are further differentiated into three
categories: conventional (not EPA certified); EPA certified, catalytic; and EPA certified,
noncatalytic. Generally speaking, the conventional units were constructed prior to 1988. Units
constructed after 1988 had to meet EPA emission standards and they are either catalytic or non-
catalytic. EPA has developed a tool for calculating residential wood combustion emissions. For
more information on the development of the residential wood combustion emissions, see the
2011 NEIv2 TSD (EPA, 2015a) and the EPA 2011 Modeling Platform TSD (EPA, 2016a).
The MARAMA 2011 GAMMA inventory uses the EPA 2011 v6.3 ‘ek’ dataset.
2.2.7. Agricultural Burning
Most of the S/L/T agencies in the Northeast relied upon EPA’s methodology for calculating
emissions from agricultural burning activities. The EPA method relies mainly on satellite-based
methods to develop the burned area and then uses an assigned crop type to estimate final
emissions.
The MARAMA 2011 GAMMA inventory uses the EPA 2011 v6.3 ‘ek’dataset.

Technical Support Document for the 2011 Northeastern U.S. Emission Inventory with projections to 2020 and 2023 GAMMA Version January, 2018
Page 22
2.2.8. Other Nonpoint Sources
This sector includes all stationary nonpoint sources that were not subdivided into the nonpoint
sub-sectors discussed above. Locomotives and commercial marine vessel (CMV) mobile sources
included in the 2011NEIv2 nonpoint inventory were moved out of the EPA nonpoint sector and
put into their own files for the BETA and GAMMA inventories as described later in this
document. There are hundreds of individual processes in this category that are grouped into the
following categories:
Industrial and commercial fuel combustion not included in the point source sector
Residential fuel combustion other than wood combustion;
Chemical manufacturing not included in the point source sector
Industrial processes not included in the point source sector, such as commercial cooking,
metal production, mineral processes, petroleum refining, wood products, fabricated metals,
and refrigeration
Solvent utilization for surface coatings such as architectural coatings, industrial maintenance,
autobody refinishing, traffic marking, textile production, furniture finishing, and coating of
paper, plastic, metal, appliances, and new motor vehicles.
Solvent utilization for degreasing of parts and equipment used in manufacturing processes
such as for furniture, metals, auto repair and electronics.
Solvent utilization for dry cleaning, graphic arts, plastics, industrial processes
Solvent utilization for consumer products such as personal care products, household
products, adhesives and sealants
Solvent utilization for asphalt application and roofing, industrial and commercial adhesive
and sealants and pesticide application
Waste disposal, treatment, and recovery via incineration, open burning, landfills, and
composting
Miscellaneous area sources such as cremation, hospitals, lamp breakage, and automotive
repair shops
Refer to the 2011 NEIv2 TSD (EPA, 2015a) and the EPA 2011 Modeling Platform TSD (EPA,
2016a) for further information.
The MARAMA 2011 GAMMA inventory uses the EPA 2011 v6.3 ‘en’ with the updates listed in
Section 2.2.8.1.
2.2.8.1. State refinements to the nonpoint inventory
New York provided refinements to the nonpoint inventory using their preferred emission factors.
New York performed the calculations and submitted replacement emissions for the county record
for each of the following SCCs and pollutants.
Industrial wood combustion (SCC: 2102008000) - PM10
Commercial combustion - distillate-fired boilers (SCC: 2103004001) - PM10
Commercial combustion - distillate-fired engines (SCC: 2103004002) - PM10
Commercial combustion – natural gas (SCC: 2103006000) - PM10 and VOC
Residential combustion – distillate (SCC: 2104004000) PM10 and PM2.5

Technical Support Document for the 2011 Northeastern U.S. Emission Inventory with projections to 2020 and 2023 GAMMA Version January, 2018
Page 23
Residential combustion – natural gas (SCC: 2104006010) PM10 and VOC
Residential combustion – (SCC: 2104007000) PM10 and PM2.5
Of these New York corrections, EPA v6.3 included VOC changes in their ‘en’ update, but not
corrections to other pollutants. All corrections are in the MARAMA GAMMA inventory.
Connecticut provided refinements to the nonpoint inventory. Connecticut performed the
calculations and submitted replacement emissions for the county record for each of the following
SCC and pollutant.
Fuel combustion – industrial boilers, ICEs – distillate oil (SCC: 2102004001) – SO2
Fuel combustion – commercial/institutional – distillate oil (SCC: 2103004001) – SO2
Fuel combustion – industrial boilers, ICEs – residual oil (SCC: 2102005000) – SO2
Fuel combustion – commercial/institutional – residual oil (SCC: 2103005000) – SO2
Of the Connecticut corrections all were included in the EPA v6.3 platform as updated.
Massachusetts submitted replacement VOC emissions for the Gas Bulk Plants/Terminals SCC
2501055120 to EPA through the 2015 NODA. EPA included the revised emissions in its 2011
v6.3 platform as updated and MARAMA included the revised emissions in the 2011 GAMMA
inventory.
2.3. AIRCRAFT, LOCOMOTIVES, AND COMMERCIAL MARINE VESSELS
(MARINE/AIR/RAIL – MAR)
Marine, Air and Rail sources are considered to be mobile sources but they are not calculated by
either the MOVES or the NONROAD model. MAR emissions have been evolving in recent
inventory cycles. In previous inventories (2002 and 2007), the Northeastern S/L/T agencies
grouped emissions from aircraft, locomotives and commercial marine vessels as a nonpoint sub-
sector called Marine/Air/Rail or MAR. States estimated emissions by county and distributed
them spatially by SMOKE similarly as nonpoint sources. However, for the 2011NEI, new data
sources and tools were developed to estimate these sources, resulting in different handling of
each in the SMOKE emissions processor. Consequently, these sources are now broken out
separately, with the aircraft and rail yard inventories a part of the non-EGU point source
inventory, and locomotives and commercial marine vessels each in separate nonpoint subgroups.
The emissions estimate from these sources for northeast states stabilized in the USEPA ‘eh’
inventory and emissions from the ‘eh’ dataset are used in both the MARAMA GAMMA and
USEPA v2.3 inventories.4 See the 2011 NEIv2 TSD (EPA, 2015a) and the EPA 2011 Modeling
4 Emissions from these sources did not change between ’eh’ and ‘ek’, but the files did as C1C2 marine and
Rail were in one file in the ‘eh’ inventory and in separate files in the ‘ek’ inventory. There were some
changes between ‘eh’ and ‘ek’ for California, however this does not affect the northeast states modeling
domain.

Technical Support Document for the 2011 Northeastern U.S. Emission Inventory with projections to 2020 and 2023 GAMMA Version January, 2018
Page 24
Platform TSD and EPA 2011 Modeling Platform TSD Updates (EPA, 2016a and EPA, 2016b)
for further information on how MAR emissions were calculated.
The following sections describe how emissions for these sources were estimated and the
inventory files in which they are located for the MARAMA GAMMA inventory.
2.3.1. Aircraft and Related Equipment
This sector includes sources calculated by the FAA’s Emissions and Dispersion Modeling
System (EDMS, Version 5.1) model. These sources include exhaust emissions from aircraft by
type, auxiliary power units (APUs) and ground support equipment (GSE) located at U.S.
airports, including seaplane ports and heliports. This sector does not include other emissions
from jet fuel storage or aircraft refueling or fuel combustion for airport heating or solvent use for
aircraft maintenance. These other sources are included in the point source inventory.
EDMS inputs include actual airport LTO activity data and aircraft engine emission factors from
the International Civil Aviation Organization (ICAO) Engine Exhaust Emissions Data Bank.
Emissions estimates are associated with aircrafts’ landing and takeoff (LTO) cycle which begins
when the aircraft approaches the airport on its descent from cruising altitude, lands, taxis to the
gate, and idles during passenger deplaning. It continues as the aircraft idles during passenger
boarding, taxis back out onto the runway for subsequent takeoff, and ascent (climb out) to
cruising altitude. The five specific operating modes in an LTO are (1) Approach, (2) Taxi/idle-in,
(3) Taxi/idle-out, (4) Takeoff, and (5) Climbout.
These sources are located at specific airport facilities and are characterized as point sources
because they are geographically located by latitude/longitude. In earlier inventories, aircraft
emissions were calculated at the county level instead of the airport level.
Aircraft activity was based on fuel combustion data collected for four types of aircraft:
Commercial aircraft tend to be larger aircraft powered with jet engines and are used for
transporting passengers, freight, or both.
Air Taxi aircraft carry passengers, freight, or both, but usually are smaller aircraft and
operate on a more limited basis than the commercial aircraft; aircraft in this category are
further sub-categorized as is turbine- or piston-driven, which allows the emissions estimation
model to assign the fuel used, jet fuel or aviation gas, respectively; also, activity data is
determined by the fraction of turbine- and piston-driven aircraft.
General Aviation aircraft includes most other aircraft used for recreational flying and
personal transportation aircraft in this category are further sub-categorized as is turbine- or
piston-driven, which allows the emissions estimation model to assign the fuel used, jet fuel or
aviation gas, respectively; also, activity data is determined by the fraction of turbine- and
piston-driven aircraft.
Military aircraft are associated with military installations, but they sometimes have activity at
non-military airports.
EDMS keys off of aircraft activity to estimate emissions from equipment typically found at
airports, including Aircraft Auxiliary power units (APU) and ground support equipment (GSE).
Ground support equipment included aircraft refueling and towing vehicles, baggage handling
equipment and vehicles, and passenger buses.

Technical Support Document for the 2011 Northeastern U.S. Emission Inventory with projections to 2020 and 2023 GAMMA Version January, 2018
Page 25
As part of the NEI development process, S/L/T agencies had the opportunity to provide locally
specific activity data and emissions. Where provided, S/L/T data was preferred over the national
defaults in calculations using the Federal Aviation Administration’s Emissions and Dispersion
Modeling System.
For the MARAMA 2011 GAMMA inventory EPA 2011 v6.2 (‘eh’) was used.
2.3.2. Locomotives and Rail Yards
The locomotive sector includes railroad locomotives powered by diesel-electric engines. A
diesel-electric locomotive uses 2-stroke or 4-stroke diesel engines and an alternator or a
generator to produce the electricity required to power its traction motors. The locomotive source
category is sub-divided into sub-categories based on railroad revenues and type of service:
Class I line haul locomotives carry freight long distances and are operated by national
railroad companies with large carrier operating revenues. There were seven Class I freight
operators in 2008.
Class II/III line haul locomotives are operated by companies with smaller revenues. Class II
railroads operate on a regional basis. Class III railroads are typically local short-line railroads
serving a small number of towns and industries. In 2008, there were about 12 Class II and
530 Class III Railroads.
Passenger railroads operated by AMTRAK providing intercity passenger train service in
the United States.
Commuter railroads operate locomotives that provide a passenger rail transport service that
primarily operates between a city center and the middle to outer suburbs.
Rail yards include switcher locomotives engaged in splitting and joining rail cars.
Class I and II - The 2011 NEI rail inventory was based on the methodology and emissions
developed for the 2008 NEI by the ERTAC Rail Subcommittee that (1) standardized S/L/T
agencies’ inventory development methods, (2) improved the quality of data received and the
resulting emission inventories, and (3) reduced the administrative burden on railroad companies
of providing data. For the 2011 NEIv2, EPA developed 2011 national rail estimates by applying
growth factors to the 2008 NEI values based on railroad freight traffic data from the 2008 and
2011 submitted by all Class I rail lines to the Surface Transportation Board and employment
statistics from the American Short Lines and Regional Railroad Association for class II and III.
Rail yards - EPA identified 95 rail yard locations in the Northeastern region for inclusion in the
point source inventory using a database from the Federal Railroad Administration. EPA
estimated CAP emissions using yard-specific emission factors and on national fuel values
allocated to rail yards using an approximation of line haul activity within the yard. EPA allocated
the emissions to line haul shape IDs and yard locations based on 2008 allocations. Emissions
from specific rail yards are included in the point source inventory; all other emissions from
locomotives are stored in the nonpoint inventory. EPA allocated the nonpoint emissions to line
haul shape IDs and yard locations based on 2008 allocations.
Class III and Commuter railroads – Emissions for these sources were only included if states
provided them.
For the MARAMA 2011 GAMMA inventory EPA 2011 v6.3 ‘ek’ was used.

Technical Support Document for the 2011 Northeastern U.S. Emission Inventory with projections to 2020 and 2023 GAMMA Version January, 2018
Page 26
2.3.3. Commercial Marine Vessels
The commercial marine vessel (CMV) sector includes boats and ships powered by diesel engines
that are used in the conduct of commerce or military activity. The CMV source category does not
include recreational marine vessels, which are generally less than 100 feet in length, most being
less than 30 feet. Recreational marine vessel emissions are calculated by the NONROAD model
and are accounted for there.
The CMV inventory is divided into sub-sectors as follows:
Category 1 and 2 (C1/C2) marine diesel engines typically range in size from about 700 to
11,000 horsepower (hp). These engines are used to provide propulsion power on many kinds
of vessels including tugboats, pushboats, supply vessels, fishing vessels, and other
commercial vessels in and around ports. C1/C2 vessels typically use distillate fuels and
emission estimates reflect reductions consistent with the 2011 Locomotive and Marine
federal rule making. Northeast states typically develop their own estimates of C1/C2
emissions that then replace the EPA national top down estimates.
Category 3 (C3) marine engines includes vessels with engines having displacement above
30 liters per cylinder that typically use residual oil as fuel. The C3 marine inventory consists
of two datasets.
o Near shore - The near shore emissions, such as occur in coastal waterways like the
Chesapeake Bay or Long Island Sound, are treated as area sources.5 Geographically,
the near shore inventories include port and inter-port emissions that occur within the
area that extends 200 nautical miles (nm) from the official U.S. shoreline, which is
roughly equivalent to the border of the U.S. Exclusive Economic Zone. EPA
allocates the portion of the CMV emissions that are estimated to occur within 3 miles
of the shore to individual counties. These near-shore emissions are treated as area
sources. EPA allocates these emissions to individual GIS polygons using methods
that vary by operating mode (i.e., in-port hotelling, maneuvering, reduced speed zone,
and underway). For example, port emissions appear only in port polygons, federal
water emissions in federal waters. Northeast states typically develop their own
estimates of near-shore CMV emissions that then replace the EPA national top down
estimates.
o Shipping Lanes - EPA prepared a detailed estimate of C3 emissions in shipping
lanes for the 2008 inventory. EPA estimated 2011 C3 shipping emissions by
applying regional adjustment factors to the 2008 emission estimates to account for
growth and control, including adjustments which accounted for NOx reductions due
to implementation of the NOx Tier 1 standard. The shipping lane emissions are
treated as point sources with emissions equally distributed to pseudo-stacks
positioned along the shipping lanes modelled to mimic ship boiler stacks.
5 Near shore C3 emissions are in the point source sector in the EPA's 2011 v6.3 'en' platform. Emissions
totals are unchanged; treating the emissions as point sources allows for different treatment in SMOKE
processing.

Technical Support Document for the 2011 Northeastern U.S. Emission Inventory with projections to 2020 and 2023 GAMMA Version January, 2018
Page 27
See the 2011 NEIv2 TSD (EPA, 2015a), the EPA 2011 Modeling Platform TSD (EPA, 2016a),
and the EPA 2011 Modeling Platform TSD Updates (EPA, 2016b) for further information on
how CMV emissions were calculated and geographically allocated.
The MARAMA 2011 GAMMA inventory uses EPA 2011 v6.3 ‘ek’ or ‘el’ where updated.
2.4. NONROAD EQUIPMENT
This sector includes non-highway vehicles, equipment and emissions processes that are
estimated by EPA’s NONROAD model including a diverse collection of equipment such as:
Recreational
Construction
Industrial and Commercial
Logging
Underground Mining
Pleasure Craft (excludes commercial marine vessels)
Railroad Equipment (excludes locomotives).
NONROAD estimates emissions from these sources for four fuel types: gasoline, diesel,
compressed natural gas, and liquefied petroleum gas.
The NONROAD model is embedded in EPA’s MOVES model and allows EPA to produce
nonroad mobile emissions in a consistent and automated way for the entire country. The primary
input to the NONROAD model is the National County Database (NCD), which contains all the
county-specific information needed to run NONROAD. EPA initially populates the NCD with
default inputs and distributes the NCD to S/L/T agencies who either:
Update the NCD data to create emissions estimates that accurately reflect local conditions
and equipment usage.
Accept the EPA NCD defaults and NONROAD modeling results; or
Executed the NONROAD model on their own and provided NONROAD results to EPA to
replace the EPA-generated NONROAD model results.
The nonroad emissions for MARAMA GAMMA 2011 include updates to the 2011 NEIv2 input
file provided by Delaware. See the 2011 NEIv2 TSD (EPA, 2015a) and the EPA 2011 Modeling
Platform TSD (EPA, 2016a) for further information regarding the S/L/T agency inputs to the
NONROAD model and other information on how EPA executed the NONROAD model.
For the MARAMA 2011 GAMMA inventory EPA 2011v6.3 (‘ek’) platform NONROAD Model
was used.
2.5. ONROAD VEHICLES
The onroad mobile source sector includes emissions from gasoline and diesel vehicles that
normally operate on public roadways. This includes passenger cars, motorcycles, minivans,
sport-utility vehicles, light-duty trucks, heavy-duty trucks, and buses. EPA also included Stage 2
vapor recovery gasoline refueling emissions, which have historically been treated as area source

Technical Support Document for the 2011 Northeastern U.S. Emission Inventory with projections to 2020 and 2023 GAMMA Version January, 2018
Page 28
emissions, in their onroad sector. Stage 2 emissions are also in the onroad sector of the
GAMMA inventory.
EPA generated emissions using the EPA highway emissions model, MOVES2014a. The primary
input to the MOVES model is the MOVES County Database (CDB), which contains county-
specific information, such as vehicle miles travelled, vehicle type and age distributions, fuel
types, emission inspection and maintenance programs, among other parameters. EPA initially
populates the CDB with default inputs and distributes the CDB to S/L/T agencies who update the
data in the CDB to reflect local conditions. Most of the Northeastern S/L/T agencies submitted a
subset of state specific CDB inputs (for example, only data related to inspection/maintenance
programs, or population data for a subset of source types); EPA used national defaults as CDB
data not provided by states.
EPA used the county-specific inputs and tools that integrated the MOVES model with the
SMOKE emission inventory model to take advantage of the gridded hourly temperature
information available from meteorology modeling used for air quality modeling. This “SMOKE-
MOVES” tool requires emission rate “lookup” tables generated by MOVES that differentiate
emissions by process (running, start, vapor venting, etc.), vehicle type, road type, temperature,
speed, hour of day, etc. EPA used an automated process to run MOVES to produce emission
factors by temperature and speed for “representative counties” to which every other county could
be mapped. SMOKE selects appropriate emissions rates for each county, hourly temperature,
SCC, and speed bin and multiplied the emission rate by activity (VMT or vehicle population) to
produce emissions from the lookup tables. SMOKE-MOVES performed these calculations for
every county, grid cell, and hour in the continental U.S.
The MARAMA 2011 GAMMA inventory uses the 2011v6.3 ‘el’ platform CBO6 mobile
emissions. The key differences that pertain to the Northeastern states between the 2011v6.3 ‘el’
platform and the 2011v6.2 ‘eh’ and ‘ek’ platform inventories are:
A newer version of MOVES (MOVES2014a dated 12/01/2015) was used. (This change
occurred between ‘eh’ and ‘ek’)
Updates were made to activity data in the County Databases (CDB) in Colorado, Ohio and
New Jersey (18 counties) (This change occurred between ‘eh’ and ‘ek’)
Changed percentage of E-85 in the activity data used to compute EPA-default emissions to
reflect actual usage of E-85 fuel. (This change occurred between ‘ek’ and ‘el’)
See EPA 2011 Modeling Platform TSD (EPA, 2016a and EPA, 2016b) for further details on how
onroad emissions were calculated and geographically allocated.
2.6. FIRES
Fire sources in this section are sources of pollution caused by the inadvertent or intentional
burning of biomass including forest and rangeland (e.g., grasses and shrubs). This sector is
specifically categorized into two sub-sectors: wildfires and prescribed burning. Other types of
fires, such as residential wood combustion, yard waste/refuse burning, and agricultural field
burning are included in the nonpoint sector.
EPA uses the SMARTFIRE2 system together with local activity data (acres burned, types of
fuels, fuel consumption values, etc.) to make emission estimates for both wild and prescribed

Technical Support Document for the 2011 Northeastern U.S. Emission Inventory with projections to 2020 and 2023 GAMMA Version January, 2018
Page 29
fires. All S/L/T agencies in the Northeast relied upon EPA’s SMARTFIRE methodology for
estimating emissions for wild and prescribed fires.
EPA has not revised fire emissions since its v6.2 (‘eh’) platform, but the wild and prescribed
emissions that were in separate files in the ‘eh’ platform are combined into a single file in EPA’s
v6.3 ‘ek’ platform. The GAMMA inventory includes the separate wild and prescribed fire files
as is from the ‘eh’ platform, with the exception of two North Carolina wildfires that were
excluded at North Carolina’s request from the GAMMA inventory.
See the 2011 NEIv2 TSD (EPA, 2015a) and EPA 2011 Modeling Platform TSD (EPA, 2016a)
for further information on how emissions were calculated and geographically allocated.
For the MARAMA 2011 GAMMA inventory EPA 2011v6.3 ‘eh’ was used.
2.7. BIOGENIC SOURCES
Biogenic emissions come from natural sources. They must be accounted for in photochemical
grid models, as most types are widespread and ubiquitous contributors to background air
chemistry. Biogenic emissions from vegetation and soils are computed using a model that
utilizes spatial information on vegetation, land use and environmental conditions of temperature
and solar radiation. The model inputs are horizontally allocated (gridded) data, and the outputs
are gridded emissions that can be speciated and utilized as input to photochemical grid models.
See the 2011 NEIv2 TSD (EPA, 2015a) and EPA 2011 Modeling Platform TSD (EPA, 2016a)
for further details on how emissions were calculated.
The MARAMA GAMMA inventory uses EPA's v6.3 2011 ('ek') BEIS 3.61/BELD4 biogenic
emission datasets.

Technical Support Document for the 2011 Northeastern U.S. Emission Inventory with projections to 2020 and 2023 GAMMA Version January, 2018
Page 30
3. FUTURE YEAR INVENTORY DEVELOPMENT
3.1. Overview of Inventory Projection Methodology
Projection of emissions to future years is key to air quality technical and policy support work.
MARAMA in consultation with Northeastern S/L/T agencies has developed state specific
growth/control/shutdown factors used to project emissions.
Growth reflects change in source activity as a result of wider societal changes. In some cases
“growth” is positive, resulting in increased future emissions. In others, “growth” is negative,
resulting in a reduction in future emissions. MARAMA consults with S/L/T agencies, ERTAC,
and EPA to prepare emission projections reflecting anticipated changes in future activities such
as energy use, employment, population growth, VMT and new air pollution control measures.
The grown emissions are adjusted to reflect unit shutdowns, installation of control devices and
other changes to source emissions. Where emissions from shutdowns are preserved as offsets for
future growth some states have elected to move these emissions to offset files, rather than
removing them from the inventory. Emissions are further adjusted to reflect both federal and
state rule impact on emissions.
Two future years, 2020 and 2023, have been projected from the 2011 GAMMA inventory. The
future year projection methodologies vary by inventory sector and projection year. 2020 and
2023 projections were prepared differently as different technical products were available for the
work.
For the MARAMA GAMMA 2023 projection, the EPA prepared 2023 inventory was relied on
where applicable. Therefore, in the case of onroad and nonroad emissions estimates, year
specific emissions have been estimated for 2023.
For 2020, no EPA projection was available. Therefore for sectors such as onroad and nonroad
emissions were estimated based on an interpolation between two projections where emissions
were available. Figure 3 provides an overview of the emission projection methodology used for
each projection year and source sector.
Figure 3: Overview of Emission Projection Methodology for Each Source Sector
MARAMA Sector Emission Projection Methodology
ERTAC EGUs (Section 3.2)
2020 and 2023 - For all states in the modeling domain. Uses ERTAC EGU Forecasting Tool:
Uses 2011 hourly emissions as the starting point
Applies regional projections of electric generation growth using Annual Energy Outlook 2016 and North American Reliability Council growth rates
Accounts for known future shutdowns, new units, emission controls, and fuel switches
To meet annual CSAPR cap, emission factors were applied to units equipped with SCR and SNCR to reflect reductions achievable using those technologies.
Ensures available capacity is matched to projected demand
Ensures unit capacity is never exceeded
Uses base year activity as the profile for future activity
Calculates hourly future year emissions for each unit
Other Point Sources (Section 3.6)
2020 and 2023 - For the 15 northeastern states. Applies MARAMA-developed projection and control factors within the Emission Modeling Framework tool:
Uses 2011 v6.3 annual emissions as the starting point

Technical Support Document for the 2011 Northeastern U.S. Emission Inventory with projections to 2020 and 2023 GAMMA Version January, 2018
Page 31
MARAMA Sector Emission Projection Methodology
Nonpoint Sources (Section 3.7) Other Nonroad Sources (Section 3.8)
Applies national, regional, or local projections of surrogate activity parameters (fuel use, employment, population, etc.)
Accounts for emission reductions o National rules o OTC model rules implemented by the States o Consent decrees and settlements o Other State-specific emission control programs
Calculates annual future year emissions
EPA used MARAMA-developed projection and control factors for the northeast states in projecting its 2023 ‘el’ platform. The GAMMA inventory uses these files and the 'en' updates where applicable.
2020 - For other states interpolated emissions or applied interpolated EPA v6.3 growth and control factors. 2023 – For other states used EPA 2023 v6.3 datasets
Nonroad – NONROAD Model (Section 3.9)
2020 - For all states in the modeling domain. Interpolates between EPA v6.3 2017 ‘ek’ and 2023 ‘el’ emissions
2023 - For all states in the modeling domain. Uses EPA’s NONROAD model:
Uses USEPA v6.3 ‘el’ files for 2023
Accounts for increases in activity (based on NONROAD model default growth estimates of future-year equipment population)
Accounts for changes in fuels and engines that reflect implementation of national regulations that impact each year differently due to engine turnover
Accounts for local control programs and other parameters
Calculates monthly exhaust, evaporative and refueling emissions by county
Onroad – MOVES Model (Section 3.10)
2020 - For all states in the modeling domain. Interpolates between EPA v6.3 2017 ‘ek’ and 2023 ‘el’emissions
2023 - For all states in the modeling domain. Uses EPA’s Rate Mode MOVES and SMOKE-MOVES model:
Uses 2014a MOVES CB06 chemistry emission factors developed by USEPA in Spring 2016
Activity data was updated to include corrections to 15 New Jersey counties
Accounts for increases in vehicle miles travelled as projected by USEPA v6.2 ‘eh’
Accounts for changes in fuels and engines that reflect implementation of national regulations that impact each year differently due to engine turnover and fuel requirements
Calculates hourly exhaust, evaporative and refueling emissions by grid cell
Fire Events (Section 3.11)
2020 and 2023 - For all states in the modeling domain. Uses EPA 2011 v6.3 2011 ‘eh’ for base and future projections (e.g., assumes no change from the base year). Two wildfires that occurred in NC were removed.
Biogenic (Section 3.11)
2020 and 2023 - For all states in the modeling domain. Uses EPA 2011 v6.3 2011 ‘ek’ BEIS v3.6.1 inventory for base and future projections (e.g., assumes no change from the base year)
As part of the development of the 2011 inventory and projections, S/L/T agencies, in
consultation with ERTAC and MARAMA, developed two new and innovative emission
projection methodologies and tools. The first is the ERTAC EGU Forecasting Tool. The second
is the Emissions Modeling Framework (EMF) and a set of spreadsheet tools for development of
growth and control factors used within the EMF to project emissions for most source sectors.
MARAMA uses the ERTAC EGU Forecasting Tool (ERTAC, 2017) to project electricity
generation and emissions from EGUs. Development of the Tool was a collaborative effort among
the Northeastern, Mid-Atlantic, Southeastern, and Lake Michigan area states; other member
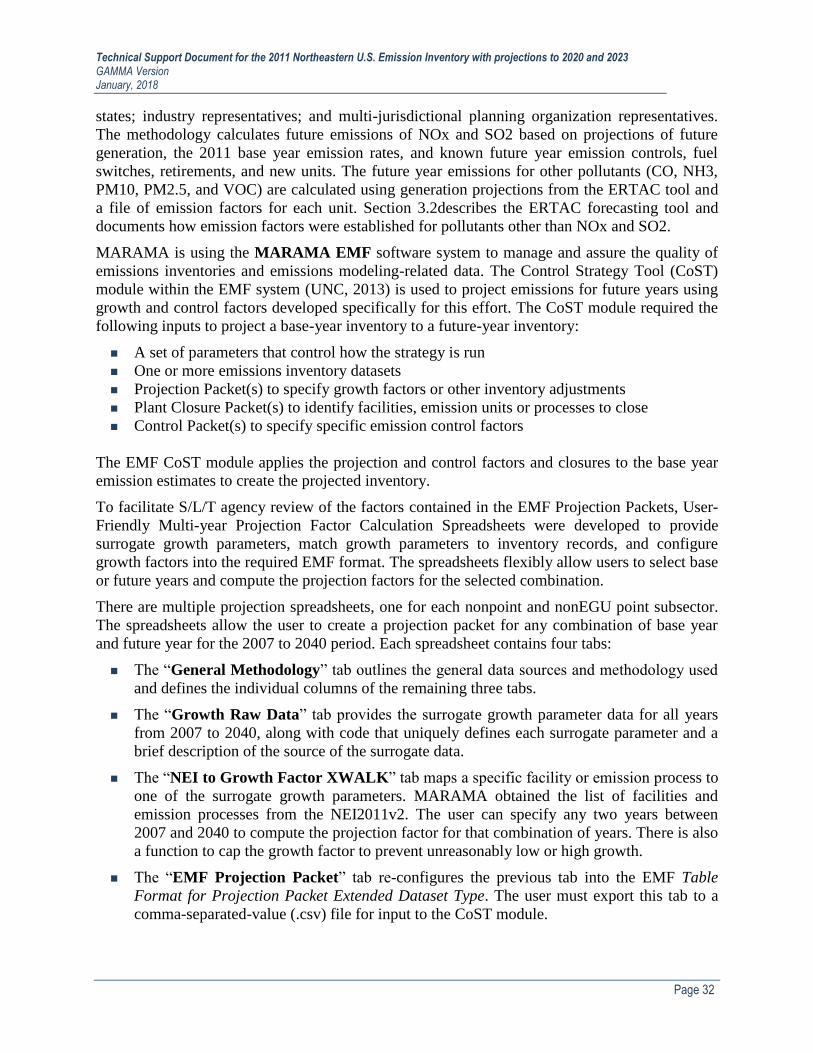
Technical Support Document for the 2011 Northeastern U.S. Emission Inventory with projections to 2020 and 2023 GAMMA Version January, 2018
Page 32
states; industry representatives; and multi-jurisdictional planning organization representatives.
The methodology calculates future emissions of NOx and SO2 based on projections of future
generation, the 2011 base year emission rates, and known future year emission controls, fuel
switches, retirements, and new units. The future year emissions for other pollutants (CO, NH3,
PM10, PM2.5, and VOC) are calculated using generation projections from the ERTAC tool and
a file of emission factors for each unit. Section 3.2describes the ERTAC forecasting tool and
documents how emission factors were established for pollutants other than NOx and SO2.
MARAMA is using the MARAMA EMF software system to manage and assure the quality of
emissions inventories and emissions modeling-related data. The Control Strategy Tool (CoST)
module within the EMF system (UNC, 2013) is used to project emissions for future years using
growth and control factors developed specifically for this effort. The CoST module required the
following inputs to project a base-year inventory to a future-year inventory:
A set of parameters that control how the strategy is run
One or more emissions inventory datasets
Projection Packet(s) to specify growth factors or other inventory adjustments
Plant Closure Packet(s) to identify facilities, emission units or processes to close
Control Packet(s) to specify specific emission control factors
The EMF CoST module applies the projection and control factors and closures to the base year
emission estimates to create the projected inventory.
To facilitate S/L/T agency review of the factors contained in the EMF Projection Packets, User-
Friendly Multi-year Projection Factor Calculation Spreadsheets were developed to provide
surrogate growth parameters, match growth parameters to inventory records, and configure
growth factors into the required EMF format. The spreadsheets flexibly allow users to select base
or future years and compute the projection factors for the selected combination.
There are multiple projection spreadsheets, one for each nonpoint and nonEGU point subsector.
The spreadsheets allow the user to create a projection packet for any combination of base year
and future year for the 2007 to 2040 period. Each spreadsheet contains four tabs:
The “General Methodology” tab outlines the general data sources and methodology used
and defines the individual columns of the remaining three tabs.
The “Growth Raw Data” tab provides the surrogate growth parameter data for all years
from 2007 to 2040, along with code that uniquely defines each surrogate parameter and a
brief description of the source of the surrogate data.
The “NEI to Growth Factor XWALK” tab maps a specific facility or emission process to
one of the surrogate growth parameters. MARAMA obtained the list of facilities and
emission processes from the NEI2011v2. The user can specify any two years between
2007 and 2040 to compute the projection factor for that combination of years. There is also
a function to cap the growth factor to prevent unreasonably low or high growth.
The “EMF Projection Packet” tab re-configures the previous tab into the EMF Table
Format for Projection Packet Extended Dataset Type. The user must export this tab to a
comma-separated-value (.csv) file for input to the CoST module.

Technical Support Document for the 2011 Northeastern U.S. Emission Inventory with projections to 2020 and 2023 GAMMA Version January, 2018
Page 33
Sections 3.3.1 provides a detailed discussion of the surrogate parameters used to project
emissions for the non-EGU point, nonpoint, and marine/air/rail nonroad sectors.
In addition to the EMF Projection packets created from the projection spreadsheets, MARAMA
also assembled EMF Closure and Control packets. The Closure packet identifies facilities
and/or emission processes scheduled to close sometime after 2011. The packet also includes the
date of the closure. Except where a state elected to retain a source's closure emissions for offsets,
emissions from closed facilities and/or emission processes are set to zero after the effective date
of the closure. A detailed discussion of closure packets and offset files is provided in Section 3.4.
Control packets include the effect on emissions of a variety of national, regional, and state rules,
regulations, consent decrees and settlements obtained from the EPA control packets as well
controls and rules specific to the 15 states covered by this inventory. States reviewed and revised
the EPA control packets as necessary. Section 3.3.3 provides a detailed discussion of the
modifications made to the EPA federal measures control packets rules.
In addition to the EPA control factors, MARAMA developed control factors to account for state
implementation of OTC and MANE-VU emission control recommendations as well as for state-
specific rules. Section 3.3.4 provides a detailed discussion of the OTC, MANE-VU and state-
specific rules.
3.2. ERTAC EGU Emissions
The ERTAC projection tool was developed by S/L/T agencies under the direction of the Eastern
Regional Technical Advisory Committee (ERTAC) as an alternative EGU modeling approach
that is more appropriate for use in SIP modeling.
The Tool uses base EPA Clean Air Markets Division (CAMD) data and fuel specific growth
rates developed from primarily Energy Information Agency (EIA) and National Energy
Reliability Corporation (NERC) data to estimate future activity and emissions. The tool uses
base year activity as contained in the CAMD files as a pattern for future activity, so that the
future year temporal activity profiles match the modeled meteorology. Generation and emissions
are collected by continuous emission monitors (CEM) located at facilities and electronically
reported to CAMD. Seasonally averaged base year emission rates for SO2 and NOX (lb/MMBtu)
are calculated from this data. Future emission rates are developed from base year emission rates
adjusted to account for state knowledge of known future year emission controls, fuel switches,
retirements, and new units.
Expected changes in generation are estimated based on EIA Annual Energy Outlook (AEO)
projections of future regional generation and the National Energy Reliability Corporation
(NERC) regional peak growth rates. This information is available by region and fuel type.
Future generation by unit is estimated by combining these data files with a table of state
knowledge of unit changes. Hourly future emissions of NOx and SO2 are calculated by
multiplying hourly projected future generation by future emission rates.
Future unit generation rates, NOX and SO2 emissions are estimated directly by the ERTAC tool.
This output is then post-processed to develop emissions estimates for other pollutants needed for
air quality modeling. Section 3.2.1 provides background on inputs, Section 3.2.2 describes the
model runs used for this BETA2 inventory, while Section 3.2.3 documents how the ERTAC tool
results were used in air quality modeling.

Technical Support Document for the 2011 Northeastern U.S. Emission Inventory with projections to 2020 and 2023 GAMMA Version January, 2018
Page 34
3.2.1. ERTAC EGU Inputs
The ERTAC EGU Tool input files are built by the ERTAC committee from a wide variety of
existing data. The Tool uses the base year CEM data as a starting point. The CEM data includes
hourly emissions variability resulting from a number of factors, including variability in emission
rate due to changes in fuel quality, control devise performance, and other site specific factors as
well as variability in emissions due to change in load. Emission rate changes are not preserved
in the final modeling files. Rather an average Ozone Season and Non-Ozone season rate are
used. Therefore, to estimate base year 2011 emissions on the same basis as future year
emissions, the ERTAC tool was run where Future Year = Base Year = 2011 to estimate 2011
emissions. For the base year run growth factors were set to 1 and retirements and fuel switches
were removed. This allowed the code to project a “future” year that is aligned with the base year
(2011).
Input files are subject to periodic quality assurance and updating by S/L/T agency staff. In
addition, S/L/T agencies provide information on new units, new controls, fuel switches,
shutdowns and other unit-specific changes. Periodic updates of these input files drives creation
of new run versions.
ERTAC EGU Tool input files are as follows:
Base Year Hourly CEM data – This file contains hourly generation and emissions data
extracted from EPA’s CAMD database. In unit-specific situations where base year hourly
data needs modification, the tool allows the user to provide a nonCAMD hourly file, which
may be used to adjust or add data to the base year hourly CEM file.
Unit Availability File (UAF) – This file is a table of base year unit specific information
derived from CAMD NEEDS database, state input, EIA Form 860, and NERC data. This file
is maintained by the ERTAC committee and provides information on changes to specific
units from the base year to the future year. For example, the UAF captures actual or planned
changes to utilization fractions, unit efficiency, capacity, or fuels. S/L/T agencies have also
added information on actual and planned new units and shutdowns.
Control File – This file contains a table of known future unit specific changes to SO2 or
NOx emission rates (in terms of lbs/MMBtu) or control efficiencies (for example, addition of
a scrubber or selective catalytic reduction system). This information is provided by S/L/T
agency staff. This file also provides emission rates for units that did not operate in the base
year. Controls can be differentiated seasonally, monthly, weekly, or using other time spans.
For example, a unit may employ more effective controls during the ozone season.
Seasonal Controls File – This optional file may be used by S/L/T agencies to enter seasonal
or periodic future year emissions rates for specific units such that the information is used in
all future year runs. This file may be used in addition to, or as an alternative to, the Control
File.
Input Variables File – A table of variables used in the modeling run. Regions and fuels are
not hardwired into the model. Rather, the regions and their characteristics are specified in
the Input Variables File. This file allows the S/L/T agencies to specify variables such as the
size, fuel type and location for new units. In addition, the regional scheme and fuel types are
specified in this file.

Technical Support Document for the 2011 Northeastern U.S. Emission Inventory with projections to 2020 and 2023 GAMMA Version January, 2018
Page 35
Growth Factor File – A table of growth factors developed from the EIA Annual Energy
Outlook (AEO) and NERC estimates. Electrical generation growth is delineated by
geographic region and generating unit type.
3.2.2. ERTAC EGU Tool Background
Each electricity generating unit included in the model is assigned to a geographic region and fuel
type bin in the Unit Availability File. The five fuel types in current use are as follows:
o Coal;
o Oil;
o Natural Gas – Combined Cycle;
o Natural Gas – Single Cycle;
o Natural Gas – Boiler gas.
The geographic regional system currently in use is a modified version of the EIA Electricity
Market Module (EMM) regional system. The regional system in use for coal is shown in Figure
4. Slightly different boundaries are used for other fuel types.

Technical Support Document for the 2011 Northeastern U.S. Emission Inventory with projections to 2020 and 2023 GAMMA Version January, 2018
Page 36
Figure 4: Regional boundaries for coal generation, CONUSv2.7 which are based on the Electricity Market Module (EMM) Regions
The EIA and NERC regional systems are not identical, so an adjustment is required to align
these regional systems to develop annual and peak growth rates. To match EIA and NERC, a
“best fit” NERC regional growth factor is assigned to each EMM region. In the simplest case,
where a clear match between EIA and NERC regional schemes exists, for example NPCC-New
England, the NERC peak growth rate is assigned to the corresponding EMM region. In more
complicated cases, where multiple NERC regions corresponded to a single EMM region, or
where regions were organized along substantially different geographic boundaries, the NERC
peak growth factors were averaged to generate a growth factor for the (usually larger)
corresponding EMM region. As an example, the EIA CAMx region corresponds to two NERC
regions, WECC-CALN and WECC-CALS. In this case, the WECC-CALN and WECC-CALS
growth factors were averaged and applied to the EIA-CAMx region. The resulting assignments
are shown in Figure 5.

Technical Support Document for the 2011 Northeastern U.S. Emission Inventory with projections to 2020 and 2023 GAMMA Version January, 2018
Page 37
Figure 5: EMM to NERC Crosswalk – ERTAC EGU V2.7
Expected future generation by fuel type are provided by EIA in their annual energy outlook
(AEO). Annual average regional growth factors are calculated by dividing AEO future year by
base year generation. The NERC peak growth rates are not delineated by fuel so each fuel has
EMM Region # Fuel EMM Region Name ERTAC Regional Code
Single "Best-Fit" NERC
Subregion Peak Growth
Code
1 Coal, NG, Oil Texas Regional Entity (ERCT) ERCT ERCOT
2 Coal, NG, OilFlorida Reliability Coordinating Council
(FRCC)FRCC FRCC
3 Coal, NG, OilMidwest Reliablity Council / East
(MROE) MROE MISO / SPP / SERC-N
4 Coal, NG, OilMidwest Reliablity Council / West
(MROW) MROW MISO / SPP / SERC
5 Coal, NG, OilNortheast Power Coordinating Council
/ Northeast (NEWE)NEWE NPCC - NE
6 Coal, NG, OilNortheast Power Coordinating Council
/ NYC Westchester (NYCW)NYCW NPCC - NY
7 Coal, NG, Oil Upstate New York (NYUP) NYUP NPCC – NY
8 Coal, NG, Oil Long Island (NYLI) NYLI NPCC - NY
9 Coal, NG, OilReliability First Corporation / East
(RFCE)RFCE PJM / SERC - E
10 Coal, NG, Oil Reliability First Corporation / Michigan RFCM MISO / SPP / SERC
11 Coal, NG, Oil Reliability First Corporation / West RFCW PJM / SERC - E
12 Coal, NG, OilSERC Reliability Corporation / Delta
(SRDA)SRDA MISO / SPP / SERC
13 Coal, NG, OilSERC Reliability Corporation / Gateway
(SRGW)SRGW MISO / SPP / SERC
14 Coal, NG, OilSERC Reliability Corporation /
Southeastern (SRSE)SRSE SERC - SE
15 Coal, NG, OilSERC Reliability Corporation / Central
(SRCE)SRCE MISO / SPP / SERC
16 Coal, NG, OilSERC Reliability Corporation / Virginia
Carolina (SRVC)SRVC PJM / SERC - E
17+18 Coal, NG, OilSouthWest Power Pool / North (SPNO)
+ South (SPSO)SPPR MISO / SPP / SERC
19 Coal, NG, OilWestern Electricity Coordinating
Council / Southwest (AZNM)AZNM WECC-WECC-SWSG
20 Coal, NG, OilWestern Electricity Coordinating
Council / California (CAMX)CAMX WECC-CAMX US
21 Coal, NG, Oil
Western Electricity Coordinating
Council / Northwest Power Pool Area
(NWPP)
NWPP WECC-NWPP US
22 Coal, NG, OilWestern Electricity Coordinating
Council / Rockies (RMPA)RMPA WECC-WECC-RMRG
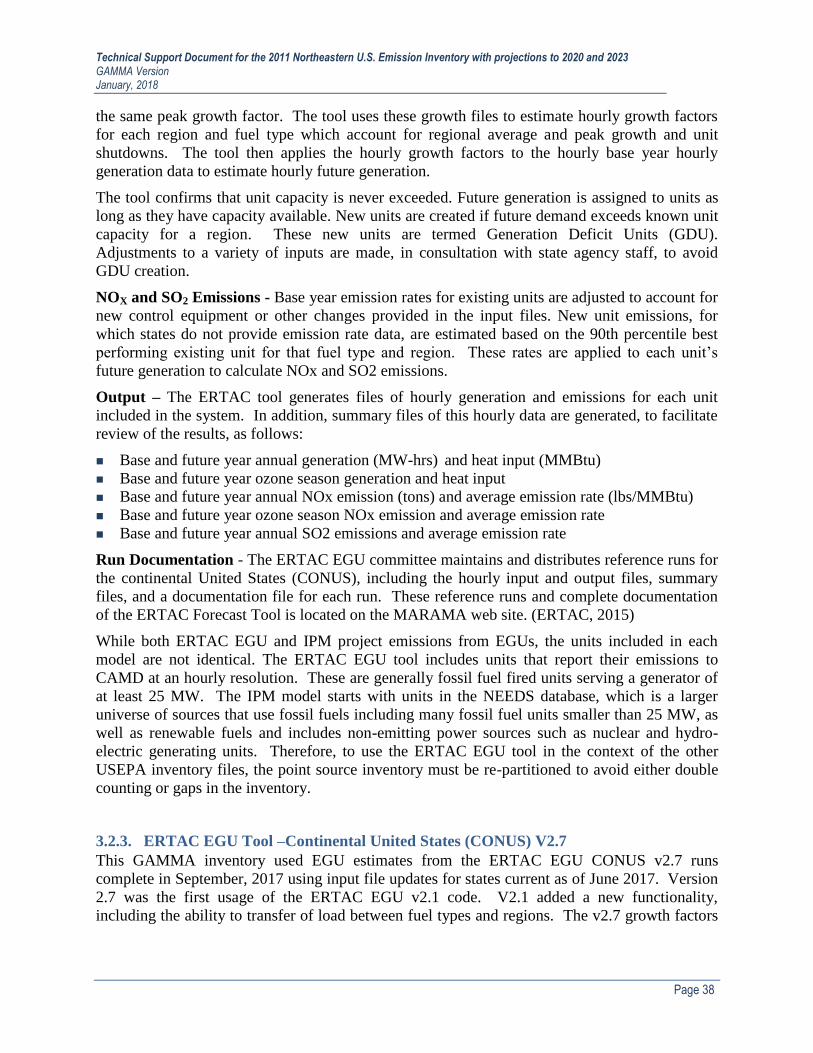
Technical Support Document for the 2011 Northeastern U.S. Emission Inventory with projections to 2020 and 2023 GAMMA Version January, 2018
Page 38
the same peak growth factor. The tool uses these growth files to estimate hourly growth factors
for each region and fuel type which account for regional average and peak growth and unit
shutdowns. The tool then applies the hourly growth factors to the hourly base year hourly
generation data to estimate hourly future generation.
The tool confirms that unit capacity is never exceeded. Future generation is assigned to units as
long as they have capacity available. New units are created if future demand exceeds known unit
capacity for a region. These new units are termed Generation Deficit Units (GDU).
Adjustments to a variety of inputs are made, in consultation with state agency staff, to avoid
GDU creation.
NOX and SO2 Emissions - Base year emission rates for existing units are adjusted to account for
new control equipment or other changes provided in the input files. New unit emissions, for
which states do not provide emission rate data, are estimated based on the 90th percentile best
performing existing unit for that fuel type and region. These rates are applied to each unit’s
future generation to calculate NOx and SO2 emissions.
Output – The ERTAC tool generates files of hourly generation and emissions for each unit
included in the system. In addition, summary files of this hourly data are generated, to facilitate
review of the results, as follows:
Base and future year annual generation (MW-hrs) and heat input (MMBtu)
Base and future year ozone season generation and heat input
Base and future year annual NOx emission (tons) and average emission rate (lbs/MMBtu)
Base and future year ozone season NOx emission and average emission rate
Base and future year annual SO2 emissions and average emission rate
Run Documentation - The ERTAC EGU committee maintains and distributes reference runs for
the continental United States (CONUS), including the hourly input and output files, summary
files, and a documentation file for each run. These reference runs and complete documentation
of the ERTAC Forecast Tool is located on the MARAMA web site. (ERTAC, 2015)
While both ERTAC EGU and IPM project emissions from EGUs, the units included in each
model are not identical. The ERTAC EGU tool includes units that report their emissions to
CAMD at an hourly resolution. These are generally fossil fuel fired units serving a generator of
at least 25 MW. The IPM model starts with units in the NEEDS database, which is a larger
universe of sources that use fossil fuels including many fossil fuel units smaller than 25 MW, as
well as renewable fuels and includes non-emitting power sources such as nuclear and hydro-
electric generating units. Therefore, to use the ERTAC EGU tool in the context of the other
USEPA inventory files, the point source inventory must be re-partitioned to avoid either double
counting or gaps in the inventory.
3.2.3. ERTAC EGU Tool –Continental United States (CONUS) V2.7
This GAMMA inventory used EGU estimates from the ERTAC EGU CONUS v2.7 runs
complete in September, 2017 using input file updates for states current as of June 2017. Version
2.7 was the first usage of the ERTAC EGU v2.1 code. V2.1 added a new functionality,
including the ability to transfer of load between fuel types and regions. The v2.7 growth factors

Technical Support Document for the 2011 Northeastern U.S. Emission Inventory with projections to 2020 and 2023 GAMMA Version January, 2018
Page 39
are primarily based on EIA AEO2017 No Clean Power Plan Case. Relative peak factors were
derived from 2016 NERC Electricity Supply & Demand (ES&D).
3.2.3.1. Controls Applied Beyond State Input to Comply with CSAPR Update
The ERTAC EGU V2.7 reference runs did not result in NOX emissions that met the regulatory
requirement to meet the 2017/2018 CSAPR Update budgets in FY 2023. Due to the conservative
nature of SIP development and therefore inventory development, states may not always include
lower ozone season NOX rates in projections for units that have flexibility in how they run
controls or combustion processes. To address this issue, the ERTAC committee developed the
CSAPR Update scenario to reflect reasonable estimates of improved NOX rates driven by the
requirement to purchase allowances under CSAPR Update in future year projections to
demonstrate a first-cut estimate of compliance with state level budgets, assurance levels, or
regional budgets associated with the CSAPR Update rule addressing the 2008 ozone NAAQS.
Development of optimized emission rates. - Maryland state staff prepared an analysis of
historical unit performance from 2005-2016 ozone seasons to determine historically best-
observed NOX emission rates for coal-fired units controlled by SCR or SNCR. (Vinciguerra et al
2017) This analysis was based on ERTAC 2.6 results. Based on this analysis it was estimated
that 19 units fitted with SNCR could meet an average NOX rate of 0.125 lbs/mmbtu in the ozone
season. Also 141 units fitted with SCR were identified that could meet an average NOX rate of
0.064 lbs/mmbtu in the ozone season. These average values were selected to represent optimized
NOX rates during the ozone season in the absence of a state-provided optimized NOX rate.
Additionally, OK staff prepared an analysis of 2016 ozone season NOX rates for units within OK
not equipped with post-combustion controls but that have reduced NOX emissions in 2016 based
on CAMD data.
Units for which the optimized control rate were applied - To determine which units would
receive optimized NOX rates, Maryland state staff developed a list of coal-fired EGUs within
CSAPR states equipped with SCR or SNCR, and matched this list to the ERTAC 2.7 2023
results. The optimized NOX rates were applied to SNCR units with a 2023 ozone season NOX
emission rate > 0.125 lbs/mmbtu and SCR units with a 2023 ozone season NOX rate > 0.064
lbs/mmbtu unless the state already provided an ozone season controlled NOX rate in the seasonal
control file. This resulted in optimized OS rates for 163 units – 124 SCR and 39 SNCR units.
Oklahoma Units – Oklahoma submitted optimized ozone season NOX rates for the CSAPR
Update compliant run for the following additional units not included in Maryland’s analysis.
These rates are based on 2016 ozone season NOX data as reported by the Oklahoma units to
CAMD.
Optimized control emission rates were only applied in the ozone season - The optimized
rates were included in the seasonal controls files and applied from May 1 through Sept 30 2020
and 2023. In other periods of the year emission factors were equivalent to the 2011 data for the
non-ozone season unless states had provided controlled NOX rates as inputs. Where states
provided a future year controlled NOX rate that controlled rate was used for the non-ozone
season. State provided annual NOX control information for optimized units was removed from
the annual control file to ensure that the ERTAC EGU tool would correctly select the NOX rate
supplied in the optimized seasonal controls file. However, state comments concerning annual
controls were preserved in the non-ozone seasonal control file records.

Technical Support Document for the 2011 Northeastern U.S. Emission Inventory with projections to 2020 and 2023 GAMMA Version January, 2018
Page 40
3.2.3.2. Region and fuel specific Growth Factor Adjustments
Adjustments to the EIA/NERC annual and peak growth factors were made for specific regions
and fuel types as follows:
EIA provides a single natural gas growth rate for each region. Because most growth in
natural gas usage is combined cycle units, this factor was allocated to apply the growth to
natural gas combined cycle unit types and “no growth” to single cycle and boiler gas unit
types.
Selected small regions were combined to allow generation growth to flow to units in the
combined regions as follows:
o SPPR – Two AEO regions, SPPN and SPPS, were aggregated for the coal fuel
type only. These regions comprise Southwest Power Pool and SERC Delta (aka
SERC West). Much of the aggregated region is linked or at least coordinated for
reliability and power wholesaling into MISO and is referred to as MISO South.
The primary utility causing the regional footprint adjustments is Entergy. It has
one controlled grid connection with the rest of MISO and much better integration
with SPP (OK and KS). Growth factors for the combined region were derived
from a capacity weighted average of the two subregion.
In general, local data is preferred. Therefore, EIA/NERC projections were replaced with factors
based on Independent System Operators (ISO) or state data in the following regions within the
states covered by the modeling inventory:
o NYCW – EIA/NERC growth projections for the NYCW region were replaced
with factors provided by NYSDEC. These factors were developed based on
NYISO projections.
o SRVC - For SRVC, EIA/NERC growth projections were replaced by those
provided by a combined study approved by the air directors of SC, NC, VA, and
WV. The Transition Points for combined cycle were set at 200 and 5000 to
reflect the base load nature of combined cycle. The Transition Points were set at
10/2000 for boiler gas to push the huge increase into the middle range of the
hours.
Demand transfer is a new concept made possible by use of the new v2.1 ERTAC EGU code.
The concept is to transfer some demand for particular hours from one fuel bin to alleviate the
generation of a GDU. Another use for a demand transfer is the case where a significant system
change occurs which was not anticipated by the EIA in the AEO. The example in V2.7 is the
retirement of a large nuclear power plant near New York City. This results in other fuel bins
having to provide a large amount of generation that was unanticipated by the EIA in the AEO.
The following is a listing of all demand transfers that were implemented in V2.7:
o NEWE 300 MW-hrs was transferred from coal to combined cycle fuel bins in
861 deficit hours to prevent a coal fired GDU.
o FRCC Coal generation was transferred to the combined cycle fuel bin for certain
hours to prevent a coal fired GDU.
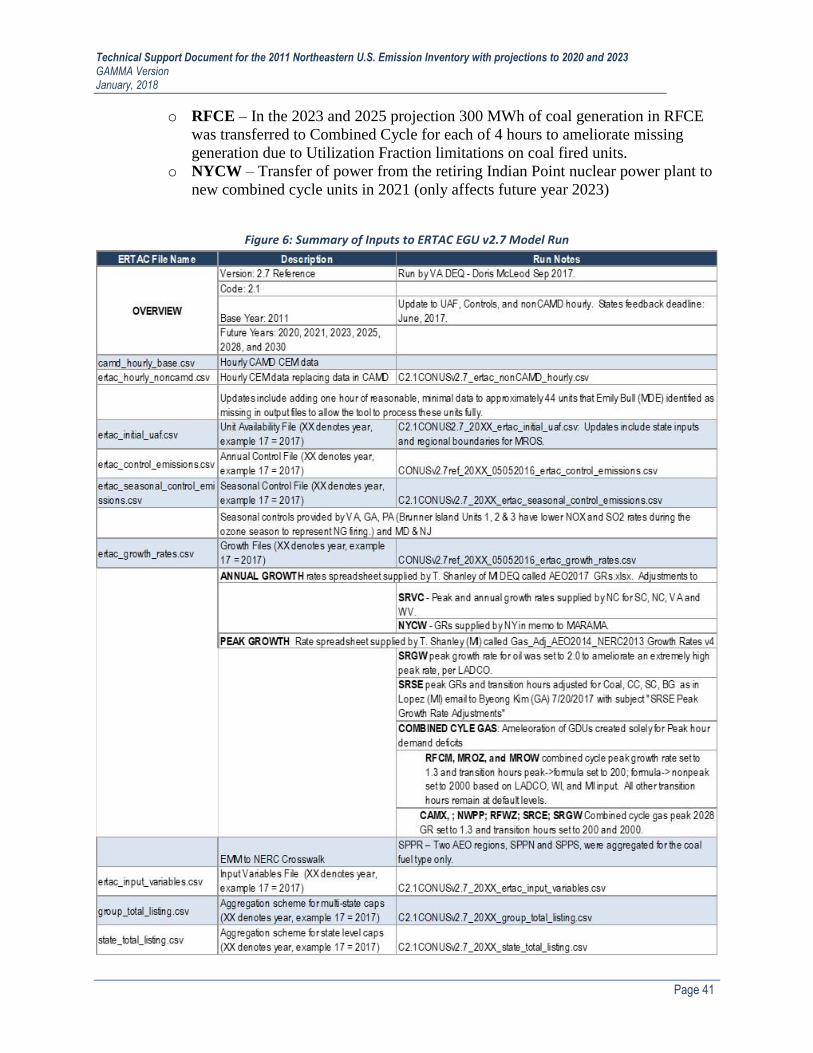
Technical Support Document for the 2011 Northeastern U.S. Emission Inventory with projections to 2020 and 2023 GAMMA Version January, 2018
Page 41
o RFCE – In the 2023 and 2025 projection 300 MWh of coal generation in RFCE
was transferred to Combined Cycle for each of 4 hours to ameliorate missing
generation due to Utilization Fraction limitations on coal fired units.
o NYCW – Transfer of power from the retiring Indian Point nuclear power plant to
new combined cycle units in 2021 (only affects future year 2023)
Figure 6: Summary of Inputs to ERTAC EGU v2.7 Model Run

Technical Support Document for the 2011 Northeastern U.S. Emission Inventory with projections to 2020 and 2023 GAMMA Version January, 2018
Page 42
3.2.4. ERTAC to SMOKE Conversion
The outputs from the ERTAC EGU tool are converted to FF10 model inputs suitable for air
quality modeling using the ERTAC to SMOKE tool. The tool adds hourly emissions for
pollutants other than NOX and SO2 and stack characteristics. We used the following data sources
to develop emission factors for other pollutants for the ERTAC sources:
The NEI2011v2 2011 annual emissions for criteria air pollutants and NH3.
As described earlier, we and the S/L/T agencies developed a cross-reference file (Appendix
A) to match units in the ERTAC UAF (Appendix B) with records in the NEI2011v2 for each
of the jurisdictions covered by the Northeast regional emissions inventory.
The EPA CAMD unit level file (Appendix C) contains data collected as part of EPA’s
emission trading programs. It contains descriptive information about emission units and
period totals for heat input and CO2, NOx and SO2 mass emissions. This inventory is
referred to as CAMD2011. Most units are required to report data for the entire year, so that
the period totals are annual totals. Other units reported data for less than 12 months,
depending on when the unit began or ceased operation during 2011.
The EPA AP-42 emission factor documents for natural gas, coal, fuel oil, and stationary gas
turbines (Appendices D-G) which contains uncontrolled and controlled emission factors for
criteria air pollutants for various types and sizes of combustion devices and fuel types.
The NEI2011v2 includes emission unit identifiers to link the units to the units in the CAMD2011
database and the units in the ERTAC UAF. Data elements from these three data sources were
merged into a spreadsheet. States reviewed and improved these linkages and the linkages were
updated to redistribute the units in the NEI2011v2 into two groups: units included in the ERTAC
methodology and all other units.
The methodology for calculating the emission factors varied depending on the availability of
annual heat input:
Full year reporters that have annual generation, heat input and SO2/NOx emissions available
from the CAMD2011 database
Partial year reporters that have less than 12-months of generation, heat input and SO2/NOx
emissions data available in the CAMD2011 database
New/proposed units and existing units that did not operate in 2011 (e.g., no heat input
reported in CAMD2011)
Note that we did not calculate emission factors for units identified as “nonEGU” in the UAF
since these units are not included in the ERTAC projections.
For full year reporters, we extracted the 2011 annual emissions of CO, NH3, PM10, PM2.5 and
VOC from the NEI2011v2. We also extracted the annual heat input from the CAMD2011
database. We calculated the emission factors using the following formulas:
EFi (lbs/MMBtu) = TONS2011i (tons) * (2000 lbs/ton) / HI2011_CAMD (MMBtu)
Where: EFi = Emission factor for pollutant i
TONS2011i = Annual 2011 emissions for pollutant i from NEI2011v2
HI2011_CAMD = Annual 2011 heat input from CAMD2011

Technical Support Document for the 2011 Northeastern U.S. Emission Inventory with projections to 2020 and 2023 GAMMA Version January, 2018
Page 43
We used this formula when there was a one-to-one correspondence between a NEI2011v2 unit
and a CAMD2011 unit. In a few cases, multiple CAMD2011 units were associated with a single
NEI2011v2 unit. For example, CAMD2011 may have multiple identical combustion turbines
listed individually with annual heat input for each turbine, whereas the NEI2011v2 has these
same turbines grouped as a single emission unit with annual emissions representing the total
emissions for all turbines in the group. For these cases, we calculated the term HI2011_CAMD
in the above equation as the sum of the heat input for all CAMD2011 units associated with the
NEI2011v2 unit.
For partial full year reporters, the annual heat input was not available since the CAMD2011 only
has heat input for the period that was reported. Most of these units either began operation in 2011
or ceased operation in 2011, so that the heat input for these units in effect represents the “annual”
heat input. We extracted the 2011 annual emissions of CO, NH3, PM10, PM2.5 and VOC from
the NEI2011v2 annual emission inventory. We calculated the emission factors using the
following formulas:
EFi (lbs/MMBtu) = TONS2011i (tons) * (2000 lbs/ton) / HI2011_CAMD (MMBtu)
Where: EFi = Emission factor for pollutant i
TONS2011i = Annual 2011 emissions for pollutant i from NEI2011v2
HI2011_CAMD = Period 2011 heat input from CAMD2011
For both existing and new units that did not operate in 2011, there is no heat input available to
calculate emission factors. We extracted emission factors from AP-42 for the appropriate fuel
type and combustion type, as shown in Figure 7. For three facilities that have experienced post-
2011 fuel switches (BL England, Bremo Power Station, and Clinch River), we obtained unit-
specific emission factors from the responsible state agency. For new facilities, we also solicited
emission factors and stack parameters from states. For example, Virginia provided emission
factors and stack characteristics for the combined cycle units at Warren and the coal-fired
Virginia City Energy Center.
Figure 7: EPA Emission Factors from AP-42
Fuel / Unit Type AP42 Reference Pollutant Emission Factor
(lbs/MMBtu)
Coal – Dry-bottom Wall-fired
Table 1.1-3 Table 1.1-20 n/a Table 1.1-6 (with cyclones) Table 1.1-6 (with cyclones) Table 1.1-19
CO CO2 NH3
PM10-PRI PM25-PRI
VOC
0.019 232 n/a
0.388 0.023
0.0023
Diesel or Distillate Oil – Combustion Turbine
Table 3.1-1 Table 3.1-2a n/a Table 3.1-2a (assume all PM<2.5) Table 3.1-2a (assume all PM<2.5) Table 3.1-2a
CO CO2 NH3
PM10-PRI PM25-PRI
VOC
0.076 157 n/a
0.012 0.012 0.0004
Natural Gas – Dry Bottom Wall-fired Boiler
Table 1.4-1 (controlled)
Table 1.4-2
n/a Table 1.4-2 (assume all PM<2.5) Table 1.4-2 (assume all PM<2.5)
CO
CO2 NH3
PM10-PRI PM25-PRI
0.082 118 n/a
0.0075
0.0075

Technical Support Document for the 2011 Northeastern U.S. Emission Inventory with projections to 2020 and 2023 GAMMA Version January, 2018
Page 44
Fuel / Unit Type AP42 Reference Pollutant Emission Factor
(lbs/MMBtu)
Table 1.4-2 VOC 0.0054
Natural Gas – Tangentially Fired Boiler
Table 1.4-1 (controlled)
Table 1.4-2
n/a Table 1.4-2 (assume all PM<2.5) Table 1.4-2 (assume all PM<2.5) Table 1.4-2
CO
CO2 NH3
PM10-PRI PM25-PRI
VOC
0.096 118 n/a
0.0075
0.0075
0.0054
Natural Gas – Combustion Turbine and Combined Cycle
Table 3.1-1
Table 3.1-2a n/a Table 3.1-2a (assume all PM<2.5) Table 3.1-2a (assume all PM<2.5) Table 3.1-2a
CO CO2
NH3 PM10-PRI PM25-PRI
VOC
0.030 110 n/a
0.0066 0.0066 0.0021
Emission factors for each unit and pollutant were reviewed to assess the reasonableness of each
factor by comparing the calculated emission factors for each combustion/fuel type (e.g., simple
cycle gas, tangentially coal-fired boiler). A few emission factors that were egregiously out-of-
range were revised based on best engineering judgment. The results of the above calculations
were provided to S/L/T for review and approval (see Appendix H). We formatted the emission
factors into the ERTAC Control File format (see Appendix I).
3.3. INDICATORS, CONTROLS, SHUTDOWNS
3.3.1. Projecting Sector Activity Change
S/L/T agencies use a variety of indicators as surrogates for future sector activity including
projections for energy consumption, vehicle miles traveled, population, and employment. While
recognizing that these surrogates may not track exactly with emissions, states consider these
surrogates to be the “best available” data for projecting emissions for non-EGU point sources.
S/L/T agencies also account for the effect of emission control programs in reducing future year
emissions. Based on S/L/T assessments of the best indicators for each source type, growth and
control factors were developed for use within the EMF tool.
EPA guidance (EPA, 2007) on developing emission projections for use with modeling
attainment demonstrations for ozone, fine particles, and regional haze is followed, to the extent
possible. Growth indicators were mapped to specific source classification codes for point and
nonpoint sources. We selected surrogate growth data for each emission source after considering
several criteria:
Is the surrogate parameter readily available in a publicly available, non-proprietary data
source?
How well are methodology and data used to develop the surrogate parameter documented?
How closely does the surrogate parameter relate to the activity indicator used to develop
the base year emission?
How closely does the surrogate data approximate changes in the emission generating
activity?
How well does it characterize the activity in a given geographic area and during the time
frame of interest?

Technical Support Document for the 2011 Northeastern U.S. Emission Inventory with projections to 2020 and 2023 GAMMA Version January, 2018
Page 45
The following sections describe each growth indicator.
3.3.1.1. Energy Consumption Projections
AEO2015 provides regional fuel-use forecasts for various fuel types (e.g., coal, residual oil,
distillate oil, natural gas, renewables) by end use sector (e.g., residential, commercial, industrial,
transportation, and electric power). In addition, they provide a national projection of annual
vehicle miles (VMT). AEO also accounts for most current laws and regulations, including those
associated with air pollution control. AEO 2015 presents long-term projections of energy
consumption supply, demand, and prices through 2040, based on results from EIA’s National
Energy Modeling System (NEMS). NEMS projects production, import, conversion,
consumption, and price of energy, subject to assumptions on macroeconomic and financial
factors, world energy markets, resource availability and costs, behavioral and technological
choice criteria, energy technology cost and performance characteristics, and demographics. The
reference case is business-as-usual trend estimates, given known technology and demographic
trends. Appendices J, K and L contain tables of AEO2015 reference case data for the three
regions. Refer to the AEO web site for a complete description of the methodologies, data
sources, and assumptions made by EIA in developing the energy projections.
AEO2015 projects energy use at census division level which groups states as follows:
New England region includes CT, MA, ME, NH, RI and VT
Mid-Atlantic region includes NJ, NY, and PA
South Atlantic region includes DC, DE, MD, NC, VA and WV (as well as a few other
states not in the MARAMA study area)
AEO2015 provides energy consumption projection estimates for each year from 2012 to 2040.
To develop complete growth tables from 2007 to 2011, previous versions of AEO were used to
obtain historic energy consumption data as follows
AEO2014 for 2011 energy consumption data
AEO2013 for 2010 energy consumption data
AEO2012 for 2009 energy consumption data
AEO2011 for 2008 energy consumption data
AEO2010 for 2007 energy consumption data
While there are slight differences in the methods used to produce the earlier versions of AEO,
the combined data set provides a cohesive data set covering all years from 2007 to 2040.
Energy consumption projections from the U.S. Energy Information Administration (EIA) 2015
Annual Energy Outlook (AEO) (EIA, 2015) reference case is the change indicator used for most
fuel burning SCCs. AEO2015 projections are used for commercial and industrial fuel
consumption. In addition, AEO2015 projections are used for residential and transportation fuel
consumption.
Commercial energy consumption – Figure 8 through Figure 10 show the AEO2015 projections
for commercial energy consumption in the three regions. AEO projects increases in residual oil
consumption in all three regions, which is unexpected and may require further investigation in
states where residual oil is widely used in commercial facilities. Because of the uncertainty of the
residual oil projection, states decided to use a “no growth” projection factor for commercial
residual oil sources in all three AEO regions. AEO also projects declines in distillate oil

Technical Support Document for the 2011 Northeastern U.S. Emission Inventory with projections to 2020 and 2023 GAMMA Version January, 2018
Page 46
consumption in all three regions compared to 2011 consumption. Coal consumption by
commercial sources decreased from 2007 to 2011, but AEO projects coal consumption to remain
relatively constant after 2011. AEO projects positive growth in natural gas consumption.
Industrial energy consumption - Figure 11 through Figure 13 show the AEO projections for
industrial energy consumption in the three regions. In all three regions, AEO projects an upward
trend in renewable energy and natural gas consumption, and relatively small changes in distillate.
Residual oil consumption is projected to decrease in all three AEO regions between 2011 and
2020. In the Mid-Atlantic region, AEO projects small increases in coal consumption from 2012
through 2021 and a downward trend after 2021. AEO is projecting upward trend in industrial
coal combustion in the South Atlantic region after 2011.
Electric power energy consumption - Figure 14 through Figure 16 show the AEO projections
for electric power energy consumption in the three regions. MARAMA used these projections
for EGUs that are not included in the ERTAC EGU forecasting tool. In New England, AEO
projects increases in renewable fuel sources, dramatic decreases in distillate and residual oil
consumption, and very little change in other fuel sources. In the Mid-Atlantic region, AEO
projects dramatic decreases in residual oil consumption, virtually eliminating its use by 2019.
Other fuels are projected to have modest changes compared to 2011. In the South Atlantic
region, AEO projects large decreases in residual oil consumption and significant increases in
renewable energy sources.
Residential energy consumption – Figure 17 through Figure 19 show the AEO projections for
residential energy consumption in the three regions. AEO2015 projects a 20 to 25 percent
reduction in heating oil consumption by 2025 in all three regions. In New England, AEO2015
projects all other residential energy sources to have only a small change in consumption. In the
Mid-Atlantic region, AEO2015 projects a downward trend in natural gas consumption and an
upward trend in renewable energy sources. In the South Atlantic region, AEO is projecting
upward trends in electricity, renewable, and natural gas. These upward trends are presumably
due in part to the growing populations in this region. There are big swings in residential coal
consumption in the years 2007 to 2011. However, the total amount of residential energy derived
from coal is very small compared to other energy sources, and this volatility should have very
little if any impact on future year emission totals.
Transportation energy consumption - Figure 20 through Figure 22show the AEO projections
for transportation energy consumption in the three regions. AEO projects increases in alternative
fuel vehicle (electricity, CNG/LPG) in all three regions. AEO also projects the gasoline
consumption will decrease after 2011 in all three regions. These AEO projections are used for
certain types of sources such as the marketing and distribution of petroleum products.

Technical Support Document for the 2011 Northeastern U.S. Emission Inventory with projections to 2020 and 2023 GAMMA Version January, 2018
Page 47
Figure 8: AEO 2015 Commercial Energy Consumption Projections – New England States
Figure 9: AEO 2015 Commercial Energy Consumption Projections – Mid-Atlantic States
Figure 10: AEO 2015 Commercial Energy Consumption Projections – South-Atlantic Jurisdictions

Technical Support Document for the 2011 Northeastern U.S. Emission Inventory with projections to 2020 and 2023 GAMMA Version January, 2018
Page 48
Figure 11: AEO 2015 Industrial Energy Consumption Projections – New England States
Figure 12: AEO 2015 Industrial Energy Consumption Projections – Mid-Atlantic States
Figure 13: AEO 2015 Industrial Energy Consumption Projections – South-Atlantic Jurisdictions

Technical Support Document for the 2011 Northeastern U.S. Emission Inventory with projections to 2020 and 2023 GAMMA Version January, 2018
Page 49
Figure 14: AEO 2015 Electric Power Energy Consumption Projections – New England States
Figure 15: AEO 2015 Electric Power Energy Consumption Projections – Mid-Atlantic States
Figure 16: AEO 2015 Electric Power Energy Consumption Projections – South-Atlantic Jurisdictions

Technical Support Document for the 2011 Northeastern U.S. Emission Inventory with projections to 2020 and 2023 GAMMA Version January, 2018
Page 50
Figure 17: AEO 2015 Residential Energy Consumption Projections – New England States
Figure 18: AEO2015 Residential Energy Consumption Projections – Mid-Atlantic States
Figure 19: AEO2015 Residential Energy Consumption Projections – South-Atlantic Jurisdictions

Technical Support Document for the 2011 Northeastern U.S. Emission Inventory with projections to 2020 and 2023 GAMMA Version January, 2018
Page 51
Figure 20: AEO2015 Transportation Energy Consumption Projections – New England States
Figure 21: AEO2015 Transportation Energy Consumption Projections – Mid-Atlantic States
Figure 22: AEO2015 Transportation Energy Consumption Projections – South-Atlantic Jurisdictions

Technical Support Document for the 2011 Northeastern U.S. Emission Inventory with projections to 2020 and 2023 GAMMA Version January, 2018
Page 52
3.3.1.1. Population Projection
Historical population counts by county for the years 2000 to 2010 were obtained from the U.S.
Census Bureau. We obtained population projections by county for available future years from
each state’s population data center. See Figure 23 for references and Appendix T for the actual
data. For years where published values were not available, we estimated the population by
interpolating between years with published values. For any projection year beyond the last year
of each state’s population growth data sets, we assumed no additional growth after the last year
of published data.
Figure 24shows the population growth factors for the six states in New England AEO region.
Population in the New England region is projected to grow from 14.5 million in 2011 to 14.8
million in 2017 and 15.2 million in 2025. Population growth is relatively modest (2 – 3 percent
over the six year period from 2011 to 2017) in Connecticut, Massachusetts, New Hampshire and
Vermont. Essentially no growth in population is projected for Maine from 2011 to 2017. Rhode
Island is projected to have a small decrease in population.
Figure 25 shows the population growth factors for the three states in Mid-Atlantic AEO region.
Population in these three states is projected to grow from 40.0 million in 2011 to 41.5 million in
2017 and 42.3 million in 2025. Population in New Jersey is projected to grow by about 3 percent
from 2011 to 2017. Population in New York and Pennsylvania is project to grow by about 1
percent from 2011 to 2017.
Figure 26 shows that population in the southern part of the study area is projected to grow much
faster than the middle/northern part of the region. Population in these jurisdictions is projected to
grow from 27.0 million in 2011 to 28.4 million in 2017 and 30.4 million in 2025. These
jurisdictions (except West Virginia) have population growth rates that range from 4 to 7½
percent from 2011 to 2017.
Figure 23: Population Data Sources
State Reference
All Historical data for 2000 to 2010 obtained from U.S. Census Bureau. Intercensal Estimates of the Resident Population by County: April 1, 2001 to July 1, 2010. Accessed on November 21, 2013. https://www.census.gov/data/datasets/time-series/demo/popest/intercensal-2000-2010-counties.html
CT Connecticut State Data Center at the University of Connecticut Libraries Map and Geographic Information Center - MAGIC. 2015-2025 Population Projections for Connecticut at State, County, Regional Planning Organization, and Town levels - November 1, 2012 edition. retrieved on 10/2/13 from: http://ctsdc.uconn.edu/2015_2025_projections/
DC DC Office of Planning, Metropolitan Washington Council of Governments Population Forecast Round 8.0; retrieved 10/3/13 from: https://www.mwcog.org/documents/2016/11/16/cooperative-forecasts-employment-population-and-household-forecasts-by-transportation-analysis-zone-cooperative-forecast-demographics-housing-population/
DE Delaware Census State Data Center, The Delaware Population Consortium Annual Projections, October 25, 2012, Version 2012.0; retrieved on 10/2/13 from: http://stateplanning.delaware.gov/information/dpc_projections.shtml
MA Massachusetts Department of Transportation, Massachusetts Population Projections from MassDOT Planning; retrieved on 10/2/13 from: https://www.mass.gov/maps-data-and-reports
MD Department of Planning, Historical and Projected Total Population for Maryland's Jurisdictions; retrieved 10/3/2012 from: http://www.mdp.state.md.us/msdc/s3_projection.shtml
ME Office of Policy and Management, Maine state and county population outlook to 2030; retrieved on 10/3/13 from: http://maine.gov/economist/projections/index.shtml

Technical Support Document for the 2011 Northeastern U.S. Emission Inventory with projections to 2020 and 2023 GAMMA Version January, 2018
Page 53
State Reference
NC Office and State Budget and Management, County/State Population Projections; retrieved on 10/3/13 from: https://www.osbm.nc.gov/facts-figures/demographics
NH Office of Energy and Planning, Population projections for New Hampshire counties, cities and towns, retrieved on 11/21/13 from: http://www.nh.gov/oep/data-center/population-projections.htm
NJ Department of Labor and Workforce Development, Projections of Total Population by County: New Jersey, 2010 to 2030; retrieved 10/3/13 from http://lwd.dol.state.nj.us/labor/lpa/dmograph/lfproj/lfproj_index.html
NY Department of Labor, New York State and County Population Projections by Age and Sex; retrieved on 10/3/13 from: https://labor.ny.gov/stats/nys/statewide-population-data.shtm
PA Pennsylvania State Data Center, Total population projections for Pennsylvania Counties, 2000-2030; retrieved 10/3/13 from: http://pasdc.hbg.psu.edu/Data/Projections/tabid/1013/Default.aspx
RI Division of Planning, City and Town Population Projections; retrieved on 10/3/13 from: http://www.planning.ri.gov/geodeminfo/data/popprojections.php
VA Virginia Employment Commission, Total Population Projections for Virginia and its Localities, 2020-2040; retrieved 10/3/13 from: http://www.coopercenter.org/demographics/virginia-population-projections
VT Vermont Agency of Commerce and Community Development’s Vermont Population Projections – 2010 - 2030; retrieved 10/3/13 from: http://accd.vermont.gov/sites/accdnew/files/documents/CD/CPR/ACCD-DED-VTPopulationProjections-2010-2030.pdf
WV Bureau for Business and Economic Research’s Population Projection for West Virginia Counties; retrieved 10/3/13 from: http://busecon.wvu.edu/bber/pdfs/BBER-2014-04.pdf

Technical Support Document for the 2011 Northeastern U.S. Emission Inventory with projections to 2020 and 2023 GAMMA Version January, 2018
Page 54
Figure 24: Population Projections – New England States
Figure 25: Population Projections – Mid-Atlantic States
Figure 26: Population Projections – South Atlantic Jurisdictions

Technical Support Document for the 2011 Northeastern U.S. Emission Inventory with projections to 2020 and 2023 GAMMA Version January, 2018
Page 55
3.3.1.2. Employment Projections
MARAMA obtained employment projections by 3- or 4-digit NAICS code from each state using
the references shown in Figure 27 (also included as Appendix M). Every two years, each
individual state department of labor produces long-term industry employment forecasts for 10
years into the future. The employment projections are available by state and Workforce
Investment Areas (individual counties or groups of counties). For most states, the most recent
data are for two years - 2010 and 2020. Massachusetts provided employment data for 2012 and
2022.
Figure 27: Employment Data Sources
State Reference
CT 2010 and 2020 statewide data from Department of Labor Office of Research’s State of Connecticut Occupational Projections: 2010-2020; retrieved 10/3/13 from: http://www1.ctdol.state.ct.us/lmi/projections.asp
DC 2010 and 2020 statewide data from Department of Employment Services’ DC Industry and Occupational Projections 2010-2020; retrieved 10/3/13 from: http://does.dc.gov/publication/dc-industry-and-occupational-projections-2010-2020
DE 2010 and 2020 statewide data from Department of Labor, Office of Labor Market Information’s Delaware Occupation And Industry Projections; retrieved on 10/3/13 from: http://www.delawareworks.com/oolmi/Information/LMIData/Projections.aspx
MA 2012 and 2022 statewide data from Labor and Workforce Development’s Long-Term Industry Projections; retrieved 10/3/13 from: http://lmi2.detma.org/lmi/projections.asp
MD 2010 and 2020 statewide data from Department of Labor, Licensing, and Regulation’s Maryland Industry Projections; retrieved 10/3/13 from: http://www.dllr.state.md.us/lmi/iandoproj/
ME 2010 and 2020 statewide data from Center for Workforce Research and Information’s Job Outlook to 2020; retrieved 10/3/13 from: http://www.maine.gov/labor/cwri/outlook.html
NC 2010 and 2020 statewide data from Department of Commerce’s NC Statewide Industry Projections; retrieved 10/3/13 from: http://www.nccommerce.com/lead/data-tools/industry/projections and used for nonpoint source projections; Also provided AEO projections of industrial output by NAICS code for use in projection nonEGU point source emissions.
NH 2010 and 2020 statewide data from New Hampshire Employment Security’s Employment Projections by Industry and Occupation, 2010-2020; retrieved on 10/3/13 from: http://www.nhes.nh.gov/elmi/products/proj.htm
NJ 2010 and 2020 statewide data from New Jersey Department of Labor and Workforce Development’s Industry and Occupational Employment Projections; retrieved 10/3/13 from: http://lwd.dol.state.nj.us/labor/lpa/employ/indoccpj/st_index.html
NY 2010 and 2020 statewide data from Department of Labor’s Long-Term Industry Employment Projections; retrieved 10/3/13 from: https://www.labor.ny.gov/stats/lsproj.shtm
PA 2010 and 2020 statewide data from Department of Labor and Industry’s Long Term Industry Employment Projections; retrieved 10/3/13 from: http://www.workstats.dli.pa.gov/Products/LongTermIndustryProjections/Pages/default.aspx
RI 2010 and 2020 statewide data from Department of Labor and Training’s Employment Projections 3-Digit Industry NAICS; retrieved 10/4/13 from: http://www.dlt.ri.gov/lmi/proj.htm
VA 2010 and 2020 statewide data from Virginia Workforce Connection’s Industry Employment and Projections (Long Term); retrieved 10/4/13 from: https://www.vawc.virginia.gov/analyzer/session/session.asp?CAT=HST_EMP_WAGE_IND
VT 2010 and 2020 statewide data from Vermont Department of Labor’s Vermont Industry Projections 2010-2020; retrieved 10/4/13 from: http://www.vtlmi.info/projlt.pdf
WV 2010 and 2020 statewide data from Work Force West Virginia’s Industry Employment Projections 2010-2020; retrieved 10/3/13 from: http://lmi.workforcewv.org/LTprojections/LTIndustryProjections.html
s

Technical Support Document for the 2011 Northeastern U.S. Emission Inventory with projections to 2020 and 2023 GAMMA Version January, 2018
Page 56
To estimate employment in years between 2010 and 2020, MARAMA performed a linear
interpolation of the available data. For years 2007 to 2009, we used a trend function as is
available in the EXCEL software package to estimate employment. This procedure may not
accurately estimate employment for 2007 to 2009 since it does not account for short-term
recession job losses in those years. For years after 2020, we assumed no additional growth due to
the lack of forecast data in those years and the uncertainty in continuing a linear trend beyond
2020.
Figure 28 shows the employment data for agricultural crop production (NAICS=111). This
sector encompasses activities associated with crop production, such as soil preparation, soil
fertilization, planting, harvesting, and management. Two states (NC and WV) are projecting a
large decrease in the number of employees in this sector, while two states (CT and MD) are
projecting a large increase. The remaining states show smaller employment losses or gains.
Figure 28 shows the employment data for oil and gas extraction (NAICS=211). This sector
includes establishments engaged in (1) the exploration, development and/or the production of
petroleum or natural gas from wells, (2) the production of crude petroleum from surface shale
and (3) the recovery of liquid hydrocarbons from oil and gas field gases. Only five states (ME,
NY, PA, VA, WV) report employment data for the oil and gas extraction industry. New York
and Pennsylvania project large increases in employment in this sector, while the three other
states report more modest employment gains.
Figure 30 shows the employment data for a group of manufacturing industries (NAICS=31x) that
primarily produce finished consumer goods. The sector includes plants, factories, or mills that
produce finished products such as food, beverages, textiles, and apparel. Most states report a
decline in employment in this sector, with New York and Maine showing the largest declines.
Two states (DE, VT) show modest employment gains for this sector.
Figure 31 shows the employment data for a group of manufacturing industries (NAICS=32x) that
primarily transform raw materials into semi-finished products that are an inputs for an
establishment engaged in further manufacturing. The sector includes refineries, chemical plants,
factories, or mills that produce semi-finished goods such as wood products, paper, petroleum
products, chemicals, plastics and nonmetallic mineral products. Four states (ME, NJ, NY, WV)
report large employment declines for this sector.
Figure 32 shows the employment data for a group of manufacturing industries (NAICS=33x) that
primarily produce both semi-finished products that are an input for an establishment engaged in
further manufacturing as well as finished products ready for utilization or consumption. The
sector includes plants, factories, or mills that produce semi-finished goods such as metal
products and finished goods such as machinery, transportation equipment, appliances, and
furniture. There is no clear trend in this sector. Delaware projects an employment gain of 12
percent from 2010 to 2020, while West Virginia projects an employment loss of 11 percent. Half
of the remaining states project employment gains and half project employment losses.
Figure 33 shows the employment data for repair and maintenance (NAICS=811), which includes
automotive body, paint, and interior repair and maintenance. All jurisdictions except the District
of Columbia project employment increases for this sector.

Technical Support Document for the 2011 Northeastern U.S. Emission Inventory with projections to 2020 and 2023 GAMMA Version January, 2018
Page 57
Figure 28: Employment Projections for Crop Production (NAICS=111)
State 2010 Estimated Employment
2020 Estimated Employment
Net Change 2010-2020
Annualized Growth Rate (% per year)
Total Percentage Change
(%)
CT 3,469 3,958 489 1.3 14.1
DC 0 0 0 0.0 0.0
DE 2,460 2,400 -60 -0.2 -2.4
MA n/a n/a n/a n/a n/a
MD 2,525 3,005 480 1.8 19.0
ME 5,858 6,196 338 0.6 5.8
NC 8,300 6,760 -1,540 -2.0 -18.6
NH 2,994 3,159 165 0.5 5.5
NJ n/a n/a n/a n/a n/a
NY 16,660 15,530 -1,130 -0.7 -6.8
PA 40,770 41,300 530 0.1 1.3
RI 519 520 1 0.0 0.2
VA 54,211 50,044 -4,167 -0.8 -7.7
VT 541 575 34 0.6 6.3
WV 551 416 -135 -2.8 -24.5
Figure 29: Employment Projections for Oil & Gas Extraction (NAICS=211)
State 2010 Estimated Employment
2020 Estimated Employment
Net Change 2010-20
Annualized Growth Rate (% per year)
Total Percentage Change
(%)
CT 0 0 0 0.0 0.0
DC 0 0 0 0.0 0.0
DE 0 0 0 0.0 0.0
MA 0 0 0 0.0 0.0
MD 0 0 0 0.0 0.0
ME 179 202 23 1.2 12.8
NC 0 0 0 0.0 0.0
NH 0 0 0 0.0 0.0
NJ 0 0 0 0.0 0.0
NY 450 1,180 730 10.1 162.2
PA 3,810 7,030 3,220 6.3 84.5
RI 0 0 0 0.0 0.0
VA 446 512 66 1.4 14.8
VT 0 0 0 0.0 0.0
WV 2,260 2,482 222 0.9 9.8

Technical Support Document for the 2011 Northeastern U.S. Emission Inventory with projections to 2020 and 2023 GAMMA Version January, 2018
Page 58
Figure 30: Employment Projections for Manufacturing (NAICS=31x) Food, Beverage, Textiles, Apparel
State 2010 Estimated Employment
2020 Estimated Employment
Net Change 2010-2020
Annualized Growth Rate (% per year)
Total Percentage Change
(%)
CT 9,894 9,604 -290 -0.3 -2.9
DC n/a n/a n/a n/a n/a
DE 9,911 10,081 170 0.2 1.7
MA 36,616 36,048 -568 -0.2 -1.6
MD 21,651 20,271 -1,380 -0.7 -6.4
ME 10,290 8,997 -1,293 -1.3 -12.6
NC 111,010 104,730 -6,280 -0.6 -5.7
NH 5,123 4,822 -301 -0.6 -5.9
NJ 44,100 41,700 -2,400 -0.6 -5.4
NY 85,240 71,590 -13,650 -1.7 -16.0
PA 88,530 80,930 -7,600 -0.9 -8.6
RI 6,180 5,850 -330 -0.5 -5.3
VA 45,676 42,998 -2,678 -0.6 -5.9
VT 4,976 5,193 217 0.4 4.4
WV 4,061 3,755 -306 -0.8 -7.5
Figure 31: Employment Projections for Manufacturing (NAICS=32x) Wood, Paper, Petroleum, Chemicals, Plastics
State 2010 Estimated Employment
2020 Estimated Employment
Net Change 2010-20
Annualized Growth Rate (% per year)
Total Percentage Change
(%)
CT 31,188 31,474 286 0.1 0.9
DC n/a n/a n/a n/a n/a
DE 7,120 7,040 -80 -0.1 -1.1
MA 56,924 55,872 -1,052 -0.2 -1.8
MD 37,180 35,500 -1,680 -0.5 -4.5
ME 18,710 14,973 -3,737 -2.2 -20.0
NC 127,640 131,380 3,740 0.3 2.9
NH 13,938 14,382 444 0.3 3.2
NJ 131,100 116,700 -14,400 -1.2 -11.0
NY 125,630 105,720 -19,910 -1.7 -15.8
PA 178,320 173,970 -4,350 -0.2 -2.4
RI 9,213 9,930 717 0.8 7.8
VA 72,442 76,490 4,048 0.5 5.6
VT 7,272 7,610 338 0.5 4.6
WV 22,953 20,136 -2,817 -1.3 -12.3

Technical Support Document for the 2011 Northeastern U.S. Emission Inventory with projections to 2020 and 2023 GAMMA Version January, 2018
Page 59
Figure 32: Employment Projections for Manufacturing (NAICS=33x) Metals, Machinery, Electronics, Transportation Equipment, Furniture
State 2010 Estimated Employment
2020 Estimated Employment
Net Change 2010-2020
Annualized Growth Rate (% per year)
Total Percentage Change
(%)
CT 124,083 120,173 -3,910 -0.3 -3.2
DC n/a n/a n/a n/a n/a
DE 8,800 9,910 1,110 1.2 12.6
MA 157,685 136,287 -21,398 -1.4 -13.6
MD 52,026 48,456 -3,570 -0.7 -6.9
ME 21,658 20,017 -1,641 -0.8 -7.6
NC 192,740 197,640 4,900 0.3 2.5
NH 46,707 46,793 86 0.0 0.2
NJ 82,000 79,100 -2,900 -0.4 -3.5
NY 246,240 235,770 -10,470 -0.4 -4.3
PA 293,590 302,860 9,270 0.3 3.2
RI 24,454 24,870 416 0.2 1.7
VA 110,697 114,979 4,282 0.4 3.9
VT 18,124 17,829 -295 -0.2 -1.6
WV 21,399 19,078 -2,321 -1.1 -10.8
Figure 33: Employment Projections for Repair and Maintenance (NAICS=811) including Automobile Repair and Maintenance
State 2010 Estimated Employment
2020 Estimated Employment
Net Change 2010-20
Annualized Growth Rate (% per year)
Total Percentage Change
(%)
CT 13,342 14,508 1,166 0.8 8.7
DC 596 538 -58 -1.0 -9.7
DE 3,320 3,650 330 1.0 9.9
MA 24,462 24,826 364 0.1 1.5
MD 22,840 24,215 1,375 0.6 6.0
ME 4,779 4,918 139 0.3 2.9
NC 31,470 32,580 1,110 0.3 3.5
NH 6,225 6,680 455 0.7 7.3
NJ 32,100 35,500 3,400 1.0 10.6
NY 55,800 63,240 7,440 1.3 13.3
PA 48,470 54,090 5,620 1.1 11.6
RI 3,936 4,300 364 0.9 9.2
VA 32,064 41,212 9,148 2.5 28.5
VT 2,442 2,759 317 1.2 13.0
WV 7,149 7,442 293 0.4 4.1

Technical Support Document for the 2011 Northeastern U.S. Emission Inventory with projections to 2020 and 2023 GAMMA Version January, 2018
Page 60
3.3.2. Control Factors
Emission control factors for point and nonpoint sources were developed relative to a 2011 base
year emissions inventory. MARAMA obtained EPA’s NEI2011v6.2 modeling platform
EMF/CoST model control records and S/L/T agencies reviewed the EPA control packets and
provided guidance on adjustments needed and state rules not included in the packets. The EPA
packets were augmented with additional factors for the missing state-specific measures. In
addition some EPA control factors were modified in response to state requests. The following
sub-sections describe how controls were represented to reduce future emissions.
3.3.3. National Control Factors
Federal Control Measures included in the 2023 GAMMA projection inventory include:
Federal Oil and Gas NSPS
Federal RICE NSPS
Federal Natural Gas Turbines NSPS
Federal Process Heater NSPS
Federal Boiler MACT
Federal RICE NESHAP
Federal Consent Decrees and State Comments
3.3.3.1. USEPA NSPS Control Measures
New Source Performance Standard (NSPS) controls are only required for new sources. EPA
developed an equation that excludes existing sources and applies NSPS controls only to the
difference between the new and existing source emission rates. The equation can be used to
estimate the future year effect of all the relevant NSPS rules including oil and gas, RICE, Natural
Gas Turbines, and Process Heaters. This approach is described in the EPA 2011 Modeling
Platform TSD (EPA, 2016b). The USEPA inventory was predicated on AEO2014 growth
factors. As the MARAMA GAMMA inventory incorporated the more current AEO2015 growth
factors the EPA’s NEI2011v6.2 NSPS control efficiency equations were revised to reflect
AEO2015 growth. The resulting NSPS control factors vary by pollutant and SCC using the same
general methodology is described in the EPA 2011 Modeling Platform TSD Updates (EPA,
2016b).
3.3.3.2. Boiler Maximum Achieveable Control Technology (MACT) Rules
The Industrial/Commercial/Institutional Boilers and Process Heaters MACT Rule promulgates
national emission standards for the control of hazardous air pollutants (HAP) for new and
existing industrial, commercial, and institutional (ICI) boilers and process heaters at major HAPs
sources. The final rule was published in the Federal Register in January 2013 and requires
existing major sources to comply with the standards by January 2016. In addition, there is an
area source Boiler MACT rule that requires tune ups for smaller boilers. It is expected that many
boilers that burn coal or oil will be replaced by new natural gas boilers as a result of the rule.
The expected co-benefit for CAPs at these facilities is significant.
MARAMA coordinated a state review of EPA’s 2011v6.2 estimation of the effect of Boiler
MACT as described in the EPA 2011 Modeling Platform TSD (EPA, 2015b). EPA developed
control factors based on a study prepared by the OTC which relied on CIBO data that varied by
pollutant, SCC, and facility for both point and area sources. The CIBO work found that many

Technical Support Document for the 2011 Northeastern U.S. Emission Inventory with projections to 2020 and 2023 GAMMA Version January, 2018
Page 61
facilities will comply with the standard by replacing coal or oil fired boilers with new Natural
Gas fired boilers rather than installing controls. EPA applied reductions to applicable point
sources identified as subject to HAP regulations in the 2011NEIv2.
MARAMA separately analyzed the NEI to confirm that EPA had identified all boilers subject to
HAP regulations. Facility HAP emissions were summed and screened for the thresholds of 10
TPY of any one HAP or 25 TPY of total HAP. Additional boilers were identified in West
Virginia and added to the list.
States developed an alternate set of reduction factors based on both EPA 2011v6.2 and additional
data collected by New Jersey and North Carolina as described in more detail in Appendix DD.
For area sources, states uniformly applied reductions that were estimated to represent improved
energy efficiency resulting from a boiler tune up. For NJ and NY, the same reductions were
applied, but assigned to state specific rules that were in place and requiring boiler tune-ups prior
to the Boiler MACT. These reductions are shown in Figure 34. They were derived from the
North Carolina study and applied to the following SCCs:
2102001000, 2102002000, 2102004000, 2102004001, 2102005000, 2102006000,
2102007000, 2102008000, 2102011000, 2103001000, 2103002000, 2103004000,
2103004001, 2103005000, 2103006000, 2103007000, 2103008000, 2103011000
Some area source SCCs represent a combination of boiler and engine emissions. For these
SCCs, for all states except New Jersey, the reductions were cut in half to represent that only one
half of the emissions come from boilers. This ratio was selected as it is the default assumption
for these SCCs that was made for the engine:boiler ratio in NEI2011v2. New Jersey’s inventory
for this SCC code only includes boiler emissions, therefore the full reduction was applied to
these SCCs in New Jersey. The following are the combined boiler and engine SCCs in the
GAMMA inventory:
2102004000, 2102006000, 2103004000, 2103006000
For point sources, North Carolina, West Virginia and Connecticut preferred to apply reductions
similar to area sources, which reflected boiler tune ups (Figure 34). All other states preferred
application of the reductions shown in Figure 35. Reductions for Anthracite, Bituminous Coal,
Distillate and residual oil were based on EPA’s 2011v6.2. Reductions to natural gas and wood
burning sources were based on the North Carolina study. These reductions were applied to the
following SCCs:
10100501, 10200202, 10200204, 10200206, 10200401, 10200402, 10200501, 10200502,
10300501, 10500205
Figure 34: Boiler MACT Tune-up Percent Reductions
Effect of Boiler MACT on Affected Area Source SCCs –Impact of Tune Up Requirement
Anthracite
Coal Bituminous
Coal Distillate Residual Natural Gas Wood
NOx 4 4 4 4 NA 4
CO 34 34 6 6 NA 29
PM10 4 4 4 4 NA 4
PM2.5 4 4 4 4 NA 4

Technical Support Document for the 2011 Northeastern U.S. Emission Inventory with projections to 2020 and 2023 GAMMA Version January, 2018
Page 62
Effect of Boiler MACT on Affected Area Source SCCs –Impact of Tune Up Requirement
SO2 4 4 4 4 NA 4
VOC 34 34 6 6 NA 29
Figure 35: Boiler MACT Conversion Percent Reductions
Effect of Boiler MACT on Affected Point Source SCCs
Impact of widespread conversion of coal and oil burning sources to Natural Gas
Anthracite
Coal Bituminous
Coal Distillate Residual Natural Gas Wood
NOx 60.6 70.7 38.8 57.1 4 4
CO 98.9 98.9 99.9 99.9 4 29
PM10 72.2 95.99 68.4 92.4 4 4
PM2.5 72.2 95.99 68.4 92.4 4 4
SO2 73 97.4 99.9 97 4 4
VOC 98.9 98.9 99.9 99.9 4 29
3.3.3.3. RICE NESHAP Standards
EPA developed control factors for three rulemakings for National Emission Standards for
Hazardous Air Pollutants (NESHAP) for Reciprocating Internal Combustion Engines (RICE).
These rules reduce HAPs from existing and new RICE sources. In order to meet the standards,
existing sources with certain types of engines will need to install controls. In addition to reducing
HAPs, these controls have co-benefits that also reduce CAPs, specifically, CO, NOX, VOC, PM,
and SO2. The compliance dates passed in 2014 for all three rules; thus, reductions pertaining to
all three rules are included in the emissions projection.
We relied upon the EPA-developed RICE standards control factors that varied by pollutant and
SCC and are included in EPA’s 2011v6.2 estimates. The RICE control factors reflect the recent
(proposed January, 2012) Reconsideration Amendments, which results in significantly less
stringent NOX controls (fewer reductions) than the 2010 final rules. See the EPA 2011 Modeling
Platform TSD (EPA, 2015b) for additional information.
3.3.3.4. Consent Decrees and State Comments
EPA developed control factors that reflect the expected emission reductions agreed upon
between EPA (and the Department of Justice) and the affected companies. The following consent
decrees affected sources in the project study area:
EPA estimated reductions needed to achieve post-2008 emissions values from the Cross
State Air Pollution Rule (CSAPR) response to comments. These reductions reflect fuel
switching, cleaner fuels, and permit targets via specific information on control equipment
in the following states: New York (LaFarge Albany County), and Virginia (Virginia Tech,
GP Big Island).
EPA estimated the emission reductions from enforcement settlements with Lafarge
Company and St. Gobain Containers, Inc. These settlements are the first system-wide
settlements for these sectors under the Clean Air Act and require pollution control
upgrades, acceptance of enforceable emission limits, and payment of civil penalties. The

Technical Support Document for the 2011 Northeastern U.S. Emission Inventory with projections to 2020 and 2023 GAMMA Version January, 2018
Page 63
settlements require various NOx controls. Affected facilities are located in Massachusetts,
North Carolina, and Pennsylvania.
EPA estimated the NOx and SO2 emission reductions from an enforcement settlement
with the Holcim (US), Inc. cement plant in Maryland. The settlement specifies a NOx
reduction of 92 tons per year and an SO2 reduction of 230 tons per year.
EPA estimated the expected NOx and SO2 emission reductions associated with BART controls
(Best Available Retrofit Technology) in regional haze plans. These controls affect expected
emission reductions and future year caps for individual facilities in various industries (cement,
taconite, steel, pulp and paper, and mining). EPA included two facilities in the project study area:
Lehigh Northeast Cement in New York and Meadwestvaco Packaging in Covington, Virginia.
EPA provided the estimated compliance dates and control efficiencies by pollutant, SCC, and
facility.
3.3.4. OTC and MANE-VU Control Measures
For the past 20 years, the Ozone Transport Commission (OTC) has identified strategies to
achieve cost-effective reductions of ozone-forming pollutants. Similarly, the Mid-
Atlantic/Northeast Visibility Union (MANE-VU) coordinated the development of emission
management strategies to assure reasonable progress toward remedying any existing impairment
of visibility and preventing future impairment. Each S/L/T agency can pursue rulemakings or
other methods to implement the OTC/MANE-VU recommended emission reductions, emission
rates or emission control technologies as appropriate and necessary.
Individual states are in various stages of adopting the OTC/MANE-VU recommendations into
the rules and SIPs. We reviewed the OTC’s status reports to identify each state’s adoption status
(see Appendices O, P, and Q). To obtain further clarification about each state’s status with
respect to the OTC/MANE-VU measures, we polled the states to determine whether they have
adopted a rule that would achieve reductions equivalent to the OTC/MANE-VU
recommendation. We obtained information on the effective date of the rule, determined if credit
for each rule was reflected in the 2011 inventory and what additional post-2011 reductions are
expected. Appendix R contains each state’s recommendations for accounting for each OTC
control measure recommendation. The following subsections discuss the control measures with
post-2011 effective dates.
3.3.4.1. State NOx Rules and Control Requirements
The OTC developed NOx control measures for industrial, commercial, and institutional (ICI)
boilers and distributed generation units in 2001. We reviewed the OTC’s status reports and state
feedback to identify each state’s status in adopting this recommendation. Most states have rules
in place with compliance dates in 2007 or earlier. As a result, we concluded that the emission
reductions are already reflected in the 2011 inventory and no post- 2011 reductions were applied.
In 2006, the OTC introduced new or more stringent requirements for several NOx source
categories (asphalt production plants, cement kilns, glass/fiberglass furnaces, and ICI boilers).
The OTC recommendations during 2009 to 2014 did not include any measures affecting NOx
emissions from nonEGU point sources. Several states have adopted rules reflecting the

Technical Support Document for the 2011 Northeastern U.S. Emission Inventory with projections to 2020 and 2023 GAMMA Version January, 2018
Page 64
recommendations of the OTC with compliance dates after 2011. We developed control factors
for the following state rules affecting point sources with post-2011 compliance dates:
Delaware identified that the Delaware City refinery is subject to an enforceable emission
cap for NOx. Delaware estimated that a 23% reduction in NOx emissions beginning in
2016.
Maine provided comments to EPA that identified facility-wide NOx reductions at three
facilities: McCain Foods Easton, FLP Energy Wyman LLC, and Bath Iron Works Bath
Facility.
New Jersey adopted a rule limiting the NOx emissions from glass furnaces. New Jersey
identified the affected units and estimated a 45% reduction in NOx emissions effective in
2012.
New Jersey’s boiler rule with post 2011 effective dates was incorporated into the
inventory. (See Appendix R)
Pennsylvania’s estimates of the RACT II NOx reductions expected beginning in 2017
from cement kilns, glass melting, and natural gas transmission were incorporated into the
inventory.
Virginia provided comments to EPA that identified facility-wide NOx reductions at three
facilities: GP Big Island, Honeywell Hopewell, and Invista Waynesboro.
The percent reductions shown above were either provided directly by the individual state agency
or obtained from the OTC Control Measures TSD (OTC, 2007).
3.3.4.2. State VOC Rules and Control Requirements
The OTC developed VOC control measures for point and non-point sources that were adopted
via rulemaking in the following states with compliance dates after 2011.
The Point source percent reductions shown above were either provided directly by the individual
state agency or obtained from the OTC Control Measures TSD (OTC, 2007).
Point source VOC content limits and other restrictions on adhesives and sealants used
in industrial and commercial settings.
o Massachusetts adopted a rule limiting the VOC content of adhesives and sealants. The
rule affects SCC 2440020000, has a compliance date of May 1, 2016 and is expected to
result in a 64% reduction in VOC emissions.
o Pennsylvania adopted a rule limiting the VOC content of adhesives and sealants. The
rule has a compliance date of January 1, 2012 and is expected to result in a 64%
reduction in VOC emissions for SCC 2440020000.
o Virginia revised a rule limiting the VOC content of adhesives and sealants to expand
coverage to the Richmond VOC Control Area with an effective date of March 1, 2014.
Previously these rules only applied to the northern Virginia counties that are part of the
Ozone Transport Region. This rule is expected to result in a 64% VOC emissions
reduction for SCC 2440020000.

Technical Support Document for the 2011 Northeastern U.S. Emission Inventory with projections to 2020 and 2023 GAMMA Version January, 2018
Page 65
Control of high vapor pressure VOCs, such as gasoline and crude oil, stored in large
aboveground stationary storage tanks, which are typically located at refineries, terminals
and pipeline breakout stations.
o New Jersey adopted a rule requiring additional controls on petroleum storage tanks.
New Jersey identified the affected SCCs and estimated the VOC percent reduction for
individual years between 2012 and 2020. VOC emissions reduction in 2023 is
expected to be 7.7% based on the January 1, 2020 compliance date.
Nonpoint VOC - MARAMA developed control factors for the following state rules with post-
2011 compliance dates: Several states have adopted rules reflecting the recommendations of the
OTC with compliance dates after 2011 which affect nonpoint sources. MARAMA developed
control factors for the following state rules with post-2011 compliance dates:
Connecticut adopted rules restricting emissions from architectural and industrial
maintenance coatings and consumer products with expected 28% and 13% VOC
reductions, respectively. The rules are effective beginning in 2018 and impact SCCs
2401002000, 2401003000, 2401008000, 2401100000, 2401200000, 2460000000.
Delaware’s auto refinishing rule is expected to result in a 90% reduction in VOCs from
the nonpoint auto refinishing sector beginning in 2012 for the following SCCs:
2401005000, 2401005500, 2401005600, 2401005700, 2401005800.
Maryland adopted rules in 2016 restricting emissions from architectural and industrial
maintenance coatings, vehicle refinishing, metal parts coating, and lithographic printing
that are all in effect for the 2023 inventory. The affected SCCs are: 2401002000,
2401003000, 2401100000, 2401200000, 2401008000, 2401005000, 2425010000,
2401065000, 2401085000, 2401080000.
New Hampshire adopted a rule with enhanced limitations on the VOC content of
consumer products affecting SCC 2460000000.
Virginia revised rules addressing architectural and industrial maintenance coatings,
consumer products, motor vehicle and mobile equipment coatings/solvents to expand
coverage to the Richmond VOC Control Area with an effective date of March 1, 2014.
Previously these rules only applied to the northern Virginia counties that are part of the
Ozone Transport Region. This rule affects the following SCCs: 2401001000,
2401002000, 2401003000, 2401005000, 2401005500, 2401005600, 2401005700,
2401005800, 2460000000, 2460100000, 2460200000, 2460400000, 2460500000,
2460600000, 2460800000, 2460900000.
3.3.4.3. State Fuel Oil Sulfur Rules
MANE-VU developed a low sulfur fuel oil strategy to help states achieve goals to reduce
Regional Haze. Lower sulfur fuel affects not only SO2 emissions, but also has co-benefits for
other pollutants including NOX. In past inventories, only the effect on SO2 was included.
Sulfur reductions. For this GAMMA inventory, state-specific SO2 control factors were
developed for distillate, residual, #4 fuel oil, and kerosene, and NOx control factors were
developed for distillate oil and kerosene; for Delaware reductions were also taken for PM2.5 and
PM10. The base and final sulfur in fuel oil varies by state, type of fuel oil, and year of
implementation. Sulfur reductions were based on a mass ratio of fuel sulfur comparing each
state’s base and controlled sulfur content in their rule. In many cases, sulfur reduction rules are
implemented in two phases. In most states the baseline sulfur content was 3000 ppm for

Technical Support Document for the 2011 Northeastern U.S. Emission Inventory with projections to 2020 and 2023 GAMMA Version January, 2018
Page 66
distillate oil, and 2.25% for residual and #4 oil. However, many states had lower baseline sulfur
contents for residual oil, which varied by state and county. We used state- or county-specific
baseline residual oil sulfur contents to calculate a state- or county-specific control factors for
residual oil. See Appendix S for the specific reductions by state/county and fuel type.
NOX reductions. When lower sulfur fuel is burned, NOX emissions are also lower. NOX
reduction estimates are based on studies of NOX emissions performed burning fuels with
different sulfur contents in both boilers and engines. Reductions range from 22% when burning
Ultra Low Sulfur fuel (ULSF) (15 ppm) in boilers to 1% when burning ULSF in engines.
Development of the NOX reduction factors are described in detail in a technical memorandum
provided by New York DEC (NY DEC, 2016).
We polled states regarding the status of state rules implementing the low sulfur fuel oil strategy
and reviewed state rules to determine enforceable sulfur limits and compliance dates. Figure
36shows the status for each jurisdiction’s rule development.
Figure 36: Status of State Fuel Oil Sulfur Rules (as of April 2016)
State Reference
CT Section 22a-174-19a. Control of sulfur dioxide emissions from power plants and other large stationary sources of air pollution: Distillate and Residual: 3000 ppm effective April 15, 2014. Section 22a – 174 - 19b. Fuel Sulfur Content Limitations for Stationary Sources (except for sources subject to Section 22a-174-19a). Distillate: 500 ppm effective July 1, 2014; 15 ppm effective July 1, 2018 Residual: 1.0% effective July 1, 2014; 0.3% effective July 1, 2018 Connecticut General Statute 16a-21a. Sulfur content of home heating oil and off-road diesel fuel. Number 2 heating oil and off-road diesel fuel: 500 ppm effective July 1, 2014; 15 ppm effective July 1, 2018
DC No rule in place
DE 1108 Sulfur Dioxide Emissions from Fuel Burning Equipment Distillate: 15 ppm effective July 1, 2016 Residual: 0.5% effective July 1, 2016 Any other fuel: 1.0% effective July 1, 2016
MA 310 CMR 7.05 (1)(a)1: Table 1 : Sulfur Content Limit of Liquid Fossil Fuel Distillate: 500 ppm effective July 1, 2014; 15 ppm effective July 1, 2018 Residual: 1.0% effective July 1, 2014; 0.5% effective July 1, 2018
MD No rule in place
ME Chapter l06: Low Sulfur Fuel Distillate: 15 ppm effective July 1, 2018 Residual: 0.5% effective July 1, 2018
NC No rule in place
NH No rule in place
NJ Title 7, Chapter 27, Subchapter 9 Sulfur in Fuels Distillate: 500 ppm effective July 1, 2014; 15 ppm effective July 1, 2016 Residual: 0.5% or 0.3%, depending on county, effective July 1, 2014 #4 Oil: 0.25% effective July 1, 2014
NY Subpart 225-1 Fuel Composition and Use - Sulfur Limitations Distillate: 15 ppm effective July 1, 2016 Residual: 0.3% in New York City effective July 1, 2014; 0.37% in Nassau, Rockland and Westchester counties effective July 1, 2014; 0.5% remainder of state effective July 1, 2016
PA § 123.22. Combustion units Distillate: 500 ppm effective July 1, 2016 (Philadelphia 15 ppm effective July 1, 2015) Residual: 0.5% effective July 1, 2016 (Philadelphia effective July 1, 2015)

Technical Support Document for the 2011 Northeastern U.S. Emission Inventory with projections to 2020 and 2023 GAMMA Version January, 2018
Page 67
State Reference
#4 Oil: 0.25% effective July 1, 2016 (Philadelphia effective July 1, 2015)
RI Air Pollution Control Regulations No. 8 Sulfur Content of Fuels Distillate: 500 ppm effective July 1, 2014; 15 ppm effective July 1, 2018 Residual: 0.5% effective July 1, 2018
VA No rule in place
VT 5-221(1) Sulfur Limitations in Fuel Distillate: 500 ppm effective July 1, 2014; 15 ppm effective July 1, 2018 Residual: 0.5% effective July 1, 2018 #4 Oil: 0.25% effective July 1, 2018
WV No rule in place
The MANE-VU low sulfur fuel oil rule applies to the following nonpoint source SCC codes:
21-02-004-000 – Industrial/Distillate Oil/Total: Boilers and Engines
21-02-004-001 – Industrial/Distillate Oil/Boilers
21-02-004-002 – Industrial/Distillate Oil/Engines
21-02-005-000 – Industrial/Residual Oil/Total: All Boiler Types
21-02-011-000 – Industrial/Kerosene/Total: All Boiler Types
21-03-004-000 – Commercial&Institutional/Distillate Oil/Total: Boilers and Engines
21-03-004-001 – Commerical&Institutional/Distillate Oil/Boilers
21-03-004-002 – Commerical&Institutional/Distillate Oil/Engines
21-03-005-000 – Commercial&Institutional/Residual Oil/Total: All Boiler Types
21-03-011-000 – Commercial&Institutional/Kerosene/Total: All Combustor Types
21-04-004-000 – Residential/Distillate Oil/Total: All Combustor Types
21-04-011-000 – Residential/Kerosene/Total: All Heater Types
Since the NOx reductions associated with ultra-low sulfur fuel oil are different for boilers and
engines, it was necessary to determine the split of emissions in the combined boiler/engine
categories in order to properly account for the anticipated emission reductions. Based on how the
NEI2011 was developed, it was determined that the emissions for the combined SCCs were
evenly split between boilers and engines. Thus, those states reporting using the combined
boiler/engine SCCs were assigned only one-half of the NOx reductions with two exceptions: NJ
and NY both specified that the emissions for the combined boiler/engine SCCs in their states
were entirely attributable to boilers, and thus those states were assigned the full NOx reductions.
The rule does not include any NOx reductions for residual oil (SCCs 21-02-005-000 and
21-03-005-000.
3.3.4.1. Portable Fuel Container Rules
Many states have adopted the OTC model rule limiting VOC emissions from portable fuel
containers. These state-specific rules have different compliance dates depending on when the
state completed its rulemaking. The remaining states are relying on federal requirements that
became effective on January 1, 2009. Both the state and federal rules apply to new containers,
and thus the anticipated reductions depend on the turnover of older non-compliant containers to
new, lower-emitting containers. The emission reduction calculations assume a 10-year turnover
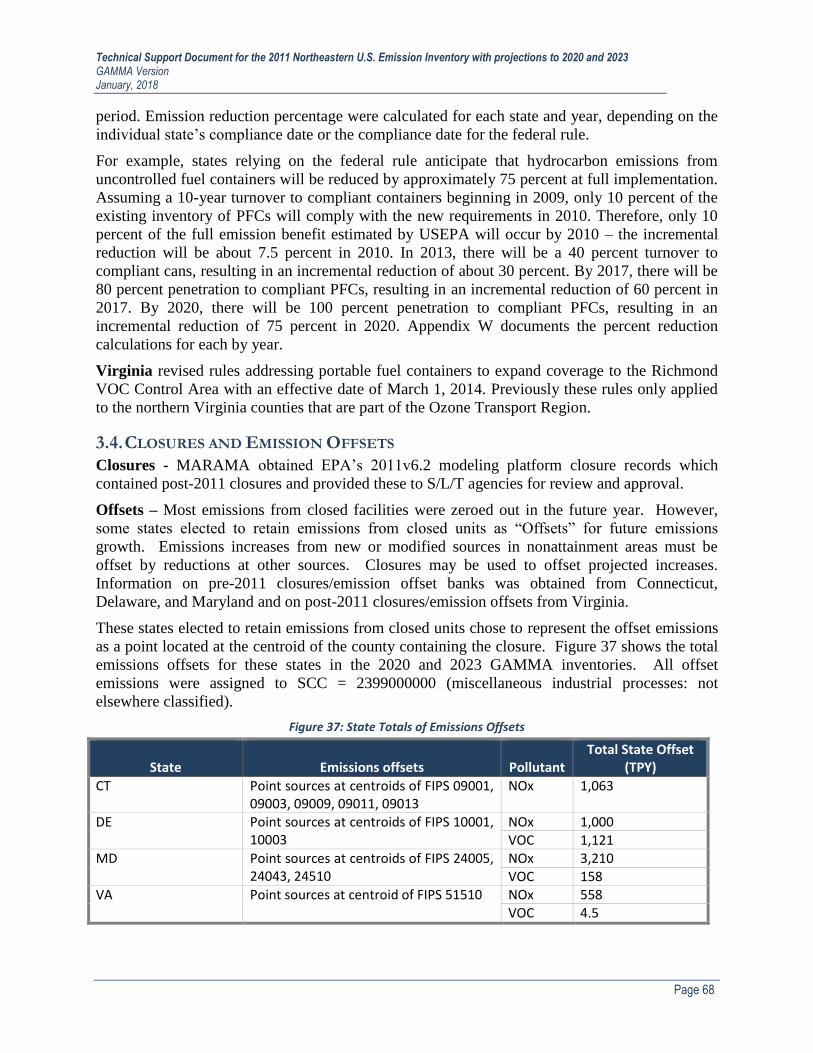
Technical Support Document for the 2011 Northeastern U.S. Emission Inventory with projections to 2020 and 2023 GAMMA Version January, 2018
Page 68
period. Emission reduction percentage were calculated for each state and year, depending on the
individual state’s compliance date or the compliance date for the federal rule.
For example, states relying on the federal rule anticipate that hydrocarbon emissions from
uncontrolled fuel containers will be reduced by approximately 75 percent at full implementation.
Assuming a 10-year turnover to compliant containers beginning in 2009, only 10 percent of the
existing inventory of PFCs will comply with the new requirements in 2010. Therefore, only 10
percent of the full emission benefit estimated by USEPA will occur by 2010 – the incremental
reduction will be about 7.5 percent in 2010. In 2013, there will be a 40 percent turnover to
compliant cans, resulting in an incremental reduction of about 30 percent. By 2017, there will be
80 percent penetration to compliant PFCs, resulting in an incremental reduction of 60 percent in
2017. By 2020, there will be 100 percent penetration to compliant PFCs, resulting in an
incremental reduction of 75 percent in 2020. Appendix W documents the percent reduction
calculations for each by year.
Virginia revised rules addressing portable fuel containers to expand coverage to the Richmond
VOC Control Area with an effective date of March 1, 2014. Previously these rules only applied
to the northern Virginia counties that are part of the Ozone Transport Region.
3.4. CLOSURES AND EMISSION OFFSETS
Closures - MARAMA obtained EPA’s 2011v6.2 modeling platform closure records which
contained post-2011 closures and provided these to S/L/T agencies for review and approval.
Offsets – Most emissions from closed facilities were zeroed out in the future year. However,
some states elected to retain emissions from closed units as “Offsets” for future emissions
growth. Emissions increases from new or modified sources in nonattainment areas must be
offset by reductions at other sources. Closures may be used to offset projected increases.
Information on pre-2011 closures/emission offset banks was obtained from Connecticut,
Delaware, and Maryland and on post-2011 closures/emission offsets from Virginia.
These states elected to retain emissions from closed units chose to represent the offset emissions
as a point located at the centroid of the county containing the closure. Figure 37 shows the total
emissions offsets for these states in the 2020 and 2023 GAMMA inventories. All offset
emissions were assigned to SCC = 2399000000 (miscellaneous industrial processes: not
elsewhere classified).
Figure 37: State Totals of Emissions Offsets
State
Emissions offsets
Pollutant
Total State Offset (TPY)
CT Point sources at centroids of FIPS 09001, 09003, 09009, 09011, 09013
NOx 1,063
DE Point sources at centroids of FIPS 10001, 10003
NOx 1,000 VOC 1,121
MD Point sources at centroids of FIPS 24005, 24043, 24510
NOx 3,210 VOC 158
VA Point sources at centroid of FIPS 51510 NOx 558 VOC 4.5

Technical Support Document for the 2011 Northeastern U.S. Emission Inventory with projections to 2020 and 2023 GAMMA Version January, 2018
Page 69
3.5. GROWTH FACTOR SPREADSHEETS AND EMF PACKETS
Four projection spreadsheets were developed for point source subgroups (except ERTAC EGU):
Point source oil & gas sources: this file contains specific sources in the point source
oil and gas sector that extracted from the overall point sources based on specific NAICS
codes representing the oil & gas extraction, transportation and distribution industries.
Aircraft engines, APU and GSE: this file contains airport specific projection factors
for aircraft engines, APU, and GSE; the FAA projection factors contained in this file are
discussed later in this document.
“Small EGUs”: this file contains a number of small sources, many of which generate a
small amount of power for the grid that were included in EPA’s IPM modeling but are
not found in either ERTAC EGU or non-EGU point files. Examples of sources
included landfill gas fired engines and cogeneration facilities located at industrial
plants.
Non-ERTAC EGU point sources: this file contains all other point sources not
included in the ERTAC EGU file, the point oil & gas file, the aircraft and support
equipment file, and the “small EGU” file.
Each spreadsheet contains four tabs as described in elsewhere in this document. Instructions for
using the spreadsheet are contained in the “Methodology” tab. The “Growth Raw Data” tab
contains the AEO and employment data described in the previous section. The “NEI to Growth
Factor XWALK” tab is a list of facilities or emission processes that were initially obtained from
the NEI2011v2. For states that chose to project all emission processes at a given facility using a
single growth code (NAICS employment), there is only one record per facility. Where states
chose to project emissions by individual emission process there is one record for each emission
process at the facility.
To facilitate state review of the growth factors, user-friendly spreadsheets were developed that
provide the surrogate growth parameters, match the growth parameters to inventory records, and
configure the growth factors into the required EMF format. The spreadsheets allow the user to
create a projection packet for any combination of base year and future year for the 2007 to 2040
period. See Section 3.1 of this TSD for a description of the spreadsheet format.
For nonpoint sources, the following projection spreadsheets were developed:
Agriculture – contains projection factors for ammonia emissions from livestock and fertilizer
application
Fugitive dust – contains projection factors for paved and unpaved roads, mining and
quarrying operations, agricultural tilling, and construction activities
Nonpoint refueling – contains projection factors for nonpoint Stage I fuel unloading
Nonpoint oil and gas processes – contains projection factors for nonpoint oil and gas
exploration and production activities
Portable fuel containers – contains projection factors for residential and commercial portable
fuel containers
Residential wood combustion – contains projection factors for wood stoves, pellet stoves,
fireplaces, and outdoor wood boilers

Technical Support Document for the 2011 Northeastern U.S. Emission Inventory with projections to 2020 and 2023 GAMMA Version January, 2018
Page 70
Other nonpoint sources – contains projection factors for all other nonpoint categories not
mentioned above
3.6. POINT SOURCE SECTOR PROJECTION
This section describes the approach taken to project point sources other than EGUs. For all
points sources in the 15 northeast states, unless indicated below, base year emissions were
projected to both 2020 and 2023 using the MARAMA Beta2 Growth/Control/Closure files
developed in August 2016 as described in this document.
3.6.1. State Preferences
S/L/T agencies were provided the choice of using (1) the AEO energy projections for fuel
burning sources and employment projections for process sources, (2) only employment
projections for all nonERTAC EGU point sources, or (3) using a no growth projection.
Some of the growth factors used to project emissions for non-EGU sources show declining
trends. For example, AEO projects negative growth for many fuel consumption sectors.
Similarly, the employment projections show declines in the predicted number of employees for
many sectors of the economy. This is particularly true for manufacturing, which is of interest
because this sector is often associated with higher emissions than those for other sectors. By
contrast, the employment projections show increasing trends in retail and service-related sectors.
However, these sectors are not typically associated with significant emissions.
Predicted declines in fuel use and employment resulted in growth factors less than unity (i.e.,
represent negative growth) for many non-EGU point source categories. Consequently, for some
categories, emissions will be projected to be lower in future years compared to the base year,
even before the application of emission control programs. The MARAMA emissions inventory
workgroup was polled as to whether or not they felt that the negative growth factors were
realistic for their state. Some state representatives mentioned that they have observed historic
state-specific data that supports the negative trends. Other representatives mentioned that they
feel comfortable with the negative growth factors and do not have a technical basis to change
them or suggest others. Still other states recommended a conservative approach for addressing
negative growth by setting a minimum growth rate of 1 (no growth). This also addresses states
that have an emission offset program and therefore any emission decreases in the point source
inventory have the potential to be sold. As a result of these discussions, each state provided
guidance on how to handle projections when negative growth is indicated.
Some of the growth factors used to project emissions for non-EGU sources showed very large
increasing trends. S/L/T agencies were polled to determine whether factors with large positive
growth should be capped so that unrealistically high growth would not occur. Initially, we
established a cumulative growth cap of +25% over the 2011 to 2017 period S/L/T agencies
reviewed the growth factors that exceeded the +25% cap and provided their recommendations
for adjusting the cap. In nearly all cases, the S/L/T agencies agreed that the +25% growth factor
cap was appropriate.
Figure 38 summarizes the state recommendations for the growth factors to use for the
nonERTAC point source sector. Appendix N contains further details on each state’s
recommendation.

Technical Support Document for the 2011 Northeastern U.S. Emission Inventory with projections to 2020 and 2023 GAMMA Version January, 2018
Page 71
Figure 38: State Preferences for nonERTAC Point Source Growth Factors
State AEO 2015 Energy Projections Employment Projections
CT Do not use AEO energy projections, use employment for all processes
Use employment projections for all SCCs for positive growth; use no growth when employment growth is negative
CT Flat line growth for MWC and landfill sources with NAICS codes of 562 and 924.
DC Use AEO projections for Fuel Burning SCCs; use no growth when AEO growth is negative
Use employment projections for Process SCCs; use no growth when employment growth is negative
DE Use AEO projections for Fuel Burning SCCs; use no growth when AEO growth is negative
Use employment projections for Process SCCs; use no growth when employment growth is negative
MA Use AEO projections for Fuel Burning SCCs; use no growth when AEO growth is negative
Use employment projections for Process SCCs; use no growth when employment growth is negative
MD Do not use AEO energy projections, use employment for all processes
Use employment projections for all SCCs for positive growth; use no growth when employment growth is negative
ME Use AEO projections for Fuel Burning SCCs; use no growth when AEO growth is negative
Use employment projections for Process SCCs; use no growth when employment growth is negative
NC Do not use AEO energy projections, use employment for all processes
Use employment projections for all SCCs for positive growth; use no growth when employment growth is negative; use no-growth for small sources included in NEI2011v2 that were not in NEI2011v1
NH Use AEO projections for Fuel Burning SCCs; use no growth when AEO growth is negative
Use employment projections for Process SCCs; use no growth when employment growth is negative
NJ Do not use AEO energy projections, use employment for all processes
Use employment projections for all SCCs for positive growth; use no growth when employment growth is negative
NY Use AEO projections for Fuel Burning SCCs; use no growth when AEO growth is negative
Use employment projections for Process SCCs; use no growth when employment growth is negative
PA Use AEO projections for Fuel Burning SCCs; use no growth when AEO growth is negative
Use employment projections for Process SCCs; use no growth when employment growth is negative
RI Use AEO projections for Fuel Burning SCCs; use no growth when AEO growth is negative
Use employment projections for Process SCCs; use no growth when employment growth is negative
VA Use AEO projections for Fuel Burning SCCs; use no growth when AEO growth is negative
Use employment projections for Process SCCs; use no growth when employment growth is negative
VT Use AEO projections for Fuel Burning SCCs; use no growth when AEO growth is negative
Use employment projections for Process SCCs; use no growth when employment growth is negative
WV Use no growth for all nonERTAC point sources Use no growth for all nonERTAC point sources
3.6.2. Other Point Sources
For each projection the following approach was taken:
2020 - Point Non-IPM
o For the 15 northeast states, MARAMA projected and controlled 2011 using
Gamma factors within the EMF tool.
o For other states in the modeling domain, MARAMA interpolated EPA growth
factors and NSPS controls between 2017 and 2023. For closures and remaining
controls MARAMA applied the EPA v6.3 ‘ek’, or ‘en’ (where updated)
closure/control.

Technical Support Document for the 2011 Northeastern U.S. Emission Inventory with projections to 2020 and 2023 GAMMA Version January, 2018
Page 72
2023 - Point Non-IPM
o For the 15 northeast states, MARAMA projected and controlled 2011 using
Gamma factors within the EMF tool.
o For other states in the modeling domain, MARAMA applied EPA v6.3 ‘en’
closure/control (including NSPS controls).
2020 - Refueling
o For all states New York DEC interpolated gridded emissions between 2017 and
2023.
2023 - Refueling
o MARAMA used EPA 2023 v6.3 (‘el’) for all states.
3.6.3. Small EGUs Points
Since this sector is unique to the MARAMA inventory, no EPA factors are available. Therefore,
MARAMA developed and applied typical factors based on similar SCCs in the MARAMA
inventory to other states in the modeling domain. For SCCs that are not represented elsewhere in
the MARAMA inventory, "No Growth" is assumed. Specifically, for each projection:
2020 – For the 15 northeast states, MARAMA projected and controlled EPA v6.2 ‘eh’
using Gamma factors within the EMF tool. For other states in the modeling domain,
MARAMA created and applied typical growth factors and applied EPA v6.3 ‘ek’ (or ‘en’
where updated) closure/control. For NSPS controls that apply only to new emissions, an
interpolation of controls between 2017 and 2023 was necessary.
2023 – For the 15 northeast states, MARAMA projected and controlled EPA v6.2 ‘eh’
using Gamma factors within the EMF tool. For other states in the modeling domain,
MARAMA created and applied typical growth factors and applied EPA v6.3 ‘ek’ (or ‘en’
where updated) closure/control (including NSPS controls).
3.6.4. Point On-Shore Oil & Gas Production Facilities
For the MARAMA GAMMA inventory the following was used to project 2011:
2020
o For DE, DC, MD, NJ, NC, PA, VA, WV projected and controlled using Gamma
factors within the EMF tool.
o For CT, ME, MA, NH, NY, RI, VT and other states in the Modeling Domain
MARAMA applied EPA v6.3 ‘ek’,‘en’ closure/control. Interpolated 2017/2023
growth and NSPS control factors within the EMF tool.
2023 – MARAMA used the EPA v6.3 ‘en’ for all states.
Note that not all states have Oil and Gas Sources including DE and DC.
See the EPA 2011 Modeling Platform TSD (EPA, 2017) for additional documentation of the on-
shore oil and gas production point source inventory.
Technical Support Document for the 2011 Northeastern U.S. Emission Inventory with projections to 2020 and 2023 GAMMA Version January, 2018
Page 73
3.6.5. Offshore Oil & Gas Drilling Platforms
For the MARAMA GAMMA inventory the following was used project 2011:
2020 – New York DEC interpolated between the final 2017 and 2023 gridded emission
files to obtain 2020.
2023 - EPA v6.3 ‘el’
3.6.6. Ethanol Production Facilities
For the MARAMA GAMMA inventory the following was used project 2011:
2020 – New York DEC interpolated between the final 2017 and 2023 gridded emission
files to obtain 2020.
2023 - EPA v6.3 ‘el’.
3.6.7. Stand-Alone Inventories
Stand-alone future year inventories contain units that did not exist in 2011 but that EPA
projected to be necessary to cover increased future year production. These inventories include
biodiesel plants, cellulosic plants, and new cement plants. See the EPA 2011 Modeling Platform
TSD Updates (EPA, 2016b).
For 2020 and 2023 GAMMA, the EPA files were included without change for states outside the
15 states covered by this inventory. The EPA stand-alone point source biodiesel file is the only
stand-alone inventory that includes sources in states covered by this inventory. The sources from
these states (Connecticut, Massachusetts, New Jersey, New York, North Carolina, Pennsylvania,
Rhode Island and Virginia) were included without change from the EPA file; emissions from
these sources are minor. EPA used 2018 for 2023.
Delaware and West Virginia provided MARAMA with a list of sources that began operating
between 2012 and 2017; these sources are also included as stand-alone inventories in 2020 and
2023 GAMMA.
3.7. NON-POINT SECTOR PROJECTION
3.7.1.1. State Preferences
As discussed elsewhere in this TSD, some factors used to project emissions for nonpoint sources
show declining trends. For example, AEO projects negative growth for many fuel consumption
sectors. Similarly, the employment projections show declines in the predicted number of
employees for many sectors of the economy. Each state provided guidance on how to handle
projections when negative growth is indicated.
Delaware and Maryland chose to set a minimum growth rate of 1 (no growth) for
nonpoint sources when the chosen growth indicator was estimating negative growth.
New Jersey provided specific growth factor guidance for each category based on state
specific data, caps or no growth on negative growth, and no growth on certain
employment categories where the employment activity was not a specific indicator of the
actual emissions. New Jersey also specified no growth in employment categories after
2020.
All other states accepted the estimated projection data as is and made no adjustments for
negative growth.
Technical Support Document for the 2011 Northeastern U.S. Emission Inventory with projections to 2020 and 2023 GAMMA Version January, 2018
Page 74
3.7.1.2. Reentrained Road Dust
Vehicle miles traveled (VMT) projection data are used as the factor for projecting emissions
from re-entrained road dust from travel on paved roads (SCC 22-94-000-000). A few states (CT,
DC, MA, NH, NJ, VT, VA) provided VMT projections by county. For states that were unable to
provide state-specific VMT, we used national VMT projections from AEO2015.
For each projection the following approach was taken:
2020
o For the 15 northeast states, MARAMA projected and controlled 2011 using
Gamma factors within the EMF tool.
o For other states in the modeling domain, New York DEC interpolated gridded
emissions between 2017 and 2023.
2023
o Because EPA had incorporated the MARAMA growth/control/closure factors for
northeast states MARAMA was able to use the EPA v6.3 files unchanged for all
states.
3.7.1.3. Agricultural Fertilizer and Livestock Waste
MARAMA used EPA’s 2011 v6.2 approach to develop projection factors for agricultural
activities including fertilizer and pesticide application, agricultural tilling/harvesting, and
livestock waste processing. Since EPA developed projection factors only for 2017, we developed
projection factors for all remaining years via interpolation or extrapolation. See the EPA 2011
v6.2 TSD (EPA, 2015b) for additional information.
For each projection the following approach was taken:
2020
o For the 15 northeast states, MARAMA projected and controlled 2011 using
Gamma factors within the EMF tool.
o For other states in the modeling domain, New York DEC interpolated gridded
emissions between 2017 and 2023.
2023
o Because EPA had incorporated the MARAMA growth/control/closure factors for
northeast states MARAMA was able to use the EPA v6.3 files unchanged for all
states.
3.7.1.4. Residential Wood Combustion
MARAMA used EPA’s 2011 v6.2 approach to develop projection factors for residential wood
combustion (RWC) activities. See the EPA 2011 v6.2 TSD (EPA, 2015b) for details of the
methodology. EPA included reductions to account for the recently promulgated national New
Source Performance Standards (NSPS) for wood stoves. This is a change from the earlier EPA
2011 v6.0 platform, as the NSPS was finalized since completion of that inventory. EPA
projected emissions to the year 2017 and 2025 based on expected increases and decreases in
various residential wood burning appliances. As newer, cleaner woodstoves replace some older,
higher-polluting wood stoves, there will be an overall reduction of the emissions from older
“dirty” stoves but an overall increase in total RWC due to population and sales trends in all other

Technical Support Document for the 2011 Northeastern U.S. Emission Inventory with projections to 2020 and 2023 GAMMA Version January, 2018
Page 75
types of wood burning devices such as indoor furnaces and outdoor hydronic heaters. More
details on the EPA approach can be found in the EPA 2011 v6.2 TSD (EPA2015b). The EPA
platform provides a combined emissions projection factor that accounts for both activity change
as well as emission reductions due to the NSPS. Since EPA developed projection factors only
for 2017 and 2025, we developed projection factors for all remaining years via interpolation or
extrapolation.
For each projection the following approach was taken:
2020
o For the 15 northeast states, MARAMA projected and controlled 2011 using
Gamma factors within the EMF tool.
o For other states in the modeling domain, New York DEC interpolated gridded
emissions between 2017 and 2023.
2023
o Because EPA had incorporated the MARAMA growth/control/closure factors for
northeast states MARAMA was able to use the EPA v6.3 files unchanged for all
states.
3.7.1.5. Oil and Gas Production
Area source oil and gas production projection factors were developed for DE, DC, MD, NJ, NC,
PA, VA, and WV based on AEO2015 Northeast regional oil, gas and coalbed methane growth
projections (see Appendices T and U). These factors were applied to base year emissions with
the following exceptions: Pennsylvania factors were developed based on AEO2016 growth
projections and no growth was applied to Pennsylvania SCCs related to Oil and Gas well
development including the following SCCs:
2310000220 – Oil & Gas Expl & Prod /All Processes /Drill Rigs
2310000230 – Oil & Gas Expl & Prod /All Processes / Workover Rigs
2310000330 – Oil & Gas Expl & Prod /All Processes / Artificial Lift
2310000550 – Oil & Gas Expl & Prod /All Processes / Produced Water
2310000660 – Oil & Gas Expl & Prod /All Processes /Hydraulic Fracturing Engines
MARAMA used the EPA 2011 v6.2 approach to develop control factors for the NSPS that apply
to nonpoint source oil and gas emissions. Because NSPS only applies to new sources, the
controls only applied to emissions beyond the base year county total. See the EPA 2011 v6.2
TSD (EPA, 2015b) for additional details on the methodology. The two NSPSs that apply to Oil
and Gas are: 1) Oil and Gas, which affects VOC emissions from evaporative sources and 2)
RICE, which affects NOx, CO and VOC emissions from engines.
For each projection the following approach was taken:
2020
o For DE, DC, MD, NJ, NC, PA, VA, WV Projected and controlled using Gamma
factors within the EMF tool. Note that DE and DC do not have oil and gas
sources.

Technical Support Document for the 2011 Northeastern U.S. Emission Inventory with projections to 2020 and 2023 GAMMA Version January, 2018
Page 76
o For CT, ME, MA, NH, NY, RI, VT and other states in the Modeling Domain
MARAMA applied EPA v6.3 ‘ek’,‘en’ closure/control. Interpolated 2017/2023
growth and NSPS control factors within the EMF tool.
o
2023
o For DE, DC, MD, NJ, NC, PA, VA, WV MARAMA projected and controlled
using Gamma factors within the EMF tool.
o For CT, ME, MA, NH, NY, RI, VT and other states in the Modeling Domain
MARAMA used the EPA 2023 v6.3 (‘en’) emissions dataset. Note that not all
states have Oil and Gas area sources.
3.8. AIRCRAFT, LOCOMOTIVES, AND COMMERCIAL MARINE VESSELS PROJECTION
3.8.1. Locomotives and C1, C2 & C3 Commercial Marine Vessels
As part of its effort to develop emission standards for these sources, EPA developed the
NEI2011v1 Emissions Modeling Platform (EMP) projection factors (combined growth and
control factor) for locomotives and C1/C2 vessels. See Appendix X for the data and calculations.
EPA estimated future-year emissions to account for increased fuel consumption based on Energy
Information Administration (EIA) fuel consumption projections, and emissions reductions
resulting from emissions standards promulgated in 2009. These standards lowered diesel sulfur
content and tightened emission standards for existing and new locomotive/vessel emissions to
lower future-year PM, SO2, and NOx. Using the EPA data, MARAMA computed projection
(combined growth and control) factors for all years from 2007 to 2040 for each year for each
type of engine and each pollutant. 6
For each projection the following approach was taken:
2020
o New York DEC interpolation of gridded emissions between 2017 and 2023.
2023
o MARAMA used EPA 2023 v6.3 (‘el’) datasets.
3.8.2. Aircraft Engines, GSE, and APUs
EPA’s approach was used to develop aircraft growth factors using the Federal Aviation
Administration’s (FAA’s) Terminal Area Forecast (TAF) system (FAA, 2014). The TAF is the
official forecast of aviation activity at FAA facilities. The TAF includes forecasts for 452
6 Note that the EPA approach is based on the growth predictions of AEO2006 together with the
phase-in of cleaner diesel engines. A few states commented that using AEO2006 over predicts
emissions compared to AEO2014 for future years. This over prediction of growth applies to
Class I, II, and III railroads and rail yards as well as C1/C2 commercial marine vessels. States
have requested that EPA adjust their projections to use AEO2014 in the NEI2011v2.

Technical Support Document for the 2011 Northeastern U.S. Emission Inventory with projections to 2020 and 2023 GAMMA Version January, 2018
Page 77
airports in the MARAMA study area, including historical data (1990–2012) and forecasts (2013–
2040) for the following activities:
Air carrier operations representing landings and take-offs (LTOs) of commercial aircraft
with seating capacity of more than 60 seats.
Commuter/air taxi operations is a single category. Commuter operations include LTOs by
aircraft with 60 or fewer seats that transport regional passengers on scheduled commercial
flights. Air taxi operations include LTO by aircraft with 60 or fewer seats conducted on
non-scheduled or for-hire flights.
General aviation itinerant operations represent all civil aviation aircraft LTOs not classified
as commercial.
General aviation local operations represent all civil aviation aircraft practice LTOs and low
approaches.
Military itinerant operations represent LTOs by military aircraft.
Military local operations represent military aircraft practice LTOs and low approaches.
Both the FAA TAF data and the 2011 NEI point source emission inventory are by airport.
However, the 2011 NEI nonpoint source inventory contains emission estimates for aviation
gasoline refueling operation on a county basis.
To facilitate state review of the growth factors, user-friendly spreadsheets were developed that
provide the surrogate growth parameters, match the growth parameters to inventory records, and
configure the growth factors into the required EMF format. The spreadsheets allow the user to
create a projection packet for any combination of base year and future year for the 2007 to 2040
period. See Section 3.1 of this TSD for a description of the spreadsheet format.
For each projection the following approach was taken:
2020
o For the 15 northeast states MARAMA projected and controlled using Gamma
factors within the EMF tool.
Includes correction to General Edward Lawrence Logan Airport annual
growth rate as requested by Massachusetts DEP.
o For other states in the modeling domain MARAMA applied EPA v6.3 ‘ek’,‘en’
closure/control. Interpolated 2017/2023 growth and NSPS control factors within
the EMF tool.
2023
o For the 15 northeast states MARAMA projected and controlled using Gamma
factors within the EMF tool.
Includes correction to General Edward Lawrence Logan Airport annual
growth rate as requested by Massachusetts DEP.
o For other states in the modeling domain MARAMA applied EPA v6.3 ‘ek’,‘en’
closure/control.
3.9. NONROAD EQUIPMENT
For the GAMMA inventory, MARAMA used the following for each projection:
2020

Technical Support Document for the 2011 Northeastern U.S. Emission Inventory with projections to 2020 and 2023 GAMMA Version January, 2018
Page 78
o For all states in the modeling domain New York DEC interpolated gridded
emissions between 2017 and 2023.
2023
o For all states in the modeling domain EPA 2023 v6.3 (‘el’) was used
3.10. ONROAD PROJECTION
For the GAMMA inventory, MARAMA used the following for each projection:
2020
o For all states in the modeling domain New York DEC interpolated gridded
emissions between 2017 and 2023 with CB6 chemistry.
2023
o EPA 2023 v6.3 (‘el’) MOVES2014a emission factors prepared for CB6
chemistry applied to EPA v6.2 county level activity data.
3.11. SECTORS WHERE BASE AND FUTURE YEAR EMISSIONS ARE IDENTICAL
3.11.1. Fires
MARAMA used EPA's v6.2 2011 (‘eh’) modeling platform files, with two NC wildfires
removed. 2011, 2020, and 2023 emissions are identical. In the ‘eh’ platform the wild and
prescribed fires are in separate datasets, which is preferred by northeast states. In the ‘ek’
platform the two datasets were combined. Emission totals are the same in ‘ek’ and ‘eh’.
3.11.2. Biogenic Sources Projection
MARAMA used EPA's v6.3 2011 (‘ek’) modeling platform files to represent biogenic emissions.
2011, 2020, and 2023 files are identical.

Technical Support Document for the 2011 Northeastern U.S. Emission Inventory with projections to 2020 and 2023 GAMMA Version January, 2018
Page 79
4. OTHER SECTORS AND FILES
Emission estimates for other inventory sectors are prepared by others and provided to
MARAMA. MARAMA is cooperating and coordinating with others to incorporate this work
and cite it in our documentation, but MARAMA is not directly involved in completing or quality
assuring this work. These other sectors are as follows:
a. Temporalization of small EGU emissions – Maryland has developed an approach to
temporalize emissions for smaller electrical generation sources that are not included in
ERTAC EGU. This approach will be applied to the Gamma 2011, 2020 and 2023
inventories by Maryland before modeling.
b. Canadian emissions –EPA provided 2011 v6.3 ‘en’ emissions back-projected from
actual 2013 files received from Canada. In addition, EPA prepared an estimate of 2023
and 2025 Canadian emissions. See the EPA 2011 v6.3 ‘en’ Modeling TSD (EPA, 2017)
for details. For the MARAMA GAMMA inventory the following was used:
2011 - EPA v6.3 ‘en’
2020 – New York DEC interpolated between the EPA Canadian 2011 and 2023
gridded emission files to obtain 2020.
2023 - EPA v6.3 ‘en’

Technical Support Document for the 2011 Northeastern U.S. Emission Inventory with projections to 2020 and 2023 GAMMA Version January, 2018
Page 80
5. DATA FILES
MARAMA and S/L/T agencies use a variety of databases and tools to prepare the data files
needed to run the Sparse Matrix Operator Kernel Emissions (SMOKE) modeling system to
prepare emissions input data for air quality modeling. These databases and tools include:
The Emissions Modeling Framework (EMF) software system to manage and assure the
quality of emissions inventories and emissions modeling-related data. One of the modules
within the EMF system is the Control Strategy Tool (CoST) module.
NEI2011v2 annual emission inventory files. EPA provides these files in the Flat File 2010,
also known as the FF10 format, for various subsectors in order to facilitate processing by
SMOKE.
The ERTAC Forecast Tool with associated input databases to project emissions from
EGUs.
Various EMF projection, closure and control packets to project emissions from
nonERTAC point sources, nonpoint sources, and aircraft engines/GSE/APUs.
Other models (NMIM/NONROAD, MOVES, SMARTFIRE, BEIS) with associated input
databases to project emissions from nonroad equipment, onroad vehicles, fires and
biogenic sources. For this inventory, S/L/T agencies are collaborating with EPA in
developing the model input files and reviewing the modeling results. See EPA
documentation for the input files used by these models for 2011 and 2023.
Figure 39 ,
Figure 40, and Figure 41 list the annual emission inventory EMF datasets for 2011, 2020, and
2023 respectively. Other auxiliary files needed to run the SMOKE emission modeling system are
documented elsewhere.

Technical Support Document for the 2011 Northeastern U.S. Emission Inventory with projections to 2020 and 2023 GAMMA Version January, 2018
Page 81
Figure 39: Annual Emission Inventory Files for 2011
MARAMA Sector 2011 Inventory File Notes
Point – ERTAC EGUs CENSARA_2011_ERTACEGUv25_20160603_TXOKNEKSIAARLAMO LADCO_2011_ERTACEGUv25_20160603_MIOHINILWIMN OTC_2011_ERTACEGUv25_20160603_MENHVTMARICTNYNJDEPAMDDCVA SESARM_2011_ERTACEGUv25_20160603_WVNCSCGAKYTNALMS
NEI2011v2 point sources included in the ERTAC EGU projection tool; hourly NOX and SO2 CEMS data replaces annual NOX and SO2 NEI data in the air quality model inputs. ERTAC v2.5 files were post-processed to include all criteria pollutants.
Point – NonEGUs ptnonERTAC_ipm_2011NEIv2_20160512.csv
NEI2011v2 point sources included in the ERTAC UAF but not included in the ERTAC EGU projection tool; and any IPM units not included in the ERTAC forecasting tool.
ptnonipm_2011NEIv2_POINT_20140913_revised_20150115_09feb2015_v2_MARAMA NEI2011v2 non EGU point sources
ethanol_plants_2011NEIv2_POINT_20141123_03feb2015_v1
2011 ethanol plant facilities from EPA’s Office of Transportation and Air Quality (OTAQ) that were not identified in the NEI2011v1.
othpt_offshore_oil_2011NEIv2_POINT_20140913_16sep2014_v0.csv EPA augmentation to include U.S. offshore oil production platforms outside the typical 3-10 nautical mile boundary defining state waters
pt_oilgas_2011NEIv2_POINT_20140913_03feb2015_v4 Onshore oil & gas production point sources
refueling_2011NEIv2_POINT_20140913_04dec2014_v2
Gasoline Stage 1 unloading processes at point source facilities
NonPoint nonpt_2011NEIv2_NONPOINT_20141108_25apr2017_v5_MARAMA_v0 NEI2011v2 for all nonpoint source SCCs not included in the individual tables below.
afdust_2011NEIv2_NONPOINT_20141108_11nov2014_v1.csv EPA_2011_afdust_no_precipadj_paved_unpaved_noNEIv2RPOstates_23sep2014_v0.csv
NEI2011v2 PM emissions for paved roads, unpaved roads and airstrips, construction (residential, industrial, road and total), agriculture production, and mining and quarrying
ag_2011NEIv2_NONPOINT_20141108_04feb2015_v3
NEI2011v2 NH3 emissions from nonpoint livestock and fertilizer application, county and annual resolution
np_oilgas_2011NEIv2_NONPOINT_14dec2015_v5.csv
NEI2011v2 nonpoint sources from oil and gas-related processes
pfc_2011NEIv2_NONPOINT_11dec2015_v1.csv NEI2011v2 portable fuel container nonpoint sources
refueling_2011NEIv2_NONPOINT_20141108_11nov2014_v0.csv NEI2011v2 Stage 1 gasoline unloading nonpoint

Technical Support Document for the 2011 Northeastern U.S. Emission Inventory with projections to 2020 and 2023 GAMMA Version January, 2018
Page 82
MARAMA Sector 2011 Inventory File Notes
sources. (Stage 2 emissions are in the onroad inventory)
rwc_2011NEIv2_NONPOINT_20141108_24nov2014_v3
NEI2011v2 residential wood combustion nonpoint sources
agburn_monthly_2011NEIv2_NONPOINT_03dec2015_v1.csv NEI2011v2 annual and monthly emissions for agricultural burning activities
Nonroad – CMV, Aircraft, Locomotives
c1c2_offshore_2011NEIv2_NONPOINT_20141108_11nov2014_v0.csv C1/C2 commercial marine vessel (CMV) emissions sources from the 2011NEIv2 nonpoint inventory located outside of state territorial waters
cmv_c1c2rail_2011NEIv2_NONPOINT_20141108_02sep2016_v1.csv
C1/C2 CMV emissions sources from the 2011NEIv2 nonpoint inventory located within state territorial waters
rail_c1c2rail_2011NEIv2_NONPOINT_30nov2015_v1.csv
Locomotives (including rail yard locomotive SCC 2285002010)
ptinv_eca_imo_nonUS_nonCANADA_caps_vochaps_2011_16jun2015_v1_orl.txt
C3 CMV emissions sources projected from the2002 ECA-IMO point inventory located outside of state territorial waters
c3marine_2011NEIv2_NONPOINT_20141108_02sep2016_v2.csv
C3 CMV emissions sources from the NEI2011v2 nonpoint inventory located within state territorial waters
ptnonipm_2011NEIv2_POINT_20140913_revised_20150115_09feb2015_v2_MARAMA Aircraft, GSE and APU sources and rail yard locomotive SCC 28500201 are included in the NEI2011v2 point source inventory
Nonroad – NONROAD Model Sources
2011NEIv1_nonroad_17oct2014_v6_part1.csv 2011NEIv1_nonroad_17oct2014_v6_part2.csv
2011NEIv1 nonroad equipment emissions developed using the NMIM/NONROAD model
Onroad – MOVES Model Sources
MOVES2014a_ONROAD_EPA2011el_FF10
2011 NEIv2 onroad equipment emissions developed using the MOVES2014a model with CB chemistry
Fires ptfire_*_2011v2_prescribed_16jan2015_v0 (* = January – December) ptfire_*_2011v2_wild_16jan2015_v0 (* = January – April; July – December) ptfire_*_2011v2_wild_16jan2015_v0_MARAMA.txt (* = May, June only)
NEI2011v2 prescribed and wild fire events: May and June wild fires were updated to remove exceptional wild fires in NC from each month.
Biogenics biogenic_2011ek_BEIS3_61_BELD4_1_08spe2016.csv County-level biogenic emissions from 2011 v6.3 Modeling Platform

Technical Support Document for the 2011 Northeastern U.S. Emission Inventory with projections to 2020 and 2023 GAMMA Version January, 2018
Page 83
MARAMA Sector 2011 Inventory File Notes
Emissions offsets from closed plants/units
2011_MARAMA_PT_offsets_2017_07_14.csv County-level emissions from plants/units in DE that were closed prior to 2011. Emissions provided by DE
Figure 40: Annual Emission Inventory Files for 2020
MARAMA Sector 2020 Inventory File Notes
Point – ERTAC EGUs CENSARA_2020_ERTACEGUv27_20180110_TXOKNEKSIAARLAMO LADCO_2020_ERTACEGUv27_20180110_MIOHINILWIMN OTC_2020_ERTACEGUv26_20180110_MENHVTMARICTNYNJDEPAMDDCVA SESARM_2020_ERTACEGUv26_20180110_WVNCSCGAKYTNALMS
NEI2011v2 point sources included in the ERTAC EGU projection tool; ERTAC EGU v2.7 runs were used. Details of which are summarized in Section 3.2 of this document.
Point – NonEGUs 2020_POINT_PTNONERTAC_IPM_22dec2017 NEI2011v2 point sources included in the ERTAC UAF but not included in the ERTAC EGU projection tool; and any IPM units not included in the ERTAC forecasting tool. Projected using MARAMA V2 growth factors.
2020_POINT_PTNONIPM_22dec2017 NEI2011v2 non EGU point sources. Projected using MARAMA V2 growth factors.
2020_from_ethanol_plants_2011NEIv2_POINT_20dec2017_MARAMA Interpolation of EPA 2017 and 2023 projections of 2011 ethanol plant facilities from EPA’s Office of Transportation and Air Quality (OTAQ) that were not identified in the NEI2011v1.
othpt_offshore_oil_2011NEIv2_POINT_20140913_16sep2014_v0.csv EPA augmentation to include U.S. offshore oil production platforms outside the typical 3-10 nautical mile boundary defining state waters. Used 2011 for 2023 (consistent with EPA)
2020_MARAMA_pt_oilgas_2011NEIv2_POINT_20140913_22dec2017 (MD, NJ, NC, PA, VA, WV; no sources in DC, DE) 2020_nonMARAMA_pt_oilgas_2011NEIv2_POINT_20140913_22dec2017 (CT, ME, MA, NY, RI + rest of the modeling domain; no sources in NH, VT)
NEI2011v2 onshore oil & gas production point sources. Projected from MARAMA V2 growth factors and interpolated EPA v6.3 2017 and 2023 factors.
2020_refueling_2011NEIv2_POINT_20140913_04dec2014_v2_14sep2017 Gasoline Stage 1 unloading processes at point source facilities. Projected using MARAMA V2 growth factors.
Biodiesel_Plants_2018_ff10_11apr2013_v0.csv Planned sources that did not exist in the NEI2011v2. Year 2018 new biodiesel plants based on planned sited plants production volumes provided by OTAQ.

Technical Support Document for the 2011 Northeastern U.S. Emission Inventory with projections to 2020 and 2023 GAMMA Version January, 2018
Page 84
MARAMA Sector 2020 Inventory File Notes
Consistent with EPA, used 2018 for 2020.
2023_MARAMA_new_sources_2jun2017 2023en_ptnonipm_new_units_state_comments_WIonly_09aug2017_v0 2014_Illinois_WV_new_sources_NODA_29aug2016_v2
Emissions Offsets from closed plants/units
2023_MARAMA_PT_offsets_2017_04_25
County-level emissions from plants/units that were closed after 2011. Emissions provided by states.
NonPoint 2020_nonpt_2011NEIv2_NONPOINT_20141108_25apr2017_v5_MARAMA New York DEC interpolation of gridded emissions between 2017 and 2023 for other states in the domain
NEI2011v2 for all nonpoint source SCCs not included in the individual tables below. Projected using MARAMA V2 growth factors.
2020_afdust_2011NEIv2_NONPOINT_11nov2014_v1_13sep2017 2020_EPA_2011_afdust_no_precipadj_paved_unpaved_noNEIv2RPOstates_23sep2014_v0_13sep2017.csv New York DEC interpolation of gridded emissions between 2017 and 2023 for other states in the domain
NEI2011v2 PM emissions for paved roads, unpaved roads and airstrips, construction (residential, industrial, road and total), agriculture production, and mining and quarrying. Projected using MARAMA V2 growth factors.
2020_ag_2011NEIv2_NONPOINT_04feb2015_v3_13sep2017 New York DEC interpolation of gridded emissions between 2017 and 2023 for other states in the domain
NEI2011v2 NH3 emissions from 2011NEIv1 nonpoint livestock and fertilizer application, county and annual resolution. Projected using MARAMA V2 growth factors.
2020_MARAMA_np_oilgas_2011NEIv2_NONPOINT_20141108_21dec2017 (MD, PA, VA, WV; no sources in DC, DE, NJ, NC,) 2020_nonMARAMA_np_oilgas_2011NEIv2_NONPOINT_21dec2017 (NY + rest of the modeling domain; no sources in CT, ME, MA, NH, RI, VT)
NEI2011v2 nonpoint sources from oil and gas-related processes from NEI2011v2. Projected from MARAMA V2 growth factors and interpolated EPA v6.3 2017 and 2023 factors.
2020_pfc_2011NEIv2_NONPOINT_11dec2015_v1_13sep2017 New York DEC interpolation of gridded emissions between 2017 and 2023 for other states in the domain
NEI2011v2 portable fuel container nonpoint sources. Projected using MARAMA V2 growth factors.
2020_refueling_2011NEIv2_NONPOINT_11nov2014_v0_13sep2017 New York DEC interpolation of gridded emissions between 2017 and 2023 for other states in the domain
NEI2011v2 Stage I gasoline unloading nonpoint source. Projected using MARAMA V2 growth factors..
2020_MARAMA_rwc_2011NEIv2_NONPOINT_20141108_24nov2014_v3 New York DEC interpolation of gridded emissions between 2017 and 2023 for other states in the
NEI2011v2 residential wood combustion nonpoint sources. Projected using MARAMA V2 growth factors.

Technical Support Document for the 2011 Northeastern U.S. Emission Inventory with projections to 2020 and 2023 GAMMA Version January, 2018
Page 85
MARAMA Sector 2020 Inventory File Notes
domain
agburn_monthly_2011NEIv2_NONPOINT_03dec2015_v1.csv NEI2011v2 annual and monthly emissions for agricultural burning activities. Consistent with EPA, used 2011 for 2020.
Nonroad – CMV, Aircraft, Locomotives
2020_c1c2_offshore_2011NEIv2_NONPOINT_20141108_11nov2014_v0_14sep2017.csv C1/C2 commercial marine vessel (CMV) emissions sources from the 2011NEIv2 nonpoint inventory located outside of state territorial water. Projected using MARAMA V2 growth factors.
2020_cmv_c1c2rail_2011NEIv2_NONPOINT_20141108_02sep2016_v1_14sep2017 New York DEC interpolation of gridded emissions between 2017 and 2023 for other states in the domain
C1/C2 CMV emissions sources from the 2011NEIv2 nonpoint inventory located within state territorial waters. Projected using MARAMA V2 growth factors.
2020_rail_c1c2rail_2011NEIv2_NONPOINT_30nov2015_v1_14sep2017 New York DEC interpolation of gridded emissions between 2017 and 2023 for other states in the domain
Locomotives (including rail yard locomotive SCC 2285002010). Projected using MARAMA V2 growth factors.
C3 CMV outside of state territorial waters New York DEC interpolation of gridded emissions between 2017 and 2023
C3 CMV emissions sources projected from the 2002 ECA-IMO point inventory located outside of state territorial waters
2020_MARAMA_c3marine_2011NEIv2_NONPOINT_20141108_14nov2014_v1.csv New York DEC interpolation of gridded emissions between 2017 and 2023 for other states in the domain
C3 CMV emissions sources from the NEI2011v2 nonpoint inventory located within state territorial waters. Projected using MARAMA V2 growth factors.
2020_POINT_ptnonipm_22dec2017 Aircraft, GSE and APU sources and rail yard locomotive SCC 28500201 included in the NEI2011v2 point source inventory. Projected using MARAMA V2 growth factors.
Nonroad – NONROAD Model Sources
Nonroad Equipment: Appendix EE – 2020 Nonroad and Onroad County Summaries
NEIv1 nonroad equipment emissions developed using the NMIM/NONROAD model
Onroad – MOVES Model Sources
Onroad: Appendix EE – 2020 Nonroad and Onroad County Summaries
NEIv2 onroad equipment emissions developed using the MOVES2014a model
Fires ptfire_*_2011v2_prescribed_16jan2015_v0 (* = January – December) ptfire_*_2011v2_wild_16jan2015_v0 (* = January – April; July – December) ptfire_*_2011v2_wild_16jan2015_v0_MARAMA.txt (* = May, June only)
NEI2011v2 prescribed and wild fire events: May and June wild fires were updated to remove exceptional wild fires in NC from each month. Consistent with EPA, used 2011 for 2020.

Technical Support Document for the 2011 Northeastern U.S. Emission Inventory with projections to 2020 and 2023 GAMMA Version January, 2018
Page 86
MARAMA Sector 2020 Inventory File Notes
Biogenics biogenic_2011ek_BEIS3_61_BELD4_1_08spe2016.csv County-level biogenic emissions from 2011 v6.3 Modeling Platform. Consistent with EPA, used 2011 for 2020.
Figure 41: Annual Emission Inventory Files for 2023
MARAMA Sector 2023 Inventory File Notes
Point – ERTAC EGUs CENSARA_2023_ERTACEGUv27_20170918_TXOKNEKSIAARLAMO LADCO_2023_ ERTACEGUv27_20170918_MIOHINILWIMN OTC_2023_ ERTACEGUv27_20170918_MENHVTMARICTNYNJDEPAMDDCVA SESARM_2023_ ERTACEGUv27_20170918_WVNCSCGAKYTNALMS
NEI2011v2 point sources included in the ERTAC EGU projection tool; ERTAC EGU v2.7 runs were used. Details of which are summarized in Section 3.2 of this document.
Point – NonEGUs 2023_POINT_PTNONERTAC_IPM_29may2017 NEI2011v2 point sources included in the ERTAC UAF but not included in the ERTAC EGU projection tool; and any IPM units not included in the ERTAC forecasting tool. Projected using MARAMA V2 growth factors.
2023_POINT_PTNONIPM_29may2017 NEI2011v2 non EGU point sources. Projected using MARAMA V2 growth factors.
2023el_from_ethanol_plants_2011NEIv2_POINT_20141123_20sep2016_v0 EPA 2023 projections of 2011 ethanol plant facilities from EPA’s Office of Transportation and Air Quality (OTAQ) that were not identified in the NEI2011v1.
othpt_offshore_oil_2011NEIv2_POINT_20140913_16sep2014_v0.csv EPA augmentation to include U.S. offshore oil production platforms outside the typical 3-10 nautical mile boundary defining state waters. Used 2011 for 2023 (consistent with EPA)
2023en_MARAMA_pt_oilgas_2011NEIv2_POINT_21aug2017_v0 (MD, NJ, NC, PA, VA, WV; no sources in DC, DE) 2023en_pt_oilgas_2011NEIv2_POINT_21aug2017_v2 (CT, ME, MA, NY, RI + rest of the modeling domain; no sources in NH, VT)
Onshore oil & gas production point sources from EPA 2023 v6.3 platform.
2023el_MARAMA_from_refueling_2011NEIv2_POINT_20140913_15sep2016_v1 2023el_from_refueling_2011NEIv2_POINT_20140913_20sep2016_v1
Gasoline Stage 1 unloading processes at point source facilities from EPA 2023 v6.3 platform.
Biodiesel_Plants_2018_ff10_11apr2013_v0.csv Planned sources that did not exist in the NEI2011v2.

Technical Support Document for the 2011 Northeastern U.S. Emission Inventory with projections to 2020 and 2023 GAMMA Version January, 2018
Page 87
MARAMA Sector 2023 Inventory File Notes
Year 2018 new biodiesel plants based on planned sited plants production volumes provided by OTAQ. Consistent with EPA, used 2018 for 2023.
2023_MARAMA_new_sources_2jun2017 2023en_ptnonipm_new_units_state_comments_WIonly_09aug2017_v0 2014_Illinois_WV_new_sources_NODA_29aug2016_v2
Emissions Offsets from closed plants/units
2023_MARAMA_PT_offsets_2017_04_25
County-level emissions from plants/units that were closed after 2011. Emissions provided by states.
NonPoint 2023_NONPOINT_nonpt_12may2017 2023el_from_nonpt_2011NEIv2_NONPOINT_2_113907436_14sep2016_v1
NEI2011v2 for all nonpoint source SCCs not included in the individual tables below. Projected using MARAMA V2 growth factors.
2023el_MARAMA_from_afdust_2011NEIv2_NONPOINT_20141108_19sep2016_v1 2023el_MARAMA_from_EPA_2011_afdust_no_precipadj_paved_unpaved_noNEIv2RPOstates_19sep2016_v1 2023el_from_afdust_2011NEIv2_NONPOINT_20141108_19sep2016_v3 2023el_from_EPA_2011_afdust_no_precipadj_paved_unpaved_noNEIv2RPOstates_19sep2016_v1
NEI2011v2 PM emissions for paved roads, unpaved roads and airstrips, construction (residential, industrial, road and total), agriculture production, and mining and quarrying from EPA 2023 v6.3 platform.
2023el_ag_MARAMA_2011NEIv2_NONPOINT_20141108_07sep2016_v0 2023el_ag_2011NEIv2_NONPOINT_20141108_07sep2016_v1
NEI2011v2 NH3 emissions from 2011NEIv1 nonpoint livestock and fertilizer application, county and annual resolution from EPA 2023 v6.3 platform.
2023el_MARAMA_np_oilgas_2011NEIv2_NONPOINT_20141108_mar_14sep2016_v1_MDPAVAWV (MD, PA, VA, WV; no sources in DC, DE, NJ, NC) 2023en_np_oilgas_2011NEIv2_NONPOINT_07aug2017_v1 (NY + rest of the modeling domain; no sources in CT, ME, MA, NH, RI, VT)
NEI2011v2 nonpoint sources from oil and gas-related processes from EPA 2023 v6.3 platform.
MARAMA_2023_from_pfc_2011NEIv2_NONPOINT_20141108_11nov2014_v0_14sep2016_v0 pfc_2025_2011v6_2_ff10_28jan2015_13sep2016_v2
NEI2011v2 portable fuel container nonpoint sources from EPA 2023 v6.3 platform.
2023el_MARAMA_from_refueling_2011NEIv2_NONPOINT_20141108_mar_13sep2016_v1 2023el_from_refueling_2011NEIv2_NONPOINT_20141108_14sep2016_v1
NEI2011v2 Stage I gasoline unloading nonpoint sources from EPA 2023 v6.3 platform.
2023el_rwc_MARAMA_2011NEIv2_NONPOINT_20141108_07sep2016_v0 2023el_rwc_2011NEIv2_NONPOINT_20141108_080856104_07sep2016_v1
NEI2011v2 residential wood combustion nonpoint sources from EPA 2023 v6.3 platform.

Technical Support Document for the 2011 Northeastern U.S. Emission Inventory with projections to 2020 and 2023 GAMMA Version January, 2018
Page 88
MARAMA Sector 2023 Inventory File Notes
agburn_monthly_2011NEIv2_NONPOINT_03dec2015_v1.csv NEI2011v2 annual and monthly emissions for agricultural burning activities. Consistent with EPA, used 2011 for 2023.
Nonroad – CMV, Aircraft, Locomotives
t_2023el_c1c2_offshore_2011NEIv2_NONPOINT_20141108_07sep2016_v0 C1/C2 commercial marine vessel (CMV) emissions sources from the 2011NEIv2 nonpoint inventory located outside of state territorial waters from EPA 2023 v6.3 platform.
2023el_MARAMA_cmv_c1c2rail_2011NEIv2_NONPOINT_20141108_07sep2016_v0 2023el_cmv_c1c2rail_2011NEIv2_NONPOINT_20141108_07sep2016_v2
C1/C2 CMV emissions sources from the 2011NEIv2 nonpoint inventory located within state territorial waters from EPA 2023 v6.3 platform.
2023el_MARAMA_rail_c1c2rail_2011NEIv2_NONPOINT_20141108_07sep2016_v0 2023el_rail_c1c2rail_2011NEIv2_NONPOINT_20141108_07sep2016_v2
Locomotives (including rail yard locomotive SCC 2285002010) from EPA 2023 v6.3 platform.
2023el_eca_imo_nonUS_nonCANADA_caps_vochaps_2011_07sep2016_v0_MARAMA.txt
C3 CMV emissions sources projected from the 2002 ECA-IMO point inventory located outside of state territorial waters
2023el_MARAMA_c3marine_2011NEIv2_NONPOINT_20141108_07sep2016_v0 2023el_c3marine_2011NEIv2_NONPOINT_20141108_09sep2016_v2
C3 CMV emissions sources from the NEI2011v2 nonpoint inventory located within state territorial waters from EPA 2023 v6.3 platform.
2023_POINT_ptnonipm_29may2017 Aircraft, GSE and APU sources and rail yard locomotive SCC 28500201 included in the NEI2011v2 point source inventory from EPA v6.3 platform.
Nonroad – NONROAD Model Sources
2023el_nonroad_ff10_NCD20160627_05oct2016_v3_part1 2023el_nonroad_ff10_NCD20160627_05oct2016_v3_part2 2023el_projection_SLT_nonroad_01feb2013_Texas_monthly_ff10_30aug2016_v0
2017NEIv1 nonroad equipment emissions developed using the NMIM/NONROAD model
Onroad – MOVES Model Sources
MOVES2014a_ONROAD_EPA2023el_FF10 2023 NEIv2 onroad equipment emissions developed using the MOVES2014a model
Fires ptfire_*_2011v2_prescribed_16jan2015_v0 (* = January – December) ptfire_*_2011v2_wild_16jan2015_v0 (* = January – April; July – December) ptfire_*_2011v2_wild_16jan2015_v0_MARAMA.txt (* = May, June only)
NEI2011v2 prescribed and wild fire events: May and June wild fires were updated to remove exceptional wild fires in NC from each month. Consistent with EPA, used 2011 for 2023.
Biogenics biogenic_2011ek_BEIS3_61_BELD4_1_08spe2016.csv County-level biogenic emissions from 2011 v6.3 Modeling Platform. Consistent with EPA, used 2011 for 2023.

Technical Support Document for the 2011 Northeastern U.S. Emission Inventory with projections to 2020 and 2023 GAMMA Version January, 2018
Page 89
6. DATA SUMMARIES
This section provides emission summary graphs for each pollutant by state, year and sector.
Additional numerical summaries in tabular format are provided in Appendix AA. The sectors
shown in the following figures are defined below. Appendix BB lists how SCCs were assigned to
sectors.
ERTAC EGU Point Sources. This sector includes emission units located primarily at
electric power plants that are included in the ERTAC EGU forecasting tool. These sources
are required to report continuous emission monitoring data to EPA’s Clean Air Market
Division (CAMD). Air quality modeling uses the hourly emissions data for these units to
accurately reflect the temporal variation in emissions
Small EGU (NonERTAC IPM) Point Sources. This sector includes emission units that are
NOT included in the ERTAC EGU Projection Tool but are included in EPA’s IPM scenarios.
This is the same as the “Point non-ERTAC EGU” source group.
NonEGU Point Sources. This sector includes facilities and sources located at a fixed,
stationary location such as larger industrial, commercial and institutional facilities.
Aircraft/GSE/APU Point Sources. This sector includes emissions from aircraft engines,
ground support equipment and auxiliary power units that are identified as point sources (e.g.,
emissions are located at specific airport locations) and rail yard locomotives.
Nonpoint Sources. This sector includes sources which individually are too small in
magnitude or too numerous to inventory as individual point sources. Nonpoint sources
include consumer products, paints, residential, commercial and industrial fuel combustion
not in the point source inventory, smaller industrial, commercial and institutional facilities,
and Stage 1 unloading emissions from the filling of underground storage tanks (Stage 2
refueling emissions are included in onroad sector). This sector does not include locomotive
emissions outside of the rail yards and commercial marine vessel emissions, which are
included in the other nonroad sector described below. S/L/T agencies and EPA estimate
nonpoint emissions at the county level.
Rail/CMV Nonroad Sources. This category includes internal combustion engines used to
propel marine vessels and locomotives.
Nonroad Sources in the NONROAD Model. This category contains mobile sources
included in NONROAD model within the National Mobile Inventory Model (NMIM).
Nonroad emissions result from the use of fuel in a diverse collection of vehicles and
equipment such as construction equipment, recreational vehicles, and landscaping equipment.
Onroad Sources. This category contains mobile sources included in the MOVES model.
Onroad emissions result from the combustion and evaporation of fuel used by motorized
vehicles, including vehicle refueling (Stage 2) emissions that are normally operated on public
roadways. This includes passenger cars, motorcycles, minivans, sport-utility vehicles, light-
duty trucks, heavy-duty trucks, and buses.
Fire Sources. This source category includes wildifires and prescribed burning sources of
pollution caused by the inadvertent or intentional burning of biomass including forest,

Technical Support Document for the 2011 Northeastern U.S. Emission Inventory with projections to 2020 and 2023 GAMMA Version January, 2018
Page 90
rangeland (e.g., grasses and shrubs), and agricultural vegetative residue. Other burning
sources such as permitted agricultural burning are included in the nonpoint inventory.
Biogenic Sources. This category includes emissions from vegetation and soils that are
computed via a model that utilizes spatial information on vegetation and land use, and
environmental conditions of temperature and solar radiation.
6.1. CARBON MONOXIDE
Figure 42 summarizes CO emissions by state, year and sector. For the 15-state region, CO
emissions are projected to decrease by ~27 percent from 11.9 to 8.6 million tons between 2011
and 2023. The reduction is associated with the significant reductions in emissions from the
onroad and nonroad sectors resulting from national emissions standards for highway vehicle and
nonroad engines.
Figure 42: Annual Emission Summary for Carbon Monoxide

Technical Support Document for the 2011 Northeastern U.S. Emission Inventory with projections to 2020 and 2023 GAMMA Version January, 2018
Page 91
6.2. AMMONIA
Figure 43 summarizes NH3 emissions by state, year and sector. For the 15-state region, NH3
emissions are projected to increase by ~2% percent from 447 to 456 thousand tons between 2011
and 2023. Nearly all of the NH3 emissions are from the nonpoint sector, primarily agricultural
fertilizer application and livestock waste operations.
Figure 43: Annual Emission Summary for Ammonia

Technical Support Document for the 2011 Northeastern U.S. Emission Inventory with projections to 2020 and 2023 GAMMA Version January, 2018
Page 92
6.3. OXIDES OF NITROGEN
Figure 44 summarizes NOx emissions by state, year and sector. For the 15-state region, NOx
emissions are projected to decrease by ~44 percent from 2.6 to 1.5 million tons between 2011
and 2023. Three sectors show significant reductions in emissions between 2011 and 2023 –
onroad emissions decrease by 70 percent, nonroad emissions decrease by 45 percent, and
ERTAC EGU emissions decrease by 50 percent. Two sectors show significant increases –
nonpoint emissions (in particular, emissions from oil & gas exploration) are projected to increase
by 4 percent and aircraft emission increase by 23 percent between 2011 and 2023. NOx
emissions from nonEGUs are projected to decrease by 10 percent between 2011 and 2023.
Figure 44: Annual Emission Summary for Oxides of Nitrogen

Technical Support Document for the 2011 Northeastern U.S. Emission Inventory with projections to 2020 and 2023 GAMMA Version January, 2018
Page 93
6.4. PM10
Figure 45 summarizes unadjusted PM10 emissions by state, year and sector.7 For the 15-state
region, PM10 emissions are projected to remain relatively unchanged at ~1.9 million tons from
2011 through 2023. Most of the PM10 emissions result from dust that is re-entrained by vehicles
traveling on paved roads.
Figure 45: Annual Emission Summary for Unadjusted PM10
7 Transport fractions and meteorological adjustments are applied during SMOKE processing.

Technical Support Document for the 2011 Northeastern U.S. Emission Inventory with projections to 2020 and 2023 GAMMA Version January, 2018
Page 94
PM2.5
Figure 46 summarizes unadjusted PM2.5 emissions by state, year and sector.8 For the 15-state
region, PM2.5 emissions are projected to decrease slightly from ~0.6 million tons in 2011 to
~0.56 tons in 2023. Most of the PM2.5 emissions result from dust that is re-entrained by vehicles
traveling on paved roads and from residential/commercial/industrial fuel combustion.
Residential wood combustion is also a significant source of PM2.5 in the region.
Figure 46: Annual Emission Summary for Unadjusted PM2.5
8 Transport fractions and meteorological adjustments are applied during SMOKE processing.

Technical Support Document for the 2011 Northeastern U.S. Emission Inventory with projections to 2020 and 2023 GAMMA Version January, 2018
Page 95
6.5. SULFUR DIOXIDE
Figure 47 summarizes SO2 emissions by state, year and sector. For the 15-state region, SO2
emissions are projected to decrease by ~55 percent from 1.1 to 0.49 million tons between 2011
and 2023. The emissions from ERTAC EGUs are projected to decrease by 60 percent.
Significant SO2 reductions are projected for the onroad and nonroad sectors due to lower sulfur
content limits for gasoline and diesel fuels. Additional SO2 reductions are projected from the
nonpoint sector due to more stringent sulfur content limits for home heating oil and other
distillate/residual fuel oils.
Figure 47: Annual Emission Summary for Sulfur Dioxide

Technical Support Document for the 2011 Northeastern U.S. Emission Inventory with projections to 2020 and 2023 GAMMA Version January, 2018
Page 96
6.6. VOLATILE ORGANIC COMPOUNDS
Figure 48 summarizes VOC emissions by state, year and sector. For the 15-state region, VOC
emissions are projected to decrease by 7 percent from ~7 to 6.5 million tons from 2011 and
2023. Biogenic emissions represent about 67 percent of the total VOC emissions in 2011 and are
projected to remain unchanged between 2011 and 2023; with reductions in other sectors biogenic
emissions are projected to represent a larger percentage of total VOC emissions, about 72
percent, in 2023. Man-made VOC emissions are projected to decrease by 22 percent, due
primarily to reductions in the onroad and nonroad sectors.
Figure 48: Annual Emission Summary for Volatile Organic Compounds

Technical Support Document for the 2011 Northeastern U.S. Emission Inventory with projections to 2020 and 2023 GAMMA Version January, 2018
Page 97
7. REFERENCES
EIA, 2015. Energy Information Administration. Annual Energy Outlook 2015 with Projections
to 2040. April 2015. http://marama.org/images/stories/documents/Annual_Energy_Outlook_2015_with_Projections_to_2014_
Apr_2015.pdf
EPA, 2007. U.S. Environmental Protection Agency. Guidance on the Use of Models and Other
Analyses for Demonstration Attainment of Air Quality Goals for Ozone, PM2.5, and Regional
Haze. April 2007. http://marama.org/images/stories/documents/Guidance_on_the_Use_of_Models_and_Other_Analyses_fo
r_Demonstration_Attainment_of_AQ_Goals_for_Ozone_PM2.5_and_RH_Apr_2007.pdf
EPA, 2015a. U.S. Environmental Protection Agency. 2011 National Emission Inventory, version
2 Technical Support Document. August 2015. http://marama.org/images/stories/documents/2011_NEI_v2_Technical_Support_Document_Aug_2015.pd
f
EPA, 2015b. U.S. Environmental Protection Agency. Technical Support Document (TSD)
Preparation of Emissions Inventories for the Version 6.2, 2011 Emissions Modeling Platform.
August 2015. http://marama.org/images/stories/documents/EPA_TSD_2011_Emissions_Modeling_Platform_v6.2_Aug
_2015.pdf
EPA, 2015c. U.S. Environmental Protection Agency. 2011 NEI Documentation Nonpoint
Emission Tools and Methods Data and Documentation ftp site (contains MS Excel spreadsheets
with emission factors, activities and county level allocation factors, and MS Word documents
that describe the methodology used to estimate emissions.).
ftp://ftp.epa.gov/EmisInventory/2011nei/doc/
EPA, 2016a. U.S. Environmental Protection Agency. Technical Support Document (TSD)
Preparation of Emissions Inventories for Version 6.3, 2011 Emissions Modeling Platform. (ek)
August 2016. http://marama.org/images/stories/documents/6_EPA_TSD_2011_Emissions_Modeling_Platform_v6.3_A
ug_2016.pdf
EPA, 2016b. U.S. Environmental Protection Agency. Technical Support Document (TSD)
Updates to Emissions Inventories for Version 6.3, 2011 Emissions Modeling Platform for the
Year 2023. (el) December, 2016 http://marama.org/images/stories/documents/7_EPA_TSD_2011_Emissions_Modeling_Platform_v6.3_u
pdates_Dec_2016.pdf
EPA, 2017. U.S. Environmental Protection Agency. Technical Support Document (TSD)
Additional Updates to Emissions Inventories for Version 6.3, 2011 Emissions Modeling Platform
for the Year 2023. (en) October 2017. http://marama.org/images/stories/documents/8_EPA_TSD_2011_Emissions_Modeling_Platform_v6.3_a
dditional_updates_Oct_2017.pdf
ERTAC, 2017. Eastern Regional Technical Advisory Committee. ERTAC EGU Forecasting
Tool Documentation web site (CONUS 2.7 CSAPR Compliant Scenario was used for this
inventory). 2017. http://www.marama.org/2013-ertac-egu-forecasting-tool-documentation

Technical Support Document for the 2011 Northeastern U.S. Emission Inventory with projections to 2020 and 2023 GAMMA Version January, 2018
Page 98
FAA, 2013. Federal Aviation Administration. Terminal Area Forecast Summary Fiscal Years
2012-2040. 2014. https://aspm.faa.gov/main/taf.asp
MARAMA, 2015. Mid-Atlantic Regional Air Management Association. (Technical Support
Document for) Emission Inventory Development for 2011, 2018, and 2028 for the Northeastern
U.S. Alpha2 Version. November 2015.
http://www.marama.org/technical-center/emissions-inventory/2011-inventory-and-projections
MARAMA, 2016. Mid-Atlantic Regional Air Management Association. Technical Support
Document Emission Inventory Development for 2011 and 2017 for the Northeastern U.S. Beta2
Version. July 2017. http://www.marama.org/technical-center/emissions-inventory/2011-2017-
beta-regional-emissions-inventory
NY DEC, 2016. New York Department of Environmental Conservation. Technical
Memorandum concerning low sulfer distillate fuel effect on NOX emissions. http://marama.org/images/stories/documents/APP09_NY2016_MARAMA_NOx_Reductions_Low_Sulfu
r_Distillate.pdf
OTC, 2007. Ozone Transport Commission. Identification and Evaluation of Candidate Control
Measures – Final Technical Support Document. February 2007. http://marama.org/images/stories/documents/14_Identification_and_Evaluation_of_Candidate_Control_
Measures_Final_Technical_Support_Document_Feb_2007.pdf
UNC, 2013. University of North Carolina Institute for the Environment. Control Strategy Tool
(CoST) “Project Future Year Inventory” Development Document. April 8, 2013. http://marama.org/images/stories/documents/15_Project_Future_Year_Inventory_DevelopmentDoc_04-
09-13.pdf