TECHNICAL SERVICE CENTER Denver, Colorado · TECHNICAL SERVICE CENTER Denver, Colorado Technical...
75
TECHNICAL SERVICE CENTER Denver, Colorado Technical Memorandum No. D8330-2003-009 2002 Status Report-Paradox Valley Seismic Network Paradox Valley Project Southwestern Colorado Prepared by Kenneth Mahrer Jon Ake Daniel O’Connell Lisa Block U.S. Department of the Interior Bureau of Reclamation May 2003
Transcript of TECHNICAL SERVICE CENTER Denver, Colorado · TECHNICAL SERVICE CENTER Denver, Colorado Technical...

TECHNICAL SERVICE CENTERDenver, Colorado
Technical Memorandum No. D8330-2003-009
2002 Status Report-Paradox Valley Seismic Network Paradox Valley ProjectSouthwestern Colorado
Prepared by
Kenneth MahrerJon Ake
Daniel O’ConnellLisa Block
U.S. Department of the InteriorBureau of Reclamation
May 2003

U.S. Department of the InteriorMission Statement
The mission of the Department of the Interior is to protect and provide access to our Nations’s natural and cultural heritage and honor our trust responsibilities to Indian tribes and our commitments to island communities.
Bureau of ReclamationMission Statement
The mission of the Bureau of Reclamation is to manage, develop, and protect water and related resources in an environmentally and economically sound manner in the interest of the American public.


1.0 INTRODUCTION
This report summarizes the calendar year 2002 seismic observations and related work for the Par-
adox Valley Seismic Network (PVSN). The Bureau of Reclamation (BOR) operates the network
as part of the Paradox Valley Unit (PVU) of its Colorado River Basin Salinity Control Project.
PVU collects and disposes Paradox Valley brine (PVB) prior to it contaminating the Dolores
River, a tributary of the Colorado River. PVB is collected from the local aquifer via 9 shallow
extraction wells along the eastern half of the Dolores River in its traverse across Paradox Valley,
CO. Prior to 2002, PVB was filtered, treated with additives, and diluted to 70% PVB:30%
Dolores River fresh water prior to high-pressure injecting ~4.5 km below the earth’s surface using
the world’s deepest injection well, the PVU Salinity Control Well No. 1. Beginning in January
2002, PVU stopped diluting and injected 100% PVB.
Based on other deep-well injection projects, including that near Denver in the 1960’s, BOR recog-
nized and planned for small seismic events induced by the PVU injection. In 1986, 5 years before
the first injections, BOR began recording ground motion on the Paradox Valley Seismic Network.
The intent was to create a background seismic database to which seismicity induced by the PVU
injection could be compared. Monitoring, analyzing, and interpreting seismic events was, and still
is, the mandate of the PVSN operations. Specifically, PVSN operations (1) gathers continuous
ground motion data originating in and around Paradox Valley and the surrounding region; (2)
electronically collates and telemeters these data to the Denver Federal Center (DFC) in Lake-
wood, CO; (3) isolates, evaluates, and catalogs local seismic events within the data; (4) locates the
sources of the events; (5) determines source mechanics (e.g., focal mechanisms) of the events
when feasible; (6) identifies and evaluates relationships between seismicity, geology, tectonics,
subsurface brine movement and location, and injection parameters; and (7) maintains a database
of both event and injection parameters.
In following order, this report discusses geological setting, PVSN instrumentation, well opera-
tions, seismic observations and analysis, rock properties modeling, and conclusions. In addition
there is one appendix: (1) a copy of the memo submitted to PVU detailing our initial findings
regarding a 2nd (proposed) injection well.
1

2
Also appended to this report is a CD containing 2 files: (1) an Excel file containing PVSN seismic
data and corresponding PVU average injection data; and (2) a PDF file of this report.

3
2.0 LOCAL SETTING
The Paradox Valley Unit is located in western Montrose County approximately 90 km southwest
of Grand Junction, CO and 16 km east of the Colorado-Utah border. Paradox Valley is about 40
km long on a N55oW axis and from 5 to 10 km wide (Figure 2-1). The most prominent local fea-
ture is the LaSal Mountains in the Manti-LaSal National Forest, which rise to an elevation of
about 3.7 km above msl and border Paradox Valley on the northwest. Paradox Valley has a rela-
tively flat floor enclosed by steep walls of sandstone. Elevations vary from about 1.5 km above
mean sea level (msl) in the valley to about 2.0 km above msl along the valley rim.
Paradox Valley is one of five northwest-striking, collapsed diapiric salt anticlines in southwestern
Colorado and southeastern Utah. The formation of these anticlines began about 250 mya when the
emergence of mountainous uplifts placed intensive lateral stresses on the intervening sedimentary
formations, causing faulting and fracturing along weak axial zones. Subsequently the stresses
relaxed and combined with the weight of overlaying strata forced a deeply buried, salt-rich layer
to flow upward into the faulted area creating the anticline. As pressures eased, the crest of the
anticline gradually dropped downward into fault blocks. That and subsequent erosion created Par-
adox Valley. Currently, the Dolores River flows normal to the strike of the valley.
The Dolores River originates in the San Juan Mountains southwest of Paradox Valley in south-
west Colorado and flows generally northwest for about 300 km to Paradox Valley and another 110
km to its confluence with the Colorado River northeast of Moab, Utah. Small tributaries in the
unit area include La Sal Creek, which enters from the northwest about 8 km upstream from Para-
dox Valley, and West and East Paradox Creeks, which enter from the northwest and southeast
within the valley. East Paradox Creek is intermittent, however, and has essentially no effect on the
river flow. Over its path through Paradox Valley, the Dolores can pick up more than 180,000 met-
ric tons (200,000 standard tons) of salts annually, primarily from brine-saturated ground water,
PVB, percolating through seeps and springs in the salt and then through the Dolores’ banks and
beds. There are two general types of seeps and springs: brackish water with total dissolved solids
(tds) varying from about 1,500 milligrams per liter (mg/l) to 4,000 mg/l and brine with about
250,000 mg/l. (For reference, fresh water is defined as <400mg/l tds.) Water pumped from the 9

4
extraction wells near the river has a salinity of about 260,000 mg/L. This brine, which is nearly
eight times the salinity of sea water, consists mostly of sodium and chloride, with much smaller
amounts of sulfate, potassium, magnesium, calcium, and bicarbonate. Heavy metals, particularly
-109˚
-109˚
-108.5˚
-108.5˚
38˚ 38˚
38.5˚ 38.5˚
0 20 40
km-109˚
-109˚
-108.5˚
-108.5˚
38˚ 38˚
38.5˚ 38.5˚
0 20 40
km
Figure 2-1. Topographic setting of PVU injection well, Paradox Valley, and local municipalities.
Gateway
Nucla
Naturita
Paradox
Injection WellBedrock
Paradox Valley
UT CO

5
iron and lead, and non-radioactive strontium are also present in limited amounts. Noticeable
amounts of hydrogen sulfide gas are released as the brine surfaces, creating a noxious odor.
2.1 PVU Salinity Control Well No. 1.
The PVU Salinity Control Well No. 1 was completed in 1987 at a total depth (t.d.) of 4.88 km
(16,000 ft). The well penetrates Triassic rock at the surface through Precambrian rock at t.d. and
has a minor drift to the east and slightly to the north. Log-based, near-wellbore stratigraphy, the
perforation intervals, and a plan view of the well are shown in Figure 2-2. Based on core and log
data, the Mississippian Leadville carbonate was selected as the prime injection zone with the
upper Precambrian as a secondary zone (Bremkamp and Harr, 1988). The well casing of PVU
No. 1 was perforated at ~20 perforations/m in two major intervals between 4.3 km and 4.8 km.
-0.5
-0.4
-0.3
-0.2
-0.1
0
0.1
0.2
0.3
0.4
0.5
-0.5 -0.4 -0.3 -0.2 -0.1 0 0.1 0.2 0.3 0.4 0.5
East, km
North, kmWellbore
Upper Perfs
Lower Perfs
0
1
2
3
4
5
6
0 1 2 3 4 5
East, km
Dep
th,k
m
Triassic (225 mya)
Permian (250 mya)
Penns. (300 mya)
Miss. (330 mya) Devon. (370 mya)
Cambrian (540 mya)
Pre-Cambrian (>570 mya)
Plan View North Viewing Cross Section
Figure 2-2. Plan view and north-viewing cross section of PVU Salinity Control Well No. 1, including the near-wellbore stratigraphic column based on well log-ging.

6
2.2 Wray Mesa Fault and Fracture System.
PVU Salinity Control Well No. 1 was sited to intersect the generally NW-SE trending Wray Mesa
fault system. Movement on the Wray Mesa faults has created an extensive fracture field within the
fault system. The main trend of the Wray Mesa fault system (N55oW) is evident in Figure 2-1. In
their 1988 report, Bremkamp and Harr predicted that the PVU injectate would move in the direc-
tion of least reservoir resistance and lowest hydrostatic pressure. This direction is to the northwest
and up dip along the fracture permeability of the Wray Mesa system. Our findings, as discussed
below and based on injection-induced, seismic source locations, support their prediction.

7
3.0 INSTRUMENTATION
Paradox Valley Seismic Network provides seismograph coverage for roughly 5500 km2 of the
Colorado Plateau centered on the intersection of the Dolores River and the west side of Paradox
Valley (Figure 3-1). PVSN was installed in late 1983 and has operated continuously since that
time. For each station shown in Figure 3-1, Table 3-1 gives station name, latitude, longitude, ele-
vation, and operational parameters; and Table 3-2 gives the legal description of the station loca-
tions. Within the limits of terrain accessibility and radio telemetry linkage, the network is loosely
arranged in two concentric rings centered on the brine injection well. The outer ring diameter is
approximately 80 km.
Each PVSN station consists of a ground motion sensor or sensors (i.e., seismometer), amplifier,
voltage control oscillator (VCO), low power telemetry radio, solar panel, and broadcast tower
with antenna. All systems are powered by solar-recharged batteries. Most of the stations operate
single, vertical-motion-only seismometers. The Davis Mesa and Nyswonger Mesa stations (PV11
and PV16, respectively), operate three-component seismometers, recording vertical, east-west,
and north-south motion. When completed, probably in the summer of 2003, PV17 will also be a
three-component site.
The seismometers at all existing sites are Teledyne Geotech Model S-13's, a high-quality, reliable,
ground velocity measuring instrument with flat response between 1 and 20 Hz (Figure 3-2). At all
sites, the amplifiers and VCO’s are also Teledyne Geotech (model 4250). The pass band (i.e. fil-
ters) of each field amplifier is set to minimize long-period noise (Table 3-1).
Table 3-1. PVSN Station Locations and Characteristics
Station Designation
Station Name
Latitude deg., N
Longitude deg., W
Elevation m, msl
Date Installed
Gain, dB/ Filters, Hz
PV01 The Burn 38.13 108.57 2190 5/83 78 / 0.2-25
PV02 Monogram Mesa 38.21 108.74 2158 5/83 78 / 0.2-25
PV03 Wild Steer 38.25 108.85 1975 5/83 78 / 0.2-25
PV04 Carpenter Flats 38.39 108.91 2152 5/83 78 / 0.2-25

8
Table 3-1. PVSN Station Locations and Characteristics
Station Designation
Station Name
Latitude deg., N
Longitude deg., W
Elevation m, msl
Date Installed
Gain, dB/ Filters, Hz
PV05 E. Island Mesa 38.15 108.97 2150 5/83 78 / 0.2-25
PV07 Long Mesa 38.44 108.65 2001 6/83 78 / 0.2-25
PV08 Uncompahgre Butte 38.58 108.65 2941 6/83 78 / 0.2-25
PV09 North LaSalle 38.50 109.13 2640 6/83 78 / 0.2-25
PV10 Wray Mesa 38.29 109.04 2300 6/83 78 / 0.2-25
PV11Z Davis Mesa 38.30 108.87 1881 12/89 78 / 0.2-25
PV11N Davis Mesa 38.30 108.87 1881 12/89 60 / 0.2-25
PV11E Davis Mesa 38.30 108.87 1881 12/89 60 / 0.2-25
PV12 Saucer Basin 38.32 108.80 2091 12/89 78 / 0.2-25
PV13 Radium Mtn 38.16 108.82 2158 12/89 78 / 0.2-25
PV14 Lion Creek 38.37 109.02 2240 12/89 78 / 0.2-25
PV15 Pinto Mesa 38.34 108.48 2280 6/95 78 / 0.2-25
PV16Z Nyswonger Mesa 38.32 108.92 2045 7/99 78 / 0.2-25
PV16N Nyswonger Mesa 38.32 108.92 2045 7/99 60 / 0.2-25
PV16E Nyswonger Mesa 38.32 108.92 2045 7/99 60 / 0.2-25
PV17 Wray Mesa East 38.28 108.96 1985 tbd --
Notes: Elevations are relative to mean sea level (msl), the surface elevation of the injection well is 1540 m above msl. Stations designated with a,“Z”, “N”, or “E” suffix stand for instruments that sense motion in the vertical, north-south, or east-west directions, respectively. Stations without a suffix have vertical- only motion sensors.
Table 3-2. PVSN Sites - Legal Description
Station Desig.
Geographic Name
Legal Description
PV01 The Burn T45N R15W S19 C,NM
PV02 Monogram Mesa T46N R17W S27 C,NM
PV03 Wild Steer T46N R18W S10 C,NM
PV04 Carpenter Flats T48N R18W S30 C,NM
PV05 E. Island Mesa T45N R19W S16 C,NM

9
Table 3-2. PVSN Sites - Legal Description
Station Desig.
Geographic Name
Legal Description
PV07 Long Mesa T48N R16W S9 C,NM
PV08 Uncompahgre Butte T50N R16W S22 C,NM
PV09 North LaSalle T26S R25E S35 U,SLC
PV10 Wray Mesa T47N R20W S35 C,NM
PV11 Davis Mesa T47N R18W S29 C,NM
PV12 Saucer Basin T47N R18W S24 C,NM
PV13 Radium Mtn T45N R18W S14 C,NM
PV14 Lion Creek T48N R20W S36 C,NM
PV15 Pinto Mesa T47N R15W S12 C,NM
PV16 Nyswonger Mesa T47N R19W S24 C,NM
PV17 Wray Mesa East T47N R19W S34 C,NM 3.1 Telemetry and Software.
In October of 2000, Reclamation upgraded the data telemetry system and the detection, location
and archiving software (Mahrer et al., 2001). Upgrading the software included adapting, refin-
ing, and implementing Earthworm, software developed by the US Geological Survey and used in
its seismic arrays. PVSN data telemetry begins with continuous analog signals broadcast from each seismometer site
to a receiver in Nucla, CO. At Nucla, the signals are digitized and transmitted via a digital tele-
phone link to the Bureau of Reclamation processing center at the Denver Federal Center (DFC) in
Lakewood, Colorado. At the DFC, Earthworm detects events in the data stream, then classifies,
locates, and archives the detected events. Subsequently, each event is re-evaluated by a Bureau of
Reclamation seismologist. In addition to the PVSN instruments noted in Tables 3-1 and 3-2, we operate two strong motion,
digital-recording instruments (Springnether Force Balance Accelerometers, FBA-23’s). One is

10
PV08
PV07
PV15
PV01
PV02
PV13
PV05
PV12
PV03
PV11
PV04
PV09
PV14
PV16
PV10
Figu
re 3
-1.
Loca
tions
of P
arad
ox V
alle
y Se
ism
ic N
etw
ork
stat
ions
(blu
e tr
iang
les)
, and
Par
-ad
ox V
alle
y U
nit I
njec
tion
Wel
l (bl
ack
circ
le).

11
Figure 3-2. Typical response of a vertical-component Teledyne Geotech S13 seis- mometer, electronics, and digital recording system used at PVSN. Nominal gain is 48 dB for curve shown, Teledyne Geotech model 42.5 amplifier/VCO and model 4612 discriminator. Damping is 0.71 of critical.
sited near the injection wellhead; the other is at PVU’s pumping station (38.33oN
108.85oW). Both have telephone links to the DFC. The data from these instruments are not part of
our normal analysis stream, but can be in the future. In the past, the data from these instruments
have been used separately to analyze large (i.e., strong) events that have overdriven PVSN elec-
tronics.

12
3.2 PVSN Operational Efficiency.
[Operational Efficiency (OE) is the percentage of operating data channel days for the whole year.
OE is calculated by summing the number of operating PVSN data channels for each day of the
year and dividing that total by 6935 (i.e., 19 channels x 365 days), the number of possible data
channel days for a year, if every channel operates every day of the year. If DFC witnesses a power
failure resulting in the loss of data, this is included in the calculation as if all PVSN stations were
down for the duration of the power failure.] During 2002, the seismic network and telemetry sys-
tem operated at 86% efficiency. Previous years averaged about 90% efficiency. Figure 3-3 shows
the individual data channel operational efficiencies in blue and the efficiency of the whole net-
work in red for 2002.
0
10
20
30
40
50
60
70
80
90
100
ALLPV01
PV02PV03
PV04PV05
PV07PV08
PV09PV10
PV11V
PV11N
PV11E
PV12PV13
PV14PV15
PV16V
PV16N
PV16E
PVSN Data Channels
%E
ffic
ien
t
Figure 3-3. PVSN Operational Efficiency: Cumulative (“All”) and By Data Channel

13
3.3 PVSN New Instrumentation.
In late 2001, we installed the infrastructure for two additional, 3-component stations. One station,
PV17, will be a new, 3-component site on eastern Wray Mesa, ~8 km east of PV10. The other is
an upgrade to PV12 at Saucer Basin. Both sites will be instrumented with Guralp CMG-40T seis-
mometers. The new instrumentation will digitize on site and record broader frequency and ampli-
tude ranges than the existing instruments. We expect to bring these stations online in 2003.

14
4.0 WELL OPERATIONS
The PVU Salinity Control Well No. 1 is located at 38.2995o N and 108.8953o W along the west-
ern boundary of Paradox Valley, approximately 1.5 km up a canyon formed by Dolores River
(Figure 2-1). As shown in Figure 2-2, the well is essentially vertical, drifting only ~0.3 km to the
east and slightly to the north over its 4.8+ km depth. Figure 2-2 also shows the two major perfo-
ration intervals of the wellbore casing. The upper perforation interval is within the primary injec-
tion target, the Mississippian-aged Leadville Limestone formation.
During 2002, PVU injected ~390 million liters (~103 million gallons) of 100% PVB. This com-
pares to 380 million liters (100 million gallons of 70% PVB - 30% Dolores River fresh water
injectate) in 2001, 424 million liters (112 million gallons of 70/30 injectate) in 2000, 568 million
liters (150 million gallons of 70/30) in 1999 and 632 million liters (167 million gallons of 70/30)
in 1998. The smaller injectate volumes in 2000-2002 are a result of reducing the injection rate to
reduce the earthquake threat following a magnitude M 4.3 earthquake on May 27, 2000 (dis-
cussed below).
4.1 Pumping Adjustments to Reduce Seismicity.
4.1.1 Reduced Injection Rate.
Prior to May 27, 2000, PVU pumped injectate at a maximum rate of 345 gal/min (gpm). Opera-
tionally this meant 3 constant-rate pumps, each operating at 115 gpm, resulting in an average
wellhead pressure of ~4,800 psi. (Note: add ~7,000 psi, the static pressure of the fluid column of
70/30 injectate in the wellbore, to approximate the injection pressure at the casing perforations,
~12,000 psi; for reference, add ~7,400 psi for the fluid column pressure of 100% PVB).
During 3-pump operations, the surface pressure on occasion approached the wellhead pressure
safety limit of 5,000 psi; at these times PVU shutdown one injection pump, reducing injection
rate, and letting pressure drop a few hundred psi before returning to 3-pump operations; this
resulted in an overall average injection rate of ~300 gpm.

15
Immediately following the May 27, 2000, M 4.3 event, PVU shutdown for 28 days. During this
shutdown period, BOR evaluated operations and its effect on seismicity and decided to change
pumping strategy to reduce the seismic threat. The new strategy reduced injection from 3 injec-
tion pumps to 2 pumps. On June 23, 2000 pumping resumed using 2 pumps, giving an injection
rate of ~230 gpm. At this reduced rate, surface pressure normalized between ~4,400 and 4,500
psi. It was believed that reducing the injection rate combined with previously-instituted bi-annual
20-day shutdowns would reduce the potential for large events.
4.1.2 Bi-Annual Shutdowns.
During 2002, PVU witnessed all or parts of three, scheduled shutdowns: 12/21/01 to 1/7/02, 6/4/
02 to 6/22/02, and 12/19/02 to 1/08/03. Scheduled shutdowns were implemented to mitigate seis-
micity following the second-largest PVU event, a M 3.3 in June 1999. Prior to the June 1999
event, we had noted that the rate of seismicity in the near-wellbore region (i.e., about 2 km from
the wellbore) reduced during and following unscheduled, maintenance shutdowns. Based on this
observation and following the June 1999 event, PVU began scheduling two, 20-day shutdowns
each year, one in December-January and one in June.
As demonstrated by the May 27th event, 20-day shutdowns alone were not sufficient for stem-
ming large event production. However, the combination of shutdowns and reduced injection rates
have, to date, reduced seismic production. Based on the 30 months of monitoring seismicity (i.e.,
6 months in 2000 and 24 in 2001-2002), this strategy has mitigated seismic event production,
inferring a reduced proclivity for larger or felt events. However, mitigation is not equivalent to
elimination. Larger (i.e., M 3 or greater) are still probable, but their rate of production seems to be
significantly reduced.
4.2 Injectate: 70/30 PVB/Fresh Versus 100% PVB.
Beginning with continuous operations in 1996, PVU diluted the injectate to 70% PVB and 30%
Dolores River fresh water. This dilution was based on a geochemical prediction then when 100%
PVB interacted with connate fluids and the dolomitized Leadville Limestone at downhole temper-

16
atures and pressures, it would precipitate calcium sulfate that would restrict permeability (Khar-
aka, 1997). During October 2001 at a meeting at the DFC, the injectate concentration question
was reconsidered. The discussions indicated that, if precipitation occurs, its maximum expected
rate is ~8 tons of calcium sulfate per day. To put this into perspective, injection at ~230 gpm,
assuming a density of 8.33 lbs/gal, gives a daily injection tonnage of ~1380 tons/day. Comparing,
the maximum expected precipitate is ~0.6% of the daily injection mass. Following these discus-
sions, it was decided that after the December-2001 20-day shutdown, the injectate would be
changed to 100% PVB. Injecting 100% PVB began on January 8, 2002 and was maintained
throughout 2002.
We are particularly interested in how this change affects the induced seismicity. Possibilities
include: (1) reduced seismicity, since flow paths become clogged and more injectate is forced into
the native porosity away from activatable faults; (2) increased seismicity, since clogging estab-
lished flow paths will cause injectate diversion into untouched reservoir regions inducing addi-
tional seismicity and expansion of the seismicity cloud, or (3) no noticeable change. To date, no
positive or negative effects on the seismicity have been found directly associated with the change
to 100% PVB. However, a larger (M2.2) event on December 16, 2002 was followed by an
increase of ~50 psi average daily (wellhead) injection pressure. To date this is the first seismic
event that may correlate with a wellhead pressure change. Shortly after this event on December
18th, PVU ceased injection, beginning its December-January, 20-day shutdown. Whether the
December 16 pressure change is associated with 100% brine injection, a simple shutting of a flow
path or paths caused by shifting from the earthquake, or neither and is coincidental but not causal
with the pressure change is still being investigated.

17
5.0 SEISMIC ANALYSIS
5.1 Local Seismic Magnitude Scale.
Typically, seismologists calculate the size of an earthquake using one or more methods. In most
cases, seismologists calculate magnitude for local events following a procedure calibrated for
local conditions. For PVSN, we compute magnitudes from the duration of the recorded signal.
This scale, called the duration or coda magnitude, is denoted MD. (For a more complete discus-
sion of the magnitude scale for PVSN see Mahrer et al., 2001)
5.2 Preliminary Event Location Method.
Accurately locating earthquakes requires (1) identifying arrival times of specific phases in the
recorded signals, (2) appropriate array geometry, and (3) an accurate velocity model of the region
through which the signals travel. As noted above, seismologists manually pick the phase arrival
times for all local earthquakes recorded by PVSN. We do this to minimize uncertainty frequently
found in automated (i.e., software-based) phase identification and arrival time picking. A mini-
mum of four arrival times from at least three stations is required to locate an event. In the PVSN
analysis, we pick the primary or P-wave arrival times from all stations with acceptable signal-to-
noise ratios. We then pick secondary or S-wave arrival times from only the three-component sta-
tions PV11 (Davis Mesa) and PV16 (Nyswonger Mesa) and from the closest single-component
station to the injection well, PV03 (Wild Steer). Although S-wave arrival times are very important
to the analysis, we use only 3 stations because the closeness of the sources to the stations and the
complexity of local geology facilitate mis-identifying the S-phase which causes mis-locating
events.
We determine preliminary earthquake locations using a flat, one-dimensional, layered earth veloc-
ity model and the computer program SPONG (Malone and Weaver, 1986). The velocity-depth
profile of the one-dimensional model is summarized in Table 5-1. The P-wave velocity depth pro-
file began with Wong and Simon (1981), to which we added results from seismic refraction sur-
veying and sonic logging. The refraction data were obtained using local mining explosions and
the sonic logs were obtained during drilling the injection well. We computed the S-wave veloci-

18
ties from P-wave velocities by assuming Poisson’s ratio = 0.25 (i.e., P-wave to S-wave velocity
ratio = 1.732). To augment our preliminary analysis, we refined the velocity model and increased
event location accuracy using seismic tomography; these are described later.
In addition to the earthquakes, PVSN records non-seismic signals. These signals are caused by
thunder, lighting strikes, landslides, low-flying aircraft, oil and gas exploration blasts, and mine
and quarry blasts. The discrimination of PVU injection-induced signals from other signals
requires processing experience and consistency. Knowing the locations of established mining
facilitates differentiating local earthquakes from blasts. Blasts signals arrive from a number of
Colorado, Utah, and New Mexico sites. The most prevalent in Colorado include a distributed area
around Uravan, Paonia (e.g., West Elk Coal Mine), Rifle (e.g., Rifle Quarry), and open-pit coal
mining west of Nucla (e.g., Western Fuels Coal Mine End). Since local explosions generate dis-
tinct waveforms (e.g., impulsive or very abrupt P-waves, unusually weak S-waves, and enhanced
surface waves for small magnitude events) our analysts can discriminate between the blasts,
regional earthquakes, and the PVU induced microseismicity. We know of no explosive sources
near the PVU injection well that produce signals that could be misidentified as injection-induced
microseismicity.
Table 5-1. PVSN 1-D Velocity Model
Depth below Surface(km)
P-Wave Velocity(km/sec)
S-Wave Velocity(km/sec)
0.00 3.595 2.076
0.20 3.950 2.281
0.60 4.330 2.500
1.00 4.650 2.685
1.40 5.050 2.916
2.20 5.100 2.945
2.80 5.340 3.083
4.00 5.420 3.129
Notes: Depth indicated is relative to a datum of +1850 m above msl. The wellhead is 1540 m above msl

19
5.3 Advanced Event Location - Seismic Modeling.
To evaluate the potential relationship of seismicity to reservoir and fluid transport characteristics,
we made a significant effort to obtain accurate earthquake locations. First, we developed a three-
dimensional velocity model for the Paradox Valley area using a progressive, three-dimensional
velocity-hypocenter inversion (Block, 1991). In this inversion, we used a data set consisting of
682 earthquakes with MD greater than 0.7 and good signal-to-noise ratios. Second, we performed
a relative relocation of as many earthquakes as possible (i.e., clean waveforms with strong signal-
to-noise ratios) using the three-dimensional velocity model developed in the first step
(Waldhauser and others, 1999). Approximately 95% of the events recorded between 1991 and
2002 had sufficient signal-to-noise ratios to be included in the relative relocation.
The immediate goal of this modeling is reducing the arrival-time root-mean-square (rms) residu-
als (i.e., the difference between the observed and the theoretical travel times). Compared to the
one-dimensional model residuals, the three-dimensional velocity model reduced the rms residuals
by ~14%. The relative relocation procedure resulted in more than a 90% reduction in rms residu-
als relative to the three-dimensional results. The final, most-accurate earthquake epicenters for the
1991 through 2002 seismic data are shown in Figure 5-1. The figure shows a pullout, close-up
with the event location symbol size minimized to emphasize the linear features in these data (dis-
4.20 5.700 3.291
4.60 5.850 3.378
5.80 5.872 3.390
11.0 5.897 3.404
18.0 6.000 3.464
40.0 7.200 4.157
Table 5-1. PVSN 1-D Velocity Model
Depth below Surface(km)
P-Wave Velocity(km/sec)
S-Wave Velocity(km/sec)
Notes: Depth indicated is relative to a datum of +1850 m above msl. The wellhead is 1540 m above msl

20
cussed below).
As discussed in previous annual reports (e.g., Ake et al., 2000; Mahrer et al., 2001), the loci of
relocated earthquakes are consistent with our interpretation that most of the tectonic stress release
takes place along (existing) linear features with orientations consistent with either the two sets of
focal mechanisms (set 1: N81W and N9E; set 2: N21W and N69E) or the two sets of fractures
observed in the oriented core samples (primary: N69W and N74W; secondary: N38W and N42W;
Ake and Mahrer, 1999). Very little seismicity appears to be occurring along planes (i.e., strike)
consistent with the Wray Mesa fault system as defined by Bremkamp and Harr (1988). Bremkamp
and Harr (1988) estimated the strike of the Wray Mesa fault system to be ~N55oW. It is likely that
Conoco-Scorup Well
PVU No. 1 Injection Well
Magnitude
3.0 to 4.3
2.0 to 2.9
1.0 to 1.9
0.1 to 0.9
-1.00 to 0
Figure 5-1. Relocated PVU Induced Seismic Events from 1991 through 2002, Close-Ups of the Two Seismic Clouds, and Relative Locations of PVU No. 1 Injection Well and Conoco-Scorup Well.

21
these features are the most through-going structures in the area. The locations of the linear fea-
tures in Figure 5-1 suggest communication through “conduits” in a ~N55oW direction. (See
Microsoft Excel animation file on attached compact disk for an interpretation of conduits super-
imposed on the seismic liner features.) We believe this behavior suggests fluid is being preferen-
tially carried along these steep planes with a northwest strike (i.e., the through-going elements of
the Wray Mesa system). Opening of these planes will require the least energy and are less likely to
induce surface-measurable events, since these planes are oriented normal to the least principal
stress direction, inferred from T-axes of the focal mechanisms (see Figure 6-20).

22
6.0 OBSERVATIONS
6.1 Local Pre-Injection Seismicity.
In the 1960’s, the US Army high-pressure injected waste fluids ~3,000 m deep at the Denver
Arsenal, north east of Denver, CO. As a result hundreds of seismic events were induced (Healy,
1968). Recognizing that the proposed injection at Paradox Valley would, most likely, induce seis-
micity, BOR decided to record pre-injection, background seismicity in the region surrounding the
proposed injection. In 1983 the US Geological Survey began installing the first 10 stations of
PVSN, PV01 through PV10 (PV06 eventually became PV15); recording seismic data began in
1986, 5 years prior to the PVU injection tests. Figure 6-1 shows the epicenters of the pre-injection
data. The data consists of a few tiny, natural earthquakes and a number of local explosions. None
of the earthquakes were within 15 km of the future injection well. Most of the local explosions are
associated with known mining and quarrying operations.
6.2 Seismic Event Production Rates.
As noted in Figure 6-1, prior to injection at PVU, the Paradox Valley region witnessed few seis-
mic events (EnviroCorp, 1995; Ake and others, 1996) and none close to the injection well site.
Between July 1991 and April 1995, PVU ran 7 injection tests. Each test consisted of a continuous
pumping period followed by a wellhead shut-in to monitor downhole pressure fall off with time.
Table 6-1 summarizes the injection tests including injected volume, pumping duration, and num-
ber of local (i.e., induced) seismic events recorded.
From the injection tests through 2001, PVSN recorded and located more than 3800 events within
10 km of the injection well. As a result, we can safely infer that PVU injection induced the events
recorded in 2002 and located within this bound.
{Note: We have found that the Earthworm system, discussed above, is less sensitive for detecting
very small events (i.e., events < M 0.0) than the system it replaced. Overall these events are not
significant, having very small signal to noise ratios (i.e., poorly constrained locations) and repre-
senting only a few percent of the old data. Therefore, for consistency with the pre-Earthworm

23
data, all subsequent discussions and figures will only use M 0.0 or greater data.}
During 2002 PVSN recorded and located 59 events with M 0.0 or greater. Compared to 2001 (84
-109.2˚
-109.2˚
-108.8˚
-108.8˚ -108.4˚
38˚ 38˚
38.4˚ 38.4˚
38.8˚
0 20 40
km
Figure 6-1. Paradox Region Seismicity, 1985-1991. Triangles show PVSN seismome-ter sites, the white outlined black circle is the injection well, the black outlined white circles are explosions, the black outline white diamonds are natural seismic events, and stars are the local municipalities (see Figure 2-1).

24
events), this is a ~29% reduction in the number of induced events. Comparing with years 2000
(282 events), 1999 (1070 events) and 1998 (1098 events) shows that the reduced injection rate
and bi-annual, 20-day shut downs continue to keep the induced-event rate low.
Figure 6-2 shows the cumulative event production and the total injection volume for years 1998
through 2002. Note decreases in average slope of the event production and their correspondence
in time with periods of zero injection (i.e., flat portions of the volume curve). This correspon-
dence supports our assessment that shutdowns reduce event production. In support of Figure 6-2,
Figure 6 -3 shows histograms of monthly injection volume and monthly event production since
continuous pumping began in 1996. (Note: There is some question as to the completeness of the
data in the later months of 1997.) Figures 6-2 and 6-3 emphasize how dramatically event produc-
tion has reduced since mid-2000 with the injection rate reduced from 345 gpm to 230 gpm.
For the years with complete data sets, 1998, 1999, 2000, 2001 and 2002, the average number of
events per day were 3.15, 3.14, 0.85, 0.23, and 0.15, respectively. Figures 6-4 and 6-5 show
events per day for these years and the years 1996 and 1997 plus average daily injection rate and
average daily wellhead pressure, respectively. In these figures, the reduced event production after
mid-2000 is dramatic.
Table 6-1. Seismicity and Injection Tests (1991-1995)
Test No. Injected Volume
Pumping Duration
No. Seismic Events
m3 days
1 11,000 14 20
2 16,00 12 9
3 54,000 54 16
4 42,000 47 0
5 54,000 28 81
6 89,000 41 150
7 354,000 232 370
Total 620,000 438 646

25
To understand the (mean) daily event rate, we combined the 2002 data with the data from the lat-
ter half of 2000 and 2001. We did this because the data naturally divides into two categories: those
recorded with injection at 345 gpm (i.e., before May 27, 2000 shutdown) and those recorded with
injection at 230 gpm (i.e., after June 23, 2000 resumption). In 2000, 130 events occurred on or
before May 27, 37 occurred during the shutdown from May 28 through June 22, and 139 occurred
from June 23 through the end of 2000. By average, this breaks down to 0.9 events per day prior to
the May 27 event, and 0.7 after the event.
First we compared the post-June 23rd 2000 mean daily event rate to the 2001 mean rate using a t-
-1000
0
1000
2000
3000
Jan-98 Jan-99 Jan-00 Dec-00 Jan-02 Jan-03
Date
Cu
mu
lati
veN
um
ber
of
Eve
nts
0
1
2
3
4
Vo
lum
e,10
6 m3
1998
1999
2000
2001
2002Volume
Events
Figure 6-2. Cumulative number of seismic events and cumulative injected vol-ume versus time. Colors correspond to noted years. Horizontal portions of vol-ume curve are shutdown periods (i.e., no injection). Note correspondence between many of the shutdowns and the change in slope (i.e., rate) of event pro-duction.

26t
test. We wanted to determine if these means, despite their numerical difference, were statistically
different. We found the mean values of post-June 23rd 2000 rate and the 2001 rate were statisti-
cally different to a 95% confidence level. We believe this shows the reduced event production fol-
lowing the reduced injection rate is not only immediate but continued to decrease into 2001. We
then t-Tested the 2002 data against the 2001 and again found these rates to be statistically differ-
ent to 95% confidence. We believe this means that the reduced injection rate has continued to
reduce event production through 2002.
To test whether the reduced injection has caused statistically significant reduced event production
following June 23, 2000, we t-Tested the mean daily event rate from 1998 through June 22, 2000,
2.7 events/day, against the mean rate from June 23rd 2000 through the end of 2002, 0.30 events/
day. The t-Test showed that these means are also statistically different to a 95% confidence level.
0
25
50
75
0
50
100
150
2001996 19981997 1999 20012000
No. of Earthquakes (M�0)
Injected Volume (Megaliters)
Biannual 20-day shut downs
Reduced Injection Rate
M 3.7 M 4.3
2002
Figure 6-3. Monthly injection volume (top) and monthly earthquake production at PVU versus time. Noted are the bi-annual, 20-day shutdown periods, reduced injection rates, and the M3.7 and M4.3 earthquakes.

27
6.3 Event Magnitudes.
As noted, the daily seismic event rate in 2002, 0.16, was substantially less than earlier years. We
believe this results from the combined shutdown periods and reduced injection rate. Similarly, in
2002, few larger magnitude events were observed. Figure 6-6 shows the event magnitude distri-
bution for 1998 through 2002. The insert shows a close up of the distribution for events MD 2.0
and larger.
Compilation of the data in Figure 6-6 shows that during 1998, 88 or 8.0% of the events were
larger than MD 1.5. During 1999, 94 or 8.7% were larger than MD 1.5. During 2000, prior to and
including the May 27th event, 11 or 8.5% were larger than MD 1.5. After pumping resumed on
June 23, 2000 only 8 or 5.5% were larger than MD 1.5; during 2001, 11 or 13% of the events were
larger than MD 1.5 and during 2002 11 or 19% of the events were larger than MD 1.5. This should
-200
-100
0
100
200
300
400
6-96 6-97 6-98 6-99 6-00 6-01 6-02
Date
Inje
ctio
nR
ate,
gal
/min
0
5
10
15
20
25
30
Eve
nts
per
Day
Figure 6-4. Number of events per day (red) and average daily injection rate (blue) versus time. Event count only includes M 0.0 and larger.
100% PVB
70/30 Mix

28
not be construed that 2001 or 2002 show a percentile increase in larger event production. First, in
2001 only one event MD 2.0 or greater was recorded; in 2002, only 3 events MD 2.0 or greater
was recorded. Second, the shape of the magnitude distribution curves for 2002 and 2001 in Fig-
ure 6-6 are different than the shapes of the curves for the previous years. In 2001 and 2002 the
distributions are nearly flat from MD 0.4 to almost 2.0. In the other years, over the same range, 0.4
to 2.0, the number of events decreased approximately by a factor of 10. Hence, these data do not
show that pumping at a lower rate increases the proclivity for producing larger events. Instead, we
believe it shows that inducing earthquakes at PVU is strongly dependent on injection rate.
6.4 Felt Events.
By the end of 2002, PVSU recorded more than 3,880 events attributed to PVU injection. Of these,
more than 99% were imperceptible (i.e., < MD 2.4) to people at the surface. From 1991 to 1996
0
1000
2000
3000
4000
5000
6000
6-96 6-97 6-98 6-99 6-00 6-01 6-02
Date
Pre
ssu
re,p
si
0
5
10
15
20
25
30
Eve
nts
per
Day
Figure 6-5. Number of events per day (red) and surface injection pressure (blue) versus time.
100% PVB
70/30 Mix

29
no events were felt. Between August, 1997 (i.e., the first reported felt event) and the end of 2001
about 12 events were felt. During 2002, two felt-events were reported to PVU: one in March and
one in December. During 1996-2002, 18 events MD 2.5 or greater were recorded, indicating not
all larger events are felt. Of the larger events, 3 occurred in 1998, 7 in 1999, and 4 in 2000. In
2000 only 1 MD 2.5-or-greater event occurred after the injection reduction following May 27. In
2001 no events MD 2.5 or greater occurred. In 2002, 1 event MD 2.5 or greater occurred.
6.5 2002 Event Locations.
0
20
40
60
80
100
120
140
0 1 2 3
Coda Magnitude, M
To
talN
um
ber
of
Rec
ord
edE
ven
ts
1998 1999 2000 2001 2002
0
5
10
15
20
2 2.5 3
Figure 6-6. Comparison of number of events per year as a function of event magni-tude from years 1998 through 2002. Insert shows blowup of distribution for magni-tudes from M 2.0 through M 3.0.

30
Figure 6-7 shows a plan view (i.e., epicenters) of the 59 earthquakes associated with the injection
during 2002 and located using the preliminary one-dimensional model. The magnitudes of these
events range from MD 0.0 to MD 2.9. With regard to magnitude, the error in locating events gen-
erally decreases with increasing magnitude. For smaller events, noise is proportionately larger,
obscuring identification of the initial P and S-arrivals. As a result, most of our conclusions for this
data set are based on events with MD > 0.6.
Figure 6-7 shows that the epicenters recorded in 2002 are, as in previous years, contained within
two groups. The first and most populated group surrounds the injection well in an elongated enve-
lope whose long axis runs approximately NW-SE and extends to a maximum of ~4 km west of the
injection well and ~2km east of the well. The second group is centered about 8 km northwest of
-10
-8
-6
-4
-2
0
2
4
6
8
10
-10 -8 -6 -4 -2 0 2 4 6 8 10
North, km
Conoco-ScorupNo. 1
Figure 6-7. Seismicity located during 2002 by PVSN using one-dimensional velocity model; 59 events plotted (triangles). Injection well is the origin of the axes; solid (black) circle is the Conoco-Scorup well. Approximate strike of Wray Mesa fault sys-tem (Bremkamp and Harr, 1988) is shown as dashed lines.

31
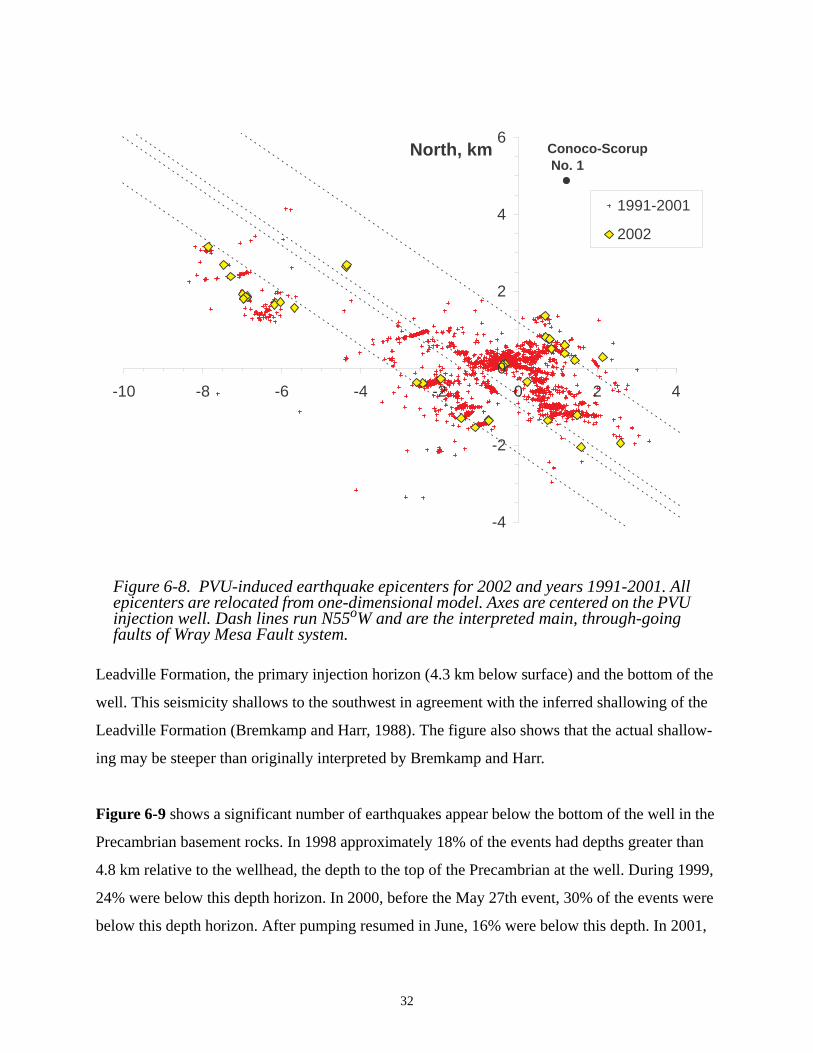
the injection well. Figure 6-8 compares the epicenters for all events from 1991 through 2001, and
the 2002 events. This figure upgrades Figure 6-7 so that all epicenters have been relocated from
the original one-dimensional model. The relocation method was discussed above and detailed in
the PVSN 2000 annual report (Mahrer et al., 2001).
As noted earlier, Figure 6-8 shows that the relocated (i.e., more accurately located) 2002 events
fall within the two groups defined by previous year events. The figure also shows dashed lines;
these lines run N55oW, the implied strike of the main faults of the Wray Mesa Fault System and
are our interpretation of candidate locations for through-going faults of the Wray Mesa System.
As discussed in last year’s annual report (Mahrer, 2002), the relocated epicenters and the shapes
of the seismic clouds align well with the strike of the fault system.
The group 8 km northwest of the well first appeared in 1997. We believe that the paucity of events
between the two groups, which has been maintained for almost 5 years, indicates the zones com-
municate hydrologically by a conduit of fluid, probably through one or more principal faults of
the Wray Mesa system. The dashed lines in Figure 6-8 show potential elements of the fault sys-
tem based on our interpretation and on Bremkamp and Harr (1988) with the west-most dashed
line aligning well with the spatial relation between the northwest epicenters and the wellbore-cen-
ter epicenters.
Complementing Figures 6-7 and 6-8, Figure 6-9 shows a NE-SW geological cross section nor-
mal to the strike of the valley and passing through the injection well. The geology, fault structures,
etc. are based on Bremkamp and Harr’s (1988) interpretation and speculation. Projected on the
cross section are all events from 1991 through the end of 2002
Figure 6-9 shows a number of features. First it shows two vertical groupings of events: one in the
Precambrian near the injection well and one starting in the Leadville and rising through the salt
about 1.5 km southwest of well. Most likely the second grouping is the actual location of the fault
Bremkamp and Harr (1988) speculated to lie about 1.5 km west of the well. Figure 6-9 also
shows that many events near the well occur at depths between the top of the Mississippi-aged
32
Leadville Formation, the primary injection horizon (4.3 km below surface) and the bottom of the
well. This seismicity shallows to the southwest in agreement with the inferred shallowing of the
Leadville Formation (Bremkamp and Harr, 1988). The figure also shows that the actual shallow-
ing may be steeper than originally interpreted by Bremkamp and Harr.
Figure 6-9 shows a significant number of earthquakes appear below the bottom of the well in the
Precambrian basement rocks. In 1998 approximately 18% of the events had depths greater than
4.8 km relative to the wellhead, the depth to the top of the Precambrian at the well. During 1999,
24% were below this depth horizon. In 2000, before the May 27th event, 30% of the events were
below this depth horizon. After pumping resumed in June, 16% were below this depth. In 2001,
-4
-2
0
2
4
6
-10 -8 -6 -4 -2 0 2 4
North, km
1991-2001
2002
Conoco-ScorupNo. 1
Figure 6-8. PVU-induced earthquake epicenters for 2002 and years 1991-2001. All epicenters are relocated from one-dimensional model. Axes are centered on the PVU injection well. Dash lines run N55oW and are the interpreted main, through-going faults of Wray Mesa Fault system.

33
Figu
re 6
-9.
Earl
y cr
oss s
ectio
n in
terp
reta
tion
of P
arad
ox V
alle
y an
d bo
rder
ing
regi
on th
roug
h PV
U in
ject
ion
wel
l an
d no
rmal
to st
rike
of t
he v
alle
y (B
ased
on
Brem
kam
p an
d H
arr,
1988
). Pr
ojec
ted
on to
cro
ss se
ctio
n ar
e al
l sei
smic
ev
ents
199
1 th
roug
h 20
02.

34
35% were below 4.8. In 2002, with the total number of events substantially less than in previous
years, about 34 of the 59 (relocated) events or 58% were 4.8 km or deeper. Note that since the Pre-
cambrian shallows to the west, these numbers represent minimum number of events in the Pre-
cambrian.
Figure 6-9 shows earthquake locations for 2002 as with previous years (Ake et al., 1999; Ake et
al., 2000; Mahrer et al., 2001) suggest that these events occur primarily over a depth interval of
3.5 to 5.5 km relative to the wellhead. Much of the activity is centered on the depth interval of the
perforations of the injection well. It needs to be recognized that the range of depths computed
using the initial, one-dimensional velocity model may be representative of the true range of
depths or the results may be controlled by the uncertainty in depth determination arising from
using a small number of vertical-component stations with a poorly constrained velocity model.
6.6 1991-2001 Near Wellbore Event Locations
For comparison with the event locations in 2002 (previous section), Figures 6-10 through 6-16
show the near-wellbore seismic event locations by years from initial injection testing in 1991-
1995 (Figure 6-10) through 2001 (Figure 6-16). This time sequence shows the growth of the
near-wellbore seismic cloud indicating that by the end of 1998, the expansion of the seismic cloud
surrounding the well had reached maturity and further expansion is very slow, if at all.
6.7 Earthquake Recurrence.
Figures 6-17 and 6-18 show calculated cumulative recurrence curves for earthquakes for the 345-
gpm injection period, 1996 to late June, 2000, and the 230-gpm injection, late June 2000 through
the end of 2002, respectively. These calculations assume a maximum magnitude of 5. The figures
begin at MD 0.5 since the data suggest this is the lower detection/location threshold (i.e., below
MD 0.5 ground motion is small and event detection is incomplete.) The (fitted) slope of the recur-
rence curves (i.e., the “b-value”) are 0.79 for the 230-gpm time period and 0.88 for the 345-gpm
period. The b-value relates the change in the number of earthquakes with a unit change in magni-

35
-5
-3
-1
1
3
5
-5 -3 -1 1 3 5
North, km
Conoco-ScorupNo. 1
Figure 6-10. 1991-1995 Near-Wellbore Epicenters. Axes are centered on injection wellhead; dashed lines are implied locations of through-going Wray Mesa normal faults.
-5
-3
-1
1
3
5
-5 -3 -1 1 3 5
North, km
Conoco-ScorupNo. 1
Figure 6-11. 1996-1997 Near-Wellbore Epicenters. Axes are centered on injection wellhead; dashed lines are implied locations of through-going Wray Mesa normal faults.

36
-5
-3
-1
1
3
5
-5 -3 -1 1 3 5
North, km
Conoco-ScorupNo. 1
Figure 6-12. 1998 Near-Wellbore Epicenters. Axes are centered on injection well-head; dashed lines are implied locations of through-going Wray Mesa normal faults.
-5
-3
-1
1
3
5
-5 -3 -1 1 3 5
North, km
Conoco-ScorupNo. 1
Figure 6-13. 1999 Near-Wellbore Epicenters. Axes are centered on injection well-head; dashed lines are implied locations of through-going Wray Mesa normal faults.

37
-5
-3
-1
1
3
5
-5 -3 -1 1 3 5
North, km
Conoco-ScorupNo. 1
Figure 6-14. 2000 January-May Near-Wellbore Epicenters. Axes are centered on injection wellhead; dashed lines are implied locations of through-going Wray Mesa normal faults.
-5
-3
-1
1
3
5
-5 -3 -1 1 3 5
North, km
Conoco-ScorupNo. 1
Figure 6-15. 2000 June-December Near-Wellbore Epicenters. Axes are centered on injection well head; dashed lines are implied locations of through-going Wray Mesa normal faults.

38
tude. In Figures 6-17 and 6-18 we annualized the data so the b-values here relate the change in
the number of earthquakes per year with a unit change in magnitude. In tectonic settings the b-
value is typically about 1 which means each unit change in magnitude corresponds to a factor of
10 change in number of events. For a b-value of 0.8, the factor changes from 10 to 10 x 0.8 or 8.
The b-values in Figures 6-17 and 6-18 are consistent with observations of earthquake recurrence
within the seismically inactive Colorado Plateau (Wong and others, 1996; LaForge, 1996). This
similarity of b-values to other studies in the Colorado Plateau support the concept that the induced
earthquakes at the Paradox site are due primarily to the release of tectonic shear-stress. This
observation agrees with our source (i.e., focal mechanism) studies of the PVSN data discussed
below.
6.8 Focal Mechanism - Preliminary Analysis.
The waveforms of the 2002 data are consistent with previous years. Hence we did not feel a need
-5
-3
-1
1
3
5
-5 -3 -1 1 3 5
North, km
Conoco-ScorupNo. 1
Figure 6-16. 2001 Near-Wellbore Epicenters. Axes are centered on injection well head; dashed lines are implied locations of through-going Wray Mesa normal faults.

39
0.0 0.5 1.0 1.5 2.0 2.5 3.0 3.5 4.0 4.5 5.00.01
0.1
1
10
100
1000
Magnitude
Cum
ulati
ve N
umbe
r of E
vent
s per
Yea
r 95% Model Bounds 95% PVSN Data Bounds PVSN Data Max. Likelihood Model
Figure 6-17. Cumulative recurrence curve for earthquakes located by PVSN near the brine injection well from 1996 through June, 2000, within a month following the M 4.3 event. Maximum likelihood model (i.e., fit) and 95% confidence bounds indicated.
0.0 0.5 1.0 1.5 2.0 2.5 3.0 3.5 4.0 4.5 5.00.01
0.1
1
10
100
1000
Magnitude
Cum
ulati
ve N
umbe
r of E
vent
s per
Yea
r
95% Model Bounds 95% PVSN Data Bounds PVSN Data Max. Likelihood Model
Figure 6-18. Cumulative recurrence curve for earthquakes located by the PVSN near the brine injection well from June 2000, a month after the M 4.3 event, through the end of 2002. Maximum likelihood model (i.e., fit) and 95% confidence bounds indicated.

40
to calculate new fault plane solutions. For completeness we repeat our statements from last year’s
report.
P-wave first motion observations are used to construct focal mechanisms for evaluating potential
fault planes and characteristics of the in situ tectonic stress field. Using earthquakes with strong
first motions and occurring over a range of locations, we constructed 75 focal mechanisms. As
with previous observations, the results are dominated by strike-slip faulting on west-northwest
trending, steeply dipping (i.e., vertical to nearly vertical) fault planes. However, several events
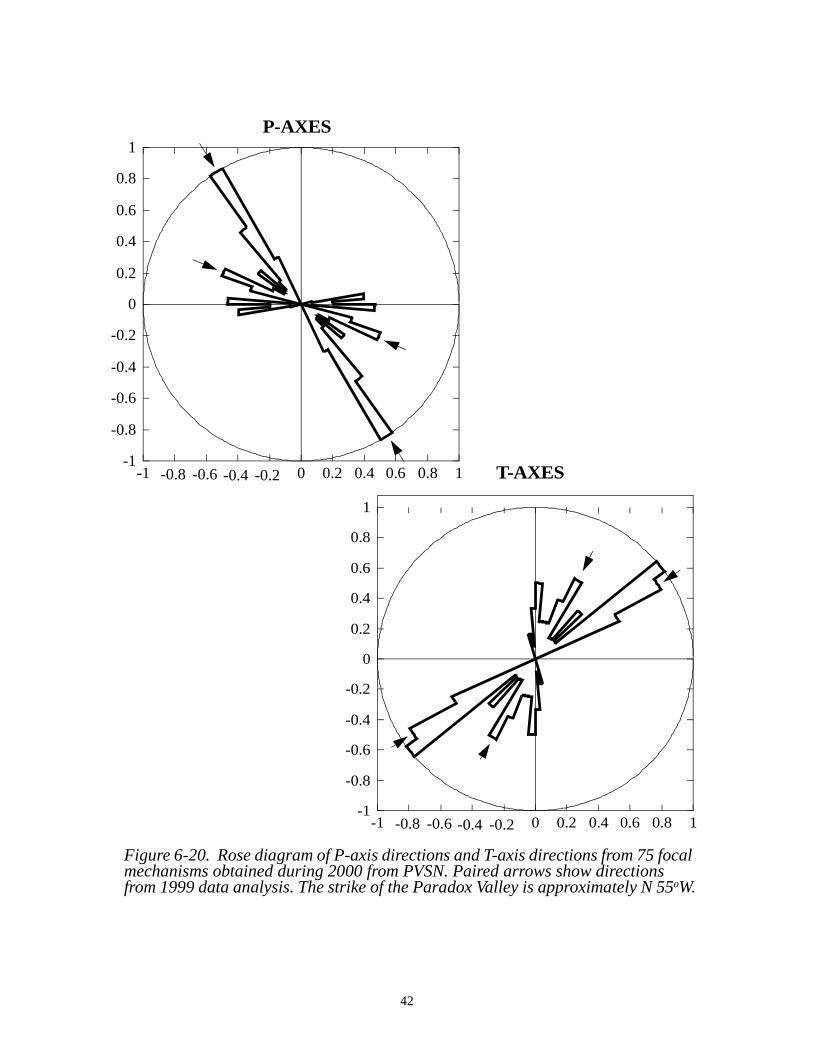
with oblique strike-slip-normal mechanisms were observed. Figure 6-19 shows a Rose diagram
of the fault plane angles of the 75 focal mechanisms. The Pressure (or P) axes and Tension (or T)
axes for these events are shown as Rose diagrams in Figure 6-20. The T-axis direction is a consis-
tent northeast direction and the P-axis is oriented northwest (~N 51oW). No difference in spatial
distribution of focal mechanism types is evident throughout PVSN’s entire data set.
6.9 Focal Mechanisms - Advanced
Focal mechanisms for the entire data set were calculated using P-wave first motion polarities and
SV/P amplitude ratios on vertical component seismograms (Kisslinger, 1980; Kisslinger and oth-
ers, 1981). A simulated annealing downhill simplex algorithm (Press and others, 1992) was used
to calculate double-couple focal mechanisms. First motions were weighted 10 times more than
SV/P ratio misfits and an L1 norm is used to calculate total misfits. The 20% of the SV/P amplitude
ratios with the worst misfit were ignored because SV/P can become unrealistically large near
nodal positions. The velocity seismograms were high-pass filtered with a one pole Butterworth
filter at one Hz and double integrated to estimate long-period displacement levels. One second P-
wave windows and 5 second S-wave windows were used to calculate long-period displacement
amplitudes. This method of calculating displacement integral amplitudes was compared to spec-
tral fitting procedures to displacement spectra and found to be more stable than spectral
approaches. A total of 28 levels were used in the simulated annealing inversions, with a maximum
of 90 function evaluations at each level. The starting level was set to a value corresponding to 60
misfitting first motions and decreased using the schedule, L = L0(1-k/K)a, where L0 is the initial
level, K is the total number of function evaluations, k is the cumulative number of function evalu-

41
ations so far, and a was set to two. At high levels, the process occasionally accepted models asso-
ciated with increases in functional misfit to inhibit convergence to a local minima. As L tended
toward zero, the inversion reduced to a simple downhill simplex algorithm (Press and others,
1992). This approach effectively eliminates the local minima convergence problems Kisslinger
and others (1981) experienced with an iterative least squares inversion approach. The azimuths
and takeoff angles from the 3D P- and S-wave velocity models were used in the focal mechanism
calculations.
Table 6-2 lists the starting simplex. Five solutions were obtained for each event, the solution
obtained with the starting simplex, and four solutions obtained by inserting each trial solution in
Figure 6-19. Rose diagram of fault plane directions from 75 focal mechanisms recorded in 2000. For comparison, paired arrows indicate directions from 1999 data analysis. The strike of the Paradox Valley is approximately N 55oW.
1-1
-0.8
-0.6
-0.4
-0.2
0
0.2
0.4
0.6
0.8
1
-1 0 0.2 0.4 0.6 0.8-0.8 -0.6 -0.4 -0.2
42
Figure 6-20. Rose diagram of P-axis directions and T-axis directions from 75 focal mechanisms obtained during 2000 from PVSN. Paired arrows show directions from 1999 data analysis. The strike of the Paradox Valley is approximately N 55oW.
1-1
-0.8
-0.6
-0.4
-0.2
0
0.2
0.4
0.6
0.8
1
-1 0 0.2 0.4 0.6 0.8-0.8 -0.6 -0.4 -0.2
T-AXES1-1
-0.8
-0.6
-0.4
-0.2
0
0.2
0.4
0.6
0.8
1
-1 0 0.2 0.4 0.6 0.8-0.8 -0.6 -0.4 -0.2
P-AXES

43
Table 1 as the new starting solution at the end of the previous solution. Several criteria were used
to determine the quality of estimated focal mechanisms. The first focal mechanism quality filter
required a minimum of seven P-wave first motions, a total of 12 SV/P amplitude ratios and P-
wave first motions, and a first-motion misfit <= 0.5. First-motion misfit was defined as the sum of
quality weight factors (Table 6-2) of first motions with incompatible polarities. Pick qualities of 0
and 1 correspond to impulsive (i.e., sharp) P-wave arrivals and pick qualities of 2 and 3 corre-
sponding to increasingly emergent (i.e., gradual) P-wave arrivals. The first-motion misfit criteria
rejected focal mechanisms with a single pick quality 0 or 1 first-motion misfits, two pick quality 2
first-motion misfits, three quality 3 first-motion misfits, or any combination of quality 2 and 3
first-motion misfits. The criteria of seven P-wave first motions establishes reasonable minimum
seismogram signal-to-noise ratios. A total of 2145 events passed the first focal mechanism quality
filter and are shown in Figure 6-21.
A second quality factor ranked the independence of the focal mechanism solutions to varying
starting solutions. The filtering criteria was that the maximum differences in P- and T-axes orien-
tations between the subset of five focal mechanism solutions must be < 20 degrees. The maximum
Table 6-2. Trial Starting Focal Mechanisms
Trial Strike (degrees)
Dip(degrees)
Rake(degrees) type
1 0 90 180 strike slip
2 270 45 -90 normal
3 180 45 90 reverse
4 300 65 135 oblique-reverse
Table 6-3. First-Motion Misfit Weights
Quality Weight
0 1.0
1 0.75
2 0.5
3 0.25

44
differences in P- and T-axes orientations were only calculated for event solutions with total L1
misfits no larger than 150% the minimum misfit. A total of 1345 well-constrained focal mecha-
nisms were obtained. These were separated into strike-slip events by imposing the constraint that
both the P- and T-axes must plunge < 25 degrees, yielding a total of 1196 strike-slip focal mecha-
nisms shown in Figure 6-21. The nodal planes were separated into two sets by removing the left
tail portion of the distribution in Figure 6-22a and placing those nodal planes into a secondary
nodal plane set. Using the two nodal plane set distributions shown in Figures 6-22b and 6-22c
reduced estimated nodal plane distribution skew from -1.7 to -0.005 and kurtosis from 5.2 to -0.86
(Table 6-4).
6.9.1 Negative kurtosis indicates a compact distribution.
If both nodal plane sets in Figure 6-21 correspond to pre-existing faults, the P axis azimuth can
vary about +/-10 about the position shown in Figure-21. If the 311° nodal set corresponds to the
normal fault orientations, the P axis could be oriented at a relatively small angle to the 311° nodal
set. For instance a P axis azimuth of 296°, places the P axis 30° from the primary nodal set azi-
muth, consistent with internal friction angles for the Leadville limestone. A P axis azimuth of
296° is within 14° of the regional P axis azimuth over the past 5 Ma in Bird (2002) (see Table 6-
5). Alternatively, the primary nodal plane set could correspond to tear faults between the normal
faults. Then both nodal plane sets correspond to relatively weak faults and the P axis azimuth is
only constrained to be between the nodal plane azimuths. The 86% proportion of events in the pri-
mary set argues for the P axis making a smaller angle with the secondary set than the primary set,
Table 6-4. Strike-Slip Nodal Plane Azimuth Statistics
Nodal Set Median Mean Std. Dev. Skew Kurtosis Events
Combined 262 257 30 -1.7 5.2 1196
Primary 266 266 19 -0.005 -0.86 1048
Secondary 311 311 3.5 0.11 -1.1 148

45
Figure 6-21. Purple dots are all epicenters. Black lines are 70 m strike-slip 227.5°-305°-azimuth nodal planes. Red 70 m line segments are 305°-355° azimuth nodal planes. Line segments > 70 m indicate nodal plane alignment for multiple adjacent events. The well-bore is shown in green (arrow at the top). Dashed blue lines show locations of normal faults at Leadville formation depths, as indicated by vertical changes in earthquake depths, well logs, and seismic reflection data. Intersecting arrows show median orienta-tions of the two nodal plane sets labeled with azimuths. Open arrow is the inferred P-axis orientation.
Wellhead
N
266×°311×°
P-axis(296°)
39 40 41 42 43 44
Grid distance N35E
-6
-5
-4
-3
-2
-1
0G
rid d
ista
nce
N55
W

46
(b)
(c)
125 130 135 140Azimuth (degrees)
0.00
0.02
0.04
0.06
0.08
0.10
Pro
babi
lity
dens
ity
220 240 260 280 300 320Azimuth (degrees)
0.000
0.005
0.010
0.015
0.020
Prob
abilit
y de
nsity
100 150 200 250 300 350Azimuth (degrees)
0.000
0.005
0.010
0.015
0.020P
roba
bilit
y de
nsity
(a)Left tail
Figure 6-22. The complete strike-slip nodal plane inventory azimuth density function in (a) has a strong left skew. Separation of the nodal-plane azimuths into a primary set (b) and secondary set (c) by placing the left tail in (a) into a secondary set (c), produces a primary set with nearly zero skew and small-tailed distributions (negative kurtosis) for both nodal plane sets in (b) and (c) as indicated in Table 3.
Primary set: 1048 events
Secondary set: 148 events

47
e.g., the P axis azimuth is probably ~295°.
6.9.2 Oblique Focal Mechanisms
Oblique focal mechanisms were defined as focal mechanism where the plunge (i.e., angle
between the vector and the surface) of the P (T) axis was >= 30° and the plunge of the correspond-
ing T (P) axis was < 25°. There were a total of 55 normal-oblique events (Figure 6-23) and 43
reverse-oblique events (Figure 6-24).
6.10 Earthquake Slip Mode.
The previous two sections present data showing that the source mechanics of the PVU earth-
quakes is shear slip on existing faults and fractures. These faults are not sufficient to hold the vol-
ume of injectate emplaced at PVU. Hence, within the formations, the injection process creates
additional “volume” (i.e., space) to accommodate the injectate. Therefore injection creates and
opens tensile fractures (i.e., hydraulic fractures) into which squirts the injectate. The question then
arises: Is any portion of the seismicity recorded by PVSN due to these tensile events? Based on oil
and gas field hydraulic fracture studies run at pressures comparable to PVU injection pressure, the
hydraulic fracture opening or aperture is on the order of a few millimeters, at most. Therefore,
with each squirt, the (new) surface area of a fracture is on the order of 10’s of square centimeters,
or less. Based on calculation of seismic moment (Wells and Coppersmith,1994), Figure 6-25
shows the slippage on surfaces this size will generate tiny events (i.e., will radiate minimal seis-
mic energy). At the surface, this radiation is well below the detection level of seismometers. In
Table 6-5. P-axis Azimuths for Colorado in the Past ~10 Ma from Bird (2002).
Feature, Location Longitude Latitude Azimuth Sigma After Before
dikes, Steamboat Springs, CO
-106.95 40.22 310 10.0 9.0 7.0
dikes, northern Routt Co., CO
-107.15 40.78 310 10.0 11.5 8.1
veins, W San Juan Mts., CO
-107.51 37.73 311 29.0 23.7 5.3

48
Figure 6-23. Purple dots are all epicenters. Black lines are 70 m normal-oblique-slip 227.5°-305°-azimuth nodal planes. Red 70 m line segments are 305°-355° azimuth nodal planes. Longer line segments indicate nodal plane alignment for multiple adjacent events. The wellbore is shown in green (arrow at the top). Dashed blue lines show approximate locations of normal-fault segments at Leadville formation depths, as indi-cated by vertical changes in earthquake depths, well logs, and seismic reflection data.
Normal-oblique events
Wellhead
N
39 40 41 42 43 44Grid distance N35E
-6
-5
-4
-3
-2
-1
0
Grid
dis
tanc
e N
55W

49
Figure 6-24. Purple dots are all epicenters. Black lines are 70 m reverse-oblique-slip 227.5°-305°-azimuth nodal planes. Red 70 m line segments are 305°-355° azimuth nodal planes. Longer line segments indicate nodal plane alignment for multiple adjacent events. The wellbore is shown in green (arrow at the top). Dashed blue lines show approximate locations of normal-fault segments at Leadville formation depths, as indi-cated by vertical changes in earthquake depths, well logs, and seismic reflection data.
Reverse-oblique events
Wellhead
N
39 40 41 42 43 44Grid distance N35E
-6
-5
-4
-3
-2
-1
0G
rid d
ista
nce
N55
W

50
addition this radiation is in the frequency band of a few 100 hertz to a couple kilohertz. Seismom-
eters, as used at PVSN, are designed to operate at frequencies below a few 10’s of Hz and lower.
Hence, based on the focal mechanics studies and the aforementioned arguments, the ground
motion recorded by PVSN is due to seismic shear events, not tensile openings.
6.11 Seismic Magnitude versus Location
One question that we have begun to examine is that with the highly accurate event location data
how the locations correlate with event magnitude? Figures 6-26 and 6-27 show all events a mag-
nitude M 1.7 and greater plotted against a background of all the events. Figure 6-26 is a plan
view and 6-27 is a depth cross section looking north. Note that all the linear features, which illus-
trate faults and fractures of the Wray Mesa system seismically activated by PVU injection, do not
host larger events. Only a subclass of the fractures and faults have larger events. Some of the frac-
tures and faults have many larger events and some have only one or two. Initially we expected the
larger events to be more uniformly distributed. Also note that a disproportionate number of larger
events occur in the second cluster, centered 8 km to the northwest of the injection well. We are
still evaluating the implications of these findings.
1.E+02
1.E+03
1.E+04
1.E+05
1.E+06
1.E+07
0 1 2 3 4 5
Moment Magnitude
Faul
t Are
a, s
q-m
Figure 6-25. Earthquake Fault Area versus Size (i.e., Moment Magnitude). Model taken from Wells and Coppersmith (1994)

51
-4
-2
0
2
4
-10 -8 -6 -4 -2 0 2 4
East, km
North, km
Figure 6-26. PVU Epicenter Map of Events with Magnitude M 1.7 and Greater (yel-low diamonds) Superimposed on All Seismicity. Origin is centered on wellhead. Note that the larger events only occur along a subset of the faults illuminated by the induced seismicity.
0
2
4
6
8
-10 -8 -6 -4 -2 0 2 4
East, km
Depth, km
Figure 6-27. Depth Map Looking North Showing Events of Magnitude M 1.7 and Greater (yellow diamonds) Superimposed on All Seismicity. Origin is injection well-head. Note that the larger events only occur along a subset of the faults illuminated by the induced seismicity.

52
7.0 MODELING ROCK PROPERTIES
7.1 Injection Data and Fracture Modeling
As noted earlier, the 2002 seismicity overlays the extent or zone defined by previous years’ seis-
micity. From this we assume that the extent of the injectate envelope is expanding very slowly and
much of the volume occupied by the 2002 inject lies within this seismicity envelope. That is, the
new volume (i.e., rock fracturing) caused by the injectate is probably occurring within the well-
centered zone defined by the seismic envelope of previous years. The persistent spatial distribu-
tion of events suggests that the occurrence of induced earthquakes at this site (and hence fluid
migration) is controlled by physical attributes, like stress, preexisting faults, planes or zones of
weakness, etc., and is not a random process.
Supporting this are the results from BORFRAC, a computer code of Envirocorp (1995) that syn-
thesized injection data based on formation parameters and fitted the synthetic data to real injec-
tion data from the 1991-1995 injection test sequence. BORFRAC synthesized the data by
modeling the well and surrounding formations and their response to high-pressure fluid invasion.
In the initial BORFRAC model, Envirocorp assumed that injection created traditional hydraulic
fracturing: single vertical fracturing divided into two wings, each extending from opposite sides
of the well at the depth of the casing perforations. This model assumes that the injectate follows
the fracture wings and diffuses into the formation through the native permeability of the fracture
walls. This type of model predicts seismic locations confined to a very narrow elliptical envelope
centered on the well and whose semi-major axial plane overlays the wings of the fracture. From
the seismic data which showed a diffused network of locations, they interpreted a network of
injectate flow paths in the Leadville Formation and recognized that the traditional, double-wing
model was not correct. Envirocorp upgraded the BORFRAC model from a double-wing fracture
to a network of fractures. Using the network model BORFRAC gave better agreement between
the model data and wellbore injection data.
7.2 Seismicity, Fault Properties, and Injectate Volume.
Since 1991, PVU has injected ~3.9 billion liters (~968 million gallons) or a volume of ~3.9 mil-

53
lion cubic meters of injectate by the end of 2002. In response to the greater than 11,000 psi pres-
sure, at the injection depth the injectate is compressed to ~93% of its surface volume or about 3.5
million cubic meters. As noted earlier, this volume of fluid must occupy existing space or create
new space within the rock matrix. The question then is where is the injected fluid being stored, in
existing space (e.g., faults, old fractures and joints, or existing pores), in new space (e.g., new
fractures), or a combination of both? It is not likely that at 4.8 km (16,000 ft) depth there is much
open space. To evaluate the existing-space hypothesis, we considered existing faults and the pos-
sibility of opening these faults.
Consider Figure 7-1, a close-up of Figure 6-8. Figure 7-1 shows that the seismic events group
linearly. As an upper bound on available fracture and fault storage volume, we have interpreted
these groupings as faults or fractures of the Wray Mesa system that have been reached (i.e., seis-
mically activated) by injectate. Note the two major groupings, near the well and northwest of the
well. Considering the northwest trend of the Wray Mesa fault system, it is likely that a northwest-
ern fault runs from the well group to the northwestern group. Based on this map and implied local
faults of Bremkamp and Harr (1988), we tallied approximately 30 km of seismically-activated
and implied fault length. We then assumed that the faults averaged about 0.5 km height, the height
of the Leadville formation. To accommodate the full injectate volume would require opening
these faults and fractures 193 mm (7.61 in). This opening is unrealistic in a rock mass at this depth
with PVU’s injectate and its pressures. Based on recovered cores from hydraulic fracture experi-
ments in the oil and gas industry (per. comm., Mike Sorrells, Teledyne Geotech), we expect the
fault openings to be a few millimeters.
If we assume that the 30 km of faults and fractures have openings between 1 and 5 millimeters,
then, at any time, only a few percent of the injectate volume can be stored in these faults and frac-
tures. This means that the injectate either has created new fractures or its has diffused into the
pore spaces of the rock mass. Considering the new fracture scenario, we calculated the length of
new fracture needed, assuming 0.5 km high fractures. The amount of new fracture is on the order
of a few thousand kilometers. This is a prohibitively large amount of fracturing. To realistically
accommodate this much fracturing requires a fractal distribution for the new fractures, which we
discuss in the next section. A second scenario is that the fluid occupies new fractures and slowly

54
diffuses into the existing pore space of the rock. This is probably the most likely scenario. How-
ever, since we cannot quantify what percentage of fluid occupies new fractures and what percent-
age occupies pore space, we will assume all the injectate occupies new fractures and show a
fractal model that is an upper bound on the amount of fracturing that could happen.
7.2.1 Fractal Model of New Fractures
To examine the fractal model we approximated the fractures-pores as a 7-step (i.e., 7-decade) dis-
tribution of penny shaped openings from 100-m radius fractures to 0.01-mm radius pores, incre-
mented by 0.1. To determine the distribution and the corresponding fractal dimension, we fitted
the fractal surface area, Af, to the surface area of a single fracture needed to accommodate the
injectate minus the volume assumed in the seismically-implied main (through-going) fractures of
-2
0
2
4
-8 -6 -4 -2 0 2
North, km
1991-2001
2002
P-axis T-axis
Figure 7-1. Close up of relocated seismic epicenters (i.e., Figure 6-8). Axis is cen-tered on injection well. Dashed lines run N55oW, the assumed strike of the Wray Mesa Fault system. Linear groupings of epicenters show (implied) seismically-acti-vated faults and (pre-existing) fractures.

55
the Wray Mesa system, As. Assuming a nominal 3-mm aperture throughout, As = 2,200 km2. Set-
ting 20 and 2,000 as bounds for the 100-m radius fractures and calculated the remaining fracture-
pores using the fractal equation ni+1=ni(ri+1/ri)-D, i = 1, 2,... 8 = incremental steps, where ni is the
number of factures or pores at the i-th size, ri is their radius, and D is the fractal dimension, we
adjusted D to best approximate Af = As. At the lower bound, n1 = 20, 100-m fractures, Af = 2045
km2 for D=2.08; at the upper bound, n1 = 2,000, the fractal area was 2091 km2 and D=2.43. Fig-
ure 7-2 shows fracture distributions corresponding to the bounds of 20 and 2,000 fractures.
7.3 Seismicity and Effective Porosity.
It is mostly likely that most of the injectate eventually migrates from the pressure-opened frac-
tures and faults, through diffusion, into the rock mass. The seismicity has allowed us to study an
aspect of diffusion, specifically the effective porosity of the rock mass.
As a first estimate for porosity we modeled the fluid volume as a vertical cylinder 2.0 km high and
1.E+00
1.E+04
1.E+08
1.E+12
1.E+16
1.E+20
1.E-03 1.E-01 1.E+01 1.E+03 1.E+05 Radius, mm
Num
ber
D=2.08D=2.43
Figure 7-2. Fractal Distribution of Penny-Shaped Fractures Needed to Accom-modate Total Volume of Injectate Minus Volume Occupying Seismically-Implied Main Faults of the Wray Mesa System.

56
growing radially. We assumed 2.0 km height since that is the maximum vertical extent of most of
the seismicity. Figure 7-3 shows the results of this modeling. The figures shows a number of fea-
tures. First, the scatter data are the horizontal distance of the seismicity from the wellbore as a
function of time. This shows the growth of the two seismic zones: the one surrounding the well
and the one ~8.5 km to the northwest. For the model diffusion model discussed below we only
consider the zone surrounding the well. Next we’ve plotted the radius of the growing cylinder
based on the injected volume, again, as a function of time. Here we modeled five porosities; in
decreasing porosities these are 0.05%, 0.01%, 0.005%, 0.0025%, and 0.001%. From smallest to
largest, these porosities span a factor of 50.
Based in the pre-2000 seismic expansion rate in Figure 7-3, the porosity models suggest a poros-
ity between 0.005% and 0.0025%. In 2000 with the inception of more shut downs and the reduced
0
2
4
6
8
10
7-91 7-92 7-93 7-94 7-95 7-96 7-97 7-98 7-99 7-00 7-01 7-02
Date
Rad
ius/
Dis
tan
ce,k
m
-5000
-4000
-3000
-2000
-1000
0
1000
2000
3000
4000
5000
Pre
ssu
re,p
si
0.001%
0.0025%
0.005%
0.01%
0.05%
Figure 7-3. Horizontal distance of seismic events from the injection well and injec-tion pressure versus time. Also plotted it the (calculated) radius of a theoretical model of an expanding cylinder model injectate for 5 rock porosities versus time. Injectate radius model uses the injected volume and assumed a fixed, 2-km height

57
injection rate in late June, the growth of seismic zone is greatly curtailed and the model no longer
fits the seismic zone expansion. This may mean that with overall reduced injection, the injectate is
not being forced to move as quickly, but instead diffuses into the existing region defined by the
extent of the seismicity. Using this scenario, a fixed region defined by the extent of seismicity, we
assumed a seismogenic volume of about 30 cubic km. With an injected volume of about 0.003
cubic km (i.e., 3 million cubic meters), this gives a porosity of 0.01%. This second value of poros-
ity is not the same as our first, but, given the impreciseness of these models, they are compatible.
For comparison, when Envirocorp (1995) ran its BORFRAC reservoir model to simulate the per-
formance of the injection well and the Leadville formation, it used 0.05% porosity.

58
8.0 CONCLUSIONS
The general objectives of recording, analyzing, and interpreting seismicity in the Paradox Valley
region were successfully carried out during 2002. The seismic data showed that the adjustment to
the PVU injection schedule in 2000 continued to reduce the level of seismicity. Relevant observa-
tions from this reporting period include:
(1) The 59 microearthquakes of 2002 located in the two seismogenic zones defined by
previous years’ microearthquake locations;
(2) As in previous years, the frequency of occurrence of observed earthquakes reduced
following periods of cessation of brine injection and following a long-term reduction
in injection rate;
(3) Induced earthquakes continued to occur approximately 6-8 km northwest of the injec-
tion well with a gap between those events and the event cloud surrounding the injec-
tion well;
(4) The spatial patterns of observed seismic sources and observed seismic source mechan-
ics seem to follow the Wray Mesa fault and fracture system and are consistent with rel-
evant tectonic stress characteristics;
(5) The seismic data from the 11 years of monitoring injection seem to indicate that a
threshold for microseismic production occurs between (the reduced) 230 gpm injec-
tion and (the previous) 345 gpm injection. Staying below this threshold seems to miti-
gate the number of events produced per year and the annual likelihood of larger
events. However, mitigation is not elimination. Although the annual probability of
larger events seems to be reduced, larger events are still probable.
59
9.0 MISCELLANEOUS
9.1 Appendix A - 2nd Well Memo
In August of 2002 we submitted a memo to PVU detailing our initial findings regarding a pro-
posed 2nd injection well. Appendix A shows a copy of that memo.
9.2 Accompanying CD
The accompanying CD contains two files: (1) a Microsoft Excel file containing the PVSN
seismic data (i.e., time, date, and location of events) and contemporaneous (average) PVU injec-
tion data; (2) a PDF file of this report.

60

61
10.0 REFERENCES
Ake, J. P., D. R. H. O’Connell, L. Block, and U. Vetter, 1996. Summary report, Paradox Valley
Seismic Network, Paradox Valley Project, southwestern Colorado (draft): Seismotectonic
Report 96-9, U. S. Bureau of Reclamation, Seismotectonic and Geophysics Group, Denver,
CO, 89 pp.
Ake, J., and K. Mahrer, 1999. 1998 Status report-Paradox Valley Seismic Network, Paradox Val-
ley Project, southwestern Colorado: Technical Memorandum No. D8330-99-016, U. S.
Bureau of Reclamation, Seismotectonics and Geophysics Group, Denver, CO, 18 pp.
Ake, J., K. Mahrer, and L. Block, 2000. 1999 Status report-Paradox Valley Seismic Network, Par-
adox Valley Project, southwestern Colorado: Technical Memorandum No. D8330-2000-012,
U. S. Bureau of Reclamation, Seismotectonics and Geophysics Group, Denver, CO, 23 pp.
Bird, P., 2002. Stress direction history of the western United States and Mexico sin 85 Ma: Tec-
tonics, v. 21, 10.1029/2001TC001319.
Block, L., Ake, J. and Mahrer, K, 2001, The Association between Seismicity Induced by Deep-
Well Injection, Injectate Migration, and Tectonic Stresses at Paradox Valley, Colorado,
abstract published in Seismological Research Letters, v72, n2, p. 286.
Block, L. V., 1991. Joint hypocenter-velocity inversion of local earthquake arrival time data in
two geothermal regions: Ph. D. Dissertation, Massachusetts Institute of Technology, 448 pp.
Bremkamp, W., and C. L. Harr, 1988. Area of least resistance to fluid movement and pressure
rise, Paradox Valley Unit, Salt Brine Injection Project, Bedrock, Colorado: Final unpublished
report to the U.S. Bureau of Reclamation, Denver, CO., 39 pp.
EnviroCorp, 1995. Report of evaluation of injection testing for Paradox Valley Injection Test No.
1: EnviroCorp Project Report No. 10Y673: Final report prepared for the U.S. Bureau of Rec-

62
lamation by EnviroCorp Services and Technology, Inc., Houston TX, 26 pp.
Healy, J.H, W.W. Rubey, D.T. Griggs, and C.B. Raleigh, 1997. The Denver earthquakes, Science,
161, p. 1301-1310.
Kharaka, Y. K. et al., 1997, Deep well injection of brine from Paradox Valley, Colorado: Potential
major precipitation problems remediated by nanofiltrations,” Water Resour. Res., v33(5), p.
1013-1020.
Kisslinger, C., 1980. Evaluation of S to P amplitude ratios for determining focal mechanisms
from regional network observations: Bulletin of the Seismological Society of America, v.
70, p. 999-1014.
Kisslinger, C., Bowman, J.R., and Koch, K., 1981. Procedures for computing focal mechanisms
from local (SV/P)z data: Bulletin of the Seismological Society of America, v. 71, p. 1719-
1729.
LaForge, R. L., 1996. Seismic hazard assessment for Navajo Dam, Navajo Indian Irrigation
Project, New Mexico: Seismotectonic Report No. 96-11, U. S. Bureau of Reclamation, Seis-
motectonics and Geophysics Group, Denver, CO, 34 pp.
Mahrer, K., L. Block, and J. Ake, 2001. 2000 Status Report-Paradox Valley Seismic Network,
Paradox Valley Project, Southwestern Colorado: Technical Memorandum No. D8330-2001-
007, U. S. Bureau of Reclamation, Seismotectonics and Geophysics Group, Denver, CO, 37
pp.
Mahrer, K., J. Ake, and L. Block, 2002. 2001 Status Report-Paradox Valley Seismic Network,
Paradox Valley Project, Southwestern Colorado: Technical Memorandum No. D8330-2002-
003, U. S. Bureau of Reclamation, Seismotectonics and Geophysics Group, Denver, CO, 35
pp.

63
Malone, S., and C. Weaver, 1986. Informal memorandum describing earthquake location program
SPONG: University of Washington Geophysics Program, Seattle, WA, 10 pp.
Press, W.H., Teukolsky, S.A., Vetterling, W.T., Flannery, B.P., 1992. Numerical recipes in FOR-
TRAN: The art of scientific computing: Cambridge University Press, New York, 963 p.
Waldhauser, F., W. L. Ellsworth, and A. Cole, 1999. Slip-parallel seismic lineations on the north-
ern Hayward Fault, California, Geophysical Research Letters, 26, No. 23, p. 3525-3528.
Wells, D.L. and K.J. Coppersmith, 1994. New Empirical Relationships among Magnitude, Rup-
ture Length, Rupture Area, and Surface Displacement, Bull. Seis. Soc. Am., 84, No. 4, p 974-
1002.
Wong, I. G., and R. B. Simon, 1981. Low-level historical and contemporary seismicity in the Par-
adox Basin, Utah and its tectonic implications: Rocky Mountain Association of Geologists-
1981 Field Conference Guidebook, p. 169-185.
Wong, I. G., S. Olig, and J. D. J. Bott, 1996. Earthquake potential and seismic hazards in the Para-
dox Basin, southeastern Utah: in Geology and Resources of the Paradox Basin, 1996 Special
Symposium, A. C. Huffman, W. R. Lund, and L. H. Godwin [eds.], Utah Geological Associ-
ation and Four Corners Geological Society Guidebook No. 25, p 251-264.

64
12.0 APPENDIX A - 2ND WELL MEMO
Following is a copy of the memo which we submitted in August, 2002 to PVU regarding a pro-posed second injection well at the site.
Date: August 7, 2002
To: Andy Nicholas, ManagerParadox Valley Unit (PVU)
From: Jon Ake and Ken Mahrer, Geophysicists, Technical Service Center
Subject: Proposed Second Injection Well-PVU
After 11 years of operation and analysis we feel that both the economic and environmental suc-cess of PVU warrant considering the implications and ramifications of a second injection well. A full analysis will require a cost and benefits analysis that includes cost of drilling, completing, and bringing a new well into the existing infrastructure; cost of operation, incremental revenue, envi-ronmental benefits, etc. In this memo we present initial technical arguments for siting a second injection well based on what we have learned from Injection Well No. 1. Below we provide rele-vant background information, summarize observations that we feel are relevant to this discussion, and finally propose preliminary locations for a second well.
Background. By design, PVU Injection Well No. 1 was sited to intersect and utilize the extensive Wray Mesa fault and fracture system both for injectate storage and as fluid conduits to smaller faults and fractures, joints, and pore spaces (i.e., the in situ porosity). Hypocenters located in the pest 10 years indicate that this design criterion was met and that the Wray Mesa has functioned and continues to function in this capacity (see Figure 1, note the linear groupings of events and the alignment of the groupings with the inferred main faults of the Wray Mesa Fault System). Given this success, a second injection well should be sited with the same consideration: intersecting an existing, pervasive fault/fracture system.
From 1991 through the end of 2001 ~865x106 gal of injectate have been pumped into the reser-voir beneath Paradox Valley. At a 70/30 ratio of Paradox Valley brine (PVB) to fresh, this corre-sponds to ~600x106 gal of PVB and ~650x103 tons of salt. Over that same 10 ½ years, the Dolores River, without PVU intervention, would have introduced ~2100x103 tons of salt into the Colorado River system. If PVU had the ability to inject more brine, there is certainly more brine to be injected.
Prior to the inception of PVU we expected that deep well injection would induce earthquakes (e.g., deep well injection at the Rocky Mountain Arsenal in the 1960's produced events around Denver). Using the Paradox Valley Seismic Network (PVSN) we have been able to record induced events and use them as a diagnostic tool for (1) adjusting injection to mitigate feelable

65
events, (2) mapping fluid migration, and (3) identifying major faults and fractures of the injection reservoir.
During the 10 ½ years of pumping, PVSN has recorded and mapped the sources of more than 3800 seismic events. These source locations cumulatively envelop a volume of between 15 and 30 km3. This volume has been quasi-stable for the last 3 to 4 years. Does this volume represent either the full extent of the injection reservoir (i.e., existing faults and major fracture system) or only the limit to which we induce detectable earthquakes, but not the full extent of the injection reservoir? At present we don't know the answer to this question.
Within the hypocenter envelope, we have identified approximately 30 km of faults (Figure 1). If we assume an average height of ~0.5 km and a maximum fault aperture of 5 mm, the identified faults give a maximum of ~7.5x10⁴ m3 of storage volume. Comparing this volume to the total injection volume, ~3.27x10⁶ m3, indicates that more than 97% of the injectate is presently stored in minor faults, fractures, joints, and pore spaces.
Over time, the final storage location for practically all of the injectate will be pore space. As long as the (injectate) fluid pressure in the faults and fractures exceeds the fluid pressure in the pore spaces, the injectate will push the pore fluids deeper into the formation and diffuse from the frac-tures and faults into the formation (i.e., the pore space). The available porosity (i.e., accessible pore volume minus connate fluid volume) of the injection reservoir gives the total available stor-age; this volume divided by its rate of filling gives an estimate of the (optimal) injection lifetime of the reservoir. We do know that we can shorten or extend the lifetime by shortening or extending the time the injectate has to displace the connate fluids. As discussed below we have extended that time using shutdown periods (a.k.a. “shut-ins”) and reduced injection rate, but with adverse effects on economic and environmental benefits.
Our analysis of the observed seismicity shows it to result from shear slip, likely across existing planes of weakness (e.g., faults, old fractures and joints, etc.). The seismicity observed at the sur-face is not caused by opening new fractures. Even though new fractures are being created by the pumping, their opening radiates only minor seismicity which cannot be observed at the surface. The surface-observable seismicity is caused by slippage across the existing planes of weakness which are nominally locked by their frictional stress (i.e., effective normal stress). Prior to any injection (i.e., before 1991) occasionally a plane of weakness broke through its frictional stress and slipped causing the minor background seismicity in the Paradox region (i.e., approximately 6 small events between 1985 and 1991). With the introduction of injection, the fluid pressure across the planes of weakness increased, reducing friction (i.e., lowering effective normal stress), liberat-ing the shear stress, and inducing the seismic events. As discussed below, we've implemented operational schemes (i.e., reduced injection rate) to keep the pressure across planes of weakness as low as possible by allowing the injectate to diffuse into the formation pores. Unfortunately, mitigating seismicity is counter to the economic and Colorado River salinity reduction benefits of PVU's mandate. Hence, the need for the second well: maintain the seismic mitigation methods while substantially increasing the injection economics and environmental benefits.
Observations. At PVU, continuous injection began the second half of 1996. Since then, we have noted three important injection characteristics germane to this discussion.

66
1. Operations have been punctuated with approximately a dozen shut-in periods (i.e., ces-sation of injection) that range from a few days to a maximum of ~70 days.
2. Beginning in mid-1999 (due to the occurrence of several felt earthquakes), we modified operations so that injection ceased for ~20 days twice each year.
3. Between 1996 and mid-2000, normal operations consisted of three pumps operating at a nominal injection rate of 345 gal/min and nominal surface pressure of ~4850 psi. In June, 2000 after a month-long shut-in following an M 4.3 event (the biggest induced event to date), operations were resumed at a reduced injection rate, using only two pumps yielding a nominal injection rate of 230 gal/min and nominal surface pressure of ~4400 psi.
With regard to inducing seismicity, we correlate these characteristics with the following effects (see Figure 2):
1. Practically uninterrupted pumping at a rate of 345 gpm from mid-1998 to mid-1999 cre-ated the highest rate of seismic event production. (Data: Between mid-1997 and mid-1998 with one 71-day shut-in period, there were 711 record events; from mid-1998 through mid-1999 with one 6-day shut-in near the end of the period, there were 1112 events recorded; and for the same months in 1999 through 2000 with ~5 shut-ins, there were 586 events.)
2. Periodically shutting down appears to reduce the induced seismic activity. We feel these shut-down periods allow the injectate to diffuse into the pore spaces while pressures fall off within the faults and fractures. This keeps effective normal stresses on the planes of weakness higher and reduces the likelihood of seismic slip.
3. Allowing the injectate to diffuse by periodically shutting down has reduced the rate at which larger magnitude events are produced
.4. Pumping at the reduced injection rate (i.e., two pumps instead of three) has further mit-igated the induced seismic activity. This observation suggests that the diffusion from the fractures into the formation is highly dependent on the rate of injection.
These observations suggest that a return to 345 gpm, continuous pumping of PVU Injection Well No. 1 is not prudent. It would, most likely, create unacceptable levels of seismicity. In contrast, the level of seismicity observed under the current operating procedures is acceptable and we expect will continue to produce acceptable levels of seismicity in the long-term. Unfortunately, pumping at the reduced rate plus two, 20-day mandated shut-in periods each year has significantly reduced revenue and environmental benefit from the project. Further, the injection of a 70/30 mix from 1991-2001 has consumed ~30% of the storage used to-date, removed some fresh water from the Dolores River, and produced no economic benefit. These facts all suggest that it is prudent at this time to consider the development of a second injection well at PVU.
Implications of a Second Well:1. As discussed above, pumping at reduced injection rates and with schedule shut-ins has

67
reduced benefits. (a mandated shut-down for 40 days per year @ 230 gpm injection means ~13.2 million gallons of lost injection which, in turn, means ~14,400 tons of salt @ 70/30 PVB/fresh or 20,500 tons @ 100% PVB entering the river system.) The revenue associ-ated with this lost injection could conceivably be realized using a second well.
2. We plan to site the second well so that its injection reservoir would be isolated from Injection Well No. 1's reservoir. At the simplest level, this would effectively double the total project life. However it is most likely that one plus one will be greater than two; giving a reservoir more than the 40 days per year shut down presently used, should extend its life.
3. The possibility that each well may operate for ~6 months/year should significantly reduce the production of larger seismic events (if 20 days of shut-in time is good, 180 should be much better). Based on what we have observed in the most recent 20 day shut down, the down-hole, near well-bore pressures should be restored to near ambient condi-tions well before 180 days. This may allow considerable flexibility in selecting operational schemes (e.g., operating both wells during times of increased ground water flow into the river etc.).
Preliminary Siting Considerations. At this time we suggest two possible locations for a second well. This not to say these are the only two possibilities. The first is the alternative site identified during the initial well-site selection process, twinning the Connect-Scorup No. 1 well (Figure 1) near the center of the valley (across the Dolores from the extraction well field). This site was iden-tified by Harr and Bremkamp as having good porosity and permeability in the Leadville Forma-tion. The geologic cross-sections drawn through the valley (Figure 3) show a fault with significant throw near the site of the existing well. We hope this fault(s) would serve a similar function as the Wray Mesa fault system near Injection Well No. 1 (a major conduit to allow communication with a large number of smaller fractures). This site has the advantage of being spatially near the extrac-tion field which should reduce infrastructure development costs. The fault system beneath the val-ley should be hydrologically isolated from the Wray Mesa system and we would expect no pressure interference between the two reservoirs. However, a disadvantage of this site would drill-ing nearly the entire well through the Paradox salt. This could add significant cost to drilling, cer-tainly to completion costs, and risk costs.
The second site we tentatively identify is southeast of the existing well along the trend of the Wray Mesa fault system a distance of ~8 km east-southeast of the current well. As mentioned, we feel the Wray Mesa system has provided very effective transport of fluid away from the injection well to numerous smaller fractures, faults, etc. We choose a set-off distance of ~8 km as that appears to be the maximum distance we have produced earthquakes from the existing well. This site would have the advantage of being remote from the major population centers of the valley in an area used for low-density grazing. The disadvantages are the greater distance from the extrac-tion well field and exploiting the Wray Mesa system (we can't guarantee complete reservoir isola-tion). However, we would likely not be drilling through salt for the entire depth of the well. Based on Figure 4, a fluid pressure map of the Leadville Formation, adapted from Harr and Bremkamp's investigations prior to any injection at PVU, this site is also up gradient from the existing injection well which will likely produce a spatial bias in pressures toward the northwest.

68
Proposed Actions. We have considered the next steps and have put together the following list. The list represents only our ruminations. It is certainly not complete and is neither prioritized nor ordered by impor-tance.
-Define the various realistic options and implications for a second injection well.
-Reprocess existing seismic reflection data to better define major faults within the Lead-ville.
-Revaluate the original Harr and Bremkamp investigations of the 1980's and determine if an update investigate is called for.
-Since a lot of geophysical explorations have been done in the region since the late 1980's, contact oil and gas companies who have done the investigations and open up a dia-logue.
-Begin soliciting cost estimates for the various options.
-Begin a dialogue with EPA regarding the permitting process.
Proposed Next Step. We feel that the next step should be a meeting of all concerned participants to evaluate options, consider obstacles, etc.; set up a schedule for subsequent stages; and assign tasks.
This summarizes our current thoughts on this issue. We would strongly urge the project to evalu-ate potential sites and associated costs for a second well at the PVU. We would appreciate any thoughts that you might have.

69
-4
-2
0
2
4
6
-10 -8 -6 -4 -2 0 2 4
North, kmConoco-Scorup No. 1
Figure 1. Map View of 1991-2001 Induced Events at PVU. Dashed lines show inferred main faults of Wray Mesa system. Axis is centered on PVU Injection Well No. 1.

70
0
20
40
60
0
50
100
150
2001996 19981997 1999 2001
Number of Earthquakes (M=0)
2000
Injected Volume (millions of liters) Biannual 20-day shut downs
Reduced Injection Rate
M3.7 M4.3
Figure 2. Comparison of Injection Volume per Month and Number of Induced Seismic Events per Month. Also shown are changes injection strategies and the times of the two largest events.

71
Figure 3. Geological Cross Section Perpendicular to Paradox Valley and Running through Injection Well No. 1. Induced seismicity near the injection well is shown as are the Union and Conoco wells.

72
Figure 4. Map View of Paradox Region, Fluid Pressure Contours of the Leadville Formation Proposed by Harr and Bremkamp, and the Epicenters of the Local Seis-micity Including the Seismicity Induced by PVU.