Technical Report TR12-5 January 2012 Ag...
31
Technical Report TR12-5 January 2012 Ag ricultural Experiment Station College of Agricultural Sciences Department of Horticulture and Landscape Architecture Department of Soil and Crop Sciences Extension Arkansas Valley Research Center 2009 Reports
Transcript of Technical Report TR12-5 January 2012 Ag...

Technical Report TR12-5 January 2012
Ag ricultural Experiment Station
College of
Agricultural Sciences
Department of
Horticulture and
Landscape Architecture
Department of
Soil and Crop
Sciences
Extension
Arkansas Valley Research Center
2009 Reports
COLORADO STATE UNIVERSITY
Agricultural Experiment Station
Arkansas Valley Research Center – 2009 Reports
Editor: Michael Bartolo, Manager, Arkansas Valley Research Center
Funding Provided by the Colorado Agricultural Experiment Station
Acknowledgements:
The projects described in this report would have not been possible without
the hard work and dedication of Kevin Tanabe, Lane Simmons, and Jeff
Davidson. We also would like to thank Ray Muniz and the student hourly
workers for their efforts. We appreciate the support of numerous growers,
community members, on-campus faculty and staff, and graduate
students who have contributed greatly to the operation of the Research
Center.
Disclaimer:
Mention of a trademark or proprietary product does not constitute
endorsement by the Colorado Agricultural Experiment Station.
Colorado State University is an equal opportunity/affirmative action
institution and complies with all Federal and Colorado State laws,
regulations, and executive orders regarding affirmative action
requirements in all programs. The Office of Equal Opportunity is located in
101 Student Services. In order to assist Colorado State University in
meeting its affirmative action responsibilities, ethnic minorities, women,
and other protected class members are encouraged to apply and to so
identify themselves.
Cover: Cantaloupe grown in drip irrigation trials.

Arkansas Valley Research Center Rocky Ford, Colorado
Staff
Michael Bartolo Manager, (Horticulture)
Lane Simmons Research Associate
Kevin Tanabe Research Associate
Cooperators
Lee Sommers, Director, CSU Agricultural Experiment Station
Frank Johnson, Associate Director, CSU Agricultural Experiment Station
Gary Peterson, Department Head, Soil and Crop Sciences
Steve Wallner, Department Head, Horticulture and Landscape Architecture
Ardell Halvorson, Soil Scientist, USDA-ARS
Jerry Johnson, Crop Scientist, C.S.U., Department of Soil and Crop Sciences
Scott Haley, Wheat Breeder, C.S.U., Department of Soil and Crop Sciences
Kevin Larson, Crop Scientist, C.S.U., Plainsman Research Center
Jim Hain, Research Associate, C.S.U., Department of Soil and Crop Sciences
Curtis Reule, Soil Scientist, USDA-ARS
Howard Schwartz, Plant Pathologist, C.S.U., Dept. of BSPM
Lorenz Sutherland, Soil Scientist, USDA-NRCS
Whitney Cranshaw, Entomologist, C.S.U., Dept. of BSPM
Dale Straw, Colorado Division of Water Resources
Tom Ley, Colorado Division of Water Resources
Jim Valliant, CSU Extension and Agricultural Experiment Station
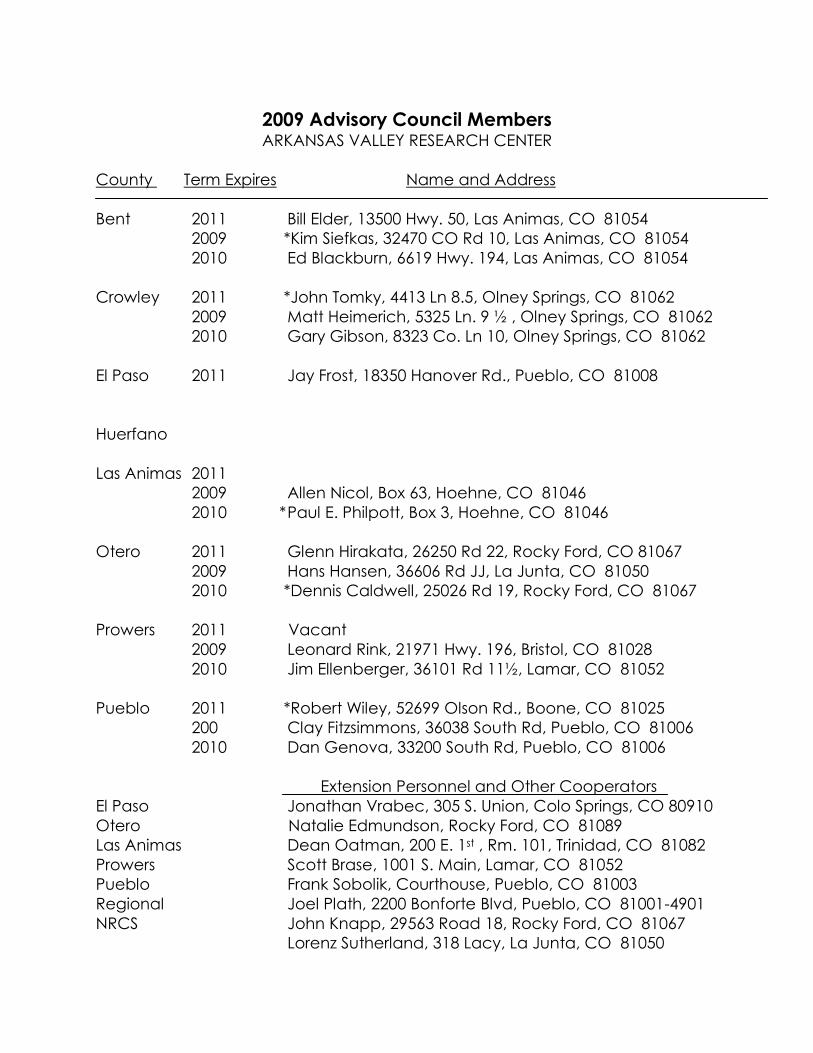
2009 Advisory Council Members ARKANSAS VALLEY RESEARCH CENTER
County Term Expires Name and Address
Bent 2011 Bill Elder, 13500 Hwy. 50, Las Animas, CO 81054
2009 *Kim Siefkas, 32470 CO Rd 10, Las Animas, CO 81054
2010 Ed Blackburn, 6619 Hwy. 194, Las Animas, CO 81054
Crowley 2011 *John Tomky, 4413 Ln 8.5, Olney Springs, CO 81062
2009 Matt Heimerich, 5325 Ln. 9 ½ , Olney Springs, CO 81062
2010 Gary Gibson, 8323 Co. Ln 10, Olney Springs, CO 81062
El Paso 2011 Jay Frost, 18350 Hanover Rd., Pueblo, CO 81008
Huerfano
Las Animas 2011
2009 Allen Nicol, Box 63, Hoehne, CO 81046
2010 * Paul E. Philpott, Box 3, Hoehne, CO 81046
Otero 2011 Glenn Hirakata, 26250 Rd 22, Rocky Ford, CO 81067
2009 Hans Hansen, 36606 Rd JJ, La Junta, CO 81050
2010 *Dennis Caldwell, 25026 Rd 19, Rocky Ford, CO 81067
Prowers 2011 Vacant
2009 Leonard Rink, 21971 Hwy. 196, Bristol, CO 81028
2010 Jim Ellenberger, 36101 Rd 11½, Lamar, CO 81052
Pueblo 2011 *Robert Wiley, 52699 Olson Rd., Boone, CO 81025
200 Clay Fitzsimmons, 36038 South Rd, Pueblo, CO 81006
2010 Dan Genova, 33200 South Rd, Pueblo, CO 81006
Extension Personnel and Other Cooperators
El Paso Jonathan Vrabec, 305 S. Union, Colo Springs, CO 80910
Otero Natalie Edmundson, Rocky Ford, CO 81089
Las Animas Dean Oatman, 200 E. 1st , Rm. 101, Trinidad, CO 81082
Prowers Scott Brase, 1001 S. Main, Lamar, CO 81052
Pueblo Frank Sobolik, Courthouse, Pueblo, CO 81003
Regional Joel Plath, 2200 Bonforte Blvd, Pueblo, CO 81001-4901
NRCS John Knapp, 29563 Road 18, Rocky Ford, CO 81067
Lorenz Sutherland, 318 Lacy, La Junta, CO 81050

TABLE OF CONTENTS FIELD CROPS
Field Crop Variety Performance Trials …………….…………………………….
Alfalfa ……….……………….…………………………………………………. 1
Winter Wheat .…………….…………………………………………………... 2
Field Corn …….…………..……………………………………………………. 3
Corn Glyphosate Antagonism Trial ……………………………………………... 4
Corn Fallow Trial ……………………………………………………………………. 6
VEGETABLE CROPS
Onion Variety Trial ………………………..………………………………………… 8
Onion Thrips Tolerance Trial ……………………………………………………… 11
Effect of Water Quality on Cantaloupe Yield and Quality…………………. 14
Effect of Water Quality on Watermelon Yield and Quality………...………. 18
Organic Seed Production Trial ……………………….………………………….. 22
Cantaloupe Foliar Nutrient and Growth Regulator Trial ……………………. 25

1
Alfalfa Variety Performance Test at Rocky Ford - 2009
Michael E. Bartolo1
Summary
The 2009 results of Colorado State University’s alfalfa variety test at Rocky Ford are presented below in Table 1. Plots were planted on August 10, 2007 and data for 2009 are for the second year of a three-year testing period. The field is furrow-irrigated and appropriate measures were taken to maintain the plots in a pest-free condition. The summer of 2009 was fairly normal and harvest conditions were generally good for all cuttings. Table 1. Forage yields of 15 alfalfa varieties at the Arkansas Valley Research Center at Rocky Ford in 2009.
Variety Source 1st
Cut
June
4
2nd
Cut
July
15
3rd
Cut
Aug
25
4th
Cut 2-yr
Oct Total Total
5
--------------------------- tons per acre ------------------
Magnum VI Dairyland Seed Co. 2.95 2.75 2.01 1.01 8.74 15.23 Medalist Intermountain Farmers 2.84 2.45 2.19 1.09 8.59 15.00 Masterpiece JR Simplot Co 2.79 2.42 2.14 1.15 8.51 14.95 WL 363HQ W-L Research 2.80 2.37 2.17 1.22 8.58 14.92 FSG 5285F Allied Seed 2.61 2.25 2.09 1.14 8.09 14.89 LegenDairy 5.0 Croplan Genetics 2.64 2.41 2.21 1.10 8.37 14.74 5454 Pioneer 2.66 2.34 1.98 1.02 8.02 14.63 Integra 8400 Wilbur-Ellis Co. 2.76 2.24 2.19 1.14 8.34 14.56 Oneida Cornell University 2.59 2.50 2.03 1.06 8.20 14.54 Vernal USDA-WI AES 2.88 2.36 2.09 1.08 8.41 14.51 Lariat JR Simplot Co 2.65 2.42 1.99 1.10 8.18 14.40 CW 500 Producer’s Choice 2.58 2.58 1.98 1.15 8.30 14.47 PGI 424 Producer’s Choice 2.54 2.40 1.90 1.08 7.93 14.27 Ameristand 407TQ
America’s Alfalfa 2.76 2.10 2.07 1.09 8.03 14.25
WL 343 HQ W-L Research 2.58 2.18 1.89 1.11 7.76 13.79 Average 2.71 2.40 2.06 1.10 8.27 14.61 CV (%) 12.05 10.29 8.74 5.42 6.18 LSD (0.1) 0.39 0.29 0.21 0.07 0.61
*Yields were calculated on an air-dry basis. Site Information: Elevation 4178 ft Soil: Rocky Ford Silty Clay Loam Precipitation - April 1, 2009 to Sept 30, 2009 = 7.81 inches Last Spring Frost – April 8, 2009 / First Fall Frost – October 2, 2009

2
2009 Research Reports
Jerry Johnson, Scott Haley, Kevin Larson
and Michael Bartolo
Colorado State University
Variety Yield Test Weight Height Lodging BYDV
bu/ac lb/bu in scale 1-
9* scale 1-9**
Aspen 107.0 55.5 35 2 4
Settler CL 106.2 58.5 36 1 1
Thunder CL 105.9 56.1 37 4 2
CO04393 105.7 59.0 37 5 3
TAM 111 101.9 59.3 38 4 3
Keota 100.7 58.2 40 4 1
Jagalene 100.5 58.0 38 3 4
CO04499 95.8 58.6 40 6 2
Hitch 94.1 56.4 36 4 4
Prairie Red 91.6 56.6 34 8 1
Ripper 91.1 54.5 35 6 3
NuDakota 90.5 55.3 36 3 6
Bond CL 89.2 56.1 38 5 3
Armour 88.3 55.6 32 5 2
Anton 85.9 58.7 38 4 4
Danby 85.6 57.7 38 9 3
OK Rising 81.7 56.7 36 1 3
Fuller 80.3 55.7 35 6 4
Yuma 79.5 55.7 36 5 6
CO03W054-2 79.0 56.3 37 8 3
TAM 112 78.7 58.1 36 8 2
AP00x0100-51 78.4 54.9 36 3 4
Ankor 77.3 54.5 37 7 3
Mace 76.4 55.9 37 2 5
Bill Brown 76.2 56.7 34 7 6
Hawken 70.9 54.3 31 6 5
Hatcher 62.3 54.9 34 8 3
CO03064-2 61.7 54.9 37 6 7
Trial Average 87.2 56.5 36 5 4
LSD(0.30) 4.7
Harvest date: 7/13/2009 Planting date: 10/7/08

3
2009 Irrigated Corn Variety Performance Trial at Rocky Ford
Jerry Johnson, Michael E. Bartolo, and Jim Hain
Grain Test Plant Plant
Hybrid Yield Moisture Weight Height Population Lodging
bu/ac % lb/bu in plants/ac %
Croplan 6168 297.6 17.5 58.9 93.3 34848 3.7
Triumph 1536 H 267.4 16.6 58.6 90.7 32670 1.3
Mycogen 2T789 274.6 16.4 58.6 92.3 32670 3.3
Mycogen 2T804 296.2 16.6 58.9 91.3 34122 2.3
LG Seeds 2V732 288.6 16.2 58.0 89.7 36300 1.3
Triumph 7514X 278.2 16.9 57.7 87.7 34848 1.7
LG Seeds 2619VT3 291.1 16.7 57.5 93.0 36000 0.3
LG Seeds 2642VT3 297.2 17.0 57.2 91.3 35574 0.7
Syngenta NK N72K-GT/CB/LL 296.2 17.6 56.7 95.0 34848 3.7
Syngenta NK N74C-3000GT 286.2 17.1 57.9 93.7 34848 0.0
Triumph 1305X 259.8 16.0 58.0 89.0 35574 2.0
Average 284.8 16.8 58.0 91.5 34755 1.8
LSD0.30 16.5 LSD.05 32.3
LSD0.30 is the most useful for producers using these results to select a variety but some collaborators find LSD0.05 useful. Experimental Design: randomized complete block, 3 replications.
Harvested Plot size: 5' x 30' Site Information Collaborator: Arkansas Valley Research Center (Mike Bartolo)
Soil type: Rocky Ford silty clay Previous Crop: Alfalfa
Planting Date:
4/30/2009
Irrigation: furrow Fertilization: N-P-K (202-104-0) lb/ac
Herbicide: Dicamba Insecticide: Comite II

4
2009 Research Reports
Michael Bartolo and Jeff Davidson
Arkansas Valley Research Center
Colorado State University
Corn used for grain or silage is an important crop in the Arkansas Valley and other regions of the state. The majority of the corn grown in the Arkansas Valley is genetically-modified and often contains resistance to the herbicide glyphosate. Glyphosate-resistant or “Round-up Ready” corn has proven to be an important component of a successful weed control program. Although glyphosate is a valuable tool in corn production, there has been some concern that, under certain circumstances, glyphosate applications may depress yields. Because of this potential, this study was conducted to determine the effect of glyphostate applications on corn grain yield on two different corn hybrids. In addition, the effects of a commercially available foliar fertilizer, sprayed in conjunction with glyphosate, were also assessed. Overall, there was not a significant (p=0.1) decrease in grain yield by the application of glyphosate compared to an unsprayed control. Conversely, the unsprayed controls had lower yields in both varieties. The addition of a commercially available foliar fertilizer did not improve yields when applied in combination with glyphosate. However, when sprayed alone, the foliar fertilizer did improve yield above the unsprayed control. METHODS This study was conducted with conventional tilled, furrow-irrigated corn on a calcareous Rocky Ford silty clay loam soil at Colorado State University’s Arkansas Valley Research Center (AVRC) in 2009. The Center is located near Rocky Ford, Colorado. The plot area had previously been in alfalfa during 2008. The corn hybrid CROPLAN 6818 (114 days) was planted on April 30, 2009 at a seeding rate of about 32,000 seeds per acre. A single line of corn was planted on top of the bed with a 30 inch row spacing (furrow to furrow). Conventional corn production practices were used throughout the course of the season. Irrigation was by gravity-flow furrows with water being applied to every other furrow (every 60 inches). One or two spray treatments were applied depending on the treatment, occurring on June 12 and June 24 at the V3 and V7 stage of corn development, respectively. All materials were applied with a hand-held sprayer (2 gal. capacity) in water (30 gal per acre). A randomized complete block design with 4 replications was used. Each plot was 4 beds wide (10 feet) and 36 feet long. The corn was harvested at full black layer maturity on October 31.

5
Table 1: Yield (bu/acre) of corn grown for grain following applications of glyphosate and foliar fertilizers. All yields were adjusted to a grain moisture content of 15.5%.
Treatment
Rate
Yield bu/acre
(adjusted to 15.5 % moisture and a bu. weight
of 58.8 lbs)
Unsprayed Control (Conventional) - 276.6 Roundup Weather Max + Class Act NG
22 fl oz/a 2.5% v/v
287.8
AGM 07027 (Conventional) 1 qt/a 274.2 Roundup Weather Max + Class Act NG + AGM 07027
22 fl oz/a 2.5% v/v
1 qt/a
282.7
Roundup Weather Max + Class Act NG + AGM 07027 + AGM 08005
22 fl oz/a 2.5% v/v
1 qt/a 3.2 fl oz/a
272.2
Roundup Weather Max + Class Act NG 12 Days Later
Roundup Weather Max + Class Act NG + AGM 07027
22 fl oz/a 2.5% v/v
22 fl oz/a 2.5% v/v
1 qt/a
286.1
Roundup Weather Max + Class Act NG
66 fl oz/a 2.5% v/v
301.8
Roundup Weather Max + Class Act NG + AGM 07027
66 fl oz/a 2.5% v/v
1 qt/a
284.6
Roundup Weather Max + Class Act NG 12 Days Later
Roundup Weather Max + Class Act NG + AGM 07027
22 fl oz/a 2.5% v/v
66 fl oz/a 2.5% v/v
1 qt/a
275.9
lsd(0.1) 11.6 This work was generously supported by Winfield Solutions under the direction of Mr. Joe Bush.

6
2009 Research Reports
Jim Valliant and Mike Bartolo
Arkansas Valley Research Center
Colorado State University
Water sales in the Arkansas River Valley of Colorado have been on a “buy and dry” basis for many years. Agricultural water rights have been sold to cities on the front range and the previously irrigated land removed from production. These lands revert to dry land production and, in the arid environment of Southeastern Colorado, have limited agricultural productivity. In many instances, these lands have serious erosion and weed problems. An alternative to water sales is the temporary leasing of agricultural waters to the cities, particularly in times of drought. Water leases give the shareholders a new crop, “water”, and provide additional revenue. In a leasing program, land is not permanently dried up but is fallowed or set aside from irrigation for a number of years, depending on the conditions of the lease. Leasing of agricultural waters could improve the economic stability of the agricultural-dependent communities of the Arkansas Valley. Growers could keep much of their land under production, fallowing only the necessary acres to meet the needs of the leasing agreements. Several ditch companies have already leased water and others are looking at the possibility of leasing water collectively as a group (Super Ditch). At this time, however, it is not clear how fallowing will affect yields, nutrients needs, ability to come back into production, and overall economics. This study attempts to address those issues. Methods This study was conducted with conventional tilled, furrow-irrigated corn on a calcareous Rocky Ford silty clay loam soil at Colorado State University’s Arkansas Valley Research Center (AVRC) starting in 2007. The Center is located near Rocky Ford, Colorado. The plot area had previously been in corn during 2006. The corn hybrid RX752RR/YGPL (Dekalb) was planted in late April in each year. The crop was seeded at a rate of about 32,000 seeds per acre. A single line of corn was planted on top of a bed with a 30 inch row spacing (furrow to furrow). Conventional corn production practices were used throughout the course of the season. Irrigation was by gravity-flow furrows with water being applied to every other furrow (every 60 inches). The trial was

7
arranged in a complete block design with four replications. Starting in 2007, one treatment was planted to corn and the remaining three treatments were fallowed. In each subsequent year, one additional treatment was planted to corn. Fallowed treatments were managed to maintain low weed growth and prevent soil erosion. The sequence of treatments are described in the table below:
Treatment 2007 2008 2009 2010
1. corn corn corn corn 2. fallow corn corn corn 3. fallow fallow corn corn 4. fallow fallow fallow corn
Grain yields were collected in October or November of each season. Yield samples were taken within each treatment plot and assessed for total weight, moisture content, and grain bushel weight. In addition to yield, soil nutrient status was monitored via soil samples taken at depths of 0-8”, 8-16”, and 16-24”. All production practices, including the practices and costs necessary to maintain the fallowed lands, were recorded. Results Table 1: Yield (bu/acre) of corn grown for grain following different fallowing periods. All yields were adjusted to a grain moisture content of 15.5%.
Treatment 2007 2008 2009 2010 Yield Bu/acre
1. 187.1 232.8 204.4 corn 2. fallow 233.0 205.1 corn 3. fallow fallow 204.7 corn 4. fallow fallow fallow corn
lsd(0.1) 38.72 14.3 Discussion Through the 2009 season, no significant yield differences have been realized as a result of either one or two years of fallowing compared to a continuously cropped treatment. After two years of fallowing, fertilizer applied during the 2007 season was still available for a crop grown in 2009. Specific fertility and production costs data will be presented in subsequent reports.

8
2009 Vegetable Crop Reports
Mike Bartolo Arkansas Valley Research Center
Colorado State University
PRODUCTION INFORMATION
Plots - Planted 20' long X 2 rows on beds spaced 30” on centers. Rows were spaced 10"
apart on top of the bed. Plants were hand-thinned to an in-row spacing ~3”. Yield was
determined from an 8’ bed section (8’ X 2 rows) of the plot. Each plot was replicated
four times in the trial.
Planted - March 16th, 2009
Fertilizer - 104 lbs. P2O5/A and 22 lbs N/A as 11-52-0 - preplant. ~ 100 lbs. N/A residual (in
top 18”) and 34 lbs N as 46-0-0 supplied via irrigation water.
Weed Control - Roundup on April 8th ; Goaltender, Trigger, and Prowl-H20 on May 6th ;
Goal 2E, Starane Ultra, and Outlook on May 20th ; Trigger and Crop Oil on June 1st ;
Goal 2E, Prowl-H20, Dual Magnum on June 16th ; Dual and Goaltender on July 13th ;
Hand weeded 2 times
Insect Control – Movento on June 27th ; Azadirect on July 13th ; Azadirect on July 24th
Disease Control- Dithane and Champ on July 24th
Irrigation – The plots were irrigated multiple (12) times via gravity-flow furrows. The
amount of irrigation water (consumptive use) was approximately 30” and seasonal
precipitation was 7.95”.
Harvest – September 14th
Grade – October 23rd
Comments
The 2009 season was good for onion production with ample irrigation water and
relatively normal growing conditions. No disease problems were detected. Specifically,
there was no Iris Yellow Spot Virus or Xanthomonas detected in the plots. The plots
escaped any significant storm damage. Thrips populations were moderate and were
fairly easy to control. Please contact Mike Bartolo at the Arkansas Valley Research
Center (phone: 719-254-6312; e-mail: [email protected]) for additional
information.

9
ONION VARIETY TRIAL Arkansas Valley Research Center, Colorado State University, Rocky Ford, Colorado, 2009
Variety
Source
Maturity
(% tops
down)
9-1
Colossals
> 4"
%
Jumbos
3"-4"
%
Medium
2.25"-3"
%
Pre-Pack
1.75"-2.25"
%
Total
Market.
CWT/A
Culls
%
Total
Weight
CWT/A
X-Y201 Waldow 22 18.1 61.7 12.3 0.9 737.7 7.1 797.7
X-Y202 Waldow 12 17.2 69.8 8.2 0.7 736.2 4.1 766.7
Mesquite D. Palmer 15 16.1 65.8 10.6 0.1 723.1 7.3 778.1
Tequila D. Palmer 20 16.0 67.8 10.5 0.7 712.8 5.0 749.2
Maverick Bejo 55 6.1 68.5 17.5 1.4 700.2 6.4 747.1
T-433 Takii 10 6.1 80.2 7.9 0.8 696.9 4.9 734.0
Cometa (W) Nunhems 22 6.1 76.4 15.8 0.7 674.6 1.1 682.3
Oracle (03-207) Crookham 32 1.1 82.3 13.6 0.5 667.6 2.5 683.3
Morpheus (03-209) Crookham 30
10.8 72.3 12.2 0.6 665.3 4.1 694.8
Colorado 6 Burrell 10 7.9 62.8 16.5 2.5 648.0 10.3 723.1
Legend Bejo 25 2.1 70.3 20.7 1.0 645.2 5.9 684.4
Advantage (05-N5) Crookham 10 7.7 70.9 12.9 0.6 640.3 7.8 695.3
Arcero Nunhems 12 0 79.5 18.0 1.5 637.6 1.0 644.1
White Cloud (W) Crookham 60 1.1 69.5 17.3 1.8 630.5 10.3 703.0
OLYX06-25 Crookham 10 8.7 71.1 14.7 0.8 630.0 4.7 661.0
Pandero Nunhems 25 16.8 73.3 5.0 0.8 620.2 4.1 646.9
The Rock Crookham 17 7.3 78.3 11.0 0.2 613.1 3.2 633.3
Joaquin Nunhems 10 14.4 72.5 6.7 0.2 610.4 6.2 654.5
Delgado Bejo 25 2.4 78.1 14.0 1.4 603.8 4.1 630.0
NUN7606ON Nunhems 45 2.7 75.4 19.6 1.0 598.4 1.4 606.6

10
lsd (0.1) = 89.7
W) = white-skinned, (R ) = red-skinned, all other yellows
Variety
Source
Maturity
(% tops
down)
9-13
Colossals
> 4"
%
Jumbos
3"-4"
%
Medium
2.25"-3"
%
Pre-Pack
1.75"-
2.25"
%
Total
Market.
CWT/A
Culls
%
Total
Weight
CWT/A
OLYX00-23 Crookham 45 0 69.1 25.4 2.7 588.0 2.8 604.9
Ranchero Nunhems 42 4.8 74.6 10.7 1.5 579.3 8.3 633.3
Western Giant Sakata 87 3.3 42.1 34.7 5.0 556.5 14.8 651.8
Vaquero Nunhems 57 1.3 65.0 25.4 2.2 553.8 6.1 589.1
Granero Nunhems 55 0 75.2 22.6 0.8 548.3 1.4 554.8
Calibra Bejo 67 0 66.3 25.0 2.2 539.0 6.4 576.1
Crockett Bejo 10 0 63.6 29.8 1.3 535.8 5.3 566.3
X-Y441 Waldow 42 0 62.1 25.3 3.8 518.4 8.7 567.9
DPS2052 (W) D. Palmer 30 0 56.9 30.5 2.8 485.7 9.9 538.0
Sarape Café D. Palmer 42 0 58.2 32.2 0.9 484.6 8.7 531.4
Gunnison Bejo 65 0 37.0 56.4 5.1 433.4 1.2 440.0
Talon Bejo 55 0 31.2 59.4 3.7 432.9 5.7 460.0
OLRH06-91 (R) Crookham 20 1.9 41.1 40.2 1.9 388.2
15.0 459.0

11
2009 VEGETABLE CROP REPORTS
Whitney Cranshaw Mike Bartolo Colorado State University
rials were conducted at the Arkansas Valley Research Center in Rocky Ford, CO. Individual plots consisted of 50-row ft of seeded onions in 4-row beds at 5-ft centers.
Each cultivar was replicated four times in a randomized complete block design. Subplots were established within each plot, so that one half of the area was treated to control thrips, the other half remaining untreated. Thrips treatments consisted of a mixture of fipronil (Regent) and spirometrastat (Movento), which had been identified as the most effective treatments at that site in previous season. Applications were made 12 June, repeated 3 July. Excellent control (>5 thrips/plant) was maintained on these treated plots through the end of July when last observations were made (July 24). Two counts of thrips were made (table below), each by counting the number of thrips on 10 plants in the center of untreated areas.
19 June* 10 July* 1. Cometa 133.5 ab 243.5 abc* Original means presented 2. White Wing 132.0 ab 202.3 abcd Analysis used log transformation 3. Salsa 136.5 a 339.25 ab 4. Red Bull 120.0 ab 303.5 abc 5. Red Wing 138.0 a 316.75 ab 6. Talon 104.0 abc 353.75 a 7. Tioga 91.0 abc 206.75 abcd 8. Gunnison 100.0 abc 259.0 abcd 9. Arcero 99.5 abc 153.0 abcde 10. Ranchero 105.0 abc 166.50 abcd 11. Calibra 127.0 ab 126.25 abce 12. X-202 (Tequila) 103.5 abc 103.75 bcde 13. Sedona 135.3 a 234.75 abc 14. OLYSOS5N5 100.3 abc 64.25 de 15. Colorado 6 114.3 ab 51.25 e 16. T-433 64.5 bc 78.25 de 17. Tamara 63.0 c 91.00 cde 18. Granero 129.3 ab 155.25 abcde 19. Oro Blanco 140.5 a 47.25 e 20. Vaquero 106.0 abc 101.0 bcde
T

12
Yield and market class distribution of onion receiving full (sprayed) or no thrips control in 2009.
Variety
Spray Treatment
Colossals
4" %
Jumbos
3"-4" %
Medium 23"-3"
%
Pre-Pack 1:"-23"
%
Total Market.
Weight 50 lb. bags/A
Culls
%
Total Weight 50 lb. bags/A
Percent Yield Increase Due
to Spray Control
Colorado 6 Spray 4.1 74.0 17.5 1.3 1457.0 2.9 1499.5 4.5
None 13.0 69.8 11.9 0.7 1393.9 4.3 1455.9
Red Bull Spray 0 82.6 5.1 0.2 782.9 11.9 889.7 36.7
None 0 30.6 49.4 0.4 572.8 19.3 708.9
Granero Spray 8.2 64.4 22.7 0.7 1306.8 3.7 1359.0 1.6
None 0 57.8 38.9 1.2 1286.1 1.9 1308.9
Cometa Spray 2.9 82.0 8.5 0.6 1601.9 5.8 1706.4 16.5
None 3.2 82.0 13.9 0.3 1375.4 0.4 1381.9
Gunnison Spray 0 45.3 48.8 2.2 1089.0 3.5 1128.2 16.0
None 0 11.0 81.9 4.0 938.7 2.8 967.0
Mesquite (X-202) Spray 14.2 65.0 17.2 1.2 1542.0 2.2 1577.9 0.2
None 9.1 82.7 5.5 0.3 1538.7 2.1 1574.6
OLYS 05-N5 Spray 0 83.0 15.4 0.5 1742.4 0.9 1758.7 20.5
None 1.1 71.7 21.8 0.3 1446.1 4.8 1521.3
Arcero Spray 4.3 64.9 27.7 0.7 1347.0 2.2 1379.7 20.5
None 0 62.6 32.9 0.6 1117.3 3.7 1163.0

13
Onion yield response to full (sprayed) or no thrips control in 2008 and 2009.
Variety
Spray
Treatment
Total Market. Weight
50 lb. bags/A 2008
Total Market. Weight
50 lb. bags/A 2009
Percent Yield
Increase Due to Spray Control
2008
Percent Yield
Increase Due to Spray Control
2009
Percent Yield Increase Due to Spray Control 2 year Ave.
Colorado 6 Spray 1265.4 1457.0 (-2.1) 4.5 2.4%
None 1292.6 1393.9
Red Bull Spray 708.8 782.9 28.4 36.7 32.5%
None 552.0 572.8
Granero Spray 1396.0 1306.8 38.4 1.6 20.0%
None 1008.4 1286.1
Cometa Spray 971.2 1601.9 18.4 16.5 17.4%
None 820.0 1375.4
Gunnison Spray 855.8 1089.0 39.8 16.0 27.8%
None 612.0 938.7
Mesquite (X-202) Spray 1325.2 1542.0 (-3.3) 0.2 (-1.5)%
None 1371.0 1538.7
OLYS 05-N5 Spray 1474.4 1742.4 9.0 20.5 14.7%
None 1352.4 1446.1
Arcero Spray 1030.0 1347.0 0.6 20.5 10.5%
None 1023.6 1117.3

14
2009 Vegetable Crop Reports
Mike Bartolo Arkansas Valley Research Center Colorado State University
antaloupe is an important vegetable crop grown in the Arkansas Valley
of Colorado. Starting in the early 1990’s, cantaloupes were increasingly produced using intensive production methods like drip irrigation and plastic mulches. Today, the majority of cantaloupes are grown with these two components of plasticulture. To facilitate the use of drip irrigation, growers have relied upon ground water pumped from shallow alluvial wells as the source of irrigation water. Unlike surface waters, ground water is relatively free of particulates and is available on a more timely and reliable basis. Unfortunately, ground waters also contain much higher amounts of dissolved salts making the electrical conductivity (ECw) of ground water approximately 3 times higher than that of surface waters. The purpose of this study was to determine how the use of ground water affects the yield and quality of cantaloupe grown with intensive production practices. Crop, water, and soil characteristics were monitored in treatment irrigated with both surface and ground waters. Methods This study was conducted at the
Arkansas Valley Research Center (AVRC) in Rocky Ford. Beds, 45 inches wide and 60 inches between centers, were shaped in early April. Drip lines were placed 1-2 inches from the center of the bed at a depth of 3 inches. The beds were covered with black embossed plastic mulch (Mechanical Transplanter) on May 5th using a one-bed mulch layer. The study was designed as a randomized complete block with four replications. The test site irrigation system was plumbed so that four plots would receive water derived from a surface source (Rocky Ford Ditch) and four plots would receive water from a shallow alluvial well located at the AVRC. Throughout the experiment, both water sources were delivered to the test site in equal quantities and the timing of each application was identical (Table 1). Soil water potential was monitored with Watermark sensors placed at depths of 9 and 18 inches. An irrigation event was initiated when soil water potential reached 30 cb at both depths. On May 19th, the cantaloupe variety “Athena” was sown in holes in the plastic mulch down the center of the bed at an in-row spacing of 18 inches. Melons were harvested starting on August 17th. At harvest, the soluble
C

15
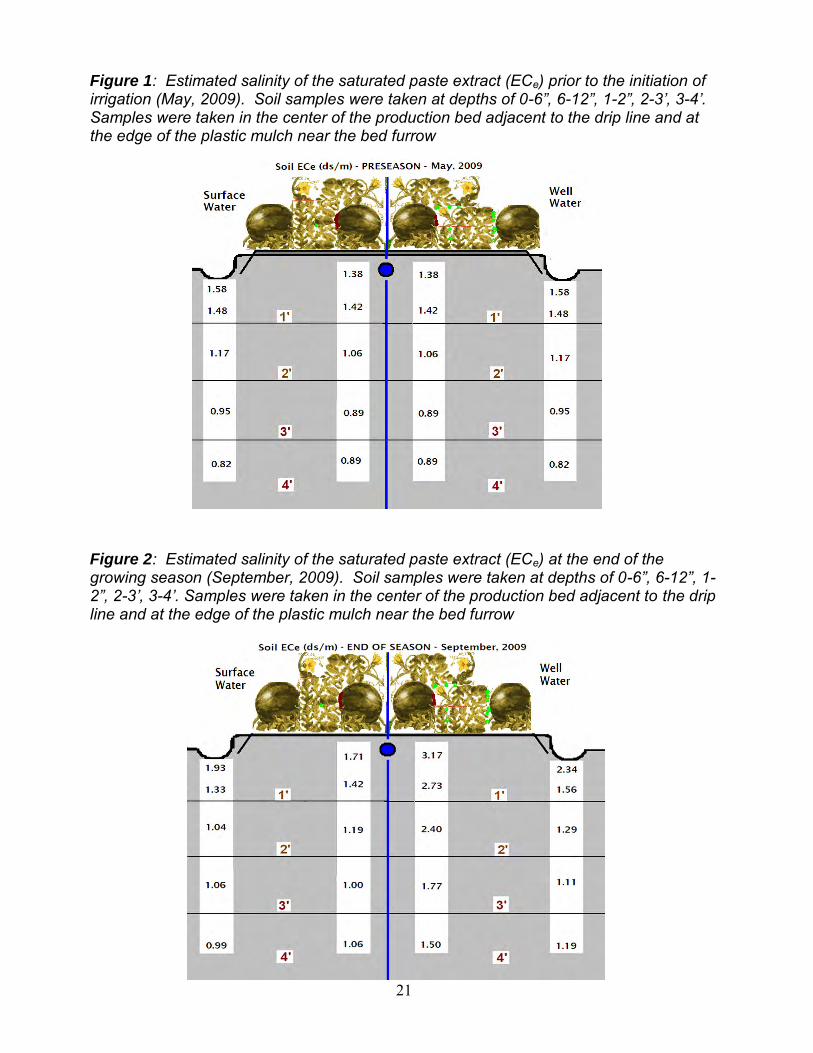
solid content (% brix) of six randomly selected melons was sampled from each plot using a digital refractometer. Melons were considered marketable if they weighed over 3 lbs. and were free of any physical defects. In addition to fruit and water characteristics, changes in soil salinity were monitored in the treatments. Soil samples were taken at depths of 0-6”, 6-12”, 1-2’, 2-3’, and 3-4’ before irrigation commenced and after harvest. Samples were taken in two locations in the bed; in the middle of the bed (seed-row) and outside of the production bed
(furrow). Salinity of the saturated paste extract was estimated using a 1:1 (w:w) extract of the soil using distilled water. Specifically, 50 g of soil was mixed with with 50 g of distilled water. The mixture was placed on a rotary shaker overnight and filtered the next day (Whatman 1). The conductivity of the resulting filtrate (ECf ) was measured and converted to the conductivity of the saturated paste extract (ECe) using the following predetermined equation: [ECe = (ECf )(2.104) + 0.0039].
Results and Discussion Irrigation water from the shallow alluvial well had 2-3 times higher electrical conductivity and individual chemical components than irrigation water derived from a surface source (Table 2). Despite these differences, there was not a significant difference in yield or fruit quality (as measured by percent brix) between cantaloupes that were irrigated with the two different
water sources (Table 3). Although, average fruit size and number were slightly greater in cantaloupes irrigated with the surface water, these differences were not statistically significant (P>.05). As anticipated, soil salinity (ECe) was greater in the treatment irrigated with well water (Figures 1 and 2). Salinity was generally greater in the surface layers.
Table 1: Timings and amounts of irrigation water delivered to treatments. Plots irrigated with surface and well waters were irrigated at the same time and received the same volumes. DATE gals/acre ACRE-IN Applied DATE gals/acre ACRE-IN Applied
25-May 11559.32 0.425
13-Jul 13752 0.506 17-Jun 15906.48 0.585
15-Jul 7181.6 0.264
23-Jun 16578.8 0.610
17-Jul 22194.2 0.817 26-Jun 17350.44 0.638
20-Jul 21048.2 0.775
29-Jun 19405.6 0.714
24-Jul 20505.76 0.755 1-Jul 14531.28 0.535
31-Jul 21850.4 0.804
4-Jul 18824.96 0.693
4-Aug 6715.56 0.247 7-Jul 9550 0.351
10-Aug 7082.28 0.260
10-Jul 9550 0.351
SEASON TOTAL 9.338

16
Table 2: Chemical characteristics of ground and surface waters.* Analysis at AVRC, ** EPA analysis at Arkansas River. Component Groundwater* Surface** Calcium 283 ppm 111 ppm Sodium 133 ppm 64 ppm Hardness - CaCO3 1022 ppm 420 ppm Sulfate 1053 ppm 365 ppm Specific Conductance 2.77 ds/m 1.00 ds/m TDS 1764 ppm 720 ppm Table 3: Yield, yield components, and quality (%brix) of cantaloupe grown with surface and ground water. .
Treatment
Water Source
% Brix
Fruit Number
per acre
Average Fruit
Weight
Marketable
Yield (lbs/acre)
Surface 11.37 10,527 4.89 51,499 Well 11.16 10,164 4.75 48,361
lsd(.05) ns ns ns ns Figure 1: Estimated salinity of the saturated paste extract (ECe) prior to the initiation of irrigation (May, 2009). Soil samples were taken at depths of 0-6”, 6-12”, 1-2”, 2-3’, 3-4’. Samples were taken in the center of the production bed adjacent to the drip line and at the edge of the plastic mulch near the bed furrow

17
Figure 2: Estimated salinity of the saturated paste extract (ECe) at the end of the growing season (September, 2009). Soil samples were taken at depths of 0-6”, 6-12”, 1-2”, 2-3’, 3-4’. Samples were taken in the center of the production bed adjacent to the drip line and at the edge of the plastic mulch near the bed furrow

18
2009 Vegetable Crop Reports
Mike Bartolo Arkansas Valley Research Center Colorado State University
atermelon is an important vegetable crop grown in the
Arkansas Valley of Colorado. In the past decade, much of the watermelons produced in the Valley have been grown with intensive production practices like drip irrigation and plastic mulches. To facilitate the use of drip irrigation, growers have relied upon ground water pumped from shallow alluvial wells as the source of irrigation water. Unlike surface waters, ground water is relatively free of particulates and is available on a more timely and reliable basis. Unfortunately, ground waters also contain much higher amounts of dissolved salts making the electrical conductivity (ECw) of ground water approximately 3 times higher than that of surface waters. The purpose of this study was to determine how the use of ground water affects the yield and quality of watermelon grown with intensive production practices. Crop, water, and soil characteristics were monitored in treatments irrigated with both surface and ground waters. Methods This study was conducted at the Arkansas Valley Research Center (AVRC) in Rocky Ford. Beds, 45 inches
wide and 60 inches between centers, were shaped in early April. Drip lines were placed 1-2 inches from the center of the bed at a depth of 3 inches. The beds were covered with black embossed plastic mulch (Mechanical Transplanter) on May 5th using a one-bed mulch layer. The study was designed as a randomized complete block with four replications. The test site irrigation system was plumbed so that four plots would receive water derived from a surface source (Rocky Ford Ditch) and four plots would receive water from a shallow alluvial well located at the AVRC. Throughout the experiment, both water sources were delivered to the test site in equal quantities and the timing of each application was identical (Table 1). Soil water potential was monitored with Watermark sensors placed at depths of 9 and 18 inches. An irrigation event was initiated when soil water potential reached 30 cb at both depths. On May 19th, the watermelon variety Stars and Stripes, an elongated seeded type, was sown in holes in the plastic mulch down the center of the bed at an in-row spacing of 3 feet. Watermelons were harvested starting on August 17th. At harvest, the soluble solid content (% brix) of four randomly selected watermelons was sampled
W

19
from each plot using a digital refractometer. Watermelons were considered marketable if they weighed over 12 lbs and were free of any physical defects. In addition to fruit and water characteristics, changes in soil salinity were monitored in the treatments. Soil samples were taken at depths of 0-6”, 6-12”, 1-2’, 2-3’, and 3-4’ before irrigation commenced and after harvest. Samples were taken in two locations in the bed; in the middle of the bed (seed-row) and outside of the production bed (furrow).
Salinity of the saturated paste extract was estimated using a 1:1 (w:w) extract of the soil using distilled water. Specifically, 50 g of soil was mixed with with 50 g of distilled water. The mixture was placed on a rotary shaker overnight and filtered the next day (Whatman 1). The conductivity of the resulting filtrate (ECf ) was measured and converted to the conductivity of the saturated paste extract (ECe) using the following predetermined equation: [ECe = (ECf )(2.104) + 0.0039
Results and Discussion Irrigation water from the shallow alluvial well had 2-3 times higher electrical conductivity and individual chemical components than irrigation water derived from a surface source (Table 2). Despite these differences, there was not a significant difference in yield or fruit quality (as measured by percent brix) between watermelons that were irrigated with the two different
water sources (Table 3). Although, average fruit size and number were slightly greater in watermelons irrigated with the surface water, these differences were not statistically significant (P>.05). As anticipated, soil salinity (ECe) was greater in the treatment irrigated with well water (Figures 1 and 2). Salinity was generally greater in the surface layers.

20
Table 1: Timings and amounts of irrigation water delivered to treatments. Plots irrigated with surface and well waters were irrigated at the same time and received the same volumes. DATE gals/acre ACRE-IN Applied DATE gals/acre ACRE-IN Applied
25-May 11559.32 0.425
13-Jul 13752 0.506 17-Jun 15906.48 0.585
15-Jul 7181.6 0.264
23-Jun 16578.8 0.610
17-Jul 22194.2 0.817 26-Jun 17350.44 0.638
20-Jul 21048.2 0.775
29-Jun 19405.6 0.714
24-Jul 20505.76 0.755 1-Jul 14531.28 0.535
31-Jul 21850.4 0.804
4-Jul 18824.96 0.693
4-Aug 6715.56 0.247 7-Jul 9550 0.351
10-Aug 7082.28 0.260
10-Jul 9550 0.351
SEASON TOTAL 9.338
Table 2: Chemical characteristics of ground and surface waters.* Analysis at AVRC, ** EPA analysis at Arkansas River. Component Groundwater* Surface** Calcium 283 ppm 111 ppm Sodium 133 ppm 64 ppm Hardness - CaCO3 1022 ppm 420 ppm Sulfate 1053 ppm 365 ppm Specific Conductance 2.77 ds/m 1.00 ds/m TDS 1764 ppm 720 ppm Table 3: Yield, yield components, and quality (%brix) of watermelon grown with surface and ground water.
Treatment
Water Source % Brix
Fruit Number per acre
Average Fruit Weight
Marketable
Yield (lbs/acre)
Surface 10.22 4257 17.03 54,237 Well 10.22 3943 16.82 52,310
lsd(.05) ns ns ns ns
21
Figure 1: Estimated salinity of the saturated paste extract (ECe) prior to the initiation of irrigation (May, 2009). Soil samples were taken at depths of 0-6”, 6-12”, 1-2”, 2-3’, 3-4’. Samples were taken in the center of the production bed adjacent to the drip line and at the edge of the plastic mulch near the bed furrow Figure 2: Estimated salinity of the saturated paste extract (ECe) at the end of the growing season (September, 2009). Soil samples were taken at depths of 0-6”, 6-12”, 1-2”, 2-3’, 3-4’. Samples were taken in the center of the production bed adjacent to the drip line and at the edge of the plastic mulch near the bed furrow

22
2009 Vegetable Crop Reports
Mike Bartolo Arkansas Valley Research Center Colorado State University
he Arkansas Valley has a long and successful history of vegetable seed production and at one time, provided a significant portion of the cucurbit seeds used in the
United States. Although seed production has diminished from its historical levels, there is still a sizable amount of conventional seed production in the Valley. In recent years, there has been a dramatic increase in organic vegetable production. Accordingly, demand for organic vegetable seed is growing rapidly as the USDA National Organic Program requires organic farmers to use certified organic seed when available. With this potential, there is the opportunity to reestablish the seed production industry in the Arkansas Valley. This project had three main objectives:
1. Identify optimum cultural techniques and varieties for the production of high quality organic watermelon, melon, and pepper seed.
2. Identify potential yields of organically produced watermelon, melon, and pepper seed.
3. Assist and educate growers on how to adopt and comply with organic
production methods and requirements. Methods This study was conducted at the Arkansas Valley Research Center (AVRC) in Rocky Ford. The Center has a four acre site that has completed the transition into organic production. In late April, one acre of the organic field was furrowed into 30 inch beds (on center). The remainder of the field was seeded to buckwheat as a cover crop. Three test plots were direct seeded: a mixed melon trial containing 10 varieties and three replications, a watermelon trial containing 15 varieties and two replications, and a pepper trial containing 19 varieties with two replications.
Irrigation was supplied by gravity-flow furrows during the course of the season. Pest control and other management practices were implemented as needed. Cost analyses of all production practices will be outlined in a subsequent report. At harvest, yield estimates were taken from each trial. A representative sample of seed was extracted from a crop subsample to determine estimated seed yields.
T

23
Outreach Activities A field day was conducted at the Arkansas Valley Research Center on August 31, 2009. Over 40 participants (photo to the right) learned about production practices and other issues related to organic seed production. Participants included growers, seed company representatives, and staff from the Organic Seed Alliance. Results
Fresh and raw seed yield of 10 mixed melon varieties grown with organic production methods at CSU’s Arkansas Valley Research Center. B= Burrell’s Seeds, SOS= Seeds of Change, SS= Siskiyou Seeds, DH= Dan Hobbs *Raw seed was washed and dried but not milled or tested for germination. This project would like to acknowledge the generous support of CSU Specialty Crops Program, Organic Seed Alliance, Natural Resource Conservation Service, and CSU Agricultural Experiment Station.
Variety Source Ave Melon
Weight (lbs)
Average Seed Yield per Melon (g)
Fresh Yield per Acre (lbs)
Raw* Seed Yield per Acre
(lbs)
Orange Flesh B 2.93 15.22 28,810 332 Sharlyn SOC 2.79 21.37 28,047 478
Sharlyn Melon SS 2.80 24.79 21,780 427 Eel River SOC 3.79 22.35 21,096 275
Eindor SOS 2.82 22.19 24,339 426 Huerfano Bliss DH 3.52 19.84 43,596 533
Golden Honeymoon B 4.05 25.44 31,175 432 Burrell’s Jumbo B 1.77 11.60 15,514 227
PMR 45 B 1.78 10.52 15,615 208 Hale’s Jumbo B 2.04 13.52 16,383 233
lsd(0.1) 0.80 2.64 10,002 113

24
Fresh and raw seed yield** of 15 watermelon varieties grown with organic production methods at CSU’s Arkansas Valley Research Center.
Variety Source Ave Melon
Weight (lbs)
Average Seed Yield
per Melon (g)
Fresh Yield per Acre
(lbs)
Raw* Seed Yield per Acre (lbs)
Legacy B 10.90 65.07 24,927 510 Desert King SOC 11.76 73.26 30,753 620 W909-4 OSA 13.10 77.46 27,818 730 Wilson Sweet OSA 8.76 35.66 28,640 225 W909-1 OSA 13.86 58.80 38,507 587 W909-3 OSA 15.66 70.80 43,505 798 Navajo Red NMOCC 5.96 33.50 21,442 143 Sweet Dakota Rose SOC 7.33 28.76 25,155 151 Blacktail OSA 7.50 29.60 23,277 159 Monticello Gold NMOCC 9.80 34.03 32,016 240 W909-2 OSA 13.23 65.00 43,233 619 W912 OSA 6.50 47.50 19,111 222 Charleston Grey- #133 B 13.10 45.93 40,657 433 Crimson Sweet B 7.96 20.60 20,821 118 Sugar Baby B 6.46 20.90 23,239 97
B= Burrell’s Seeds, SOS= Seeds of Change, NM= State of New Mexico Organic Commodity Commission, OSA= Organic Seed Alliance *Raw seed was washed and dried but not milled or tested for germination. **Values are an average of two replicates. No statistical analysis was conducted. Fresh and raw seed yield** of 9*** pepper varieties grown with organic production methods at CSU’s Arkansas Valley Research Center.
Variety Source Fresh Yield per Acre
(lbs) Raw* Seed Yield per Acre
(lbs)
Santa Fe Grande B 22,052 826 Big Jim B 19,602 468 Sandia B 18,676 733 Isleta NMOCC 13,068 890 Joe Parker B 32,071 229 Corno Di Toro SOC 28,640 607 Mosco CSU 21,997 536 California Wonder B 23,086 104 Sweet Tangerine SOC 21,780 404
B= Burrell’s Seeds, SOS= Seeds of Change, NM= State of New Mexico Organic Commodity Commission, CSU=Colorado State University *Raw seed was washed and dried but not milled or tested for germination. **Values are an average of two replicates. No statistical analysis was conducted.
*** Ten other varieties (CSU experimental lines) were included in the trial but not evaluated for yield.

25
2009 VEGETABLE CROP REPORTS
Michael Bartolo Arkansas Valley Research Center
Colorado State University
Cantaloupe is an important vegetable crop in the Arkansas Valley grown on over
2,000 acres. Cantaloupes grown in the Valley are renowned for their high quality. Nonetheless, improving the yield and sugar content is a constant goal of producers. This study was conducted to examine the response of cantaloupe to several commercially available fertilizers and growth regulators applied to the foliage starting at the time of first bloom. A late infestation of powdery mildew severely reduced the functional leaf area at start of harvest. Although fruit number and size did not seem to be affected, fruit sugar content (% brix) was dramatically reduced in all treatments. As result, sugar levels are not reported in this document. Several products, alone or in combination, significantly improved yields compared to an untreated control. MATERIALS AND METHODS This study was conducted at the Arkansas Valley Research Center (AVRC) in Rocky Ford. Beds, 45 inches wide and 60 inches between centers, were shaped in early April. Drip lines were placed 1-2 inches from the center of the bed at a depth of 3 inches. The beds were covered with black embossed plastic mulch on April 29th using a one-bed mulch layer. The study was designed as a randomized complete block with four replications. On June 1st, the cantaloupe variety Athena, a slightly sutured eastern shipping type, was sown in holes in the plastic mulch down the center of the bed at an in-row spacing of 18 inches. Foliarly-applied fertilizers were applied initial at the first bloom stage (July 18). All products were delivered with a hand-held sprayer. Cantaloupes were harvested starting on September 1st. Cantaloupes were considered marketable if they weighed over 3 lbs and were free of any physical defects. This work was generously supported by Winfield Solutions under the direction of Mr. Joe Bush.

26
Treatment combinations and timing of applications for foliarly-applied fertilizers and growth regulators # Treatment
Rate
Per Acre
Stage First
Bloom
July 18, 2009
Stage First
Bloom + 14 days
July 31, 2009
Stage First
Bloom + 28 days
Aug. 13,
2009
1. Untreated Control
-
2. MKP 5 lbs Yes
Yes
No
3. MI ZMB 1 qt Yes No No
4. MKP MI VC
5 lbs 1 qt
Yes Yes
No No
No No
5. MKP MI VC Ascend
5 lbs 1 qt
3.2 oz
Yes Yes Yes
Yes Yes Yes
Yes Yes No
6. MI ZMB Ascend MKP
1 qt 3.2 oz 5 lbs
Yes Yes No
Yes Yes No
Yes No Yes
7. MI VC
1 qt Yes Yes No
RESULTS
# Treatment
Fruit Number per Acre
Average Fruit weight (lbs)
Yield per Acre (lbs)
1. Untreated Control
13,068 ab 3.23 ab 42,587 bc
2. MKP
12,487 b 3.29 ab 40,852 c
3. MI ZMB
13,576 ab 3.28 ab 44,438 bc
4. MKP MI VC
14,737 a 3.51 a 51,458 a
5. MKP MI VC Ascend
14,084 ab 3.35 ab 47,298 ab
6. MI ZMB Ascend MKP
14.084 ab 3.38 ab 47,712 ab
7. MI VC
14,592 a 3.17 b 46,253 abc
lsd (0.1) 1,789 0.32 6,073

![Capitulo4 - tesis.uson.mxtesis.uson.mx/digital/tesis/docs/12171/Capitulo4.pdf · Rezagado y avrc e; 'dev d]žll cuacfrifla. tfábàjar, el patiir piso, a eéà' tm metro. encúentce](https://static.fdocuments.net/doc/165x107/5b0408fb7f8b9a2d518d078a/capitulo4-tesisuson-y-avrc-e-dev-dzll-cuacfrifla-tfbjar-el-patiir-piso.jpg)