Technical Report: The Renewable Energy Technology Options to
38
P.O. Box 602090 ▲Unit 4, Lot 40 ▲ Gaborone Commerce Park ▲ Gaborone, Botswana ▲ Phone (267) 390 0884 ▲ Fax (267) 390 1027 E-mail: [email protected] Technical Report: The Renewable Energy Technology Options to Improve the Sustainability of Energy Supply in Botswana Gloria Magombo – Energy Advisor Submitted by: AECOM International Development Submitted to: USAID/Southern Africa Gaborone, Botswana October 2009 USAID Contract No. 690-M-00-04-00309-00 (GS 10F-0277P)
Transcript of Technical Report: The Renewable Energy Technology Options to

P.O. Box 602090 ▲Unit 4, Lot 40 ▲ Gaborone Commerce Park ▲ Gaborone, Botswana ▲ Phone (267) 390 0884 ▲ Fax (267) 390 1027 E-mail: [email protected]
Technical Report:
The Renewable Energy Technology Options to Improve the Sustainability of Energy Supply in
Botswana
Gloria Magombo – Energy Advisor
Submitted by: AECOM International Development
Submitted to: USAID/Southern Africa
Gaborone, Botswana
October 2009
USAID Contract No. 690-M-00-04-00309-00 (GS 10F-0277P)

TABLE OF CONTENTS INTRODUCTION ..................................................................................................3 PART A. LITERATURE REVIEW..........................................................................3
International Scenario .......................................................................................3 Technology Colonialism ..................................................................................10 Technology Innovation ....................................................................................12 Technology Transfer – Southern African Perspective .....................................14 Renewable Energy Scenario in South Africa...................................................16 Framework to Review Barriers to the Implementation of Renewable Energy Technologies ...................................................................................................17
PART B. THE RENEWABLE ENERGY TECHNOLOGIES IN BOTSWANA.......20
The Overview of the Botswana Energy Sector ................................................20 The Botswana Energy Resources ...................................................................21 The overall energy consumption for Botswana................................................22 Why Renewable Energy Technologies............................................................25 The Renewable Energy Resources and Technologies in Botswana ...............25 Challenges to Implementation of Renewable Technologies in Botswana .......32 Measures in Place to Overcome Barriers to Implementation ..........................33
RECOMMENDATIONS.......................................................................................35 BIBLIOGRAPHY .................................................................................................37
INTRODUCTION The Southern African Development Community (SADC) region has gone through a power crisis in the past year as a result of increased economic growth, which was not complemented by investments in new generation capacity. Early 2008 saw the countries which depend on South Africa for more than 50% of their supply, Botswana and Namibia, experience load shedding and black out during the first quarter of the year. The region, like the rest of Africa, still suffers from low electrification rates with countries like Namibia and Botswana having more than 50% of their population without access to electricity. The region has one of the highest coal reserves in Africa and has some of the highest insulation levels in the world. The abundance of resources does not translate to access to modern energy services. The other resources include use of hydro power in Democratic Republic of Congo (DRC), Zambia, Mozambique, South Africa and Zimbabwe, which can be exploited on a large and small scale. The main planned power projects in the region are primarily development of new coal fired thermal plants and large hydro capacity along the Congo and Zambezi river basins. The governments are looking more towards private sector participation in generation and transmission projects as a means to help address the current regional power crisis. Very few private sector projects have been realised and are highly unlikely to become a reality as the current policies and regulatory environment are not conducive to investments. The renewable energy use remains limited in modern energy services although it is important to acknowledge that more than 80% of the population in the Southern African region (excluding South Africa) still depend on use of firewood and charcoal for cooking and space heating. PART A. LITERATURE REVIEW International Scenario The latest Renewable Global Status Report Energy (2009) has highlighted a new global trend which experienced a boom in the renewable energy sector over the past 5 years. The highest growth was experienced in wind power as a source of renewable energy, which enjoyed tremendous growth from 48GW installed generation capacity in 2004 to 121GW in 2008. The United States of America (USA) had the highest growth in new installation adding 8,4GW in new generation capacity followed by German, Spain, China and India. In Sub-Saharan Africa, new projects are under construction in Kenya, Tanzania and Ethiopia. The United Kingdom (UK) leads in offshore wind installations. China remains the leader in small hydro power adding 4-6GW annually since 2004. The installed capacity of small hydro plants by 2008 was 85GW. Small hydro capacity has continued to grow in African and Asian countries. In the
3
meantime, large hydro generation capacity increased by more than 25GW in 2008. China added more than 12GW whilst India added over 5GW. At the same time, biomass and co-generation had 2GW added in 2008 increasing the world installed capacity to 52GW. The European Union (EU) countries of Finland, France, Germany, Italy and UK added new capacity of industrial scale biogas projects using livestock farms and agricultural waste. The sugar industries continued to bring new baggass power plants on line especially in developing countries with industry leaders being Brazil, Philippines, Argentina, Columbia, India, Mexico, Nicaragua and Uruguay. The solar photovoltaic (PV) with grid connection was the fastest growing power generating technology, experiencing 70% increase to 13GW in 2008 – a six fold growth in five years. In 2008, five, 4GW were installed and Spain was the world market leader with two, 6GW installed grid connected solar PV systems. Surprisingly, the USA had more than 300MW in new capacity, most of which was installed in 2007/8, and South Korea had more than 200MW surpassing Germany which was the world leader in grid connected solar PV generation systems. New trends immerged in 2008 especial growth in building integrated Solar PV with more than 25MW installed in Europe. Thin film photovoltaic grew worldwide to 1800 plants. Utility scale photovoltaic (power plants) has capacity of more than 200kW with Spain adding more than 19GW. The largest solar PV plant in the world with 60MW capacity was completed in 2008 in Spain called Olmedila de Alarcon. The geothermal capacity reached 10GW in 2008 with the USA being the largest developer with over 120 projects in early 2009 (with approximately 5GW). Other countries with significant growth included Australia, Guatemala, Iceland, Mexico, Kenya, Papua New Guinea and Turkey. The new Concentrated Solar Thermal Plants (CPS) plants came online with 50MW in Spain and a 5MW demo plant in California, USA. Two more 50MW and 20MW plants integrated to 450MW combined cycle plant in Morocco were commissioned early 2009. The planned capacity under construction was 8GW of which 6GW is in the USA states of Arizona, California and Florida, and the rest in Abu Dhabi, Algeria, Egypt, Israel, Italy, Portugal and Spain. A 280MW plant is planned in Arizona with more than six hours of storage to allow generation in the evening. The total renewable energy (RE) installed capacity was extended to 280GW in 2008 from 160GW in 2004. The RE heating continued to grow with solar water heating capacity increasing by 15% to 145GW. China installed 145GWh solar heating capacity emerging as world leader with 70% of the world’s installed capacity. In Germany over 200 000 units were installed. Developing countries Brazil, Mexico, Morocco and Tunisia saw acceleration in solar water heat installations. Ground source geothermal heat pumps accounted for more than 30GWh of installed capacity in 2008 mostly used for space heating, agricultural drying and industrial use.
4

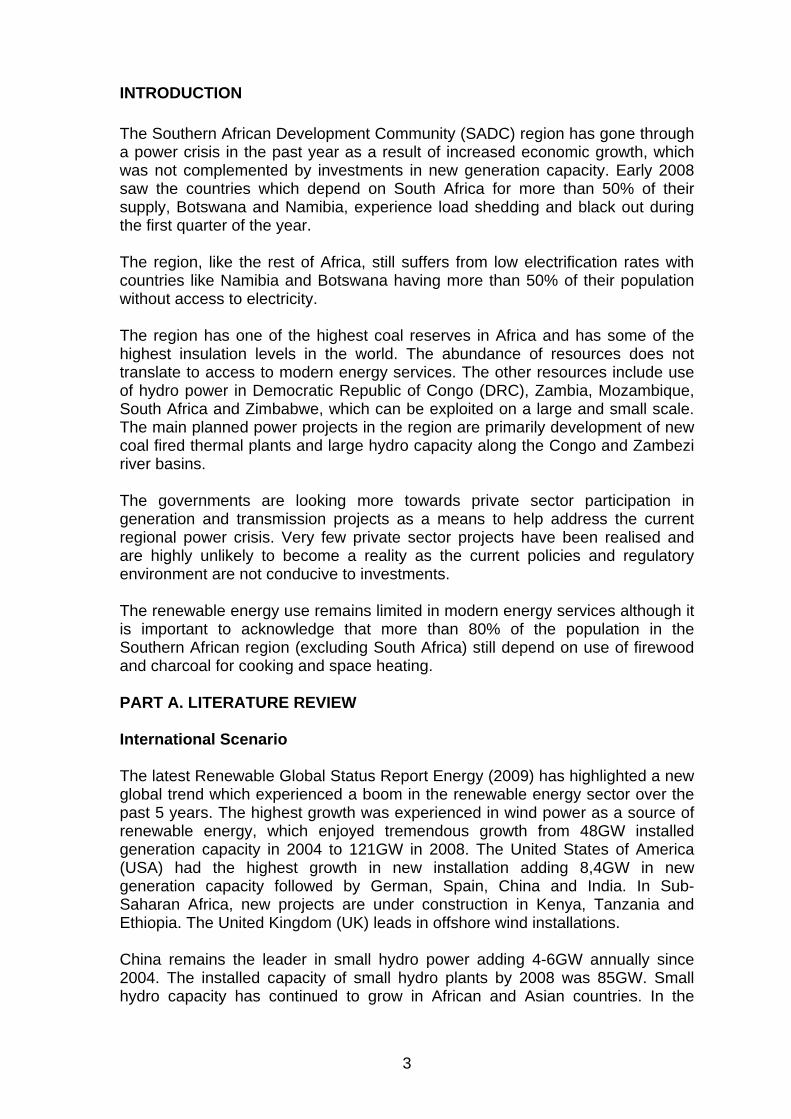
The Global Trends in Bio fuels Ethanol production increased by 34% in 2008 to 61 billion litres from 30 billion in 2004. Brazil increased from 18 billion to 27 billion litres with 50% of non-diesel fuel coming from ethanol. USA is world leader with 34billion litres in 2008 while other significant producers share the balance six billion, namely Australia, China, Colombia, Costa Rica, Dominican Republic, France, Germany, India, Jamaica, South Africa, Malawi and Zambia. The bio diesel increased from two billion litres in 2004 to 12 billion in 2008. EU is responsible for two thirds expected to increase to 16 billion per year. The other producers are USA, Argentina, Brazil and Thailand. Renewable Energy Investments The same renewable energy report highlighted that over $120billion was invested worldwide in 2008 including new capacity doubling from 2006 which was $63 billion. Most investments were in wind power (42%), solar photovoltaic (32%) and bio fuels (13%).The USA had the highest investments of $24 billion in 2008 due to new wind installations and ethanol investments overtaking the traditional leader, Germany, with 20% of the global investments. Spain, China, and Germany invested between $15 to $19 billion each and Brazil invested $5billion with large investments in bio fuels. The solar power and wind industries had substantial new capital investment growth in manufacturing capacity (plant and equipment) and significant new investment into cellulosic ethanol (about $350 million). Cellulosic ethanol is a biofuel produced from wood, grasses, or the non-edible parts of plants. It is a type of biofuel produced from lignocelluloses, a structural material that comprises much of the mass of plants. Lignocellulose is composed mainly of cellulose, hemicelluloses and lignin. Corn stover, switch grass, miscanthus, woodchips and the byproducts of lawn and tree maintenance are some of the more popular cellulosic materials for ethanol production. Production of ethanol from lignocellulose has the advantage of abundant and diverse raw material compared to sources like corn and cane sugars, but requires a greater amount of processing to make the sugar monomers available to the microorganisms that are typically used to produce ethanol by fermentation (Wikipedia, 2009). The largest single funding institution was the European Investment Bank (EIB) providing $2,6 billion for RE projects in the EU and worldwide. Development assistance for renewable investments in developing countries expended greatly reaching $2 billion in 2008. KfW (German) provided $970 million, World Bank $280 million, Asian Development Bank and Inter American Development Bank $200 million, Global Energy Fund $100 million/year and The Netherlands $230 million. As part of the response to the financial crisis of 2008, in early 2009 a number of national governments announced plans to increase public finance of renewable energy technologies in an effort to stimulate economies and create “green jobs”. Table 1 below shows some of the countries which adopted this measure.
5
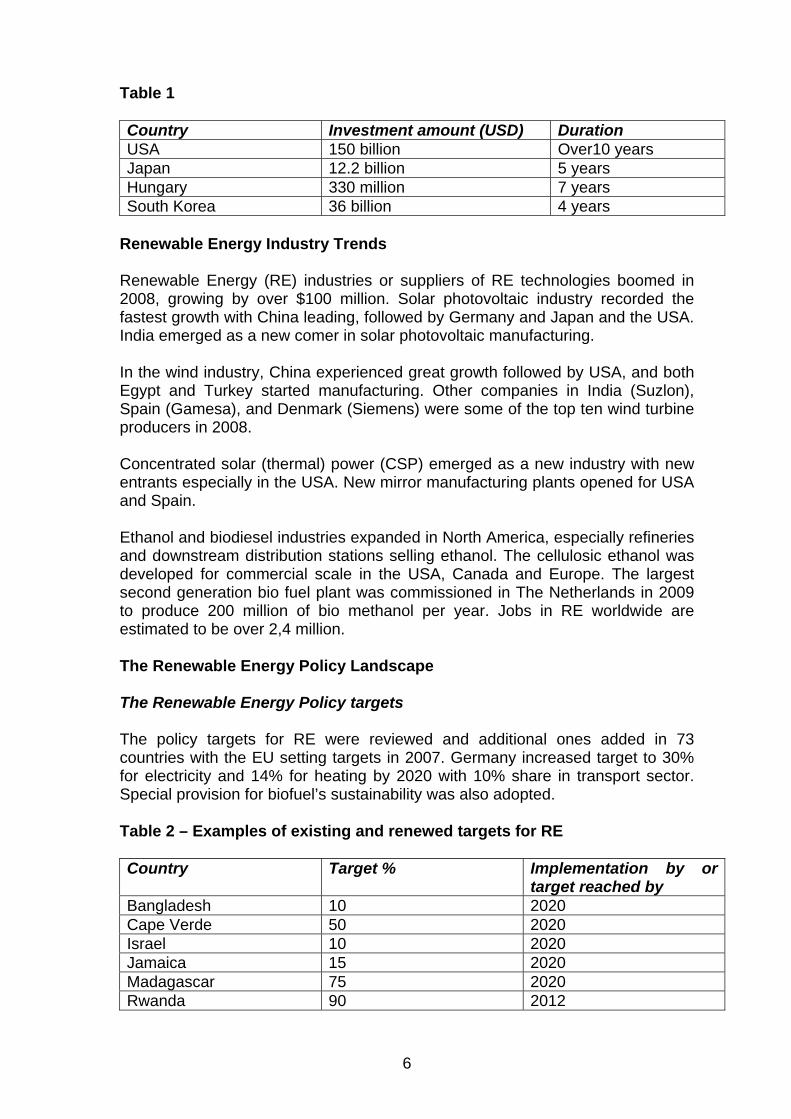
Table 1 Country Investment amount (USD) Duration USA 150 billion Over10 years Japan 12.2 billion 5 years Hungary 330 million 7 years South Korea 36 billion 4 years
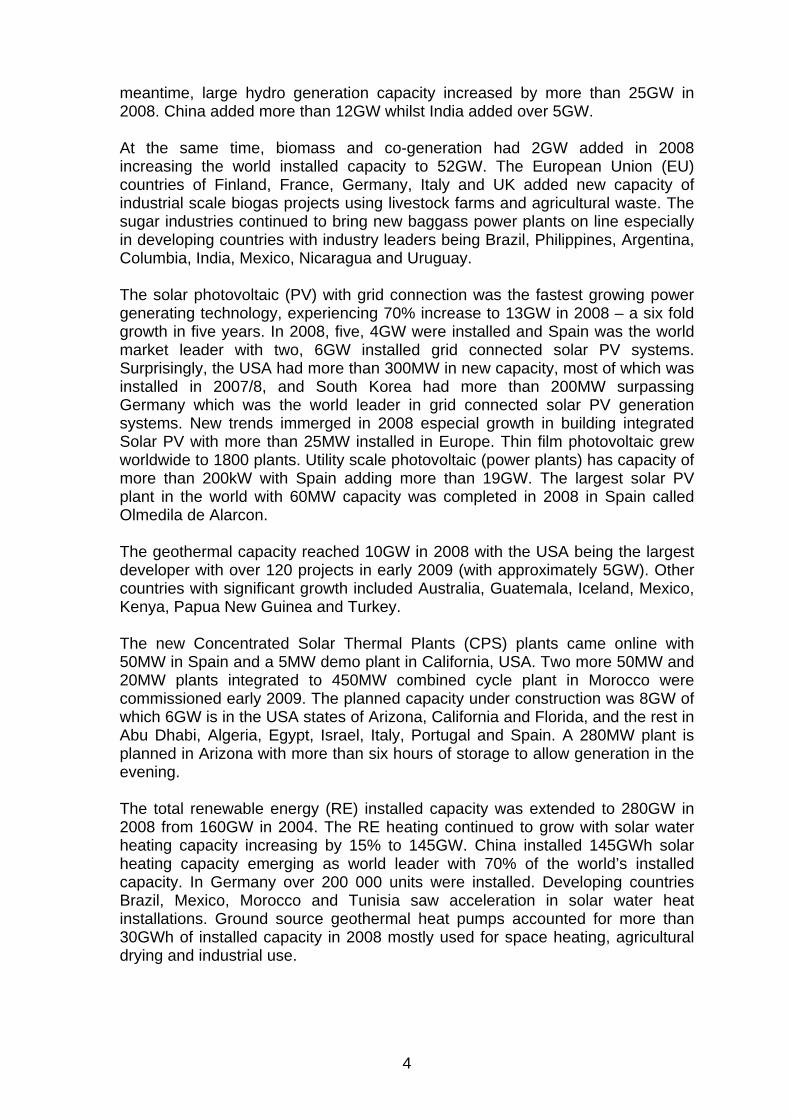
Renewable Energy Industry Trends Renewable Energy (RE) industries or suppliers of RE technologies boomed in 2008, growing by over $100 million. Solar photovoltaic industry recorded the fastest growth with China leading, followed by Germany and Japan and the USA. India emerged as a new comer in solar photovoltaic manufacturing. In the wind industry, China experienced great growth followed by USA, and both Egypt and Turkey started manufacturing. Other companies in India (Suzlon), Spain (Gamesa), and Denmark (Siemens) were some of the top ten wind turbine producers in 2008. Concentrated solar (thermal) power (CSP) emerged as a new industry with new entrants especially in the USA. New mirror manufacturing plants opened for USA and Spain. Ethanol and biodiesel industries expanded in North America, especially refineries and downstream distribution stations selling ethanol. The cellulosic ethanol was developed for commercial scale in the USA, Canada and Europe. The largest second generation bio fuel plant was commissioned in The Netherlands in 2009 to produce 200 million of bio methanol per year. Jobs in RE worldwide are estimated to be over 2,4 million. The Renewable Energy Policy Landscape The Renewable Energy Policy targets The policy targets for RE were reviewed and additional ones added in 73 countries with the EU setting targets in 2007. Germany increased target to 30% for electricity and 14% for heating by 2020 with 10% share in transport sector. Special provision for biofuel’s sustainability was also adopted. Table 2 – Examples of existing and renewed targets for RE Country Target % Implementation by or
target reached by Bangladesh 10 2020 Cape Verde 50 2020 Israel 10 2020 Jamaica 15 2020 Madagascar 75 2020 Rwanda 90 2012
6

China superseded the 30GW to 100GW target for wind it had set to achieve by 2020. A number of countries exceeded their 2010 RE targets during 2008 including Spain, Germany and Hungary. The Renewable Energy Power Generation Policies About 64 countries have policies to promote renewable power generation which include the following:
1. Feed in tariffs: • Feed in tariff -adoption in five countries’ electricity supply industry-
South Africa, Kenya, Philippines, Ukraine and Poland; • New feed in tariff for solar photovoltaic and solar thermal power for
India; • Feed in tariff for wind, hydro and biomass power for Norway; • Feed in tariff in California in USA for solar photovoltaic; • Green Energy Act – Canada; and • Revision of existing Feed in laws in Germany, France, Portugal, Spain
and the Slovak republic.
2. Renewable portfolio policy – through Renewable Portfolio Standard (RPS) in the USA’s states of Michigan 10% by 2015, and Missouri 15% by 2021.
3. Subsidy policy - about $3/watt for installations larger than 50kw in China.
4. New and Modified Policies:
• Increased subsidies for solar photovoltaic for institutions and homes; • Increase to two thirds of new homes built to have solar photovoltaic
by 2020; • Capital subsidy – USA; • Residential solar lease or loan program – USA; • Net metering – Mexico’s system for greater than 30KW; • 30% tax credit for USA solar photovoltaic, solar thermal, solar hot
water, small wind and geothermal; • Production tax credit extended to wind and solar power through 2012
and biomass, geothermal, etc, by 2013; • New RE law – Mexico with mandated targets for utilities purchases of
renewable generation connection priority for RE generators; • Allow for accelerated depreciation; • New energy conservation law – encourages private sector
participation in Syria; • South Africa – New agency to accelerate renewable energy projects;
and • National renewable development program created a market
facilitation, best practice and promotion centre for renewables. Solar Systems and Other Renewable Energy Policies:
7

1. Mandate solar water heating in new buildings – Spain, Cape Town South Africa (under consideration at national level).
2. Renewable heating law – Germany for space heating for new buildings to
produce 20% of required and 2 years transition for old buildings to 10%. (Industry solar, biogas, biomass and ground heat pumps with a budget of 500 million Euros).
3. 25% investment subsidiary in Canada. 40-50% subsidiaries for solar and
geothermal heating in Luxembourg – a 25-30 for biomass heating.
4. Green Mortgage – Mexico for supporting energy conservation.
5. South Africa - $200-$350 per household subsidy by ESKOM.
6. 30% tax credit in the USA. Biofuels Policies:
1. Tax exemptions/Tax incentives. 2. Targets set and adjusted for blending and use of bio fuels.
Country Target (litres) Implementation by or target reached by Australia 350 million 2010 Indonesia 390 million 2015 Japan 500 million 2020
Green Power Purchasing The voluntary purchase of green power grew in 2007-2008 as indicated in the table below: Country Customers Consumption Year USA 850,000 18TWh 2007 Germany 1 million households and 60,000
commercial 4.1 TWh 2007
Australia 934,000 1.8 TWh 2008 Switzerland 500,000 4.71 TWh 2007
City and Local Government Policy 1. Adopting renewable energy goals, targets and local subsidies. 2. Renewable energy promotion. 3. Urban planning laws review – inclusion of new building standards. 4. Demonstration projects, e.g. Tokyo’s 1GW new solar photovoltaic by 2010
and subsidies. 5. USA major Climate Protection Act.
8
Rural Off Grid Renewable Energy Progress has been difficult to trace in this area. The emerging trend of popular off grid technology is solar photovoltaic. The tradition 20-30Watt size units are being replaced by new less expensive solar – pico photovoltaic 1-5 Watts used with ultra low power Light Emitting Diode (LED) lamps for low income households. Solar Photovoltaic Systems Projects Country Project Funding institution Bangladesh 1.3 million Solar PV home systems World bank and Carbon
Finance China 400,000 solar PV (11MWtotal) World Bank Morocco 40,000 household systems German KfW
Other new projects There has been a lot of new:
• Solar torches; • One piece solar lantern; and • Solar-home-system kits power 1-2 LED lamps, radio and a cellular phone
charger. Rural Electrification Policy and Programs Some rural electrification programs have focused on the use of renewable energy for off-grid and mini-grid. Most of these have been donor led programs with some of these objectives:
- Improved cooking technology – improved biomass cooking stoves; and - Electricity access.
Some of the countries like Peru have plans to increase electrification from 30% to 50% by the year 2011. The Renewable Energy Global Status Report gives a good summary of global trends which is a good background for any renewable energy review process. The policy section is very interesting as it provides the insight on how policy implementation is country specific and no single policy is the solution. Feed in tariffs remain the single most successful policy intervention to overcome barriers to entry for RE technologies. A combination of policy interventions (incentives) were used to kick-start the implementation of renewable energy solutions. These initiatives worked together at different levels of government, both local and national. Technologies are changing and different technologies have had different success levels overtime with wind and solar experiencing the highest growth. What is not clear is the level of investment each government has had to make in the form of subsidies, which has played a critical role on boosting uptake in the form of tax incentives, feed in tariffs and capital subsidies. The question remains, if African governments with high competing priorities, especially poverty eradication being high on the agenda, will be able to stimulate
9

the introduction of renewable energy technologies outside the traditional large hydro power which is a mature technology. Southern Africa has one of the highest solar radiation levels but solar photovoltaic uptake is still very insignificant. Why has such a resource still not the first choice for new projects? Is it because of its current cost limitations, especially for large thermal, as compared to large coal and large hydro? Has the high growth in the uptake of renewables in developed countries helped in the cost reduction of such technologies? What will it take for the change to take place in sub-Saharan Africa as the electricity demand growth is high, with low electrification levels in rural areas? The African solution will lie in more than just the politics covered in the report. Stimulation of economic activity at a consumption level needs to be considered to increase income levels and the ability to pay for the consumption of modern energy services. Also, part of the grand strategy is to develop African solutions for African problems and emergence from technology colonialism. Technology Colonialism According to Gideon de Wet (2000), most developing countries have gained political independence however they remain ‘technology colonies’. The former colonies believe this has delayed their economic growth and has led to tension between the “North” and the “South”. The technology colonies are characterised by the large flow of technology from the developed world to the colony in the form of licensed product designs, processes, sub-assembles and final products through subsidiaries of multinational corporations. There is little research and development (R&D) activity in the local research and development community to the local industries, as most of the research and development is done at the headquarters in the developed country. In South Africa, more than 80% of the value in industrial business activity is done under a foreign “licence”. There are several strategic business alternatives for technology colonies to implement in order to grow their economies beyond the limitations of the domestic market. This requires the development of an export strategy beyond on the limited local market, thereby deriving benefit from the technology colony status. Singapore is a classic example of a successful technology colony with educated and developed skills of human resources which attracted multinationals to base a significant part of the global manufacturing capacity in the country. This strategy is referred to as being a technology colony of excellence and is a viable strategy. The technology colony which derives its competitive advantage from human resource productivity is “a technology colony of the first kind.” Gaining technological “independence” is critical for colonies to achieve higher levels of economic growth to support their population. It is important to note that no country is technologically self sufficient. The strategy is to eventually reach a level where the country can determine its economic future through innovation. Taiwan and South Korea with experienced and highly skilled human resources managed to develop their own design capabilities to compete globally under their
10

own brands. This independence in some cases was gained through adding value at earlier stages of the product life cycle which is termed “lateral innovation”. The main reason for colonisation was for colonisers to gain access to natural resources due to the abundant natural resources in the former colonies. The development of such technological colonies is often slow and many have returned the status of “the technological colonies of the second kind.” Their characteristics are typical and limited to the following:
- Development of infrastructure, transport, energy and communication to facilitate movement of commodities;
- The business orientation of natives is such that they have priority to serve these mines or farms through government structures as regulators or policy formulators or by being employed or with careers within utilities or mines and agriculture. There was limited opportunity to gain experience in research, design and product development; and
- Teachers and professors are educated in the first world countries and teach from first world text books. This creates the perception that local is not good enough and might not be accepted by employers or recognised by foreign former colonial masters who own the mines and commercial farms.
The colony of the second kind is a commodity provider whose economies tend to be affected by change in international commodity prices. A lot of countries in Southern Africa are greatly affected by their second kind technology colonial status such as Botswana for diamonds, South Africa for gold, platinum and diamonds, and Zambia for copper. Some of the strategies used to move forward out of the disadvantaged colonial status are: 1. Backward integration Moving upstream in the product life cycle by value addition in the earlier stages with a gain in ownership over intellectual property. This means technology transfer should be done in the form of design and development capability, applied research and basic scientific research. This strategy was successfully implemented by Japan, South Korea and Taiwan. The failure in most African countries has been due to the limited scope of technology transfers under the pretext that there is limited infrastructure overlooking the availability of scientific and technological implant. This process might take long to bear fruit and the process requires a joint effort from both private sector and government to manage the “technological evolution”. 2. Beneficiation This refers to adding value to raw materials, for example mining ores can be beneficiated to produce steel sections then steel structures and vehicles, machine tool and boilers and specialised equipment or products. It is not easy but can be done with cooperation between private and public sector.
11
3. Clustering Secondary industries are developed to serve other sectors like mining and end up developing skills and products to serve other related industries like vehicle manufacturing or assembly plants. 4. White Space Initiatives This is a strategy to venture into new fields which are not common in that country, e.g. Information Technology, pharmaceuticals, and defence technologies with the government creating relevant incentives. The Grand Strategy The key is to optimise resource investment through use of a National Innovation System:
• Reorientation of the tertiary engineering educator community. Most engineering graduates enter employment to focus on maintenance, operations and project management with few enterprises focusing on engineering design and development hence they never get the design experience;
• Review the role and function of scientific institutions. Industrial Technology Research Institutes (ITRI) are often seen as scientific “zoos” and lack support from stakeholders other than government. ITRI should focus on provision to support industrialisation strategy; and
• The approach to management of national innovation system should be formalised and reviewed constantly for improvement.
With a technology colony background, it is important to understand and implement the strategic options available and have the will to change. The process is complex and needs drivers and champions supported by political will. The technology manager cannot move without the buy-in of policy makers. The author strongly believes the region has the relevant skills and scientific know how to move towards technological sustainability. Any strategy or combination of strategies needs to be implemented with a view that the world is a global village with interdependencies which will continue for years to come. The current problem is that as much as the various strategies are feasible to move the natural resource rich countries from their technology colony status there is usually lip service paid in the form of political rhetoric to the strategies especially when the commodity prices are down and economies are in decline. Once the commodity prices improve and the economies start to improve, the whole issue goes to the back burner. What will it take for these countries to move forward? Are we ready for technology innovation or do we understand what technology innovation is? Technology Innovation Sagar AD and van der Zwaan B (2005) view development and deployment of new and improved energy technologies as central to the transition to cleaner and
12
more efficient forms of energy production and consumption. The development of new renewable technologies is mostly stimulated or driven by requirements to meet new international standards on the environment. There are two main components of technical change:
1. R & D – research, development and demonstration; and 2. Learning by doing – commercial use and innovation deployment through
the private sector. Questions have been asked about the role of public sector Energy Research and Development (ER&D) in the view of climate change and sustainable development. The private ER&D is also critical but impacts of all ER&D are very long term. At times other factors other than the public ER&D help to change the trajectory of the country’s energy sector:
• Changes in energy supply sources; and • Energy prices.
Deployment of new technologies often face barriers including cost, slow capital stock turnover, market organisation, and information and financing constraints, especially in developing countries. The barriers are overcome through the following interventions:
• Elimination of price distortions - granting subsidies for new technology - using regulatory instruments;
• Promoting deployment of emerging technology to help overcome initial cost barriers
- government mandating utilities to buy renewable energy power - government’s own procurement programs;
• Improved information provision to customers to overcome information barriers to energy technology deployment
- through eco labelling, energy star on equipment; and • Overcome infrastructural barriers
- requirements can be overwhelming such that depending on the type of technology various reform options can be followed.
“Learning” refers to experience obtained from using new technology. Learning takes various forms depending on the product or service, e.g.:
- Learning by manufacturing – experience in manufacturing photovoltaic modules has allowed production costs to be reduced overtime hence reducing the overall cost of technology;
- Learning by copying – typical across firms; - Learning by operating – skills gained over time by workers to operate
equipment safely and efficiently; and - Learning through implementation.
Benefits from learning:
• Lowering costs of components; and
13
• Lowering costs of implementation of projects in which new technology is used.
Learning curves differ from country to country and communities. The lesson is ER&D is necessary for deployment of new technologies which benefit from the learning process through feedback. Governments play a central role in the deployment of new technologies, which in most cases, is resisted by state owned utilities. Mandates to buy from renewable sources of power have had mixed results. Infrastructure upgrade costs to use new technology are still a big challenge. Technology Transfer – Southern African Perspective The article by Mabuza L O K, Brent A and Mapako M (2007) highlights the realities of challenges of technology transfer using practical examples of the implementation renewable energy technology projects in Africa. The approach is to identify practical experiences, their failures and successes, and develop valuable lessons for future project implementation by overcoming the barriers to technology transfer. The key issue is with the current cooperation efforts and globalisation, the technology transfer has not been successful in Africa due to the lack of a sustainable method of distribution, servicing and improving the technology to meet specific local needs. There is a general misconception which views technology transfer by the private sector as joint ventures with overseas product developers and governments view it as technology implementation. Technology transfer is holistic, involving the transfer of plant, machinery and equipment together with training, know-how and more effective means of organising the factors of production. The technology transfer can also involve the sharing of intellectual property overtime. The technology development, as observed by the Scientific and Development Network (2007), must provide for the newly acquired knowledge to be deeply assimilated and ultimately result in creative management, design engineering and innovation. By 2005, Zimbabwe had achieved considerable success in the increase of electrification levels to more than 40%. The government tried to improve further access through the implementation of various renewable energy projects which included:
1. Installation of 85,000 solar photovoltaic systems; 2. 200 units of biogas digesters; 3. introduction of 14,000 efficient wood and coal stoves; 4. 15 sights were identified for min hydro projects and solar PV water
pumping units; and 5. GEF jointly funded 9000 solar PV systems.
The projects were not effectively implemented due to the fact that there was no effective technology transfer. Top–bottom approaches were used, ignoring the fact that beneficiaries were peasant farmers with seasonal and erratic income circles. The stove design ignored some of the local traditions whilst the bio digesters were of poor construction due to lack of adequate training and
14

ultimately collapsed. It is clear that social anthropologists perspectives and stakeholder participation was lacking. South Africa had the following renewable technology projects implemented:
1. Solar electrification project by concession involving 300,000 households over 5 years; and
2. The solar rural electrification projects implemented by Eskom-Shell in the Eastern Cape and Limpopo provinces.
The lessons learned from the challenges of both projects were an insufficient level of stakeholder participation in the project design as the limitations of the systems became the main source of discontent. The fee for service was high compared to other alternatives which were required to complement the limitations. The skills transfer was inadequate as some basic skills such as change of bulbs were not passed on and left to poorly trained technicians who could not handle complex problems. Theft and vandalism was also an issue. The Botswana project involved the development of bio-digesters using cow dung for water pumping. The project failed due to lack of ownership and commitment from the intended beneficiaries. The quality of some of the bio-digesters was poor due to inadequate technology transfer. The introduction of efficient cook stoves in Kenya was the only highly successful project which was due to the involvement of the Kenyan people in the continued project design review process, involvement in the manufacture process and affordability of the product. The technology transfer involved all stakeholders and assisted in the creation of a viable industry which resulted in employment creation and improved livelihoods due to lower emissions from the improved stoves and savings from efficient use of charcoal. The stove has been adapted for use in other countries like Ethiopia, Malawi and Sudan. The key lesson is the importance of collaboration between the development community who provided the research and development funding and the local tin smiths and women corporations who participated in the design improvements and adaptation for their local use and dissemination of the technology. The case studies highlight the need for technology transfer to be a holistic process which includes transfer of both hard and soft aspects, including the adaptability of the technology to local conditions coupled with the building of local manufacturing capabilities to ensure a timely solution to customer problems. All these should be considered in the context of the size of the market. This is an area of exploration for the SADC community to negotiate as a common market which will justify economies of scale. The author agrees with the writers of the article in that there is need for further research to develop appropriate business models for technology transfer in the developing world context with a focus on rural communities. It should also include methods of improving income generation capabilities for poor communities to ensure sustainable development.
15
Renewable Energy Scenario in South Africa Pillay P and Sebitosi A B (2008) highlight in the article on Renewable Energy and the Environment in South Africa, that the renewable energy use and importance has been driven by the need to mitigate the adverse environmental impacts of fossil fuel usage, the volatility of fuel prices and the need to enhance national energy security. The increase in grid connected renewable energy has been phenomenally driven by strong policy support mechanisms. Key policy interventions have had mixed results in different circumstances depending on the socioeconomic environment. The renewable energy (RE) policies have mainly been directed toward investment cost reductions and/or public investment. Market facilitation policy implementation has also been challenging. In early 2008, South Africa had a capacity deficiency of approximately 10% mainly associated with reduced production at the coal thermal power plants. The country is endowed with more than 300 days of sunshine per year, has good wind regime and lots of gas, which can be generated from urban landfills to provide alternative electric power generation options. South Africa does seem to understand the basic requirements for enabling sustainable renewable energy and has a comprehensive white paper on renewable energy. This renewable energy policy document highlights the critical issues as financial and legal instruments, technology development, awareness raising, capacity building and education, and improved industry governance. The RE policy was developed after the white paper on energy (DME 1998) with both recognise the constitutional provision which states that every South African citizen has a right to an environment that is not harmful to their well being, reaffirming the need for sustainable development complemented by the reasonable legislature measures to prevent pollution. The policy on RE had a provision to develop a strategy for RE which would translate goals and objectives into an implementation plan which was still outstanding five years after the adoption of the policy indicating a lack of will or capacity to move forward with RE. With South Africa ranking the 7th greenhouse gas emitter worldwide, there is a need to urgently adopt RE on their energy mix, currently dominated by fossil fuel options. Would external pressure from institutions like SADC help to move the process forward? The power crisis of 2008 prompted DME and ESKOM to look into demand management options which included use of solar water heaters, compact florescent lights and deployment of the solar photovoltaic system in a multi pronged approach to manage the power supply. However these efforts are not well coordinated and lack the critical guide to the way forward which is through a clear strategy implementation plan identifying key stakeholders and resources requirements. Is ESKOM the only player to take this process forward? There is a need to mobilise other sectors of the economy like the private sector through a comprehensive RE strategy implementation which would also review the industry structure. The 2010 World Cup with massive construction projects presents the opportunity for South Africa to incorporate a reasonable scale of grid connected RE technologies into new housing projects, stadiums and other public infrastructure. South Africa has a lot to learn from the Sydney Olympics, where Australia successfully showcased solar photovoltaic (PV) power.
16

Raising awareness of the RE programs and projects is important. The education of children on RE should help ensure its sustainable future. The author, concurs with the conclusion by Pillay, et al (2008) that the only way to move the RE agenda forward is to develop a comprehensive strategy for implementation. The policy makers need to also address the need to improve availability of information and reliable energy data. The existence of a sectoral regulator provision of critical planning data information is necessary to improve policy decision making. Framework to Review Barriers to the Implementation of Renewable Energy Technologies According to Painuly J P (2001) the potential use of Renewable Energy Technology (RET) is estimated between 15-20% of the world energy demand. The World Bank estimates that demand in developing countries will increase to five million MW in the next 40 years. In financial terms, new capacity is estimated to require $5 trillion in new investments. The technologies such as solar, small scale hydro power and wind have been proven to be economically viable and ideal for rural communities. Other RET being considered cost competitive with conventional energy are:
1. Solar photovoltaic; 2. Small scale biomass generation; 3. Bio fuels; 4. Grid connected and off grid wind power; 5. Small hydro power; 6. Geothermal power; and 7. Methane utilisation from urban and industrial waste.
The United Nations (UN) has put a goal for 30% of the world’s needs to be met by renewable energy by 2025 and increased to 45% by 2050. The critical question still remains if the above is true, why has the use of renewable energy failed to penetrate the energy market when the potential is huge given the low access levels in some countries in Southern Africa? This question is answered by the fact that various barriers have been identified to be preventing penetration of RET’s, including cost effectiveness, technical and market barriers, inconsistent price structures, institutional, political and regulatory barriers, and social and environmental barriers. The framework for identifying barriers (Painuly 2001) proposes the following steps for the study:
1. Selection of RET – literature survey on the existing energy strategy and plans and plans, financing, innovation, institutional and legal mechanisms. This is followed by a techno-economic potential evaluation.
2. Define criteria for selection of RETs by reviewing the following:
- Adequate resource base for RET(solar, biomass or hydroelectric); - Available technologies and cost; - Commercial viability and financing (private or public finding);
17
- Environmental impacts and benefits; industry job creation potential - Socioeconomic impacts; and - Coverage centralised or decentralised options.
This process involves stakeholder participation. It may include quantitative and qualitative methods, a literature survey and site visits. Painuly (2001) identifies the following major challenges in his framework: 1. Market failure or imperfection
• Highly controlled/regulated energy sector – over regulation has failed to allow for viability of the industry;
• Lack of information and awareness; • Restricted access to technology – technology not available local
imports and expensive; • Lack of competition; • Missing market structure – increased price to consumer; and • High investment requirements – early barrier for entrepreneurs.
2. Market distortions • Favour (subsidies) to conventional energy – affects
competitiveness of renewable technologies; • Taxes on RETs – cost of energy from RETs increases; • Non consideration of externalities – conventional fossil fuel energy
priced below cost; and • Trade barriers – high costs of import duties increase cost of RETs.
3. Economic and Financial • Economically not viable – cost reduction required; • High discount rates – incentives required to break entry barrier; • Long pay back period – project not viable; • High cost of capital – affects project viability; • Market size small – economies of scale not achieved; • Lack of access to capital – few producers, no competition and no
market efficiency; • Lack of credit to consumers – reducers market size; • High upfront costs for investors – increased risk; and • Lack of financial institutions to support RETs, lack of instruments
affects ability to compete.
4. Institutional • Lack of intervention or mechanism for mechanism for intervention
dissemination – non availability of information or producers and suppliers;
• Lack of a legal/ regulatory framework – RET traders face market barriers/ economic;
• Problems in realising financial measures; • Unstable microeconomic environment;
18

• Lack of involvement of stakeholders in decision making leading to misplaced priorities;
• Clash of interests – leads to powerful lobbies against RETs; • Lack of private sector participation – lack of competition; and • Lack of professional institutions.
5. Technical • Lack of standards and codes and certification – product quality and
acceptability is affected; • Lack of skilled personnel or training facilities – can affect product
acceptability; • Lack of entrepreneurs – lack of competition; • System constraints – market can not be realised by producers; and • Product not reliable – market size may get affected.
6. Social, Cultural and Behavioural • Lack of consumer acceptance of the product – small market size;
and • Lack of social acceptance for some RETs – affects market size
(hotels in Botswana refusing to use bio gas from human waste for cooking).
7. Other Barriers
• Uncertain government policies – uncertainty lack of continuity; • Environmental – damages and pollution unacceptable; • High risks perceptions of RETs – increases cost of capital; and • Lack of infrastructure – grid connectivity.
Some of the proven measures to overcome barriers are explained below:
1. Energy sector liberation – restructuring the energy sector with the establishment of independent regulators and legal provision for the private sector entry and participation. The basic purpose of liberation was to increase efficiency and facilitate market competition in developed countries whilst the purpose in developing countries is to increase efficiency and also allow governments to facilitate private sector investments in energy infrastructure.
2. Guaranteed markets – to allow RETs to compete in the energy market
suppliers are obliged through policy instruments and regulations to include them in their energy mix. Examples include the UK non fossil fuel obligation (NFFO), the renewable portfolios standard (RPS) in the USA and the electricity feed law in Germany.
3. Economic and financial incentives – capital subsidies are the major
incentives offered by most governments for RET, and various programs by multi-lateral institutions like the World Bank or ESMAP (WB and UNDP). Developing countries have provided micro-credit through revolving funds (Uganda and Zimbabwe). This is a major
19
challenge for most governments in developing countries who do not have the capacity to offer direct subsidies.
4. Government investments – governments in some countries have made
direct investment through designated institutions for RETs.
5. Information and awareness campaigns – campaigns usually target specific technologies. Stakeholders are educated and supplied with the necessary tools to evaluate RETs and design implementation.
6. Standards and regulations – deregulation allows grid connection of
RETs and provides standards to boost confidence of RET products.
7. Institutional measures – setting up of regulatory agencies to over see the sector liberation and measures to promote energy service companies (ESCOs).
8. Research and Development – high cost of RETs skill is a major barrier
to penetration. More research budgets and sustainable funding is required to develop affordable options.
9. Facilitation measures – financing of feasibility studies, planning and
fixing targets for RE contribution resource assessments. Skill development through training in various aspects of RETs.
10. Moral and ethical considerations – green pricing and voluntary actions
through paying more for renewable electricity by consumers. This has worked well in Europe and USA.
The RETs have become competitive with conventional energy sources but more still needs to be done to tap into their full potential. Developing countries offer high potential and stakeholder involvement is critical to develop effective measures for overcoming barriers. The process should help to develop holistic solutions to barrier removal. Why has this happened effectively thus far are some of the questions which will be addressed by reviewing further literature. PART B. THE RENEWABLE ENERGY TECHNOLOGIES IN BOTSWANA Botswana, like most of the countries within the SADC region, has faced many challenges in implementing new renewable energy projects. This part of the analysis uses the Painuly (2001) framework to review the barriers to implementation of the renewable technologies with the ultimate objective to recommend the most suitable options for Botswana. The Overview of the Botswana Energy Sector The Ministry of Minerals Energy and Water Resources through the Energy Affairs Department is responsible for the formulation, direction and coordination of the national energy policy. The overall policy goal for the energy sector is to provide
20

affordable, environmentally friendly and sustainable energy services in order to promote social and economic development. Botswana has limited energy resources and therefore relies on imported energy sources, primarily petroleum products and electricity. However, the country has abundant coal reserves and is blessed with one of the best solar regimes in the world. There is need to promote the use of indigenous energy resources such as coal and solar energy to reduce dependence on imported energy sources. The energy sector in Botswana comprises both conventional and non-conventional energy sources with the conventional dominated by electricity, petroleum products and coal, and the latter by mainly biomass in the form of fuel wood. Since the beginning of the National Development Plan 8, Botswana has adopted the integrated energy planning concept that aims for the least cost development for the energy sector and focuses on customer requirements as opposed to the supply sector. This management approach will continue to be used to facilitate optimal efficiency of the sector. The Botswana Energy Resources Coal Resources Botswana’s energy resource base is dominated by huge coal reserves estimated at 212 billion tons. Only the Morupule Colliery is currently operational. The resource and economic potential for coal bed methane (CBM) is still to be established, although estimates put the CBM resource potential at roughly 35 terra cubic feet (TCF). There are two companies (Kalahari gas and Saber) doing explorations. The CBM is targeted for power generation. Oil Reserves Botswana has no known petroleum reserves and the country has to import all its petroleum products requirements in refined form, mainly from South Africa. Biomass The woody biomass loading ranges from 3.6 to 4.3 tons per ha per annum for shrub savannah to 4.8 to 10.6 tons per ha per annum for dense forest. Solar The mean annual solar insolation is 21 MJ per m2 per day, one of the highest radiation levels in the world. Wind Average wind speeds range from 2.0 to 3.5 m/s, considered too low for viable wind based power generation, but reasonable for water pumping. Wind pump technology is not widely used in Botswana.
21

Bio-fuels Potential A feasibility study on bio-fuels production and use in Botswana established that there was potential for bio-fuels, mainly ethanol based on sorghum and sugar cane feedstock and biodiesel from jatropha. Government support in the form of tax and levy exemption would be required for these options to be viable. Other issues to be addressed include research into feedstock crops, and operation and maintenance of production equipment as well as the establishment of an appropriate institutional framework for the promotion of bio-fuels. Biogas With a large cattle population, the potential for biogas should be huge. However, as most of the cattle are free range, this potential cannot be realized except at slaughterhouses and dairies. Power from waste or landfills There is also potential for producing energy from municipal solid waste of about 16.9 million tons per year and from waste water treatment plants. The overall energy consumption for Botswana Diagram 1 – Botswana Energy Flow Diagram
Energy Flow 2005 (Source IEA) Table 3 – Sources of Energy and usage
22

ENERGY TYPE USE [ktoe] %PETROL AND DIESEL 612.7 41%LPG 36.2 2%PARAFFIN 15.7 1%OTHER PETROLEUM PRODUCTS 17.7 1%COAL 135.6 9%ELECTRICITY IMPORTED 150.8 10%ELECTRICITY LOCAL 83.5 6%WOOD 455.7 30%TOTAL 1507.9 100% Diagram 2 – Energy use by type 2005 (source, IEA)
PETROL AND DIESEL
41%
LPG2%
COAL9%
PARAFFIN1%
OTHER PETROLEUM PRODUCTS
1%
ELECTRICTIY IM PORTED
10%
ELECTRICITY LOCAL
6%
WOOD30%
According to the statistics provided by the International Energy Agency (EIA) in 2005 (see various diagrams above), the energy consumption in Botswana was mainly dominated by petroleum fuels including LPG constituting 45% for use in the transport sector (for public and private vehicles), industry and domestic consumers for lighting and cooking purposes (liquid paraffin). The fuel wood contributes 30% of the energy consumption in the country and is used mainly for domestic cooking and by government institutions. Electricity provides 16% of the total energy needs of the country with 10% being imported. Coal contributes 9% mainly used by mining sector industry and for power production. The situation today is not too different from the above, with the mining sector’s energy demand projected to grow over the next 5 years. Electricity Consumption In the financial year 2007/8, BPC data indicated that mining continued to be the highest consumer of electricity at almost 46% of total energy consumption, and will increase as new mines are opened. This is followed by the business sector at 27% and domestic consumption at 16%. The government consumes just about 11% of the total electricity available.
23

Type 2007 Share %SMALL BUSINESS 154,127,048 6%
MED BUSINESS 296,272,875 12%LARGE BUSINESS 222,008,514 9%
MINING 1,186,200,943 46%DOMESTIC 414,140,832 16%
GOVERNMENT 273,543,328 11%WATER PUMPING 11,587,485 0%
TOTAL 2,557,881,025 100% Diagram 3 – BPC Sales KWh 2007-2008 by customer (source, BPC)
SMALL BUSINESS6%
MED BUSINESS12%
LARGE BUSINESS9%
MINING46%
DOMESTIC16%
WATER PUMPING0%
GOVERNMENT11%
BPC sales share by customer2007 (Source, BPC) Table 4 – Electricity Demand projections in the near term
24
With the current growth in demand at more than 6% per annum and the existing bilateral contracts reducing firm power, Botswana will have a major capacity deficit post 2010, and will need to be met through emergency power supplies. This gap can also be met using renewable energy instead of the 80MW of diesel generators planned for commissioning in 2010. Why Renewable Energy Technologies The energy consumption pattern described above represents the current situation in Botswana with the supply deficit increasing annually. There are great efforts to provide people with better services and resources which include access to electricity, access to modern cooking fuels, increased employment and improved mobility. The three major areas of concern which affect the country’s ability to supply more energy to the people and influence the decision making are:
1. The current high reliance on fossil fuels is unsustainable in the long term due to large fluctuations in oil prices for industry and household which often have huge economic and social consequences.
2. Fossil fuel use has a negative impact on the environment due to pollution
and the negative environmental impacts of mining, related to coal.
3. Fossil fuels are all carbon based resulting in emissions of carbon dioxide into the atmosphere contributing to the green house effect.
For this reason, it is important for Botswana to explore the use of renewable energy in lieu of fossil fuels and to also encourage the efficient use of energy by converting to compact fluorescent lights, energy efficient stoves, and other efficiency measures. The Renewable Energy Resources and Technologies in Botswana The following renewable energy resource options could have a significant role in Botswana:
1. Solar energy converted into other useful forms through a. Solar photovoltaic energy – electricity generation b. Solar thermal for heating – water, space, cooking and process heat c. Solar thermal electric technologies d. Sunlight – being used as a source of lighting, space heating in
homes and work places.
2. Biomass a. Electricity generation through combustion in boilers to drive
turbines or through gasification b. Household energy fuels used for cooking and space heating c. Bio-fuels – used as fuel for transport or blended with other liquid
fuels.
25

3. Landfill gas a. Methane gas produced at landfill site from organic material to be
used for electricity generation or for driving gas turbines.
4. Geothermal – where the heat in the earth is used to drive heat engines. 5. Wind energy – electricity generation in small scale, due to the low wind
speeds in Botswana, and water pumping. Not much power is expected due to low wind speed regimes of less than 3m/s.
Solar Energy Solar Photovoltaic Solar Photovoltaic (PV) panels convert solar radiation into electricity using the photovoltaic effect. A PV module has no moving parts and warranties are around 20 years. The technology is still very expensive and there are several thousand installed in Botswana (although most are not working due to failure of battery systems). According to the Renewable Energy Report, there are more than 2,6GW installed capacity in Spain as of 2008. Photovoltaic modules are used in a variety of applications as an alternative power source or for use in situations where there is no grid. This includes remote telecommunications, power for water pumps, security systems, and power for remote clinics, schools and households. Botswana had an off grid system which was not very successful and was suspended in 2004 due to numerous unit failures and failure to pay by recipients. A new program has been designed which will be implemented by the Botswana Power Company under a fee for service basis currently estimated at P70/month. The program is jointly funded by UNDP and the government, and will involve 88 villages. The price of modules was still high for South Africa in early 2006, and the price of modules was about R26 000/kWh, yielding a price of R1.50/kWh. The potential for contribution of the PV systems is not limited by the solar resource but the fact that the PV systems only generate power when there is sunlight. If solar becomes a considerable contributor to the grid power it becomes necessary to have an adequate energy storage system in place to accommodate the variability of PV generation. Even though costs are predicted to half by 2015, it will still remain much more expensive than the coal fired power station. Solar PV is still expected to play a significant role in the power sector due to the following advantages:
• Ease of use, It requires minimal maintenance, mainly cleaning, and carries a warranty for up to 20 years. It is simple to install and well suited for off grid applications.
• Electricity is generated at point of use. It can be installed anywhere and can be integrated into the grid distribution system.
26

• Technology is being developed to integrate PV modules into dual purpose applications:
- Roof tiles and roofing membranes - Durable building cladding - Fabrics for tents and clothing - Portable product surfaces- watches, cell phones, radios, etc.)
• The long run marginal costs of fossil fuels will increase, especially if environmental costs are incorporated, and solar PV will become more competitive.
In Botswana there is a project planned which will be funded by the Government of Japan to build a 1 MW solar PV installation near Gaborone to feed directly into the grid. Not much information is currently available on the status of this project. Solar Thermal When solar energy is concentrated using mirrors or lenses it is possible to achieve high temperatures suitable for generating steam and driving turbines and heat engines. The Concentrated Solar Power (CSP) technology has the lowest costs for large scale solar generation (Solar Paces 2005). Several plants have been installed world wide over the past 10 years with the bulk of them being in California. The main technologies being used today include:
• Power tower systems - mirrors or heliostats reflect and concentrate sunlight onto a central tower mounted receiver where energy is transferred to the air or some other heat transfer fluid. This is used to drive turbines and typically designed to operate in multi-megawatt range.
• Parabolic trough - a reflective parabolic trough concentrates sunlight onto a tube located along the trough’s focal line, heating fluid in the tube is then pumped into a steam turbine or generator or can be used to provide process heat. The troughs are designed to track the sun in order to maintain the focus on the tube and the temperatures of the fluid can exceed 400oC. This technology is used in California and can be used for multi-megawatt range (50-200MW).
• Dish Concentrator systems – a parabolic dish or array of dishes focuses light on to a receiver where it can be used to generate electricity directly in a small heat engine (a Stirling engine). These are smaller systems from 50 watts to 25 or 50kilowatts and mainly used for small scale distributed systems.
• Solar chimney or green tower – uses a very tall chimney up to 2km high with a green house collector surrounding it in the ground. The hot air rises in the chimney and the resultant draft drives wind turbines to generate electricity. This technology, if well, designed can produce power on a 24hr basis while providing agricultural produce grown in a green house.
The CSP technologies have an advantage that thermal energy storage can be incorporated into the design using molten salts or other heat stores thereby allowing power generation during cloud cover or evening. Gas or other fuel
27

burners can be incorporated into the system so it can produce continuously into the grid after dark. In southern Africa the use of this technology is currently limited with South Africa having a 25kW demonstration plant at the Development Bank of South Africa. Botswana is currently planning to build a 200MW plant solar tower project and the feasibility study was completed in draft form. Unlike PV technology, the CSP plants can have a wider range of application if used with heat storage and other fuels. The CSPs can generate 25-40MW /km2 (WBGU 2003, p 66) which is much less land use in relation to large scale hydroelectric dams. Solar Thermal Heating (Water, space and process) Solar water heaters, cookers, solar dryers, and solar process heating systems allow solar energy to be trapped and used to heat the fluid, air or food. Provided buildings are well designed, it is possible to reduce space heating using electricity or other sources in winter. For most households half of the energy is used for water heating, presenting a high potential for energy savings and a reduction in peak demand. In Botswana there was a deliberate effort to introduce solar water heaters and these are evident in several government funded housing schemes around the country. However, the quality of systems was poor without back up spares which led to premature failures and most of these are now connected to the house mains. The high cost of systems was one of the major barriers with a lack of funding to develop the local industry and training program. Although there are standards for systems which have been adopted, these have been difficult to enforce. There is potential for solar heating systems to displace a significant amount of energy in Botswana in residential applications, however this is not quantified and the officials at the Ministry are not presently interested in this potential area of energy savings due to the poor performance of existing systems. Wind The wind energy conversion systems convert energy in moving air to electricity or mechanical energy to move pumps. Wind turbines generating electricity range from 100W up to multi-megawatt systems (10MW to 100MW). Wind energy is currently the fasted growing energy industry in the world and large wind farms are being installed on and off shore worldwide. Wind powered water pump are a common feature in Southern African countries. The Darling wind farm is the biggest in the region with potential to produce 5MW in Cape Town. Due to low average wind speeds in Botswana, the use of wind energy applications are at present limited to water pumping with few scattered wind
28
pumps across the country. Wind energy resource mapping, estimation and technologies need to be continuously researched and further developed. Hydro Power Potential Hydropower, hydraulic power or water power is power derived from the force or energy of moving water, which may be harnessed for useful purposes. It is dependent on the geographical terrain through which rivers flow and energy available is a function of the water flow rate and the change in height as it flows downhill. As Botswana is a water stressed semi-arid country, the hydro power potential is minimal. Biomass Biomass is a major source of energy. It can be used directly for heating or cooking fuel and also as a fuel for boilers, gasification and fluidized bed gasification. It can be used indirectly as using biological processes to produce methanol or ethanol and crating liquid fuels for transport and cooking purposes. Crops with high oil content are currently being used to produce bio-fuels which can be used directly or blended, with other fossil fuels. Anaerobic bacteria produce methane from biomass and this can be captured directly for thermal and power generation. The methane can be sourced from landfill sites or produced using biogas digesters. In Botswana, fuelwood constitutes 30% of the total energy used in the country and more than 70% of households use it for cooking. Its scarcity is increasingly visible in both the urban and rural areas, more especially around towns and large villages due to unsustainable harvesting. There are programs in place to encourage the use of efficient wood stoves. With environmental concerns taking centre stage worldwide, promotion and utilization of new and renewable sources of energy is also getting more attention. Biogas production, which has a huge potential in Botswana, is an area which government is looking into as an alternative cooking fuel and for space heating, lighting and fuel source for gas turbines or mechanical energy. Previous biogas programs have not been successful due to inadequate technology adaptation, training and the villagers buy-in resulting in redundancy and failure of some bio-digesters. Lessons have been learned and government is engaging with stakeholders to develop more appropriate systems and sustainable process chains which will include gas production for electricity generation plant which will be run by government and villagers will provide cow dung for the bio-digester. The landfill technologies will be left for the private sector to explore further and install turbines to supply the national grid. For bio-fuels, the government commissioned a feasibility study to look into the potential of bio-fuels in Botswana. According to the report by EECG Consultants, the key findings were:
29
1. Botswana has a potential to produce bio-fuels, mainly ethanol and biodiesel, but with a higher potential for biodiesel production. At the adopted operation and maintenance costs, biodiesel will require more government support than ethanol. All the bio-gel is currently imported and opportunity for its production in the country will be possible if ethanol production occurs in the country.
2. The land availability and suitability will not be a limitation in the production
of bio-fuels feedstock with regard to the two energy crops of Jatropha and sweet sorghum that have been identified to be suitable for Botswana.
3. Production of ethanol will require larger scale feedstock and fuel
production but for biodiesel feedstock can be produced at both a large and small scale. Analysis shows that biodiesel production will be cost competitive at a large scale (50 million litres per year plant) while small scale producers could derive better returns by producing just the raw oil.
4. Feedstock and bio-fuel production will generate employment (in excess of
5,000 jobs) and contribute to import substitution (about 5%) and GDP (about 10%) of the country from the estimated ethanol and biodiesel production. Ethanol production, however, lends itself to mechanized feedstock production while biodiesel feedstock production is more labour intensive.
5. In comparison with wholesale prices of fossil fuels (petrol and diesel), bio-
fuels will only be competitive with levy reduction of the order of 50% for ethanol and 75% for biodiesel. Exempting ethanol and biodiesel from VAT and fuel levy, and introducing a Green Levy of 10 thebe for petrol and 5 thebe for blended petrol; then 15 thebe for fossil diesel and 9 thebe for blended diesel will have a similar effect as reducing the levies by the margins of 50% and 75% of ethanol and biodiesel, respectively.
The study also identified the following cross cutting issues which affect the general implementation of most renewable energy projects especially the bio-fuels:
1. Environmental assessment: The environmental assessment reflects a number of environmental impacts (both negative and positive) related to feedstock production, bio-fuel production and use, but the tilt is in favour of the positive rather than negative impacts. Use of sweet sorghum and Jatropha will not pose any serious demand for input resources (energy, water and fertilizers) and pesticides. Lessons are required on Jatropha as it has not been grown on a wide scale in the country. Tests on biogel combustion indicated that emissions of CO and unburnt hydrocarbons could occur. Good quality biogel and appliances plus use in ventilated spaces will reduce these emissions.
2. Socio-economic potential: There is huge potential for entrepreneurship in inputs supply, feedstock production, plant operation, maintenance and downstream industries. The volume of business that can be generated in these spheres has been estimated to be in excess of P1
30

billion. The estimated job creation considering maximum utilization of land that is not currently planted is about 5400-6600 for feedstock production and around 200 jobs at ethanol and biodiesel plants combined. Households can also make as much as P5000/month from feedstock production and sale of bio-oil on a 10 ha plot.
3. Policy, Legal and regulatory Frameworks: The critical policy elements
for bio-fuel production and use relate to government control of retail prices, incentives in the form of reduction in levies on bio-fuel price-build up and duty on imports. Subsidies are particularly required to enhance feedstock production and construction of plants and other infrastructure. Price incentives and financing of infrastructure could be done through a fund similar to the National Petroleum Fund. Policy should also facilitate easy access to credits/grants. On blending ratios, E5 and B5 to B10 are seen as the feasible mandates, and can be supported by the assessed potential production capacity. The Environmental Impact Assessment Act as it stands gives every investor an opportunity whether their project will need an EIA or not which is fair. What government may require is to set a minimum investment size for which EIA will be required. There are a number of bio-fuels (both ethanol and biodiesel) standards from which Botswana can adapt when developing the national standards and this requires involvement of the Botswana Bureau of Standards. Bio-fuel production and use will require government support and tax exemptions, similar to other bio-fuel producing countries.
4. Trade: International trade is currently low relative to the trade in fossil fuels. The market is, however, on the increase and there is a ready market for bio-fuels in Europe, USA and emerging developed countries such as China and India. Opportunities for exploiting low duty imports from SACU and SADC exist and the government could also reduce duty on the bio-fuels imports. Trading at SADC/SACU level will also facilitate adoption of uniform bio-fuels standards for the region. Botswana would not be able to export bio-fuels immediately but when they do there are privileges under EU that will allow favourably trading.
5. Skills development and Institutional framework: Basic skills for
production of bio-fuels can be found in Botswana, but there will be a need for enhancement on research for feedstocks, operating, management and maintenance of production plants, and policy-making skills.
6. Institutional framework: This is necessary for the promotion of bio-fuels
and is available to the various stakeholders that exist in the country. The private sector has shown interest to support government initiative, provided the necessary policies and incentives are in place.
31

7. Research: Research opportunities identified relate to improvement of feedstock crops including assessment of potential in indigenous plants. Another level of research is on competitive production systems and scales.
Challenges to Implementation of Renewable Technologies in Botswana Market issues The energy sector in Botswana is highly regulated. In the electricity supply industry (dominated by a state owned power utility, Botswana Power Corporation), there are no other players although a licence has been issued to an independent power producer. Unfortunately the ability of the IPP to operate viably will depend mainly on the regulatory framework in South Africa, and not Botswana, as the main off taker of the energy from the IPP. The market will continue without competition and the government will remain the major player and regulator. The current electricity price controls have resulted in the utility failing to realise any return on investments. All liquid fuels are imported and the industry is dominated by the international oil companies, e.g. Engen, Total and Caltex, with the state playing a small role in ensuring strategic stocks are kept by the main companies. The price is also controlled by government with the National Energy Fund used to cushion customers against price volatility. Biomass is usually the most used fuel by households and generally viewed as free although in urban areas it is sold as a commodity. This has resulted in unsustainable harvesting of trees and deforestation. Renewable energy technologies are viewed as new and there is limited information on their availability and access to the general populace. Economic and Financial The current supply of energy especially electricity in Botswana is mainly through imports from South Africa. With the current crisis in new generation capacity in the region, Botswana is in the process of building its own coal fired thermal power stations to meet their own demand. Due to the size of market, the current planned 600MW from Morupule will be sufficient to meet internal demand by 2012 whilst any addition capacity will need to be sold to the rest of the region. The plans to build a solar tower may not be viable due to the high cost of solar technology in the near term; it will be necessary to invest in such technology as a more sustainable solution to meet the future energy needs of Botswana. By virtue of being semi-arid, low population density country, renewable technology will be the best way to electrify the rural arrears through distributed networks to yield low transmission losses. Institutional At various forums on the topic of renewable energy technology supplies have lamented that lack of policy, legal and regulatory framework has been the main
32

barrier to introduction of such technologies to the Botswana market. Currently private sector participation is limited in the supply of solar heaters and a few suppliers have of bio-digester. There is interest in technologies, like CSP, but depending on government priority there remains a need to work out strategies of information dissemination and exposure of the private sector to suppliers of renewable technology worldwide. Technical The technical barrier is one of the biggest barriers facing Botswana. Being a sparsely populated country the market is quite small with limited industrial development, skilled labour and training facilities for new or mature technologies. This comes from the limited institutional capacity and funding for research and development. Although a new standards bureau has been established, it lacks sufficient capacity to combat the challenge of standards on enforcement. Social, Cultural and Behavioural The social and cultural issues are still affecting acceptance of new technologies. A typical example is the use of gas from biodigesters for cooking. Some hotels will only use gas produced using food and vegetable waste and will not use animal and human waste for producing the cooking gas even though the characteristics of the gas remain unchanged. Other Barriers The other barrier applicable to Botswana is the lack of government policy with clear targets for renewable technology. This affects consistency in policy ability to develop incentives to encourage or discourage use of certain technologies. Although some technologies could have negative impacts on the environment, no studies have been carried out to determine the extent and to devise ways of mitigation. Measures in Place to Overcome Barriers to Implementation Energy sector liberation Botswana has not fully liberalized the energy sector, but it has adopted and implemented some aspects of power sector reform. Botswana is among the only two countries in the region that has not reviewed its legislation to provide for an independent regulator although it has carried out some studies to determine the need for a regulator for such a small market. A tender has been issued to look for consultants to assist in the development of the necessary legal, regulatory and institutional frameworks for the setting up of a multisectoral regulator, focusing initially on the energy sector. The electricity act was amended in 2007 to accommodate the participation of independent power produces in the electricity supply industry. It is hoped that by
33

the end of 2010 there will be a regulatory institution set up to regulate the energy sector. An energy policy is currently being developed which will include the strategy implementation plan, including targets for renewable energy. This policy should be adopted by June 2010. Ideally the electricity white paper should have preceded the energy liberalisation and determined the structure of the industry. However this will still achieve the ultimate purpose to change the energy market structure, introduce competition and resulting in competitive pricing of services and products. Guaranteed markets To allow renewable energy technologies to compete in the energy market suppliers are obliged through policy instruments and regulations to include them in their energy mix. Examples include the UK non fossil fuel obligation (NFFO), the renewable portfolios standard (RPS) in the USA and the electricity feed law in Germany. Botswana is still to come up with various policy initiatives for encouraging the use of renewable technologies. On the solar PV side, government together with UNDP is currently working on a programme to electrify 88 villages using solar PV systems. Economic and financial incentives In most countries capital subsidies are the major incentive offered by most governments for renewable energy technologies penetration strategy to work. Currently, aside from solar PV, there are no specific subsidies being directly funded by government to the consumer for a minimum cost of service. The bio-fuels feasibility study is also advocating for some incentives from government and deliberations with the Ministry of Finance and Development Planning include a reduction of levies on bio-fuels to make price competitive with conventional fuels, feedstock production prices, on consumer goods/equipment that use bio-fuels, reduce import duties on imported equipment and inputs for bio-fuel production, and control of bio-fuel prices. Much work remains to be done in Botswana. Government investments The government of Botswana has opted to make direct investments for the implementation of the following renewable technologies:
1. the solar PV projects to electrify the 88 villages 2. purchase of the processing plant for the production of bio-fuels 3. find the building of biodigesters and relevant equipment for production of
electricity 4. provide guarantees and possibly co-fund the Solar Thermal Tower project
34
Information and awareness campaigns The government is still to define a clear policy position and recommend appropriate technologies. It is recommended that once the solar PV programme is started it should be preceded by an extensive campaign on the education of the intended beneficiaries and the general population. The implementation should be followed by a process of localisation of the products so that spares and repairs and maintenance of systems is possible. Lessons should be learned from previous programs, including the PV project that was suspended in 2004. Standards and regulations Although standards have been developed and/or adapted for Botswana, the standards association needs to develop, implement and enforce procedures for some selected renewable technologies, like solar heaters. Institutional measures There are plans to establish a regulatory agency to oversee the sector liberation and measures to promote energy service companies (ESCOs) in future. It is necessary for government to expedite this process and set up the regulatory agency by June 2010. RECOMMENDATIONS Having analysed the various renewable technology systems available for possible implementation, examined the current barriers to their implementation and the measures in place to remove the barriers, it is recommended that the following renewable technologies are prioritised by government: The prioritisation of solar energy projects is critical in Botswana given the high radiation or insolation levels and the over 320 days of sun availability. This is an infinite resource whose availability should be maximised, focused on the following:
1. Solar PV systems for rural electrification. These should be done in the form of distributed mini grids. Any new program should aim to ensure sustainability of the systems and should be linked to the development of local entrepreneurs to provide spares of the energy storage systems. Such projects should be implemented with other renewable back up options to supply essential services such as bio-digesters supplying gas turbines connected to the grids. The essential issue is to design projects that are self sustaining and would empower the users in one form or another. The poverty levels in rural communities need to be reduced and programs to improve agricultural productivity in rural communities are critical. The solar PV can also be encouraged for urban dwellers through feed in tariffs and smart grids which can cope with flexible power supplies
2. The solar thermal solar concentrated system. Emphasis should be put
on building a 200MW CSP plant with molten salt to ensure heat storage and prolonged operational hours to take care of the evening peak so as to
35
provide clean energy to Botswana. Salt is readily available in Botswana. The diesel which will be used for emergency generators should be used to ensure continuous supply of power from the solar plant and used as a secondary fuel during the night or cloudy days. This can be implemented as an IPP project and government will need to provide a feed in tariff or any well designed smart policy support mechanism
3. The solar water heaters. This will help reduce domestic and commercial
load thereby reducing the current peak demand. Incentives should be put in place to encourage the substitution of normal heaters with a solar option. There is need to analyze the problems which were associated with the SWH which were of poor quality in Botswana and put in measures to avid similar problems. Solar water heaters have been successfully implanted as an energy efficiency measure in countries like Israel and Australia where lessons can be drawn.
The other renewable technology systems relevant for Botswana are biomass, as wind and hydro options are not possible until further research on wind mapping is carried out. The biomass technology which will make economic sense (coupled with government incentives) and will help create employment are:
4. Bio-fuel Production. As recommended in the feasibility study. 5. Biogas Production. Using various forms of biomass such as cow dung,
waste from farm produce, vegetables, food, etc. These five renewable technologies should be prioritised and various policies designed to address each technology based on the geographical location Technologies nearing maturity and competitiveness with fossil fuels need support through feed in tariffs or other regulatory mechanisms. The sectors with longer term technological promise need research funds. The government should create demand for the renewable energy technologies, achieved though public procurement, and should guarantee markets for leading innovators in transport heat and electricity. Government buildings should lead the process in procuring clean energy even if it is at a higher price. Whatever policy is adopted, it is important to have is consistency, stability and simplicity of implementation.
36

BIBLIOGRAPHY
1. Assefa G, Frostell B, 2007. Social sustainability and social acceptance in technology assessment: a case of energy technologies. Technology in Society, 29, 63-78.
2. De Wet G, 2000. Emerging from the technology colony: A view from the
South. Graduate School of Technology Management, University of Pretoria, Available from:
3. https://www.up.ac.za/dspace/handle/2263/1703.
4. Dinica V, 2006. Support systems for the diffusion of renewable energy technologies – an investor perspective. Energy Policy, 34, 461-480.
5. Mabuza LOK, Brent AC, Mapako M, 2007. The transfer of energy
technologies in a developing country context – Towards improved practice from past successes and failures. Proceedings of the World Academy of Science, Engineering and Technology, 22, 237-241.
6. Menegaki A, 2008. Valuation of renewable energy: A comparative review.
Renewable and Sustainable Energy Reviews, 12, 2422-2437.
7. Painuly JP, 2001. Barriers to renewable energy penetration; a framework for analysis. Renewable Energy, 24, 73-89.
8. Pataltitzianas KD, Doukas H, Kagiannas AG, Psarras J, 2008. Sustainable
energy policy indicators: Review and recommendations, 33, 966-973.
9. Pehnt M, 2006. Dynamic life cycle assessment (LCA) of renewable energy technologies. Renewable Energy, 31, 55-71.
10. Phaal R, Farrukh CJP, Probert DR, 2004. Technology roadmapping – A
planning framework for evolution and revolution. Technological Forecasting & Social Change, 71, 5-26.
11. Pohekar SD, Ramachandran M, 2004. Application of multi-criteria decision
making to sustainable energy planning – A review. Renewable and Sustainable Energy Reviews, 8, 365-381.
12. Renewable Energy Policy Network for the 21st Century (REN21), 2009.
Policy renewable Global Status Report: 2009 Update. REN21 Secretariat, Paris.
13. Sagar AD, van der Zwaan B, 2006. Technology innovation in the energy
sector: R&D, deployment, and learning-by-doing. Energy Policy, 34, 4042-4049.
14. Sebitosi AB, Pilay P, 2008. Renewable energy and the environment in
South Africa: A way forward. Energy Policy, 36, 3312-3316.
37
15. Tran TA, Daim T, 2008. A taxonomic review of methods and tools applied in technology assessment. Technological Forecasting & Social Change, 75, 1396-1405.
16. Urban F, Benders RMJ, Moll HC, 2007. Modelling energy systems for
developing countries. Energy Policy, 35, 3473-3482.
17. Wiser RH, Pickle SJ, 1998. Financing investments in renewable energy: the impact of policy design. Renewable and Sustainable Energy Reviews, 2, 361-386.
38