Technical Report – Geological Summary_Pearson...Technical Report – Geological Summary Pearson...
112
Technical Report – Geological Summary Pearson Project, British Columbia Victoria Mining Division NTS mapsheets: 092C/09, 10, 15, 16 TRIM mapsheets: 092C.058-60, 067-70, 077-80 Latitude: 48˚42'00" N Longitude: 124˚27'25" W UTM: 5395131 N, 392794 E, Zone 10 FOR: EMERALD FIELDS RESOURCE CORPORATION 1546 Pine Portage Road Kenora, Ontario P9N 2K2 PREPARED BY: George Owsiacki, P.Geo. EFFECTIVE DATE: October 31, 2007 Revised: March 11, 2008 Massive magnetite outcrop along roadcut at Lorimer Creek showing.
Transcript of Technical Report – Geological Summary_Pearson...Technical Report – Geological Summary Pearson...

Technical Report – Geological Summary Pearson Project, British Columbia Victoria Mining Division NTS mapsheets: 092C/09, 10, 15, 16 TRIM mapsheets: 092C.058-60, 067-70, 077-80 Latitude: 48˚42'00" N Longitude: 124˚27'25" W UTM: 5395131 N, 392794 E, Zone 10
FOR: EMERALD FIELDS RESOURCE CORPORATION 1546 Pine Portage Road Kenora, Ontario P9N 2K2 PREPARED BY: George Owsiacki, P.Geo. EFFECTIVE DATE: October 31, 2007 Revised: March 11, 2008
Massive magnetite outcrop along roadcut at Lorimer Creek showing.

CONSENT OF AUTHOR
George Owsiacki, P.Geo. Total Earth Science Services
1350 Kristine Rae Lane Victoria, British Columbia V8Z 7L1
Telephone: 250.704.0060 Fax: 250.704.0060 Email: [email protected]
TO: British Columbia Securities Commission Alberta Securities Commission Saskatchewan Securities Commission Manitoba Securities Commission Ontario Securities Commission Commission des valeurs mobilieres du Quebec Nunavut Legal Registry Officer of the Administrator, New Brunswick Nova Scotia Securities Commission Registrar of Securities, Prince Edward Island Securities Commission of Newfoundland Registrar of Securities, Government of the Yukon Territory Securities Registry, Government of the Northwest Territories AND TO: Emerald Fields Resource Corporation
I, George Owsiacki, P.Geo., do hereby consent to the filing of the technical report prepared for Emerald Fields Resource Corporation, titled Technical Report – Geological Summary, Pearson Project, British Columbia dated October 31, 2007 and revised March 11, 2008 (the "Technical Report") with the securities regulatory authorities referred to above.
I further consent (a) to the filing of the Technical Report with any stock exchange and other regulatory authority and any publication of the Technical Report by them for regulatory purposes, including electronic publication in the public company files on their websites accessible by the public, and (b) to the publication of the Technical Report by Emerald Fields Resource Corporation on its company website or otherwise, and (c) to all other uses by Emerald Fields Resource Corporation of the Technical Report or excerpts thereof in connection with its business.
Dated this 11th day of March 2008.
George Owsiacki, P.Geo.
i

TABLE OF CONTENTS
1.0 SUMMARY...................................................................................................................1
2.0 INTRODUCTION ...........................................................................................................2
3.0 RELIANCE ON OTHER EXPERTS ...................................................................................2
4.0 PROPERTY DESCRIPTION AND LOCATION....................................................................3
5.0 ACCESSIBILITY, CLIMATE, LOCAL RESOURCES, INFRASTRUCTURE AND PHYSIOGRAPHY...........................................................................................................10
6.0 HISTORY .....................................................................................................................11
7.0 GEOLOGICAL SETTING ................................................................................................13
7.1 Regional Geology ..........................................................................................13 7.2 Local Geology................................................................................................16
8.0 DEPOSIT TYPES...........................................................................................................17
9.0 MINERALIZATION........................................................................................................18
9.1 BUGABOO CREEK AREA..................................................................................18 9.2 RENFREW CREEK AREA ..................................................................................20
10.0 EXPLORATION.............................................................................................................23
11.0 DRILLING ....................................................................................................................24
11.1 BUGABOO CREEK AREA..................................................................................29 11.2 RENFREW CREEK AREA ..................................................................................37
12.0 SAMPLING METHOD AND APPROACH..........................................................................49
13.0 SAMPLE PREPARATION, ANALYSES AND SECURITY ....................................................49
14.0 DATA VERIFICATION...................................................................................................50
15.0 ADJACENT PROPERTIES...............................................................................................50
16.0 MINERAL PROCESSING AND METALLURGICAL TESTING .............................................53
17.0 MINERAL RESOURCE AND MINERAL RESERVE ESTIMATES.........................................53
18.0 OTHER RELEVANT DATA AND INFORMATION .............................................................54
19.0 INTERPRETATION AND CONCLUSIONS .........................................................................55
20.0 RECOMMENDATIONS...................................................................................................56
21.0 REFERENCES ...............................................................................................................60
22.0 DATE AND SIGNATURE PAGE ......................................................................................61
23.0 CERTIFICATE OF AUTHOR ...........................................................................................62
24.0 ADDITIONAL REQUIREMENTS FOR TECHNICAL REPORTS ON DEVELOPMENT PROPERTIES AND PRODUCTION PROPERTIES ...............................................................63
ii

FIGURES Figure 1 Location Map, Pearson Project ......................................................................4
Figure 2 Pearson Project Claim Group.........................................................................5
Figure 3 Bugaboo and Reko Deposits Work Area Location Map ...............................14
Figure 4 Regional Geology Map..................................................................................15
Figure 5 MINFILE Occurrences ..................................................................................21
Figure 6 Bugaboo Creek Area Drillhole Location Map and Proposed Drillholes .......25
Figure 7 Reko 10 DDH 1 and 2 Drillhole Location Map.............................................26
Figure 8 Reko 10 DDH 3 Drillhole Location Map ......................................................27
Figure 9 Marble DDH 1 Drillhole Location Map and Proposed Drillholes.................28
Figure 10 Daniel DDH 1 Drillhole Section....................................................................31
Figure 11 Daniel DDH 1 Drillhole Sample Locations ...................................................32
Figure 12 Conqueror DDH 1 Drillhole Section ............................................................33
Figure 13 Conqueror DDH 1 Drillhole Sample Locations.............................................34
Figure 14 David DDH 1 Drillhole Section.....................................................................35
Figure 15 David DDH 1 Drillhole Sample Locations....................................................36
Figure 16 Reko 10 DDH 1 Drillhole Section.................................................................38
Figure 17 Reko 10 DDH 1 Drillhole Sample Locations ................................................39
Figure 18 Reko 10 DDH 1, 2 Drillhole Location and Magnetic Survey Line Map.......40
Figure 19 Reko 10 DDH 2 Drillhole Section.................................................................41
Figure 20 Reko 10 DDH 2 Drillhole Sample Locations ................................................42
Figure 21 Reko 10 DDH 3 Drillhole Location Map ......................................................43
Figure 22 Reko 10 DDH 3 Drillhole Section.................................................................44
Figure 23 Reko 10 DDH 3 Drillhole Sample Locations ................................................45
Figure 24 Marble DDH 1 Drillhole Location Map ........................................................46
Figure 25 Marble DDH 1 Drillhole Section...................................................................47
Figure 26 Marble DDH 1 Drillhole Sample Locations ..................................................48
Figure 27 Location Map of Bugaboo Creek Area Showings and Proposed Drillholes.................................................................................52
Figure 28 3D Projection of Noranda Drillholes (1957-60) ............................................55
iii

TABLES
Table 1 Claims Owned by Emerald Fields Resource Corporation .............................6
Table 2 Drilling History of the Bugaboo and Reko Deposits .....................................24
Table 3 Summary of Spring 2005 Drill Program........................................................29
Table 4 Proposed Drillholes........................................................................................58
APPENDICES
Appendix A Review of Aeromagnetic Data over the Pearson Property, Report by M. Sumara, August 25th, 2006 Appendix B Ultramafic Rock Occurrences in the Jurassic Bonanza Arc near Port Renfrew, Southern Vancouver Island, Geoscience BC Proposal, Report by J. Larocque and D. Canil, 2006 Appendix C ALS Chemex Sample Preparation and Analytical Procedures
iv

1.0 SUMMARY This report was prepared by George Owsiacki, P.Geo. at the request of Emerald Fields Resource Corporation (“Emerald Fields”) to describe and evaluate the results of current and previous mineral exploration carried out on the Pearson Project claim group. The Pearson Project claim group covers an area approximately 42 kilometres east-west by 24 kilometres north-south and is located 107 kilometres west-northwest of Victoria on Vancouver Island, British Columbia. The property is in the Victoria Mining Division and consists of 147 mineral claims totalling 63,388.761 hectares, held by Emerald Fields Resource Corporation. Access to the property is via the Gordon River Main and Granite Main logging roads about 10 kilometres north from the community of Port Renfrew. An excellent network of secondary logging roads provide access to most of the property. This report summarizes previous and current geological and related exploration work carried out on mineral showings within the Pearson Project claim group. The area presently held as the Pearson Project claim group received exploration from mining companies in the past who have identified and isolated targets that require follow-up exploration. The Pearson Project claim group hosts the Bugaboo and Reko magnetite deposits in the Bugaboo Creek and Renfrew Creek areas, respectively. The Bugaboo and Reko deposits can be classified as calcic iron skarns or contact metasomatic iron deposits. Massive magnetite mineralization is generally developed near marble and diorite and associated with pyroxene +/- garnet skarn. Previously unrecognized and undocumented ultramafic rocks have recently been discovered on the property and could be an indicator for the ultramafic-related suite of ore deposits, namely tholeiitic intrusion-hosted nickel-copper that may contain platinum group element mineralization. Historical exploration work on the project claim group by previous operators was well conceived and carried out on a methodical basis with geological mapping and prospecting complimented with a variety of ground and airborne geophysical surveys, diamond drilling and geochemical sampling. Several areas that were previously identified have not been fully tested and is the focus of proposed additional exploration and drilling to determine their economic viability. In particular, the Daniel and Conqueror magnetite orebodies have been identified to warrant a more systematic evaluation of the dimensions and strike continuity of the mineralization to be carried out by a recommended ground magnetometer survey and diamond drilling program. In the Lorimer Creek target area, a new magnetite showing with a corresponding airborne magnetic anomaly will require further evaluation and drilling, and also northwest along strike where a similar setting is evident. Drilling is also recommended on a large, significant airborne magnetic anomaly in the Reko North showing area. In 2005-06, limited diamond drilling and an airborne magnetic survey was completed by Emerald Fields. This program identified and confirmed significant magnetite showings overlying favourable stratigraphy which will require further examination and drill testing. The results of the spring 2005 drill program has established high iron grades of the
1

Bugaboo magnetite deposits and the economic viability of the Bugaboo and Reko deposits should be further evaluated. One drillhole on the Daniel deposit intersected massive magnetite over a core length of 21.9 metres grading 57.55% total iron; a drillhole on the Conqueror intersected massive magnetite over a core length of 25.0 metres grading 61.22% total iron. Geological, geochemical, geophysical and drilling data compiled by the author has led to recommendations for work on the Pearson Project claim group. Results from current and previous exploration have been positive. Based on the potential for discovery of additional magnetite mineralization and expanding the dimensions of known deposits, testing newly discovered showings, investigating the airborne magnetic anomalies and the potential of nickel-copper +/- platinum group element mineralization related to ultramafic rocks, a program of ground and airborne magnetometer surveying, geological mapping, geochemical sampling in conjunction with core drilling is recommended with a proposed budget of C$ 2.5 million. 2.0 INTRODUCTION In March of 2005 Mr. Perry Heatherington, Chief Operating Officer of Emerald Fields Resource Corporation, requested that the author, George Owsiacki, P.Geo. review all relevant information on the Pearson Project claims and to supervise a diamond drill program scheduled for the spring of 2005. The project claims cover the significant and historic Reko and Bugaboo magnetite deposits. The drilling program was proposed to accurately re-locate and expand the dimensions of the magnetite orebodies that were worked on in the late 1950s and early 1970s, test newly discovered zones of massive magnetite, and qualify targets for future mineral exploration and development. In October 2007, Mr. Heatherington requested that the author recommend a work program to qualify targets for future mineral exploration and development within the subject property. This report is based in part on previous work, carried out by numerous mining companies and provincial government geologists, as well as the author’s property visit. The work will also involve the preparation of a Technical Report as defined in National Instrument 43-101 and in compliance with Form 43-101F1 (the “Technical Report”). George Owsiacki, P.Geo., served as the independent Qualified Person responsible for preparing the Technical Report and was present on the property during the drilling program from April to May, 2005. 3.0 RELIANCE ON OTHER EXPERTS This Technical Report has been prepared by George Owsiacki, P.Geo. for Emerald Fields Resource Corporation. The author has relied in part on documents and assessment reports on file with the British Columbia Ministry of Energy, Mines and Petroleum Resources and geological literature in the public domain to describe past exploration work on the property and the geological setting and mineralization of the property. These reports are cited and listed under section 21.0, References.
2

The author has relied on Emerald Fields Resource Corporation to provide full information concerning any other corporate dealings, current legal title of the property and environmental status of the property. The author has conducted an online mineral title search of the Pearson Project claims and is confident that all land tenure as listed in Table 1 forms part of the property. At the date of this report the information, conclusions, opinions and estimates contained within the report are based on the following:
- information available to the author at the time of preparation of the report; - assumptions, conditions and qualifications as set forth in the report; and - data, reports and other information available to the author at the time of
preparation of the report. All descriptions of mineral zones and mineral resources, either on or adjacent to the Property, are presented as historical estimates and are based on historical terminology except where specifically noted. The author has reviewed this data and believes that the sources are, overall, reliable. While the author has taken all reasonable care in producing this Technical Report, it may still contain inaccuracies, omissions or typographical errors. 4.0 PROPERTY DESCRIPTION AND LOCATION The Pearson Project claim group is in the Victoria Mining Division on Vancouver Island, 107 kilometres west-northwest of Victoria, British Columbia and 10 kilometres north of the community of Port Renfrew (Figure 1). The claims are located on NTS mapsheets 092C/09, 10, 15, 16 (TRIM mapsheets 092C.058-60, 067-70, 077-80) at a latitude of 48˚42'00" N and longitude 124˚27'25" W (Figure 2). Access to the claims is via Highway 14 to the community of Port Renfrew and thence by an excellent network of active and non-active logging roads. The Pearson Project consists of an irregularly-shaped block of 147 contiguous claims, totalling 63,388.761 hectares. The claim block extends about 42 kilometres in an east-west direction and 24 kilometres north-south. Emerald Fields is 100% owner of the claims forming the Pearson Project claim group and Table 1 lists all claims comprising the claim group. On March 31, 2005, Emerald Fields Resource Corporation obtained a permit from the Ministry of Energy, Mines and Petroleum Resources (pursuant to Section 10 of the Mines Act) to carry out core drilling. Emerald Fields received permit numbers MX-1610131 and MX-1610150 in order to commence a program of core drilling on the subject property.
3

BritishColumbia
Figure 1. Location Map, Pearson Project.
0 50 100
km
Victoria
Vancouver
Pearson ProjectProperty Location
Pa
cific
Oc
ea
n
4

010 10 20 30
KILOMETRES
N
Lake Cowichan
Victoria
Olympic Peninsula(Washington State)
Duncan
Port Renfrew
Cowichan Lake
Pearson Project
Fort St. John
Stewart
Prince Rupert
Smithers
Prince George
Campbell River
Vancouver
Victoria
Kamloops
Cranbrook
Figure 2. Pearson Project Claim Group.
92C/10 92C/09
92C/07 92C/08
92B/11
92B/06
92B/13 92B/1492C/15 92C/16
124
0W
°3’
48 N°45’
Nitinat Lake
92B/12
92B/05
Pearson Project Claim Group
Emerald Fields Claim Holdings
48 30 N° ’124
0W
°0’
5

TABLE 1. CLAIMS OWNED BY EMERALD FIELDS RESOURCE CORPORATION
Tenure Number Claim Name Good Until (y/m/d) Area (ha)
358261 GALLEON 8 20080311 25 360704 GALLEON 8-3 20080311 25 361465 GALLEON 50 20080311 25 370610 GALLEON 53 20080311 25 373375 GALLEON 70 20080311 25 373376 GALLEON 71 20080311 25 373716 GALLEON 57 20080311 25 374247 GALLEON 80 20080311 25 374409 OBIN 20080311 25 374714 DAN 1 20080311 25 375070 DAN 4 20080311 25 378446 JAN 8 20080311 25 378447 JACK 20080311 25 378824 DAN 9 20080311 25 378825 DAN 10 20080311 25 378826 DAN 11 20080311 25 379141 ABBEY 20080311 25 379142 PACMIST 4 20080311 25 379144 GHOST 20080311 25 379145 PACMIST 3 20080311 25 379146 OUTHOUSE 20080311 25 379328 PRINCESS 20080311 25 379889 PRINCESS 2 20080311 25 379890 ROCCOD 20080311 25 381142 TIMBER 20080311 25 381143 JAY JAY 20080311 25 385855 WHISTLE 1 20080311 25 386342 WHISTLE 2 20080311 25 390305 COHO 2 20080311 25 390306 COHO 3 20080311 25 390462 COHO #4 20080311 25 390463 COHO #5 20080311 25 390464 COHO #6 20080311 25 394662 GALLEON 8-2 20080311 25 408828 NOSE 20080311 25 409241 NOSE 2 20080311 25 414631 GALLEON 54 20080311 25 508322 RENFREW 1 20080311 256.267 508323 RENFREW 2 20080311 64.006 508324 RENFREW 3 20080311 85.316 508325 RENFREW 4 20080311 256.16 508326 RENFREW 5 20080311 256.116 508407 20080311 1578.087 508425 20080311 1878.076
6

508458 20080311 1899.543 508466 20080311 277.562 508500 20080311 2110.044 508534 20080311 1984.778 508539 20080311 426.622 508552 20080311 682.423 508555 20080311 703.73 508564 20080311 1535.985 508572 20080311 1129.941 508576 20080311 640.18 508577 20080311 1344.008 508578 20080311 1771.778 508593 20080311 939.522 508594 20080311 490.651 508595 20080311 490.656 508601 20080311 170.658 508619 20080311 1452.035 508631 20080311 1387.024 508649 20080311 1151.952 508661 20080311 85.379 508712 20080311 1814.207 508714 20080311 1003.116 508715 20080311 1067.809 508723 20080311 619.513 508770 20080311 597.964 512099 RENFREW 6 20080311 532.441 512106 RENFEW 7 20080311 447.399 515286 20080311 85.447 515296 20080311 21.337 515297 20080311 42.704 515299 20080311 21.346 515300 20080311 106.757 515301 20080311 42.701 515302 20080311 192.251 519016 20080311 277.69 520492 20080311 533.138 520493 20080311 511.813 520494 20080311 511.661 520495 20080311 532.659 520496 20080311 532.674 520497 20080311 532.704 520498 20080311 532.691 520499 20080311 532.634 520500 20080311 532.706 520501 20080311 532.912 520502 20080311 532.686 520503 20080311 319.503 520616 THOR 20080311 21.361 532775 20080311 319.32
TABLE 1. CONTINUED
7

534816 20080311 448.767 540161 20080311 85.246 541800 20080311 42.722 556794 20080420 532.914 556796 20080420 532.814 556799 20080420 511.414 556801 20080420 447.406 556809 20080420 511.159 556810 20080420 468.6 556814 20080420 212.941 556817 20080420 510.891 556823 20080420 532.17 556827 20080420 532.27 556830 20080420 383.628 556833 20080420 383.594 556835 20080420 512.938 556838 20080420 512.822 556839 20080420 512.78 556841 20080420 534.072 556843 20080420 491.398 556846 20080420 427.29 556848 20080420 363.205 556850 20080420 511.7 556852 20080420 469.029 556870 20080420 447.577 556873 20080420 532.798 556877 20080420 468.844 556878 20080420 532.828 556881 20080420 511.316 556883 20080420 511.235 556884 20080420 532.505 556886 20080420 468.632 556888 20080420 426.025 556890 20080420 511.048 556892 20080420 42.736 556894 20080420 42.733 556896 20080420 213.704 556939 20080420 512.745 556941 20080420 427.308 557080 20080421 532.071 557088 20080421 510.862 557092 20080421 510.865 557094 20080421 532.211 557097 20080421 532.256 557099 20080421 532.286 557101 20080421 489.712 557104 20080421 511.088 557105 20080421 511.148 557107 20080421 532.421
TABLE 1. CONTINUED
8

557108 20080421 511.137 557110 20080421 511.337 557111 20080421 532.518 557115 20080421 468.653 557117 20080421 191.749
In 2005, Emerald Fields completed a work programme consisting of core drilling with expenditures totalling $123,001. In 2006, an airborne magnetometer survey was flown over 1972 line kilometres with expenditures totalling $226,334. Mineral claims in British Columbia are staked under the governments Ministry of Energy, Mines and Petroleum Resources internet-based Mineral Title administration system, Mineral Titles Online (MTO). To conduct mineral titles business, you require BCeID (British Columbia electronic identification) registration and a valid free miner certificate (FMC) to acquire any mineral title, or to register work or a payment instead of work on your claims, transfers, etc. The work requirements are $4 per hectare plus a 40 cents per hectare filing fee. The value of work commitment to keep the Pearson Project claim group in good standing for one year is about $278,900. To register a cell claim, one selects one or more adjoining cells on the electronic MTO map. The MTO map grid is derived from the Petroleum and Natural Gas (PNG) grid which the ministry has been using for many years to describe tenures for oil and gas and coal. Cells range in size from approximately 21 hectares (457 x 463 metres) in the south to approximately 16 hectares at the north of the province; this is due to the longitude lines that gradually converge toward the North Pole. No two people can select the same cells simultaneously, since the database is live and updated instantly; once you make your selection, the cells you have selected will no longer be available to another person, but if payment is not successfully completed within 30 minutes the cells become available to anyone. The electronic internet MTO map allows you to select single or multiple adjoining grid cells. Clients are limited to 25 selected cells per submission for acquisition as one claim. The number of submissions is not limited, but each submission for a claim must be completed through to payment before you can commence another registration. When you have made your cell selection, you must confirm it and make payment electronically through your credit card, or by cash or cheque if you are using a PC terminal in a recording office. The fee for mineral cell claim registration is 40 cents per hectare, and $2 per hectare for a placer cell claim; MTO will calculate the exact area in hectares according to the cells you select, and calculate the required fee. The fee is charged for the entire cell, even though a portion may be unavailable due to a prior legacy title or alienated land. Upon confirmation of payment, which is immediate, your title is issued. A tenure number will be issued for the cell or group of adjoining cells that you select as the claim and you'll receive an immediate email confirmation of your transaction and title. Upon registration, a cell claim is deemed to commence as of that date (“Date of Issue”), and is good until the “Expiry Date” (Good To Date) that is one
TABLE 1. CONTINUED
9

year from the date of registration. To maintain the mineral claims beyond the expiry date, the recorded holder (or an agent) must, on or before the expiry date, register either exploration and development work that was performed on the claim, or a payment instead of exploration and development. You must register work online (indicating the type of work) and make the required payment, on or before the due expiry date of the claim; if this is not done, the claim automatically forfeits at the end (midnight) of the expiry date. Work details must be submitted in a report for both physical work and technical work; physical work reports must be submitted within 30 days of registering the work, and technical reports within 90 days of registration of the work. Reports may be sent to the Vancouver Mineral Titles office, or submitted in the Vancouver or Victoria Mineral Titles office or any Government Agent Service BC office, or submitted digitally as an attachment to an email. The Pearson Project claim group has not been legally surveyed. The author is not aware of any planned or existing land use that would adversely affect development of mineral resources on the property. There are no known environmental liabilities to which the property is subject to. None of the exploration work that companies have completed in the past on the property would be considered an environmental liability to the property. 5.0 ACCESSIBILITY, CLIMATE, LOCAL RESOURCES, INFRASTRUCTURE AND PHYSIOGRAPHY The Pearson Project claim group is generally in moderately rugged and steep terrain about 10 kilometres north of the coastal community of Port Renfrew. Topography consists of regions of protruding and steeply sloped bluffs incised by numerous, north and northwest trending creeks and rivers (e.g. Gordon River, Renfrew Creek, Hemmingsen Creek). Elevations range from 200 to 1100 metres above sea level. The property is located within an exceptionally wet and mild rainforest climate region with cool summers and mild winters. In Port Renfrew there is an average of approximately 12 days of snowfall and only 15 days of snow cover over the year but at higher elevations regular winter snow conditions exist. Mean average daily temperatures range from a low of 3.2˚C in January to 14.9˚C in August. The area receives an impressive amount of rain, with a mean total rainfall of 64.1 mm in July, and 561.8 mm in November. The annual average total for rainfall is 3.6 metres. Fieldwork can be performed year round except at higher elevations where winter conditions prevail. Access to and on the property is excellent using an expansive and well developed network of logging roads. Other than road access, there is no significant infrastructure on the property. The community of Port Renfrew, population 180, is 10 kilometres south of the property and is a source for fuel, groceries, accommodation, etc. Port Renfrew is accessed by a 1¾ hour drive via Highway 14 from Victoria in the southeast or by all-weather logging roads from Lake Cowichan and Duncan in the northeast.
10
The author did not see any topographic or physiographic impediments for potential mine, mill, heap leach or waste disposal sites. Suitable lands occur throughout the project area that should allow development of such facilities. 6.0 HISTORY The Pearson Project claim group covers an area 42 kilometres long in an east-west direction and 24 kilometres in a north-south direction and contains numerous mineral occurrences as documented in the British Columbia provincial mineral inventory database, MINFILE, available online at www.minfile.ca. The most significant of these are the Bugaboo iron (magnetite) skarn deposits in the western portion of the claim block near the headwaters of Bugaboo Creek, and the Reko iron (magnetite) skarn deposits in the eastern portion of the claim block along Renfrew Creek. Both the Bugaboo and Reko deposits contain historic reserves. The two Bugaboo deposits are called Conqueror and Daniel (MINFILE 092C 022); the David (MINFILE 092C 023) and Elijah (MINFILE 092C 024) magnetite showings occur close by. Other magnetite showings in this area, but not covered by the property claims, are the Sirdar (MINFILE 092C 025), Baden Powell (MINFILE 092C 027) and Rose (MINFILE 092C 030). In the eastern portion of the claim block, the main Reko magnetite deposits are the Reko 10 (MINFILE 092C 091) and Reko 3 (MINFILE 092C 090). The Conqueror showing was originally staked by R. Elliot of Port Renfrew in 1898 but the claims lapsed and four of them were relocated as the Conqueror group in 1899 and Crown granted in 1905. This new group, which also covered the Daniel showing, was owned by Messrs. McGregor, Cathcart and Parsell. The development work, carried out during the period 1900-07, consisted of two opencuts, and a tunnel 4.3 metres long, in solid magnetite, driven from a point 2.4 metres above Bugaboo Creek. No further work was done on the property until 1957 when two x-ray drillholes (both stopped in overburden) totalling 25.6 metres was completed on the Daniel, and nine x-ray drillholes totalling 273.7 metres completed on the Conqueror. In 1959, Noranda Exploration Company, Limited optioned 7 Crown-granted claims and fractions from H.W. Cathcart of Victoria covering the Conqueror and Daniel showings. A 30-metre grid survey, as well as dip needle and magnetometer surveys were completed. Thirteen EX diamond-drill holes totalling 880.6 metres was completed on the Daniel claim and 15 EX drillholes totalling 1118.3 metres on the Conqueror. In 1960, an additional 15 AX drillholes totalling 987.2 metres was completed on the Daniel and 7 AX drillholes totalling 894.6 metres on the Conqueror to confirm the ore reserves and grades indicated by earlier work and to show sufficient additional tonnage to justify a mining operation. Noranda also completed a report on proposed breakwater requirements adjacent to a deep-sea dock for Port of San Juan and a laboratory test on Conqueror mine run ore at the Noranda Concentrator Experimental Laboratory.
11

Noranda reports indicated reserves for the Daniel (open pit) as 1,537,534 tonnes at an average grade of 55.67% iron and 3.61% sulphur. Indicated reserves for the Conqueror (underground) are 1,069,471 tonnes at an average grade of 54.31% iron and 2.21% sulphur. Probable reserves for the Daniel are 508,883 tonnes (no grades given). Probable reserves for the Conqueror are 453,550 tonnes, and possible reserves 798,565 tonnes (no grades given). Combined indicated and probable ore for both deposits total 3,569,438 tonnes (no grades given). Combined indicated, probable and possible reserves for both deposits total 4,367,686 tonnes (no grades given). Refer to the 1960 Final Report by M.M. Menzies and O.W. Nicolls. It should be noted that the report by Menzies and Nicolls does not contain detailed drill logs, drillhole location maps or drill sections of the deposits reported on. Emerald Fields Resource Corporation has not been able to obtain enough of the original data and has not done the work necessary to verify the classification of a resource or reserve and is not treating the historical estimates as fulfilling the requirements of Sections 1.3 and 1.4 of National Instrument 43-101. In the eastern portion of the claim block bulldozing and blasting by B.C. Forest Products road-building crews during the summer of 1970 uncovered showings of magnetite and sulphides near the upper reaches of Renfrew Creek (Reko showings). The Reko 1-6 claims were staked on these showings in July 1970 by Mr. M. Levasseur. Sampling of the exposed mineralization was subsequently carried out. Levasseur and associates incorporated Reako Explorations Ltd. in July 1971. Further staking in 1971-72 expanded the property to 66 claims. Exploration work during 1971 included x-ray diamond drilling totalling 37 metres in 6 holes and a limited magnetometer survey. During 1972-73, work included geological mapping, magnetometer surveys over 120 line-kilometres, an electromagnetic survey over 80 line-kilometres, an induced potential survey over 19 line-kilometres, trenching, and 5300 metres of diamond drilling in 100 holes on Reko 3, 4, 9, 10 and 42. The adjoining Kestrel 1-15 claims were purchased from M. Dickens of Savona in January 1974. Work during the year included 89 metres of diamond drilling in 6 holes on Reko 37. Drilling in 1972 on the South Pit B zone indicated a magnetite-bearing zone 94 metres long, over 30 metres wide and up to 50 metres deep. The average grade indicated by the core assay was 22.28% iron. In 1973-74, R.L. Roscoe estimated 1,111,242 tonnes in five combined zones (Zone 1, 2, 3, 5, 8) without specifying grades. South Pit B zone (or Zone 2) contains 970,597 tonnes. Emerald Fields Resource Corporation has not been able to obtain enough of the original data and has not done the work necessary to verify the classification of a resource or reserve and is not treating the historical estimates as fulfilling the requirements of Sections 1.3 and 1.4 of National Instrument 43-101. No further work was reported on until Emerald Fields entered an option agreement with Gary Pearson of Port Renfrew on June 14, 2002 and also began staking claims in the area. In May 2003, Discovery Consultants completed geological, geochemical and geophysical surveys on behalf of Emerald Fields and Gary Pearson over parts of the property. Work comprised geological mapping, rock, heavy mineral and stream sediment sampling, petrographic work, and orientation VLF-EM and magnetometer surveys. In April 2004, Emerald Fields completed 7 BQ diamond-drill holes totalling 326 metres in the eastern portion of the claim block, namely on some of the Reko showings. Emerald
12

Fields staked additional claims in November 2004 and early 2005. Between April-May 2005, a diamond drill program of 7 TWNQ drillholes totalling 711.4 metres was completed on parts of the Reko, Conqueror, Daniel and David magnetite showings and was supervised by George Owsiacki, P.Geo. (author of this Technical Report) and Garry Payie, P.Geo., of Total Earth Science Services. This work is summarized in Section 10.0 of this Technical Report. 7.0 GEOLOGICAL SETTING Much of the information in this section has been sourced from Muller (1982), Roscoe (1973), McKinley and Gilmore (2003a), Menzies and Nicolls (1960), Young and Uglow (1926), Eastwood (1974), and by the author’s own observations during the supervision of the drill program. The project claim group extends almost 42 kilometres east-west and 24 kilometres north-south, and encompasses two significantly mineralized areas. Magnetite deposits occur in the Bugaboo Creek area in the west part of the property, and in the Renfrew Creek area 15 kilometres east (Figure 3). 7.1 Regional Geology The Port Renfrew area and beyond was mapped in 1982 by J.E. Muller of the Geological Survey of Canada. The property lies in the Insular Tectonic Belt where three distinct terranes occur. In the north are Paleozoic to Mesozoic rocks of the Wrangell Terrane consisting of Lower Jurassic Bonanza Group calc-alkaline and volcanic rocks, Middle to Upper Triassic Vancouver Group basaltic volcanic rocks and limestones, Early to Middle Jurassic Island Plutonic Suite quartz monzonitic to granodiorite intrusive rocks, and Paleozoic to Jurassic Westcoast Crystalline Complex dioritic intrusive rocks. Younger sedimentary and volcanic rocks of the Pacific Rim Terrane are thrust beneath the southern and western edges of the Wrangellia rocks along the San Juan and Survey Mountain faults. The San Juan Fault extends from near Port Renfrew to beyond Cobble Hill and for much of its length separates Pacific Rim Terrane from Wrangellia. Pacific Rim Terrane rocks consist of Jurassic to Cretaceous Leech River Complex greenstone, greenschist metamorphic rocks, sedimentary rocks and bimodal volcanic rocks. In the south, just below the property boundary, Crescent Terrane basaltic volcanic rocks belonging to the Paleocene to Eocene Metchosin Igneous Complex are emplaced beside and beneath the Pacific Rim Terrane along the Leech River Fault. Sedimentary rocks of the Upper Eocene to Oligocene Carmanah Group accumulated on the Crescent and Pacific Rim terranes. Numerous north-northwest and east-west faults transect the property (Figure 4). Previously un-mapped ultramafic rocks have recently been discovered and identified on the property and are variously comprised of peridotite, serpentinized peridotite, gabbro, pyroxenite and hornblendite (refer to Larocque and Canil, 2006, Appendix B).
13
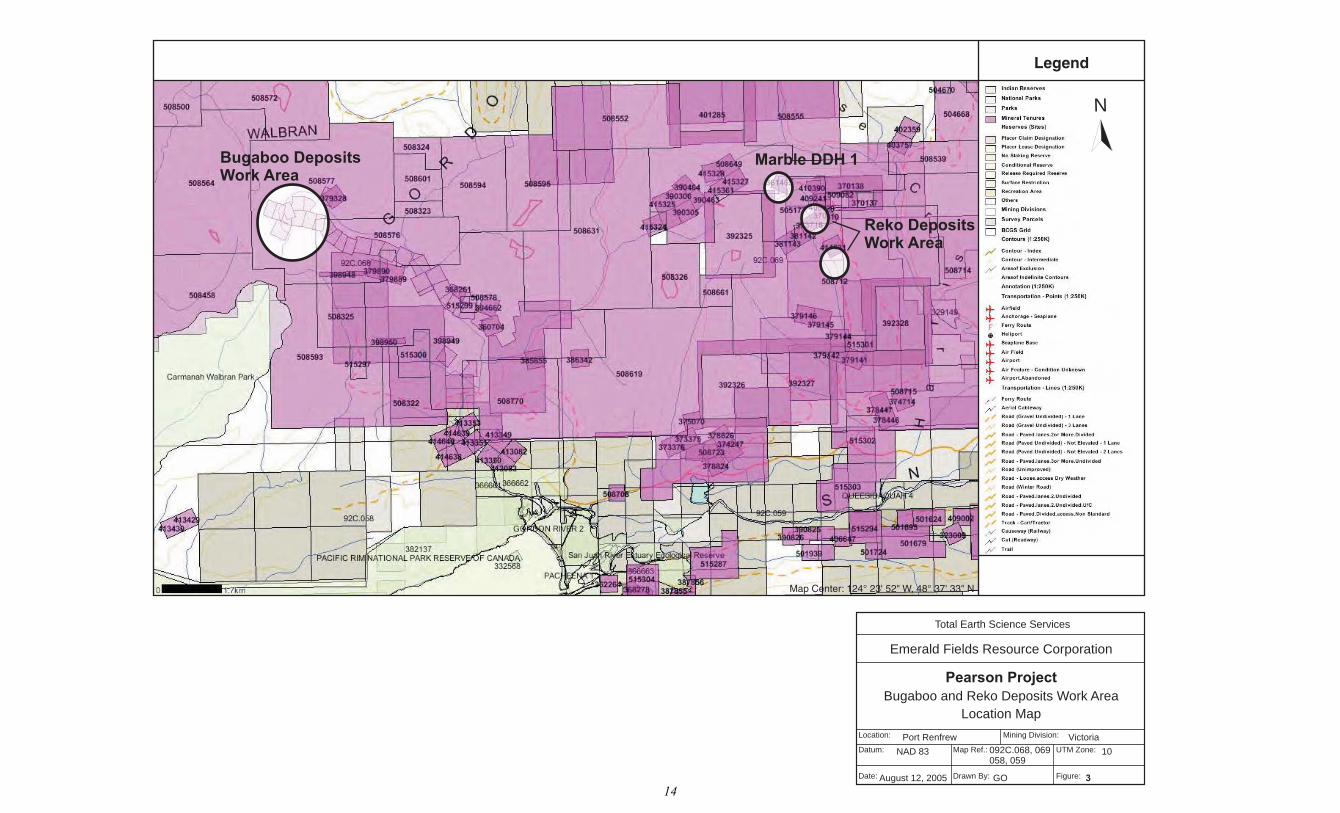
Total Earth Science Services
Emerald Fields Resource Corporation
Pearson Project
Bugaboo and Reko Deposits Work Area
Location Map
Location:
Datum:
Mining Division:
Map Ref.: UTM Zone:
Date: Drawn By: Figure:
Port Renfrew
NAD 83
August 12, 2005 GO 3
092C.068, 069058, 059
10
Victoria
Legend
Map Center: 124° 23' 52" W, 48° 37' 33" N
Reko DepositsWork Area
Marble DDH 1Bugaboo DepositsWork Area
N
14

05 5 10 15
KILOMETRES
N Port Renfrew
EOlC CARMANAH GROUP: Undivided sedimentary rocks
TERTIARYUpper Eocene to Oligocene
Paleocene to Eocene
PeEMMvb METCHOSIN IGNEOUS COMPLEX - METCHOSIN FORMATION:Basaltic volcanic rocks
JURASSIC TO CRETACEOUS
LEECH RIVER COMPLEX: Greenstone, greenschist metamorphicrocks
JKLS LEECH RIVER COMPLEX - SURVEY MOUNTAIN VOLCANICS:Bimodal volcanic rocks
LOWER JURASSIC
lJBca BONANZA GROUP: Calc-alkaline volcanic rocks
MIDDLE TRIASSIC TO UPPER TRIASSIC
uTrVK KARMUTSEN FORMATION: Basaltic volcanic rocks
muTrVs Undivided sedimentary rocks
VANCOUVER GROUP
JKL
EOlM MOUNT WASHINGTON PLUTONIC SUITE:Quartz dioritic intrusive rocks
TERTIARYEocene to Oligocene
GEOLOGICAL LEGEND
INTRUSIVE ROCKS
EARLY JURASSIC TO MIDDLE JURASSIC
EMJlgd ISLAND PLUTONIC SUITE:Granodioritic intrusive rocks
PALEOZOIC TO JURASSIC
PzJWg WESTCOAST CRYSTALLINE COMPLEX:Intrusive rocks, undivided
Geological map and legend compiled from:
MapPlace (2005): Website;, www.mapplace.ca
Muller, J.E. (1982): ;, Open File 821, scale 1:250 000.
BC Ministry of Energy, Mines and PetroleumResources
Geological Survey of CanadaGeology, Nitinat Lake, British Columbia, Map and Notes
Figure 4. Regional Geology Map.
Claims not part of property
Fault
Thrust Fault
Pearson Project
15

7.2 Local Geology The Conqueror, Daniel, David and Reko iron (magnetite) skarn deposit areas have been variously described by Menzies and Nicolls (1960), Young and Uglow (1926), Roscoe (1973), Eastwood (1974) and McKinley (2003a) where the following information has been taken. The British Columbia mineral inventory database, MINFILE, documents the showings as follows: Bugaboo, 092C 022; David, 092C 023; and Reko, 092C 090, 91, 110, 146. Refer to the online MINFILE database at www.minfile.ca. Bugaboo Creek Area The Bugaboo Creek area in the western portion of the claim block contains four well exposed, partly developed iron (magnetite) skarn deposits: Conqueror-Daniel, David, Sirdar and Baden Powell. The Conqueror-Daniel and David deposits are on the property while the Sirdar and Baden Powell are located 680 metres and 1500 metres southeast, respectively and are not part of the subject property. The Conqueror-Daniel and David area is underlain by a dioritic intrusion possibly of the Westcoast Crystalline Complex and limestone of the Upper Triassic Quatsino Formation (Vancouver Group). The bodies of limestone appear to be completely surrounded by dioritic intrusive rocks and could be considered roof pendants. The magnetite showings are aligned in a northwest-southeast trending line that appears to parallel a regional northwest trending fault structure along Bugaboo Creek (Figure 3). Generally, the Conqueror, Daniel and David magnetite bodies occur within zones of pyroxene-garnet skarn formed along the contact of fine to medium-grained diorite and limestone. The magnetite occurs as large, irregular, fine grained massive bodies surrounded by recrystallized limestone (marble) and dioritic intrusive rocks cut by plagioclase porphyritic dikes. A detailed description of the mineralization is provided in Section 9.0. Renfrew Creek Area The Renfrew Creek area in the eastern portion of the claim block, located about 15 kilometres east of the Bugaboo Creek area, is generally underlain by dioritic rocks of the Westcoast Crystalline Complex in contact along irregular boundaries with limestone probably belonging to the Upper Triassic Quatsino Formation (Vancouver Group). The massive limestone bodies strike in a general north-northwest direction, and where bedding is evident, dip at various angles to the north and south. The limestone varies from dark grey to blue to white and in some localities has been altered to marble. Most limestone bodies have been successively intruded by andesitic (greenstone) and fine-grained diorite dikes. The dioritic rocks include fine grained, mafic rich and leucocratic diorite, medium to coarse-grained quartz diorite, and quartz diorite breccia containing fragments of fine-grained mafic diorite. The breccia locally grades to massive diorite. A set of long, narrow, fine grained grey dikes strike consistently at 020 degrees, transect all other rocks, and probably follow late fractures. Massive iron (magnetite) skarn deposits are developed near diorite and recrystallized limestone (marble) contacts and along zones of garnet-pyroxene skarn. The magnetite
16

occurs as large fine to coarse grained massive bodies bounded by marble and/or diorite. A detailed description of the mineralization is provided in Section 9.0. 8.0 DEPOSIT TYPES The Bugaboo and Reko deposits can be classified as calcic iron skarns or contact metasomatic iron deposits. Commodities and byproducts related to this type of deposit are magnetite (iron), copper, silver, gold and cobalt. Typically magnetite-dominant mineralization is genetically associated with a skarn gangue. The tectonic setting of calcic iron skarns are intra and non-intraoceanic island arcs and rifted continental margins. The age of mineralization can be of any age, mainly Mesozoic to Cenozoic and are typically Early to mid-Jurassic in British Columbia. Deposit-type classification description is taken from G.E. Ray (1995) in ‘Fe Skarns, in Selected British Columbia Mineral Deposit Profiles, Volume 1 - Metallics and Coal, Open File 1995-20’ and is reproduced below. The host and associated rock types are iron-rich, silica-poor intrusions derived from primitive oceanic crust. Typically, large to small stocks and dikes of gabbro to syenite (mostly gabbro-diorite) intrudes limestone, calcareous clastic sedimentary rocks, tuffs or mafic volcanics at a high to intermediate structural level. The deposit form is variable and includes stratiform orebodies, vertical pipes, fault-controlled sheets, massive lenses or veins, and irregular ore zones along intrusive margins. Igneous textures prevail in endoskarn (skarn formed by replacement of intrusive or other aluminous silicate rock). Coarse to fine grained, massive granoblastic to mineralogically layered textures are evident in exoskarn (skarn formed by replacement of limestone or dolomite). Some hornfelsic textures may also be developed. Magnetite varies from massive to disseminated to veins. Exoskarn alteration is high iron, low manganese, diopside-hedenbergite clinopyroxene and grossular-andradite garnet, ± epidote ± apatite. Late stage amphibole ± chlorite ± ilvaite ± epidote ± scapolite ± albite ± K-feldspar. Endoskarn alteration comprises sodium silicates ± garnet ± pyroxene ± epidote ± scapolite. Principal and subordinate ore mineralogy can comprise magnetite ± chalcopyrite ± pyrite ± cobaltite ± pyrrhotite ± arsenopyrite ± sphalerite ± galena ± molybdenite ± bornite ± hematite ± martite ± gold. Rarely, can contain tellurobismuthite ± fluorite ± scheelite. Ore controls are stratigraphic and structural: close proximity to contacts between intrusions and carbonate sequences, volcanics or calcareous tuffs and sediments. Fracture zones near igneous contacts can also be important. Some associated deposit types can be copper porphyries, copper and lead-zinc skarns or small lead-zinc veins. In calcic iron skarns, early magnetite is locally intergrown with, or cut by, garnet and magnesian silicates. Some of these skarns contain relatively small pockets of pyrrhotite-pyrite mineralization that postdate the magnetite; this mineralization can be gold-rich.
17

Over 90% of the 146 iron skarn occurrences in British Columbia lie within the Wrangell Terrane of the Insular Belt. The majority of these form where Early to mid-Jurassic dioritic plutons intrude Late Triassic limestones. Exploration guides for calcic iron skarns are geochemical signatures exhibiting enrichment in iron, copper, cobalt, gold, nickel, arsenic and chromium. Overall copper and gold grades are low (<0.2% Cu and 0.5 g/t Au). Geophysical signatures are strong positive magnetic, electromagnetic and induced polarization anomalies. Other exploration guides for iron skarn development are magnetite-rich float, and exploration in the Wrangell Terrane near the upper and lower contacts of the Upper Triassic Quatsino Formation limestone (or equivalent units). Economic factors are grade and tonnage where grades are typically 40% to 50% iron. Worldwide, calcic iron skarns range from 3 to 150 million tonnes. In British Columbia, they reach 20 million tonnes and average approximately 4 million tonnes mined ore. Nearly 90% of British Columbia's historic iron production was from skarns. Previously unrecognized and undocumented ultramafic rocks have been recently discovered (McKinley, 2003; Larocque and Canil, 2006) on the Pearson property and could be a significant indicator for the ultramafic-related suite of ore deposits, namely tholeiitic intrusion-hosted nickel-copper that may contain platinum group elements (PGE). Gabbro and hornblende gabbro with significant copper, nickel, cobalt, platinum and palladium values were identified on the Ebb showing in the eastern part of the property in the vicinity of Fairy Creek, north of Fairy Lake (Tavela, 1980). 9.0 MINERALIZATION 9.1 Bugaboo Creek Area The original Conqueror discovery showing is a solid mass of magnetite about 10 metres thick exposed in the canyon of Bugaboo Creek, over which the creek forms a waterfall. The massive magnetite occurs within and near zones of pyroxene-garnet skarn formed along the contact of fine-grained diorite and limestone. The magnetite occurs as large, irregular massive bodies surrounded by recrystallized limestone (marble) and dioritic intrusive rocks cut by plagioclase porphyritic dikes. The skarn appears to be of two phases. The first is an older garnet-epidote assemblage found only as a remnant within the massive magnetite; the second is the later pyroxene skarn that surrounds the magnetite body. Actinolite is a minor constituent in the zone of alteration. The magnetite is fine grained and massive with pyrrhotite finely disseminated throughout and may have formed contemporaneously. Actinolite is also a minor accessory mineral within the magnetite. Late sulphide veinlets, mainly pyrite and chalcopyrite, cut the magnetite body.
18

Diamond drilling between 1957-60 indicates that the Conqueror orebody strikes northwesterly and, on the surface, is divided into ‘West’ and ‘East’ pipe-like orebodies. Conqueror ‘East’ plunges steeply westerly while Conqueror ‘West’ appears to dip steeply to the south. The 1957 drilling suggests a steep southerly dip to the ‘West’ orebody. If subsequent drilling substantiates this southerly dip then both bodies must join at depth as both are open and very strong at the greatest depths yet drilled (Menzies and Nicolls, 1960). The structure of the Conqueror may be likened to a ‘Y’ lying in a northwesterly striking plane dipping roughly 75 degrees southwesterly. Conqueror ‘East’ is then represented by the easterly striking arm, Conqueror ‘West’ by the northerly striking arm, and the neck, 137 metres in depth, indicating the point of junction. The stem represents a possible continuation to still greater depths of the unified orebodies. The primary ore control may be a tightly folded syncline of limestone with its axis striking southwesterly and plunging steeply in the same direction. If this is the case, the emplacement of magnetite in the limbs of the syncline was controlled by a cross-cutting structure have the attitude of the ‘Y’ described above (Menzies and Nicolls, 1960). Indicated reserves are 1,069,471 tonnes grading 54.31% iron and 2.21% sulphur. There are additional probable reserves of 453,550 tonnes and possible reserves of 798,565 tonnes (grades not given). The steeply plunging, pipe-like orebodies lend themselves to economical underground mining (Menzies and Nicolls, 1960). The reserve estimates are assumed to not comply with Sections 1.3 and 1.4 of National Instrument 43-101. The Daniel magnetite orebody is located about 250 metres northwest of the Conqueror orebody and resembles a flattened cylinder with its axis oriented north-northeast and plunging about 20 degrees to the north. The magnetite is similar to that of the Conqueror with pyrite and pyrrhotite occurring in roughly equal proportions but with no conspicuous actinolite. Late pyrite and chalcopyrite veinlets cut the magnetite. Indicated reserves at the Daniel are 1,537,534 tonnes at an average grade of 55.67% iron and 3.61% sulphur. There are additional probable reserves of 508,883 tonnes (grades not given). The reserves are amenable for open pit mining methods (Menzies and Nicolls, 1960). The reserve estimates are assumed to not comply with Sections 1.3 and 1.4 of National Instrument 43-101. The David magnetite showing is about 300 metres southeast of the Conqueror orebody. All three showings, Daniel, Conqueror and David, are on the same northwest-southeast trend. The Sirdar and Baden Powell showings (not part of the subject property) are also on the same trend. The David is a massive, irregular body of fine to medium grained magnetite bounded by pyroxene-garnet skarn, marble and altered diorite. The magnetite is relatively free of sulphides and appears sheeted in the roadcut exposure. The recently exposed Lorimer Creek showing (not tested during the 2005 field program) is located about 4 kilometres southeast of, and on trend with the Conqueror-Daniel deposits. The showing is exposed in a logging roadcut and is about 10 metres long and consists of a massive, fine to medium grained magnetite body lying beneath marble and locally developed pyroxene skarn. The overlying marble has an undulating and abrupt
19

contact with the magnetite. In 2004, a grab sample of the massive magnetite mineralization taken by Emerald Fields assayed 45.6% iron, 0.6% copper and 192 ppb gold. A fine grained, dark mafic rock (diabase) occurs nearby and hosts two parallel magnetite-pyrite-pyrrhotite veins from 15 to 40 centimetres wide. In 2004, a grab sample taken from one of the veins by Emerald Fields assayed 44.3% iron, 1.01% copper and 177 ppb gold. 9.2 Renfrew Creek Area A total of 11 magnetite skarn zones have been described by Roscoe (1973) in the Renfrew Creek area and documented in the British Columbia provincial mineral inventory database, MINFILE, as Reko 10 (092C 091), Reko 3 (092C 090), Reko 38 (092C 110) and Reko North (092C 146). See Figure 5 for MINFILE locations and www.minfile.ca for the online MINFILE database. Only those zones containing historic reserves or which have been tested by the 2005 drill program are discussed below. The South Pit A zone or Zone 1 (092C 091) showing is exposed for a length of 12 metres and a width of 4.5 metres in an old logging roadcut. It consists of massive, fine to medium-grained magnetite with up to 30% pyrrhotite and small blebs, minute veinlets and fine disseminations of chalcopyrite and pyrite. The magnetite is in contact with marble; fine grained, dark mafic diorite occurs 10 metres away. Roscoe (1973) estimated 41,046 tonnes of magnetite without specifying grades. The reserve estimates are assumed to not comply with Sections 1.3 and 1.4 of National Instrument 43-101. In a 1975 George Cross News Letter, reference is made to this showing where magnetite is exposed in two areas 61 metres apart and when checked by magnetometer indicated an anomaly enclosing both exposures. The showing was partially tested in the 2005 drill program. The South Pit B zone or Zone 2 (092C 091) is located 215 metres southwest of Zone 1 near a bridge crossing Renfrew Creek. The showing originally showed only a few outcrops of garnetite and silicified rock. It produced a strong magnetic anomaly and was systemically drilled; a trench was bulldozed 76 metres northeast of the bridge, exposing magnetite in garnetite. A drillhole in the centre of the zone intersected thinly to thickly disseminated magnetite in epidote-pyroxene-garnet skarn from 2.4 to 20.4 metres depth and sporadically from 20.4 to 25.3 metres. Pyrite and chalcopyrite occur locally (Eastwood, 1974). Roscoe (1973) estimates 970,597 tonnes of ore without specifying grades. The reserve estimates are assumed to not comply with Sections 1.3 and 1.4 of National Instrument 43-101. Two drillholes were put down in this zone in 2004 by Emerald Fields Resource Corporation (Mowat, 2004). This zone was not tested during the 2005 drill program. South Pit C zone or Zone 3 (092C 091) is located about 425 metres northwest of Zone 2. The zone is not exposed and is known only from the drilling of a magnetic anomaly. A drillhole inclined 45 degrees to the west put down on the centre of the zone intersected magnetite, pyrrhotite and pyrite as disseminations, veins and veinlets in skarn from 18.9 to 23.8 metres. Below 24 metres the rock is predominantly diorite (Eastwood, 1974).
20

092C 029
092C 031
092C 044
092C 058
092C 059
092C 063
092C 068
092C 071
092C 079
092C 085
092C 086
092C 089
092C 090
092C 091
092C 093
092C 099
092C 100092C 102
092C 103
092C 104
092C 106
092C 107
092C 111
092C 158
092C 110
092C 124
092C 125
092C 131
092C 140
092C 141
092C 142
092C 143
092C 146
092C 157
05 5 10 15
KILOMETRES
N
MINFILE OCCURRENCES
092C 012 Red Dog092C 022 Bugaboo 092C 100 Dore 99092C 023 David 092C 101 Dore 97092C 024 Elijah 092C 102 TL 5798092C 025 Sirdar 092C 103 Polly092C 027 Baden Powell 092C 104 DL092C 029 Tide 092C 106 Dore 162092C 030 Rose 092C 107 Harris092C 031 Tally 092C 110 Reko 38092C 044 Sombrio Placers 092C 111 Fitinat092C 058 Kinsley 092C 124 Gad092C 059 Ox 092C 125 Lori092C 063 Mal 092C 131 3 x 3092C 068 Alfreda 092C 137 Ren092C 071 Spanish 092C 140 Murton092C 077 Ebb 1-12 092C 141 Ebb092C 079 Nan 092C 142 Lizard092C 085 Harris Creek 092C 143 Rat092C 086 Gordon River 092C 146 Reko North092C 089 Val 092C 152 New World Slate092C 090 Reko 3 092C 157 Baird Creek Marble092C 091 Reko 10 092C 158 Hemm092C 093 Dore 30
092C 099 Dore 52
092C 101
092C 077
092C 137
092C 152
092C 012
092C 030
092C 025
092C 023
092C 022092C 024
092C 027
Figure 5. MINFILE occurrences.
MINFILE Status
Developed Prospect
Past Producer
Prospect
Showing
Project Claim Boundary
Claims not part of property
21

Roscoe (1973) estimated 31,839 tonnes of ore without specifying grades. The reserve estimates are assumed to not comply with Sections 1.3 and 1.4 of National Instrument 43-101. This zone was not tested during the 2005 drill program. Zone 7 or Pope’s Nose zone (092C 090) is located 1.4 kilometres north of Zone 2 (South Pit B zone). The showing originally consisted of two small exposures of massive pyrrhotite containing networks of chalcopyrite. Emerald Fields opened up the road exposure and tested the zone with four drillholes in 2004 (see Assessment Report 27517). The zone is now 17.5 metres long and comprises massive magnetite bounded by garnet-pyroxene skarn and diorite. The magnetite contains significant pyrite and pyrrhotite with chalcopyrite. The zone was not tested during the 2005 drill program. Zone 8 or North Pit zone (092C 090) is also known as the Road zone and is located 190 metres north of Zone 7 or Pope’s Nose zone. It consisted of numerous small exposures of magnetite and skarn but has recently been developed as one continuous cut along a logging road. The width of exposed magnetite is now about 4 metres wide and is in contact with fine-grained diorite and pyroxene-garnet skarn. Drilling in 1973 was not extended far enough to delimit the zone. A vertical drillhole toward the southwest side of the zone intersected massive and near-massive magnetite from 2.7 to 9.7 metres cut by 2.4 metres of very weakly mineralized skarn. Pyrite occurs in minor amounts. Roscoe (1973) estimated 33,063 tonnes of ore without specifying grades. The reserve estimates are assumed to not comply with Sections 1.3 and 1.4 of National Instrument 43-101. This zone was partially tested during the 2005 drill program. Zone 5 or Northwest zone (092C 110) is located about 715 metres west-southwest of Zone 7 (Pope’s Nose zone). The original showing was partly exposed in bulldozer strippings and one small outcrop and consists of a mixture of magnetite and sulphide minerals in skarn. A 1973 drillhole inclined 45 degrees to the west near the north end of the zone intersected abundant magnetite with lesser amounts of chalcopyrite, pyrrhotite and pyrite from 0.6 to 7.9 metres cut by a 1.5 metre diorite dike. From 20.4 to 26.5 metres the core is mostly massive pyrrhotite, containing lenses and blebs of chalcopyrite (Eastwood, 1974). Roscoe (1973) estimated 34,696 tonnes of ore without specifying grades. The reserve estimates are assumed to not comply with Sections 1.3 and 1.4 of National Instrument 43-101. This zone was not tested during the 2005 drill program. In one locality, a logging roadcut exposes about 150 metres of a limestone unit that contains a section of marble comprised of medium to coarse-grained calcite crystals. Bedding in nearby massive limestone strikes 110 degrees, dipping 80 degrees southwest. The marble section varies from dark grey to blue-white to bright white colour and is free of impurities. There are some greenstone dikes that cut the section further along the outcrop. One drillhole from the 2005 drilling program tested the calcium carbonate quality for commercial industrial applications.
22

10.0 EXPLORATION Historic exploration efforts (Noranda, 1957-60 and Reako Explorations Ltd., 1972-73) have focused on defining the deposits in the Bugaboo and Renfrew creeks areas and are detailed in Section 6.0. The 2005 drilling program by Emerald Fields served a combination of purposes: to validate historic drilling, to infill historic drilling as needed, to evaluate the potential at depth and at the fringes of the deposits, to expand the dimensions of the known zones, and to accurately re-locate deposits where necessary. Ongoing exploration, consisting primarily of an airborne and ground magnetometer survey and diamond drilling will continue to test for expanding mineralization along strike and at depth, test newly discovered showings, and assess select magnetic anomalies from previous surveys in combination with those from the airborne program completed in 2006. In June 2006, Fugro was contracted to fly a low altitude, magnetometer survey with their helicopter-borne, stinger mounted single sensor system over the key areas of interest on the Pearson Project claim group. The airborne magnetometer survey was flown between June 12 and 20, 2006; the grid measured 22 by 7 kilometres and consisted of north-south lines at 100 metres spacing and east-west tie lines at 500 metres spacing for a total distance of 1972 line-kilometres. The aeromagnetic data reveals a great deal of structural variety compared to the widespread high level magnetic response visible on a regional scale. A detailed compilation of at least 19 anomalies throughout the survey block is summarized (refer to Table 1 in the report by M. Sumara in Appendix A). The interpreted anomalies were analyzed and prioritized based on signal strength, structure, size as well as any evidence of mineral showings or drillhole results. The information provided by the magnetics suggests a minimum of 6 significant anomalies of interest that are strongly recommended to be followed up by geological investigation, ground magnetometer surveying, and core drilling. During the summer of 2006 mapping was conducted on the Pearson Project claim group by J. Larocque (as part of M.Sc. thesis) and D. Canil (University of Victoria) in a jointly funded Geoscience BC proposal to delineate the occurrence and origin of ultramafic rocks related to anomalous nickel, chromium, copper and PGE (platinum group elements) (refer to report in Appendix B and online at www.geosciencebc.com). Information from this report has been excerpted and follows. Peridotite, feldspathic olivine pyroxenite, cumulate gabbro and gabbronorite have been positively identified in the project area. The majority of the ultramafic bodies are no more than a few tens of metres wide and although discontinuous at the surface, the ultramafic outcrops tend to be distributed in patches throughout the West Coast Crystalline Complex. Geophysical investigations may reveal continuity between these or other ultramafic bodies at depth. It is suggested that the ultramafic rocks found within the West Coast Crystalline Complex represent cumulates from a primitive (parent?) Bonanza arc magma. There may be a melt-residue relationship between West Coast Crystalline Complex diorite and the ultramafic cumulates, the latter having been entrained in the former during emplacement. Strikingly similar petrography and field relations to the ultramafic rocks of the Pearson Project study are known from the Giant Mascot deposit of southern BC. Nickel-copper-platinum
23

group element sulphide ores at Giant Mascot are hosted by ultramafic rocks, including peridotite, pyroxenite and feldspathic pyroxenite. As in the Pearson Project study, the Giant Mascot rocks contain cumulus spinel and olivine, poikilitically enclosed by orthopyroxene and amphibole. Whole rock geochemical analysis for major and selected trace elements will further clarify the origin of the ultramafic and related plutonic rocks in the Port Renfrew area. The nickel concentration of olivine will be investigated in peridotite and olivine pyroxenite samples to test if they were in equilibrium with nickel-sulphide. This may shed light on the prospectivity of the ultramafic bodies for nickel-copper or PGE sulphide, both in the Port Renfrew field area and elsewhere in the West Coast Crystalline Complex. 11.0 DRILLING As detailed in Section 6.0, the Bugaboo and Reko deposits have previously undergone several drilling campaigns by Noranda Exploration Company, Limited and Reako Explorations Ltd., respectively. All holes were diamond-drill holes and Table 2 lists the work done by each company. Unfortunately, much of the original data for the historic drilling are not available.
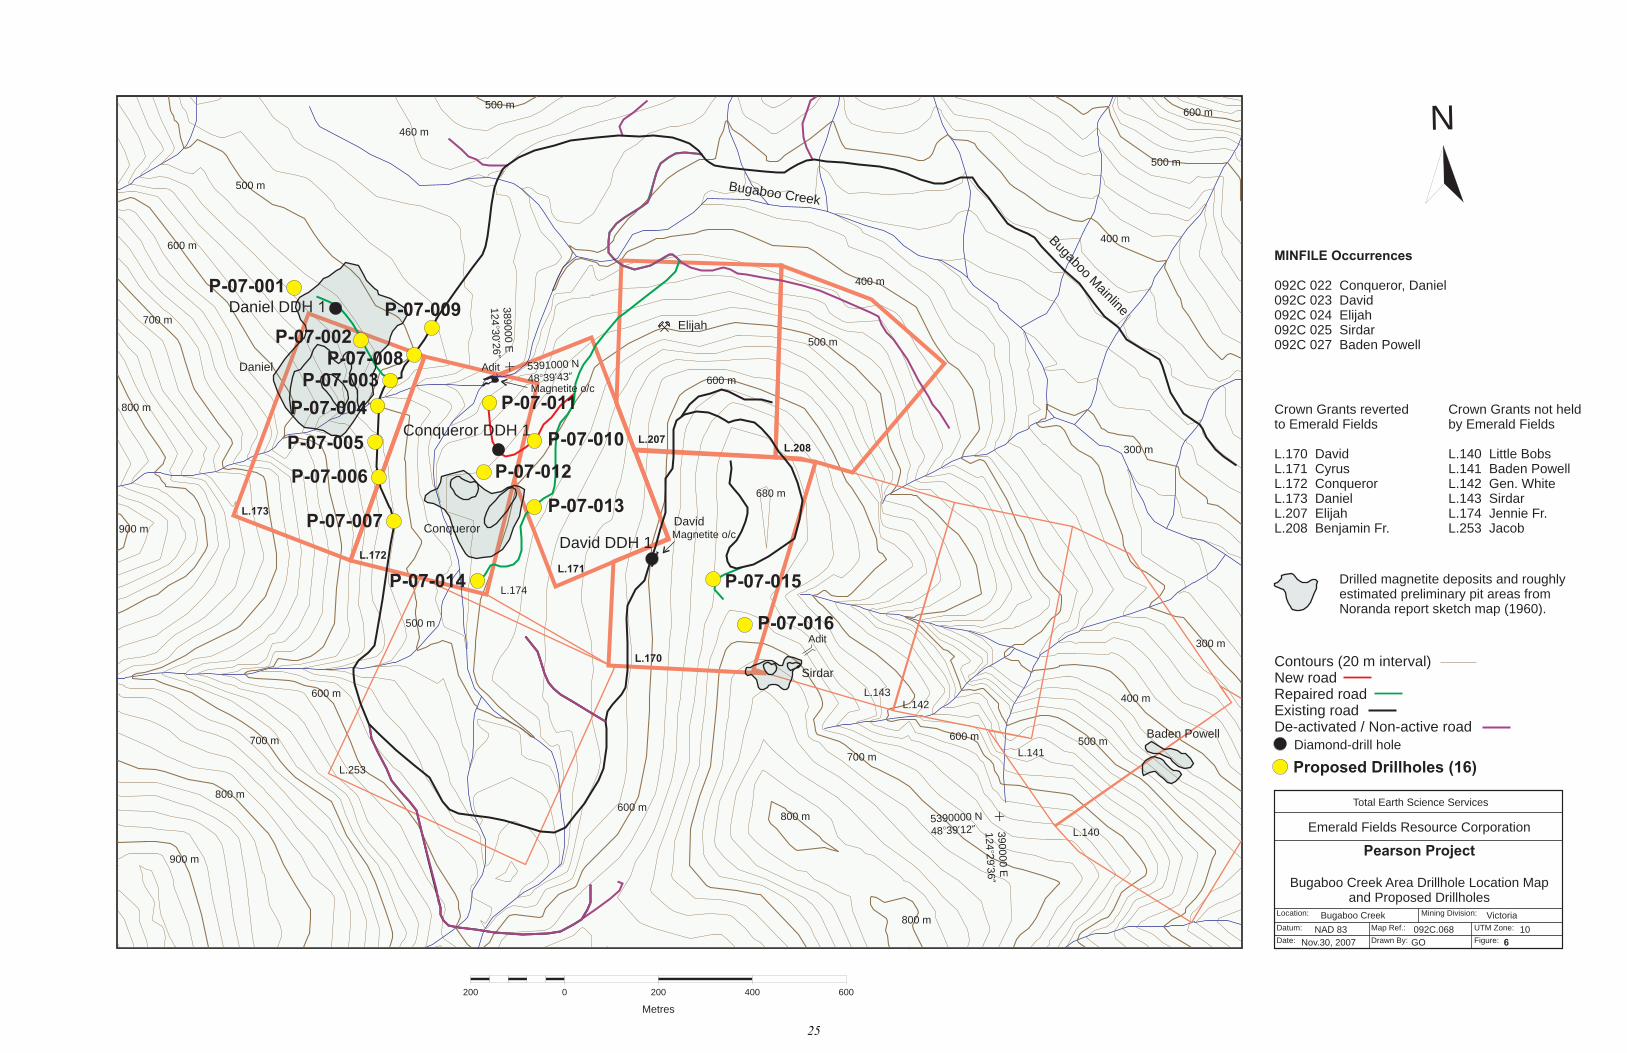
TABLE 2. DRILLING HISTORY OF THE BUGABOO AND REKO DEPOSITS Company Deposit Year Drillholes (m) Noranda Expl. Co. Ltd. Daniel 1957 to 1960 30 1893.4 Noranda Expl. Co. Ltd. Conqueror 1957 to 1960 31 2286.6 Reako Explorations Ltd. Reko 1971 to 1974 112 5427.2 Emerald Fields Res. Corp. Reko 2004 6 204 There is core available from the Emerald Fields drilling campaign in 2004 and is located at the fish plant adjacent the new Port Renfrew Hotel in the community of Port Renfrew, British Columbia. In the course of exploration in 2005, drill core from Noranda’s drilling campaign (1957-60) was discovered but the core stand is collapsed and the core and core boxes have dislodged. The core boxes are still identifiable by metal tags. Between April and May of 2005, a diamond drilling program was completed on behalf of Emerald Fields Resource Corporation (Table 3). Full Force Diamond Drilling Ltd. of Peachland, British Columbia completed 7 thin-wall NQ (TWNQ) diameter drillholes totalling 711.4 metres. Three holes were on the David, Daniel and Conqueror showings (Figure 6), three holes on the Reko showings (Figures 7 and 8), and one hole tested for commercial grade limestone (Figure 9). Core recoveries averaged 92% for Daniel DDH 1, 98% for Conqueror DDH 1, 94% for David DDH 1, 92% for Reko 10 DDH 1, 92% for Reko 10 DDH 2, 91% for Reko 10 DDH 3, and 97% for Marble DDH 1.
24
389000
E
124
30
26
°’
”
Total Earth Science Services
Emerald Fields Resource Corporation
Pearson Project
Bugaboo Creek Area Drillhole Location Mapand Proposed Drillholes
Location:
Datum:
Mining Division:
Map Ref.: UTM Zone:
Date: Drawn By: Figure:
Bugaboo Creek
NAD 83
Nov.30, 2007 GO 6
092C.068 10
Victoria
Bugaboo
Mainline
Bugaboo Creek
5390000 N
48 39 12° ’ ” 390000
E
124
29
36
°’
”
460 m
500 m
500 m
600 m
700 m
800 m
900 m
700 m
600 m
500 m
800 m
900 m
700 m
800 m
680 m
600 m
600 m
500 m
300 m
400 m
600 m
500 m
400 m
Contours (20 m interval)New roadRepaired roadExisting roadDe-activated / Non-active road
400 m
500 m600 m
800 m
300 m
N
0200 200 400 600
Metres
Daniel DDH 1
5391000 N
48 39 43° ’ ”
Conqueror DDH 1
David DDH 1
L.173
L.170
L.171
L.207L.208
L.172
Crown Grants revertedto Emerald Fields
L.170 DavidL.171 CyrusL.172 ConquerorL.173 DanielL.207 ElijahL.208 Benjamin Fr.
L.253
L.174
L.143L.142
L.141
L.140
Crown Grants not heldby Emerald Fields
L.140 Little BobsL.141 Baden PowellL.142 Gen. WhiteL.143 SirdarL.174 Jennie Fr.L.253 Jacob
Drilled magnetite deposits and roughlyestimated preliminary pit areas fromNoranda report sketch map (1960).
Adit
Adit
Magnetite o/c
Magnetite o/c
Baden Powell
Elijah
Conqueror
Daniel
Sirdar
David
MINFILE Occurrences
092C 022 Conqueror, Daniel092C 023 David092C 024 Elijah092C 025 Sirdar092C 027 Baden Powell
Diamond-drill hole
Proposed Drillholes (16)
P-07-001
P-07-006
P-07-007
P-07-008
P-07-009
P-07-010
P-07-011
P-07-012
P-07-013
P-07-014 P-07-015
P-07-002
P-07-003
P-07-004
P-07-005
P-07-016
25

Total Earth Science Services
Emerald Fields Resource Corporation
Pearson Project
Reko 10 DDH 1 and 2 Drillhole Location Map
Location:
Datum:
Mining Division:
Map Ref.: UTM Zone:
Date: Drawn By: Figure:
Renfrew Creek
NAD 83
July 29, 2005 GO 7
092C.069 10
Victoria
N
Magnetiteoutcrop
400 m
Gra
nite
Main
line
5389000 N
48 38 48° ’ ” 405000
E
124
17
23
°’
”
500 m 600 m
Reko 10 DDH 2
Reko 10 DDH 1
360 m
Renfre
wC
reek
0100 100 200 300
Metres
Contours (20 m interval)New roadRepaired roadExisting roadDe-activated / Non-active road
South Pit B Zone or Zone 2MINFILE 092C 091
South Pit A Zone or Zone 1MINFILE 092C 091
Diamond-drill hole
26

N
Total Earth Science Services
Emerald Fields Resource Corporation
Pearson Project
Reko 10 DDH 3 Drillhole Location Map
Location:
Datum:
Mining Division:
Map Ref.: UTM Zone:
Date: Drawn By: Figure:
Renfrew Creek
NAD 83
July 29, 2005 GO 8
092C.069 10
Victoria
460 m
GraniteMainline
Renfre
wC
reek
5390000 N
48 39 20° ’ ”
404000
E
124
18
12
°’
”
Magnetite outcrop
Magnetite outcrop
Reko 10 DDH 3
500 m 600 m440 m
400 m
0100 100 200 300
Metres
Contours (20 m interval)New roadRepaired roadExisting roadDe-activated / Non-active road
Zone 7 or Pope’s Nose ZoneMINFILE 092C 090
Zone 8 or Road ZoneMINFILE 092C 090
Diamond-drill hole
27

N
Total Earth Science Services
Emerald Fields Resource Corporation
Pearson Project
Marble DDH 1 Drillhole Location Mapand Proposed Drillholes
Location:
Datum:
Mining Division:
Map Ref.: UTM Zone:
Date: Drawn By: Figure:
Renfrew Creek
NAD 83
Nov.30, 2007 GO 9
092C.069 10
Victoria
600 m500 m
Granite Mainline
700 m
800 m
Renfrew Creek
5391000 N
48 39 52° ’ ”
403000
E
124
19
02
°’
”
Limestone outcrop
Marble DDH 1
0100 100 200 300
Metres
500 m
Contours (20 m interval)New roadRepaired roadExisting roadDe-activated / Non-active road
Diamond-drill hole
Proposed Drillholes (4)
P-07-018
P-07-017
P-07-019
P-07-020
28

TABLE 3. SUMMARY OF SPRING 2005 DRILL PROGRAM Hole No. Azimuth/Dip NAD 83 Coordinates (UTM) Total Depth (°) (m) Daniel DDH 1 /-90 5391125N / 388623E 178 Conqueror DDH 1 /-90 5390824N / 388973E 181.66 David DDH 1 119/-60 5390589N / 389291E 77.42 Reko 10 DDH 1 215/-60 5388653N / 404879E 38.4 Reko 10 DDH 2 210/-60 5388556N / 404900E 38.4 Reko 10 DDH 3 190/-60 5390079N / 404342E 24.08 Marble DDH 1 020/-60 5390902N / 403261E 173.43 The author observed the drilling and core handling procedures employed for the 2005 spring program, and is of the opinion that they were standard in the industry. The core was logged by the author and Garry Payie, P.Geo. Dan Hora, P.Geo., an industrial minerals specialist, assisted in logging one drillhole (Marble DDH 1) that tested for commercial grade limestone. All core sample intervals were sawn in half with half sent to ALS Chemex in North Vancouver, British Columbia and the other half left in the core box. A total of 89 samples were taken for analysis. The core is stored outside at the fish plant adjacent to the new Port Renfrew Hotel in the community of Port Renfrew, British Columbia. Refer to Sections 12.0 and 13.0 for sampling methodology and procedures. The spring 2005 drill program successfully located the Daniel and Conqueror orebodies, validated the depth and width of mineralization, and expanded the dimension of the Conqueror deposit. The drillhole on the David showing indicates that the massive magnetite as exposed in the roadcut does not appear to continue under the road and downhill but remains untested upslope. The two drillholes on the Zone 1 (South Pit A) showing confirmed the width of mineralization but testing upslope and along strike remains. The drillhole on the Zone 8 (North Pit) showing indicates that the massive magnetite in the roadcut does not appear to continue under the road but remains untested upslope and along strike. The one drillhole that tested a limestone outcrop intersected sufficiently clean white marble acceptable for industrial use over several separate core segments, but cannot be considered as a potentially economic target because of narrow widths at depth and contamination due to numerous greenstone dikes and skarn sections. Unless otherwise indicated, all drill intersections from the 2005 drill program are quoted as core length. Proposed drill targets for the 2008-09 exploration program are shown on Figures 6, 9 and 27 and noted below. 11.1 Bugaboo Creek Area One vertical drillhole (Daniel DDH 1) was centred on highly anomalous magnetic readings from an orientation survey line that was completed over a part of the projected Daniel deposit outline taken from a sketch map in the Noranda report by Menzies and
29

Nicolls (1960). The drillhole intersected five zones of massive magnetite mineralization between 27.56 to 67.77 metres depth enclosed by diorite, marble and pyroxene-garnet skarn. Overall aggregate magnetite thickness is 30.97 metres averaging 57.37% total iron. The magnetite intersections from top to bottom are as follows: 1.83 metres grading 66.51% total iron, 21.97 metres averaging 57.55% total iron, 4.4 metres averaging 56.37% total iron, 0.38 metre grading 50.44% total iron and 2.39 metres grading 55.99% total iron (Figures 10 and 11). Drill intersections are quoted as core lengths. One vertical drillhole (Conqueror DDH 1) was centred on highly anomalous magnetic readings from an orientation survey line that was completed over a part of the projected Conqueror deposit outline taken from a sketch map in the Noranda report by Menzies and Nicolls (1960). The drillhole collared directly into 12.36 metres of massive magnetite mineralization under 7.32 metres of overburden. The drillhole intersected six zones of massive magnetite mineralization between 7.32 to 82.45 metres depth enclosed by marble and pyroxene-garnet skarn. Overall aggregate magnetite thickness is 42.27 metres averaging 59.2% total iron. The magnetite intersections from top to bottom are as follows: 12.36 metres averaging 62.23% total iron, 0.91 metre grading 60.74% total iron, 1.27 metres grading 55.42% total iron, 25.04 metres averaging 61.22% total iron, 0.48 metre grading 57.06% total iron and 2.21 metres grading 58.56% total iron (Figures 12 and 13). Drill intersections are quoted as core lengths. The drillhole is located between the original discovery showing of magnetite in Bugaboo Creek to the north, and the main Conqueror deposit outline to the south (Figure 6). This indicates excellent potential to expand the dimensions of the known deposit towards the drillhole. An inclined drillhole (-60 degrees) tested the downdip extension of the David magnetite showing along a logging roadcut. The hole intersected massive marble cut by a plagioclase porphyritic dike and did not intersect the massive magnetite mineralization as evidenced in outcrop (Figures 14 and 15). The results indicate that the magnetite mineralization does not appear to continue downslope under the road towards the Conqueror orebody. Drilling is required upslope from the showing to test for continuity and extension. It is recommended to drill the Daniel and Conqueror deposit area in the 2008-09 exploration programs. Three drillholes are recommended to test and assess whether the two deposits are continuous with each other. Two drillholes are also recommended to expand the Conqueror orebody to the north of its current configuration. Refer to Figure 6 for proposed drillhole locations. The Lorimer Creek showing is located about 3.5 kilometres southeast along strike from the Daniel and Conqueror orebodies. Massive magnetite is exposed in a roadcut and coincides with a small aeromagnetic anomaly identified from the 2006 airborne survey (refer to Figure 3 in the airborne survey report in Appendix A). Two drillholes are recommended to test the Lorimer Creek area and the larger scale aeromagnetic features just northwest along strike from the showing between it and the historic Baden Powell workings (refer to Figure 27 for proposed drillhole location).
30

Total Earth Science Services
Emerald Fields Resource Corporation
Pearson Project
Daniel DDH 1 - 2005 Drillhole Section
Location:
Datum:
Mining Division:
Map Ref.: UTM Zone:
Date: Drawn By: Figure:
Bugaboo Creek
NAD 83
July 27, 2005 GO 10
092C.068 10
Victoria
Daniel DDH 1 - 2005
Magnetite aggregate thickness = 30.97 metresAverage Total Fe = 57.37%(drill intersections are core lengths)
E.O.H. = 178 metresDip = -90°
Overburden
Massive magnetite
Diorite, quartz diorite,plagioclase porphyritic dike
Skarn - pyroxene +/- garnet,+/- epidote
Marble
0 10 15
Metres
5
Section Facing Azimuth 295 degrees
500 m
450 m
400 m
350 m
300 m
Elevation
Overburden
27.56 - 29.39 m ( )1.83 m Total Fe 66.51%
31.29 - 53.26 m ( )21.97 m Avg. Total Fe 57.55%
55.47 - 59.87 m ( )4.4 m Avg. Total Fe 56.37%
61.04 - 61.42 m ( )0.38 m Total Fe 50.44%
65.38 - 67.77 m ( )2.39 m Total Fe 55.99%
LEGEND
Lithology contact attitude to core axis45
90
30
20
50
31

Total Earth Science Services
Emerald Fields Resource Corporation
Pearson ProjectDaniel DDH 1 - 2005 Drillhole Section
Sample Location Map
Location:
Datum:
Mining Division:
Map Ref.: UTM Zone:
Date: Drawn By: Figure:
Bugaboo Creek
NAD 83
July 27, 2005 GO 11
092C.068 10
Victoria
Daniel DDH 1 - 2005
E.O.H. = 178 metresDip = -90°
Overburden
Massive magnetite
Diorite, quartz diorite,plagioclase porphyritic dike
Skarn - pyroxene +/- garnet,+/- epidote
Marble
0 10 15
Metres
5
Section Facing Azimuth 295 degrees
500 m
450 m
400 m
350 m
300 m
Elevation
LEGEND
B279854
B279853
B279855B279856B279857B279858B279859B279860B279861B279862B279863B279864B279865B279866B279867B279868B279869B279870B279871B279872B279873B279874
B279875B279876B279877B279878B279879B279880B279881B279882B279883B279884
B279885
B279886
B279601 Sample ID
Daniel DDH 1 - 2005
Magnetite aggregate thickness = 30.97 metresAverage Total Fe = 57.37%(drill intersections are core lengths)
27.56 - 29.39 m ( )1.83 m Total Fe 66.51%
31.29 - 53.26 m ( )21.97 m Avg. Total Fe 57.55%
55.47 - 59.87 m ( )4.4 m Avg. Total Fe 56.37%
61.04 - 61.42 m ( )0.38 m Total Fe 50.44%
65.38 - 67.77 m ( )2.39 m Total Fe 55.99%
32

Total Earth Science Services
Emerald Fields Resource Corporation
Pearson Project
Conqueror DDH 1 - 2005 Drillhole Section
Location:
Datum:
Mining Division:
Map Ref.: UTM Zone:
Date: Drawn By: Figure:
Bugaboo Creek
NAD 83
July 28, 2005 GO 12
092C.068 10
Victoria
Conqueror DDH 1 - 2005
Magnetite aggregate thickness = 42.27 metresAverage Total Fe = 59.2%(drill intersections are core lengths)
E.O.H. = 181.66 metresDip = -90°
Overburden
Massive magnetite
Diorite, plagioclase porphyritic dike
Skarn - pyroxene +/- garnet,+/- actinolite, +/- diopside, +/- epidote
Marble
0 10 15
Metres
5
Section Facing Azimuth 270 degrees
460 m
410 m
360 m
310 m
260 m
Elevation
Overburden
7.32 - 19.68 m ( )12.36 m Avg. Total Fe 62.23%
42.52 - 43.43 m ( )0.91 m Total Fe 60.74%
49.56 - 74.6 m ( )25.04 m Avg. Total Fe 61.22%
78.16 - 78.64 m ( )0.48 m Total Fe 57.06%
80.24 - 82.45 m ( )2.21 m Total Fe 58.56%
LEGEND
Lithology contact attitude to core axis45
80
70
40
55
44.81 - 46.08 m ( )1.27 m Total Fe 55.42%
Semi-massive magnetite, skarn
Skarned diorite
90
20
33

Total Earth Science Services
Emerald Fields Resource Corporation
Pearson Project
Conqueror DDH 1 - 2005 Drillhole SectionSample Location Map
Location:
Datum:
Mining Division:
Map Ref.: UTM Zone:
Date: Drawn By: Figure:
Bugaboo Creek
NAD 83
July 28, 2005 GO 13
092C.068 10
Victoria
Conqueror DDH 1 - 2005
Magnetite aggregate thickness = 42.27 metresAverage Total Fe = 59.2%(drill intersections are core lengths)
E.O.H. = 181.66 metresDip = -90°
Overburden
Massive magnetite
Diorite, plagioclase porphyritic dike
Skarn - pyroxene +/- garnet,+/- actinolite, +/- diopside, +/- epidote
Marble
0 10 15
Metres
5
Section Facing Azimuth 270 degrees
460 m
410 m
360 m
310 m
260 m
Elevation
Overburden
7.32 - 19.68 m ( )12.36 m Avg. Total Fe 62.23%
42.52 - 43.43 m ( )0.91 m Total Fe 60.74%
49.56 - 74.6 m ( )25.04 m Avg. Total Fe 61.22%
78.16 - 78.64 m ( )0.48 m Total Fe 57.06%
80.24 - 82.45 m ( )2.21 m Total Fe 58.56%
LEGEND
44.81 - 46.08 m ( )1.27 m Total Fe 55.42%
Semi-massive magnetite, skarn
Skarned diorite
B279887 Sample ID
Conqueror DDH 1 - 2005
B279887B279888B279889B279890B279891B279892B279893B279894
B279895
B279898
B279900
B279899
B279896
B279901B279902B279903B279904B279905B279906B279907B279908B279909B279910B279911B279912B279913B279914B279915B279916
B279897
B279917B279918
B279919B279920B279921B279922B279923
B279924
34
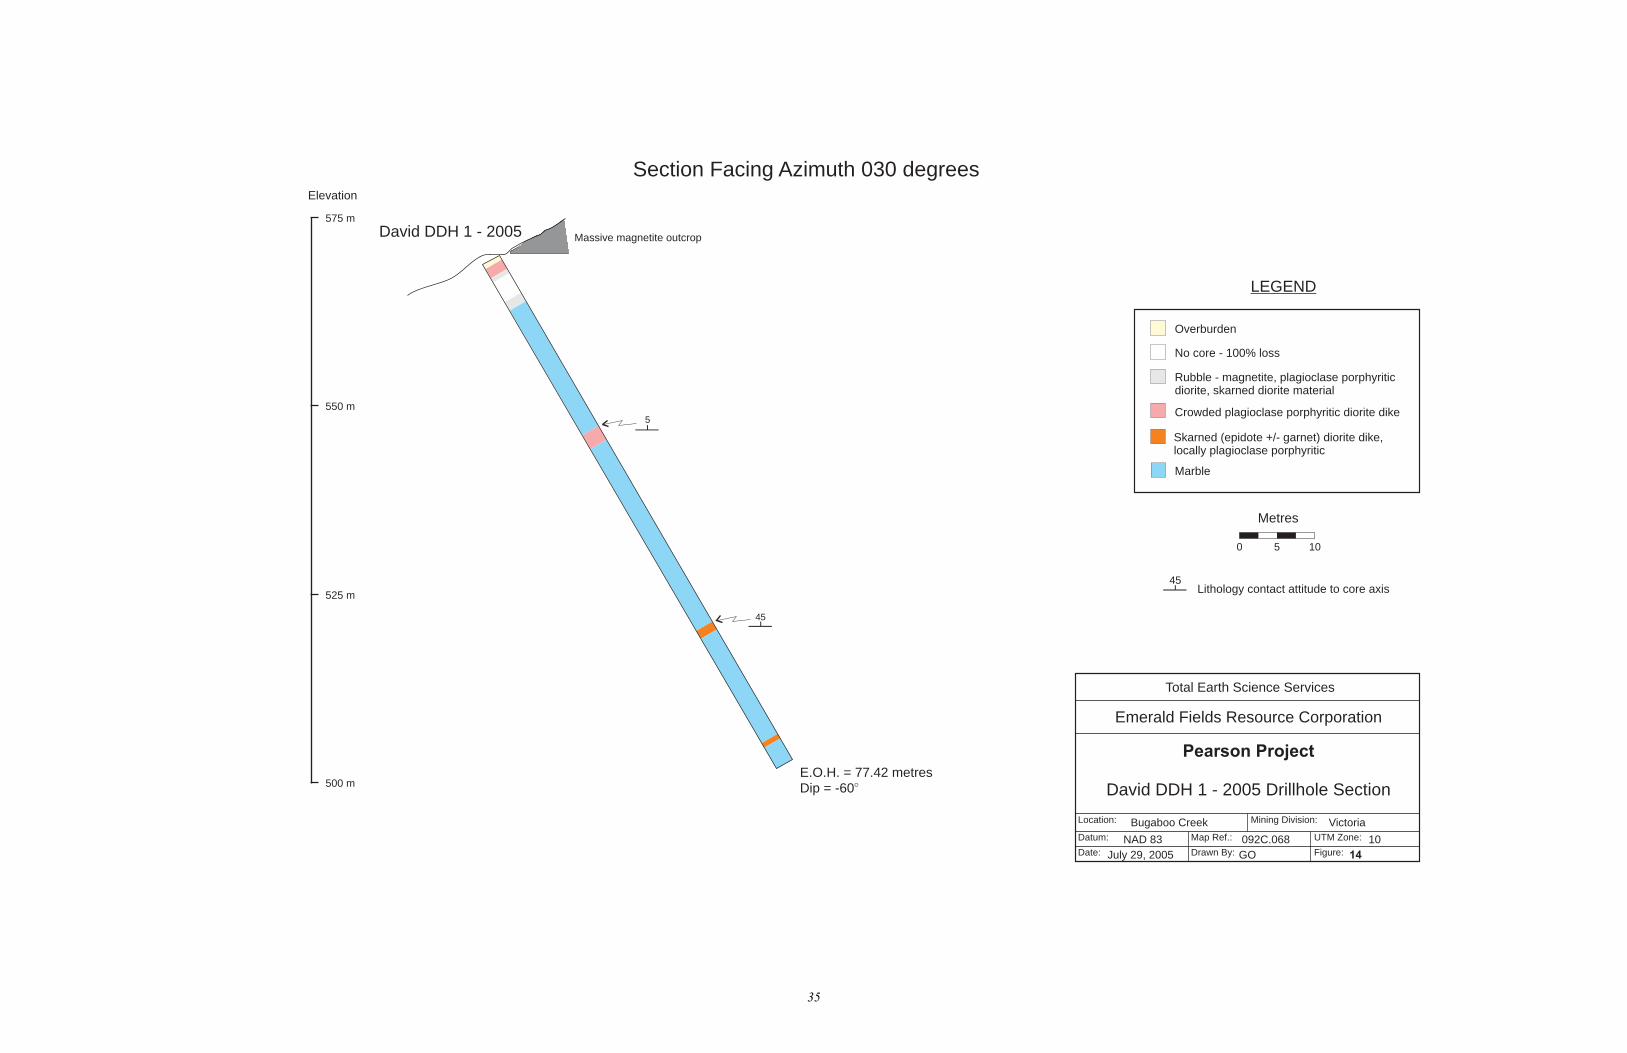
Lithology contact attitude to core axis45
575 m
550 m
525 m
500 m
Elevation
Total Earth Science Services
Emerald Fields Resource Corporation
Pearson Project
David DDH 1 - 2005 Drillhole Section
Location:
Datum:
Mining Division:
Map Ref.: UTM Zone:
Date: Drawn By: Figure:
Bugaboo Creek
NAD 83
July 29, 2005 GO 14
092C.068 10
Victoria
David DDH 1 - 2005
Section Facing Azimuth 030 degrees
E.O.H. = 77.42 metresDip = -60°
0 5 10
Metres
Overburden
Crowded plagioclase porphyritic diorite dike
Skarned (epidote +/- garnet) diorite dike,locally plagioclase porphyritic
Marble
LEGEND
No core - 100% loss
Rubble - magnetite, plagioclase porphyriticdiorite, skarned diorite material
5
45
Massive magnetite outcrop
35

575 m
550 m
525 m
500 m
Elevation
Total Earth Science Services
Emerald Fields Resource Corporation
Pearson Project
David DDH 1 - 2005 Drillhole SectionSample Location Map
Location:
Datum:
Mining Division:
Map Ref.: UTM Zone:
Date: Drawn By: Figure:
Bugaboo Creek
NAD 83
July 29, 2005 GO 15
092C.068 10
Victoria
David DDH 1 - 2005
Section Facing Azimuth 030 degrees
E.O.H. = 77.42 metresDip = -60°
0 5 10
Metres
Overburden
Crowded plagioclase porphyritic diorite dike
Skarned (epidote +/- garnet) diorite dike,locally plagioclase porphyritic
Marble
LEGEND
No core - 100% loss
Rubble - magnetite, plagioclase porphyriticdiorite, skarned diorite material
Massive magnetite outcrop
B279925
B279926
B279925 Sample ID
David DDH 1 - 2005
36

11.2 Renfrew Creek Area Two shallow inclined drillholes (both -60 degrees) were completed on the Reko Zone 1 (South Pit A) magnetite showing (Figure 7). The first hole (Reko 10 DDH 1) intersected 4.06 metres of massive magnetite mineralization between 10.77 to 14.83 metres depth enclosed by marble and diorite. The magnetite averaged 58.38% total iron and 1795 ppm copper (Figures 16 and 17). The second hole (Reko 10 DDH 2), about 70 metres along strike and to the south of the showing, was located on an anomalous magnetic survey orientation line (Figure 18). The hole did not intersect a significant amount of massive magnetite but a suite of dioritic rocks containing garnet-pyroxene skarn over 2.06 metres thick hosts a small zone (0.6 metre) of magnetite mineralization (Figures 19 and 20). Drill intersections are quoted as core lengths. Further testing is required north of the Zone 1 showing along strike, and to also check the relationship of mineralization to Zone 2 (South Pit B) located about 180 metres southwest of Zone 1. One shallow inclined hole (-60 degrees) was completed on the Zone 8 (North Pit or Road zone) showing (Figure 21). The hole (Reko 10 DDH 3) was sited to test the width of a massive magnetite body exposed in a roadcut. The hole intersected a large zone of garnet-pyroxene skarn and diorite and may indicate a locally developed lens of magnetite (Figures 22 and 23). Further testing may be required to check the relationship of mineralization with that of the Zone 7 (Pope’s Nose) showing about 200 metres south and along trend with Zone 8. Marble DDH 1, inclined at -60 degrees, was completed to test the quality and extent of a white, coarse-grained marble unit for commercial industrial mineral applications (Figure 24). The limestone outcrop varies from grey, to blue-white to bright white and contains a section of marble comprised of medium to coarse-grained calcite crystals. The drillhole was stepped back from the outcrop to test the downdip extension and quality of the marble (Figures 25 and 26). Dan Hora, P.Geo., an industrial minerals specialist, assisted in assessing and logging the drillhole. The drillhole revealed a high level of contamination by silicate rocks with numerous segments of a fine-grained greenstone, probably andesitic in composition, from few centimetres thick to sections up to 15 metres long. The greenstone is frequently accompanied by a garnet-epidote skarn. There are also substantial intersections of siliceous feldspar porphyry. In conclusion, sufficiently clean white limestone for industrial use occurs in core segments 5.41 to 22.96 metres, 39.93 to 47.68 metres and 149.2 to 158.19 metres but this cannot be considered as a potentially economic target due to narrow widths and a high level of contamination of other rock units. There are numerous other exposures of limestone and marble throughout the property area and consideration should be given to them after initial rock sampling, analysis and geological evaluation. The 2006 airborne magnetic survey identified a strong, large feature that underlies the Reko North magnetite showing in close vicinity to where the Marble drillhole tested for commercial grade limestone in 2005 (refer to Figure 5 in the airborne survey report in
37

Lithology contact attitude to core axis45
Elevation
Total Earth Science Services
Emerald Fields Resource Corporation
Pearson Project
Reko 10 DDH 1 - 2005 Drillhole Section
Location:
Datum:
Mining Division:
Map Ref.: UTM Zone:
Date: Drawn By: Figure:
Renfrew Creek
NAD 83
July 30, 2005 GO 16
092C.069 10
Victoria
Reko 10 DDH 1 - 2005
Section Facing Azimuth 305 degrees
E.O.H. = 38.4 metresDip = -60°
0 2.5 5
Metres
Overburden
Marble
LEGEND
Massive magnetite
Fine-grained diorite, medium to coarse-grainedquartz diorite, +/- pyroxene skarn
45
Massive magnetiteoutcrop along roadcut
430 m
420 m
410 m
400 m
390 m
10
Magnetite aggregate thickness = 4.06 metresAverage Total Fe = 58.38%Average Cu = 1795 ppm(drill intersections are core lengths)
10.77 - 12.8 m ( )2.03 m Total Fe 62.49%Cu 1965 ppm
12.8 - 14.83 m ( )2.03 m Total Fe 54.27%Cu 1625 ppm
38

Elevation
Total Earth Science Services
Emerald Fields Resource Corporation
Pearson Project
Reko 10 DDH 1 - 2005 Drillhole SectionSample Location Map
Location:
Datum:
Mining Division:
Map Ref.: UTM Zone:
Date: Drawn By: Figure:
Renfrew Creek
NAD 83
July 30, 2005 GO 17
092C.069 10
Victoria
Reko 10 DDH 1 - 2005
Section Facing Azimuth 305 degrees
E.O.H. = 38.4 metresDip = -60°
0 2.5 5
Metres
Overburden
Marble
LEGEND
Massive magnetite
Fine-grained diorite, medium to coarse-grainedquartz diorite, +/- pyroxene skarn
Massive magnetiteoutcrop along roadcut
430 m
420 m
410 m
400 m
390 m
B279927 Sample ID
Reko 10 DDH 1 - 2005
B279927
B279928
B279929
Magnetite aggregate thickness = 4.06 metresAverage Total Fe = 58.38%Average Cu = 1795 ppm(drill intersections are core lengths)
10.77 - 12.8 m ( )2.03 m Total Fe 62.49%Cu 1965 ppm
12.8 - 14.83 m ( )2.03 m Total Fe 54.27%Cu 1625 ppm
39

N
Total Earth Science Services
Emerald Fields Resource Corporation
Pearson Project
Reko 10 DDH 1 and 2 Drillhole Location
and Magnetic Survey Line Map
Location:
Datum:
Mining Division:
Map Ref.: UTM Zone:
Date: Drawn By: Figure:
Renfrew Creek
NAD 83
June 29, 2005 GO 18
092C.069 10
Victoria
Instrument: Vertical Field Fluxgate MagnetometerComponent measured: Vertical Field (gammas)
Contours (20 m interval)New roadRepaired roadExisting roadDe-activated / Non-active road
Reko 10 DDH 2
Reko 10 DDH 1
Gra
nite
Main
line
540680500600550560600700600
600600350500
92020001100
Bedding in limestone outcroplocated 84 m further northalong road
45
Magnetiteoutcrop
Gammas
0+0 m
0+25 m
0+50 m
0+75 m
400 m 500 m
Direction of survey
readings
020 20 40 60
Metres
40

Lithology contact attitude to core axis45
Elevation
Total Earth Science Services
Emerald Fields Resource Corporation
Pearson Project
Reko 10 DDH 2 - 2005 Drillhole Section
Location:
Datum:
Mining Division:
Map Ref.: UTM Zone:
Date: Drawn By: Figure:
Renfrew Creek
NAD 83
July 30, 2005 GO 19
092C.069 10
Victoria
Reko 10 DDH 2 - 2005
Section Facing Azimuth 305 degrees
E.O.H. = 38.4 metresDip = -60°
0 2.5 5
Metres
Overburden
Quartz diorite to monzodiorite - medium to coarsegrained
LEGEND
Diorite - fine-grained, locally plagioclase porphyritic
Quartz diorite breccia - contains fine-grained dioritefragments
45
425 m
415 m
405 m
395 m
385 m
Garnet-pyroxene skarn +/- epidote +/- magnetite
Vertical Field (gammas)
600 700600 560
920
2000
1100
600600
350
Magnetometer survey line0+25 m0+50 m0+70 m
41

Elevation
Total Earth Science Services
Emerald Fields Resource Corporation
Pearson Project
Reko 10 DDH 2 - 2005 Drillhole SectionSample Location Map
Location:
Datum:
Mining Division:
Map Ref.: UTM Zone:
Date: Drawn By: Figure:
Renfrew Creek
NAD 83
July 30, 2005 GO 20
092C.069 10
Victoria
Reko 10 DDH 2 - 2005
E.O.H. = 38.4 metresDip = -60°
0 2.5 5
Metres
Overburden
Quartz diorite to monzodiorite - medium to coarsegrained
LEGEND
Diorite - fine-grained, locally plagioclase porphyritic
Quartz diorite breccia - contains fine-grained dioritefragments
425 m
415 m
405 m
395 m
385 m
Garnet-pyroxene skarn +/- epidote +/- magnetite
B279930 Sample ID
Reko 10 DDH 2 - 2005
B279930
B279931
Section Facing Azimuth 305 degrees
42

N
Total Earth Science Services
Emerald Fields Resource Corporation
Pearson Project
Reko 10 DDH 3 Drillhole Location Map
Location:
Datum:
Mining Division:
Map Ref.: UTM Zone:
Date: Drawn By: Figure:
Renfrew Creek
NAD 83
June 30, 2005 GO 21
092C.069 10
Victoria
460 m
GraniteMainline
Renfre
wC
reek
5390000 N
48 39 20° ’ ”
404000
E
124
18
12
°’
”
Magnetite outcrop
Magnetite outcrop
Reko 10 DDH 3
500 m 600 m440 m
400 m
0100 100 200 300
Metres
Contours (20 m interval)New roadRepaired roadExisting roadDe-activated / Non-active road
Zone 7 or Pope’s Nose ZoneMINFILE 092C 090
Zone 8 or Road ZoneMINFILE 092C 090
Diamond-drill hole
43

Lithology contact attitude to core axis45
Elevation
Total Earth Science Services
Emerald Fields Resource Corporation
Pearson Project
Reko 10 DDH 3 - 2005 Drillhole Section
Location:
Datum:
Mining Division:
Map Ref.: UTM Zone:
Date: Drawn By: Figure:
Renfrew Creek
NAD 83
July 30, 2005 GO 22
092C.069 10
Victoria
Section Facing Azimuth 100 degrees
E.O.H. = 24.08 metresDip = -60°
0 2.5 5
Metres
Overburden
LEGEND
Diorite - plagioclase porphyritic
Garnet-pyroxene skarn +/- epidote
470 m
460 m
450 m
440 m
Massive magnetite in roadcut
Massive magnetite
Reko 10 DDH 3 - 2005
44

Elevation
Total Earth Science Services
Emerald Fields Resource Corporation
Pearson Project
Reko 10 DDH 3 - 2005 Drillhole SectionSample Location Map
Location:
Datum:
Mining Division:
Map Ref.: UTM Zone:
Date: Drawn By: Figure:
Renfrew Creek
NAD 83
July 30, 2005 GO 23
092C.069 10
Victoria
Section Facing Azimuth 100 degrees
E.O.H. = 24.08 metresDip = -60°
0 2.5 5
Metres
Overburden
LEGEND
Diorite - plagioclase porphyritic
Garnet-pyroxene skarn +/- epidote
470 m
460 m
450 m
440 m
Massive magnetite in roadcut
Massive magnetite
B279932 Sample ID
Reko 10 DDH 3 - 2005
B279932
B279933
B279934
B279935
B279936
Reko 10 DDH 3 - 2005
45

N
Total Earth Science Services
Emerald Fields Resource Corporation
Pearson Project
Marble DDH 1 Drillhole Location Map
Location:
Datum:
Mining Division:
Map Ref.: UTM Zone:
Date: Drawn By: Figure:
Renfrew Creek
NAD 83
June 29, 2005 GO 24
092C.069 10
Victoria
600 m
500 m
Granite Mainline
700 m800 m
Renfrew Creek
5391000 N
48 39 52° ’ ”
403000
E
124
19
02
°’
”
Limestone outcrop
Marble DDH 1
0100 100 200 300
Metres
500 m
Contours (20 m interval)New roadRepaired roadExisting roadDe-activated / Non-active road
Diamond-drill hole
46

Total Earth Science Services
Emerald Fields Resource Corporation
Pearson Project
Marble DDH 1 - 2005 Drillhole Section
Location:
Datum:
Mining Division:
Map Ref.: UTM Zone:
Date: Drawn By: Figure:
Renfrew Creek
NAD 83
July 29, 2005 GO 25
092C.069 10
Victoria
Marble DDH 1 - 2005
E.O.H. = 173.43 metresDip = -60°
Section Facing Azimuth 315 degrees
Overburden
60
34
85
45
0 10 15
Metres
5
LEGEND
Lithology contact attitude to core axis45
60
625 m
575 m
525 m
475 m
425 m
Elevation
Overburden
Garnet-epidote skarn
Mixed unit of diorite (greenstone), quartz-feldsparporphyry, epidote skarn
Marble - medium to coarse grained
Marble unit mixed zone with diorite (greenstone)dikes, siliceous dikes and epidote-garnet skarn
Quartz-feldspar porphyry dike
Diorite (greenstone), locally garnet-epidote skarnaltered
Representative sample of marblefrom 10.36 - 13.41 m (3.05 m)(drill intersection is core length)
CaO 53.05 MgO 1.83SiO 0.43 Fe O 0.09
Al O 0.08 Na O 0.10
K O 0.01 Cr O 0.01
MnO <0.01 P O 0.02
SrO 0.33 BaO <0.01TiO <0.01 LOI 43.9
% %
2 2 3
2 3 2
2 2 3
2 5
2
Marble outcrop exposed along road for atleast 115 continuous metres. Beddingstrikes from 100 - 110 degrees, dipping78 to 80 degrees southwest.
Marble dips from78 - 80 degrees
47

Total Earth Science Services
Emerald Fields Resource Corporation
Pearson Project
Marble DDH 1 - 2005 Drillhole SectionSample Location Map
Location:
Datum:
Mining Division:
Map Ref.: UTM Zone:
Date: Drawn By: Figure:
Renfrew Creek
NAD 83
July 29, 2005 GO 26
092C.069 10
Victoria
Marble DDH 1 - 2005
E.O.H. = 173.43 metresDip = -60°
Section Facing Azimuth 315 degrees625 m
0 10 15
Metres
5
LEGEND
575 m
525 m
475 m
425 m
Elevation
Overburden
Garnet-epidote skarn
Mixed unit of diorite (greenstone), quartz-feldsparporphyry, epidote skarn
Marble - medium to coarse grained
Marble unit mixed zone with diorite (greenstone)dikes, siliceous dikes and epidote-garnet skarn
Quartz-feldspar porphyry dike
Diorite (greenstone), locally garnet-epidote skarnaltered
B279837 Sample ID
Marble DDH 1 - 2005
B279937
B279938
B279939
B279940
B279941
Marble outcrop exposed along road for atleast 115 continuous metres. Beddingstrikes from 100 - 110 degrees, dipping78 to 80 degrees southwest.
Marble dips from78 - 80 degrees
48

Appendix A). Two drillholes are recommended to test this deeper magnetic feature (refer to Figure 9 for proposed drillhole location). It is interesting to note that skarn development and diking become more prevalent near the bottom of the Marble drillhole. 12.0 SAMPLING METHOD AND APPROACH In the spring 2005 drill program a total of 89 core samples were taken for analysis. In practice, the drill core was sawn using a tile-cutting table saw fitted with an appropriate cutting blade. In each case, half the core was returned to the box and half was bagged for shipment to ALS Chemex in North Vancouver, British Columbia. The core boxes were placed on pallets, covered and stored near the fish plant adjacent to the new Port Renfrew Hotel in the community of Port Renfrew, British Columbia. The author and Garry Payie, P.Geo. were responsible for sawing and all sample preparation. In the author’s opinion the sampling procedures are consistent with accepted industry practice. Where massive magnetite mineralization was intersected, core samples were generally 1.5 metre continuous lengths. Sampling intervals for sections of non-massive mineralization were also generally 1.5 metre continuous lengths. 13.0 SAMPLE PREPARATION, ANALYSES AND SECURITY In the spring 2005 drill program the author and Garry Payie, P.Geo. sawed, prepared, sampled and shipped all core. The sawn, half-core samples were placed in labeled plastic sample bags and then into labeled rice-sacks and shipped to ALS Chemex in North Vancouver, British Columbia. Analytical procedures used were Au 30g FA-AA finish, 47 element four acid ICP-MS, Total Fe in Concentrates and Total Sulphur (Leco). See Appendix C for detailed ALS Chemex Sample Preparation and Analytical Procedures. Drill core samples taken by the author and Garry Payie, P.Geo. on the Pearson project claim group were not handled or tampered with by anyone. The samples were prepared using standard analytical procedures by ALS Chemex Laboratories in North Vancouver, British Columbia. All pulps are in paid storage after 90 days. ALS Chemex uses the following sample preparation and analytical procedure. The sample is logged in the tracking system, weighed, dried and finely crushed to better than 70% passing a 2 mm (Tyler 10 mesh) screen. A split of up to 250 grams is taken and pulverized to better than 85% passing a 75 micron (Tyler 200 mesh) screen. This method is appropriate for rock chip or drill samples. A prepared sample (0.50 gram) is digested with aqua regia for 45 minutes in a graphite heating block. After cooling, the resulting solution is diluted to 12.5 mL with demineralized water, mixed and analyzed by inductively coupled plasma-atomic emission spectrometry. The analytical results are corrected for inter-element spectral interferences. For the fire assay procedure, a prepared sample is fused with a mixture of lead oxide, sodium carbonate, borax, silica and other reagents as required, inquarted with 6 mg of gold-free silver and then cupelled
49

to yield a precious metal bead. The bead is digested in 0.5 mL dilute nitric acid in the microwave oven, 0.5 mL concentrated hydrochloric acid is then added and the bead is further digested in the microwave at a lower power setting. The digested solution is cooled, diluted to a total volume of 4 mL with demineralized water, and analyzed by atomic absorption spectroscopy against matrix-matched standards. ALS Chemex laboratories in North America are registered to ISO 9001:2000 for the provision of assay and geochemical analytical services. In addition to ISO 9001:2000 registration, ALS Chemex’s North Vancouver laboratory has received ISO 17025 accreditation from the Standards Council of Canada under CAN-P-1579 “Guidelines for Accreditation of Mineral Analysis Testing Laboratories”. CAN-P-1579 is the Amplification and Interpretation of CAN-P-4D “General Requirements for the Accreditation of Calibration and Testing Laboratories” (Standards Council of Canada ISO/IEC 17025). The scope of the accreditation includes the following methods:
- Au and Ag by Fire Assay/Gravimetric Finish - Au by Fire Assay/AAS Finish - Au, Pt, Pd by Fire Assay/ICP Finish - Ag, Cu, Pb, Zn by Aqua Regia Digestion/AAS Finish - Co, Ni by 4-Acid Digestion/AAS - Cu, Ni, Co by Sodium Peroxide Fusion/ICP Finish - Multi-element package by Aqua Regia Digestion/ICP Finish
In the author’s opinion the handling, sample preparation, security and analytical procedures of the drill core samples conform to industry standards. 14.0 DATA VERIFICATION ALS Chemex performs internal quality control by performing routine check analysis on random samples to verify data. The author did not include duplicate and/or blank samples in the shipments sent in for geochemical analysis of core samples. The intent was to identify weak, moderate or strong areas of metallic mineralization and perform follow-up exploration and drilling in the most prospective areas. Generally, the results indicate that the assay data are accurate, precise, free from contamination, and in control. 15.0 ADJACENT PROPERTIES The Bugaboo and Reko deposits occur within the Pearson Project claim group. The author is aware of other adjacent properties to the Bugaboo deposits that contain similar mineralization. Namely, these are the Sirdar located 625 metres southeast of the Conqueror orebody, the Baden Powell located 1.5 kilometres southeast of the Conqueror orebody, and the Rose located 5.7 kilometres southeast of the Conqueror orebody. It is
50

recognized by the author that the Daniel, Conqueror, David, Sirdar, Baden Powell and Rose magnetite showings share the same northwest-southeast trend (Figure 27). The Baden Powell, Sirdar and Rose showings have been described in depth by Young and Uglow in Geological Survey of Canada Economic Geology Report No. 3 (1926). Development reported by Young and Uglow on the Sirdar deposit comprised two shallow trench-like cuts, stripping and a tunnel 31 metres long crosscutting the deposit. The magnetite occurs as a massive deposit almost completely surrounded by quartz diorite porphyry. It has a maximum extension in a northwest direction of 38 metres, a maximum width in a northeast direction of 27 metres, and a proven depth of 15 metres to the level of the tunnel. The deposit may have a general northeasterly dip. A sample of the ore gave the following analysis: iron, 56.57%; insolubles, 8.52%; sulphur, 2.75%; phosphorous, 0.121% (CANMET Report No. 47, page 11). Based on the apparent dimensions of the deposit, Young and Uglow made an estimate of the reserves: proven, 9000 tonnes; probable, 8900 tonnes; and possible, 69,000 tonnes. This resource estimate was calculated prior to the implementation of National Instrument 43-101 and is not compliant with those standards. Development on the Baden Powell deposit consisted of two tunnels, 15 metres apart vertically, and a number of shallow opencuts and strippings. The upper tunnel is 33 metres long, and the lower one is 34 metres long. The Baden Powell orebody is lenticular and outcrops along a northwest trend for about 106 metres. The greatest exposed width is 27 metres and the greatest proven depth is 46 metres. The upper contact of the deposit is against quartz diorite; the dip of the contact is 50 degrees into the hill. The central part of the orebody is high-grade magnetite; the outer edges are mixed with metamorphosed rock and impregnated with pyrite. Based on the apparent dimensions of the deposit, Young and Uglow made an estimate of the reserves: proven, 33,800 tonnes; probable, 56,000 tonnes. This resource estimate was calculated prior to the implementation of National Instrument 43-101 and is not compliant with those standards. A sample of the higher grade part of the deposit graded 59.34% iron, 5.93% insolubles, 2.57% sulphur, 0.012% phosphorous and 1.14% manganese oxide (Geological Survey of Canada Economic Geology Series No. 3, page 185). Two tunnels and a shaft were excavated on the Rose occurrence by 1902 and consisted of a 91-metre shaft with three crosscut drifts at the 30, 61 and 91 metre levels. The upper drift was 12 metres long, and the two lower drifts were 5.5 metres long. One drift was reported to have cut diagonally through 18 metres of ore mixed with country rock. There are at least three exposures of magnetite on the Thorn claim, the largest having a triangular shape measuring 24 by 18 by 12 metres. The smaller masses are vein-like stringers in limestone. At the time of development these properties were controlled by the Gordon River Iron Ore Company. In 2004, a grab sample by Emerald Fields from an exposure of massive magnetite above an old shaft on the Rose showing assayed 61.6% iron. The Rose showing is not part of Emerald Fields claim holdings but the showing is located 1.7 kilometres southeast of the Lorimer showing and along trend with the Bugaboo Creek deposits (Figure 27).
51
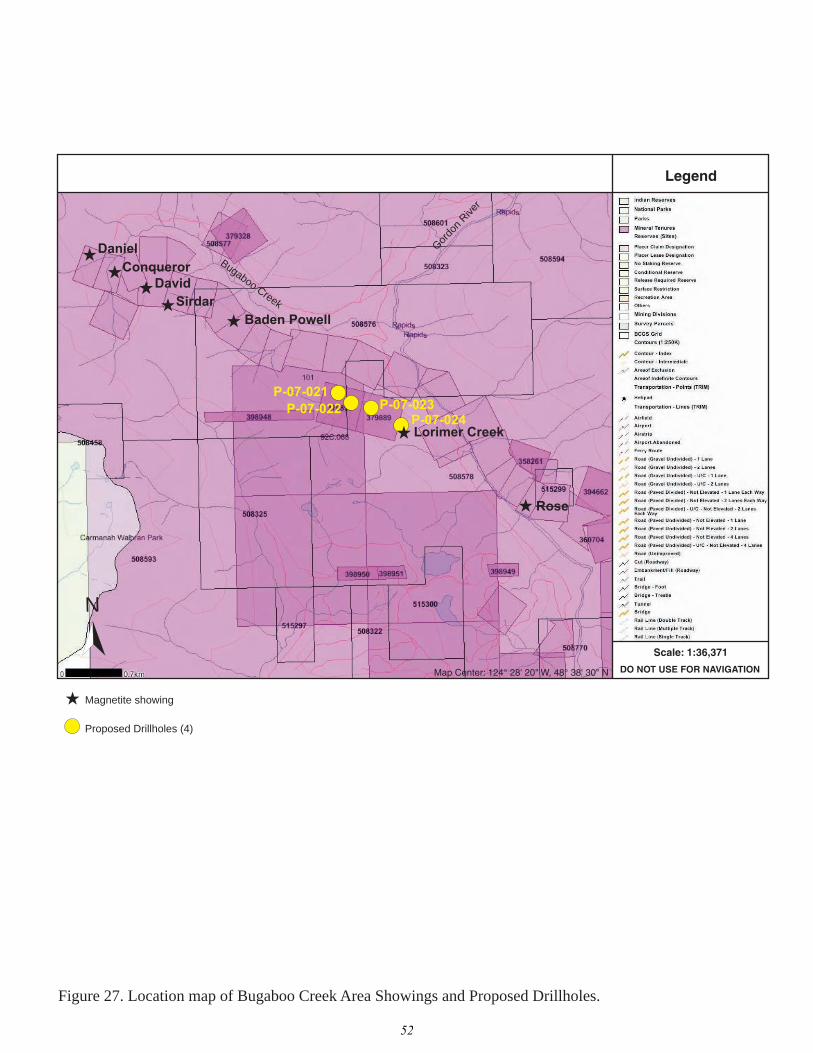
Legend
Scale: 1:36,371
DO NOT USE FOR NAVIGATIONMap Center: 124° 28' 20" W, 48° 38' 30" N
Daniel
Conqueror
David
Sirdar
Baden Powell
Lorimer Creek
Rose
Figure 27. Location map of Bugaboo Creek Area Showings and Proposed Drillholes.
N
BugabooCreek
Gor
don
River
Magnetite showing
Proposed Drillholes (4)
P-07-023P-07-021
P-07-022P-07-024
52
The British Columbia mineral inventory database, MINFILE, lists these showings as 092C 027 (Baden Powell), 092C 025 (Sirdar), and 092C 030 (Rose). Refer to the online MINFILE database at www.minfile.ca. The author of this Technical Report has not verified the information on the Adjacent Properties and that this information is not necessarily indicative of the mineralization on the Pearson Project property. 16.0 MINERAL PROCESSING AND METALLURGICAL TESTING In 1960, laboratory tests were performed on a sample from the Conqueror orebody between May 4-9, 1960 at the Noranda Concentrator Experimental Laboratory. The results are documented by H.L. Ames, Concentrator Superintendent and W. Hrynewich, Metallurgist in a report dated May 19, 1960 and forms part of the final Noranda report by Menzies and Nicolls. That portion of the report is reproduced below. A 27-kilogram sample representative of normal ore where weighted 1000-gram samples were prepared from this material for testing purposes. Head analyses was performed on a 500-gram composite that was ground and yielded 53.8% iron, 2.3% sulphur, 10.4% SiO2, 0.019% phosphorus and no detectable arsenic. Magnetic separation was done on 1000-gram lots utilizing three stages in a very weak magnetic field. The ore was crushed to pass 4 mesh (0.185") in this case. Results from the testing state that crushing a little finer than the proposed minus ¼-inch is indicated to affect high iron recovery. With ore passing 3 mesh (0.263"), a 57.3% recovery of iron at 63.2% grade was realized. With ore passing 4 mesh (0.185"), iron recovery was 88.4% at a 64.6% grade. Upgrading and recovery of iron is not difficult and will be influenced by ore fineness. Due to dilution by gangue the initial sulphur content of the ore was lower than the 3% maximum permissible in the shipping product. However, there was no concentration of sulphur in the concentrate, indicating that sulphides are effectively rejected in a very weak magnetic field. The author of this Technical Report not aware of any metallurgical problems that would adversely affect development of the Bugaboo iron deposits. 17.0 MINERAL RESOURCE AND MINERAL RESERVE ESTIMATES In 1960, Noranda Exploration Company, Limited completed diamond drilling to confirm and expand ore reserves and grades indicated by earlier work to justify a mining operation and forms part of a report titled ‘Final Report for 1960 on the Port Renfrew Iron Property’ by M.M. Menzies and O.W. Nicolls. This work was performed on the Daniel and Conqueror orebodies in the Bugaboo Creek area of the Pearson Project claims. The report based its resource estimates on diamond drilling, analysis and sampling of core and calculations of ore and waste, performed between 1957 and 1960.
53

The Daniel and Conqueror deposits were estimated to contain indicated and inferred mineral resources of magnetite mineralization. The Daniel deposit contains an indicated mineral resource of 1,537,534 tonnes at an average grade of 55.67% iron and 3.61% sulphur, and an inferred mineral resource of 508,883 tonnes with no grade given. The Conqueror deposit contains an indicated mineral resource of 1,069,471 tonnes at an average grade of 54.31% iron and 2.21% sulphur, and an inferred mineral resource totalling 1,252,115 tonnes with no grade given. All resource data was converted from Imperial short tons to metric tonnes by multiplying by the factor 0.9071. Between 1971-73, Reako Explorations Ltd. conducted diamond drilling on five magnetite showings in the Renfrew Creek area and are referred to as the Reko deposits and is documented in Assessment Report 5029 by R.L. Roscoe (1973). Roscoe has estimated 1,111,242 tonnes of ore without specifying grades in five zones (see Section 9.0). All resource data was converted from Imperial short tons to metric tonnes by multiplying by the factor 0.9071. Data verification on historic drilling campaigns at the Bugaboo and Reko deposits has not been possible due to a lack of quality assurance data and by a lack of archived core. Emerald Fields Resource Corporation has not been able to obtain enough of the original data and has not done the work necessary to verify the classification of a mineral resource or reserve and is not treating the historical estimates as compliant with Sections 1.3 and 1.4 of National Instrument 43-101. 18.0 OTHER RELEVANT DATA AND INFORMATION Previous diamond drilling by Noranda between 1957 and 1960 on the Daniel and Conqueror deposits culminated in 31 holes on the Conqueror deposit and 30 holes on the Daniel. A survey control grid had also been established during this time (Menzies and Nicolls, 1960). There are no maps in the report that show the location of the grid or drillholes. A sketch map roughly indicates the deposit outline relative to Reverted Crown grant claim boundaries. During the spring 2005 drill program by Emerald Fields Resource Corporation the author of this Technical Report was able to ascertain that evidence of the Noranda control grid no longer exists because the area has been logged. Some drill casing was found in place along Bugaboo Creek and drill core was also located from the 1957 to 1960 drill programs. The drill core storage rack is collapsed and core and core boxes are dislodged. The core boxes are still identifiable by metal tags. The Noranda report contains simplified drill logs with location coordinates based on the control grid (feet), azimuth and dips of holes, elevation (feet), depth of holes (feet), depth of overburden and magnetite mineralization intersections (feet). The drillhole data was input into drillhole plotting software to generate a 3D projection map showing magnetite intersections (Figure 28).
54

4500 E
4500 E
4750 E
4750 E
5000 E
5000 E
5250 E
5250 E
5500 E
5500 E
5750 E
5750 E
6000 E
6000 E
6250 E
6250 E
6500 E
6500 E
6750 E
6750 E
3500
N35
00 N
3750
N
3750
N
4000
N
4000
N
4250
N
4250
N
4500
N
4500
N
4750
N
4750
N
5000
N
5000
N
5250
N
5250
N
5500
N
5500
N
5750
N
5750
N60
00 N
6000
N
900 Elev900 Elev
1000 Elev1000 Elev
1100 Elev1100 Elev
1200 Elev1200 Elev
1300 Elev1300 Elev
1400 Elev1400 Elev
1500 Elev1500 Elev
1600 Elev1600 Elev 3d Projection
Bugaboo Creek Deposits - Daniel and Conqueror
Scale 1:10000 Date: 17/06/05 Drafted by: DGM
Daniel Deposit
Conqueror Deposit
Figure 28. 3D Projection of Noranda drillholes (1957-60). This map is used to only reference the location of the Daniel and Conqueror deposits relative to one another. The distance separating the deposits (in feet) was translated into metric using the feet to metric conversion factor of 0.3048. The distance between the two deposits was then used in conjunction with their locations from the sketch map in the Noranda report and it confirmed that the deposit locations in the Noranda sketch map are relatively accurate. This information as well as exploration magnetic survey lines and bedrock geology was then used to locate the two drillholes in this area for part of the 2005 drill program. Results from these two holes confirmed the deposit locations and their relative distance from one to another (Figure 6). 19.0 INTERPRETATION AND CONCLUSIONS The Pearson Project claim group hosts significant high-grade iron deposits which have excellent potential for expansion. The Bugaboo and Reko area magnetite orebodies, and adjoining areas, are the focus of future exploration and development. Known and newly discovered magnetite showings, and airborne magnetic anomalies identified from the 2006 survey are the focus of proposed additional exploration and drilling to determine their economic viability. In particular, the Daniel and Conqueror orebodies (Bugaboo) warrant a more systematic evaluation of the dimensions and strike continuity of the
55
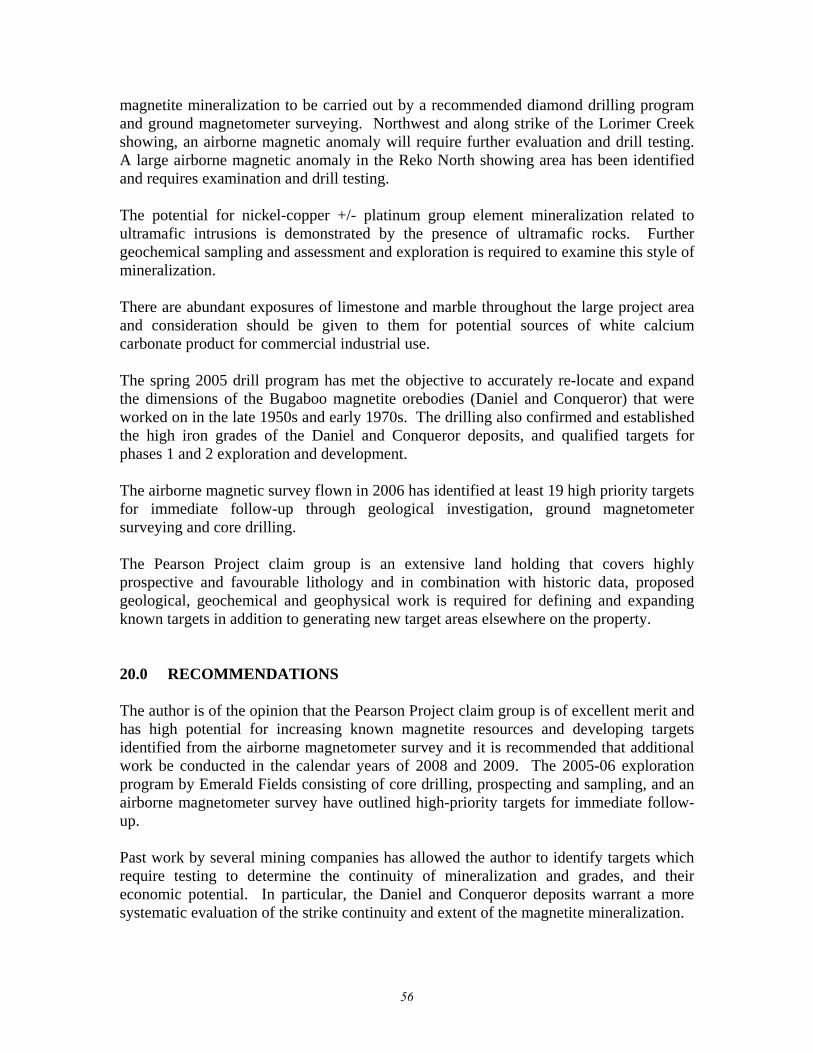
magnetite mineralization to be carried out by a recommended diamond drilling program and ground magnetometer surveying. Northwest and along strike of the Lorimer Creek showing, an airborne magnetic anomaly will require further evaluation and drill testing. A large airborne magnetic anomaly in the Reko North showing area has been identified and requires examination and drill testing. The potential for nickel-copper +/- platinum group element mineralization related to ultramafic intrusions is demonstrated by the presence of ultramafic rocks. Further geochemical sampling and assessment and exploration is required to examine this style of mineralization. There are abundant exposures of limestone and marble throughout the large project area and consideration should be given to them for potential sources of white calcium carbonate product for commercial industrial use. The spring 2005 drill program has met the objective to accurately re-locate and expand the dimensions of the Bugaboo magnetite orebodies (Daniel and Conqueror) that were worked on in the late 1950s and early 1970s. The drilling also confirmed and established the high iron grades of the Daniel and Conqueror deposits, and qualified targets for phases 1 and 2 exploration and development. The airborne magnetic survey flown in 2006 has identified at least 19 high priority targets for immediate follow-up through geological investigation, ground magnetometer surveying and core drilling. The Pearson Project claim group is an extensive land holding that covers highly prospective and favourable lithology and in combination with historic data, proposed geological, geochemical and geophysical work is required for defining and expanding known targets in addition to generating new target areas elsewhere on the property. 20.0 RECOMMENDATIONS The author is of the opinion that the Pearson Project claim group is of excellent merit and has high potential for increasing known magnetite resources and developing targets identified from the airborne magnetometer survey and it is recommended that additional work be conducted in the calendar years of 2008 and 2009. The 2005-06 exploration program by Emerald Fields consisting of core drilling, prospecting and sampling, and an airborne magnetometer survey have outlined high-priority targets for immediate follow-up. Past work by several mining companies has allowed the author to identify targets which require testing to determine the continuity of mineralization and grades, and their economic potential. In particular, the Daniel and Conqueror deposits warrant a more systematic evaluation of the strike continuity and extent of the magnetite mineralization.
56

Drill testing airborne magnetic anomalies resultant from the 2006 survey is required in the Lorimer Creek and Reko North showings area. Further geochemical analysis and sampling is warranted to further examine the potential of nickel-copper +/- platinum group element mineralization related to the presence of ultramafic rocks. Based on the high potential for discovery of additional magnetite mineralization and expanding and extending the dimensions of known deposits over favourable stratigraphy, a program of geological mapping, geochemical sampling, ground and airborne magnetometer surveying, and core drilling is recommended. The proposed program will cost approximately C$ 2.5 million to implement. PROPOSED PROGRAM Geological mapping, geochemical sampling, airborne and ground geophysics, and core drilling is recommended for the Pearson Project claim group. Approximately 3000 line kilometres of airborne magnetic survey is necessary to cover the Pearson Project claim group and additional contiguous claim holdings of Emerald Fields; about 1900 line kilometres of airborne survey was completed in 2006. Ground magnetometer surveying is recommended on prospective areas identified, and to further delineate airborne magnetic anomalies where necessary. Approximately 700 metres of diamond drilling in seven holes were completed in 2005 to locate the Daniel, Conqueror and Reko magnetite bodies, and to test for commercial grade limestone. Diamond drilling amounting to 8000 metres in 30 holes is recommended to test, expand and define dimensions of the Daniel, Conqueror and David magnetite deposits (Figure 6), and test newly discovered zones and airborne magnetic anomalies at the Reko North and Lorimer Creek showings (Figures 9 and 27). Continued geological mapping and sampling is also recommended to follow-up on the potential for nickel-copper +/- platinum group element mineralization in ultramafic rocks. Refer to Figures 6, 9 and 27 and Table 4 for location and listing of proposed drillholes.
57

TABLE 4. PROPOSED DRILLHOLES
Total drillholes – 24 Total metreage – 8000
Drillhole Location Azimuth (degrees)
Dip (degrees)
Core Size
Depth (m)
Figure(s) Reference
P-07-001 Daniel/Conqueror - -90 NQ 325 6 This report
P-07-002 Daniel/Conqueror - -90 NQ 325 6 This report
P-07-003 Daniel/Conqueror - -90 NQ 325 6 This report
P-07-004 Daniel/Conqueror - -90 NQ 325 6 This report
P-07-005 Daniel/Conqueror - -90 NQ 325 6 This report
P-07-006 Daniel/Conqueror - -90 NQ 325 6 This report
P-07-007 Daniel/Conqueror - -90 NQ 325 6 This report
P-07-008 Daniel/Conqueror - -90 NQ 325 6 This report
P-07-009 Daniel/Conqueror - -90 NQ 325 6 This report
P-07-010 Daniel/Conqueror - -90 NQ 325 6 This report
P-07-011 Daniel/Conqueror - -90 NQ 325 6 This report
P-07-012 Daniel/Conqueror - -90 NQ 325 6 This report
P-07-013 Daniel/Conqueror - -90 NQ 325 6 This report
P-07-014 Daniel/Conqueror - -90 NQ 325 6 This report
P-07-015 David - -90 NQ 325 6 This report
P-07-016 David - -90 NQ 325 6 This report
P-07-017 Reko North 270 -60 NQ 400 9 This report
P-07-018 Reko North 270 -60 NQ 400 9 This report
P-07-019 Reko North 270 -60 NQ 400 9 This report
P-07-020 Reko North 270 -60 NQ 400 9 This report
P-07-021 Lorimer Creek area - -90 NQ 300 27 This report
P-07-022 Lorimer Creek area - -90 NQ 300 27 This report
P-07-023 Lorimer Creek area - -90 NQ 300 27 This report
P-07-024 Lorimer Creek area - -90 NQ 300 27 This report
58

PROPOSED BUDGET Item Description Amount (Cdn$) Personnel: Geologists (x2) 150 days x $575/day 86,250 150 days x $575/day 86,250 Equipment, saws, field supplies 9500 Drilling, includes road 8000 metres @ $175/metre 1,400,000 work, site preparation and related costs Accommodation, food, travel 300 man-days 75,000 fuel, rental vehicle, etc. Airborne magnetometer survey 3000 line km @ $100/km 300,000 Ground magnetometer survey 300 line kilometres @ $250/km 75,000 Analytical - core and rock 5200 samples @ $40/sample 208,000 samples Communication – telephone, 10,000 fax, mobile/satellite phone Report and drafting 25,000 Contingency (~10%) 225,000 Total 2,500,000 Total = $ 2,500,000 TOTAL = $ 2,500,000 In the author’s opinion, the proposed recommendations are warranted as outlined, and should be completed within the calendar years of 2008 and 2009.
59

21.0 REFERENCES CANMET Report 47, Iron Ore Deposits of Vancouver and Texada Islands, British Columbia, Natural Resources Canada, page 11.
Eastwood, G.E.P. (1974): Reko Property Description; British Columbia Ministry of Energy, Mines and Petroleum Resources, Geology, Exploration and Mining in British Columbia, pp. 166-170.
Eastwood, G.E.P. (1977): Notes, maps and sketches; British Columbia Ministry of Energy, Mines and Petroleum Resources Library, Property File – 092C 090.
George Cross News Letter (1972-73, 1975): No. 147,235, 1972, No. 20,21,26,43,69,117,143,148,212, 1973, No. 207, 1975; British Columbia Ministry of Energy, Mines and Petroleum Resources Library, Property File - 092C 090.
Larocque, J. and Canil, D. (2007): Ultramafic Rock Occurrences in the Jurassic Bonanza Arc near Port Renfrew (NTS 092C/09, 10, 15, 16), Southern Vancouver Island; in Geological Fieldwork 2006, British Columbia Ministry of Energy, Mines and Petroleum Resources, Paper 2007-1, pages 319-324.
McKinley, S. (2003): Geological Description of Port Renfrew, B.C. Ni-PGE Property; British Columbia Ministry of Energy, Mines and Petroleum Resources Library, Property File – 092C 025.
McKinley, S. and Gilmour, W.R. (2003a): Geological, Geochemical and Geophysical Assessment Report on the Pearson Property; British Columbia Ministry of Energy, Mines and Petroleum Resources, Assessment Report 27246, 136 pp.
McKinley, S. and Gilmour, W.R. (2003b): Geochemical Report on the Karen Property; British Columbia Ministry of Energy, Mines and Petroleum Resources, Assessment Report 27280, 136 pp.
Menzies, M.M. and Nicolls, O.W. (1960): Final Report for 1960 on the Port Renfrew Iron Property, Noranda Exploration Company, Limited and International Iron Mines Ltd.; British Columbia Ministry of Energy, Mines and Petroleum Resources Library, Property File - 092C 022.
Mowat, A. (2004): Diamond Drill and Geological Assessment Report; British Columbia Ministry of Energy, Mines and Petroleum Resources, Assessment Report 27517, 101 pp.
Muller, J.E. (1982): Geology, Nitinat Lake, British Columbia, Map and Notes; Geological Survey of Canada, Open File 821, scale 1:250 000.
Newman, T.E. (1999): White Limestone Deposit, Port Renfrew, B.C.; British Columbia Ministry of Energy, Mines and Petroleum Resources, Assessment Report 25877, 13 pp.
Ray, G.E. (1995): Fe Skarns, in Selected British Columbia Mineral Deposit Profiles, Volume 1 - Metallics and Coal, Lefebure, D.V. and Ray, G.E., Editors; British Columbia Ministry of Employment and Investment, Open File 1995-20, pages 63-65.
Roscoe, R.L. (1972): Report on the Renfrew Creek Claim Group, Port San Juan Area, January 21, 1972 in Prospectus, Reako Explorations Ltd., April 12 1972; British Columbia Ministry of Energy, Mines and Petroleum Resources Library, Property File – 092C 091.
Roscoe, R.L. (1973): Diamond Drilling Report on the Reko 38, Granite Creek, Port Renfrew Area; British Columbia Ministry of Energy, Mines and Petroleum Resources, Assessment Report 5029, 32 pp.
Sumara, M. (2006): Review of Aeromagnetic Data over the Pearson Property, Appendix A this report.
Tavela, M. (1980): Report on Exploration Ebb Claims; British Columbia Ministry of Energy, Mines and Petroleum Resources, Assessment Report 8278, 39 pp.
Young, G.A. and Uglow, W.L. (1926): The Iron Ores of Canada, Volume 1, British Columbia and Yukon; Geological Survey of Canada, Economic Geology Series No.3, pp. 167-191.
60

22.0 DATE AND SIGNATURE PAGE This report titled “Technical Report – Geological Summary, Pearson Project, British Columbia” dated October 31, 2007 and revised March 11, 2008 was prepared and signed by the author, George Owsiacki, P.Geo. DATED at Victoria, British Columbia this 11th day of March 2008.
George Owsiacki, P.Geo.
61

23.0 CERTIFICATE OF AUTHOR
I, GEORGE OWSIACKI, P.Geo., Consulting Geologist, with a business address at 1350 Kristine Rae Lane, Victoria, British Columbia V8Z 7L1, DO HEREBY CERTIFY THAT: 1. I graduated with an Honours Bachelor of Science degree in Geology from Queen’s University, Kingston, Ontario in 1981.
2. I am registered as a Professional Geoscientist (License No. 18309) with the Association of Professional Engineers and Geoscientists of the Province of British Columbia.
3. I have practiced my profession as a geologist, both within government and the private sector, in eastern and western Canada for more than 27 years. Work has included detailed geological investigations of mineral districts, examination and reporting on a broad spectrum of mineral prospects and producing mines, supervision of mineral exploration projects and comprehensive mineral property evaluations.
4. I have read the definition of “Qualified Person” set out in National Instrument 43-101 (“NI 43-101”) and certify that by reason of my education, affiliation with a professional association (as defined in NI 43-101) and past relevant work experience, I fulfill the requirements to be a “Qualified Person” for the purposes of NI 43-101.
5. I am responsible for all sections of the technical report titled Technical Report – Geological Summary, Pearson Project, British Columbia dated October 31, 2007 and revised March 11, 2008 (the “Technical Report”). I visited the property from April to June, 2005.
6. I am not aware of any material fact or material change with respect to the subject matter of the Technical Report that is not reflected in the Technical Report, the omission to disclose of which makes the Technical Report misleading. The sources of all information not based on my personal examination are referenced in the report.
7. I am independent of the issuer applying the tests set out in section 1.4 of National Instrument 43-101.
8. I have not had prior involvement with the property that is the subject of the Technical Report.
9. I have read National Instrument 43-101 and Form 43-101F1, and the Technical Report has been prepared in compliance with that instrument and form.
10. I consent to the filing of the Technical Report with any stock exchange and other regulatory authority and any publication by them, including electronic publication in the public company files on their websites accessible by the public, of the Technical Report. Dated this 11th day of March 2008.
George Owsiacki, P.Geo.
62

24.0 ADDITIONAL REQUIREMENTS FOR TECHNICAL REPORTS ON DEVELOPMENT PROPERTIES AND PRODUCTION PROPERTIES No other data or information are relevant for this report.
63

APPENDIX A
REVIEW OF AEROMAGNETIC DATA OVER THE PEARSON PROPERTY, REPORT BY M. SUMARA, AUGUST 25TH, 2006

REVIEW
OF
AEROMAGNETIC DATA
OVER THE
PEARSON PROPERTY
ON BEHALF OF
EMERALD FIELDS RESOURCE CORPORATION
REPORT BY MONIKA SUMARA
August 25th, 2006

Monika Sumara 1303, 933 Seymour Street Vancouver, British Columbia V6B 6L6 Tel: 604.737.1371 Fax: 604.689.8199

Pearson Project - Emerald Fields Resource Corporation Aeromagnetic Interpretation Report
Table of Contents
INTRODUCTION ..............................................................................................................................4
MAGNETIC SURVEY.......................................................................................................................4 Survey Specification..................................................................................................................4 Altitude.......................................................................................................................................4 Magnetic Noise..........................................................................................................................4
SURVEY LOCATION .......................................................................................................................4
MAGNETIC MAPS ...........................................................................................................................5
DATA PROCESSING AND PRESENTATION ................................................................................5
DISCUSSION AND RECOMMENDATIONS....................................................................................6 Anomaly P1 ...............................................................................................................................6 Anomaly P2 ...............................................................................................................................7 Anomaly P4 ...............................................................................................................................8 Anomaly P9 ...............................................................................................................................9 Anomaly P12 ...........................................................................................................................10 Anomaly P13 ...........................................................................................................................11
FOLLOW-UP CONSIDERATIONS ................................................................................................12
APPENDIX A – geophysical images and figures.......................................................................13
STATEMENT OF QUALIFICATIONS ............................................................................................26

Pearson Project - Emerald Fields Resource Corporation Aeromagnetic Interpretation Report INTRODUCTION This report describes the data obtained from the airborne magnetometer survey as pertaining to the geology of the Pearson claim block for Emerald Field Resource Corporation on Southwestern Vancouver Island, BC. In June 2006, Fugro was contracted to fly a low altitude, magnetometer survey with their helicopter based, stinger mounted single sensor system over the key area of interest on the Pearson property. MAGNETIC SURVEY Survey Specification The helicopter based magnetometer survey was flown by Fugro and was completed over a period spanning between Jun 12, 2006 and June 20, 2006. The grid measured 22km by 7km and consisted of N-S lines at 100m spacing and E-W tie lines at 500m spacing for a total distance of 1972 line kilometers. Altitude Altitude control was accomplished via onboard helicopter altimeter. The target elevation of 60m average altitude was achieved with a mean variation of 15m. This was deemed acceptable for the rugged terrain of the southern part of Vancouver Island. Magnetic Noise A fourth difference filter was applied to the diurnally corrected data to inspect the level of noise. The noise envelope was at an acceptable level well below 0.1nT, and overall the magnetic data was very clean. SURVEY LOCATION The 2006 Aeromagnetic survey was flown over a portion of the Pearson claim block located on SW Vancouver Island, BC, as seen on the map bellow.

Pearson Project - Emerald Fields Resource Corporation Aeromagnetic Interpretation Report
5
MAGNETIC MAPS A total magnetic field map was made over the entire survey area and contoured at an interval of 100nT. Also provided are the vertical derivative and the analytic signal grids showing the locations of historical drillholes and mineral showings. Where magnetic anomalies of interest were noted, further zoomed images of the area of interest were created. These maps and figures are included as an appendix to this report. DATA PROCESSING AND PRESENTATION All data was collected and processed in the NAD 83, Zone 10 projection. A standard sequence of geophysical processing was applied to the aeromagnetic data as described in the steps below. The aeromagnetic data was gridded using the bi-directional method with a 25m cell size, and a Total Magnetic Field image was created. In addition, two other grids were created which included the Vertical Derivative and Analytics Signal in order to investigate the magnetic characteristics of the geology in this area. The Vertical Derivative is commonly applied to total magnetic field data to enhance the shallowest geological sources. Isolating short wavelength magnetic features enhances the response of near surface features at the expense of deeper sources and provides a more direct correlation between magnetic anomalies and geological map units. The Analytic Signal grid is a valuable geophysical interpretation tool in locating the edges of magnetic source bodies, particularly where remanence complicates interpretation. The analytic signal is the square root of the sum of the squares of the derivatives in the x, y, and z directions. Diurnal Corrections Basemag readings were carried out by Fugro as was the diurnal correction of the raw data. Lag Correction A lag shift of -5 fiducial was used in the lag correction. Heading Correction Heading corrections were performed by the survey data acquisition system as part of the aircraft compensation system. The correction parameters were determined by a heading test flight at the start of the survey. Statistical Leveling of Total Magnetic Field A statistical leveling of the magnetic data was done first on the tie lines, and then a full level was done on all lines. A least-squares trend line was calculated through an error channel to derive a trend error curve, which was then added to the channel to be leveled. The trend curve was then saved for later inspection.

Pearson Project - Emerald Fields Resource Corporation Aeromagnetic Interpretation Report
6
DISCUSSION AND RECOMMENDATIONS The detailed 2006 aeromagnetic data reveals a great deal of structural variety as compared to the widespread high level magnetic response visible on a regional scale. The geology consists mainly of the metamorphic Westcoast Complex which includes: gneiss, amphibolite, migmatite, and quartz diorite. These Paleozoic and Mesozoic age rocks are characterized by a moderately strong magnetic response, with NW trending, linear, magnetically low structures. The prominent geological features within the survey area are the two groups of intrusive rocks which consist of the early to middle Jurassic Island Plutonic Suite and are signified by a higher magnetic domain. The geological map, MINFILE Occurrence MAP 092C, Cape Flattery, Ministry of Energy, Mines and Petroleum Resources, BC, was used in the geophysical interpretation. A compilation of anomalies throughout the survey block is summarized in Table 1 of the Appendix. The interpreted anomalies were analyzed and prioritized based on signal strength, structure, size as well as any evidence of mineral showings or drillhole results. The information provided by the magnetics suggests six significant anomalies of interest, however, further geological follow-up and investigation is strongly recommended, particularly over anomalies where there is only magnetic data available. Anomaly P1 The western section of the survey area includes the Daniel, Conqueror and David drillholes as well as a number of mineral showings and magnetite outcrops potentially associated with skarns formed as volcanics of the Island Suite intruded into overlying carbonates. The structure that hosts all three drillholes has the strongest magnetic response (anomaly P1) of the survey block at a magnitude of approximately 2500nT. This is a very broad and intense response that would be characteristic of an intrabasement source of the anomaly. The size and shape of the profiles suggest that this source is a near vertical dike (Figure 7 in the Appendix) however, it is possible that there is more than one source of the signal (ie. two or more magnetic bodies overlaying each other) which would affect the profiles.
Figure 1: Anomaly P1 Image Under the assumption that the anomaly is caused by vertical contacts, the analytic signal can be used to estimate depth (using an amplitude half-width rule) which would give a value of approximately 160m for

Pearson Project - Emerald Fields Resource Corporation Aeromagnetic Interpretation Report
7
anomaly P1. The anomaly itself appears to be 2500m in length by 700m in width at its widest point. There appears to be a contact zone to the NE of this anomaly which is marked by a sharp change in amplitude and as well as a change in magnetic texture. Anomaly P2 Anomaly P2 is an elongate, NW trending mag high that measure roughly 1900m in length by 900m at its widest point. It is roughly located between the Baden Powell showing and the Lorimer Creek magnetite outcrop. The depth to the source is estimated to be 200m. Given the strength of the signal of this anomaly and the fact that it falls in line with the structure that holds the P1 anomaly it merits further exploration in the way of geological investigation. The structure between anomalies P1 and P2 may well be linked.
Figure 2: Anomaly P2 Image
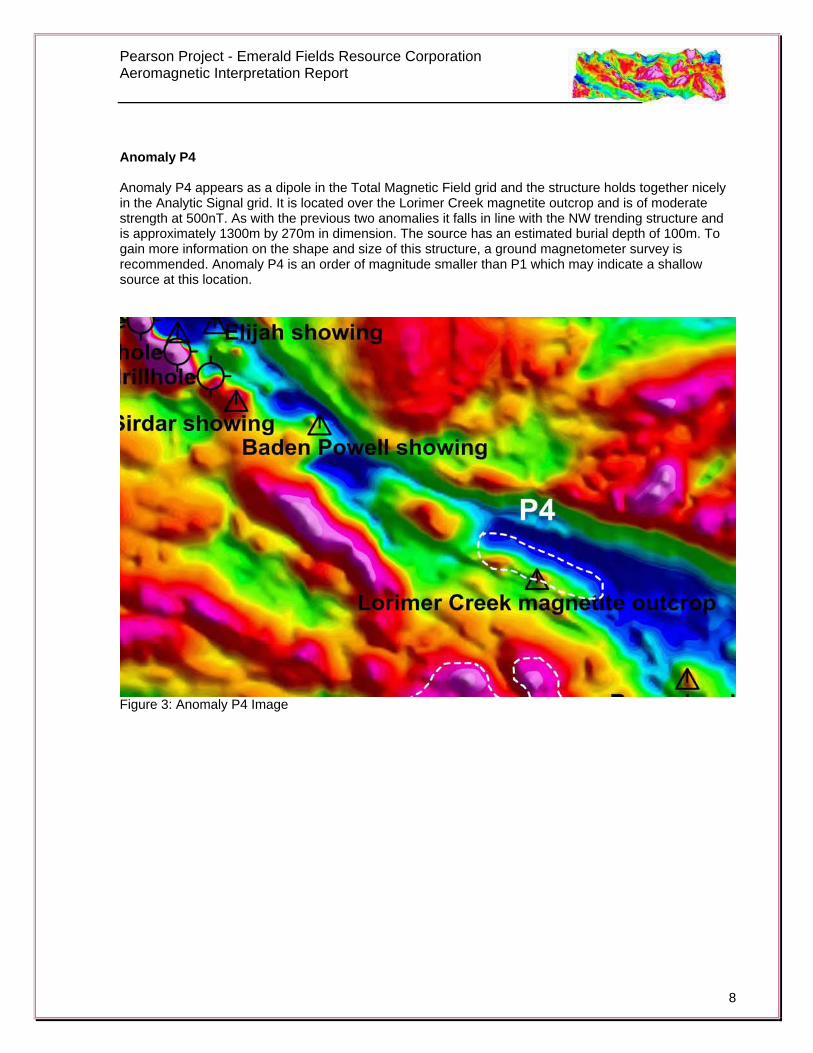
Pearson Project - Emerald Fields Resource Corporation Aeromagnetic Interpretation Report
8
Anomaly P4 Anomaly P4 appears as a dipole in the Total Magnetic Field grid and the structure holds together nicely in the Analytic Signal grid. It is located over the Lorimer Creek magnetite outcrop and is of moderate strength at 500nT. As with the previous two anomalies it falls in line with the NW trending structure and is approximately 1300m by 270m in dimension. The source has an estimated burial depth of 100m. To gain more information on the shape and size of this structure, a ground magnetometer survey is recommended. Anomaly P4 is an order of magnitude smaller than P1 which may indicate a shallow source at this location.
Figure 3: Anomaly P4 Image

Pearson Project - Emerald Fields Resource Corporation Aeromagnetic Interpretation Report
9
Anomaly P9 Anomaly P9 is located in the central region of the survey area along a larger magnetic high that trends NW. At 1500nT it is the strongest anomaly this central region and it measures approximately 2000m in length by 500m in width. Further geological recon is recommended to ascertain the source of this signal which is estimated to have a burial depth of approximately 170m.
Figure 4: Anomaly P9 Image
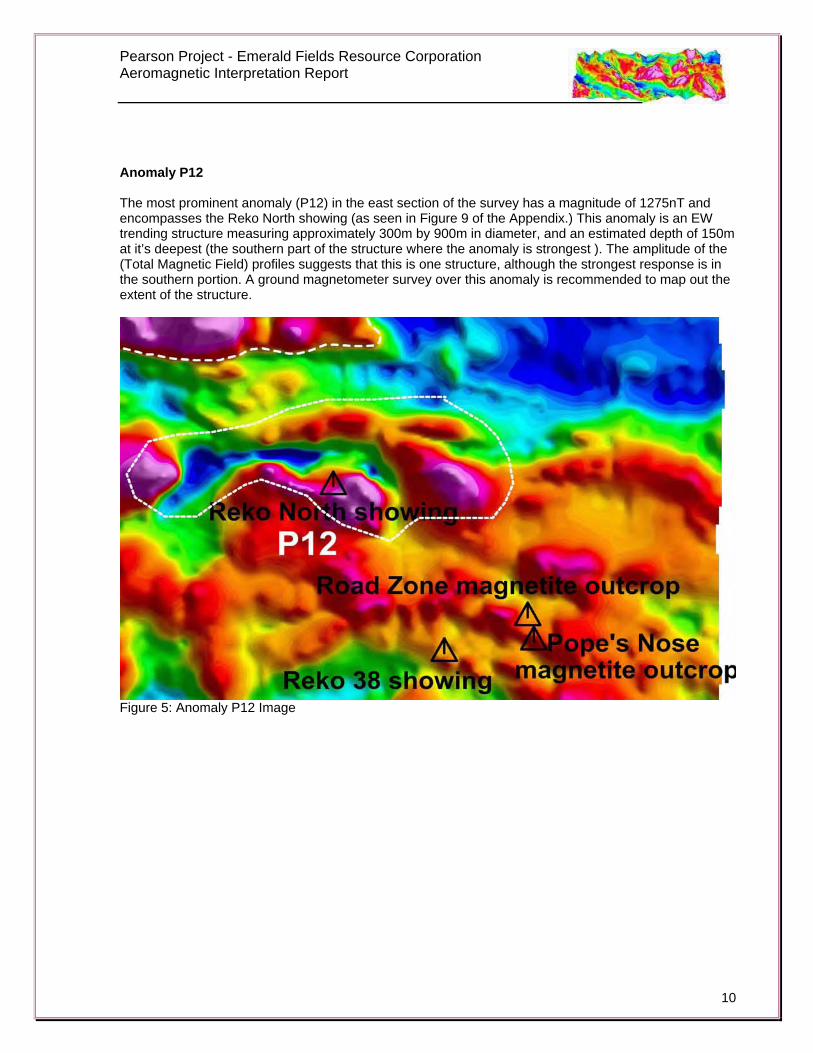
Pearson Project - Emerald Fields Resource Corporation Aeromagnetic Interpretation Report
10
Anomaly P12 The most prominent anomaly (P12) in the east section of the survey has a magnitude of 1275nT and encompasses the Reko North showing (as seen in Figure 9 of the Appendix.) This anomaly is an EW trending structure measuring approximately 300m by 900m in diameter, and an estimated depth of 150m at it’s deepest (the southern part of the structure where the anomaly is strongest ). The amplitude of the (Total Magnetic Field) profiles suggests that this is one structure, although the strongest response is in the southern portion. A ground magnetometer survey over this anomaly is recommended to map out the extent of the structure.
Figure 5: Anomaly P12 Image

Pearson Project - Emerald Fields Resource Corporation Aeromagnetic Interpretation Report
11
Anomaly P13 Anomaly P13 is located at the NE end of the survey block and has a very strong response at 1400nT. It’s approximately 3000m by 830m in dimension and trends NW though not as strongly as the previous anomalies. Based on the large size and strength of the magnetic response, this anomaly merits further exploration. EM and geological recon are recommended.
Figure 6: Anomaly P13 Image The source of the other mineral showings in the eastern section of the survey including the Road Zone magnetite outcrop, Pope's Nose Zone magnetite outcrop, Reko 38 showing and Reko 10 magnetite outcrop, do not appear to have very deep sources as shown in the vertical derivative and analytic signal grids, and therefore show less potential as economic ore bodies.

Pearson Project - Emerald Fields Resource Corporation Aeromagnetic Interpretation Report
12
FOLLOW-UP CONSIDERATIONS For anomalies at both the east and west end of the 2006 survey block, follow up investigation should include a high resolution, horizontal loop electromagnetic HLEM survey to detect and map out any associated conductivity and define further the geological structure. For the eastern section of the property in particular, gravity surveying as well as further geological mapping would be beneficial in delineating the structure of the area. The West Zone is significantly more promising a target compared to the East Zone due to the size and depth of the potential structure. Ground magnetics should be conducted at all high priority anomaly locations to pin-point potential drill targets. The 2006 aeromagnetic survey offers a detailed insight into the geological structure of the area and positive enforcement as to the presence of a large iron bearing structure. And as this survey covers just a portion of the Emerald Field claims on Southern Vancouver Island, it leaves much for future exploration and potential development.
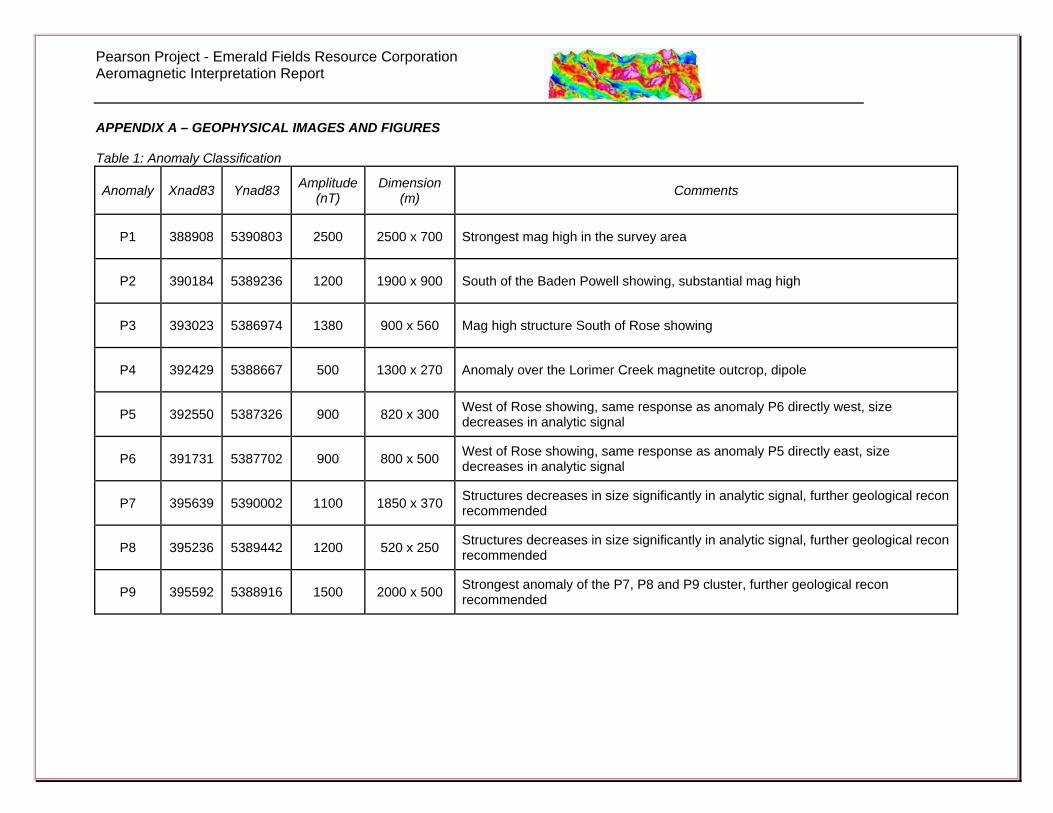
Pearson Project - Emerald Fields Resource Corporation Aeromagnetic Interpretation Report APPENDIX A – GEOPHYSICAL IMAGES AND FIGURES Table 1: Anomaly Classification
Anomaly Xnad83 Ynad83 Amplitude (nT)
Dimension (m) Comments
P1 388908 5390803 2500 2500 x 700 Strongest mag high in the survey area
P2 390184 5389236 1200 1900 x 900 South of the Baden Powell showing, substantial mag high
P3 393023 5386974 1380 900 x 560 Mag high structure South of Rose showing
P4 392429 5388667 500 1300 x 270 Anomaly over the Lorimer Creek magnetite outcrop, dipole
P5 392550 5387326 900 820 x 300 West of Rose showing, same response as anomaly P6 directly west, size decreases in analytic signal
P6 391731 5387702 900 800 x 500 West of Rose showing, same response as anomaly P5 directly east, size decreases in analytic signal
P7 395639 5390002 1100 1850 x 370 Structures decreases in size significantly in analytic signal, further geological recon recommended
P8 395236 5389442 1200 520 x 250 Structures decreases in size significantly in analytic signal, further geological recon recommended
P9 395592 5388916 1500 2000 x 500 Strongest anomaly of the P7, P8 and P9 cluster, further geological recon recommended

Pearson Project - Emerald Fields Resource Corporation Aeromagnetic Interpretation Report
P10 384366 5392158 900 900 x 350 Smagll mag high at the far western end of the survey block, further geological recon recommended
P11 385649 5387371 700 980 x 300 Moderate mag high in the southwestern corner of the survey block, requires further geological recon
P12 402919 5391192 1275 3100 x 900 large E-W trending structure that encompasses Reko North showing
P13 401507 5392669 1400 3000 x 830 large E-W trending structure, strong mag high, requires further geological recon
P14 399722 5390962 900 1660 x 730 Moderate mag high, analytic signal indicates the source is many small parts rather than one large structure
P15 399843 5387885 1600 1880 x 1300 Strong anomaly, further geological recon recommended
P16 403327 5386898 1300 2700 x 1200 Broad anomaly, analytic signal indicates the source is many small parts rather than one large structure
P17 400592 5390486 700 1130 x 500 Moderate mag high, N-E trending structure, further geological recon recommended
P18 395115 5387159 900 770 x 340 Moderage mag high southeast of Rose showing, further geological recon recommended
P19 396947 5386722 500 1100 x 440 S-E trending mag high further geological recon recommended
14

Pearson Project - Emerald Fields Resource Corporation Aeromagnetic Interpretation Report
15
Figure 7: Summary Anomaly Map of 2006 Aeromagnetic Survey
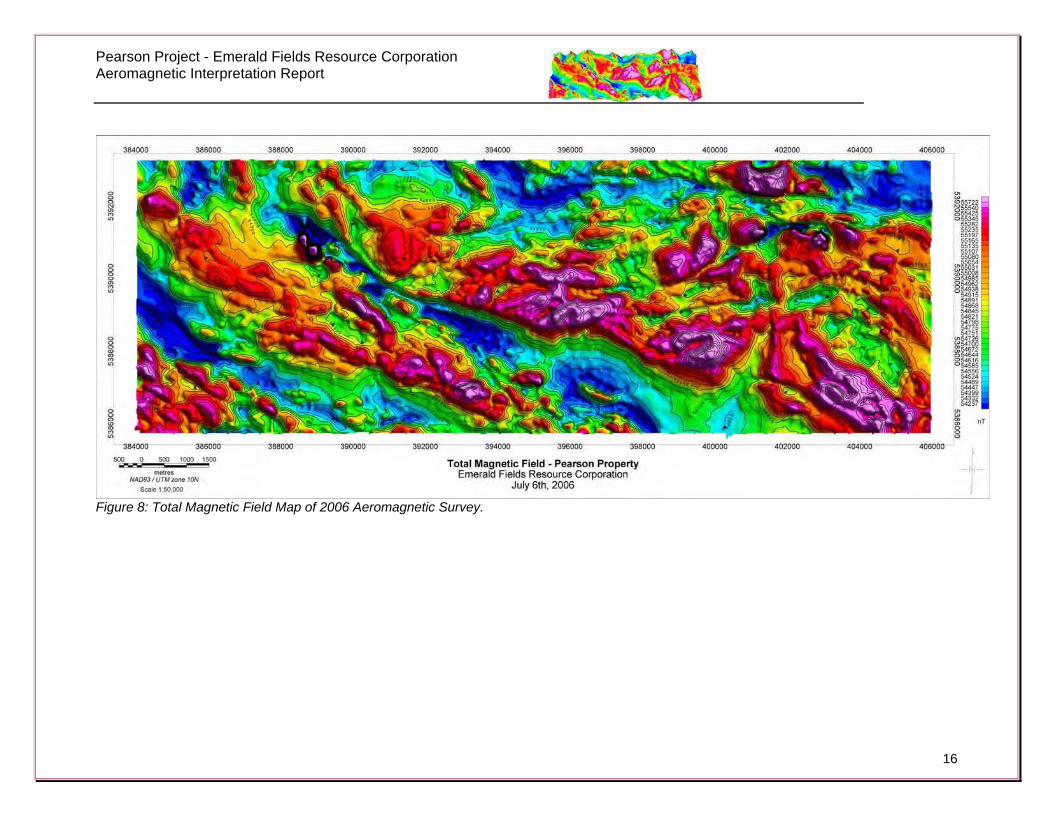
Pearson Project - Emerald Fields Resource Corporation Aeromagnetic Interpretation Report
16
Figure 8: Total Magnetic Field Map of 2006 Aeromagnetic Survey.

Pearson Project - Emerald Fields Resource Corporation Aeromagnetic Interpretation Report
Figure 9: Vertical Derivative Grid 2006 Aeromagnetic Survey with showings and drillholes.
17

Pearson Project - Emerald Fields Resource Corporation Aeromagnetic Interpretation Report
Figure 10: Analytic Signal Grid of 2006 Aeromagnetic Survey with showings and drillholes.
18

Pearson Project - Emerald Fields Resource Corporation Aeromagnetic Interpretation Report
Figure 11: Overlay of Regional Geology and Total Magnetic Field.
19

Pearson Project - Emerald Fields Resource Corporation Aeromagnetic Interpretation Report
Figure 12: West Side of Property - Total Magnetic Field with showing and drillholes.
20

Pearson Project - Emerald Fields Resource Corporation Aeromagnetic Interpretation Report
Figure 13: West Side of Property – Analytic Signal with showing and drillhole locations.
21

Pearson Project - Emerald Fields Resource Corporation Aeromagnetic Interpretation Report
Figure 14: West Zone Analytic Signal with Total Magnetic Field Profiles: A possible contact is marked with the yellow line where there is a change in amplitude of the profiles. A white line marks the outline of the structure which has with the highest magnetic response in this section of the property. The geophysical signature is consistent with that of a highly magnetic body.
22

Pearson Project - Emerald Fields Resource Corporation Aeromagnetic Interpretation Report
Figure 15: East Side of Property – Total Magnetic Field.
23

Pearson Project - Emerald Fields Resource Corporation Aeromagnetic Interpretation Report
24
Figure 16: Analytic Signal Grid of the East Section of the survey. The structure (marked by a white line) is the strongest anomaly in this part of the survey, and reflects a broad and deep source. Total Magnetic Field profile through the anomaly (black) shows the highest magnetic response.

Pearson Project - Emerald Fields Resource Corporation Aeromagnetic Interpretation Report
25
Figure 17: East Side of Property – Vertical Derivative Grid.
Pearson Project - Emerald Fields Resource Corporation Aeromagnetic Interpretation Report STATEMENT OF QUALIFICATIONS Monika Sumara I, Monika Sumara am a Consulting Geophysicist who is employed by Emerald Fields Resource Corporation to analyze, interpret and provide follow-up recommendations regarding geophysical data of the Pearson Property on southwest Vancouver Island. I have completed a field visit to the property. I am:
• Eligible for membership with the Association of Professional Engineers and Geoscientists of British Columbia (APEGBC).
I graduated from the University of Calgary in Alberta with a Bachelor of Science in Geophysics in 2002, and I have practiced my profession continuously since. My geophysics experience has involved:
• diamond exploration with Arctic Star Diamond in Northern Manitoba, Ontario and the Northwest Territories since 2004;
• geophysical aeromagnetic surveys with Universal Wing of Vancouver, British Columbia since 2004;
• satellite imagery processing with PhotoSat of Vancouver, British Columbia in 2003 involving GIS mapping and rendering;
• oil and gas geophysical research with CREWES (Consortium for Research in Elastic Wave Exploration Seismology) at the University of Calgary under the tutelage of Dr. Gary Margrave, involving seismic processing techniques during 2002;
• seismic survey planning, processing and interpretation in the Western Sedimentary basin with Tikal Resources Inc., an oil and gas exploration company of Calgary, Alberta, from 1998 to 2001.
I am not aware of any material fact or material change with respect to the subject matter of this technical report which is not reflected in this report, the omission to disclose which would make this report misleading. Dated at Vancouver, BC this 8th day of July, 2006. “Monika Sumara” July, 2006

APPENDIX B
ULTRAMAFIC ROCK OCCURRENCES IN THE JURASSIC BONANZA ARC NEAR PORT RENFREW, SOUTHERN VANCOUVER ISLAND, GEOSCIENCE BC PROPOSAL

Ultramafic Rock Occurrences in the Jurassic Bonanza Arc near PortRenfrew (NTS 092C/09, 10, 15, 16), Southern Vancouver Island1
by J. Larocque2 and D. Canil2
KEYWORDS: Wrangellia, Van cou ver Is land, map ping,arc, plutons, ultra mafic rocks
INTRODUCTION
Ig ne ous rocks of Ju ras sic age on Van cou ver Is land,Brit ish Co lum bia rep re sent an obliquely tilted sec tion of is -land arc crust called the Bo nanza arc. The struc tural depthof rocks ex posed is cur rently un cer tain. Re cently, sev eraliso lated bod ies of ultra mafic rock were rec og nized by G.Pearson, a lo cal pros pec tor, within what are pre sumed to bethe deeper lev els of the arc in the area of Port Renfrew.Ultra mafic rock out crops, in many cases, cor re spond tostrong anom a lies in the re gional aero mag net ic pat tern, aswell as soil anom a lies for nickel and chro mium in nearbystreams. The ex tent to which ultra mafic rocks are pres ent in the Bo nanza arc is po ten tially very sig nif i cant, as they maybe pro spec tive for nickel and plat i num group el e ments.Dur ing the sum mer of 2006, a field study was con ducted aspart of the first au thor’s MSc the sis, in or der to as cer tain the ex tent of the ultra mafic bod ies, to de ter mine their re la tion -ship to other rocks of the Bo nanza arc and to ad dress theireco nomic po ten tial.
FIELD AREA
The field area (Fig 1) is lo cated ap prox i mately a two-hour drive north west of Vic to ria, BC. The field area is bor -dered by the San Juan River in the south, Cowichan Lake inthe north, Lake Nitinat and the Nitinat River to the west andnorth west and the Fleet River to the east. Ac cess to the areais pro vided by a net work of vari ably main tained log gingroads. Many of the roads that once ac cessed some of themore el e vated, re mote ar eas are badly over grown. Over all,rock ex po sures are mainly con cen trated along ac tive log -ging roads. Ex po sure is best in el e vated ar eas that haverecently been logged.
REGIONAL GEOLOGY
Most of Van cou ver Is land is un der lain by rocks ofWrangellia as orig i nally de fined by Jones et al. (1977). The
Sicker Group forms the base ment to Wrangellia on Van cou -ver Is land, and con sists of mafic and fel sic vol ca nic andvolcaniclastic rocks, over lain by epiclastic and car bon atesed i ments of the Perm ian Buttle Lake Group (Massey andFri day, 1987). The Sicker Group is in ter preted as an is landarc that was ac tive from De vo nian to Perm ian time (Greeneet al., 2005). Over ly ing the Sicker Group are the Tri as sicKarmutsen ba salt, a thick (~2500 m) se quence of sub aque -ous pil low lava, over lain by a few hun dred metres of pil lowbrec cia, which are them selves topped by an other thick(~3000 m) se quence of subaerial sheet flows (Nixon et al.,1993). The Karmutsen flood bas alts may be an emer gentocean is land built upon the ex tinct Sicker is land arc(Greene et al. , 2005). Con form ably over ly ing theKarmutsen ba salt is a thin (<75 m) se quence of micriticlime stone called the Quatsino For ma tion, which is it selfcon form ably over lain by the Par sons Bay For ma tion, a35 m thick se quence of thinly bed ded ar gil la ceousmudstone, lime stone, siltstone and sand stone (Massey andFri day, 1987; Nixon et al., 1995). The Ju ras sic Bo nanza arcintrudes, as well as unconformably overlies, older units ofWrangellia.
Jurassic Bonanza Arc
In the field area, rocks of the Bo nanza arc are sep a rated from the Ju ras sic-Cre ta ceous Pa cific Rim Terrane to thesouth by the San Juan fault and from the Sicker Group to the north by the Cowichan fault. The Ju ras sic-aged rocks of
Geo log i cal Field work 2006, Pa per 2007-1 319
1Geoscience BC con tri bu tion GBC 0332School of Earth and Ocean Sciences, University of Victoria,
Victoria, BC
This publication is also available, free of charge, as colourdigital files in Adobe Acrobat® PDF format from the BCMinistry of Energy, Mines and Petroleum Resources website athttp://www.em.gov.bc.ca/Mining/Geolsurv/Publications/catalog/cat_fldwk.htm
Fig ure 1. Southern Van cou ver Is land, show ing the field area of thepres ent study (as out lined above). The grid out lines NTS sheets092C, 092F, 092G and 092B (clock wise from lower left).

Wrangellia on Van cou ver Is land havebeen rec og nized as the prod ucts of is landarc magmatism, based on pe trol ogy andgeo chem is try (Isachsen, 1987; DeBari etal., 1999). From base to top, these unitsin clude the West Coast Crys tal line Com -plex, the Is land Plutonic suite and the Bo -nanza Group vol ca nic rocks. Rocks in thefield area have un der gone ze o lite to lo -cally greenschist fa cies meta mor phism,but the orig i nal ig ne ous lithologies areused in their descriptions.
WEST COAST CRYSTALLINECOMPLEX
The West Coast Crys tal line Com plex has been in ter preted as the deep est-pre -served level of the Ju ras sic arc, based onits in tru sive re la tion ship with coun tryrock that most of ten be longs to the SickerGroup (DeBari et al., 1999). SickerGroup rocks, how ever, were not en coun -tered any where in the field area south ofCowichan Lake. Plutonic mar gins in theWest Coast Crys tal line Com plex tend tobe con cor dant with the coun try rocks(DeBari et al., 1999).
The com plex is dom i nated by melanocratic toleucocratic quartz diorite and gab bro con tain ing vary ingamounts of hornblende, bi o tite, orthopyroxene andclinopyroxene. Grain sizes vary lo cally from fine grainedto peg ma titic. As noted by DeBari et al. (1999), West CoastCrys tal line Com plex diorite com monly con tains in clu sions of finer-grained mafic rock that range from well-de fined,an gu lar shapes to faint, wispy len tic u lar bod ies. As well asspo radic granitoid in tru sions, out crops of diabase are found lo cally in the West Coast Crys tal line Com plex in the fieldarea, south west of the Gordon River. Di rectly to the north,two dis tinct bands of light grey mar ble oc cur as septa in thediorite. Sim i lar mar ble out crops are found in the east ernpart of the field area, al though these are more ir reg u lar inout crop pat tern. Mi nor mag ne tite-rich skarn bod ies, withvari ably-de vel oped di op side-gar net as sem blages, arefound at the con tact with the mar ble. Due to the meta mor -phosed na ture of these car bon ate rocks, they are sug gestedto rep re sent frag ments and/or faulted slices of the ButtleLake For ma tion, as op posed to recrystallized Quatsinolime stone. Most sig nif i cantly, the West Coast Crys tal lineComplex contains bodies of ultramafic rock, which arefurther described below.
Foliations within the West Coast Crys tal line Com plex,de fined by pla nar fab ric of hornblende, bi o tite or plagio -clase, strike north west and dip 60 to 75° de grees to thesouth west. Roughly in the mid dle of the field area, a largearea of Karmutsen ba salt is jux ta posed with the West CoastCrys tal line Com plex along a shear zone with the same at ti -tude as the per va sive fo li a tion in the diorite. Shear zonesde fined by my lon ite ho ri zons within the West Coast Crys -tal line Com plex have a sim i lar ori en ta tion in the wes tern -most parts of the field area. The com mon ori en ta tion andsense of shear (tops to the north east) for all these shearzones sug gest that the West Coast Crys tal line Com plex is ase ries of east-verg ing thrust-faulted pan els, the east ern -most one of which has been thrust onto the overlyingKarmutsen basalt.
Re gional-scale aero mag net ic data avail able for south -ern Van cou ver Is land (Fig 2) shows a prom i nent mag netichigh, run ning par al lel to, and ex tend ing north from the SanJuan fault. At this res o lu tion, the mag netic anom aly ap -pears to roughly cor re spond with ar eas un der lain by WestCoast Crys tal line Com plex rocks, but de vi a tions from thisgeneral trend exist.
ISLAND PLUTONIC SUITE
The Is land Plutonic suite oc curs as a roughly north -west-south east aligned se ries of plutons rang ing fromquartz diorite to al kali feld spar gran ite. As noted by DeBariet al. (1999), the Is land Plutonic suite most com monly in -trudes the Tri as sic Karmutsen ba salt and is dis tin guishedfrom plutons of sim i lar com po si tion of the West CoastCrys tal line Com plex by lack ing any fo li a tion (Mul ler et al., 1981). Ex cept where faulted, the con tact be tween the Is -land Plutonic suite and the West Coast Crys tal line Com plex is not well de fined. In the field area, rocks of the Is landPlutonic suite oc cur mainly in the north ern and east ernparts of the field area, sep a rated from the West Coast Crys -tal line Com plex to the south west by in ter vals of Karmutsen basalt and Quatsino limestone.
BONANZA GROUP VOLCANIC ROCKS
The Bo nanza Group vol ca nic rocks are only veryweakly meta mor phosed, dis play ing as sem blages in dic a -tive of the ze o lite fa cies (Massey and Fri day, 1987) andvary from apha ni tic ba salt, through plagioclase, pyroxeneand/or hornblende-phyric an de site to mi nor dacite. In ad di -tion to mas sive flows, the Ju ras sic vol ca nic rocks are alsoen coun tered as pil lowed flows and flow brec cia. Lesserpyroclastic de pos its have been noted, with rhyth mic band -ing of apha ni tic fel sic and mafic ash flows and fall de pos its. The lat eral ex tent and con ti nu ity of these de pos its is ob -scured by veg e ta tion and over bur den. Sim i lar rocks werenoted by Nixon et al. (1995) in the Quatsino Sound regionof northern Vancouver Island.
320 Geoscience BC, Re port 2007-1
Fig ure 2. Re gional aero mag net ic anom aly map of the field area (BC Geo log i cal Sur vey,2006). Cir cles show lo ca tions of ultra mafic-cu mu late gab bro in out crop.

ULTRAMAFIC ROCKS
Previous Occurrences
Isachsen (1987) re ports the oc cur rence of iso lated bod -ies of gab bro and peridotite, con tain ing up to 35%orthopyroxene and ol iv ine, along Lemmens In let onMeares Is land, north east of Tofino. These bod ies are as so -ci ated with Isachsen’s Westcoast am phi bo lite, Westcoastdiorite and Westcoast migmatite sub units of the West CoastCrys tal line Com plex. Their nonfoliated na ture and lowgrade of meta mor phism led Isachsen to be lieve that theywere youn ger than the West Coast Crys tal line Com plexrocks into which they intruded.
Contact Relationships
Ultra mafic rocks oc cur as dis crete bod ies within theWest Coast Crys tal line Com plex diorite, rang ing in sizefrom 1 m to sev eral tens of metres. Al though ob scured byover bur den, there is some lat eral con ti nu ity of min er al og i -cally dis tinct ultra mafic bod ies over dis tances of up to1 km. Con tact re la tion ships be tween the ultra mafic bod iesand the West Coast Crys tal line Com plex diorite are quitevari able. Smaller bod ies, which tend to be more ol iv ine-rich, have ei ther abrupt, undeformed con tacts with theirhost (Fig 3), or are pres ent as sheared pods. Larger bod ies,which are gen er ally more gabbroic, grade into the me lanoand leucocratic diorites of the West Coast Crys tal line Com -plex. In sev eral lo ca tions, the as so ci a tion of ol iv inepyroxenite and peg ma titic hornblende diorite has beennoted (Fig 4). Ar eas of the West Coast Crys tal line Com plex that host ultra mafic rocks ap pear to cor re spond with the ex -treme mag netic highs (see Fig 2). The ultra mafic bod ieswere first dis cov ered us ing an aero mag net ic sur vey from1972 (G. Pearson, pers comm, 2006). If the re gional mag -netic sig nal is con trolled by the pres ence of ultra mafic rock, there may be a significant amount of these rocks hiddenwithin the West Coast Crystalline Complex.
Sample Descriptions
In out crop, the ultra mafic bod ies are no to ri ously dif fi -cult to rec og nize, ow ing to their strongly weath ered char ac -
ter. Of ten, a weath ered out crop con tain ing peridotite canini tially be mis taken as dark soil. The ma jor ity of the out -crop is com monly in an ad vanced stage of chem i cal weath -er ing, with small patches of well-pre served rock dis persedthrough out (Fig 5, 6). Peridotite and ol iv ine pyroxenite out -crops weather to dun or choc o late brown and have freshsur faces that are dark grey to black, of ten with largeoikocrysts of am phi bole and pyroxene en clos ing subhedralol iv ine (Fig 7). The gabbroic out crops weather to a darkbrown or dun col our and are better pre served than theirolivine-rich counterparts.
In thin sec tion, the peridotite and ol iv ine pyroxenitecon sist of vari ably serpentinized cu mu lus ol iv ine with in -clu sions of euhedral spinel, poikilitically en closed by ei ther orthopyroxene, am phi bole, or more rarely, clinopyroxene.Orthopyroxene and clinopyroxene co ex ist in sev eral sam -ples. Weakly to strongly al tered plagioclase is pres ent as anintercumulus phase in some sam ples. In these sam ples, ol -iv ine is never di rectly in con tact with plagioclase and is al -ways man tled by a co rona of pyroxene (Fig 8).
Where pres ent, am phi bole ap pears as the re sult of re -ac tion with pyroxene, along grain bound aries or alongexsolution lamellae. The am phi bole is of ig ne ous or i gin asa deuteric al ter ation of an hy drous min er als dur ing ad -
Geo log i cal Field work 2006, Pa per 2007-1 321
Fig ure 3. Sharp con tact be tween ultra mafic body and West CoastCrys tal line Com plex diorite.
Fig ure 4. Ol iv ine pyroxenite (far right, black) in as so ci a tion withpeg ma tite diorite (mid dle) and leucodiorite (left).
Fig ure 5. Out crop of mica peridotite. The ma jor ity of the out crophas weath ered to soil.

vanced crys tal li za tion of hy drous magma (e.g., Beard et al., 2005). More over, we would not ex pect the pres er va tion offresh ol iv ine if these rocks were hy drated (to form am phi -bole) by meta mor phism (e.g., Fig. 9). Ig ne ous phlogopite is also pres ent as a mi nor phase in some sam ples.
Cu mu late gab bro and gabbronorite dis play cu mu lusplagioclase, ±orthopyroxene, clinopyroxene and, in onecase, ol iv ine. Much of the postcumulus clinopyroxene hasbeen re placed by am phi bole (Fig 10). Plagioclase in thesesam ples is in vari ably less al tered than in the peridotite andol iv ine pyroxenite samples.
Mag ne tite with mi nor il men ite exsolution is the dom i -nant opaque phase in the ultra mafic sam ples. It oc curs asmi nor dis sem i nated grains in the peridotite and ol iv inepyroxenite, and as both a euhedral and intercumulus phasein the gabbroic rocks (Fig 11). A euhedral, dark grey min -eral with low re flec tivity is pres ent in peridotite and ol iv inepyroxenite sam ples, pos si bly chro mite. Mi nor amounts ofchal co py rite are noted in most sam ples. Rare in clu sions ofround, white, high-re flec tivity grains in ol iv ine are noted,possibly pentlandite (Fig 12).
DISCUSSION
Ultra mafic rocks oc cur in sev eral dif fer ent tec tonicset tings in the Ca na dian Cor dil lera, in clud ing ophioliterocks, Alas kan-type in tru sions and cumulates as so ci atedwith calcalkaline in tru sions in arc ter ranes (Nixon, 2003).The hy drous, calcalkaline na ture of the par ent magma thatpro duced the ultra mafic cumulates in the Bo nanza arc, asat tested to by the pres ence of pri mary am phi bole,phlogopite and mag ne tite, is in con sis tent with an ophioliteas so ci a tion. Fur ther more, there is no spa tial as so ci a tion of
322 Geoscience BC, Re port 2007-1
Fig ure 6. Peridotite sam ple with chem i cally al tered out crop in theback ground.
Fig ure 7. Cut slab of feldspathic ol iv ine pyroxenite. Sam ple is ap -prox i mately 10 cm across.
Fig ure 8. Pho to mi cro graph show ing intercumulus plagioclase (Pl)with cu mu lus ol iv ine (Ol) and orthopyroxene (Opx) oikocrysts.Field of view is 2 mm across.
Fig ure 9. Pho to mi cro graph of fresh cu mu lus ol iv ine (Ol) en closedby pri mary am phi bole (Amph). Field of view is ap prox i mately 4 mm across.

man tle tectonite, pil low lava or sheeted dikes with theultramafic bodies or their hostrocks.
Sev eral lines of ev i dence also show that the ultra maficbod ies are not of Alas kan-type af fin ity. First and fore most,orthopyroxene is a com mon phase in many sam ples, an ob -ser va tion that is in con sis tent with Alas kan-type ultra maficoc cur rences (Tay lor, 1967). Un like the Alas kan-type sit u a -tion, the par ent magma from which the ultra mafic bod iessep a rated must have been sil ica sat u rated. In ad di tion to themin er al og i cal ev i dence, field re la tions also ar gue againstan Alas kan-type or i gin — the peridotite and ol iv inepyroxenite bod ies lack any con cen tric zoning and occur asblocks and lozenges in diorite.
Strik ingly sim i lar pe trog ra phy and field re la tions to the ultra mafic rocks of the cur rent study are known from theGi ant Mas cot de posit of south ern BC. Nickel-cop per-plat i -num group el e ment sul phide ores at Gi ant Mas cot arehosted by ultra mafic rocks, in clud ing peridotite,pyroxenite and feldspathic pyroxenite (Metcalfe et al.,2002). As in the cur rent study, the Gi ant Mas cot rocks con -tain cu mu lus spinel and ol iv ine, poikilitically en closed byorthopyroxene and am phi bole (Metcalfe et al., 2002).
Based on spinel chem is try, the Gi ant Mas cot cumulateshave been in ter preted as frag ments of the root zone to thetholeiitic Karmutsen ba salt that were sam pled by theSpuzzum diorite (Nixon, 2003). The hy drous na ture of thecumulates is ex plained by Metcalfe et al. (2002) as the re -sult of anatexis of metapelitic wallrock, caus ing de hy dra -tion and thereby in tro duc ing wa ter into the magma. Al -though chem i cal data is pend ing for the cur rent study, it isdif fi cult to rec on cile the pres ence of pri mary mag ne tite andam phi bole in the Bo nanza ultra mafic rocks with thetholeiitic na ture or the anatectic pro cesses ev i dent in the Gi -ant Mas cot rocks. In the Port Renfrew area, the pres ence offresh ol iv ine in am phi bole oikocrysts rules out ametasomatic or i gin for the lat ter and there is no fieldevidence for the assimilation of hydrous or pelitic countryrock.
Peridotite and pyroxenite are noted to oc cur in as so ci a -tion with gabbronorite to wards the mid dle and base of crustin ex humed is land arc ter ranes in the Cor dil lera and else -where (e.g., Burns, 1985; Takahashi et al., 2006). For ex -am ple, an oblique sec tion of arc crust ex posed in theKohistan Terrane of north ern Pa ki stan con tains peridotite,an or tho site, troctolite and ol iv ine gab bro cumulates, within a larger body of granoblastic diorite and gabbronorite.(Takahashi et al., 2006).
The Bo nanza arc and its set ting are very sim i lar to theTalkeetna arc in south-cen tral Alaska and it has been pro -posed that the two are of sim i lar age and can be cor re latedalong strike (DeBari et al., 1999). In the Talkeetna arc,ultra mafic cumulates are pres ent in large but spo radic oc -cur rences at the base of the arc crust sec tion, in con tact withman tle harzburgite and du nite (Burns, 1985; DeBari andColeman, 1989). The ultra mafic cumulates in the Talkeetna arc sec tion are thought to be ge net i cally linked to the moreevolved mag matic rocks of the arc (DeBari and Sleep,1991). In the Tonsina as sem blage, a part of the Talkeetnaarc, peridotite and pyroxenite bod ies oc cur in as so ci a tionwith cu mu late gar net-bear ing gab bro, which grades intocu mu late gabbronorite con tain ing Fe and Ti ox ides(DeBari and Coleman, 1989). Plagioclase is pres ent as alate postcumulus phase and never co ex ists with ol iv ine(DeBari and Coleman, 1989; DeBari and Sleep, 1991).While am phi bole is pres ent in the peridotite and pyroxenitepri mar ily in the form of re ac tion rims on pyroxene, it ap -pears to be a ma jor postcumulus phase in the over ly ing
Geo log i cal Field work 2006, Pa per 2007-1 323
Fig ure 10. Pho to mi cro graph of cu mu late gab bro, with fresh cu mu -lus plagioclase (Pl), am phi bole (Amph), rel ict clinopyroxene (Cpx)and ox ides (Mgt). Field of view is ap prox i mately 4 mm across.
Fig ure 11. Pho to mi cro graph show ing euhedral and intercumulusmag ne tite (Mgt), with mi nor chal co py rite (Cpy) in cu mu late gab bro. Field of view is ap prox i mately 2 mm across.
Fig ure 12. Pho to mi cro graph of pentlandite (?; Pn) in clu sion in ol iv -ine (Ol). Field of view is ap prox i mately 1.5 mm across.

gabbroic cumulates (DeBari and Coleman, 1989). Thesepetrographic re la tion ships are strik ingly sim i lar to ultra -mafic cumulates from our field area. We sug gest that theultra mafic rocks found within the West Coast Crys tal lineCom plex rep re sent cumulates from a prim i tive (par ent?)Bo nanza arc magma. There may be a melt-res i due re la tion -ship be tween the West Coast Crys tal line Com plex dioriteand the ultra mafic cumulates, the latter having beenentrained in the former during emplacement.
FUTURE DIRECTIONS AND ECONOMICPOTENTIAL
Whole rock geo chem i cal anal y sis for ma jor and se -lected trace el e ments will fur ther elu ci date the or i gin of theultra mafic and re lated plutonic rocks in the Port Renfrewarea. In ad di tion, geo chron ol ogi cal in ves ti ga tions are un -der way to con strain the age of rocks that host the ultra maficbod ies, as well as to con strain the ig ne ous his tory of thispor tion of the Bo nanza arc. All of the ultra mafic sam plescol lected have been sent for as say. In ad di tion, the Ni con -cen tra tion of ol iv ine will be in ves ti gated in peridotite andol iv ine pyroxenite sam ples to test if they were in equi lib -rium with Ni-sul phide. This may shed light on theprospectivity of the ultra mafic bod ies for Ni-Cu or PGEsul phide, both in the Port Renfrew field area and elsewherein the West Coast Crystalline Complex.
The ma jor ity of the ultra mafic bod ies are no more thana few tens of metres wide. Al though it is dis con tin u ous atthe sur face, the ultra mafic out crops tend to be dis trib uted inpatches through out the West Coast Crys tal line Com plex.Geo phys i cal in ves ti ga tions may re veal con ti nu ity be tweenthese or other ultra mafic bod ies at depth. No sig nif i cantcon cen tra tions of eco nomic min er als were noted in out -crop, hand sam ple or thin sec tion, apart from mi nor Cu andNi sul phide minerals. None the less, the West Coast Crys tal -line Com plex is ex posed along most of west ern Van cou verIs land and the find ings of Isachsen (1987) on Meares Is land sug gest that ultra mafic bod ies are likely to be pres ent else -where through out the West Coast Crys tal line Com plex onVan cou ver Is land, possibly associated with concentrationsof Ni-Cu sul phide minerals.
ACKNOWLEDGMENTS
This work was jointly funded by Geoscience BC andEm er ald Fields Re sources to whom we are in debted fortheir sup port. Holly Steenkamp is thanked for field as sis -tance. In Port Renfrew, spe cial thanks go to Tom Maw sonfor his hos pi tal ity and Gary Pearson for much guid ance,cheer and lo gis ti cal help.
REFERENCES
BC Geo log i cal Sur vey (2006): MapPlace GIS internet map pingsys tem; BC Min is try of En ergy, Mines and Pe tro leum Re -sources, MapPlace website, URL <http:// www.MapPlace.ca> [November 2006].
Beard, J.S., Ragland, P.C. and Crawford, M.L. (2005): Us ing in -con gru ent equi lib rium hydration re ac tions to model lat ter-stage crys tal li za tion in plutons: ex am ples from the Bell Is -land tonalite, Alaska; Jour nal of Ge ol ogy, vol ume 113,pages 589–599.
Burns, L. (1985): The Bor der Ranges ultra mafic and mafic com -plex, south-cen tral Alaska: cu mu late fractionates of is land
arc volcanics; Ca na dian Jour nal of Earth Sci ences, vol -ume 22, pages 1020–1038.
DeBari, S., An der son, R.G. and Mortensen, J.K. (1999): Cor re la -tion among lower to up per crustal com po nents in an is landarc: the Ju ras sic Bo nanza arc, Van cou ver Is land, Can ada;Ca na dian Jour nal of Earth Sci ences , vol ume 36,pages 1371–1413.
DeBari, S.M. and Coleman, R.G. (1989): Ex am i na tion of the deeplev els of an is land arc: ev i dence from the Tonsina ultra -mafic-mafic as sem blage, Tonsina, Alaska; Journal ofGeophysical Research, vol ume 94, pages 4373–4391.
DeBari, S.M. and Sleep, N.H. (1991): High-Mg, low-Al bulk com -po si tion of the Talkeetna is land arc, Alaska: Im pli ca tions for pri mary mag mas and the na ture of arc crust; GeologicalSociety of America Bulletin, vol ume 103, pages 37–47.
Greene, A.R., Scoates, J.S. and Weis, D. (2005): WrangelliaTerrane on Van cou ver Is land, Brit ish Co lum bia: dis tri bu tion of flood bas alts with im pli ca tions for po ten tial Ni-Cu-PGEmin er al iza tion in south west ern Brit ish Co lum bia; in Geo -log i cal Field work 2004, BC Min is try of En ergy, Mines andPe tro leum Re sources, Pa per 2005-1, pages 209–220.
Isachsen, C.E. (1987): Ge ol ogy, geo chem is try, and cool ing his tory of the Westcoast Crys tal line Com plex and re lated rocks,Meares Is land and vi cin ity, Van cou ver Is land, Brit ish Co -lum bia; Ca na dian Jour nal of Earth Sci ences, vol ume 24,pages 2047–2064.
Jones, D.L., Silberling, N.J. and Hillhouse, J. (1977): Wrangellia –a dis placed terrane in north west ern North Amer ica; Ca na -dian Jour nal of Earth Sci ences, vol ume 14, pages 2565–2577.
Massey, N.W.D. and Fri day, S.J. (1987): Ge ol ogy of the Cowichan Lake area, Van cou ver Is land (92C/16); in Geo log i cal Field -work 1987, BC Min is try of En ergy, Mines and Pe tro leumRe sources, Pa per 2003-1, pages 223–229.
Metcalfe, P., McClaren, M., Gabites, J. and Houle, J. (2002): Ni-Cu-PGE de pos its in the Pa cific Nickel Com plex, south west -ern BC: a pro file for mag matic Ni-Cu-PGE min er al iza tionin a transpressional mag matic arc; in Ex plo ra tion and Min -ing in Brit ish Co lum bia 2002, BC Min is try of En ergy, Minesand Pe tro leum Re sources, pages 65–79.
Mul ler, J.E., Cameron, B.E.B. and North cote, K.E. (1981): Ge ol -ogy and min eral de pos its of Nootka Sound map-area, Van -cou ver Is land, Brit ish Co lum bia; Geo log i cal Sur vey ofCan ada, Pa per 80-16, 53 pages.
Nixon, G.T. (2003): Use of spinel in min eral ex plo ra tion: the enig -matic Gi ant Mas cot Ni-Cu-PGE de posit – pos si ble ties toWrangellia and met al lo gen ic sig nif i cance; in Geo log i calField work 2002, BC Min is try of En ergy, Mines and Pe tro -leum Re sources, Pa per 2003-1, pages 115–128.
Nixon, G.T., Hammack, J.L., Ham il ton, J. and Jennings, H. (1993): Pre lim i nary ge ol ogy of the Mahatta Creek area, north ernVan cou ver Is land (92L/5); in Geo log i cal Field work 1992,BC Min is try of En ergy, Mines and Pe tro leum Re sources, Pa -per 1993-1, pages 17–35.
Nixon, G.T., Hammack, J.L., Payie, G.J., Snyder, L.D., Archibald,D.A. and Barron, D.J. (1995): Quatsino-San Josef map area,north ern Van cou ver Is land: Geo log i cal over view(92L/12W, 1021/8, 9); in Geo log i cal Field work 1994, BCMin is try of En ergy, Mines and Pe tro leum Re sources, Pa per1995-1, pages 9–21.
Takahashi, Y., Mikoshiba, M.U., Takahashi, Y., Kauser, A.B.,Khan, T. and Kubo, K. (2006): Geo chem i cal mod el ling ofthe Chilas Com plex in the Kohistan Terrane, north ern Pa ki -s t a n ; J o u r n a l o f A s i a n E a r t h S c i e n c e s , d o i :10.1016/j.jseaes.2006.04.007
Tay lor, H.P. (1967): The zoned ultra mafic com plexes of south east -ern Alaska; in Ultra mafic and re lated rocks, Wyl lie, P.J., Ed -i tor, John Wiley and Sons, pages 97–121.
324 Geoscience BC, Re port 2007-1

APPENDIX C
ALS CHEMEX SAMPLE PREPARATION AND ANALYTICAL PROCEDURES

June 11, 2003 Page 1 of 1
Sample Preparation Package – PREP‐31 Standard Sample Preparation: Dry, Crush, Split and Pulverize
Sample is dried and the entire sample is crushed to better than 70% passing a 2 mm (Tyler 10 mesh) screen. A split of up to 250 grams is taken and pulverized to better than 85% passing a 75 micron (Tyler 200 mesh) screen. ALS Chemex Method Code Description
LOG‐22 Sample is logged in tracking system and a bar code label is attached.
CRU‐31 Fine crushing of rock chip and drill samples to better than 70% of the sample passing 2 mm.
SPL‐21 Split sample using riffle splitter.
PUL‐31 A sample split of up to 250 g is pulverized to better than 85% of the sample passing 75 microns.

May 4, 2004 Page 1 of 2
Geochemical Procedure – ME-MS61 Ultra-Trace Level Method Using ICP-MS and ICP-AES
Sample Decomposition: HF-HNO3-HClO4 acid digestion, HCl leach Analytical Methods: Inductively Coupled Plasma - Atomic Emission Spectroscopy (ICP - AES) Inductively Coupled Plasma - Mass Spectrometry (ICP-MS)
A prepared sample (0.250 gram) is digested with perchloric, nitric, and hydrofluoric acids to near dryness. The sample is then further digested in a small amount of hydrochloric acid. The solution is made up to a final volume of 12.5 ml with 11% hydrochloric acid, homogenized, and analyzed by inductively coupled plasma‐atomic emission spectrometry. Following this analysis, the results are reviewed for high concentrations of bismuth, mercury, molybdenum, silver and tungsten and diluted accordingly. Samples that meet this criteria are then analyzed by inductively coupled plasma-mass spectrometry. Results are corrected for spectral interelement interferences.
Element Symbol Detection Limit
Upper Limit Units Analytical
Technique Silver Ag 0.01 100 ppm AES+MS Aluminum Al 0.01 25 % AES Arsenic As 0.2 10,000 ppm AES+MS Barium Ba 0.5 10,000 ppm AES Beryllium Be 0.05 1000 ppm AES+MS Bismuth Bi 0.01 10,000 ppm AES+MS Calcium Ca 0.01 25 % AES Cadmium Cd 0.02 500 ppm AES+MS Cerium Ce 0.01 500 ppm MS Cobalt Co 0.1 10,000 ppm AES+MS Chromium Cr 1 10,000 ppm AES Cesium Cs 0.05 500 ppm MS Copper Cu 0.2 10,000 ppm AES Iron Fe 0.01 25 % AES Gallium Ga 0.05 500 ppm MS Germanium Ge 0.05 500 ppm MS Hafnium Hf 0.1 500 ppm MS Indium In 0.005 500 ppm MS Potassium K 0.01 10 % AES Lanthanum La 0.5 500 ppm MS

May 4, 2004 Page 2 of 2
Element Symbol Detection Limit
Upper Limit Units Analytical
Technique Lithium Li 0.2 500 ppm MS Magnesium Mg 0.01 15 % AES Manganese Mn 5 10,000 ppm AES Molybdenum Mo 0.05 10,000 ppm MS+AES Sodium Na 0.01 10 % AES Niobium Nb 0.1 500 ppm MS Nickel Ni 0.2 10,000 ppm AES+MS Phosphorous P 10 10,000 ppm AES Lead Pb 0.5 10,000 ppm AES+MS Rubidium Rb 0.1 500 ppm MS Rhenium Re 0.002 50 ppm MS Sulfur S 0.01 10 % AES Antimony Sb 0.05 1000 ppm MS Selenium Se 1 1000 ppm MS Tin Sn 0.2 500 ppm MS Strontium Sr 0.2 10,000 ppm AES+MS Tantalum Ta 0.05 100 ppm MS Tellurium Te 0.05 500 ppm MS Thorium Th 0.2 500 ppm MS Titanium Ti 0.01 10 % AES+MS Thallium Tl 0.02 500 ppm MS Uranium U 0.1 500 ppm MS Vanadium V 1 10,000 ppm AES Tungsten W 0.1 10,000 ppm AES+MS Yttrium Y 0.1 500 ppm MS Zinc Zn 2 10,000 ppm AES Zirconium Zr 0.5 500 ppm MS MS ‐ Results are from the ICP‐MS scan AES ‐ Results are from the ICP‐AES scan AES+MS ‐ Results are a combination of ICP‐AES and ICP‐MS scans

March 31, 2003 Page 1 of 1
Fire Assay Procedure – Au‐AA23 and Au‐AA24 Fire Assay Fusion, AAS Finish
Sample Decomposition: Fire Assay Fusion Analytical Method: Atomic Absorption Spectroscopy (AAS)
A prepared sample is fused with a mixture of lead oxide, sodium carbonate, borax, silica and other reagents as required, inquarted with 6 mg of gold‐free silver and then cupelled to yield a precious metal bead. The bead is digested in 0.5 ml dilute nitric acid in the microwave oven, 0.5 ml concentrated hydrochloric acid is then added and the bead is further digested in the microwave at a lower power setting. The digested solution is cooled, diluted to a total volume of 4 ml with de‐mineralized water, and analyzed by atomic absorption spectroscopy against matrix‐matched standards.
ALS Chemex Method Code Element Symbol
Sample Weight
Lower Reporting Limit
Upper Reporting Limit
Units
Au‐AA23 Gold Au 30 g 0.005 10.0 ppm Au‐AA24 Gold Au 50g 0.005 10.0 ppm

Fe‐VOL51 (rev01.00).doc Revision 01.00
August 29,2003 Page 1 of 1
Specialty Assay Procedure – Fe‐VOL51 Volumetric Determination of Iron in Ore Samples and Smelter
Sample Decomposition: HCl‐HNO3‐H2SO4‐HF Analytical Method: Volumetric This method is suitable for the determination of high concentrations of iron in custom ores, concentrates and samples that do not completely decompose with acid digestion, such as chromites, black sand or samples with high Ti content. A prepared sample is (0.25 to 1.00 g) is digested with hydrochloric, sulfuric, nitric and hydrofluoric acid and evaporated to dryness. This residue is then re‐dissolved with dilute hydrochloric acid. The Fe(OH)3 in the aqueous state is then precipitated with ammonium hydroxide, filtered off, and dissolved in hydrochloric acid. The ferric hydroxide in solution is then reduced to the ferrous state. The ferrous iron is re‐oxided by potentiometric titration from Fe2+ to Fe3+ and the amount of iron calculated.
Element Symbol Lower Reporting
Limit Upper Reporting
Limit Units Iron Fe 0.01 100 %

March 18, 2003 Page 1 of 3
Specialty Assay Procedure – Sulfur Analysis Methods
Parameter Method Code Symbol
Lower Reporting Limit
Upper Reporting Limit
Units
Total Sulfur (Leco)
S‐IR08 S 0.01 50 %
Sulfide Sulfur (Leco)
S‐IR07 S 0.01 10 %
Sulfate Sulfur (carbonate leach)
S‐GRA06 S 0.01 50 %
Sulfate Sulfur (HCl leach)
S‐GRA06a S 0.01 50 %
Sulfide Sulfur (calculated)
S‐CAL06 S 0.01 50 %
Sulfide Sulfur (calculated)
S‐CAL06a S 0.01 50 %
Total Sulfur (Gravimetric)
S‐GRA08 S 0.01 100 %
Total Sulfur Method Code: S‐IR08 The sample is analyzed for Total Sulfur using a Leco sulfur analyzer. The sample (0.5 to 5.0 grams) is heated to approximately 1350 degrees Celsius in an induction furnace while passing a stream of oxygen through the sample. Sulfur dioxide released from the sample is measured by an IR detection system and the Total Sulfur result is provided. Sulfide Sulfur Method Code: S‐IR07 A prepared sample is selectively leached by converting metal sulfide to insoluble carbonates and soluble sulfate by heating with sodium carbonate solution. The
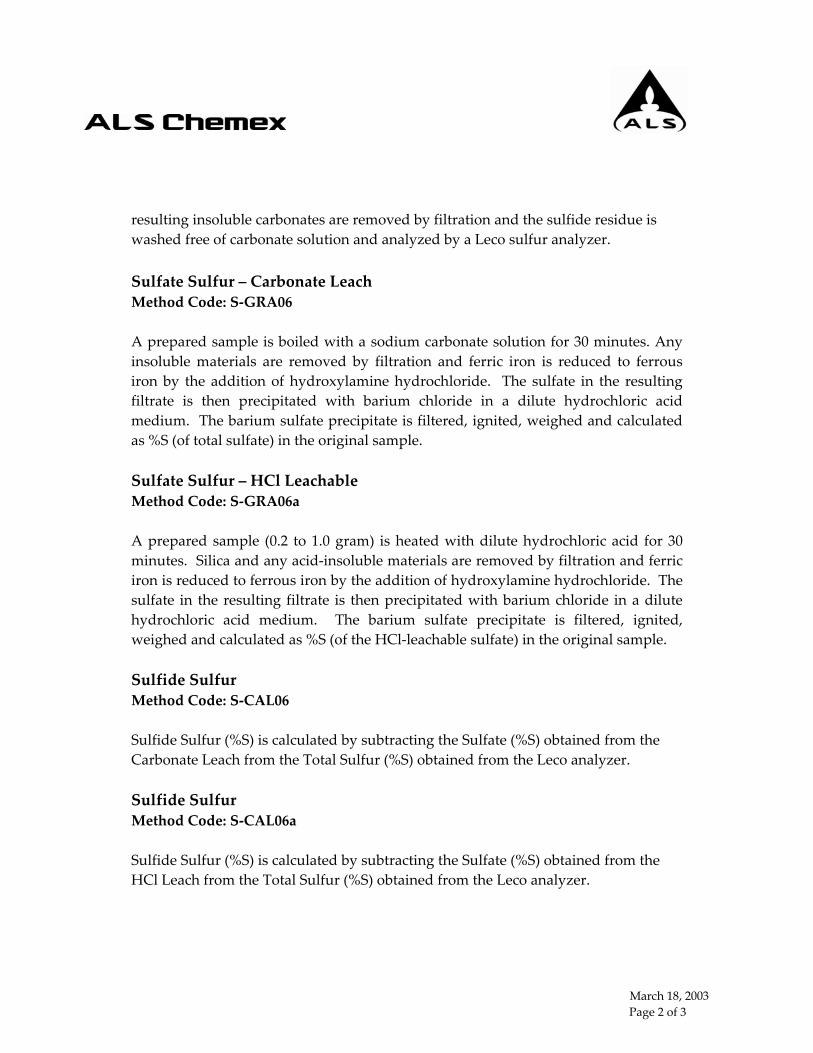
March 18, 2003 Page 2 of 3
resulting insoluble carbonates are removed by filtration and the sulfide residue is washed free of carbonate solution and analyzed by a Leco sulfur analyzer. Sulfate Sulfur – Carbonate Leach Method Code: S‐GRA06 A prepared sample is boiled with a sodium carbonate solution for 30 minutes. Any insoluble materials are removed by filtration and ferric iron is reduced to ferrous iron by the addition of hydroxylamine hydrochloride. The sulfate in the resulting filtrate is then precipitated with barium chloride in a dilute hydrochloric acid medium. The barium sulfate precipitate is filtered, ignited, weighed and calculated as %S (of total sulfate) in the original sample. Sulfate Sulfur – HCl Leachable Method Code: S‐GRA06a A prepared sample (0.2 to 1.0 gram) is heated with dilute hydrochloric acid for 30 minutes. Silica and any acid‐insoluble materials are removed by filtration and ferric iron is reduced to ferrous iron by the addition of hydroxylamine hydrochloride. The sulfate in the resulting filtrate is then precipitated with barium chloride in a dilute hydrochloric acid medium. The barium sulfate precipitate is filtered, ignited, weighed and calculated as %S (of the HCl‐leachable sulfate) in the original sample. Sulfide Sulfur Method Code: S‐CAL06 Sulfide Sulfur (%S) is calculated by subtracting the Sulfate (%S) obtained from the Carbonate Leach from the Total Sulfur (%S) obtained from the Leco analyzer. Sulfide Sulfur Method Code: S‐CAL06a Sulfide Sulfur (%S) is calculated by subtracting the Sulfate (%S) obtained from the HCl Leach from the Total Sulfur (%S) obtained from the Leco analyzer.

March 18, 2003 Page 3 of 3
Total Sulfur Method Code: S‐GRA08 The ore sample is digested with nitric acid and potassium chlorate and bromine is added to assist oxidation. After complete dehydration of the silica and complete removal of the nitric acid and silica, the iron in solution is reduced with hydroxylamine hydrochloride. The sulfate is then precipitated by the addition of barium chloride solution and is filtered and weighed as barium sulfate.

January 30, 2003 Page 1 of 1
Whole Rock Geochemistry – ME‐XRF06
Sample Decomposition: Lithium Tetraborate Fusion* Analytical Method: X‐Ray Fluorescence Spectroscopy (XRF)
A prepared sample (1.000 gram) is added to lithium tetraborate flux (9.000 grams), mixed well and fused in a furnace at 1100°C. A flat glass disc is prepared from the resulting melt. This disc is then analyzed by X‐ray fluorescence spectrometry. Oxide concentration is calculated from the determined elemental concentration and the result is reported in that format. To determine loss on ignition (L.O.I.), a porcelain crucible is dried in an oven at 105°C, cooled and the weight recorded. A prepared sample (3.00 grams) is added to the crucible and then ashed at 1000°C for one hour. The sample is then cooled in a desiccator, weighed and the percent loss on ignition is calculated.
Oxide Determined Symbol Lower Reporting Limit
Upper Reporting Limit
Units
Aluminum Oxide Al2O3 0.01 100 % Barium Oxide BaO 0.01 100 % Calcium Oxide CaO 0.01 100 % Chromium Oxide Cr2O3 0.01 100 % Ferric Oxide Fe2O3 0.01 100 % Magnesium Oxide MgO 0.01 100 % Manganese Oxide MnO 0.01 100 % Phosophorus Oxide P2O5 0.01 100 % Potassium Oxide K2O 0.01 100 % Silicon Oxide SiO2 0.01 100 % Sodium Oxide Na2O 0.01 100 % Strontium Oxide SrO 0.01 100 % Titanium Oxide TiO2 0.01 100 % Loss On Ignition L.O.I. 0.01 100 % *Note: For samples that are high in sulphides, we may substitute a peroxide fusion in order to obtain better results.