TECHNICAL REPORT 3/03 MORPHOLOGY DESK STUDY
72
TECHNICAL REPORT 3/03 MORPHOLOGY DESK STUDY
Transcript of TECHNICAL REPORT 3/03 MORPHOLOGY DESK STUDY

TECHNICAL REPORT 3/03
MORPHOLOGY DESK STUDY

Report No. B4027/TR03/03 October 2004
Halton Borough Council Rutland House
Halton Lea Runcorn
WA7 2GW
NEW MERSEY CROSSING
MORPHOLOGY DESK STUDY

Halton Borough Council Rutland House Halton Lea Runcorn WA7 2GW
Gifford and Partners 20 Nicholas Street
Chester CH1 2NX
NEW MERSEY CROSSING
MORPHOLOGY DESK STUDY
CONTROLLED DOCUMENT
Gifford and Partners Document No: B4027/TR03/03
Status: FINAL Copy No:
Name Signature Date
Prepared by: Andrew Brookes/Andrew Chalmers/Sally German/ABPmer
A Brookes, A Chalmers, S
German, N Pontee
07/10/04
Checked: Anthony Guay A Guay 07/10/04
Technical Approval: Paul Hillman P Hillman 07/10/04
Gifford Approved: Ian Hunt I Hunt 13/10/04
Revision Record
Rev. Date By Summary of Changes Chkd Aprvd
New Mersey Crossing New Mersey Crossing Gifford and Partners Morphology Desk Study Morphology Desk Study Page i Report No. B4027/TR03/03
NEW MERSEY CROSSING
MORPHOLOGY DESK STUDY
C O N T E N T S Page
FOREWORD ...........................................................................................................................1
EXECUTIVE SUMMARY ........................................................................................................3
1. INTRODUCTION ...........................................................................................................5
2. ESTUARY CHARACTERISTICS..................................................................................6
2.1 General Setting ....................................................................................................6 2.2 Palaeohydrological Context .................................................................................6
2.3 Estuary Form .......................................................................................................7 2.4 Tides ..................................................................................................................10
2.5 Surges................................................................................................................13
2.6 Tidal bore ...........................................................................................................13 2.7 Fresh Water Flow...............................................................................................13
2.8 Mixing.................................................................................................................14 2.9 Wind and Wave Climate ....................................................................................14
2.10 Sediment Sources..............................................................................................14
2.11 Anthropogenic Influences ..................................................................................15
3. HISTORICAL DATA SOURCES.................................................................................19
3.1 Bathymetric surveys ..........................................................................................19 3.2 EMPHASYS Data ..............................................................................................20
3.3 Aerial photographs.............................................................................................20 3.4 Additional secondary sources............................................................................22
4. ANALYSIS OF CHANGE............................................................................................23
4.1 Cross-sectional changes ...................................................................................23
4.2 Changes in volume ............................................................................................26
4.3 Channel change.................................................................................................31 4.4 Saltmarsh change..............................................................................................36
5. DISCUSSION OF CHANGE........................................................................................41
5.1 Background to physical parameters controlling change within an estuarine system................................................................................................41
5.2 Specific reasons for changes to the sediment regime in the Mersey ...............44

New Mersey Crossing Gifford and Partners Morphology Desk Study Page ii Report No. B4027/TR03/03
6. CONCLUSIONS ..........................................................................................................46
7. REFERENCES ............................................................................................................48
APPENDICES Appendix A Channel Positions Appendix B Emphasys Database Channel Configuration Appendix C Aerial Photographs Appendix D List of Technical Reports

New Mersey Crossing Gifford and Partners Morphology Desk Study Page 1 Report No. B4027/TR03/03
FOREWORD
Halton Borough Council, on behalf of the Mersey Crossing Group, is currently promoting a second integrated crossing of the Mersey within the Borough, between Runcorn and Widnes. Gifford and Partners were appointed as Project Manager and Lead Consultant in July 2001 to undertake the further studies necessary to take the project forward. A substantial body of work has been undertaken to date on the project, including design, investigation of funding options and environmental studies. The work has culminated in the production of a series of reports, which are summarised in the following table:
Report Number & Status
Report Title
Principal Author
Purpose of Report
General Reports B4027/01 Issued November 2001
Report of Works 1 – Preliminary Sources Survey
Gifford and Partners Report to the client on the desk study
B4027/01 Addendum No 1 Issued November 2001
Report of Works 1 – Preliminary Sources Survey – Addendum No 1 – Fiddler’s Ferry Route
Gifford and Partners Report to the client on the desk study for Route 4
Report of Works 2 – Volume 1 Gifford and Partners Report to the client on the studies carried out on alternative route options
B4027/02 Issued March 2003
Report of Works 2 – Volume 2 Gifford and Partners Structure and Highways Drawings for ROW2
B4027/03 Issued March 2004
Route Selection Gifford and Partners Report to DfT to clarify Route selection
B4027/04 In preparation – due to be issued November 2004
Amendments to Technical Reports
Gifford and Partners Report to DfT summarising changes to Technical Reports since MSA submission in July 2003
Environmental Impact Assessment for Options Appraisal & MSA B4027/EIA/01 Issued March 2002
Environmental Impact Assessment Scoping Report
Gifford and Partners Scoping of impacts for EIA for consultation
B4027/EIA/02 Issued August 2002
Environmental Impact Assessment Scoping Report Addendum
Gifford and Partners Addendum to scoping report taking into account comments received from consultees
B4027/EIA/03 Issued July 2003
Environmental Impact Assessment Progress Report
Gifford and Partners Report on EIA progress to inform the ROW2 and for consultees
B4027/EIA/04 Issued March 2003
Environmental Impact Assessment Synthesis – Multi-Criteria Analysis
Gifford and Partners Statistical analysis of impacts to assist in decision making process
B4027/EIA/05 In preparation – due to be issued November 2004
Environmental Impact Assessment Supplementary Report for the Major Scheme Appraisal
Gifford and Partners Report on changes to EIA as a result of changes to the scheme since the submission of the MSA in July 2003
Environmental Impact Assessment for Orders and Applications B4027/EIA/05 In preparation – due to be issued November 2004
Environmental Impact Assessment Orders and Applications Scoping Report
Gifford and Partners EIA Scoping Report for “The Scheme” detailing EIA to be carried out for the Environmental Statement
Major Scheme Appraisal Appendix 1 Major Scheme Appraisal for New Mersey Crossing – Volume 1
Gifford and Partners Report submitted to DfT with application for funding
B4027/MSA/01 Issued July 2003 (Will be superseded by B4027/MSA/02) Appendix 1 Major Scheme
Appraisal for New Mersey Crossing – Volume 2
Gifford and Partners Worksheets in support of above
Major Scheme Appraisal for New Mersey Crossing – Volume 1
Gifford and Partners Report submitted to DfT with application for funding
B4027/MSA/02 In preparation – due to be issued November 2004
Major Scheme Appraisal for New Mersey Crossing – Volume 2
Gifford and Partners Worksheets in support of above

New Mersey Crossing Gifford and Partners Morphology Desk Study Page 2 Report No. B4027/TR03/03
In addition to these main reports, the detailed technical studies have been reported in a series of Technical Reports which provide supporting details for the Report of Works, Environmental Impact Assessment and Major Scheme Appraisal. These reports are listed in Appendix D. The work undertaken to March 2003 focused on comparing potential options for a new crossing. In March 2003, Halton Borough Council and the Mersey Crossing Group voted unanimously for a preferred route upstream of the existing Silver Jubilee Bridge. A Major Scheme Appraisal (MSA) for the preferred scheme was submitted to the Department for Transport (DfT) in July 2003 with Halton Borough Council’s Local Transport Plan APR to apply for Central Government funding. In December 2003, the DfT responded by awarding the scheme “Super Work in Progress” status and requesting further information on the following issues:
• Traffic impact over the wider road network • Hydrodynamic modelling • Economic Impacts • Statutory Procedures and Procurement • Funding Options – consideration of tolling as a means to fund the new crossing
A second MSA submission will be made to the DfT in November 2004, after which it is hoped that funding issues will be resolved. Following this, it is intended that work on the Environmental Statement will commence, with the appropriate Applications and Orders being submitted in the autumn of 2005. The reports being produced for the MSA submission in November 2004 are also listed in Appendix X. Queries regarding any of the reports should be addressed to either of the contacts below: Mrs Claire Hall/Mr Sas Fernando Tel: 01244 311855 Gifford & Partners Fax: 01244 311182 20 Nicholas Street Chester Cheshire CH1 2NX Mr Mike Bennett Tel: 0151 424 2061 Halton Borough Council Fax: 0151 471 7304 Environment and Development Directorate Rutland House Halton Lea Runcorn Cheshire WA7 2GW

New Mersey Crossing Gifford and Partners Morphology Desk Study Page 3 Report No. B4027/TR03/03
EXECUTIVE SUMMARY This report supersedes report B4027/011/01. The crossing of the Mersey is the biggest single transport issue facing Halton Borough. It is being addressed firstly, by maintaining and getting the best from the Silver Jubilee Bridge and secondly, by promoting a new “local” crossing in Halton. Studies into the feasibility of a new crossing concluded that a crossing could have potentially adverse environmental impacts on the river and estuary. Potentially of these the most critical may be the impact on the hydrodynamic processes in the river and the risk of mobilising contaminants from overlying materials in the riverbed and on the banks. In July 2001, the Mersey Crossing Group appointed Gifford and Partners as Project Manager and Lead Consultant. Following this, Gifford appointed ABP Marine Environmental Research Ltd (ABPmer) to assist them in studying the hydrodynamics of the Upper Mersey Estuary. This report, an amalgamation of the research carried out by both Gifford and ABPmer, reviews previous studies into the subject area and then evaluates the available information to provide the reader with an understanding of the geomorphology of the estuary in both the past and present. It concludes by providing a statement on how the current geomorphology may affect and be affected by the proposed New Mersey Crossing. The conclusions from this report identify that, in common with many other UK estuaries, the Mersey Estuary has been infilling throughout the Holocene period. Over the last several hundred years the estuary has been subject to substantial anthropogenic modification including port construction, dredging and training works, bridge crossings and river diversions. As a whole, the estuary has not reached an equilibrium form. In the future, the general trend for siltation in the study area is likely to continue, with the rate of siltation dependent on the balance of marine to fluvial sediment supply. The Upper Mersey Estuary is characterised by a series of banks and channels, which show lateral movement. In the study area, the sub-tidal channels have decreased in depth and width, whilst the intertidal/supratidal areas have accreted vertically. The positions of the sub-tidal channels have varied significantly in the period between 1906 and 1997. It is not possible to identify shifts in channel dominance between the North and South Channels. There is an area of mudflat in the centre of the study area, which has been present over the last 91 years. However, whilst there is no guarantee that a low water channel might not form here in the future. The only record of such a channel forming is from an aerial photograph taken in 1945. EMPHASYS data shows no evidence of the channel in 1936 and 1946 showing that it was present for a maximum of ten years. It is likely that the North and South Channel will continue to exist and migrate laterally across the estuary. Over the past 41 years, lateral movements of up to 500m have been documented and these rates are likely to continue. This study suggests that this lateral migration is likely to continue to be most pronounced upstream of Hempstones Point. The high rates of morphodynamic variability observed in the study area on a day-to-day basis suggest that the process of meander migration is highly stochastic and the channels display similar properties to riverine anastomosing channels. Given the complexity of meander systems in estuaries in general and the evident variability of channels and banks in the study area, it is not possible to predict the future positions of the estuary channels and banks. However, based on this study the areas between the

New Mersey Crossing Gifford and Partners Morphology Desk Study Page 4 Report No. B4027/TR03/03
Silver Jubilee Bridge and the middle of the study area are dominated by relatively stable low water channels. Studies on patterns of change suggest that a bridge alignment some 1000m downstream of Hempstones Point, with bridge piers avoiding the present north and south channels and utilising the central relatively stable sand bank, would offer the least risk of what remains an uncertain situation.
New Mersey Crossing Gifford and Partners Morphology Desk Study Page 5 Report No. B4027/TR03/03
1. INTRODUCTION The crossing of the Mersey is the biggest single transport issue facing Halton Borough. It is being addressed firstly, by maintaining and getting the best from the Silver Jubilee Bridge and secondly, by promoting a new “local” crossing in Halton. Earlier studies concluded that a new crossing would have a significant beneficial impact on the economy of the area and that crossings in a 2km corridor east of the existing bridge perform best in traffic terms, are technically feasible and provide good value for money. However, the studies also concluded that a crossing could have potentially adverse environmental impacts on the river and estuary. The most critical of these is likely to be the impact on the hydrodynamic processes in the river and the risk of mobilising contaminants from overlying materials in the riverbed and on the banks. In July 2001, the Mersey Crossing Group appointed Gifford and Partners as Project Manager and Lead Consultant. Following this, Gifford appointed ABP Marine Environmental Research Ltd (ABPmer) to assist them in studying the hydrodynamics of the Upper Mersey Estuary. As part of the project brief, it is Gifford’s and ABPmer’s responsibility to gather and analyse all the existing information about the site and in particular, in the context of this report, all the information relating to the geomorphology of the Upper Mersey Estuary. This report, an amalgamation of the research carried out by both Gifford and ABPmer, reviews previous studies into the subject area and then evaluates the available information to provide the reader with an understanding of the geomorphology of the estuary in both the past and present. It concludes by providing a statement on how the current geomorphology may affect and be affected by the proposed New Mersey Crossing.
New Mersey Crossing Gifford and Partners Morphology Desk Study Page 6 Report No. B4027/TR03/03
Howley Weir
Hale Head
New Brighton
Runcorn Gap
Fiddler’s Ferry
Dingle Point
Dee Estuary
Mersey Estuary
Crosby
2. ESTUARY CHARACTERISTICS
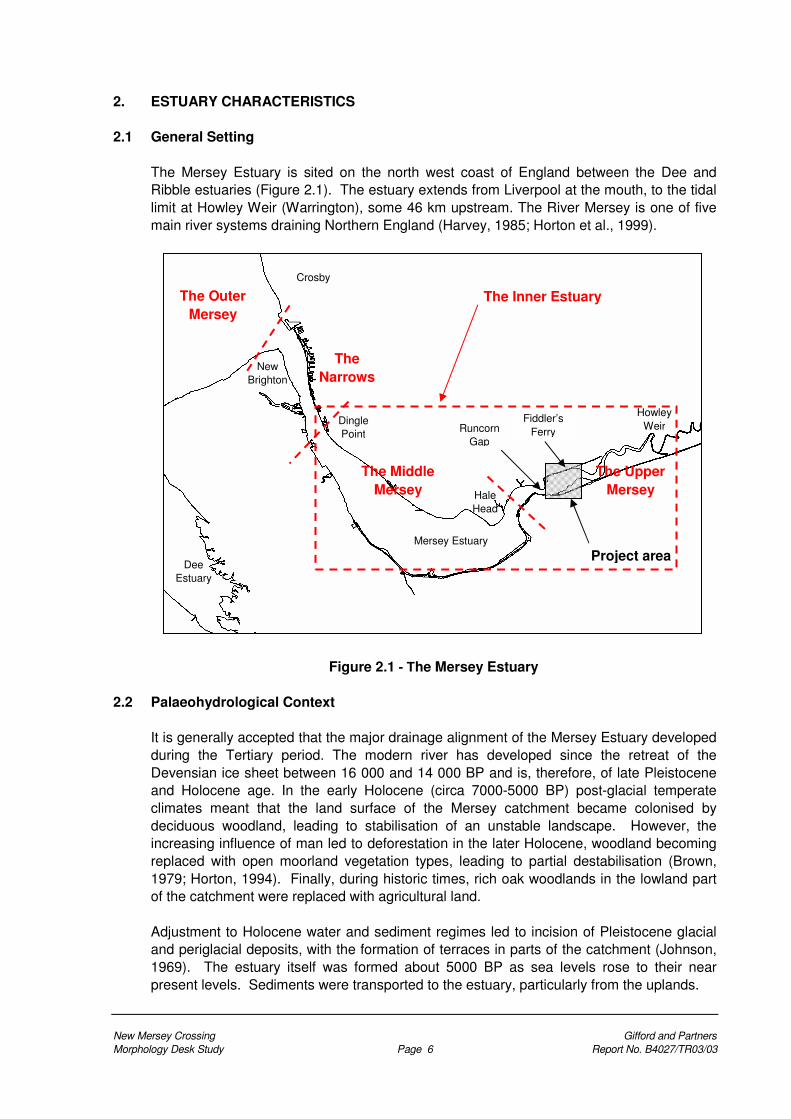
2.1 General Setting The Mersey Estuary is sited on the north west coast of England between the Dee and Ribble estuaries (Figure 2.1). The estuary extends from Liverpool at the mouth, to the tidal limit at Howley Weir (Warrington), some 46 km upstream. The River Mersey is one of five main river systems draining Northern England (Harvey, 1985; Horton et al., 1999).
Figure 2.1 - The Mersey Estuary 2.2 Palaeohydrological Context
It is generally accepted that the major drainage alignment of the Mersey Estuary developed during the Tertiary period. The modern river has developed since the retreat of the Devensian ice sheet between 16 000 and 14 000 BP and is, therefore, of late Pleistocene and Holocene age. In the early Holocene (circa 7000-5000 BP) post-glacial temperate climates meant that the land surface of the Mersey catchment became colonised by deciduous woodland, leading to stabilisation of an unstable landscape. However, the increasing influence of man led to deforestation in the later Holocene, woodland becoming replaced with open moorland vegetation types, leading to partial destabilisation (Brown, 1979; Horton, 1994). Finally, during historic times, rich oak woodlands in the lowland part of the catchment were replaced with agricultural land. Adjustment to Holocene water and sediment regimes led to incision of Pleistocene glacial and periglacial deposits, with the formation of terraces in parts of the catchment (Johnson, 1969). The estuary itself was formed about 5000 BP as sea levels rose to their near present levels. Sediments were transported to the estuary, particularly from the uplands.
The Outer Mersey
The Narrows
The Middle Mersey
The Upper Mersey
Project area
The Inner Estuary

New Mersey Crossing Gifford and Partners Morphology Desk Study Page 7 Report No. B4027/TR03/03
The channel morphology of the present estuary reflects sediment type and supply both from Pleistocene deposits and from pre-Pleistocene bedrock. The stratigraphy underlying the Mersey Estuary is alluvium overlying Glacial Till, which in turn overlies Bunter Upper Mottled Sandstone and/or Pebble Beds of the Triassic System (JNCC, 1996). The mouth of the estuary is constrained by the underlying bedrock. The Southern coastline between the Mersey Estuary and the Dee estuary is composed of a low-lying alluvial plain, much of which was formerly marshland, whilst the northern coastline has an extensive sand dune system extending from Crosby to Formby (ABPmer, 2001b).
2.3 Estuary Form
The Mersey Estuary has an unusual bottle shaped planform, with a narrow deep entrance channel, owing its existence to the underlying geology, opening into a shallow wide inner basin of shifting banks and channels, which in turn leads to a meandering river stage further landwards. This planform is very different from estuaries such as the Humber, which have a funnel shape where the width and cross-sectional area decrease almost exponentially with distance upstream from the mouth. The main approach channel to the Mersey Estuary is trained through a series of offshore sandbanks (Figure 2.2). A number of the estuary properties are summarised in Table 2.1.
Property Values for the Mersey
Lengths To Runcorn Sands, 31.5km; to tidal limit, 45.6 km.
Volumes
1 Total volume at MHW = 8.81×10⁸ m3
1 Total volume at MLW = 1.64×10⁸ m3
1 Total volume at MTL = 3.92×10⁸ m3
Widths and depths
Width of The Narrows = 1.5 km (at mouth reduces to ~ 800m at Pier Head)
Average depth at The Narrows = 15 m Max. width of Middle Mersey = 4 km
Max width of Upper Estuary = 1.30 km
Areas 2 The total area of the estuary = 8,914 ha
2 The intertidal area = 5,606 ha
1 obtained from ABPmer (2001a) 2 obtained from JNCC (1996)
Table 2.1 - Summary of Mersey Estuary Properties The Mersey Estuary can be divided into four regions (Figure 2.1):
• The Upper Mersey (Howley Weir to Hale Head), the study area • The Middle Mersey (Hale Head to Dingle Point) • The Narrows (Dingle Point to New Brighton) • The Outer Mersey (New Brighton to the seaward extent of the Training Walls)
New Mersey Crossing Gifford and Partners Morphology Desk Study Page 8 Report No. B4027/TR03/03
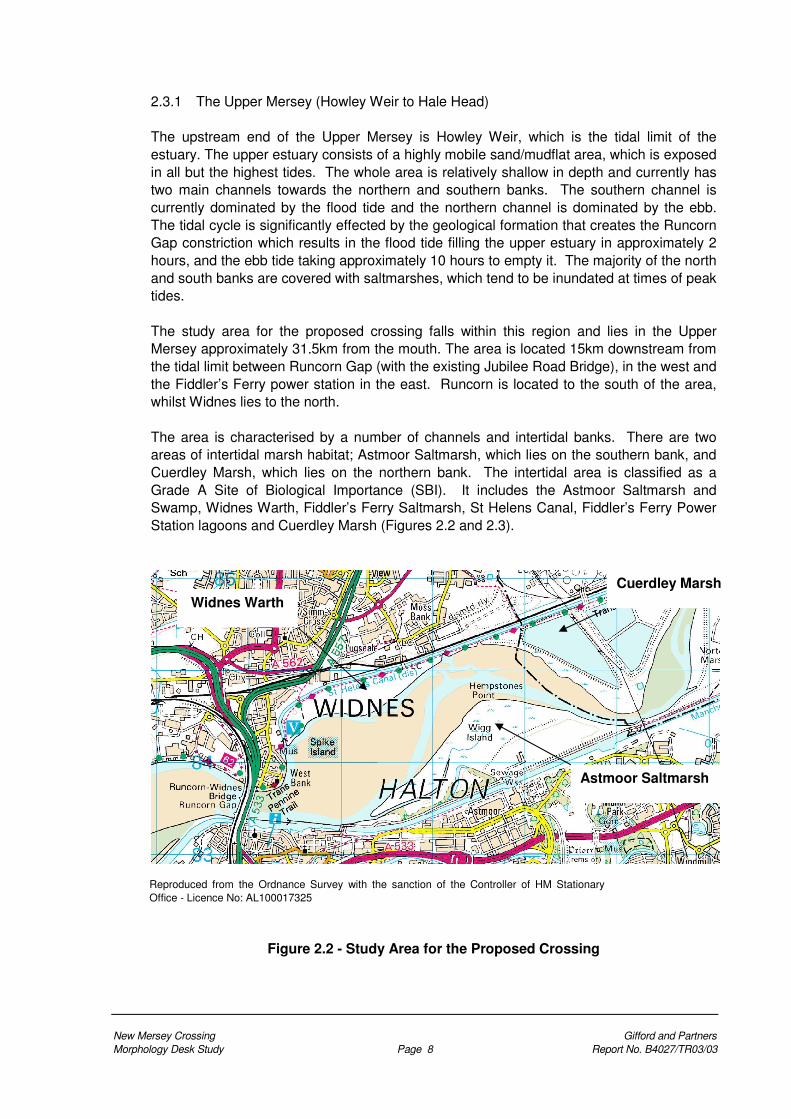
2.3.1 The Upper Mersey (Howley Weir to Hale Head) The upstream end of the Upper Mersey is Howley Weir, which is the tidal limit of the estuary. The upper estuary consists of a highly mobile sand/mudflat area, which is exposed in all but the highest tides. The whole area is relatively shallow in depth and currently has two main channels towards the northern and southern banks. The southern channel is currently dominated by the flood tide and the northern channel is dominated by the ebb. The tidal cycle is significantly effected by the geological formation that creates the Runcorn Gap constriction which results in the flood tide filling the upper estuary in approximately 2 hours, and the ebb tide taking approximately 10 hours to empty it. The majority of the north and south banks are covered with saltmarshes, which tend to be inundated at times of peak tides. The study area for the proposed crossing falls within this region and lies in the Upper Mersey approximately 31.5km from the mouth. The area is located 15km downstream from the tidal limit between Runcorn Gap (with the existing Jubilee Road Bridge), in the west and the Fiddler’s Ferry power station in the east. Runcorn is located to the south of the area, whilst Widnes lies to the north. The area is characterised by a number of channels and intertidal banks. There are two areas of intertidal marsh habitat; Astmoor Saltmarsh, which lies on the southern bank, and Cuerdley Marsh, which lies on the northern bank. The intertidal area is classified as a Grade A Site of Biological Importance (SBI). It includes the Astmoor Saltmarsh and Swamp, Widnes Warth, Fiddler’s Ferry Saltmarsh, St Helens Canal, Fiddler’s Ferry Power Station lagoons and Cuerdley Marsh (Figures 2.2 and 2.3).
Figure 2.2 - Study Area for the Proposed Crossing
Reproduced from the Ordnance Survey with the sanction of the Controller of HM Stationary Office - Licence No: AL100017325
Cuerdley Marsh
Astmoor Saltmarsh
Widnes Warth

New Mersey Crossing Gifford and Partners Morphology Desk Study Page 9 Report No. B4027/TR03/03
Reproduced from www.multimap.com
Figure 2.3 - Aerial Photograph (Date Unknown)
2.3.2 The Middle Mersey (Hale Head to Dingle Point)
The Middle Mersey has similar characteristics to the Upper Mersey, consisting predominantly of intertidal banks, composed of sand/silt, with saltmarshes on the surrounding shores. This area is designated as a Special Protection Area (SPA), Site of Special Scientific Interest (SSSI), Ramsar Site and European Marine Site. At low tide this reach almost completely dries out due to the large tidal range. There are three dominant channels that meander through this reach: • the Garston Channel, which runs along the North Bank • the Middle Channel • the Eastham Channel, which runs along the South Bank Many of the Mersey Estuary’s major freshwater sources enter the Middle Mersey adding to already complicated channel flow patterns. On the North bank, Ditton Brook enters the estuary just downstream of the Runcorn-Widnes Bridge. On the south bank, the Manchester Ship Canal (MSC) and the River Weaver enter the estuary at Weaver Bend via the Weaver Sluices. The Weaver Sluices only operate when water levels in the river/canal system exceed a certain level. The discharge from the sluices flows around Ince Banks where it meets up with the main Mersey channel. The resulting flow predominantly travels down the northern Garston Channel. Pye and Van de Wal (2000a) suggest that the North Garston channel and the Middle Mersey channels have a tendency to switch in dominance periodically. The River Gowy enters the estuary on the downstream side of Ince Banks, and flows down the southern Eastham Channel where it joins water entering from the MSC via Eastham locks.
2.3.3 The Narrows (Dingle Point to New Brighton) At the mouth of the estuary near Liverpool the ‘Narrows’ represent a geological constraint to the estuary system, with the bedrock preventing any further expansion of the channel.
Astmoor Saltmarsh
Cuerdley Marsh
Widnes Warth
New Mersey Crossing Gifford and Partners Morphology Desk Study Page 10 Report No. B4027/TR03/03
The Narrows stretch for about 10km, have a width of approximately 1 km, a mean depth of 15m and some depths in excess of 20m. The Narrows are subjected to high tidal currents, which can exceed 3m/s, and scour the bed down to rock and gravel.
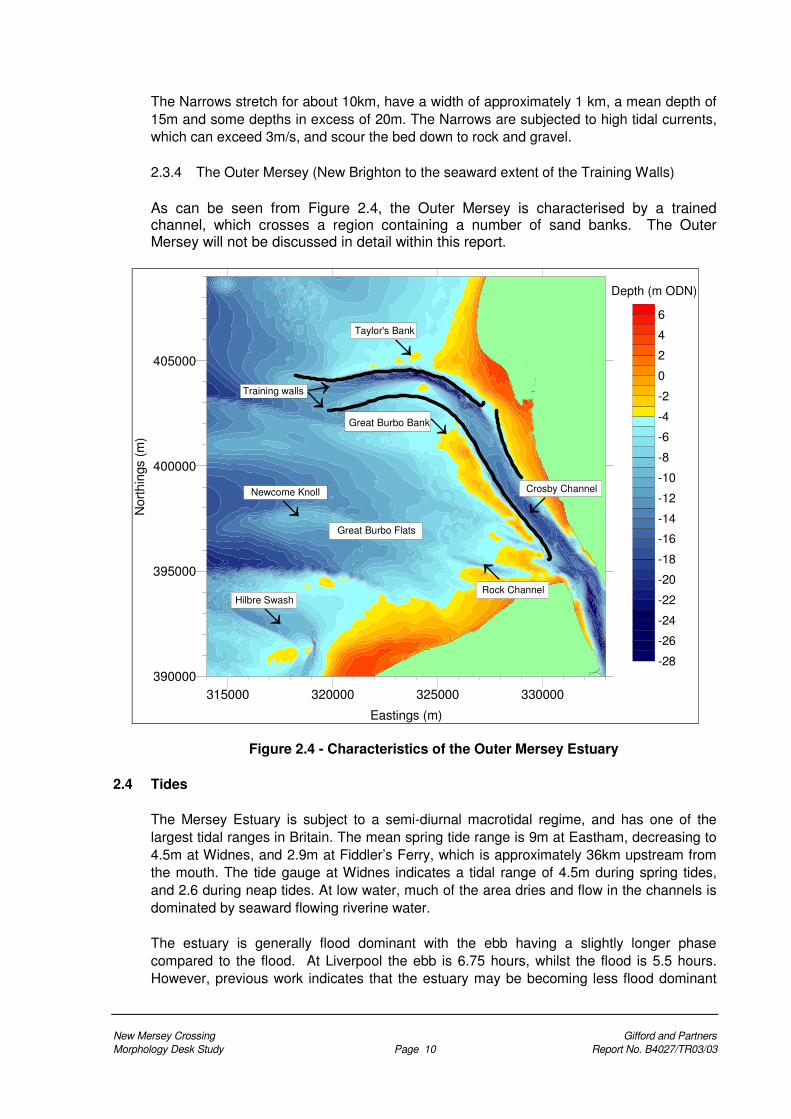
2.3.4 The Outer Mersey (New Brighton to the seaward extent of the Training Walls) As can be seen from Figure 2.4, the Outer Mersey is characterised by a trained channel, which crosses a region containing a number of sand banks. The Outer Mersey will not be discussed in detail within this report.
Figure 2.4 - Characteristics of the Outer Mersey Estuary
2.4 Tides
The Mersey Estuary is subject to a semi-diurnal macrotidal regime, and has one of the largest tidal ranges in Britain. The mean spring tide range is 9m at Eastham, decreasing to 4.5m at Widnes, and 2.9m at Fiddler’s Ferry, which is approximately 36km upstream from the mouth. The tide gauge at Widnes indicates a tidal range of 4.5m during spring tides, and 2.6 during neap tides. At low water, much of the area dries and flow in the channels is dominated by seaward flowing riverine water. The estuary is generally flood dominant with the ebb having a slightly longer phase compared to the flood. At Liverpool the ebb is 6.75 hours, whilst the flood is 5.5 hours. However, previous work indicates that the estuary may be becoming less flood dominant
315000 320000 325000 330000
Eastings (m)
390000
395000
400000
405000
Nor
thin
gs (
m)
-28
-26
-24
-22
-20
-18
-16
-14
-12
-10
-8
-6
-4
-2
0
2
4
6
Depth (m ODN)
Great Burbo Bank
Crosby ChannelNewcome Knoll
Training walls
Hilbre Swash
Taylor's Bank
Great Burbo Flats
Rock Channel

New Mersey Crossing Gifford and Partners Morphology Desk Study Page 11 Report No. B4027/TR03/03
overall, showing an increased tendency to ebb dominance towards the mouth, whilst becoming more flood dominant in the Inner reaches (Thomas, 2000; see Section 2.10). Analysis of the 7 tidal gauges in the Mersey Estuary (Table 2.2) illustrates that from The Narrows to as far as Eastham, there is a tidal amplification effect, which increases tidal range. This amplification effect is illustrated in Figure 2.5 using three datasets from the three tidal gauges situated in The Narrows.
Lat. Long. Height in m above Chart Datum
Height in m above Chart Datum Place
Distance from Mouth (km) N W MHWS MHWN MLWN MLWS
Datum relative to ODN
Garston Dock 0 53°27’ 3°01’ 9.2 7.3 2.9 0.8 - 4.93m
Liverpool (Alfred Dock)
5 53°24’ 3°01’ 9.3 7.4 2.9 0.9 - 4.90m
Eastham 12 53°19’ 2°57’ 9.6 7.5 2.8 0.6 - 4.93m
Hale Head 21 53°19’ 2°48’ 6.9 4.9 - - - 2.00m
Widnes 26 53°21’ 2°44’ 5.1 3.0 0.4 0.6 0
Fiddler’s Ferry 31 53°22’ 2°39’ 3.4 1.1 0.5 0.5 2.00m
Warrington 38 53°23’ 2°36’ 2.7 - - - 2.90m
Table 2.2 - Tidal Data Obtained from Admiralty Chart (2001a and b)
Graph showing the tidal propagation up the Mersey Estuary
0
1
2
3
4
5
6
7
8
9
10
00:00 02:00 04:00 06:00 08:00 10:00 12:00
Time
Hei
ght (
m) O
D
Liverpool (Alfred Dock)EasthamGladstone Dock
Figure 2.5 - Graph showing the tidal propagation up the Mersey Estuary

New Mersey Crossing Gifford and Partners Morphology Desk Study Page 12 Report No. B4027/TR03/03
In order to calibrate the model for the hydrodynamics study, accurate tide level information was needed upstream and downstream of the study area. Two recording tide gauges were installed (by Gifford); one located at Old Quay Lock and the other at the Electricity Pylon opposite Fiddler’s Ferry Power Station. The tide gauges additionally record conductivity (in order to establish salinity) and temperature. An example output from the tide gauges is illustrated in Figure 2.6. Measurements have been taken every 15 minutes covering the period 19/09/02 to 17/7/04. The instruments have been reliable and there are minimal gaps in the record.
Figure 2.6 - Tide Gauge Output for May/June 2003
Because the Middle Mersey dries at low water, it is impossible to pinpoint the location of maximum tidal amplification, however, on both spring and neap tides the maximum is somewhere between Eastham and Hale Head in the Middle Mersey. Table 2.3 illustrates the tidal velocities experienced in The Narrows and lower reaches of the Mersey (acquired from Admiralty Chart 3490).
Max Flood Velocity Max Ebb Velocity Difference (Flood –
Ebb) Location
Knots m/s Knots m/s Knots m/s
Gladstone Dock 4.4 2.3 4.2 2.2 0.2 0.1
Bramley Moore Dock 4.2 2.2 5.3 2.7 -1.1 0.5
Rock Ferry Terminal 5.2 2.7 4.4 2.3 0.8 0.4
Dingle Point 4.7 2.4 4.0 2.1 0.7 0.3
Table 2.3 - Tidal Current Velocities in the Mersey Estuary

New Mersey Crossing Gifford and Partners Morphology Desk Study Page 13 Report No. B4027/TR03/03
2.5 Surges
Some of the highest storm surges in the UK are found on the West Coast in Liverpool Bay. Such surges can reach around 2m in height and can increase tidal currents by up to 0.6m/s (ABPmer, 2001c). Such surges are likely to lead to increases in water levels and currents in the Mersey Estuary.
2.6 Tidal bore The tidal bore on the Mersey is most prominent when very high tides are expected above 10 meters at Liverpool, which occurs on only a few days each year. However, lower tides can produce good bores if other factors are favourable such as a period of dry weather reducing fresh water flow in the rivers. The Mersey bore may be seen in the lower estuary opposite Hale Point about 2hr 25 min before HW Liverpool. From the park at Widnes West Bank it may be seen passing under the Runcorn road and rail bridges about 1 hr 50 min before HW Liverpool. Under good conditions the bore may be seen as far as Warrington passing under the rail bridge south of Bank Quay station about 20 min before HW Liverpool. It passes rapidly through the town centre and arrives at Howley Weir just before HW Liverpool (www.pol.ac.uk/home/insight/merseybores.html).
2.7 Fresh Water Flow
For its size, the Mersey Estuary has a relatively low freshwater input. A typical freshwater flow from the Mersey is 66m3/s and the tidal influx into the Narrows is 2000m3/s during a spring tide (Van der Wal and Pye 2000; Pye et al., 2002). There are four main sources: • The River Mersey itself, via Howley Weir • The Manchester Ship Canal (MSC), via Eastham Locks and the Weaver Sluices • Ditton Brook • The River Gowy Table 2.4 displays the modal flow in these main freshwater sources. However, these freshwater flows vary seasonally from 25 - 200 m3/s (Prandle and Lane, 2000), with flood flows exceeding 1200 m3/s (HR Wallingford, 1999). The River Irwell provides an additional freshwater input.
Fresh Water Input Mean Flow m3/s
Mersey (at Westy) 37.22
Weaver (at Pickerings Cut) 16.55
Sankey Brook ( at Causey Bridge) 2.61
Ditton Brook (at Greens Bridge) 1.38
River Gowy (at Picton) 1.23
Total 58.99
Table 2.4 - Modal flows for Fresh Water Inputs to the Mersey Estuary
(from National River Flow Archive available from CEH, 1999)

New Mersey Crossing Gifford and Partners Morphology Desk Study Page 14 Report No. B4027/TR03/03
2.8 Mixing
The Mersey is a well-mixed estuary due to high tidal current velocities and relatively low freshwater inputs. Prandle and Lane (2000) calculated the mean flow ratio (volume of freshwater flow × 12.42 hr / volume between low and high water) of approximately 0.01, indicating well-mixed conditions. However, Prandle and Lane (2000) also state that in certain sections during part of the tidal cycle, the Mersey Estuary may become partially mixed.
2.9 Wind and Wave Climate
The waves offshore in Liverpool Bay are generally wind generated. Previous work has shown that the hourly mean wind speed for 75% of the time is 3m/s (JNCC, 1996). During winter months, significant wave heights of 5m have been observed (ABPmer, 2001b). The prevailing wind direction is from the west, but the Mersey Estuary is also open to winds from the north-westerly sector. The narrow entrance to the Mersey limits the propagation of waves into the estuary. Although it is important to note that waves are not only limited by the narrow entrance, but by the bathymetry as the tidal range ensures that the drying banks induce wave-breaking and thus limiting the height of waves entering the estuary. Locally generated waves within the estuary may influence sediment transport in intertidal areas. However, such waves are fetch limited and are unlikely to exceed 2m in height. Given this and the distance from the Bay, it is considered that the swell waves from the outer sea in Liverpool Bay will not affect the study area. In terms of locally generated waves, the limited fetch in the estuary around the study area suggests waves are unlikely to exceed 2m in height. The importance of waves is further reduced since much of the area dries out for long periods of the tidal cycle.
2.10 Sediment Sources
The two main sediment sources for the Mersey Estuary are: • Marine sources from the glacial and fluvioglacial deposits covering large parts of
the eastern Irish seabed, and • Fluvial sources from the rivers Previous work indicates that the marine sources are the most dominant, with O’Connor (1987) estimating that over 1,000,000m3 /year of sediment has been delivered to the estuary since the turn of the century. Price and Kendrick (1963) concluded that the mechanism for sediment transport from these offshore sources is via density stratification, which causes a net inland movement along the bed. Heaps (1972) also demonstrated that small density gradients found in the near-shore regions contribute to the net landward drift of near-bed water and sediments in Liverpool Bay. Although the fluvial sources are believed to be small compared with offshore sources, the magnitude and duration of freshwater inputs may affect the lateral migration of low water channels in the Upper and Middle Mersey (McDowell and O’Connor, 1977). Additionally, localised erosion of the Ince Banks region and Dungeon Bay has provided a recent source of sediment, however, this is very small compared to marine sources (HR Wallingford, 1999).

New Mersey Crossing Gifford and Partners Morphology Desk Study Page 15 Report No. B4027/TR03/03
The exact balance of marine versus fluvial sediment sources in the study area is not clear. Although the Mersey Estuary as a whole is considered to be heavily influenced by marine sediment sources, the distance of the study area from the mouth of the estuary may mean that these have a less prominent role and that fluvial sources are more significant. Without further data it is not possible to be more precise about the relative contributions of marine and fluvial sediment sources. However O’Connor (1987) field data from 1955-1965 found that the average yearly values (Mm3 /yr) were as follows:
• Sand influx (Sn) = 1.85 Mm3/yr - no dredging influence • Silt influx (SSn) = 2.43 Mm3/yr - no dredging influence • River influx (Sr) = 0.04 Mm3/yr
Based on the hydrodynamics it must be reasoned that in the study area the fluvial input is low based on the differences between tidal discharge and fluvial discharge, and that transport is therefore likely to be flood dominant based on tidal asymmetry. The Mersey Estuary is sensitive to morphological change (in particular at the mouth of the estuary) although parts of the system are confined by geology and (in some places) bank protection and seawalls (Van der Wal and Pye, 2000).
2.11 Anthropogenic Influences
There have been a number of significant anthropogenic modifications to the Mersey Estuary over the last few centuries (detailed in Table 2.5). The main activities include dredging of channels for navigation and the construction of training walls and other structures. Dredging Dredging started in 1833 to provide access to the Ports of Liverpool and Birkenhead. However, regular dredging of the channel only commenced after 1890 and by the time of training wall construction in 1909, there was already significant dredging to maintain the approaches to the busy port of Liverpool. Volumes of material removed through dredging peaked between 1912 and 1950, removing 320 x 106 m3 (8.4 x 10⁶ m3 per year) in comparison to the 100 x 106 m3 between 1950 and 1988 (2.6 x 10⁶ m3 per year). Currently on average 0.4 x 10⁶ m3 of sediment is removed from the Mersey estuary per year. (Van der Wal and Pye, 2000). The construction of the training walls suppressed channel meandering and confined a greater part of the estuary’s ebb tidal flow within the trained channel leading to a strengthening of the flood tide along the North Wirral and Lancashire coastlines. Therefore, sediment moved down-coast by the enhanced flood tide velocities has contributed to siltation in both the trained channel and in the estuary itself – any reduction in sediment entering the system can perhaps be explained by an initial reduction in sediment supply due to the ‘closure’ of subsidiary channels as a result of the training works and it is possible that a change in sediment movement i.e. more suspended silt concentrations lead to more sediment (silt sized) being removed from the system. During the Second World War only maintence dredging was carried out and in 1966 the ruling depth for navigation was increased, which resulted in a short term increase in dredging.

New Mersey Crossing Gifford and Partners Morphology Desk Study Page 16 Report No. B4027/TR03/03
Prandle (2000) estimated that peak dredging levels in the first half of the century were of the order of 10 million tonnes/year, which was reduced to approximately 1 million tonnes/year after 1950. Prandle also estimated that about 10% of the total dredged material was deposited within the estuary system during this period. Table 2.6 summarises estuary wide capacity changes and associated dredging activities.
Net volume change
Period Liverpool Bay
Upper Mersey
Dredging in Outer Channel
Dredging in Upper Mersey
Disposal within system
1833-1871 71 Mm3 -16 Mm3 0 Mm3 0 Mm3 0 Mm3
1871-1906 65 Mm3 5 Mm3 After 1860 60 Mm3 After 1890 15 Mm3 Not known but small
1906-1936 -22 Mm3 33 Mm3 180 Mm3 65 Mm3 30 Mm3
1936-1977 130 Mm3 40 Mm3 135 Mm3 75 Mm3 25 Mm3
Table 2.6 - Capacity Changes in Relation to Past Dredging Activities
(from Prandle, 2000)

New Mersey Crossing Gifford and Partners Morphology Desk Study Page 17 Report No. B4027/TR03/03
Pre 1830’s 1830’s - 1870’s 1880’s - 1900’s 1910’s - 1930’s 1940’s - 1960’s 1970’s - present
Route change
Two main approaches to the estuary in 1766 – Rock channel (west) and Formby channel (north)
Between 1838 – 1854 the Crosby Channel became a separate feature from the Formby Channel
Crosby Channel moved north and Askew spit had advanced into the channel (1885-1909)
NW passage alignment altered and main route into estuary by 1912
Rock Channel relict feature by 1938
Rock channel completely disappeared by 1955
Infilling of Formby Channel 1950 - 1961
Taylor’s Bank and Formby Bank amalgamated in 1970
Taylor’s Bank continues to erode eastward finally reaching equilibrium in 2002
Channel change patterns
1738 – Inner estuary had two channels (hugged north and south banks and joined at Devils Bank off Eastham)
1842 (and onwards) – Inner estuary had three channels.
Channel could occupy any part of the estuary between 1867 and 1918
High lateral change of the lower water channel in the Inner estuary (1861 – 1911)
Reduced channel movement from 1911 in the Inner estuary.
Channel restricted and hugged the northern shore between 1921 and 1961
Increased lateral channel activity from 1961 to present day
Volume change
Sand flats west of Formby Point decreased in area between 1738 and 1833
Sand flats west of Formby Point grew considerably in size between 1838 - 1854
Rock Channel began to infill between 1833 and 1912
Capacity ranged between 770 and 730 million m3 (1860 to 1910)
Between 1906 and 1936 accretion rates of 5mm/yr (in Inner estuary)
Reduction in capacity from 750 to 680 million m3 (1910 to 1960)
Sediment infill at Bromborough Bar (1954)
Between 1936 and 1956 accretion rates of 24mm/yr (in Inner estuary)
Between 1956 and 1977 accretion rates of 3mm/yr (in Inner estuary)
Increase in capacity from 680 to 700 million m3 (1960 to 1990)
Between 1977 and 1997 erosion rates of 19mm/yr (in Inner estuary)
Net accretion of 70 x 106 m3 in the estuary during 1900 to 1988
Training walls
Taylor’s Bank revetment (1909 – 1910)
Crosby West Training Bank (1923 – 1930)
Crosby East Training Bank (1929 – 1930)
Askew Spit Training Bank (1933 – 1935)
Queens North Training Bank (1933 – 1938)
South Training Bank (1935 – 1938)
Queens North Training Bank (1946 – 1957)
South Training Bank (further extended to 1957)
Management
1868 - Aethelfleada Bridge was constructed for the railway
1894 - Manchester ship canal completed
1896 – River Weaver diverted and slag embankments placed between Widnes and Hale Head
Construction on the Transporter Bridge started in 1901 and opened in 1905. It was demolished in 1961 and replaced by the Silver Jubilee Road bridge.
Construction on the Silver Jubilee Bridge started in 1954 and was opened to traffic in 1961
Power station ??
Loss of capacity of the estuary due to land reclamation since 1861 approx 12 x 106 m3 (Van der Wal and Pye, 2000)
Dredging
Approaches to the Mersey dredged for navigation purposes from 1833
Dredging of the Bar and deepening of the sea channel in Liverpool Bay 1890
320 x 106 m3 dredged between 1912 and 1950
Maintenance dredging of the Eastham channel and ship canal approach 1950’s
1953-4 – dredging of Bromborough Bar
100 x 106 m3 dredged between 1950 and 1988
Currently 0.4 x 10⁶ m3 dredged every year from the estuary to ensure depths are maintained for navigation purposes (Combe et al .,1993).
Floods 1767, 1799, 1828 1837, 1852, 1866, 1872, 1877
1886, 1890 1911, 1923 1933, 1948
Droughts 1785, 1788, 1791
Table 2.5 – Timeline of events
Training wall construction started

New Mersey Crossing Gifford and Partners Morphology Desk Study Page 18 Report No. B4027/TR03/03
Training Walls The training walls were constructed along the face of Taylor’s Bank in the Outer Mersey in 1909 to initially prevent the continued Northward movement of the Crosby Channel, and also to prevent a smaller channel breaking through Taylor’s Bank. The training walls were extended during the period 1910 to 1957 (as detailed in Table 2.5), and included the Queens North, South, Askew Spit, Crosby West and Crosby East Training Banks (Van der Wal and Pye, 2000). Other activities The Irwell, Mersey and Bollin all flow into the Manchester Ship Canal (completed in 1894), each river carrying sufficient suspended sediment to cause problems for canal maintenance. The material (mainly sand but also silt) has been periodically removed and deposited upstream over a large area of land near Warrington. The canal clearly acts as a sediment trap, limiting the supply of fluvial sediment to the study reach. Fluvial sediment supply is therefore limited to inputs from remaining tributaries such as the Sankey Brook. The fluvial supply of sediment to the estuary is small compared to the supply of sediment from offshore sources (O’Connor, 1987; van der Wal and Pye, 2000). Other man-made structures within the main channel, including flood embankments and bridges (detailed in Table 2.5), will have also had some impact on the sediment system. These features could have affected circulation patterns leading to increased scour or deposition in localised areas (as detailed in Price and Kendrick, 1965).

New Mersey Crossing Gifford and Partners Morphology Desk Study Page 19 Report No. B4027/TR03/03
3. HISTORICAL DATA SOURCES Analysis of historical maps can provide an insight in to the long-term trends of the physical system. Comparison of historical maps from 1881 to the present date indicates that, whilst there has been little change in the position of the ‘permanent’ banks of the Mersey throughout the study reach, there may have been many changes in the extent of mud flats and in the position of sand banks and the low water channels. However, personal communication with the Ordnance Survey suggests that this historical mapping does not accurately record the position of sedimentary features within the permanent banks of the estuary and therefore, the locations of the low water channels. As such, historical aerial photographs and bathymetric surveys of the estuary are considered to provide a more accurate overview of change and the following sections identify the data sources and methods of analysis adopted. The following sections introduce sources of information available to determine the channel locations, fluctuations in bathymetry and changes in volumes within the study area and Inner estuary as a whole.
3.1 Bathymetric surveys
Bathymetric surveys for the Mersey Estuary have been obtained and analysed from a number of different sources: 1. Bathymetric surveys for the Upper Mersey Estuary undertaken by The Mersey Docks
and Harbour Commission. The surveys were taken from 1936 to 1977 in five yearly intervals and a final survey was taken in 1997 with the assistance of HR Wallingford. Each of the earlier surveys took over six months to produce, which could have led to changes in topography prior to the survey being complete. However, it is still possible to study the data with relation to the change in bed depth and the location of the channel.
2. Hydrographic surveys charting survey information for intertidal and offshore areas
produced by The United Kingdom Hydrographic Office (UKHO), marketed under the Admiralty brand. The Admiralty were contacted to ascertain whether they had produced a chronological series of charts for the study area. They have a chart entitled ‘Manchester Ship Canal and Upper River Mersey’ (May 2001). It was felt that this would not be beneficial to this study due to insufficient detail and accuracy and therefore, this avenue was not pursued further.
3. LIDAR and Sonar Survey data (2002), produced by the Environment Agency (EA).
The EA were consulted to determine whether they had any relevant hydrographic information. Bathymetric and Water Depth Information was sourced from the provided by the Environment Agency. Field surveys were performed to provide calibration data for the LIDAR survey and this contemporary data has been used in all the subsequent hydrodynamic modelling. However, given the difference in format, data collection methods and sensitivity of the LIDAR survey, it has not been used for the purpose of temporal analysis. This analysis has all been based on the series of bathymetric surveys.

New Mersey Crossing Gifford and Partners Morphology Desk Study Page 20 Report No. B4027/TR03/03
The bathymetric surveys were analysed to investigate lateral channel movements between 1936 and 1977. This provided an indication of the stability of channel positions, illustrating whether the channels migrate significantly or follow a fixed channel alignment. The bathymetric surveys were scanned and converted to AutoCAD files to allow the production of scaled drawings showing the main channel locations. The different scaled drawings for selected years were overlain to investigate the changes over different time periods. All the bathymetric surveys used within the analysis are displayed in Appendix A. It must be noted that the bathymetric surveys are only an indicative representation of the actual situation due to the errors in the collection of the data and also within the CAD work due to the poor quality of the original surveys. However, it is unclear if the channel positions have been surveyed at the same time as the bathymetric survey or whether they have been transposed from an OS map. This is yet to be confirmed by Mersey Docks and Harbour Company.
3.2 EMPHASYS Data
The Estuaries Research Programme funded by MAFF (now DEFRA), the Environment Agency and English Nature was established in response to the need for methods to predict changes to estuary functioning. The first phase of the Programme was aimed at producing guidance on the techniques that can be applied to achieve this understanding. EMPHASYS (Estuarine Morphology and Processes Holistic Assessment SYStem) was the first phase of the Research Programme and aimed at providing guidance on the prediction of morphological change in estuarine systems. GIS data from the EMPHASYS database for years 1906, 1936, 1956, 1977, and 1997 was obtained for the study area. All figures relating to EMPHASYS results are located in Appendix B the first figure illustrates the channel form derived from EMPHASYS data. In addition to the production of a technical guidance note the first phase of the programme gathered together data on six representative estuaries (Blackwater, Humber, Ribble, Mersey, Tamar and Southampton Water) in the EMPHASYS database. Included with these data is summary information on a further 18 estuaries and present-day bathymetries for 79 UK estuaries, of which 66 have information on the tidal prism and cross-sectional area at mean tide level. The data is currently subject to licensing restrictions.
3.3 Aerial photographs
Aerial photographs were obtained for 1945, 1951, 1959, 1963, 1966, 1975, 1979, 1983, 1991 and 2000 (see Appendix C). Out of these, the 1945, 1966, 1975, 1983 and 1991 photographs showed the main channels. The locations of the channel were captured through onscreen digitising in MapInfo GIS (see figure 3.1). An additional date from 1993 was obtained using landline data showing the channel position. These channel locations at various dates were laid over the 2000 aerial photo to put the data into context and compare them to the most recent known location of the channel as detailed in Figure 3.2.

New Mersey Crossing Gifford and Partners Morphology Desk Study Page 21 Report No. B4027/TR03/03
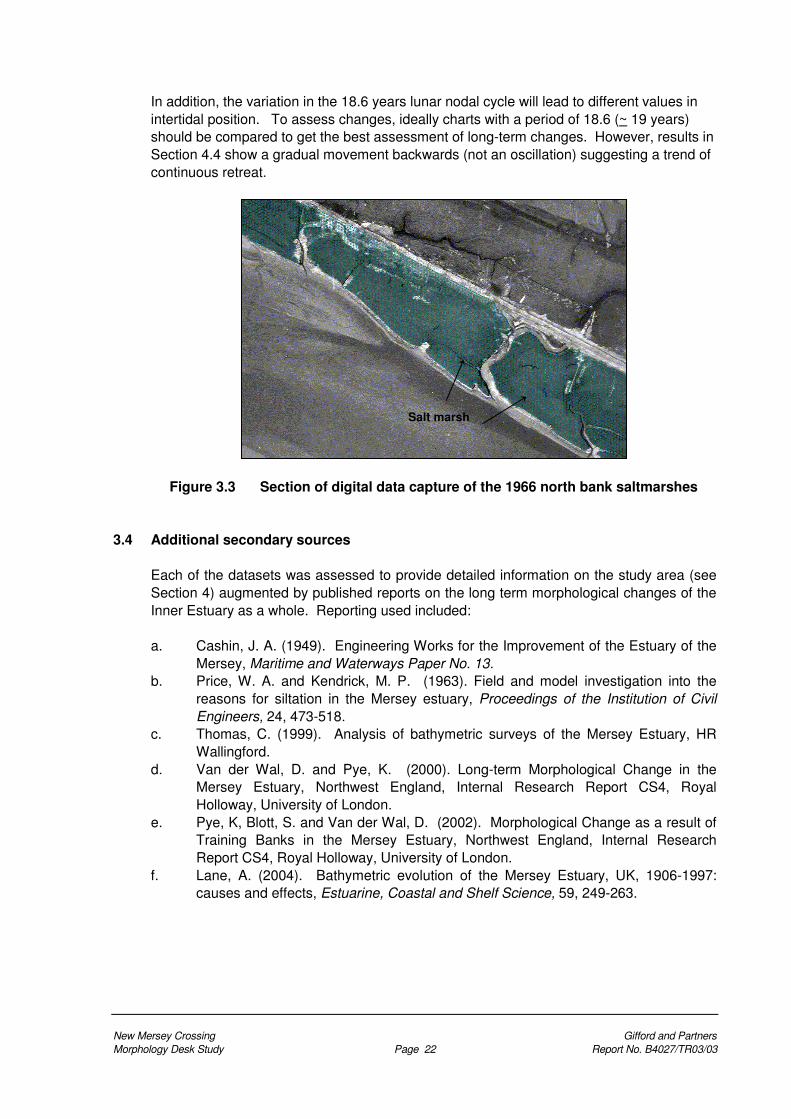
Figure 3.1 Section of digital data capture of the 1945 channel In addition to the locations of historical channels, saltmarsh locations were also digitised for a number of years including 1945, 1951, 1959, 1936 (part), 1966, 1979 (part), 1983, and 1991 (see figure 3.3). These were also overlain on the 2000 aerial photo to compare to the 2000 position of the saltmarsh edge and for context.
Figure 3.2 – Locations of past channels derived from aerial photographs
There are certain errors associated with aerial photos, although the more recent photographs: 1983, 1991 and 2000 have less error. It is generally accepted (GeoSense pers comm., 2003) that the older aerial photographs (pre 1983) have an error of +/- 5m and therefore any change in the channel of less than 5m could be due to rectification error and not natural channel or saltmarsh movement.
Channel
New Mersey Crossing Gifford and Partners Morphology Desk Study Page 22 Report No. B4027/TR03/03
In addition, the variation in the 18.6 years lunar nodal cycle will lead to different values in intertidal position. To assess changes, ideally charts with a period of 18.6 (~ 19 years) should be compared to get the best assessment of long-term changes. However, results in Section 4.4 show a gradual movement backwards (not an oscillation) suggesting a trend of continuous retreat.
Figure 3.3 Section of digital data capture of the 1966 north bank saltmarshes
3.4 Additional secondary sources Each of the datasets was assessed to provide detailed information on the study area (see Section 4) augmented by published reports on the long term morphological changes of the Inner Estuary as a whole. Reporting used included:
a. Cashin, J. A. (1949). Engineering Works for the Improvement of the Estuary of the
Mersey, Maritime and Waterways Paper No. 13. b. Price, W. A. and Kendrick, M. P. (1963). Field and model investigation into the
reasons for siltation in the Mersey estuary, Proceedings of the Institution of Civil Engineers, 24, 473-518.
c. Thomas, C. (1999). Analysis of bathymetric surveys of the Mersey Estuary, HR Wallingford.
d. Van der Wal, D. and Pye, K. (2000). Long-term Morphological Change in the Mersey Estuary, Northwest England, Internal Research Report CS4, Royal Holloway, University of London.
e. Pye, K, Blott, S. and Van der Wal, D. (2002). Morphological Change as a result of Training Banks in the Mersey Estuary, Northwest England, Internal Research Report CS4, Royal Holloway, University of London.
f. Lane, A. (2004). Bathymetric evolution of the Mersey Estuary, UK, 1906-1997: causes and effects, Estuarine, Coastal and Shelf Science, 59, 249-263.
Salt marsh

New Mersey Crossing Gifford and Partners Morphology Desk Study Page 23 Report No. B4027/TR03/03
4. ANALYSIS OF CHANGE
4.1 Cross-sectional changes Following the work surveying the bathymetry of the area by the Mersey Docks and Harbour Commission, five cross sections have been drawn through the study area for the years 1967, 1972 and 1997; refer to Figures 4.1 to 4.6. The data from the other survey dates could not be used to draw the cross sections due to the illegibility of both paper and electronic data sets.
‘A’
‘A’
‘B’
1967 SURVEY
SOUNDINGS IN FEET AND INCHESDatum to which soundings are reduced,
To approximately the Low Water Level of a 30 feet Tide at Liverpool, or 10 feet below the level of Old Dock Sill, or 14.54 feet below Ordnance Datum Newlyn.
‘B’
‘C’
‘C’
‘D’
‘D’
‘E’
‘E’
‘A’
‘A’
‘B’
1967 SURVEY
SOUNDINGS IN FEET AND INCHESDatum to which soundings are reduced,
To approximately the Low Water Level of a 30 feet Tide at Liverpool, or 10 feet below the level of Old Dock Sill, or 14.54 feet below Ordnance Datum Newlyn.
‘B’
‘C’
‘C’
‘D’
‘D’
‘E’
‘E’
Figure 4.1 - Location of Cross-sections

New Mersey Crossing Gifford and Partners Morphology Desk Study Page 24 Report No. B4027/TR03/03
-0.5
0
0.5
1
1.5
2
2.5
3
3.5
4
4.5
5
5.5
0 50 100 150 200 250 300 350 400 450 500
Distance from Southern Bank (m)
Bed
Lev
el A
OD
N (m
)19971972
1967
MHWS
MLWN
MLWS
MHWN
Figure 4.2 - Cross-section ‘A-A’ through the Channel (looking Downstream)
0
0.5
1
1.5
2
2.5
3
3.5
4
4.5
5
5.5
6
6.5
0 100 200 300 400 500 600 700 800 900 1000 1100 1200 1300 1400 1500
Distance from Southern Bank (m)
Bed
Lev
el A
OD
N (m
)
1997
1972
1967
MHWS
MLWN
MLWS
MHWN
Figure 4.3 - Cross-section ‘B-B’ through the Channel (looking Downstream)
0
0.5
1
1.5
2
2.5
3
3.5
4
4.5
5
5.5
6
6.5
7
7.5
0 100 200 300 400 500 600 700 800 900 1000 1100 1200 1300 1400
Distance from Southern Bank (m)
Bed
Lev
el A
OD
N (m
)
1997
1972
1967
MHWS
MLWN
MLWS
MHWN
Figure 4.4 - Cross-section ‘C-C’ through the Channel (looking Downstream)

New Mersey Crossing Gifford and Partners Morphology Desk Study Page 25 Report No. B4027/TR03/03
0
0.5
1
1.5
2
2.5
3
3.5
4
4.5
5
5.5
6
6.5
0 100 200 300 400 500 600 700 800 900 1000 1100
Distance from Southern Bank (m)
Bed
Lev
el A
OD
N (m
)
1997
1972
1967
MHWS
MLWN
MLWS
MHWN
Figure 4.5 - Cross-section ‘D-D’ through the Channel (looking Downstream)
0
0.5
1
1.5
2
2.5
3
3.5
4
4.5
5
5.5
6
6.5
7
0 100 200 300 400 500 600 700
Distance from Southern Bank (m)
Bed
Lev
el A
OD
N (m
)
1997
1972
1967
MHWS
MLWN
MLWS
MHWN
Figure 4.6 - Cross-section ‘E-E’ through the Channel (looking Downstream)
It can be seen that there are general trends associated with all of the cross sections. The surveys show that the channel splits at the location of Fiddler’s Ferry and two channels form. One of the channels flows close to the southern bank of the estuary and the other to the northern bank. This basic channel pattern is reflected in the EMPHASYS data and aerial photos discussed in Sections 4.2 and 4.3. This can be seen in Figure 4.3, Figure 4.4 and Figure 4.5. The point where the river splits consistently appears to be just to the east of the head of Hempstones Point. Figure 4.3 indicates that the northern channel has moved laterally by approximately 300m in the five-year period between 1967 and 1972, suggesting that the channel is still mobile. Present observations suggest that when the mean high water neap tide occurs, the majority of the tidal flow occurs within the southern channel (see Figures 4.3, 4.4 and 4.5). The two channels then converge just upstream of the Runcorn Gap (Figure 4.6).

New Mersey Crossing Gifford and Partners Morphology Desk Study Page 26 Report No. B4027/TR03/03
In the Inner estuary as a whole (Van der Wal and Pye, 2000; Pye et al., 2002) the cross sectional areas from 1906 to 1977 show that the channel cross-section locations are consistent with the results in the above figures and show similar patterns of channel movement and accretion to the bifurcated cross-sections in Figures 4.4 and 4.5.
4.2 Changes in volume
The Mersey estuary as a whole has been infilling naturally since the beginning of the Holocene at a steady rate (as discussed previously). The following section looks at how this natural sediment regime has changed and Section 5 discusses the main reasons behind these changes in patterns of accretion. Bathymetric changes in the estuary have been well documented over the last century, with surveys being conducted every 10 years since 1861, and every 5 years from 1881 until 1977. This has led to a number of studies on historical bathymetric analysis of the Mersey Estuary (Price and Kendrick, 1963; O’Connor, 1987; Thomas, 1999; Van der Wal and Pye, 2000; Pye et al., 2002; Lane, 2004). The studies confirm that from 1900 to 1977 the estuary has been slowly infilling, with the largest rate of accretion occurring between 1936 and 1956. In addition, studies suggest that the rate of infilling has slowed in the second half of the century, and that since 1977 the estuary capacity has increased. In fact Van der Wal and Pye (2000) and Pye et al. (2002) predict that erosion is part of this new sediment regime.
610
620
630
640
650
660
670
1930 1940 1950 1960 1970 1980 1990 2000 2010
Year
Vol
ume
(mill
ion
cubi
c m
etre
s)
Figure 4.7 - Mersey Estuary total volumes at HAT (after Thomas, 1999) Accretion in the estuary has not been evenly distributed, and the most substantial decrease in estuary volume has occurred in the Middle Mersey basin. Comparatively little accretion has taken place in the Narrows, the high flows ensures sedimentation is limited as was

New Mersey Crossing Gifford and Partners Morphology Desk Study Page 27 Report No. B4027/TR03/03
described earlier, and very limited change has occurred within the Upper Mersey and around the development site.
The bathymetric data from the EMPHASYS database was used to produce graphs summarising the physical properties of the Upper Mersey. This included: • Volumetric analysis of the estuary section as a whole, the low-water channels, the
intertidal and the supratidal regions. • Aerial analysis of the low-water channels, the intertidal and the supratidal regions • Average depth analysis of the estuary section as a whole, the low-water channel,
the intertidal and the supratidal regions. For the purposes of this analysis the channel was defined as the area below MLWS (0.6m ODN), the intertidal as MLWS to MHWS (0.6 to 5.1m ODN) and the supratidal as the area above MHWS (Figures 4.8 to 4.11). In the Middle Mersey the decrease in estuary volume has been attributed to: • increased supply of sediment to the estuary due to the training works at the mouth • changes in mobility of the low water channels (Price and Kendrick, 1963; Kendrick
and Stevenson, 1985). Within the hydrodynamics study area, the overall trend between 1906 and 1997 has been one of siltation and, therefore, a reduction in storage capacity. Channel volumes over the study period have decreased by 76,400m3, and both intertidal and supratidal prisms have reduced by 832,000 m3 and 243,000m3 respectively (Figure 4.8).
0
5000000
10000000
15000000
20000000
25000000
1900 1910 1920 1930 1940 1950 1960 1970 1980 1990 2000 2010
Year
Vol
ume
of e
stua
ry (m
3)
Channel vol: less than MLW S
Intertidal Vol: MLW S between MHW S
Intertidal & Channel Vol: less than MHW S
Supratidal Vol: more than MHW S
Total Vol
Figure 4.8 - Comparison of Estuary Capacities in Study Area Over the Last Century

New Mersey Crossing Gifford and Partners Morphology Desk Study Page 28 Report No. B4027/TR03/03
-2.00
-1.00
0.00
1.00
2.00
3.00
4.00
5.00
6.00
7.00
1900 1920 1940 1960 1980 2000 2020
Ele
vatio
n (m
OD
N)
Overall elevation
Average channel elevation: less than MLWS
Average intertidal elevation: between MLWS and MHWS
Average supratidal elevation: more than MHWS
Figure 4.9 - Comparison of Average Channel, Intertidal, Supratidal, and Overall
Elevations in Study Area Over the Last Century
0
500000
1000000
1500000
2000000
2500000
3000000
3500000
1900 1920 1940 1960 1980 2000 2020
Year
Are
a (m
2)
Total area
Channel area: less than MLWS
Intertidal area: between MLWS and MHWS
Supratidal area: more than MHWS
Figure 4.10 - Comparison of Channel, Intertidal, Supratidal, and Total Areas
in Study Area Over the Last Century

New Mersey Crossing Gifford and Partners Morphology Desk Study Page 29 Report No. B4027/TR03/03
0
10
20
30
40
50
60
70
80
90
100
1900 1920 1940 1960 1980 2000 2020
Year
% A
rea
Area of Channel: less than MLWS
Area of Intertidal: between MLWS andMHWSArea of Supratidal: more than MHWS
Figure 4.11 - Comparison of %Area of Channel, Intertidal, Supratidal and Total Area
of Study Area Over the Last Century Although the general trend appears to have been one of siltation, 1936 represents a perturbation. From 1906 to 1936 there was a significant period of net sediment loss in the channels (potentially due to erosion leading to channel widening, down-cutting etc or through dredging in some form). The increase in channel volume of 462,000m3, led to an increase in the overall volume of the section of some 97,500 m3, despite decreases in the intertidal and supratidal prisms of 24,500 and 104,600 m3. These changes were associated with a 5% decrease in intertidal area and a 6% increase in supra tidal area, with channel area remaining constant. Comparison of raw data for these years indicates that this increase in volume can be attributed to a large increase in 5-10m ODN region of the channel around the Widnes to Runcorn bridges at the western end of the site, where depths increased by some 1m from 1906 to 1936. Following this perturbation in 1936, the estuary has undergone steady net sediment gain, with the overall section volume decreasing by 1,240,000m3 (Figure 4.8). This sediment gain has been achieved by decreases in the intertidal, supratidal and channel volumes of 808,000 m3, 138,000 m3 and 543,000m3, respectively. These volume decreases were associated with an increase in bed elevations of 0.5m and 0.7m in the intertidal and supratidal regions (Figure 4.9). Average channel elevations showed a substantial increase of 1.5m, which again can be largely attributed to changes in channel depth around the Runcorn Gap. These changes have been accompanied by a 6% (190,000m2) increase in the intertidal area, whilst the supratidal area has remained fairly constant since 1936 (Figure 4.11). Table 4.1 gives values as calculated for the Dronkers (γ) parameter1, the ratio of tidal amplitude to mean depth (a/h) and channel volume to storage (Vs/Vc). These are also plotted against time on Figure 4.12. Values close to 1 indicate an approximate balance
1 This dimensionless term defines the ratio of the durations of the ebb to the flood tide. Thus if the durations of the ebb and flood are similar, γ tends to 1. As γ increases, the duration of the flood with respect to the ebb decreases and vice versa.

New Mersey Crossing Gifford and Partners Morphology Desk Study Page 30 Report No. B4027/TR03/03
between flood and ebb dominance. It can be seen that values of the Dronkers parameter indicate an overall flood dominance. However, the estuary as a whole has become increasingly less flood dominant towards the second half of the century when the rates of accretion decreased. This is consistent with the decreased rates of marine infilling and supports the theory that the estuary is stabilising. Thomas (2000) concluded that the estuary exhibited greater ebb dominance towards the mouth, whilst there was a tendency towards greater flood dominance in the intertidal Upper reaches.
Year γγγγ Parameter a/h Vs/Vc
1871 1.41 0.571 2.624
1906 1.58 0.530 2.296
1936 1.53 0.529 2.325
1956 1.53 0.538 2.288
1977 1.34 0.558 2.564
1997 1.31 0.575 2.680
Table 4.1 - Tidal parameters for the Mersey Estuary (from Thomas, 2000)
0
0.5
1
1.5
2
2.5
3
1860 1880 1900 1920 1940 1960 1980 2000 2020
Years of survey
Val
ue
GammaParametera/h
Vs/Vc
Figure 4.12 Variation of γγγγ parameter, a/h and Vs/Vc with time
Elevations in the channel, intertidal region, and supratidal have increased in the region of 0.25m, 0.3m, and 0.7m, respectively (Figure 4.9) indicating a general shallowing of the estuary. Siltation has also led to a decrease in the width of the low water channels. This narrowing has led to a 5% (168,000m2) reduction in surface area of the low water channels (Figures 4.10 and 4.11). The decrease in low water channel area has been accompanied by a 5% (167,000m2) increase in the supratidal area. By comparison the intertidal area has remained fairly constant over this period, with the exception of a reduction in 1936. This process is not considered to be exceptional and over the Holocene period the Mersey Estuary has been infilling, as have other local estuaries such as the Ribble. This infilling of the estuary represents an adjustment in the channel form to compensate for the over-deepening and down-cutting that occurred during the last Ice Age (Pye and Van der Wal, 2000b).

New Mersey Crossing Gifford and Partners Morphology Desk Study Page 31 Report No. B4027/TR03/03
4.3 Channel change
The results from the accumulation of the aerial photographs, bathymetric surveys and EMPHASYS data suggests that the low water channel system is very dynamic. Previous investigations into the trends of these patterns in the middle of the estuary suggest that there were significant reductions in changes of channel movement post 1891 and channels tended to stick or hug to the north and south banks instead of moving freely within the estuary. All historical datasets (presented in this report or detailed in published literature) confirm that this pattern of increasing stability in the middle estuary is mimicked in the inner estuary and the study area. It also is apparent that channel widths have decreased over this time. Noticeably the North Channel appears to have decreased in width by undergoing siltation in the mid channel, leading to the division of the channel into two channels followed by subsequent closure of one channel. The largest changes in channel position have been around the position of the channel split in the vicinity of Hempstones Point. There appears to be only one location where there has always been a mudflat in the centre of the estuary. This is approximately between 700m and 1500m to the east of the Runcorn Gap.
Figure 2 in Appendix B demonstrates a similar pattern, with the largest changes in channel position occurring around the location of the channel split. To identify the main trends of this dynamic change, analysis and interpretation has been undertaken for three data sets (detailed in Section 3): (i) The 55 years between 1945 and 2000 (Aerial Photographs) (ii) The 41 years between 1936 and 1977 (Historical bathymetric data) (iii) The 91 year period between 1906 and 1997 (EMPHASYS data) All datasets conclude that the main channel splits into two just north of Hempstones Point and then converges just upstream of the Runcorn Gap. One channel runs along the North Bank (here referred to as the North Channel) and one along the South Bank (the South Channel). This channel arrangement has meant that there have been two areas of mudflats, one to the south of Cuerdley Marsh and one in the centre of the estuary near to the Runcorn Gap, although the exact positions have varied. The area of mud flat in the centre of the estuary, 700m and 1,500m to the east of the Runcorn Gap, was present in the 41 years from 1936 to 1977, as well as the 91 years from 1906 to 1997 and the 55 years from 1945 to 2000. Additionally, along the banks of the estuary, the locations of both Astmoor Saltmarsh and Cuerdley Marsh remain unchanged from 1936 to 2000. Although the aerial photographs suggest that there are small changes in the physical location of the seaward edges of the marsh with an overall trend of saltmarsh loss through erosion and reclamation (see Section 4.4). The historical bathymetric data illustrates that this split location has been associated with the meandering of the South Channel and its subsequent cut off and capture by the North Channel. One of the most noticeable aspects of channel variability is the movement of the South Channel from adjacent to the south bank to a more northerly position in the centre of the channel (observed in the aerial photos in Figure 4.13 (a-g)). In particular, the low water channel in the 1945 aerial photograph has no southern channel. This anomaly is not found in any of the other aerial photographs or other datasets available and could have been
New Mersey Crossing Gifford and Partners Morphology Desk Study Page 32 Report No. B4027/TR03/03
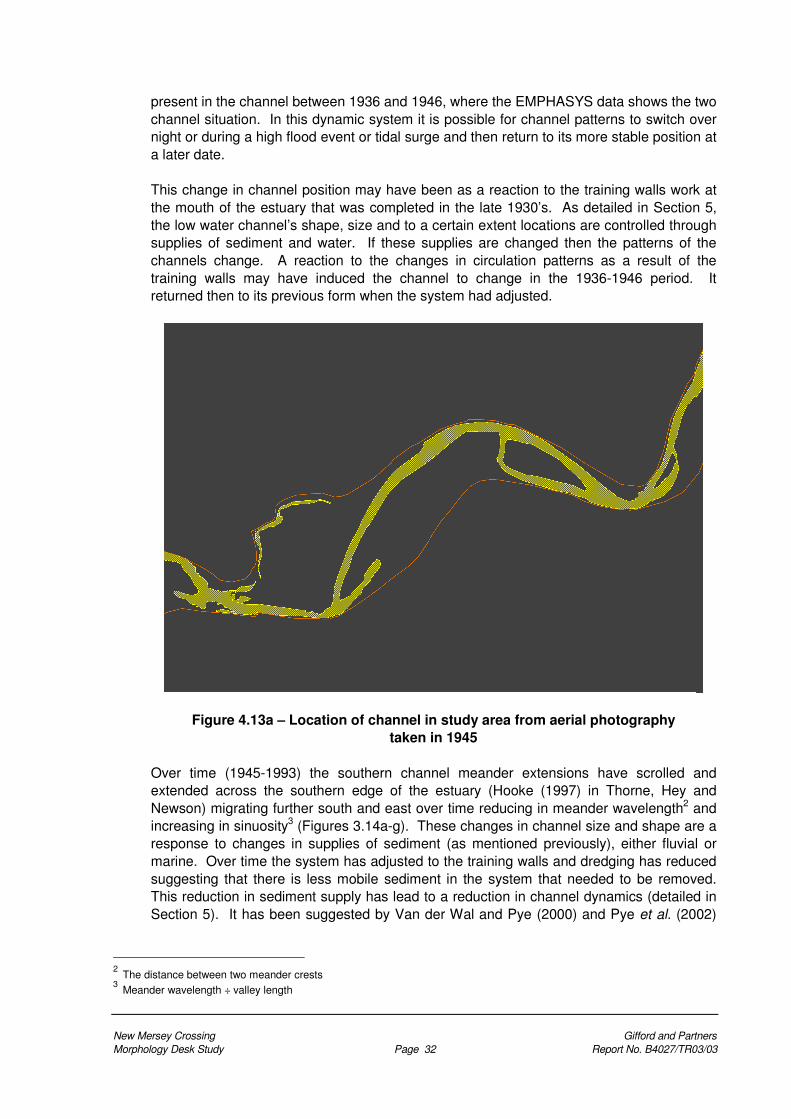
present in the channel between 1936 and 1946, where the EMPHASYS data shows the two channel situation. In this dynamic system it is possible for channel patterns to switch over night or during a high flood event or tidal surge and then return to its more stable position at a later date. This change in channel position may have been as a reaction to the training walls work at the mouth of the estuary that was completed in the late 1930’s. As detailed in Section 5, the low water channel’s shape, size and to a certain extent locations are controlled through supplies of sediment and water. If these supplies are changed then the patterns of the channels change. A reaction to the changes in circulation patterns as a result of the training walls may have induced the channel to change in the 1936-1946 period. It returned then to its previous form when the system had adjusted.
Figure 4.13a – Location of channel in study area from aerial photography taken in 1945
Over time (1945-1993) the southern channel meander extensions have scrolled and extended across the southern edge of the estuary (Hooke (1997) in Thorne, Hey and Newson) migrating further south and east over time reducing in meander wavelength2 and increasing in sinuosity3 (Figures 3.14a-g). These changes in channel size and shape are a response to changes in supplies of sediment (as mentioned previously), either fluvial or marine. Over time the system has adjusted to the training walls and dredging has reduced suggesting that there is less mobile sediment in the system that needed to be removed. This reduction in sediment supply has lead to a reduction in channel dynamics (detailed in Section 5). It has been suggested by Van der Wal and Pye (2000) and Pye et al. (2002)
2
The distance between two meander crests
3 Meander wavelength ÷ valley length

New Mersey Crossing Gifford and Partners Morphology Desk Study Page 33 Report No. B4027/TR03/03
that this pattern of accretion is slowing down and in the future erosion will dominate the system.
Figure 4.13b – Location of channel in study area from aerial photography taken in 1966 (only partial coverage of the low water channel)

New Mersey Crossing Gifford and Partners Morphology Desk Study Page 34 Report No. B4027/TR03/03
Figure 4.13c – Location of channel in study area from aerial photography taken in 1975 (only partial coverage of the low water channel)
Figure 4.13d – Location of channel in study area from aerial photography taken in 1983

New Mersey Crossing Gifford and Partners Morphology Desk Study Page 35 Report No. B4027/TR03/03
Figure 4.13e – Location of channel in study area from aerial photography taken in 1991
Figure 4.13f – Location of channel in study area from aerial photography taken in 1993

New Mersey Crossing Gifford and Partners Morphology Desk Study Page 36 Report No. B4027/TR03/03
Figure 4.13g – Location of channel in study area from aerial photography taken in 2000
Kendrick and Stevenson (1985) as cited in Van der Wal and Pye (2000) and Pye et al. (2002) suggest that there are three main periods of lateral channel activity and movement within the Inner Estuary as a whole. The ‘Narrows’ have remained relatively stable over this time period due to the geology in this area restricting movement. From 1861 to 1911 the Inner Estuary low water channel experienced a period of high activity and lateral movement with wide fluctuations in channel position and a gradual trend in decreasing volume of the estuary. Between 1911 and 1961 this lateral activity of the low water channel significantly reduced and was matched with a consistent and rapid reduction in estuary volume. From 1961 to 1977 (and to present, as suggested by Van der Wal and Pye, 2000 and Pye et al., 2002) there has been an increase in lateral channel activity and an apparent levelling off of estuary volume changes. Reasons for these changes in sediment regime for the estuary are discussed in Section 5.2.
4.4 Saltmarsh change The aerial photos provide a useful overview of the trends of saltmarsh advance and retreat. It is important to note here, that any movement in the position of the saltmarsh edge less than 5m is considered to be an artefact of the rectification process. However, it is possible to identify trends of either advance or retreat over a number of years as is demonstrated in Figures 4.14 and 4.15 below. The changes in colours represent changes in years and go from dark blue (1945) through green, to yellow (1991). The general trend for the majority of the banks within the study area is that of retreat. The area that has retreated most significantly is that area shown in Figure 4.14 at the most south western edge of the south bank. It is the continuous meander extension of the

New Mersey Crossing Gifford and Partners Morphology Desk Study Page 37 Report No. B4027/TR03/03
southern channel in the study that has eroded this area and has retreated the saltmarsh by 9 to 12m. However the north-east edge of Astmoor Saltmarsh appears to have advanced as it is situated on the inside of a meander bend (Figure 4.15) by 3m. It is important to note this impact of the 18.6 years lunar modal cycle on saltmash loss. For example, the difference in tidal range between the peak and trough of the nodal cycle is approximately 0.30m on the Humber Estuary. For example, a 1:100 gradient represents a 30m difference in position of mean tide level. However the pattern of continuous retreat or advance does not suggest that this tidal cycle has influenced saltmarsh development in this area.
Figure 4.14 Example of saltmarsh retreat on the south bank
1945
1959
1963 1983
1979
1991
2000
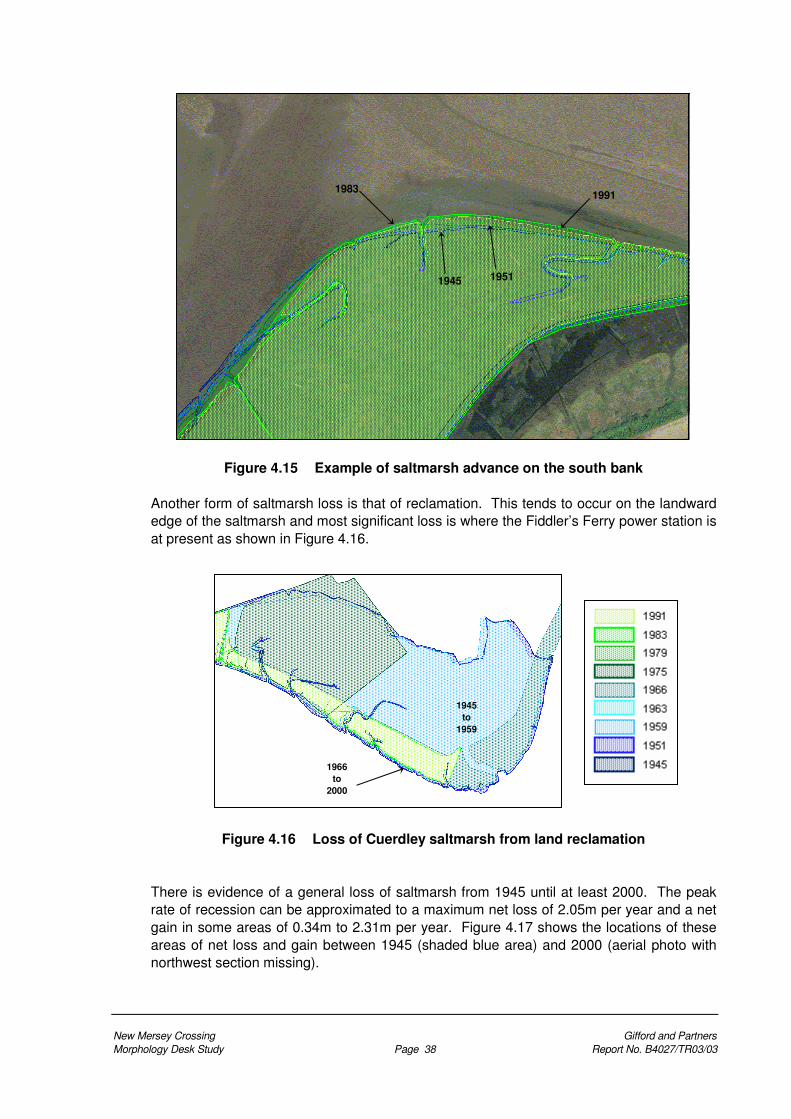
New Mersey Crossing Gifford and Partners Morphology Desk Study Page 38 Report No. B4027/TR03/03
Figure 4.15 Example of saltmarsh advance on the south bank Another form of saltmarsh loss is that of reclamation. This tends to occur on the landward edge of the saltmarsh and most significant loss is where the Fiddler’s Ferry power station is at present as shown in Figure 4.16.
Figure 4.16 Loss of Cuerdley saltmarsh from land reclamation There is evidence of a general loss of saltmarsh from 1945 until at least 2000. The peak rate of recession can be approximated to a maximum net loss of 2.05m per year and a net gain in some areas of 0.34m to 2.31m per year. Figure 4.17 shows the locations of these areas of net loss and gain between 1945 (shaded blue area) and 2000 (aerial photo with northwest section missing).
1945 1951
1983 1991
1945 to
1959
1966 to
2000

New Mersey Crossing Gifford and Partners Morphology Desk Study Page 39 Report No. B4027/TR03/03
Figure 4.17 – Locations and rates of saltmarsh loss and gain from 1945 to 2000 Although Figure 4.17 shows the distribution of the erosion and accretion of the saltmarshes it is difficult to identify overall trends of change. Table 4.2 shows the changes in saltmarsh area from 1945 to 1991 for the south and north marsh areas. Although some of the aerial photo datasets are incomplete (marked by * on the table) it allows the general trend of loss of saltmarsh to be identified.
South saltmarsh North saltmarsh
Year Area (m2)
Change between consecutive surveys (m2)
Area (m2)
Change between consecutive surveys (m2)
Comments
1945 581000 - 1271000 - No development on north marsh 1951 581000 0 1360000 +89000 No development on north marsh 1959 592000 +9000 1295000 -65000 No development on north marsh 1966 593000 +1000 1063000 -232000 Power station lagoons partly constructed
on north marsh 1975 546000 -47000 928000 * -135000* Power station lagoons partly constructed
on north marsh 1979 526000 -20000 * * Power station lagoons construction
completed on north marsh 1983 551000 +25000 557000 * -371000* Power station lagoons present on north
marsh 1991 527000 -24000 552000 -5000 Power station lagoons present on north
marsh
Table 4.2 – Rate of change in area of both north and south saltmarshes (* incomplete datasets)
14.5m = -0.26m/yr
12.5m = -0.23m/yr
28m = -0.51m/yr
15m = -0.27m/yr
14.5m = -0.26m/yr
127m = +2.31m/yr 18.9m =
+0.34m/yr
113m = -2.05m/yr
59.0m = -1.07m/yr
37.0m = -0.67m/yr
27.5m = +0.5m/yr
New Mersey Crossing Gifford and Partners Morphology Desk Study Page 40 Report No. B4027/TR03/03
The southern marsh shows an overall net loss of 0.054 km2 or 54000m2 and it is reasonable to assume that this trend will continue. However, in the northern shore this trend is overshadowed by the reclamation of a large area of saltmarsh (now the site of a power station) and the incomplete dataset. Although the overall trend on both south and north saltmarshes is one of retreat or loss of land there is a certain amount of fluctuation and some years there has been a substantial gain in saltmarsh area. It is important to note that there are a certain number of caveats that need to be considered when analysing these datasets, these include:- • aerial photography rectification errors • accuracy of data capture • correct identification of saltmarsh • incomplete dataset for northern saltmarsh General trends in saltmarsh erosion and accretion are believed to be directly related to the lateral movement of the low water channels.
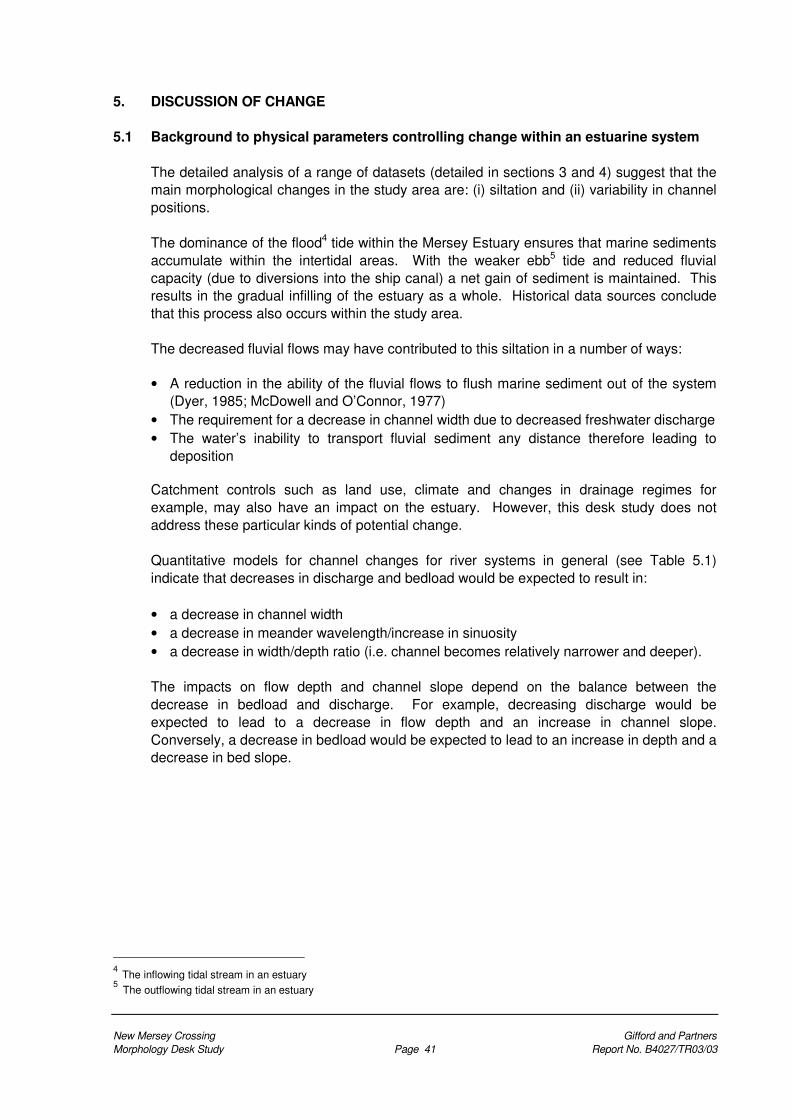
New Mersey Crossing Gifford and Partners Morphology Desk Study Page 41 Report No. B4027/TR03/03
5. DISCUSSION OF CHANGE
5.1 Background to physical parameters controlling change within an estuarine system The detailed analysis of a range of datasets (detailed in sections 3 and 4) suggest that the main morphological changes in the study area are: (i) siltation and (ii) variability in channel positions. The dominance of the flood4 tide within the Mersey Estuary ensures that marine sediments accumulate within the intertidal areas. With the weaker ebb5 tide and reduced fluvial capacity (due to diversions into the ship canal) a net gain of sediment is maintained. This results in the gradual infilling of the estuary as a whole. Historical data sources conclude that this process also occurs within the study area. The decreased fluvial flows may have contributed to this siltation in a number of ways: • A reduction in the ability of the fluvial flows to flush marine sediment out of the system
(Dyer, 1985; McDowell and O’Connor, 1977) • The requirement for a decrease in channel width due to decreased freshwater discharge • The water’s inability to transport fluvial sediment any distance therefore leading to
deposition Catchment controls such as land use, climate and changes in drainage regimes for example, may also have an impact on the estuary. However, this desk study does not address these particular kinds of potential change. Quantitative models for channel changes for river systems in general (see Table 5.1) indicate that decreases in discharge and bedload would be expected to result in: • a decrease in channel width • a decrease in meander wavelength/increase in sinuosity • a decrease in width/depth ratio (i.e. channel becomes relatively narrower and deeper). The impacts on flow depth and channel slope depend on the balance between the decrease in bedload and discharge. For example, decreasing discharge would be expected to lead to a decrease in flow depth and an increase in channel slope. Conversely, a decrease in bedload would be expected to lead to an increase in depth and a decrease in bed slope.
4 The inflowing tidal stream in an estuary 5 The outflowing tidal stream in an estuary

New Mersey Crossing Gifford and Partners Morphology Desk Study Page 42 Report No. B4027/TR03/03
Response
Process
Wat
er
disc
harg
e
Bed
load
(as
%of
tota
l lo
ad)
Wid
th
Dep
th
Mea
nder
w
avel
engt
h
Cha
nnel
S
lope
Sin
uosi
ty
Wid
th/
dept
h ra
tio
Decreased discharge ↓ - ↓ ↓ ↓ ↑ - ↓
Decreased bed load - ↓ ↓ ↑ ↓ ↓ ↑ ↓
Decreased bed load and discharge ↓ ↓ ↓ ↑ ↓ ↓ ↑ ↓ ↑ ↓
Increased discharge ↑ - ↑ ↑ ↑ ↓ - ↑
Increased bed load - ↑ ↑ ↓ ↑ ↑ ↓ ↑
Increased bed load and discharge ↑ ↑ ↑ ↑↓ ↑ ↑↓ ↓ ↑
Increased bed load and decreased discharge ↓ ↑ ↑↓ ↓ ↑↓ ↑ ↓ ↑
Table 5.1 - Qualitative models of channel change, illustrating the direction of
morphological response for decreases in discharge and bedload (after Schumm, 1969)
Adjustment to change River systems adjust to changes in sediment and discharge by changing the size, shape and/or number of the channels as discussed in the previous section and in Table 5.1 and Figure 5.1. This adjustment generally takes place in the form of vertical and/or lateral channel change. Meander development in one form or another is the fundamental process of lateral channel change within riverine systems and is a function of bank collapse and bar accumulation. However, the controls and drivers on this process are complex and dependant on a number of factors ensuring that the morphology of individual river bends can be highly variable and unpredictable. Within river systems (and estuaries) lateral movement is ultimately confined by physical parameters such as depositional features, geology, valley sides and manmade structures. It is likely that the canals and developed (reclaimed land) either side of the estuary in the study area are the main factors controlling the extent of the meander migration of the channels, ensuring that features such as cut-offs, chutes and avulsions do not take place. Although there does not appear to be a literature base for ‘channel switching’ in estuarine environments per se, the authors of this report believe that, given the importance of fluvial flows as a factor in low water channel change, there may well be some value in making an analogy with ‘channel switching’ in fluvial environments (anastomosing channels). Anastomosing channels typically occur as multiple channels spaced far apart with intervening islands composed of silt-clays and sands. They are associated with low energy settings i.e. low valley slopes and often at river mouths (e.g. deltas). Although studied less than other channel forms there is published evidence to show that channel switching is a relatively unpredictable phenomena and random in nature.

New
Mer
sey
Cro
ssin
g
G
iffor
d an
d P
artn
ers
Mor
phol
ogy
Des
k S
tudy
P
age
43
R
epor
t No.
B40
27/T
R03
/03
Figu
re 5
.1 –
Sch
emat
ic r
epre
sent
atio
n of
mor
phol
ogic
al c
hang
e in
an
estu
ary
(f
rom
Van
der
Wal
and
Pye
, 200
0)
chan
nel t
rain
ing
man
aged
retre
at
recl
amat
ion
and
emba
nkin
g
dum
ping
of d
redg
e sp
oil
sand
min
ing
fluvi
al s
edim
ent
avai
labi
lity
offs
hore
sed
imen
t av
aila
bilit
y
litho
logy
/ se
dim
ent
ante
cede
nt
geom
orph
olog
y
CO
NS
TRA
INTS
sedi
men
t tra
nspo
rt
bath
ymet
ry/
topo
grap
hy
wav
e an
d w
ater
le
vel c
ondi
tions
near
shor
e w
ave
clim
ate
offs
hore
w
ave
clim
ate
river
dis
char
ge
tides
mea
n se
a le
vel
win
d
wav
es
FOR
CIN
G
FAC
TOR
S
chan
nel d
redg
ing
HU
MA
N
INFL
UE
NC
ES
tidal
pris
m

New Mersey Crossing Gifford and Partners Morphology Desk Study Page 44 Report No. B4027/TR03/03
In estuary systems, the bi-directional flows and freshwater/sea water mixing can further complicate meander formation. Previous studies have demonstrated that in estuaries meander wavelengths are greater than for rivers, and are governed by the combined freshwater and tidal discharges (University of Newcastle, 1999). Additionally, in estuaries changes in one reach of an estuary, such as erosion or deposition, can produce changes in flows and sediment supply either upstream or downstream, resulting in increased natural variability (Pontee and Townend, 1999).
5.2 Specific reasons for changes to the sediment regime in the Mersey The previous section detailed the hypothetical reason for channel change within the Mersey over the last 200 years. However, there has been a marked change over time in the patterns of this change. The following sections provide suggestions/answers to these changes in patterns of lateral channel movement and accretion within the Inner estuary. Van der Wal and Pye (2000) Pye et al., 2002) state that the construction of training walls in Liverpool Bay and the mouth of the Mersey estuary (see Table 2.5) is the most important factor in the morphological development of the estuary since 1912. It is stated that the construction of the training walls is directly linked to an increase in accretion rates within the estuary. In addition, the dredging activity that has been undertaken since the beginning of the 19th Century has also contributed to altering patterns of change. The alteration of the circulation system within the estuary as a result of these works led to accretion of sediment within the system, reducing the estuary volume. It is understood that the training works were designed to focus flow in the main navigation channel. This, as expected, increased the ebb flow within the navigation channel, but also increased the flood dominance of the channels outside of this area and extended this dominance further inshore. It has been observed that this ultimately resulted in the infilling of the Rock and Formby Channels. This strengthened flood tide meant that more sediment could be carried into the estuary from offshore (Irish Sea), already understood to be the source of sediment for the gradual infilling of the estuary since the beginning of the Holocene. It has also been suggested (Van der Wal and Pye, 2000; Pye et al., 2002) that dredging activity is also responsible for some of these increases in accretion rates. This is not directly as a result of the removal of sediment, as might be expected, but from the subsequent dumping of this material offshore. Studies of long-term drift patterns suggest that offshore dumping in particular locations has contributed to the shoaling of the Formby Channel (up to 1961 when dumping at a particular spoil site was reduced), development of Jordan Spit and led to changes in Great Burbo Bank (spoil sites abandoned in 1923 (to the east) and 1961 (to the west)). In this study it has been noted that vertical channel change is taking place as a reaction to a decrease in discharge, and sediment accretion is raising the bed heights (decreasing the depth of the channel). In addition, although the Mersey is considered to be ‘well mixed’, the distance of the inner estuary from the sea might preclude the idea that there is less mixing in the study area. Partially mixed estuaries tend to carry more marine based sediment into the system (due to the presence of a salt wedge). Subsequently this sediment falls out of suspension when mixed with freshwater to ultimately create more sediment deposition within the area.

New Mersey Crossing Gifford and Partners Morphology Desk Study Page 45 Report No. B4027/TR03/03
As such, the construction of Manchester Ship Canal is likely to have had a significant effect on these aspects of estuary morphology. The canal has captured the flows of several rivers, thereby reducing the freshwater flow and sediment supply to the Mersey. In addition, the canal rejoins the Mersey significantly further downstream than its source, thereby reducing the fluvial flows in the inner estuary area. It is interesting to note, therefore, that in a drought (Price and Kendrick, 1963) decreased fluvial flows led to increased flocculation of fine sediment and as such created a reduction in the amount of sediment deposited within the estuary in ‘problem’ areas of high siltation. The changes in lateral movement (or reduction of movement) of low water channels in the Inner estuary is unlikely to contribute to the trend in accretion of the mud flats if movement was restricted (as suggested in Price and Kendrick, 1963). The inshore movement of sediment from the Irish Sea, increased by the changes in circulation patterns, is the primary cause of sediment accumulation in the area. The freshwater flows are too weak to create a net movement of sediment out of the system. The low water channel can at the least redistribute material within the estuary, but ultimately this is refreshed with every flood tide. The shape and size of the low water channels within the inner estuary are also affected by changing management practices. Historically the system has been very dynamic, however, post construction of the training walls the variability of the system has reduced as first documented by Price and Kendrick (1963) with respect to the middle estuary. Historical data sources suggest that this pattern of reduced dynamism in mimicked in the inner estuary, and the bifurcated channel has remained relatively attached to the north and south banks with reducing meander wavelengths and increasing sinuosity. This phenomenon is a typical reaction to the changes in the supply of sediment and water within the system (as discussed in the previous section). Van der Wal and Pye (2000) and Pye et al., (2002) predict that in the future the system will start to erode with a net movement of sediment out of the estuary.

New Mersey Crossing Gifford and Partners Morphology Desk Study Page 46 Report No. B4027/TR03/03
6. CONCLUSIONS In common with many other UK estuaries, the Mersey Estuary has been infilling throughout the Holocene period. Over the last several hundred years the estuary has been subject to substantial anthropogenic modification including port construction, dredging and training works, bridge crossings and river diversions. As a whole, the estuary has not reached an equilibrium form displaying an increase in volume of sediment (and, therefore, a decrease in capacity) since around 1977. The Middle and Upper Mersey are characterised by a series of banks and channels, which show lateral movement. The Middle Mersey is documented as having undergone the highest rates of siltation over historical times. Analysis carried out here also shows that over similar timescales the Upper Mersey has also undergone siltation. In the study area the sub-tidal channels have decreased in depth and width, whilst the intertidal/supratidal areas have accreted vertically. Comparison of the Mersey with estuaries such as the Humber indicates that channel switching may be dependant on combinations of freshwater flow, tidal discharge and antecedent bed topography. In the Inner Humber the bed slope was noted to be greater where switching occurred and, like the Humber, it appears that the location of the channel switching within the Mersey may be governed by bed slope and energy gradient. In the Mersey, McDowell and O’Connor (1977) note that the channel slope between Dingle and Warrington, which corresponds to those areas where channel switching occurs, has a very steep bed slope. Additionally, the same authors tentatively suggested that the position of channels in the vicinity of Hale Head might be controlled by the freshwater discharge. However, in the study area it is not possible to identify shifts in channel dominance from North to South Channel. Instead the region is characterised by shifts in channel location around the position of channel divergence at Hempstones Point. In the future the general trend for siltation in the study area is likely to continue. However, there may be a decrease in the rate of siltation, as has happened in the Middle Mersey, where erosion is now believed to be occurring. In the study area the rate of siltation in the future will depend on the balance of marine to fluvial sediment supply. It is likely that the North and South Channel will continue to exist and migrate laterally across the estuary. Over the past 41 years, lateral movements of up to 500m have been documented and these rates are likely to continue. The aerial photography, the historic bathymetric data and the EMPHASYS data all suggest that this lateral migration is likely to continue to be most pronounced upstream of Hempstones Point. The high rates of morphological variability observed in the study area on a day-to-day basis suggest that the process of meander migration is highly stochastic and the channels display similar properties to riverine anastomosing channels. Detailed bathymetric survey data would be required to document and quantify these changes. However, the reported variability suggests that there may be no one dominant factor governing channel position. Whilst there is an area of mudflat in the centre of the study area, which has been present over the last 91 years, there is no guarantee that a low water channel might not form here in the future. However, with the possible exception of 1955, the data analysed here indicates that the channel positions at this point have been fairly stable from 1906 to 2000.

New Mersey Crossing Gifford and Partners Morphology Desk Study Page 47 Report No. B4027/TR03/03
The overall trend in saltmarsh change is one of retreat and reclamation leading to a net loss of saltmarsh over the past 55 years. The seaward edge of the saltmarsh is eroding in most places due to the presence of outside meander bends. There are some areas of accretion on the inside of bends, but overall there is a net loss of saltmarsh from the process of lateral migration. Given the complexity of meander systems in estuaries in general and the evident variability of channels and banks in the study area, it is not possible to predict the future positions of the estuary channels and banks. However, based on this study the area between the Silver Jubilee Bridge and the middle of the study area is dominated by relatively stable low water channels and studies on patterns of change suggest that a bridge alignment some 1000m downstream of Hempstones Point, with bridge piers avoiding the present north and south channels and utilising the central relatively stable sand bank, would offer the least risk of what remains an uncertain situation.

New Mersey Crossing Gifford and Partners Morphology Desk Study Page 48 Report No. B4027/TR03/03
7. REFERENCES ABP Research, 1999. Humber Estuary geomorphological studies - Stage 2. Annex 5: Thalweg and bed level analysis. Report No. R.854. ABPmer, 2001a. An investigation of the gross properties of UK estuaries. Report No. R.900. ABPmer, 2001b. Futurecoast West Coast Process Review. Start Point to River Eden. Report No. R.917. pp 26-27. ABPmer, 2001c. Futurecoast - Macro review of coastal processes around England and Wales. Report No. R.920. Admiralty Chart, 2001a. Manchester Ship Canal and Inner River Mersey. Chart No. 3478. Admiralty Chart, 2001b. Port of Liverpool. Chart No. 3490. Brown, EH, (1979). The Shape of Britain, Transactions of the Institute of British Geographers, New Series, 4, 449-462 Comber, D. P. M., Hansom, J. D and Fahy, F. M. 1993. Estuaries Management Plans. Coastal Processes and Conservation. Mersey Estuary. University of Glasgow, Glasgow, 78pp Davidson N.C., d'A Laffoley D., Doody J.P., Way L.S., Gordon J., Key R., Drake C.M., Pienkowski M.W., Mitchell R. and Duff K.L. 1991. Nature conservation and estuaries in Great Britain. Nature Conserve Council. Dennis JM and Spearman JR, 1994. Estuary Regime: Towards long-term prediction., Hydraulics Research Report IT414, June, HR Wallingford, 56pp. Dennis JM, Spearman JR and Dearnaley MP, 2000. The development of a regime model for the prediction of the long-term effects of civil engineering activities on estuaries, Journal of Physics and Chemistry of the Earth, Volume 25, 1, 45-50 Downhill SB and Shimwell DW, 2000. Sediment depositional sequences in the Mersey Basin in the Holocene, The Holocene (in press) Dyer K.H. 1985. Coastal and estuarine sediment dynamics. John Wiley & Sons. pp 231 EMPHASYS Consortium, 2000. A guide to prediction of morphological change within estuarine systems., Version 1B. Research by the EMPHASYS Consortium for MAFF Project FD 1401. Report TR 113, HR Wallingford, UK. Gameson A.L.H. 1982. The quality of the Humber estuary, 1961-1981. Humber Estuary Committee. Fraser Cliff, July 2002. Acting Mersey Conservator. Personal communication to John Harris at ABPmer.

New Mersey Crossing Gifford and Partners Morphology Desk Study Page 49 Report No. B4027/TR03/03
Harvey AM, 1985. The river systems of North-west England., pp122-142, in Johnson, R.H. (ed) The geomorphology of North-west England., Manchester University Press, Manchester and Dover, New Hampshire, 421pp Horton BP, 1994. Holocene alluvial sequences of the Bollin Valley, Cheshire., Department of Geography Working Paper, University of Portsmouth, 30, 1-25 Horton BP, Innes JB, Plater AJ, Tooley MJ and Wright MR, 1999. Post-glacial evolution and relative sea-level changes in Hartlepool and the Tees Estuary, England, pp 65-87 in Bridgland, D.R, Horton, B.P. and Innes, J.B. (eds) Late Quaternary of Northeast England, Field Guide, Quaternary Research Association, University of Durham. HR Wallingford. 1998. Mersey Estuary survey data. Presentation at Environment Agency Meeting Warrington. HR Wallingford. 1999. Analysis of bathymetric surveys of the Mersey Estuary. Report No. IT 469. IECS, 1994. The Humber Estuary, Coastal Processes and Conservation. Institute of Estuarine and Coastal Studies, University of Hull. Johnson RH, 1969. A reconnaissance survey of some river terraces in part of the Mersey and Weaver catchment., Mem. Proce. Manchester Lit. Phil. Society., 112. 1-35 JNCC, 1996. Coasts and seas of The United Kingdom: Region 13 - Northern Irish Sea: Colwyn Bay to Stranraer, including The Isle of Man. Lane A., Prandle D, Harrison AJ Jones PD and Jarvis CJ, 1997. Measuring fluxes in tidal estuaries: sensitivity to instrumentation and associated data analyses, Estuarine, Coastal and Shelf Science., 45(4): 433-451. Long AJ, 2000. Late Holocene sea-level change and climate., Progress in Physical Geography, 24(3), 415-423 Long AJ, 2001. Mid Holocene sea-level change and coastal evolution, Progress in Physical Geography, 253 (3), 399-408 McDowell, D. M., and O’Connor, B. A. 1977. Hydraulic Behaviour of estuaries. London: McMillan Press Ltd., pp. 292 O’Connor B.A. 1987. Short and long term changes in estuary capacity. Journal of the Geological Society. Volume 144 pp 187 - 195. Plater AJ, Long AJ, Huddart D, Gonzales S and Tooley MJ, 1999. The land of the Mersey Basin: Sea-level changes. pp13-20 in Greenwood, E.F (ed) Ecology and Landscape Development of the Mersey Basin, Liverpool University Press and National Museums and Galleries on Merseyside. Pontee, N I. and Townend, I. H. 1999. The development of a cause consequence model for an estuary system. MAFF conference of River and Coastal Engineers, Keele University, 30th June-2nd July 1999, Keele.

New Mersey Crossing Gifford and Partners Morphology Desk Study Page 50 Report No. B4027/TR03/03
Prandle D., and Lane A. 2000. Modelling tide and marine sediments in the Mersey with 1-D, 2-D and 3-D models - A critique of their respective capabilities and limitations. EMPHASYS Consortium Paper 6. Modelling Estuary Morphology and Process. Final Report. pp 27-33. Prandle D. 2000. Database for EMPHASYS Project - Mersey Estuary. EMPHASYS Consortium Paper 3. Modelling estuary morphology and process. Final Report. pp 13. Price W.A. and Kendrick M.P. 1963. Field and model investigations into the reasons for siltation in the Mersey Estuary. Proceedings of the Institute of Civil Engineers, April. pp 473-517. Pye, K., Blott, S. and Van der Wal, D. 2002. Morphological Change as a Result of Training Banks in the Mersey Estaury, Northwest England. Internal Research Report CS14 Pye K. and van der Wal D. 2000a. Historical trend analysis (HTA) as a tool for long-term morphological predictions in estuaries. EMPHASYS Consortium Paper 14. Modelling estuary morphology and process. Final Report. pp 92-94. Pye K. and van der Wal D. 2000b. Expert Geomorphological assessment (EGA) as a tool for long-term morphological prediction in estuaries. EMPHASYS Consortium Paper 15. Modelling estuary morphology and process. Final Report. pp 97-101. Rogers HR, Crathorne B., and Watts C.D. 1992. Sources and Fate of Organic Contaminants in the Mersey Estuary. Marine Pollution Bulletin. Volume 24. Number 2. pp 82 - 91. Seminara G., Zolezzi G., Tubino M. and Zardi D. 2001. Downstream and upstream influence in river meandering. Part 2. Planimetric development. J Fluid Mechanics. Vol 438. pp 213-230. Thomas C. 2000. 1D modelling of the hydrodynamic response to historical morphological change in the Mersey Estuary. EMPHASYS Consortium Paper 9. Modelling estuary morphology and process. Final Report. pp 55-61. Thomas, C. 1999. Analysis of bathymetric surveys of the Mersey Estuary, HR Wallingford. University of Newcastle, 1998. Channel changes in the Inner Humber Estuary. Draft report. University of Newcastle, 1999. Humber Estuary geomorphological studies - stage 2. Meander energetics model (scenario M7/M8). Draft report. Van der Wal, D. and Pye, K., 2000. Long-term morphological change in the Mersey Estuary, northwest England. Surface Processes and Modern Environments Research Group, Royal Holloway, University of London, Internal Research Report CS5, 21pp Zolezzi, G. and Seminara, G. 2001. Downstream and upstream influence in river meandering. Part 1. General theory and application to overdeepening. J. Fluid Mechanics. Vol 438. pp. 183-211.

New Mersey Crossing Gifford and Partners Morphology Desk Study Report No. B4027/TR03/03
APPENDIX A
CHANNEL POSITIONS

Period 1
1936
Southern Channel
Northern Channel
Cross section
Astmoor Saltmarsh Mudflat
Mudflat
Southern Channel
Northern Channel
Cross section
Astmoor Saltmarsh Mudflat
Mudflat
1946
Flood Channel Cut through
1953
Southern Channel
Northern Channel
Cross section
Astmoor Saltmarsh Mudflat
1954
Southern Channel
Northern Channel
Cross section
Cuerdley Marsh
Astmoor Saltmarsh Mudflat
• North & South Channel Area of North Channel decreases
Area of South Channel increases North & South Channel South Channel greater width
Interim Period 1 - 2 Period 2
Southern Channel
Northern Channel
Cross section
Northerly migration of South Channel
1956
1958
Southern Channel
Northern Channel
Cross section
Area of South Channel
decreases Secondary South Channel forms
• North Channel • Southern Secondary Channel
fully open • Old South Channel infilled
No change No change No change
Period 3 Period 4
1961
Southern Channel
Northern Channel
Cross section
Astmoor Saltmarsh
North Channel split forms
Southern Channel
Northern Channel
Cross section
Astmoor Saltmarsh
1965 1966
Southern Channel
Northern Channel
Cross section
Astmoor Saltmarsh
1967
Southern Channel
Northern Channel
Cross section
Astmoor Saltmarsh
1970
Southern Channel
Northern Channel
Cross section
Astmoor Saltmarsh
1972
Southern Channel
Northern Channel
Secondary Northern Channel
Cross section
Astmoor Saltmarsh
Area of South Channel
decreases and closes Area of North Channel
decreases
No change General Siltation General Siltation General Siltation • General erosion South Channel opens up.
Wigg Island
Wigg Island
Wigg Island
1955 Southern Channel
Northern Channel
Secondary Southern Channel
Secondary Northern Channel
Cross section
Astmoor Saltmarsh
1957
Southern Channel
Northern Channel
Cross section
1960
Southern Channel
Northern Channel
Cross section
Mudflat Astmoor Saltmarsh
Appendix -A Figure 1 – Bathymetric Time Sequence Data
It must be noted that the bathymetric surveys are only an indicative representation of the actual situation due to the errors in the collection of the data and also within the CAD work due to the poor quality of the original surveys. It is however unclear if the channel positions have been surveyed at the same time as the bathymetric survey or whether they have been transposed from an OS map. This is yet to be confirmed by Mersey Docks and Harbour Company.

New Mersey Crossing Gifford and Partners Morphology Desk Study Report No. B4027/TR03/03
APPENDIX B
EMPHASYS DATABASE CHANNEL CONFIGURATION

Appendix B Figure 1 - Channel Configuration 1906 to 1997.
Based on Data From EMPHASYS Database
South Channel
North Channel
Mudflat
1997
Astmoor Saltmarsh
1906
South Channel
North Channel Astmoor Saltmarsh
Mudflat
1936
South Channel
North Channel Astmoor Saltmarsh
Mudflat
1956
South Channel
North Channel
Astmoor Saltmarsh
Mudflat
1977 South Channel
North Channel
Secondary North Channel
Astmoor Saltmarsh
Mudflat
Mudflat

Appendix B Figure 2 - Thalweg Analysis 1906 to 1997
Based on Data From EMPHASYS Database

New Mersey Crossing Gifford and Partners Morphology Desk Study Report No. B4027/TR03/03
APPENDIX C
AERIAL PHOTOGRAPHS

Aerial Photograph 1945
Scale: 1: 15 000

Aerial Photograph 1951
Scale: 1: 15 000

Aerial Photograph 1959
Scale: 1: 15 000

Aerial Photograph 1966
Scale: 1: 15 000
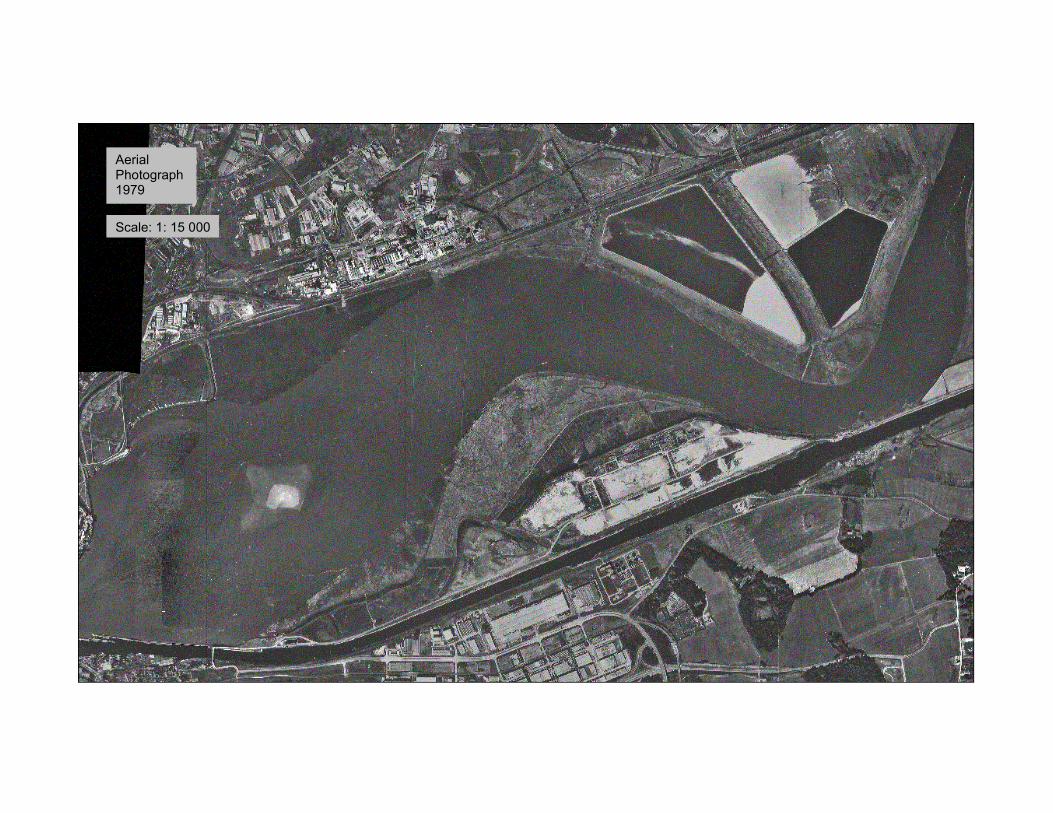
Aerial Photograph 1979
Scale: 1: 15 000
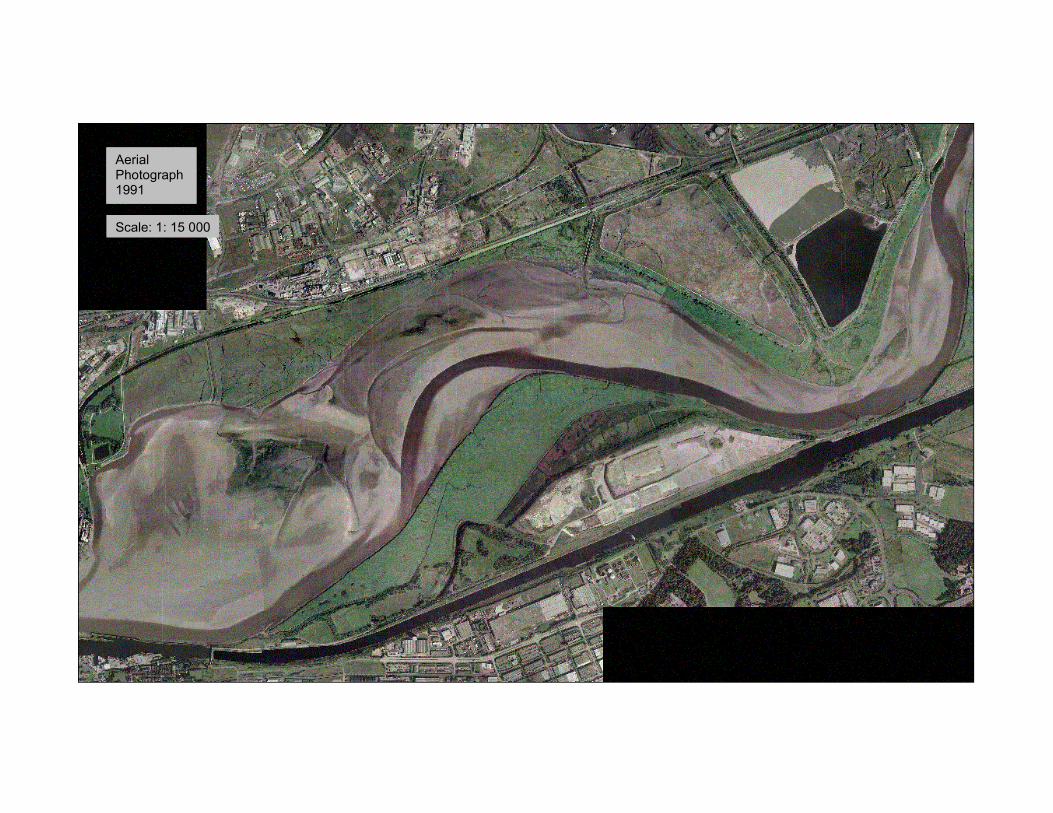
Aerial Photograph 1983
Aerial Photograph 1991
Scale: 1: 15 000

Aerial Photograph 2000
Scale: 1: 15 000

Scale: 1: 15 000
Salt marsh change from 1945 to 1991

New Mersey Crossing Gifford and Partners Morphology Desk Study Report No. B4027/TR03/03
APPENDIX D
LIST OF TECHNICAL REPORTS

New
Mer
sey
Cro
ssin
g
G
iffor
d an
d P
artn
ers
Mor
phol
ogy
Des
k S
tudy
R
epor
t No.
B40
27/T
R03
/03
LIS
T O
F TE
CH
NIC
AL
RE
PO
RTS
Te
chni
cal R
epor
t N
umbe
r
R
evis
ion
R
epor
t Titl
e
Prin
cipa
l Aut
hor
C
urre
nt S
tatu
s
B40
27/T
R01
/01
Th
e A
quat
ic E
colo
gy o
f Int
ertid
al a
nd S
ubtid
al H
abita
ts
AP
EM
Is
sued
Jul
y 20
03
B40
27/T
R02
/01
A
Terr
estri
al E
colo
gy +
Bird
s E
RA
P
Issu
ed A
ugus
t 200
3 B
4027
/TR
03/0
1 A
H
ydro
dyna
mic
s G
iffor
d Is
sued
Oct
ober
200
4 B
4027
/TR
03/0
2 A
A
dden
dum
to H
ydro
dyna
mic
s G
iffor
d Is
sued
Oct
ober
200
4 B
4027
/TR
03/0
3
Hyd
rody
nam
ics
Mor
phol
ogy
Rep
ort
Giff
ord
Issu
ed O
ctob
er 2
004
B40
27/T
R03
/04
H
ydro
dyna
mic
s C
ase
Stu
dy R
epor
t G
iffor
d To
be
issu
ed O
ctob
er 2
004
B40
27/T
R03
/05
H
ydro
dyna
mic
s –
Fine
Mod
el
Giff
ord
To b
e is
sued
Oct
ober
200
4 B
4027
/TR
04/0
1
Con
tam
inat
ion
of S
oil,
Sed
imen
ts a
nd G
roun
dwat
er
Giff
ord
Issu
ed J
uly
2003
B
4027
/TR
05/0
1
Sur
face
Wat
er Q
ualit
y G
iffor
d Is
sued
Jul
y 20
03
B40
27/T
R06
/01
A
ir Q
ualit
y +
Clim
ate
Giff
ord
Issu
ed J
uly
2003
B
4027
/TR
06/0
2
Air
Qua
lity
+ C
limat
e C
asel
la
To b
e is
sued
Nov
embe
r 200
4 B
4027
/TR
07/0
1
Land
scap
e +
Vis
ual A
men
ity
Ber
tram
Hyd
e Is
sued
Jul
y 20
03
B40
27/T
R08
/01
C
ultu
ral H
erita
ge
Giff
ord
Issu
ed J
uly
2003
B
4027
/TR
09/0
1
Tran
spor
t Im
pact
Ass
essm
ent
Giff
ord
Issu
ed J
uly
2003
B
4027
/TR
09/0
2
Tran
spor
t Im
pact
Ass
essm
ent
Giff
ord
To b
e is
sued
Nov
embe
r 200
4 B
4027
/TR
10/0
1
Nav
igat
ion
Impa
cts
Giff
ord
Issu
ed J
uly
2003
B
4027
/TR
11/0
1
Noi
se Im
pact
s C
asel
la
Issu
ed J
uly
2003
B
4027
/TR
11/0
2
Noi
se Im
pact
s C
asel
la
Issu
ed J
uly
2003
B
4027
/TR
12/0
1
Soc
ial I
mpa
cts
Giff
ord
Issu
ed J
uly
2003
B
4027
/TR
12/0
2
Soc
ial A
sses
smen
t of T
ollin
g G
iffor
d To
be
issu
ed N
ovem
ber 2
004
B40
27/T
R13
/01
E
cono
mic
Impa
cts
Am
ion
Issu
ed J
uly
2003
B
4027
/TR
13/0
2
Eco
nom
ic Im
pact
s of
Pre
ferr
ed R
oute
A
mio
n To
be
issu
ed N
ovem
ber 2
004
B40
27/T
R14
Hea
lth Im
pact
Ass
essm
ent
- H
ealth
Impa
ct A
sses
smen
t will
be
inco
rpor
ated
in S
ocia
l Im
pact
Rep
ort i
n 20
05
B40
27/T
R15
/01
G
eote
chni
cal I
nter
pret
ativ
e R
epor
t G
iffor
d Fi
nal D
raft
issu
ed in
Jul
y 20
03 –
Fin
al
to b
e is
sued
Nov
embe
r 200
4 B
4027
/TR
16/0
1
Con
sulta
tions
G
iffor
d Is
sued
Jul
y 20
03
B40
27/T
R16
/02
C
onsu
ltatio
ns
Giff
ord
To b
e is
sued
Nov
embe
r 200
4 B
4027
/TR
17/0
1
Cos
t Rep
ort
Giff
ord
Issu
ed J
uly
2003
B
4027
/TR
17/0
2
Cos
t + R
isk
Ass
essm
ent R
epor
t – P
refe
rred
Rou
te
Giff
ord
To b
e is
sued
Nov
embe
r 200
4

New
Mer
sey
Cro
ssin
g
G
iffor
d an
d P
artn
ers
Mor
phol
ogy
Des
k S
tudy
R
epor
t No.
B40
27/T
R03
/03
Te
chni
cal R
epor
t N
umbe
r
R
evis
ion
R
epor
t Titl
e
Prin
cipa
l Aut
hor
C
urre
nt S
tatu
s
B40
27/T
R18
/01
C
onst
ruct
ion
Met
hods
G
iffor
d Is
sued
Jul
y 20
03
B40
27/T
R18
/02
C
onst
ruct
ion
Met
hods
– P
refe
rred
Rou
te
Giff
ord
To b
e is
sued
Dec
embe
r 200
4 B
4027
/TR
19/0
1
Des
ign
Sta
ndar
ds
Giff
ord
Issu
ed J
uly
2003
B
4027
/TR
19/0
1
Des
ign
Sta
ndar
ds –
Pre
ferr
ed R
oute
G
iffor
d To
be
issu
ed N
ovem
ber 2
004
B40
27/T
R20
/01
Fu
ndin
g O
ptio
ns
Giff
ord
Issu
ed J
uly
2003
B
4027
/TR
21/0
1
Traf
fic S
urve
y G
iffor
d Is
sued
Jul
y 20
03
B40
27/T
R21
/02
Tr
affic
Sur
vey
Giff
ord
To b
e is
sued
Nov
embe
r 200
4 B
4027
/TR
22/0
1
Mod
el V
alid
atio
n G
iffor
d Is
sued
Jul
y 20
03
B40
27/T
R22
/02
M
odel
Val
idat
ion
Giff
ord
To b
e is
sued
Nov
embe
r 200
4 B
4027
/TR
23/0
1
Traf
fic F
orec
astin
g G
iffor
d Is
sued
Jul
y 20
03
B40
27/T
R23
/02
Tr
affic
For
ecas
ting
Giff
ord
To b
e is
sued
Nov
embe
r 200
4 B
4027
/TR
24/0
1
Indu
ced
Traf
fic
Giff
ord
Issu
ed J
uly
2003
B
4027
/TR
24/0
2
Indu
ced
Traf
fic
Giff
ord
To b
e is
sued
Nov
embe
r 200
4 B
4027
/TR
25/0
1
Tran
spor
t Eco
nom
ic E
ffici
ency
G
iffor
d Is
sued
Jul
y 20
03
B40
27/T
R25
/02
Tr
ansp
ort E
cono
mic
Effi
cien
cy
Giff
ord
To b
e is
sued
Nov
embe
r 200
4 B
4027
/TR
26/0
1
Acc
iden
ts
Giff
ord
Issu
ed J
uly
2003
B
4027
/TR
26/0
2
Acc
iden
ts
Giff
ord
To b
e is
sued
Nov
embe
r 200
4 B
4027
/TR
27/0
1
Des
crip
tion
of A
ltern
ativ
es
Giff
ord
To b
e is
sued
Nov
embe
r 200
4