Technical Performance of Refractory Liners for Molten ...
12
Technical Performance of Refractory Liners for Molten Chloride Salt Thermal Energy Storage Systems Samuel Gage, Ph.D. SolarPACES 2020 Virtual Conference September 28 – October 2, 2020
Transcript of Technical Performance of Refractory Liners for Molten ...
Technical Performance of Refractory Liners for Molten Chloride Salt Thermal Energy Storage Systems
Samuel Gage, Ph.D.SolarPACES 2020 Virtual ConferenceSeptember 28 – October 2, 2020

NREL | 2
Generation 3 Concentrating Solar Power (Gen3 CSP)Liquid Pathway
TES System:Hot salt tank (720 °C)Cold salt tank (500 °C)
Zhao and Vidal, Sol. Energy Mater. Sol. Cells, 2020
Nominal salt compositionNaCl:KCl:MgCl220:40:40 mol.%
The ternary-chloride salt is stable to temperatures well above the proposedoperating point of 720°C, which enables the use of more efficient supercritical CO2(sCO2) closed-loop Brayton cycles, with predicted net-cycle efficiencies of ≥ 50%.
Freeze temperature ~ 400°C
NREL | 3
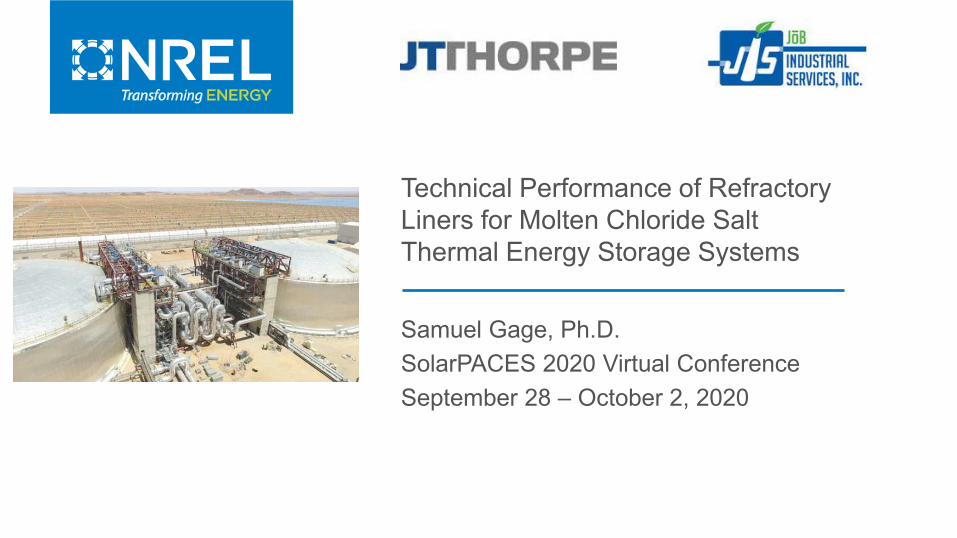
Molten Chloride Salt Thermal Energy Storage Tanks Overview
– Salt is not compatible common steels– Internal lining is only economic choice
• Refractory-ceramic liners selected– Thermal, chemical, mechanical stability– Proven efficacy in similar industries– Cost
• Materials compatibility and down selection– Material immersion in molten salt
• Commercial scale tank design and analysis– Drafting tank and refractory engineering drawings– Finite element analysis of thermal and mechanical
profile of tank in operation– Cost analysis and estimating $/kWhth
Class of ceramics, considered complex composites consisting of multiple ceramic phases, bonding matrixes, and/or defects
Refractory-Ceramics
• Temperature and corrosivity of chloride salt requires use of internal tank liners
Tank Project Research
NREL | 4
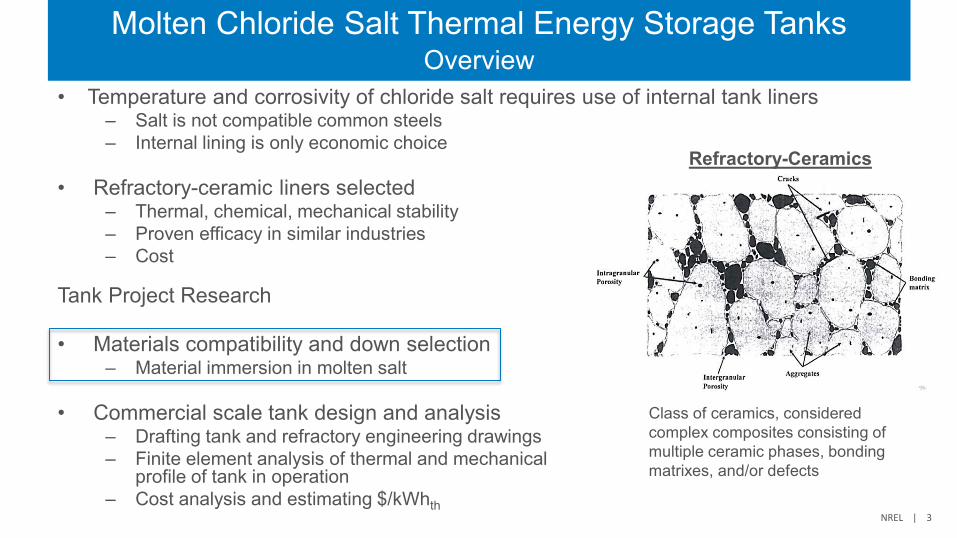
Tank Liner Model and Method Development
Salt (720°C)1. Hot Face2. Insulating Firebrick3. Microporous InsulationCarbon Steel Shell
• Developed a 1-D heat transfer modelling tool in conjunction with industry partners• NREL modelled the effective thermal conductivity of refractories wetted by molten salt
Validated data by comparing to known dry vs. wetted insulation thermal conductivity values• Modelled various liner configurations and liner failure modes for target heat flux of ≤ 276 W/m2
Analysis led to choosing “cold walls” (<100 °C) as the final design over initially proposed “hot walls” (500 °C) design
Possible designsRed: “hot walls” (wet)Blue: “cold walls” (dry)Green: “cold walls” (wet)
Only “cold walls” design that is kept dry meets heat flux and cost targets
NREL | 5
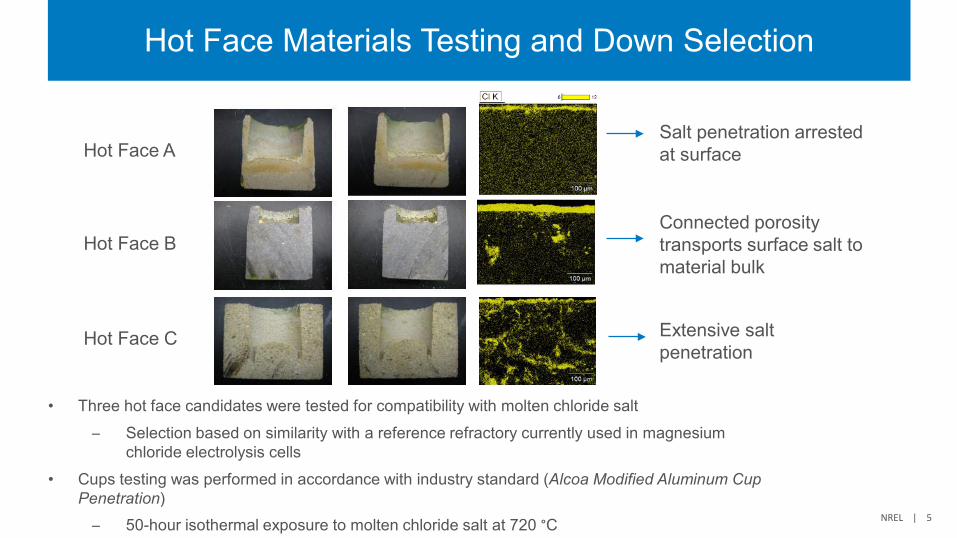
Hot Face Materials Testing and Down Selection
Extensive salt penetration
Connected porosity transports surface salt to material bulk
Salt penetration arrested at surface
• Three hot face candidates were tested for compatibility with molten chloride salt Selection based on similarity with a reference refractory currently used in magnesium
chloride electrolysis cells• Cups testing was performed in accordance with industry standard (Alcoa Modified Aluminum Cup
Penetration) 50-hour isothermal exposure to molten chloride salt at 720 °C
Hot Face A
Hot Face B
Hot Face C
NREL | 6
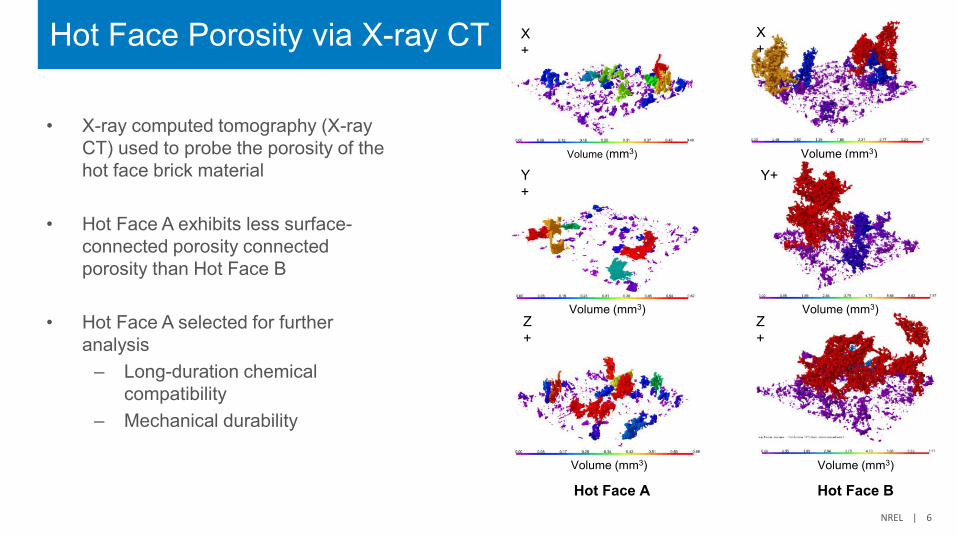
Hot Face Porosity via X-ray CT X+
Volume (mm3)
Y+
Volume (mm3)
Volume (mm3)
Z+
Volume (mm3)
X+
Y+
Z+
Volume (mm3)
Volume (mm3)
Hot Face A Hot Face B
• X-ray computed tomography (X-ray CT) used to probe the porosity of the hot face brick material
• Hot Face A exhibits less surface-connected porosity connected porosity than Hot Face B
• Hot Face A selected for further analysis
– Long-duration chemical compatibility
– Mechanical durability
NREL | 7
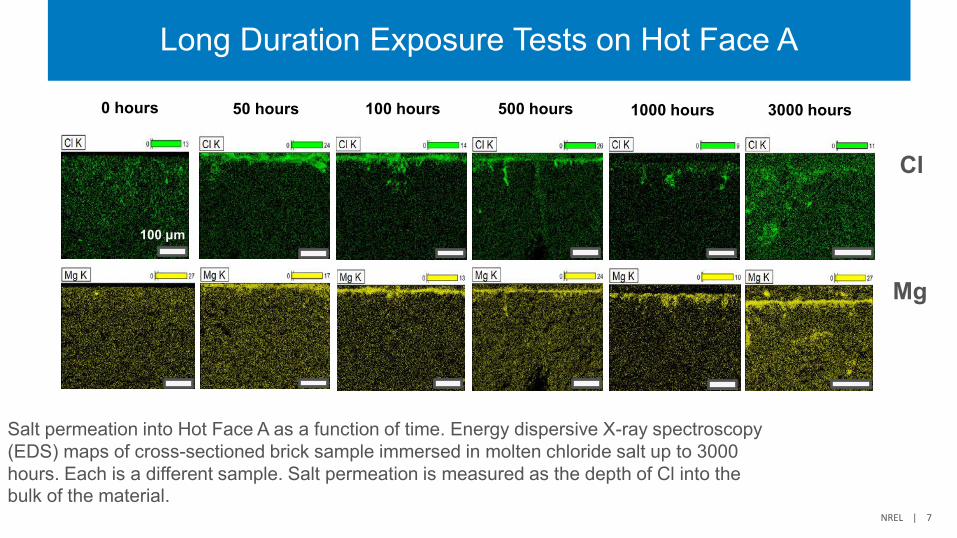
Long Duration Exposure Tests on Hot Face A
Salt permeation into Hot Face A as a function of time. Energy dispersive X-ray spectroscopy (EDS) maps of cross-sectioned brick sample immersed in molten chloride salt up to 3000 hours. Each is a different sample. Salt permeation is measured as the depth of Cl into the bulk of the material.
1000hours
500hours
100hours
3000hours
0 hours 50 hours 100 hours 500 hours 1000 hours 3000 hours
100 μm
Cl
Mg
NREL | 8
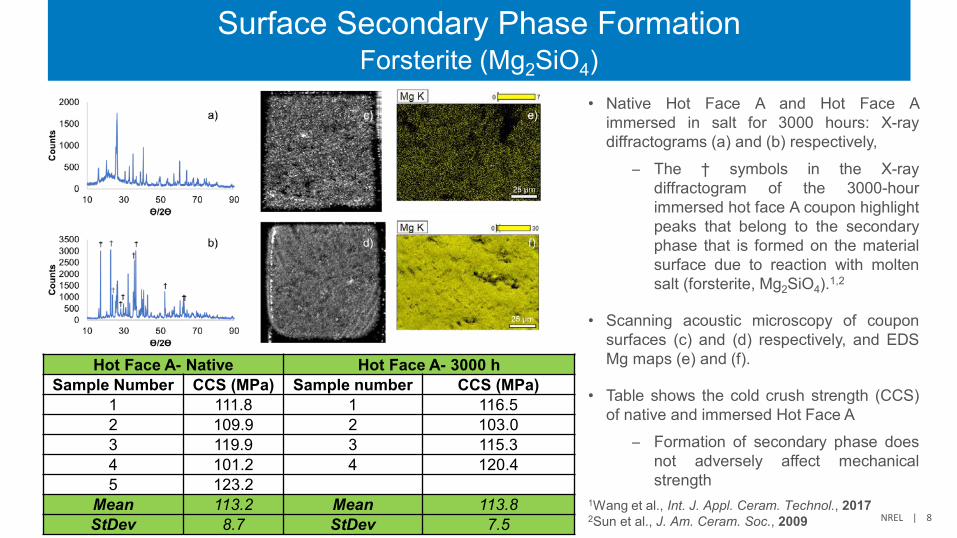
Surface Secondary Phase FormationForsterite (Mg2SiO4)
Hot Face A- Native Hot Face A- 3000 hSample Number CCS (MPa) Sample number CCS (MPa)
1 111.8 1 116.52 109.9 2 103.03 119.9 3 115.34 101.2 4 120.45 123.2
Mean 113.2 Mean 113.8StDev 8.7 StDev 7.5
• Native Hot Face A and Hot Face Aimmersed in salt for 3000 hours: X-raydiffractograms (a) and (b) respectively,
The † symbols in the X-raydiffractogram of the 3000-hourimmersed hot face A coupon highlightpeaks that belong to the secondaryphase that is formed on the materialsurface due to reaction with moltensalt (forsterite, Mg2SiO4).1,2
• Scanning acoustic microscopy of couponsurfaces (c) and (d) respectively, and EDSMg maps (e) and (f).
• Table shows the cold crush strength (CCS)of native and immersed Hot Face A
Formation of secondary phase doesnot adversely affect mechanicalstrength
1Wang et al., Int. J. Appl. Ceram. Technol., 20172Sun et al., J. Am. Ceram. Soc., 2009
NREL | 9
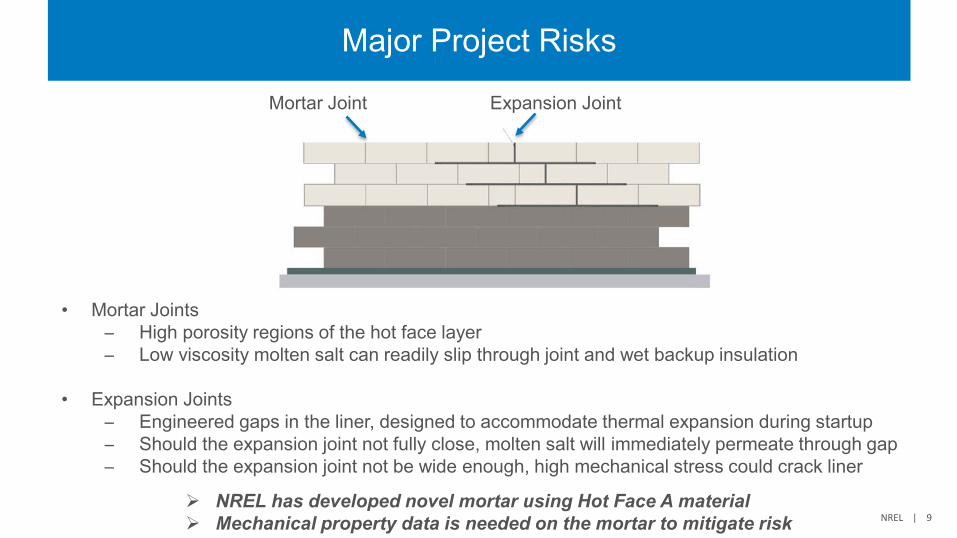
Major Project Risks
Mortar Joint Expansion Joint
• Mortar Joints High porosity regions of the hot face layer Low viscosity molten salt can readily slip through joint and wet backup insulation
• Expansion Joints Engineered gaps in the liner, designed to accommodate thermal expansion during startup Should the expansion joint not fully close, molten salt will immediately permeate through gap Should the expansion joint not be wide enough, high mechanical stress could crack liner
NREL has developed novel mortar using Hot Face A material Mechanical property data is needed on the mortar to mitigate risk
NREL | 10
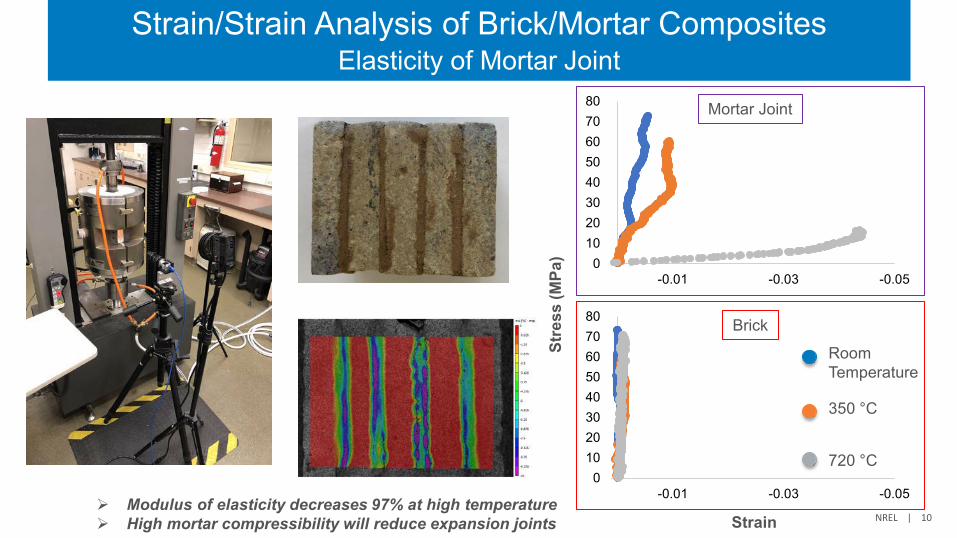
Strain/Strain Analysis of Brick/Mortar CompositesElasticity of Mortar Joint
01020304050607080
-0.05-0.03-0.01
Room Temperature
350 °C
720 °C0
1020304050607080
-0.05-0.03-0.01
Strain
Stre
ss (M
Pa)
Mortar Joint
Brick
Modulus of elasticity decreases 97% at high temperature High mortar compressibility will reduce expansion joints
NREL | 11
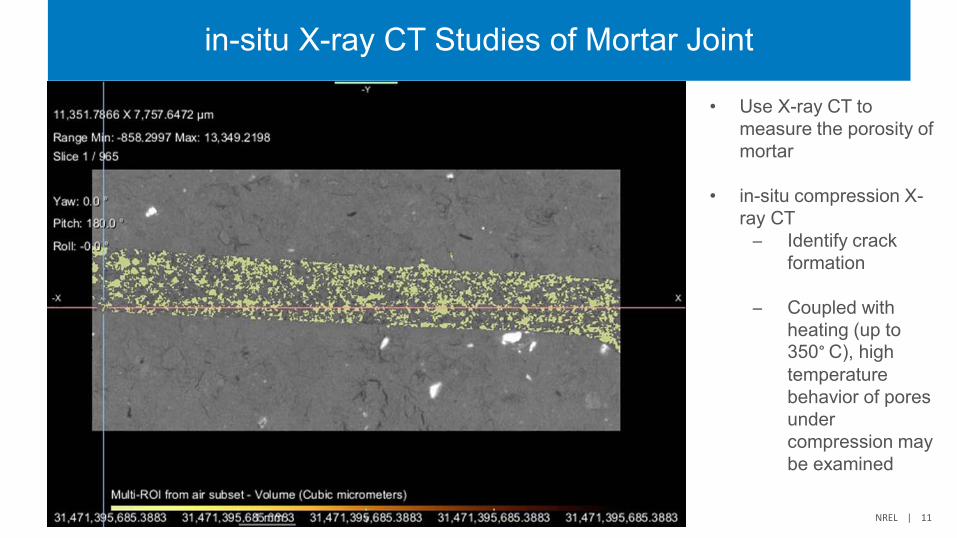
in-situ X-ray CT Studies of Mortar Joint
• Use X-ray CT to measure the porosity of mortar
• in-situ compression X-ray CT Identify crack
formation
Coupled with heating (up to 350° C), high temperature behavior of pores under compression may be examined

Thank you
This work was authored by the National Renewable Energy Laboratory, operated by Alliance for Sustainable Energy, LLC, for the U.S. Department of Energy (DOE) under Contract No. DE-AC36-08GO28308. Funding provided by U.S. Department of Energy Office of Energy Efficiency and Renewable Energy Solar Energy Technologies. The views expressed in the article do not necessarily represent the views of the DOE or the U.S. Government. The U.S. Government retains and the publisher, by accepting the article for publication, acknowledges that the U.S. Government retains a nonexclusive, paid-up, irrevocable, worldwide license to publish or reproduce the published form of this work, or allow others to do so, for U.S. Government purposes.
[email protected]/PR-5700-77846