Technical note on assessing black carbon reductions using ...
36
Technical note on assessing black carbon reductions using the Long-range Energy Alternatives Planning (LEAP) system with an Integrated Benefits Calculator (LEAP-IBC) Oil and Gas Initiative of the Climate and Clean Air Coalition (CCAC) Prepared for the CCAC Oil and Gas Initiative Howard Cambridge, Stockholm Environment Institute
Transcript of Technical note on assessing black carbon reductions using ...

Technical note on assessing black carbon reductions using the Long-range Energy Alternatives Planning (LEAP) system
with an Integrated Benefits Calculator (LEAP-IBC)
Oil and Gas Initiative of the Climate and Clean Air Coalition (CCAC)
Prepared for the CCAC Oil and Gas Initiative Howard Cambridge, Stockholm Environment Institute

Technical note on assessing black carbon reductions using Long-range Energy October 2016 Alternatives Planning (LEAP) system with Integrated Benefits Calculator (LEAP-IBC)
2
Contents
1. Introduction
1.1 Overview of LEAP-IBC 1.2 Main features of the LEAP Integrated Benefits Calculator (LEAP-IBC) 1.3 Default LEAP-IBC global emission data 1.4 Data requirement and modelling 1.5 Calculation of emissions 1.6 Scenario development 1.7 Calculation of impacts
2. Use of LEAP-IBC for Assessing the Impacts of the Oil and Gas Sector
2.1 Data requirements
3. Application of LEAP-IBC in two Case Study Scenarios
3.1 Overview 3.2 Case Study – Mexico 3.3 Case Study – Colombia
4. Analysis
5. Recommendations
References
Technical note on assessing black carbon reductions using Long-range Energy October 2016 Alternatives Planning (LEAP) system with Integrated Benefits Calculator (LEAP-IBC)
3
List of figures
Figure 1.1 Figure 1.1 LEAP-IBC tree structure showing Key Assumptions and Benefit
Calculator Inputs.
Figure 1.2 Data entry for fuel share
Figure 1.3 Energy transformation tab
Figure 1.4 Data entry tab for oil refining
Figure 1.5 Emission factor tab for BC flaring from oil production
Figure 1.6 Pull down menu for selection of scenarios
Figure 1.7 Creation of baseline scenario – change of values over a specific timeframe
Figure 1.8 Data entry for different scenarios
Figure 1.9 Results from LEAP-IBC –Premature deaths associated with PM2.5 and O3
Figure 1.10 Comparison of different scenarios showing number of deaths avoided
Figures 3.1a Flaring in Mexico
Figure 3.1b Flaring in Colombia
Figure 3.2 Oil production by type 2014
List of tables
Table 3.1. Key assumption data for Mexico current accounts
Table 3.2 LEAP SLCP Benefits Calculator input data used for Mexico
Table 3.3 Variables related to Oil and Gas used in LEAP-IBC for Mexico
Table 3.4 Reduction of flaring in Mexico under two scenarios
Table 3.5 Reduction in Black Carbon from flaring in Mexico
Table 3.6 Methane reductions under two scenarios in Mexico
Table 3.7 Key assumption data for Colombia current accounts
Table 3.8 LEAP-IBC Benefits Calculator input data for Colombia
Table 3.9 Oil and gas data for Colombia used for scenarios
Table 3.10 Baseline Growth scenario for Colombia
Table 3.11 Reduction in Methane emissions under two scenarios for Colombia
Appendix 1. Signatories to the World Bank/UNEP Initiative to cease routine flaring by 2030

Technical note on assessing black carbon reductions using Long-range Energy October 2016 Alternatives Planning (LEAP) system with Integrated Benefits Calculator (LEAP-IBC)
4
1. Introduction
This report outlines the data needs, modelling and scenario development undertaken using the
Long range Energy Alternatives Planning (LEAP) system with Integrated Benefits Calculator
(LEAP-IBC) in order to carry out an assessment of the potential reductions in methane and
black carbon (BC) emissions from the cessation of flaring and venting of gas in Mexico and
Colombia.
Short-lived climate pollutants (SLCPs) are harmful air pollutants that also contribute
significantly to climate change. The main SLCPs are black carbon (or soot), methane (CH4),
tropospheric ozone (O3) and some hydrofluorocarbons (HFCs). They obtain their name by
virtue of the fact that they remain in the atmosphere for only a relatively short time and
controlling them can give climate benefits in the shorter-term (tens of years as opposed to
hundreds for CO2). SLCPs can also be quickly controlled and reduced with existing
technology.
The oil and gas (OAG) sector accounts for more than 20% of all anthropogenic emissions of
CH4 globally and is also a source of BC. The two main processes that contribute to this are
flaring and venting of gas. Flaring takes place where excess gas is combusted without
utilisation of the energy that is released. Other pollutants are emitted during flaring in
addition to methane and black carbon. These include: nitrogen oxides (NOx) and non-
methane volatile organic compounds (NMVOC), as well a sulphur dioxides (SOx), carbon
monoxide (CO), heavy metals (HM) and particulate matter (PM).
Gas flaring is carried out on both on-shore and off-shore oil and gas (OAG) platforms usually
as a safety measure to release any dangerous build-up of gas. Some flaring is also done at the
start of oil well operations and during their maintenance. This gas is also referred to as
‘associated gas’. These flaring activities can be considered non-routine as they can happen
intermittently. Routine flaring usually takes place where the oil field operation has
insufficient capacity to process the gas in situ or lack of transport to move it to a processing
facility. This is typically the case for off-shore platforms and for smaller OAG installations
that would require large capital investments for which there would only be limited economic
benefit.

Technical note on assessing black carbon reductions using Long-range Energy October 2016 Alternatives Planning (LEAP) system with Integrated Benefits Calculator (LEAP-IBC)
5
Whilst flaring actually fell globally by about 18 percent between 2005 and 2011,
approximately 300 million tons of carbon dioxide as well as other GHGs such as methane are
still produced every year (World Bank, 2015). The scale of impact has an effect elsewhere on
the environment and in particular the Arctic where BC strongly influences radiative forcing
due to changes in the albedo of snow and ice where it is deposited darkening the surface.
Whilst globally, flaring contributes about 3 percent of black carbon emissions, in the Arctic it
can contribute as much as much as 52 per cent according to study by Klimont (2015). There
is the potential for gas flaring to increase in the future due to expansion of oil production in
countries such as Iraq and other countries where new locations are opened up for oil and gas
shale production. This includes increasing exploitation of reserves in the Arctic.
Flaring has an impact at different scales. Firstly, local populations can be exposed directly to
air pollutants from the flare in the form of non-combusted material (primarily soot and
particulate matter). These particles can cause respiratory problems and other associated
diseases including cardiovascular disease. The number of people exposed to emissions is
dependent on the type of flaring activity, the meteorological conditions and the location of
the population i.e. whether they are downwind from the flare site. The relative risk to
individuals of these emissions will also be dependent on socio-economic factors, including
their age and poverty level especially in urban areas, and on whether there are other emission
sources co-located such as industry, brick kilns, heavy traffic and waste burning.
Epidemiological studies looking specifically at the health risks from BC emissions from
flaring in the OAG industry are lacking.
When gas is flared at an installation it is moved a distance away from the platform through a
series of pipes connected to a flare tip which is usually located in a chimney stack. Under
ideal conditions, flaring converts all the methane into carbon dioxide and water vapour. The
efficiency of the combustion process can be in the region of 98 per cent for a well-designed
and operated flare. However, these conditions seldom exist depending on factors such as the
gas velocity (efficiency of the flare), local meteorology and type of flare burner. Whilst these
factors can be measured at the site they rarely are.
Not only does flaring contribute to climate change impacts, it actually represents a huge
economic loss in terms of the potential revenue that could be achieved through the sale of by-
products that could have been made from the gas. For example, the gas can be converted into

Technical note on assessing black carbon reductions using Long-range Energy October 2016 Alternatives Planning (LEAP) system with Integrated Benefits Calculator (LEAP-IBC)
6
liquefied gas and used as an energy source or to power vehicles or it can be converted into
products such as animal feedstocks and fertilisers. Thirdly, it can be socio-economically
beneficial to local communities if for example, the gas is used for electricity generation to
power homes, schools, health centres. An example where there has been success is in the
Republic of Congo where an Italian energy company Eni, invested in the production of
electricity through the utilization of associated gas which was previously flared. This
provided electricity for the community including providing street lighting (Eni, 2015).
Therefore, it is clear that reducing flaring can offer multiple co-benefits but this requires
multinational oil and gas companies and national governments to pave the way by increasing
awareness and understanding, improving monitoring and assessment, and developing and
enforcing regulations. A new initiative to end routine flaring by 2030 was put forward by the
World Bank in May 2015 (World Bank, 2015) to address mounting international concern.
Forty countries, companies and organisations signed up to the initiative at its launch (See
Appendix 1). This now stands at 45 in 2016 with the U.S. and Canada also agreeing to cease
flaring. The Climate and Clean Air Coalition (CCAC) is supporting the efforts of major oil
companies and governments to reduce wasteful flaring by seeking alternative uses for the gas
and identifying ways to overcome the barriers that inhibit more flare gas utilization.
1.1 Overview of LEAP-IBC
The Long-range Energy Alternatives Planning (LEAP) system1 is a widely-used software
tool for energy policy analysis and climate change mitigation assessment developed at the
Stockholm Environment Institute. LEAP is an integrated scenario-based modeling tool that
can be used to track energy consumption, production and resource extraction in all sectors of
an economy. In addition, it can account for both energy and non-energy sector greenhouse
gas (GHG) emission sources and sinks. LEAP can also analyze emissions patterns of local
and regional air pollutants, including short-lived climate pollutants (SLCPs), making it well-
suited to studies of the climate co-benefits of air pollution emissions reductions, and vice
versa.
LEAP-IBC is a new application that combines the LEAP platform with an ‘integrated
benefits calculator’ (IBC) that allows the emissions to be converted into concentrations of
fine particulate matter (PM2.5) and ozone (O3), which can then be used to calculate the 1 www.energycommunity.org/default.asp?action=introduction

Technical note on assessing black carbon reductions using Long-range Energy October 2016 Alternatives Planning (LEAP) system with Integrated Benefits Calculator (LEAP-IBC)
7
climate impacts (changes in radiative forcing and temperature), the human health impacts
(premature mortality) and the crop impacts (yield losses of four staple crops: wheat, rice,
maize and soy) resulting from these air pollutants. With the LEAP-IBC tool, emissions can
be calculated for a base year and then scenarios generated to assess the potential of different
policies or mitigation strategies to reduce emissions and impacts of air pollutants, for instance,
the impact of the initiative to reduce routine flaring from the OAG industry by 2030.
The LEAP-IBC tool was developed through collaboration between SEI and US EPA, and
highlights the potential for visualising the benefits of national mitigation planning. It was
developed for the Supporting National Action and Planning (SNAP) on Short-Lived Climate
Pollutants (SLCPs) initiative of the CCAC. It has been used to help with the development of
National Action Plans in countries and for assessing the benefits of mitigation measures in
regional assessments e.g. Latin America (LAC) Assessment. The long-term goals of this
initiative are to: support integration of SLCPs into existing national planning; to identify and
prioritize strategies that countries can undertake and can be implemented through existing air
quality, climate change and development policy and regulatory frameworks; and identify
ways to overcome barriers and to build capacity in countries for their strategic planning.
The use of the LEAP-IBC tool in the context of the Oil and Gas Initiative activity is to
identify the air quality and climate benefits of reducing flaring and venting and to help
countries identify pathways leading to reduced emissions and impacts. The tool allows the
user to estimate current levels of emissions at existing flaring sites in the country, to create a
‘business-as-usual’ scenario and then compare this with mitigation scenarios in which flaring
has been reduced either through control measures such as using regulation that introduces the
implementation of technology to capture gas. Thus, the output from the tool provides a means
of assessing different mitigation alternatives in terms of their relative efficacy in reducing
adverse impacts compared with the business-as-usual scenario.

Technical note on assessing black carbon reductions using Long-range Energy October 2016 Alternatives Planning (LEAP) system with Integrated Benefits Calculator (LEAP-IBC)
8
1.2 Main features of the LEAP Integrated Benefits Calculator (LEAP-IBC)
The LEAP-IBC tool has two extra features in addition to the base LEAP software2. These
features i) allow for the calculation of an SLCP-focussed emission inventory (LEAP-IBC
default SLCP template), and ii) use this inventory to estimate impacts on human health, crop
yield and climate.
LEAP-IBC default SLCP template
Based on the Global Atmospheric Pollution Forum (GAP Forum) emission inventory
guidebook (https://www.sei-international.org/gap-the-global-air-pollution-forum-emission-
manual), a default tree structure has been constructed in LEAP-IBC which represents all
major source sectors of SLCP-relevant emissions. These source sectors include the major
energy-consuming emission sources, energy production source sectors (e.g. electricity
generation), but also non-energy emission sources, such as agricultural emissions, waste
emissions etc.
To calculate emissions from a particular source sector, the user is required to input a value for
activity rate and an emission factor. However, the default SLCP template has been pre-loaded
with emission factors for 10 pollutants. These default emission factors are fully referenced,
and generally derive from sources such as the Intergovernmental Panel on Climate Change
(IPCC) Guidelines for National Greenhouse Gas Inventories 3 , or the EMEP/EEA Air
Pollutant Emission Inventory Guidebook4. They can easily be replaced by the user with more
appropriate emission factors if these exist for the target country.
2 LEAP is the Long range Energy Alternatives Planning System, and is a widely-used software tool for energy policy analysis and climate change mitigation assessment developed at the Stockholm Environment Institute. LEAP has been adopted by thousands of organizations in more than 190 countries worldwide. Users of the tool include government agencies, academics, non-governmental organizations, consulting companies, and energy utilities. It has been used at many different scales ranging from cities and states to national, regional and global applications. LEAP is increasingly being used by countries undertaking integrated resource planning, greenhouse gas (GHG) mitigation assessments, and Low Emission Development Strategies (LEDS) especially in the developing world. Many of these countries have also chosen to use LEAP as part of their commitment to report to the U.N. Framework Convention on Climate Change (UNFCCC).
3 http://www.ipcc-nggip.iges.or.jp/public/2006gl/ 4 http://www.eea.europa.eu/publications/emep-eea-guidebook-2016

Technical note on assessing black carbon reductions using Long-range Energy October 2016 Alternatives Planning (LEAP) system with Integrated Benefits Calculator (LEAP-IBC)
9
The Integrated Benefits Calculator (IBC)
Using the default template, LEAP calculates emission inventories for current and future years
for all relevant pollutants. These emissions are then used to estimate atmospheric
concentrations of fine particulate matter (PM2.5) relevant for human health, and surface ozone
(O3), relevant for human health and vegetation. The concentrations are calculated using
output (called coefficients) from the GEOS-Chem Adjoint model (undertaken by Daven
Henze at the University of Colorado through a collaboration with the US EPA). GEOS-Chem
is a global 3-D model of atmospheric composition driven by assimilated meteorological
observations from the Goddard Earth Observing System (GEOS) of the NASA Global
Modeling Assimilation Office (GMAO). This atmospheric chemistry transport model
calculates the sensitivity of PM2.5 and O3 concentrations in the target country to emissions of
each PM2.5 and O3 precursor in each grid-square in the world. For example, the sensitivity of
population-weighted PM2.5 in the target country to changes in NOx, SO2, NH3, BC, OC, and
other PM emissions in each grid square is calculated, and the sensitivity to NOx, VOC, CH4
and CO emissions for the health, and vegetation O3 metrics (population-weighted maximum
3-month daily 1h average concentration for health, and average daily 12h concentration over
3-month growing season for crops). These coefficients from GEOS-Chem Adjoint are used in
combination with the LEAP-derived emissions for the target country, and default emissions
for the rest of the world (IIASA ECLIPSE emission inventory) to derive pollutant
concentrations for the base year (2010), baseline scenario (2010-2050), and any policy
scenarios.
The benefits calculated relate to human health (from exposure to PM2.5 and ground-level
ozone), crop yield from ground-level ozone, and changes to radiative forcing and temperature,
both globally and for four latitudinal bands. Premature mortality is currently the only health
impact incorporated, but other health outcomes will be included in the near future e.g. Years
of life lost (YLLs) etc. The calculator currently uses a log-linear relationship between
concentration and mortality. The crop yield loss from exposure to ozone is calculated from
relationships for yield loss related to the 7 or 12 hour means of daylight ozone concentrations
during the growing season for the appropriate crop. At the moment it only includes the
response of four staple crops – wheat, rice, soybean and maize. To estimate climate impacts,
the tool currently calculates the radiative forcing (RF) related to changes in emissions and,
from this RF, resulting equilibrium temperatures can be estimated.

Technical note on assessing black carbon reductions using Long-range Energy October 2016 Alternatives Planning (LEAP) system with Integrated Benefits Calculator (LEAP-IBC)
10
1.3 Default LEAP-IBC Global Emission data
Inputs to the Integrated Benefits Calculator include gridded (2° x 2.5°) global default
emissions data for the base year 2010 and estimates for 2030 and 2050 for a Reference
Scenario (i.e. ‘business as usual’ with no further mitigation measures beyond those already
planned and assuming energy and fuel demand as projected by the International Energy
Agency (IEA)). This default emissions data set was re-gridded to 2° x 2.5° from the original
emission data set (0.5° x 0.5°) of the ECLIPSE 5 (Evaluating the Climate and Air Quality
Impacts of Short-Lived Pollutants) project which was created with the GAINS (Greenhouse
gas – Air pollution Interactions and Synergies; http://gains.iiasa.ac.at) model (Amann et al.,
2011). When configuring the tool for a particular target country, population-weighted country
masks are then used to identify those 2° x 2.5° grid-cells that overlay that country together
with the proportion of each grid-cell’s total population belonging to that country. This then
enables the default ECLIPSE emissions data for the target country to be replaced by LEAP
emissions data using population as an allocation proxy.
1.4. Data requirements and modelling
The LEAP-IBC software interface consists of a collection of folders arranged in a tree
structure within which the user can enter information about the country, and about the
different activities within the country which result in emissions of air pollutants (Figure 1.1).
The first part of the tree contains the key drivers of growth in emissions such as GDP and
Population for the base year, 2010. Also included here are the (pre-loaded) Benefit Calculator
Inputs which show all the parameters required to calculate human health and crop impacts for
the country. For health impacts, these include the proportion of the total population aged over
30 years, the baseline mortality rates for cardiopulmonary disease, lung cancer and
respiratory disease (the health effects included in LEAP-IBC as being affected by exposure to
air pollution); the relative risks (RR) for these diseases (representing the increased risk of
mortality due to these causes due to increases in PM2.5 and ozone exposure). For crop losses,
these are the annual crop yields for the four staple crops: Rice, Wheat, Maize and Soy. These
parameters can be substituted with nationally relevant values.
5 http://www.iiasa.ac.at/web/home/research/researchPrograms/air/ECLIPSEv5a.html
Technical note on assessing black carbon reductions using Long-range Energy October 2016 Alternatives Planning (LEAP) system with Integrated Benefits Calculator (LEAP-IBC)
11
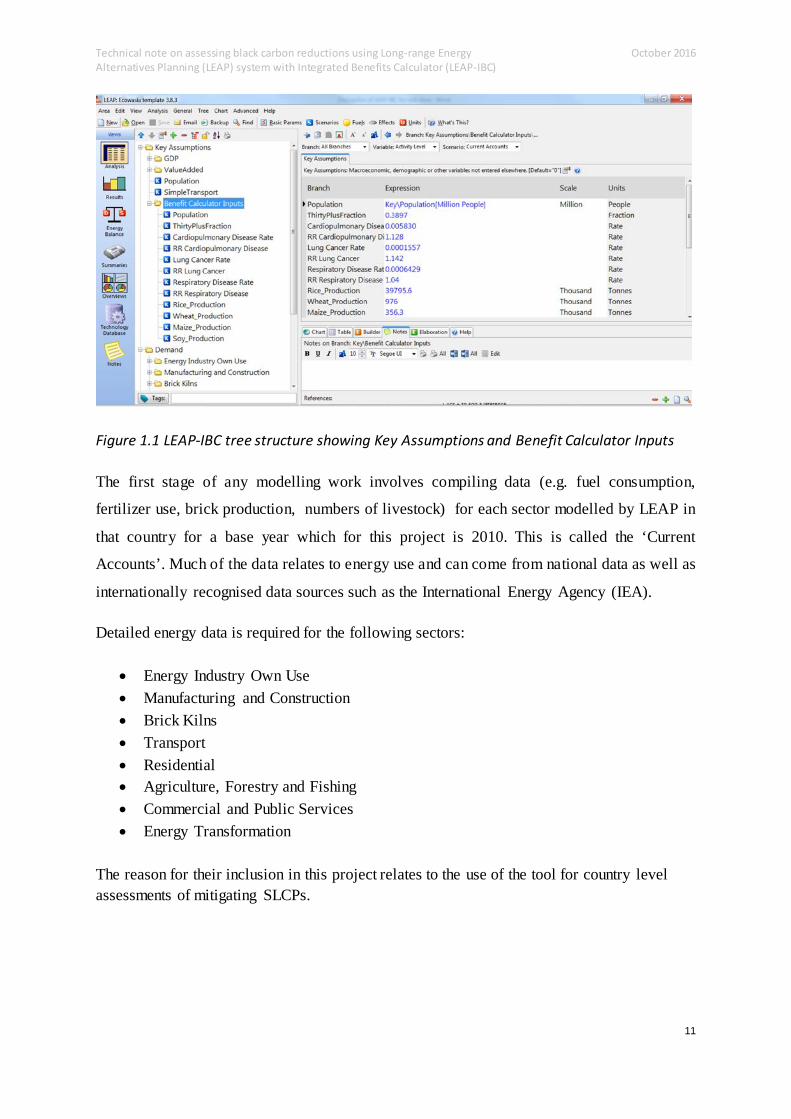
Figure 1.1 LEAP-IBC tree structure showing Key Assumptions and Benefit Calculator Inputs
The first stage of any modelling work involves compiling data (e.g. fuel consumption,
fertilizer use, brick production, numbers of livestock) for each sector modelled by LEAP in
that country for a base year which for this project is 2010. This is called the ‘Current
Accounts’. Much of the data relates to energy use and can come from national data as well as
internationally recognised data sources such as the International Energy Agency (IEA).
Detailed energy data is required for the following sectors:
• Energy Industry Own Use • Manufacturing and Construction • Brick Kilns • Transport • Residential • Agriculture, Forestry and Fishing • Commercial and Public Services • Energy Transformation
The reason for their inclusion in this project relates to the use of the tool for country level assessments of mitigating SLCPs.

Technical note on assessing black carbon reductions using Long-range Energy October 2016 Alternatives Planning (LEAP) system with Integrated Benefits Calculator (LEAP-IBC)
12
1.5 Calculation of emissions There are three folders in LEAP-IBC which contain all the major source sectors of air
pollutants. The first folder is called ‘Demand’, and this contains the source sectors where
energy is required (i.e. ‘demanded’) and then used. In general terms, emissions are calculated
by multiplying the activity for a particular source by an emission factor for that source. For
the Demand sectors, the activity variable is the amount of energy consumed by each source
sector. The total energy use for that sector is then split between each of the fuels used in that
sector in the fuel share tab (see Figure 1.2 below).
Figure 1.2 Data entry for fuel share Default emission factors (termed ‘Environmental Loading’ for fuel combustion sectors in
LEAP) are pre-loaded into LEAP-IBC (with full referencing) but these can be overwritten by
alternative factors (e.g. locally determined) if the user considers these to be more appropriate.
For each fuel type, LEAP multiplies the ‘Environmental Loading’ emission factor by the
activity (fuel use) to calculate emissions from that sector for the base year.
The demand for certain types of energy (electricity, charcoal) required by the sectors in the

Technical note on assessing black carbon reductions using Long-range Energy October 2016 Alternatives Planning (LEAP) system with Integrated Benefits Calculator (LEAP-IBC)
13
‘Demand’ folder is met by energy production in the ‘Transformation’ folder. For Electricity
Generation, the user must specify how much electricity is produced from the different sources
(Figure 1.3) whereas for Charcoal Making, wood is the only feedstock fuel.
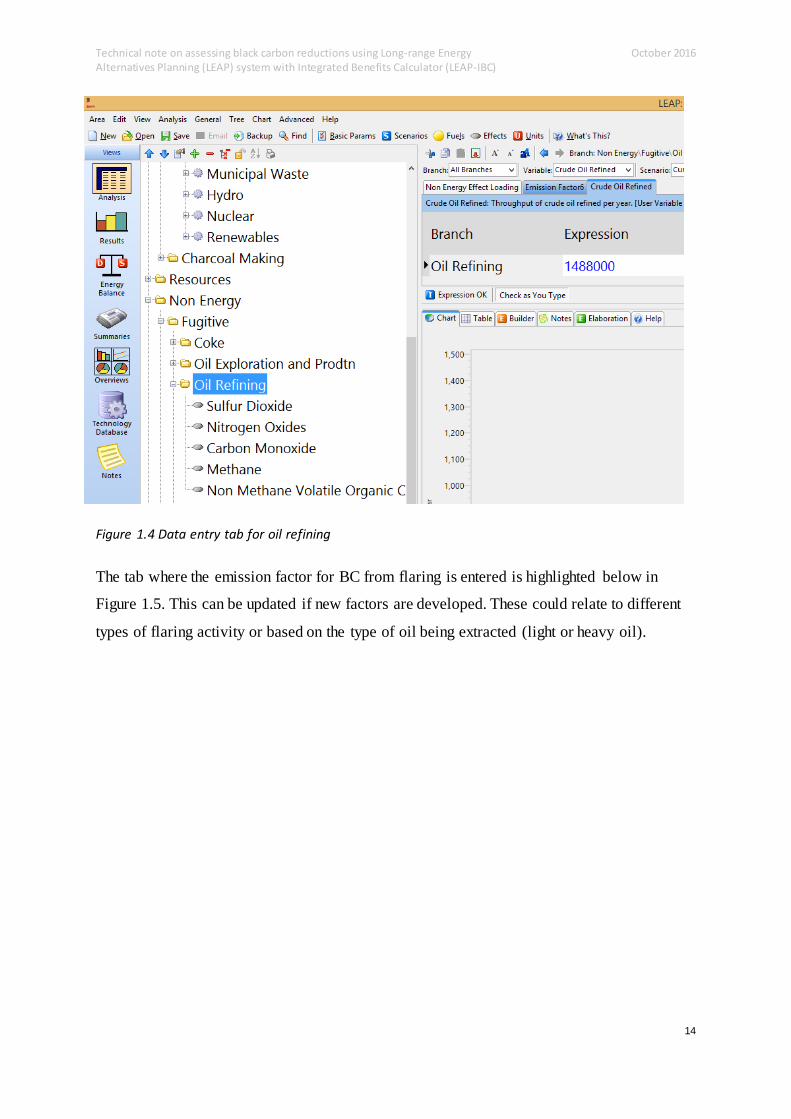
Figure 1.3 Energy transformation tab Finally, the Non-Energy folder contains source sectors which are not linked to fuel
combustion. These sectors are varied and wide ranging, and include fugitive emissions from
oil and gas industries, a detailed method for calculating transport emissions, industry,
agriculture and waste sectors. The principle for calculating emissions in each of these sectors
is the same, each source sector requires and activity variable, and an emission factor for each
pollutant. For example, to calculate emissions from ‘Oil Refining’, you simply enter the
tonnes of oil refined per year, and the default emission factors can be used to calculate
emissions of each pollutant (see Figure 1.4)
Technical note on assessing black carbon reductions using Long-range Energy October 2016 Alternatives Planning (LEAP) system with Integrated Benefits Calculator (LEAP-IBC)
14
Figure 1.4 Data entry tab for oil refining The tab where the emission factor for BC from flaring is entered is highlighted below in
Figure 1.5. This can be updated if new factors are developed. These could relate to different
types of flaring activity or based on the type of oil being extracted (light or heavy oil).

Technical note on assessing black carbon reductions using Long-range Energy October 2016 Alternatives Planning (LEAP) system with Integrated Benefits Calculator (LEAP-IBC)
15
Figure 1.5 Emission factor tab for BC flaring from oil production
Once data have been entered for the base year it is then necessary to create the baseline
scenario, which describes how emissions will change in the future up to 2050 if current trends
continue (see Figure 1.6).
Figure 1.6 Pull down menu for selection of scenarios
For each of the activity variables input for the base year 2010, it is necessary to specify an
equation to describe how this will change over time in the baseline scenario. For example, for
the Onshore Oil Production category, we have specified it will grow at 1 per cent per annum,
but any equation to describe how the activity of each source sector will change based on the
information available (see Figure 1.7) can be used. Once the changes over time for each
source sector activity variable have been specified, the baseline scenario has been created and
the results can be produced.

Technical note on assessing black carbon reductions using Long-range Energy October 2016 Alternatives Planning (LEAP) system with Integrated Benefits Calculator (LEAP-IBC)
16
Figure 1.7 Creation of baseline scenario – change of values over a specific timeframe 1.6 Scenario development As well as the baseline scenario, a key use of LEAP-IBC is to calculate how emissions and
impacts will change as a result of policies and interventions aimed at reducing air pollution
impacts. Within LEAP-IBC, new scenarios are created and compared with the baseline, to
show the benefits which could result from emissions reductions. All the variables which
were input for the base year and baseline scenario are kept in the new scenario. This means
that all that is needed to create a policy scenario is to change those variables in the source
sectors which are of interest, and everything else is left the same. The same procedure is done
for each scenario, where the variables which will change are selected and an equation for how
they will change is specified, different to the one entered for the baseline scenario (see Figure
1.8).

Technical note on assessing black carbon reductions using Long-range Energy October 2016 Alternatives Planning (LEAP) system with Integrated Benefits Calculator (LEAP-IBC)
17
Figure 1.8 Data entry for different scenarios
1.7 Calculation of impacts The benefit calculator results for current and future emissions and impacts can be shown by
using LEAP’s Results View. All the impacts are stored in the ‘Indicators’ folder. For example,
clicking on the ‘Deaths’ folder shows the number of premature deaths in a given year as
shown below for premature mortality from outdoor exposure to PM2.5 and ozone for the
country of interest (Figure 1.9). This can be further split into contributions from national
emissions, the rest of the world and natural background.

Technical note on assessing black carbon reductions using Long-range Energy October 2016 Alternatives Planning (LEAP) system with Integrated Benefits Calculator (LEAP-IBC)
18
Figure 1.9 Results from LEAP-IBC –Premature deaths associated with PM2.5 and O3 By selecting a particular scenario from the menu, the number of premature deaths in the
scenario can be compared to the baseline, with the white box showing the number of avoided
deaths in each year, if the scenario was implemented (see Figure 1.10).
Figure 1.10 Comparison of different scenarios showing number of deaths avoided

Technical note on assessing black carbon reductions using Long-range Energy October 2016 Alternatives Planning (LEAP) system with Integrated Benefits Calculator (LEAP-IBC)
19
2. USE OF LEAP-IBC FOR ASSESSING THE IMPACTS OF THE OIL AND GAS SECTOR
2.1 Data requirements
LEAP-IBC is a relatively simple ‘reduced form’ model which requires data from different
sources to be compiled. The principle for calculating emissions for sectors not linked to
energy production and use is the same, each source sector requiring an activity variable, and
an emission factor for each pollutant. For example, to calculate emissions from ‘Oil Refining’,
you simply enter the tonnes of oil refined per year, and the default emission factors are then
used by LEAP to calculate the emissions of each pollutant. For national scale analysis,
default data can be obtained through readily available datasets such as the International
Energy Agency’s (IEA) Statistics and Balances, although nationally derived data may be
preferable and more accurate.
The data requirements pertinent to oil and gas components in LEAP (Non-Energy Fugitive
Emissions) are:
• Number of oil wells drilled
• Offshore/Onshore Crude oil production (tonnes)
• Oil transported through pipelines
• Oil loaded onto tankers and land transport
• Volume of gas flared • Gas Processing • Gas Production • Gas Distribution
LEAP contains a default database of emission factors which are taken from the literature. For
oil and gas production, methane, NMVOC and CO2 emissions from venting are calculated
using IPCC Tier 1 emission factors. For flaring, the default emission factors for methane,
NMVOC and CO2 are also IPCC Tier 1 whereas the black carbon (BC) emission factor of
0.51 kg per 1000 m3 flared is based on research by McEwen and Johnson (2012). The
emission factor for black carbon can be changed by the user to reflect the flaring
characteristics based on local measurements.
Data is entered for the current situation ‘Baseline’ (e.g. 2010) and a scenario is developed on
which the expected changes in variables over the next years are specified. This can be based
on previous trends or forecasts published by the industry e.g. increase in oil well drilling.
Further scenarios can then be developed, such as reducing flaring to zero and the effects of

Technical note on assessing black carbon reductions using Long-range Energy October 2016 Alternatives Planning (LEAP) system with Integrated Benefits Calculator (LEAP-IBC)
20
such interventions on emissions, health impacts and climate change can be compared to the
baseline scenario.
3. APPLICATION OF LEAP-IBC IN TWO CASE STUDY SCENARIOS
3.1 Overview
Two focal countries under the CCAC Oil and Gas Initiative are Mexico and Colombia. Both
of these are major oil producers and are closely controlled by their respective Governments.
The maps in Figures 3.1a and b show where flaring is taking place in the two countries using
NASA satellite imagery for 2014 (Elvidge, 2015).
Figures 3.1a Flaring in Mexico Figure 3.1b Flaring in Colombia (Elvidge, 2015)
3.2 Case Study - Mexico
Mexico is one of the largest oil producers in the World; ranking 9th in terms of crude oil
reserves although in recent years oil production has been on the decline. One reason for this
is that the main production, located in the Cantarell oil field, has decreased significantly.
Petróleos Mexicanos (PEMEX) is the state-owned company that carries out exploration and
extraction of petroleum as well as processing and distribution. PEMEX has six refineries,
eight petrochemical and nine gas processing plants and produces approximately 2.5 million
barrels of oil daily and more than 6 million of cubic feet of natural gas. Half of oil
production (see Figure 3.2) is heavy oil which is usually harder to extract.

Technical note on assessing black carbon reductions using Long-range Energy October 2016 Alternatives Planning (LEAP) system with Integrated Benefits Calculator (LEAP-IBC)
21
Figure 3.2 Oil production by type 2014. Source PEMEX Statistical year Book 2014
The petroleum industry in Mexico has also recently been opened up to private companies to
begin exploration and production.
In terms of flaring, Mexico is ranked 15th in the world according to the World Bank (GGFR,
2012). Peak levels were recorded in 2008 with approximately 3.5 billion cubic meters (bcm)
flared whereas current levels are approximately 2.8 bcm (PEMEX and the Ministry of
Energy). There was a steep rise in emissions due to the need to flare gas at the Cantarell oil
field, as high nitrogen concentration in the oil could not be utilised for other purposes and
therefore had to be flared. The Mexican Government also sets annual limits for flaring and
venting and imposes fines for breaching them.
3.2.1 Data input
The current accounts data used as the baseline scenario is for 2010. Demographic data has
been taken from the World Bank statistical dataset for Mexico (World Bank, online) -
Variables include population, GDP, production share are shown in Table 3.1
12.30%
35.60% 52.10%
Type of oil production
Lighter
Lighter
Heavy

Technical note on assessing black carbon reductions using Long-range Energy October 2016 Alternatives Planning (LEAP) system with Integrated Benefits Calculator (LEAP-IBC)
22
GDP: $1051.129 billion Population: 118 million
Activity Agriculture: 3.5% Services: 35.1% Industry: 61.5%
Table 3.1. Key assumption data for Mexico current accounts (Source: World Bank)
The input data required by LEAP-IBC’s benefit calculator for deriving impacts on health and
crops are pre-loaded into the tool separately for each country; the data for Mexico are
summarized in the Table 3.2.
ThirtyPlusFraction 46% Cardiopulmonary Disease Rate 0.0036 RR Cardiopulmonary Disease 1.128 Lung Cancer Rate 0.000179 RR Lung Cancer 1.142 Respiratory Disease Rate 0.000611 RR Respiratory Disease 1.04 Rice Start Month May Wheat Start Month February Maize Start Month April Soy Start Month April Rice_Production 216.676 kt Wheat_Production 3676.707 kt Maize_Production 23928.97 kt Soy_Production 167.665 kt
Table 3.2 LEAP-IBC benefit calculator input data used for Mexico
The activity data used in calculating emissions from fuel combustion in the demand sectors is
primarily taken from the IEA database. For ‘Non-energy’ sectors, industrial data needed for
calculating process emissions are taken from UN Data, and the USGS Minerals database.
Some data was unavailable although these would not be affected under the scenarios
developed for looking at oil and gas. Petroleum Coke production data is from UN Data and
Coal production from EIA. Coke – assumed traditional method – data from - Energy
Information System Petróleos Mexicanos http://sie.energia.gob.mx/
Within LEAP-IBC, transport emissions can be calculated two ways: one way is to use a
detailed fleet inventory for all modes and includes detailed splits by vehicle type,

Technical note on assessing black carbon reductions using Long-range Energy October 2016 Alternatives Planning (LEAP) system with Integrated Benefits Calculator (LEAP-IBC)
23
performance and fuel type; the second is to use the simple transport sub-model which does
not break the transport modes into sub-categories of vehicles. The simpler model was chosen.
Data for oil and gas production is taken from the PEMEX annual statistics (PEMEX Annual
Statistical Yearbook, 2014). These are produced for each oil field and aggregated. Data on
flaring was taken from the World Bank dataset published in 2012. PEMEX only provides a
combined value of flaring and venting. The data used for the scenario is shown in Table 3.3.
SOURCES VARIABLE VALUE Oil Exploration and Production\ Drilling Wells drilled per year 994 Oil Exploration and Production\ Oil Production
Mcm/yr
Volume of Gas flared
2,800
tonnes/yr
Onshore Crude Production 32,474,050
Offshore Crude Production 99,215,760
Crude Oil loaded onto Marine Tankers
69,393,800
Oil Transport tonnes/yr
Oil Transported in Pipelines 530,517
Oil Refining
Crude Oil Refined 60,860,100
Gas Production, Processing and Distribution TJ/yr
Gas Production 2,700,164
Gas Processing 1,807,559
Gas Distribution 3,323,646
Table 3.3 Variables related to Oil and Gas used in LEAP-IBC for Mexico

Technical note on assessing black carbon reductions using Long-range Energy October 2016 Alternatives Planning (LEAP) system with Integrated Benefits Calculator (LEAP-IBC)
24
3.2.2 Scenarios
Once the current account data has been entered, two scenarios were modelled. These are
named Baseline Growth and Maximum Reduction:
The Baseline Growth scenario considers the potential for further oil exploration and only a
slight annual increase in oil production (1% per annum). This is based on current industry
expectations (EIA, 2015), however in practice speculation in oil production is fraught with
uncertainty. It can be highly variable depending on a number of factors such as market
conditions, locations of productive oil and gas fields as well as regulatory impacts. In
addition, in many countries, political instability can affect production. Therefore, in this
scenario, growth was also constrained due to uncertainty in the market due to low prices of
the gas and also low uptake of new technology due to lack of investment.
Flaring and venting have been reducing since 2008 partly as a consequence of Mexico’s
energy reform. Significant investments in gas handling and its use for re-injection such as in
the case of Cantarell primarily have led to this reduction. A growing domestic demand for gas
has also increased uptake. This has required more gas processing and distribution facilities to
meet such demand. In addition, Mexico is investing in new technologies to capture and
process the gas.
The Maximum Reduction scenario includes substantial reduction in venting through improved
operations and re-use of the gas (methane). The scenarios assume the methane capture
technology has been developed and used to convert the methane into other products such as
Liquid Natural Gas (LNG), used as a catalyst in bio-refineries or made into fertilizer. The
scenario does not assume that all the methane is captured though some will be still vented due
to logistical and infrastructural constraints and also through leakage. Flaring is also reduced
according to the World Bank zero routine-flaring initiative of reaching zero flaring by 2030.
There may still be some non-routine flaring for operational and safety reasons. The reduction
in flare volume is shown in Table 3.4.

Technical note on assessing black carbon reductions using Long-range Energy October 2016 Alternatives Planning (LEAP) system with Integrated Benefits Calculator (LEAP-IBC)
25
Table 3.4 Reduction of flaring in Mexico under two scenarios
3.2.3 Results
The purpose of running the model was to determine the potential reduction in BC emissions
by eliminating flaring and methane reductions by reducing venting. Both scenarios were run
over a 20 year time-frame (2010-2030) to coincide with the anticipated cessation of flaring.
Results in Table 3.5 show that overall BC emissions are small under the Baseline Growth
scenario (under 2 tonnes per year). However, when considering the total amount of emissions
over the time-period, BC has reduced by 3 tonnes (65 per cent).
Black Carbon Emissions (tonnes)
Scenarios
2010
2020
2030 Total
2010-2030
Baseline Growth 1,428 1,577 1,742 4,747
Maximum Reduction 1,428 235 - 1,663
Table 3.5 Reduction in Black Carbon from flaring
In comparison, methane reductions at approximately 150 kt are significant (Table 3.6) as
much of the methane is assumed to have been captured and converted. Not all the methane is
captured as some will be still vented due to logistical and infrastructural constraints and also
through leakage. There are other impacts associated with methane emission reductions
including global warming temperature change and its effect on crops.
Flaring volume (Mcm/yr) Scenarios 2010 2020 2030 Baseline Growth 2,800 4,813 5,316 Maximum Reduction 2,800 1,120 -

Technical note on assessing black carbon reductions using Long-range Energy October 2016 Alternatives Planning (LEAP) system with Integrated Benefits Calculator (LEAP-IBC)
26
Crop yield losses will also reduce as a result of implementing the Maximum Reduction
scenario although this effect largely comes as a result of a reduction in climate change impact
than direct impact on crop health. The reduction in crop yield losses is approximately 0.5 per
cent or 21,000 tonnes by 2030 for all crops. Maize accounts for 94 per cent (19,900 tonnes)
of these reductions.
Under the Maximum Reduction scenario reductions in emissions from carbon dioxide,
aerosols and ozone could see radiative forcing reduced by 2% by 2030, declining from 48.2
w/m2 6 to 47.2 4/m2 compared to the Baseline Growth scenario. This is primarily due the
effect of reducing methane, which is a precursor to Ozone and which also has a higher global
warming potential.
Methane Emissions 2010 2020 2030 (kts) Baseline Growth Flaring 8.9 13.8 19.3 Venting 257.6 399.9 557.0 Total 266.5 413.7 576.3 Maximum Reduction Flaring 8.9 12.1 14.4 Venting 257.6 350.3 416.3 Total 266.5 362.5 430.7
Table 3.6 Methane reductions under two scenarios in Mexico
In terms of global temperature change, if measures were implemented to reduce flaring and
venting then temperatures would reduce by approximate 0.2 mK[7] in 2030 that is to say
there will be a very negligible effect.
LEAP-IBC does not attribute any deaths due to BC from oil and gas flaring however in terms
of Particulate Matter (PM2.5) the model predicts 190 deaths saved over the time-period.
3.3 Case Study – Colombia
Colombia is the third-largest oil producer in Latin America. Most of Colombia's crude oil
production occurs in the Andes foothills and the eastern Amazonian jungles. Rubiales is the
largest oil field in the country, located in the centre of Colombia (EIA, 2015). Colombia has 6 watts per square metre 7 mlliKelvin

Technical note on assessing black carbon reductions using Long-range Energy October 2016 Alternatives Planning (LEAP) system with Integrated Benefits Calculator (LEAP-IBC)
27
seven major oil pipelines crossing the country: (Bicentennial , Ocensa; Cano-Limon; Llanos
Orientales; Alto Magdalena; Colombia Oil and Transandino) four of which connect oil and
gas fields to the Caribbean coast export terminal. Similar to the oil sector, natural gas
production has risen substantially in the last few years, owing to greater investment at
existing fields, rising domestic consumption, and new export opportunities
Oil production has increased significantly in Colombia from 2010 after a period of decline as
a result of the government introducing a series of regulatory reforms. The national target is to
produce 1 million barrels per day (bls/d) up from 686,000 bls/d in 2009. Similar to PEMEX,
Ecopetrol was a fully state-owned company but is now part-privatised to attract investors,
primarily in upstream production. Recently, new pipelines and refining capacity has helped
increased oil production especially off-shore. Most oil production is on-shore (80 per cent of
production) although it is estimated that offshore exploration in the country could increase six
times and triple the size of gas reserves off the Colombian Caribbean coast (PwC, 2014).
Security remains a major problem for the industry where attacks on pipelines have led to
production stopping as recently as March 2016.
Chevron is the largest gas producer and most of the production is located in two fields the
Llanos and Guajira basins. Recently, gas production has increased due to investment in
existing fields and increased domestic energy demand. Previously, the majority of the gas
was re-injected to increase oil production. Compared to Mexico the amount of flaring in
Colombia is small (0.6 bcm per annum compared to 2.8 bcm per annum for Mexico in 2010).
Ecopetrol has a programme of environmental measures to capture and market methane gas
released at drilling sites and also capturing of natural gas escaping at well sites and its
conversion to electricity for further production.
3.3.1 Data input
Oil and gas production data were available from BP Statistical Review of World Energy
(2015) and flaring volume for 2010 was taken from the World Bank GGFR flaring database.
Data for other sectors is based on the same data sources outlined for Mexico in section 3.2.1.
Population, GDP, production share values used for the scenario are shown in Table 3.7.
Technical note on assessing black carbon reductions using Long-range Energy October 2016 Alternatives Planning (LEAP) system with Integrated Benefits Calculator (LEAP-IBC)
28
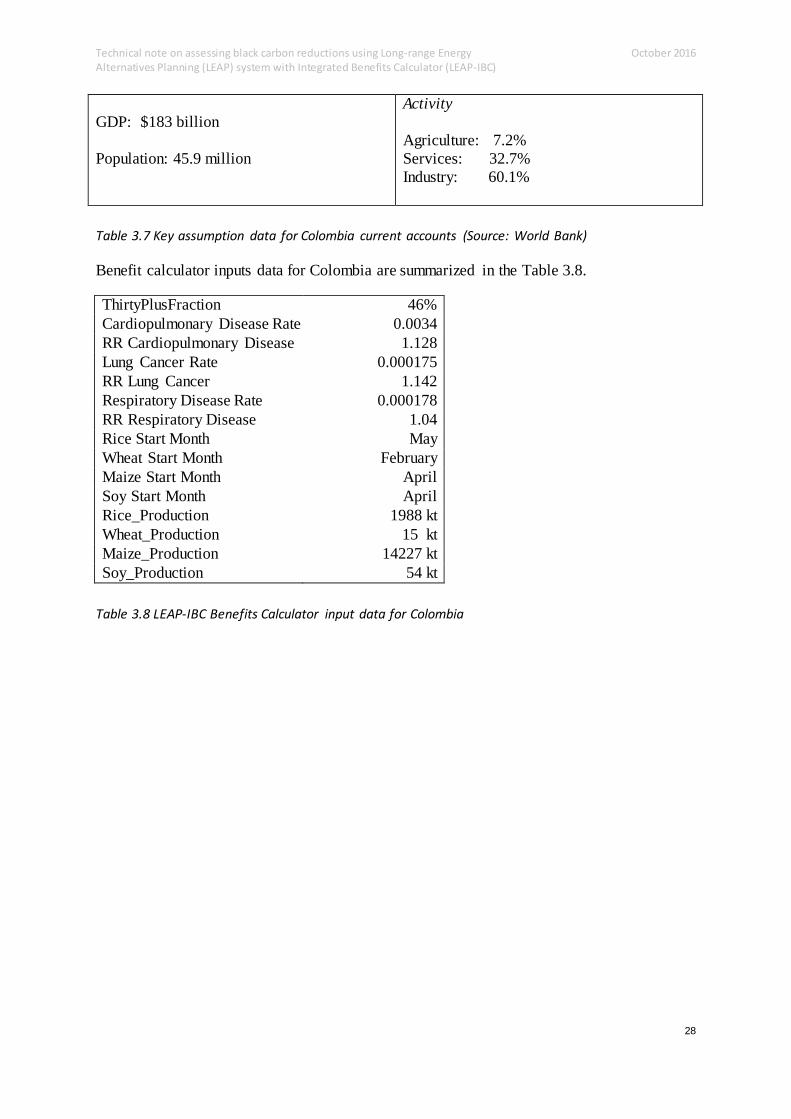
GDP: $183 billion Population: 45.9 million
Activity Agriculture: 7.2% Services: 32.7% Industry: 60.1%
Table 3.7 Key assumption data for Colombia current accounts (Source: World Bank)
Benefit calculator inputs data for Colombia are summarized in the Table 3.8.
ThirtyPlusFraction 46% Cardiopulmonary Disease Rate 0.0034 RR Cardiopulmonary Disease 1.128 Lung Cancer Rate 0.000175 RR Lung Cancer 1.142 Respiratory Disease Rate 0.000178 RR Respiratory Disease 1.04 Rice Start Month May Wheat Start Month February Maize Start Month April Soy Start Month April Rice_Production 1988 kt Wheat_Production 15 kt Maize_Production 14227 kt Soy_Production 54 kt
Table 3.8 LEAP-IBC Benefits Calculator input data for Colombia

Technical note on assessing black carbon reductions using Long-range Energy October 2016 Alternatives Planning (LEAP) system with Integrated Benefits Calculator (LEAP-IBC)
29
SOURCES VARIABLE VALUE Oil Exploration and Production\ Drilling Wells drilled per year 112
Oil Exploration and Production\ Oil Production Mcm/yr
Volume of Gas flared
2,800
tonnes/yr Onshore Crude Production 32,108,000 Offshore Crude Production 8,027,000
Crude Oil loaded onto Marine Tankers
12,414,733
Oil Transport tonnes/yr Oil Transported in Pipelines 38,387,244
Oil Refining
Crude Oil Refined 15,387,000
Gas Production, Processing and Distribution TJ/yr
Gas Production
438,454
Gas Processing
112,135
Gas Distribution 166,593 Table 3.9 Oil and gas data for Colombia used for scenarios
3.3.2 Scenarios
In a similar way that was employed for the Mexico case study, two scenarios were
investigated to compare the Baseline Growth with the Maximum Reduction scenarios. The
baseline scenario followed similar a growth pattern however additional gas production is
envisaged as domestic demand is foreseen to increase and further off-shore oil production is
expected as new fields are opened up for foreign companies to explore and develop.
Both scenarios envisage oil production increasing in line with the US Energy Information
Administration’s predicted growth of 1% per annum between 2011 and 2035 whilst gas
production will increase by 1.4% (EIA, 2015).

Technical note on assessing black carbon reductions using Long-range Energy October 2016 Alternatives Planning (LEAP) system with Integrated Benefits Calculator (LEAP-IBC)
30
Under the Maximum Reduction scenario flaring will reduce by 98 per cent (taking into
account some non-routine flaring taking place). In addition control measures to reduce
venting by 60 per cent will be introduced. These measures include reductions in venting
where methane is captured and converted for sale to market or for energy production as well
as reduction of fugitive emissions e.g. leakages from valves.
3.3.3 Results
Due to the relatively low flaring activity in Colombia it follows that there is only a relatively
small decrease in total BC emissions achievable if zero routine flaring were to be attained in
2030. Table 3.10 shows that under the Baseline Growth scenario, BC emissions increase from
0.3 tonnes to 0.5 tonnes over the time period and the overall BC emissions saved as flaring
ceases under the Maximum Reduction scenario are approximately 1.6 tonnes.
Table 3.10 Baseline Growth scenario for Colombia
The comparison between the two scenarios shows that methane emission reductions across all
parts of the oil and gas industry would be possible, approximately 181kilotonnes over the
time period 2010-2030 (Table 3.11).
Black Carbon Emissions
2010 2020 2030 Total 2010-2030
(tonnes) Baseline Growth 0.29 0.41 0.52 2.03 Maximum Reduction
0.29 0.11 -
0.45

Technical note on assessing black carbon reductions using Long-range Energy October 2016 Alternatives Planning (LEAP) system with Integrated Benefits Calculator (LEAP-IBC)
31
Table 3.11 Reduction in Methane emissions under two scenarios for Colombia
The additional co-benefits from reducing flaring and venting under the scenarios are also
very marginal. For example, the reduction in global mean temperature is 0.065mK in 2030.
The overall reduction in radiative forcing is 0.14 w/m2, again with ozone contributing the
greatest reduction due to less methane produce. The results for the scenarios undertaken for
Colombia also show that there are no deaths attributable to the emissions from oil and gas.
4. ANALYSIS
This project has used the LEAP-IBC tool to model the reduction in black carbon (BC)
emissions from flaring and methane emissions from venting in Mexico and Colombia.
Scenario modelling undertaken in this assessment takes into account current levels of
emissions at existing flaring rates and then scenarios constructed comparing business-as-
usual case (Baseline scenario) to those where flaring has reduced either through control
measures (regulation) or through implementation of technology to capture gas. However, the
output from the model can provide a relative measure to compare different mitigation options
against the business as usual.
Whilst BC emissions from flaring alone in each country are relatively small when added
together with other sources – transport, brick production, waste burning and cooking stoves
then the overall contribution by each country is important. Other CCAC initiatives have
demonstrated how BC can be reduced and the associated benefits activities can yield.
BC emissions are relatively small in Colombia. Much of the gas from the oil and gas industry
is re-injected to increase pressure to enable greater oil extraction. Similar to Mexico there
Methane Emissions 2010 2020 2030 (kt) Baseline Growth 188 414 683 Maximum Reduction 188 357 502

Technical note on assessing black carbon reductions using Long-range Energy October 2016 Alternatives Planning (LEAP) system with Integrated Benefits Calculator (LEAP-IBC)
32
could be potential to reduce methane emission significantly depending on the scale of
technology that is introduced to process it for example into Liquefied Natural Gas (LNG).
5. RECOMMENDATIONS
What is clear from the development of the scenarios is the lack of detailed measurements
from oil and gas installations on which to develop the scenarios. There does not appear to be
a verifiable emission inventory for the sector in Colombia. In Mexico, flaring and venting is
disaggregated and reported by PEMEX at a production region level.
Most global datasets that are available provide only national estimates of flaring volumes or,
in other words, territorial emissions. Countries which operate state-operated oil exploration
facilities may have greater control and accountability to produce accurate emission
inventories. The issue of attaching responsibility to the volumes can be further misleading as
the flaring activity might be from non-National sources i.e. foreign companies, multi-
nationals.
There is lack of regulation or enforcement of regulations to make companies comply with any
legislation to report flaring and venting. There needs to be a means of verification and where
the facilities are off-shore, this will be particularly difficult to measure. Satellite data can aid
verification but this also requires local expertise in processing and analysing the data. Whilst
the satellite data can detect where flaring is occurring to a reasonable level of accuracy it
cannot yet successfully quantify the emissions from individual flares. As a consequence there
is a large amount of uncertainty in any assessments.
Overall there is a need for better data collection and measurement either on-site or remotely
although this may improve as new technologies are introduced.
Such data gathering includes:
- production and flaring data at each site (platform/well)
- different hydrocarbon constituents and conditions related to combustion efficiency of flares
- improved understanding of flare constituents and derivation of emission factors related to
different type of crude oil
- what control measures employed or technology used to capture and convert gas

Technical note on assessing black carbon reductions using Long-range Energy October 2016 Alternatives Planning (LEAP) system with Integrated Benefits Calculator (LEAP-IBC)
33
- associated meteorological data measurements e.g. wind speed
- measurement of venting and detection of methane from satellite
This can only be achieved through international efforts which require companies and
countries to report detailed measurements. Undertaking these types of assessments are costly
and could still be open to high levels of uncertainty. Therefore, one recommendation would
be to include reporting of flaring and venting emissions as a requirement of the signatories to
the Zero Routine Flaring Initiative of the World Bank.
REFERENCES
BP, 2015, Statistical Review of World Energy. http://www.bp.com/en/global/corporate/energy-economics/statistical-review-of-world-energy.html EIA, 2015, US Energy Information Administration International energy data and analysis.
Elvidge, C.D., Zhizhin, M.; Baugh, K., Hsu, F.-C. and Ghosh, T. 2016 , Methods for Global Survey of Natural Gas Flaring from Visible Infrared Imaging Radiometer Suite Data. Energies 2016, 9, 14. Eni, Website https://www.eni.com/en_IT/sustainability/climate-change-and-new-forms-of-energy/reduction-of-routine-gas-flaring.page GGFR, 2012, Global Gas Flaring Reduction Initiative of the World Bank http://www.worldbank.org/en/programs/gasflaringreduction.
GGFR, 2015, Zero Flaring Initiative of the World Bank http://www.worldbank.org/en/programs/zero-routine-flaring-by-2030
International Energy Agency Statistics Yearbook 2014 IPCC (2006) Intergovernmental Panel on Climate Change (IPCC). Guidelines for National Greenhouse Gas Inventories (http://www.ipcc-nggip.iges.or.jp/public/2006gl/index.html)
Klimont, Z., Kupiainen, K., Heyes, C., Purohit, P., Cofala, J., Rafaj, P., Borken-Kleefeld, J., Schoepp, W. 2016a. Global anthropogenic emissions of particulate matter including black carbon. In preparation, McEwen, J.D.N. & Johnson, M.R. 2012. Black carbon particulate matter emission factors for buoyancy-driven associated gas flares, Journal of the Air & Waste Management Association, 62:3, 307-321, DOI: 10.1080/10473289.2011.650040
PEMEX Annual Statistical Yearbook, 2014

Technical note on assessing black carbon reductions using Long-range Energy October 2016 Alternatives Planning (LEAP) system with Integrated Benefits Calculator (LEAP-IBC)
34
PwC, 2014, Colombia Oil & Gas Industry 2014: An Overview. Pricewaterhouse Coopers http://www.pwc.com/gx/en/industries/energy-utilities-mining/oil-gas-energy/publications/colombia-oil-gas-industry-2014.html
UNEP/WHO Assessment Report (UNEP/WHO, 2011)).
World Bank, 2015, http://www.worldbank.org/en/programs/zero-routine-flaring-by-2030
World Bank statistical dataset -http://data.worldbank.org/country/colombia
World Bank statistical dataset -http://data.worldbank.org/country/mexico

Technical note on assessing black carbon reductions using Long-range Energy October 2016 Alternatives Planning (LEAP) system with Integrated Benefits Calculator (LEAP-IBC)
35
APPENDIX 1. Signatories to the World Bank Initiative to cease routine flaring by 2030
GOVERNMENTS COMPANIES ORGANISATIONS
• Angola
• Azerbaijan
• Cameroon
• Canada
• Republic of Congo
• France
• Gabon
• Germany
• Kazakhstan
• Mexico
• Netherlands
• Norway
• Perú
• Russian Federation
• State of California, United States
• Turkmenistan
• United States
• Uzbekistan
• BP
• Eni
• Entreprise Tunisienne d’Activités Pétrolières (ETAP – Tunisia)
• Galp Energia (Portugal)
• KazMunayGaz (Kazakhstan)
• Kuwait Oil Company
• MOL Group
• Niger Delta Petroleum Resources Ltd. (Nigeria)
• ONGC (India)
• Petroamazonas EP (Ecuador)
• Royal Dutch Shell
• Seven Energy (Nigeria)
• Societé Nationale des Hydrocarbures (SNH – Cameroon)
• Societé Nationale des Petroles du Congo (SNPC)
• Sonangol (Angola)
• State Oil Company of the Azerbaijan Republic (SOCAR)
• Statoil
• TOTAL
• Uzbekneftegaz (Uzbekistan)
• Wintershall
• African Development Bank (AfDB)
• Agence Française de
Développement (AFD)
• Asian Development Bank (ADB)
• ECOWAS Bank for
Investment and Development (EBID)
• European Bank for
Reconstruction and Development (EBRD)
• Inter-American Development Bank (IDB)
• Islamic Development Bank (IsDB)
• OPEC Fund for
International Development (OFID)
• United Nations
Sustainable Energy for All (SE4All)
• West African Development Bank (BOAD)
• World Bank Group

Technical note on assessing black carbon reductions using Long-range Energy October 2016 Alternatives Planning (LEAP) system with Integrated Benefits Calculator (LEAP-IBC)
36