TECHNICAL MEMORANDUM TO: FROM: COPY: …€¦ · · 2015-08-28TECHNICAL MEMORANDUM TO: Dennis...
22
TECHNICAL MEMORANDUM TO: Dennis Crumpler / OAQPS FROM: Eric Boswell / NAREL COPY: Dr. Richard Tropp / DRI Dr. Marc Pitchford / IMPROVE Steering Committee Chair AUTHOR: Steve Taylor DATE: August 21, 2007 SUBJECT: DRI Laboratory Audit Introduction On May 15, 2007, a Technical Systems Audit (TSA) was conducted at Desert Research Institute’s (DRI’s) Division of Atmospheric Sciences (DAS) and Environmental Analysis Facility (EAF), located in Reno, NV. This TSA was conducted as part of the U.S. Environmental Protection Agency’s (EPA’s) quality assurance oversight for the PM 2.5 Chemical Speciation Network (CSN). DRI was initially contracted by the Texas Commission on Environmental Quality (TCEQ) in 1999 to provide laboratory support for their PM 2.5 Federal Reference Method (FRM) Program. In 2004, TCEQ awarded a new contract to DRI which included laboratory support for their supplemental PM 2.5 CSN sites. DRI’s support activities include shipping, receiving and analysis of filter samples, data management, database development, training, and project management. The Texas CSN contract includes approximately seven PM 2.5 Speciation sampling sites that operate on a one in six day schedule and two sites that operate on a one in three day schedule. EPA also provides quality assurance oversight for the Interagency Monitoring of Protected Visual Environments (IMPROVE) Network. DRI is contracted to provide laboratory support for all filter samples collected by the IMPROVE Network that require carbon analysis. This support includes pre-treatment and analysis of 25 millimeter quartz-fiber filters for organic and elemental carbon (OC/EC) and the carbon sub-fractions. Carbon data for the IMPROVE Network is reported to Crocker Nuclear Laboratory (CNL) located on the campus of the University of California in Davis, California. CNL is the coordinating laboratory for all field operations and speciation laboratory work for the IMPROVE program. The EPA audit team consisted of Jewell Smiley and Steve Taylor, physical scientists at the National Air and Radiation Environmental Laboratory (NAREL) located in Montgomery, AL and Dr. Marc Pitchford. Marc is a meteorologist with the National Oceanic and Atmospheric Administration (NOAA), senior scientist with EPA, and he is also chairman of the IMPROVE Steering Committee. This TSA was the second EPA inspection of the DRI laboratory systems and operations. A report of the first TSA, conducted in 2005, is available on the web (reference 1). Page 1 of 22
Transcript of TECHNICAL MEMORANDUM TO: FROM: COPY: …€¦ · · 2015-08-28TECHNICAL MEMORANDUM TO: Dennis...

TECHNICAL MEMORANDUM
TO: Dennis Crumpler / OAQPS FROM: Eric Boswell / NAREL COPY: Dr. Richard Tropp / DRI Dr. Marc Pitchford / IMPROVE Steering Committee Chair AUTHOR: Steve Taylor DATE: August 21, 2007 SUBJECT: DRI Laboratory Audit
Introduction On May 15, 2007, a Technical Systems Audit (TSA) was conducted at Desert Research Institute’s (DRI’s) Division of Atmospheric Sciences (DAS) and Environmental Analysis Facility (EAF), located in Reno, NV. This TSA was conducted as part of the U.S. Environmental Protection Agency’s (EPA’s) quality assurance oversight for the PM2.5 Chemical Speciation Network (CSN). DRI was initially contracted by the Texas Commission on Environmental Quality (TCEQ) in 1999 to provide laboratory support for their PM2.5 Federal Reference Method (FRM) Program. In 2004, TCEQ awarded a new contract to DRI which included laboratory support for their supplemental PM2.5 CSN sites. DRI’s support activities include shipping, receiving and analysis of filter samples, data management, database development, training, and project management. The Texas CSN contract includes approximately seven PM2.5 Speciation sampling sites that operate on a one in six day schedule and two sites that operate on a one in three day schedule.
EPA also provides quality assurance oversight for the Interagency Monitoring of Protected Visual Environments (IMPROVE) Network. DRI is contracted to provide laboratory support for all filter samples collected by the IMPROVE Network that require carbon analysis. This support includes pre-treatment and analysis of 25 millimeter quartz-fiber filters for organic and elemental carbon (OC/EC) and the carbon sub-fractions. Carbon data for the IMPROVE Network is reported to Crocker Nuclear Laboratory (CNL) located on the campus of the University of California in Davis, California. CNL is the coordinating laboratory for all field operations and speciation laboratory work for the IMPROVE program.
The EPA audit team consisted of Jewell Smiley and Steve Taylor, physical scientists at the National Air and Radiation Environmental Laboratory (NAREL) located in Montgomery, AL and Dr. Marc Pitchford. Marc is a meteorologist with the National Oceanic and Atmospheric Administration (NOAA), senior scientist with EPA, and he is also chairman of the IMPROVE Steering Committee. This TSA was the second EPA inspection of the DRI laboratory systems and operations. A report of the first TSA, conducted in 2005, is available on the web (reference 1).
Page 1 of 22

Summary of Audit Proceedings
The audit team was greeted on arrival at DRI by Dr. Judith Chow and Dr. Richard Tropp. Dr. Chow is the DRI EAF director and senior technical advisor. Dr. Tropp is DRI’s principal investigator and project manager for the TCEQ contract. The TSA began with an introductory meeting with DRI senior staff to present an overview of the audit process and to share information on any recent developments at DRI and EPA. Dr. John Watson, the DRI EAF QA manager presented precision data collected from DRI’s model 2001 thermal/optical carbon analyzers. The data were the result of analyzing a second punch from 10% of the filter samples for replicate analysis. Dr. Chow, EAF founder, briefed the audit team on current research in progress at the EAF facility.
NAREL auditors had planned several experimental activities to be performed during the audit and details of these activities were explained to DRI staff during the initial meeting. One of the activities involved verification of temperature and humidity control in DRI’s weighing room. For this activity, NAREL supplied temperature/humidity loggers were placed in the weighing room by DRI staff to begin recording data.
Following the introductory meeting, the auditors proceeded to inspect specific areas of the laboratory and to interview technical staff who actually perform the analyses. At least one member of the DRI staff was always available to escort and assist the auditors. The following specific areas at the DRI facility were visited and inspected.
Sample Shipping, Receiving and Handling - Brenda Cristani
Gravimetric Laboratory - Brenda Cristani
Ion Chromatography (IC) Laboratory - Ed Hackett
XRF Laboratory - Steven Kohl
Organic Carbon/Elemental Carbon (OC/EC) Laboratory - Dana Trimble, Teresa Bohannan
In addition to the laboratory areas mentioned above, interviews were also conducted with Dr. Tropp concerning data review, validation and reporting; QA documentation, and DRI support for field activities.
In preparation for the TSA, the auditors obtained DRI’s QA documents for review. The documents included updated versions of the TCEQ Quality Assurance Project Plan (QAPP) (reference 2), the Quality Management Plan (QMP) (reference 3), and Standard Operating Procedures (SOPs). Documentation also included copies of training memoranda sent to Texas field personnel.
DRI’s reported results from NAREL’s 2006 performance evaluation (PE) study were also reviewed in preparation for the TSA. A report of the 2006 PE study is available on the web (reference 4). Results of the PE study were discussed in detail in the specific laboratory area that had analyzed each sample. The experimental activities performed during the course of this audit will be described later within the appropriate section of this report.
Page 2 of 22

Gravimetric Laboratory
Brenda Cristani, the weighing lab supervisor, was interviewed for this part of the TSA. Lab technician Cody Meredith, was also available during the interview. The interviews and inspections were performed to determine compliance with good laboratory practices, the QAPP, and the following SOPs and documents.
DRI SOP #2-114.2 - Gravimetric Analysis (DRI is in the process of revising this SOP). (reference 5)
Monitoring PM2.5 in Ambient Air Using Designated Reference or Class I Equivalent Methods. Quality Assurance Guidance Document 2.12. U.S. Environmental Protection Agency. Office of Research and Development, Research Triangle Park, NC. 1998. (reference 6)
DRI’s procedures for mass measurements follow the guidelines listed in the EPA Quality Assurance Guidance Document 2.12 listed above (reference 6). A Mettler Toledo MT5 microbalance is used for weighing the TCEQ Teflon® filters. Mass determination typically proceeds by weighing the collection filter before (pre-weight) and after (post-weight) the sampling event. The amount of Particulate Matter captured onto the surface of the filter can be calculated by a simple subtraction of the pre-weight from the post-weight. New 47mm Teflon® filters are checked for defects on a light table. Filters that pass inspection are logged into the laboratory information system (LIMS) which assigns an ID number to each filter. Filters are equilibrated for at least 24 hours before pre-weights are determined. The EPA Guidance Document recommends re-weighing 10% of the pre-weighed filters. As an extra QC measure, DRI re-weighs 100% of their pre-weighed filters. The filters are re-weighed by another technician in a different weighing session. The re-weighed filter must be within ±10 µg of the original weight to be accepted. Post-weighed filters are re-weighed at the rate of 30% by another technician. Acceptance criteria of post-weighed filters are ±15 µg. Filters that fail the criteria are re-weighed once the balance is checked. The microbalance is maintained and recalibrated annually by an independent contractor using NIST Class 1 weights. DRI’s working mass standards and primary mass standards are re-certified annually by an independent contractor.
The DRI gravimetric measurements are performed in an environmentally controlled weighing room. The weighing room is configured to satisfy conditions of cleanliness, constant temperature, and constant humidity required by the program. Accurate control of the climate inside the weighing room is important because the balance calibration is very sensitive to temperature, and the equilibrated mass on a Teflon® filter is sensitive to humidity. The microbalance is also extremely sensitive to static electricity. DRI uses a custom made box containing several low-level radioactive 210Po radiation sources to dissipate static charge on filters. Each filter is placed into the box for 30 to 60 seconds just prior to being weighed. To satisfy requirements for cleanliness, the weighing room is kept under positive pressure with HEPA filtered air.
The criteria for conditioning Teflon® filters used to collect PM2.5 are specified in the EPA Quality Assurance Guidance Document 2.12 (reference 6). The criteria specify a temperature between 20-23 °C, controlled to ± 2 °C for 24 hours. The average relative humidity (RH) must be between 30-40% controlled to ± 5% RH over 24 hours. DRI uses a digital hydrometer/thermometer to monitor the weighing room conditions. The
Page 3 of 22

hydrometer/thermometer sensors are checked for accuracy semi-annually by DRI staff using standards traceable to the National Institute of Standards and Technology (NIST). The temperature and humidity readings are automatically recorded into a database each minute. Daily control charts are printed and used to check the weighing room conditions before weighing.
Dickson temperature/humidity data loggers were brought from NAREL to independently measure conditions inside of DRI’s weighing room. NAREL’s data loggers were placed into the weighing room on the morning of the audit and remained there for several hours. Figure 1 shows the comparison of the temperature and humidity measurements inside the weighing room as recorded by NAREL and DRI data loggers. Figure 1
Temperature and Relative Humidity MeasurementsDRI Weighing Room May 15, 2007
10.0
12.0
14.0
16.0
18.0
20.0
22.0
24.0
8:30 AM 9:30 AM 10:30 AM 11:30 AM 12:30 PM 1:30 PM 2:30 PM 3:30 PM 4:30 PM
Tem
pera
ture
(°C
)
.
20
25
30
35
40
45
50
Rel
ativ
e H
umid
ity (%
)
.
Dickson#1 (°C) DRI (°C) Dickson#1 (RH) DRI (RH)
The average RH was 35.5 % recorded by the NAREL device and 32.3 % for the DRI device. The average temperature was 22.0 °C recorded by the NAREL device and 21.7 °C for the DRI device. The measurement differences are within acceptable limits based on the accuracy for each device. The data loggers have an expected accuracy of ± 2 % RH and ± 0.5 °C and are traceable to NIST. The measurements indicate very good humidity and temperature control of the weighing room for the time period indicated.
Prior to the audit, the NAREL auditors had planned for experiments and demonstrations that could be performed by DRI analysts. In preparation for the gravimetric demonstrations, four 47 mm Teflon® filters were inspected, equilibrated in NAREL’s weighing chamber, and pre-weighed. Two stainless steel mass standards that had been slightly altered from their nominal mass were also pre-weighed. All samples were placed into individual labeled petri slides and brought to the TSA. Two filters, T07-12128 and T07-12129, served as controls and two filters, T07-12156 and T07-12157, and the metallic weights were used to demonstrate DRI’s weighing procedures in the gravimetric lab.
Page 4 of 22

The gravimetric demonstration began during the morning interview with Brenda Cristani. The filters and metallic weights were place in a positive pressure laminar flow hood with their petri slides slightly opened. A weighing session by technician Mr. Cody Meredith was in progress and was temporarily interrupted to perform the demonstration. The microbalance performed a re-zero and auto-calibration just before the demonstration began. Each sample was then weighed by Mr. Meredith who manually recorded the mass from the balance display. Normally, DRI’s mass results are automatically entered into an electronic database as well as manually recorded onto a form. Table 1 summarizes the demonstration’s mass results.
Table 1. EPA/DRI Mass Demonstration AM Session Observed Mass (mg) Corrected Mass (mg) Difference
Sample ID NAREL DRI NAREL DRI EPA - DRI T07-12156 142.137 142.168 142.287 142.293 -0.006 T07-12157 140.254 140.284 140.402 140.407 -0.005
MW07-12134 191.060 191.068 191.060 191.068 -0.008 MW07-12135 96.353 96.360 96.353 96.360 -0.007
Table 1 also shows the mass results with corrections applied to account for the large difference in altitude between the NAREL and DRI laboratories. DRI’s location is approximately 5000 feet above mean sea level (msl) compared to near msl for NAREL. At the higher elevation the air density is less than at msl resulting in less buoyant lifting force. The difference in air buoyancy has a large affect on Teflon® filters which are significantly less dense than the stainless steel calibration weights used to establish the balance’s calibration curve. The corrected mass shown in Table 1 is the balance reading corrected to account for the differences in air density between NAREL and DRI. Since the density of the metallic samples (MW07-12134 and MW07-12135) is essentially the same as the balance calibration weights, the displayed and true masses are equal. Performing pre-weight and post-weight of a filter on the same balance at the same location eliminates the need for the buoyancy correction. Although the samples were allowed only a few minutes to equilibrate, Table 1 shows relatively good agreement between DRI and NAREL for the two filter samples. Between lab agreement was not as good for the metallic samples. For NAREL gravimetric studies, between labs agreement for metallic samples is typically within the ± 0.003 mg. According to the EPA Quality Assurance Guidance Document 2.12 (reference 6), the working standard measurements should agree to within 3 μg of the verified values.
It was learned that for routine weighing operations, the balance readings are written to a database where a correction factor based on results of a daily check standard is applied. The procedure used to determine the correction factor was not fully explained by DRI staff or by the gravimetric SOP. This was discussed with DRI staff and a decision was made to reweigh the samples with the correction factor applied. The reweighing was performed during the afternoon of the TSA. Table 2 compares results of the DRI afternoon weigh session to NAREL’s measurements.
Table 2. EPA/DRI Mass Demonstration PM Session Observed Mass (mg) True Mass (mg) Difference
Sample ID NAREL *DRI NAREL DRI EPA - DRI T07-12156 142.137 142.157 142.287 142.282 0.005 T07-12157 140.254 140.273 140.402 140.396 0.006
MW07-12134 191.060 191.054 191.060 191.054 0.006 MW07-12135 96.353 96.349 96.353 96.349 0.004
Page 5 of 22

Results of the second DRI weigh session compare reasonably well to NAREL’s results, however, there was concern by the audit team as well as DRI staff for the relatively large change between DRI’s morning and afternoon measurements. Note that DRI’s afternoon measurements decreased 0.011 – 0.014 mg from the morning session (see Table 3).
Table 3. DRI Repeat Measurements DRI Mass (mg) DRI Mass (mg) Difference
Sample ID AM PM DRI – DRI (mg) T07-12156 142.293 142.282 0.011 T07-12157 140.407 140.396 0.011
MW07-12134 191.068 191.054 0.014 MW07-12135 96.360 96.349 0.011
The initial measurements were performed during the morning interviews where several of DRI’s staff and the auditors were present. Because the microbalance is very sensitive to temperature fluctuations, the unusually large number of personnel in the room could account for part of the measurement difference.
The final experiment planned for the gravimetric laboratory served to demonstrate the repeatability of DRI’s mass measurements. Two filters were selected at random from DRI’s stock of pre-weighed filters and were re-weighed in the auditors’ presence. DRI filters TC111T11098 and TC111T11107 were originally weighed by DRI on May 11 and May 14 respectively. Table 3 shows the results of DRI’s recorded pre-mass measurements compared to the mass measured during the audit. The experiment found good agreement between measurements determined on different dates even though no correction factor was applied to the measurements determined on the day of the TSA. DRI’s criterion for reweighs of tared filters is ± 0.010 mg.
Table 3. Filters Removed from DRI's Tared Stock
NAREL Sample ID
DRI Sample ID
Date of Pre-Wt.(mg)
DRI Pre-Wt.(mg)
5/15/07 DRI
Re-Wt.(mg) Difference
(mg) T07-12158 TC111T11098 5/11/07 140.704 140.699 0.005 T07-12159 TC111T11107 5/14/07 142.157 142.154 0.003
DRI allowed the auditors to keep the two filters in order to obtain independent mass measurements after returning to NAREL. Table 4 shows very good agreement between DRI and NAREL after correcting the observed mass to msl.
Table 4. Filters Removed from DRI’s Tared Stock
NAREL Sample ID
DRI Sample ID
DRI Pre-Mass* (mg)
NAREL Post Audit Mass*
(mg) Difference
(mg) T07-12158 TC111T11098 140.825 140.824 -0.001 T07-12159 TC111T11107 142.280 142.280 0.000
* Measurements corrected to msl. Acceptable results were seen from the majority of the mass experiments performed during the audit. The primary concern during this part of the TSA was the relatively large change in replicate measurements between the AM and PM weigh sessions. Related to the gravimetric
Page 6 of 22

concern was the 2006 PE in which DRI’s reported a result for a metallic sample that fell outside acceptance limits of the study. Based on the PE results and this TSA’s experiments, Dr. Tropp and Brenda stated that they plan to investigate further to determine if there is a balance stability problem or other issue with the microbalance.
Sample Receiving and Handling Laboratory The interviews and inspections were performed to determine compliance with good laboratory practices, the QAPP, and the following SOPs and documents.
DRI SOP #2-113.2 - PM2.5 FRM Sample Shipping, Receiving, and Chain-of-Custody (Reference 7)
DRI SOP #2-112.2 - PM2.5 FRM Filter Pack Assembly, Disassembly, and Cleaning (Reference 8)
Ms. Cristani was available to explain DRI’s filter processing and shipping procedures. Brenda explained their process of shipping clean filters to the field sites and receiving the loaded filters back at the lab. R&P Partisol-Plus Model 2025 Sequential Air Samplers are used by TCEQ to collect PM2.5 air samples. For chemical speciation, samplers are paired at each site with one sampler loaded with Teflon® filters used for gravimetric, XRF, and ions analysis and one with quartz filters for carbon analysis. Nylon® filters are not used by TCEQ in the R&P Model 2025 sampler.
Working in a laminar flow hood, new, pre-weighed Teflon® filters and pre-fired quartz filters are loaded into cassettes and placed into protective clamshell containers. Barcodes and labels identifying the filter and cassette are placed on the clamshell containers. Sample identification and sampling date information are entered on field data sheets/chain of custody forms and also into a laboratory database. The assembled cassettes and protective containers are sealed into labeled plastic bags along with the field data sheets. The filters are sent to the field sites by second day delivery. After the sampling event, the loaded filters are returned to the laboratory by overnight delivery still mounted in the cassette, but are cooled to approximately 4 °C for preservation during transit. Upon receipt at the laboratory, the coolers are opened and the temperature is measured and recorded. Each cassette is disassembled, and the recovered filter is transferred to a petri slide. The bar code label is also transferred to the petri slide. The Teflon® filters are moved to the weighing room for equilibration and the quartz filters are stored under refrigeration until analysis. The filter holder cassettes are cleaned for reuse using a dishwasher and deionized water. The clamshell protective cassette holders are cleaned with methanol.
There is a potential to contaminate filters due to sample handling in the laboratory and in the field. Blank filters are included with every shipment of filters to monitor for contamination. The field blank is handled with the same procedures as the samples except that no air is sampled through the designated blank filter. The audit team made a request to examine current field blank results and Dr. Tropp provided spreadsheets with analysis results of field blanks from the TCEQ program. A summary of the TCEQ field blank results as of the fourth quarter of 2004 through the fourth quarter of 2006 are presented in table 5. Table 5 also includes MDLs calculated from laboratory blanks for the same period.
Page 7 of 22
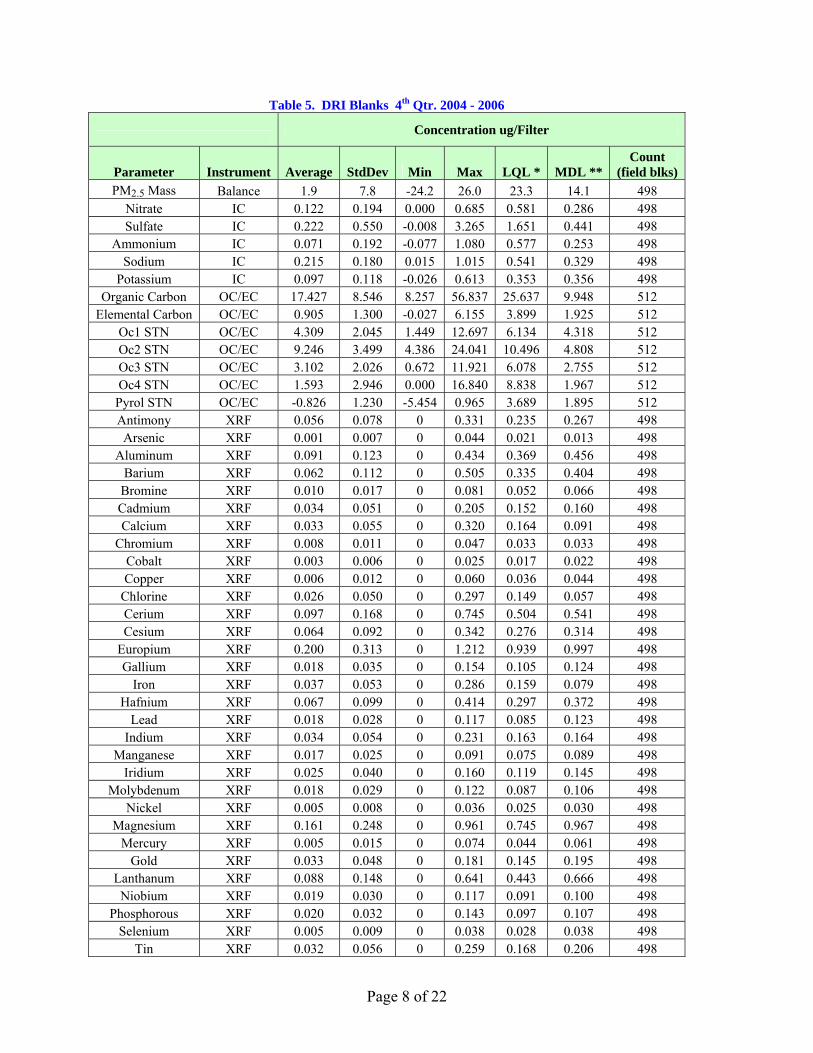
Table 5. DRI Blanks 4th Qtr. 2004 - 2006
Concentration ug/Filter
Parameter Instrument Average StdDev Min Max LQL * MDL ** Count
(field blks) PM2.5 Mass Balance 1.9 7.8 -24.2 26.0 23.3 14.1 498
Nitrate IC 0.122 0.194 0.000 0.685 0.581 0.286 498 Sulfate IC 0.222 0.550 -0.008 3.265 1.651 0.441 498
Ammonium IC 0.071 0.192 -0.077 1.080 0.577 0.253 498 Sodium IC 0.215 0.180 0.015 1.015 0.541 0.329 498
Potassium IC 0.097 0.118 -0.026 0.613 0.353 0.356 498 Organic Carbon OC/EC 17.427 8.546 8.257 56.837 25.637 9.948 512
Elemental Carbon OC/EC 0.905 1.300 -0.027 6.155 3.899 1.925 512 Oc1 STN OC/EC 4.309 2.045 1.449 12.697 6.134 4.318 512 Oc2 STN OC/EC 9.246 3.499 4.386 24.041 10.496 4.808 512 Oc3 STN OC/EC 3.102 2.026 0.672 11.921 6.078 2.755 512 Oc4 STN OC/EC 1.593 2.946 0.000 16.840 8.838 1.967 512
Pyrol STN OC/EC -0.826 1.230 -5.454 0.965 3.689 1.895 512 Antimony XRF 0.056 0.078 0 0.331 0.235 0.267 498 Arsenic XRF 0.001 0.007 0 0.044 0.021 0.013 498
Aluminum XRF 0.091 0.123 0 0.434 0.369 0.456 498 Barium XRF 0.062 0.112 0 0.505 0.335 0.404 498
Bromine XRF 0.010 0.017 0 0.081 0.052 0.066 498 Cadmium XRF 0.034 0.051 0 0.205 0.152 0.160 498 Calcium XRF 0.033 0.055 0 0.320 0.164 0.091 498
Chromium XRF 0.008 0.011 0 0.047 0.033 0.033 498 Cobalt XRF 0.003 0.006 0 0.025 0.017 0.022 498 Copper XRF 0.006 0.012 0 0.060 0.036 0.044 498
Chlorine XRF 0.026 0.050 0 0.297 0.149 0.057 498 Cerium XRF 0.097 0.168 0 0.745 0.504 0.541 498 Cesium XRF 0.064 0.092 0 0.342 0.276 0.314 498
Europium XRF 0.200 0.313 0 1.212 0.939 0.997 498 Gallium XRF 0.018 0.035 0 0.154 0.105 0.124 498
Iron XRF 0.037 0.053 0 0.286 0.159 0.079 498 Hafnium XRF 0.067 0.099 0 0.414 0.297 0.372 498
Lead XRF 0.018 0.028 0 0.117 0.085 0.123 498 Indium XRF 0.034 0.054 0 0.231 0.163 0.164 498
Manganese XRF 0.017 0.025 0 0.091 0.075 0.089 498 Iridium XRF 0.025 0.040 0 0.160 0.119 0.145 498
Molybdenum XRF 0.018 0.029 0 0.122 0.087 0.106 498 Nickel XRF 0.005 0.008 0 0.036 0.025 0.030 498
Magnesium XRF 0.161 0.248 0 0.961 0.745 0.967 498 Mercury XRF 0.005 0.015 0 0.074 0.044 0.061 498
Gold XRF 0.033 0.048 0 0.181 0.145 0.195 498 Lanthanum XRF 0.088 0.148 0 0.641 0.443 0.666 498 Niobium XRF 0.019 0.030 0 0.117 0.091 0.100 498
Phosphorous XRF 0.020 0.032 0 0.143 0.097 0.107 498 Selenium XRF 0.005 0.009 0 0.038 0.028 0.038 498
Tin XRF 0.032 0.056 0 0.259 0.168 0.206 498
Page 8 of 22

Table 5. DRI Blanks 4th Qtr. 2004 - 2006
Concentration ug/Filter Count
Parameter Instrument Average StdDev Min Max LQL * MDL ** (field blks) Titanium XRF 0.006 0.011 0 0.045 0.032 0.050 498 Samarium XRF 0.109 0.201 0 0.884 0.602 0.786 498 Scandium XRF 0.011 0.016 0 0.065 0.049 0.082 498 Vanadium XRF 0.002 0.005 0 0.023 0.015 0.012 498
Silicon XRF 0.060 0.086 0 0.373 0.259 0.275 498 Silver XRF 0.034 0.052 0 0.207 0.156 0.166 498 Zinc XRF 0.008 0.019 0 0.134 0.056 0.034 498
Strontium XRF 0.019 0.028 0 0.129 0.083 0.082 498 Sulfur XRF 0.051 0.164 0 0.974 0.492 0.162 498
Tantalum XRF 0.053 0.077 0 0.296 0.232 0.315 498 Terbium XRF 0.182 0.320 0 1.315 0.959 1.082 498
Rubidium XRF 0.006 0.012 0 0.049 0.035 0.034 498 Potassium XRF 0.024 0.036 0 0.174 0.108 0.115 498 Yttrium XRF 0.009 0.016 0 0.070 0.048 0.046 498 Sodium XRF 0.461 0.679 0 2.963 2.037 2.946 498
Zirconium XRF 0.026 0.039 0 0.153 0.116 0.116 498 Wolfram XRF 0.070 0.116 0 0.500 0.349 0.433 498
* The LQL is three times the standard deviation of mean concentrations of field blanks, assuming a deposit area of 11.78 cm2 and a sample volume of 24 m3. The LQL is calculated quarterly for parameters reported to AQS, but values here are averages for the period 2004 Q4 through 2006 Q4
** The MDL is three times the standard deviation of mean concentrations of laboratory blanks, assuming a deposit area of 11.78 cm2 and a sample volume of 24 m3. The MDL is calculated and reported quarterly, but values here are averages for the period 2004 Q4 through 2006 Q4.
Another critical area involving sample handling occurs at the field site when the field operator loads the cassettes into the sampler magazine. The cassettes must be loaded into the magazine in the proper order and field data sheets must be accurately filled out. Dr. Tropp has provided onsite training and created instructional CDs for site operators that detail these specific procedures. In the rare event that a field blank filter is accidentally used for sampling, Dr. Tropp’s data review is usually able to detect and correct the mistake.
An experimental activity planned for this part of the TSA involved the loading and unloading of filters into cassettes in order to check for possible transfer of contamination. Brenda demonstrated DRI’s procedure for processing filters for shipment to Texas using new filters that were prepared at NAREL for this demonstration. NAREL supplied filters, two pre-weighed Teflon® filters and two thermally cleaned quartz filters, were installed into cassettes randomly selected from DRI’s stock of cleaned cassettes used for the TCEQ program. Brenda installed the filters using procedures routinely executed in the sample handling laboratory. The loaded cassettes were placed into clamshell protective holders which were then placed into plastic bags. The cassettes were then removed and disassembled so that the filters could be recovered and placed back into their protective Petri slides. Extra filters brought from NAREL to serve as travel blanks were not removed from their protective petri slides. All filters were carried back to NAREL for analysis. Results of this experiment are shown in Table 6. The values shown in
Page 9 of 22

Table 6 may be compared to the field blank results presented in Table 5. This demonstration showed no significant contamination transferred to the filters.
Table 6. Results from Cassette Assembly & Filter Retrieval Experiment
Filter ID Filter Description Parameter Instrument Concentration(µg/filter)**
T07-12126 Teflon test filter #1 PM2.5 Mass Balance 0.002 T07-12127 Teflon test filter #2 PM2.5 Mass Balance 0.001 T07-12128 Teflon Control Filter PM2.5 Mass Balance 0.001 T07-12129 Teflon Control Filter PM2.5 Mass Balance 0.000
T07-12126 Teflon test filter #1 Nitrate IC 0.538 T07-12127 Teflon test filter #2 Nitrate IC 0.660 T07-12128 Teflon Control Filter Nitrate IC 1.017 T07-12129 Teflon Control Filter Nitrate IC 0.698
T07-12126 Teflon test filter #1 Sulfate IC not detected T07-12127 Teflon test filter #2 Sulfate IC not detected T07-12128 Teflon Control Filter Sulfate IC not detected T07-12129 Teflon Control Filter Sulfate IC not detected
T07-12126 Teflon test filter #1 Ammonium IC -0.401 T07-12127 Teflon test filter #2 Ammonium IC not detected T07-12128 Teflon Control Filter Ammonium IC -0.419 T07-12129 Teflon Control Filter Ammonium IC not detected
T07-12126 Teflon test filter #1 Potassium IC not detected T07-12127 Teflon test filter #2 Potassium IC 0.378 T07-12128 Teflon Control Filter Potassium IC not detected T07-12129 Teflon Control Filter Potassium IC not detected
T07-12126 Teflon test filter #1 Sodium IC 0.305 T07-12127 Teflon test filter #2 Sodium IC 0.503 T07-12128 Teflon Control Filter Sodium IC 0.411 T07-12129 Teflon Control Filter Sodium IC 0.391
Q07-12130 Quartz test filter #1 Elemental Carbon OC/EC Analyzer 0.00 Q07-12131 Quartz test filter #2 Elemental Carbon OC/EC Analyzer 0.00 Q07-12132 Quartz Control Filter Elemental Carbon OC/EC Analyzer 0.00 Q07-12133 Quartz Control Filter Elemental Carbon OC/EC Analyzer 0.00
Q07-12130 Quartz test filter #1 Organic Carbon OC/EC Analyzer 6.82 Q07-12131 Quartz test filter #2 Organic Carbon OC/EC Analyzer 8.11 Q07-12132 Quartz Control Filter Organic Carbon OC/EC Analyzer 7.06 Q07-12133 Quartz Control Filter Organic Carbon OC/EC Analyzer 5.53 ** Based on filter area of 11.76 cm2
Page 10 of 22
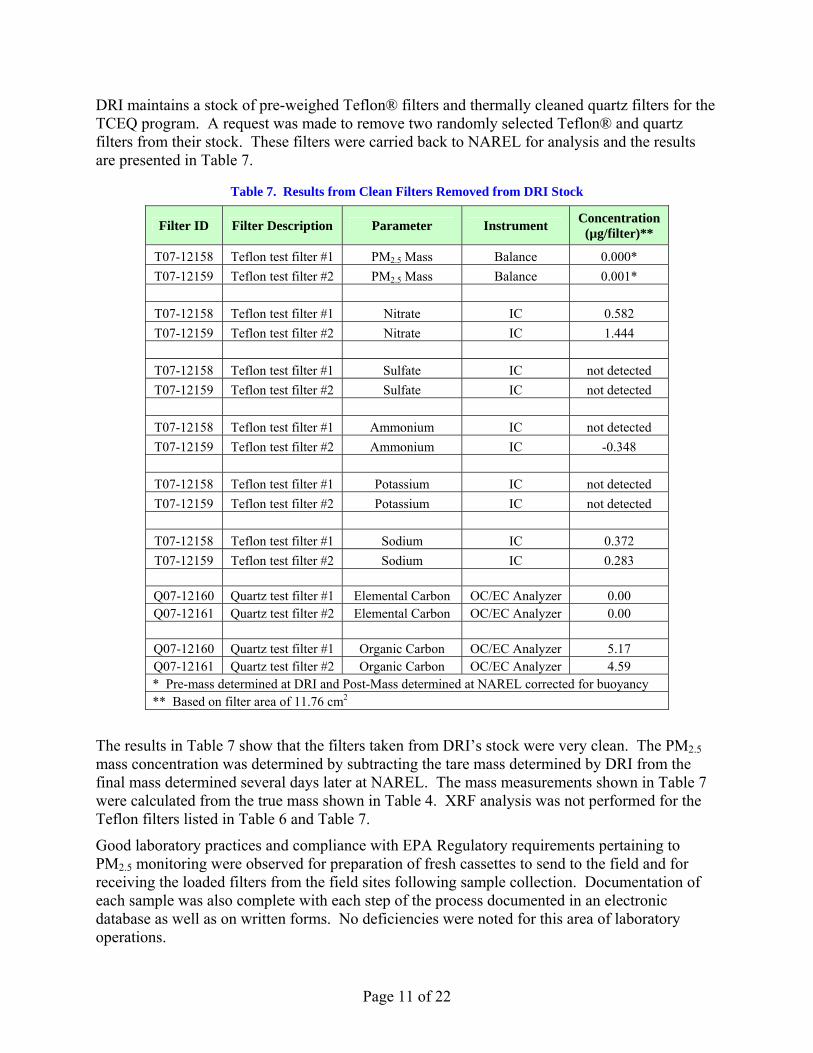
DRI maintains a stock of pre-weighed Teflon® filters and thermally cleaned quartz filters for the TCEQ program. A request was made to remove two randomly selected Teflon® and quartz filters from their stock. These filters were carried back to NAREL for analysis and the results are presented in Table 7.
Table 7. Results from Clean Filters Removed from DRI Stock
Filter ID Filter Description Parameter Instrument Concentration(µg/filter)**
T07-12158 Teflon test filter #1 PM2.5 Mass Balance 0.000* T07-12159 Teflon test filter #2 PM2.5 Mass Balance 0.001*
T07-12158 Teflon test filter #1 Nitrate IC 0.582 T07-12159 Teflon test filter #2 Nitrate IC 1.444
T07-12158 Teflon test filter #1 Sulfate IC not detected T07-12159 Teflon test filter #2 Sulfate IC not detected
T07-12158 Teflon test filter #1 Ammonium IC not detected T07-12159 Teflon test filter #2 Ammonium IC -0.348
T07-12158 Teflon test filter #1 Potassium IC not detected T07-12159 Teflon test filter #2 Potassium IC not detected
T07-12158 Teflon test filter #1 Sodium IC 0.372 T07-12159 Teflon test filter #2 Sodium IC 0.283
Q07-12160 Quartz test filter #1 Elemental Carbon OC/EC Analyzer 0.00 Q07-12161 Quartz test filter #2 Elemental Carbon OC/EC Analyzer 0.00
Q07-12160 Quartz test filter #1 Organic Carbon OC/EC Analyzer 5.17 Q07-12161 Quartz test filter #2 Organic Carbon OC/EC Analyzer 4.59 * Pre-mass determined at DRI and Post-Mass determined at NAREL corrected for buoyancy ** Based on filter area of 11.76 cm2
The results in Table 7 show that the filters taken from DRI’s stock were very clean. The PM2.5 mass concentration was determined by subtracting the tare mass determined by DRI from the final mass determined several days later at NAREL. The mass measurements shown in Table 7 were calculated from the true mass shown in Table 4. XRF analysis was not performed for the Teflon filters listed in Table 6 and Table 7.
Good laboratory practices and compliance with EPA Regulatory requirements pertaining to PM2.5 monitoring were observed for preparation of fresh cassettes to send to the field and for receiving the loaded filters from the field sites following sample collection. Documentation of each sample was also complete with each step of the process documented in an electronic database as well as on written forms. No deficiencies were noted for this area of laboratory operations.
Page 11 of 22

Ion Chromatography (IC) Laboratory
The IC analyses are performed by Edward Hackett, the wet chemistry lab supervisor. Mr. Hackett was recently moved to this position to replace Barbara Hinsvark, the IC chemist who will soon retire. He was interviewed for compliance to good laboratory practices, the QAPP, and the following SOPs.
DRI SOP #2-109.5 - Extraction of Ionic Species from Filter Samples (draft in final review) (Reference 9)
DRI SOP #2-203.5 - Anion Analysis of Filter Extracts and Precipitation Samples by Ion Chromatography (draft in final review) (Reference 10)
DRI SOP #2-208.1 - Cation Analysis of Filter Extracts and Precipitation Samples by Ion Chromatography (draft in final review) (Reference 11)
The laboratory is equipped with an automated Dionex IC instrument. One channel is optimized for the analysis of anions and another channel is optimized for the analysis of cations. The lab also has equipment for cleaning and extracting Teflon®, Nylon®, and quartz filters. Ions are collected on Teflon® filters for the Texas samples. Gravimetric and XRF analyses must be performed and results validated before the Teflon® filters are extracted. Extractions are performed using an ultrasonic bath and a shaker table. The entire filter is placed into a 15 ml polystyrene tube and 100 µl of ethanol is added to the filter as a wetting agent. The extraction solvent for the Teflon® filters is nanopure deionized water. Multilevel standards are used to develop calibration curves and establish retention times. New calibration curves are checked against a standard from a secondary source. Fresh curves are prepared daily or when the routine check samples indicate excessive calibration drift. Mr. Hackett allowed the audit team to view a recent calibration curve and the associated quality control elements on the instrument’s data system. No deficiencies were noted in reviewing the data.
Quality control elements practiced by the DRI IC laboratory include the following.
Precision evaluation using results from duplicate filter analysis.
Blank or matrix spikes are extracted along with field samples to evaluate method accuracy.
Quality control samples (QCS) are analyzed as an independent check of the calibration standards.
Continuing calibration blanks (CCB), continuing calibration verification (CCV) solutions, and lab blanks are also analyzed at a prescribed frequency to verify instrument and method performance.
Sample results from the most recent PE study conducted by NAREL in 2006 were discussed during the interview. The Ion PE samples for the DRI study were created at NAREL using Met One SASS air samplers to collect replicate samples on Teflon® filter media. Although Nylon® is the standard filter material used for collection of ions for the STN network, ions collected for the Texas speciation network are currently being collected on the same Teflon® filter used for gravimetric and XRF analyses. TCEQ is aware of the issues involving biased nitrate capture on Teflon® filter media. For the 2006 PE study, a set of six Teflon® filters was sent to DRI for ion extraction and analysis while a replicate set of filters was extracted and analyzed at NAREL. DRI also made a request for an additional set of replicate Nylon® filter samples that were to be
Page 12 of 22

analyzed by NAREL as well as three other CSN laboratories. The results from the PE study indicated overall good performance from DRI’s IC laboratory. A separate PE report including results from all participating laboratories is available (reference 4).
At the time of the TSA, only the draft forms of the IC SOP’s referenced above were available to the auditors. A follow-up telephone conversation revealed that the document has been completed and is in final review by the DRI QA manager.
X-Ray Fluorescence (XRF) Analysis The elemental composition of particulate matter deposited on a Teflon® filter is determined by energy dispersive X-Ray Fluorescence (XRF). New Teflon® filters that are supplied by EPA for the PM2.5 program have been subjected to numerous XRF analyses to determine background before the filter lots are accepted for distribution. The XRF analysis is performed after the gravimetric analysis has been completed. The XRF laboratory is supervised by Mr. Steve Kohl. The primary instrument used for analysis of STN samples is a PANalytical Epsilon 5 energy dispersive XRF. The PANalytical XRF utilizes a liquid nitrogen cooled germanium detector. The X-Ray tube utilizes a gadolinium (Gd) anode and the beam spot size is 20 mm2. Mr. Kohl indicated that the instrument was also capable of analyzing the 25 mm Teflon® filters used by the IMPROVE network. A minimum of eight instrument conditions resulting in eight separate XRF spectra are acquired on each sample under vacuum. All 48 elements reported to AQS by RTI for the Speciation Trends Network are also reported by DRI for the TCEQ speciation samples. Interviews and inspections were performed to determine compliance with good laboratory practices, the QAPP, and the following SOP.
DRI SOP #2-209.1 - X-Ray Fluorescence (XRF) Analysis of Aerosol Filter Samples (PANalytical Epsilon 5) (DRI is in the process of revising this SOP). (reference 12)
Instrument calibration is performed using two concentration levels of thin film standards from Micromatter. Polymer film standards and NIST standards are used as calibration verification QC checks. A multi-element Micromatter standard is analyzed daily to check for instrument drift. A criterion of ±5% is used to determine if re-calibration is necessary. Energy calibration of the germanium detector is performed weekly using an automated program supplied with the operating software. For each batch of samples analyzed, laboratory blanks are analyzed and the average concentration of each element is used for baseline correction. MDLs are determined quarterly from the analysis of a series of 24 Teflon® laboratory blanks. The MDL for each element is computed as 3 times the standard deviation of the element concentration (see Table 5). The lower quantifiable limits (LQL) are determined quarterly from the analysis of field blanks (Table 5). The XRF measurement uncertainty of each element in a sample is calculated by adding the standard deviation of lab blank measurements to the absolute sample concentration multiplied by the relative standard deviation of multiple measurements of the low standard. Sample replicates are analyzed at a frequency of approximately one per ten samples. The criteria for re-analysis of previous samples are ±10% or three times the analytical uncertainty. No attenuation corrections are made for PM2.5 samples. Control charts are maintained to monitor instrument performance. Results of the most recent PE study were available for discussion. Table 8 presents the XRF instrument conditions that were used for routine samples during the PE study. Currently, eight instrument conditions are used for routine samples.
Page 13 of 22

Table 8. XRF Analysis at the DRI Laboratory Instrument: PanAnalytical Epsilon 5 Software: E5 Version 1.0B
Instrument Conditions for Routine Sample Analysis Parameter #1 #2 #3 #4 #5
X-ray tube parameters: Tube voltage (kV) 40 40 75 100 100 Tube current (mA) 15 15 8 6 6 Tube anode material Gd Gd Gd Gd Gd Direct excitation of sample: Filter material Filter thickness (mm) Secondary excitation of sample: Secondary fluorescor Ti Fe Ge Zr Mo Filter material Filter thickness (mm) Acquisition time (seconds) 200 200 200 200 200 Energy range acquired (keV) 0-20 0-20 0-20 0-20 0-20 Number of [MCA] channels 2048 2048 2048 2048 2048 Sample rotation (yes/no) yes yes yes yes yes Beam spot size, diameter (mm2) 20 20 20 20 20 Atmosphere (vacuum, He, air) vacuum vacuum vacuum vacuum vacuum
Elements Reported Na Mg Al Si
P S Cl K Ca Sc
Ti V Cr
Mn Fe Co Ni Cu Zn
Sm Eu Tb
Ga As Se Br Rb Hf Ta W
Ir Au Hg Tl Pb
Sr Y
Parameter (repeated) #6 #7 #8 X-ray tube parameters: Tube voltage (kV) 100 100 100 Tube current (mA) 6 6 6 Tube anode material Gd Gd Gd Direct excitation of sample: Filter material Filter thickness (mm) Secondary excitation of sample: Secondary fluorescor Ag BaF2 Fe Filter material Filter thickness (mm) Acquisition time (seconds) 200 200 200 Energy range acquired (keV) 0-40 0-80 0-20 Number of [MCA] channels 4096 8192 2048 Sample rotation (yes/no) yes yes yes Beam spot size, area (mm2) 20 20 20 Atmosphere (vacuum, He, air) vacuum vacuum vacuum
Elements Reported Zr Nb Mo Pd Ag Cd In Sn Sb
Cs Ba La Ce
The XRF laboratory documentation was in good order and the records pertaining to the recent PE study along with selected spectra were examined. The results from the PE study indicated
Page 14 of 22

good performance from the XRF laboratory. Details of the PE study are available in a separate report (reference 4).
Good quality control practices are performed in the XRF laboratory. The laboratory also maintains a service contract for the instrument which helps to minimize down-time. No deficiencies were noted for this area of laboratory operations.
Carbon Analysis Laboratory
The carbon analysis laboratory is supervised by Ms. Dana Trimble. Lab analysts Teresa Bohannan and Amy Bishoff were also present to answer questions about the carbon analysis and assist with the inspection of this laboratory to determine compliance with good laboratory practices, the QAPP, and the following SOPs.
DRI SOP #2-201r3, - DRI Model 2001 Thermal/Optical Carbon Analysis (TOR/TOT) of Aerosol Filter Samples – Method STN. (Recently revised and under review). (Reference 13)
DRI SOP #2-216.1, - DRI Model 2001 Thermal/Optical Carbon Analysis (TOR/TOT) of Aerosol Filter Samples – Method IMPROVE_A. (Currently under revision). (Reference 14)
DRI SOP # 2-106.5 - Pre-firing and Acceptance Testing of Quartz-Fiber Filters for Aerosol and Carbonaceous Material Sampling (Reference 15)
DRI has performed carbon analyses using a thermal/optical analysis (TOA) method for the IMPROVE Program since the mid-1980s. Organic carbon (OC) compounds are thermally removed from a sub-sample (punch) of quartz filter sample using heating ramps of increasing temperature and of variable duration while in a pure helium atmosphere. Elemental carbon (EC) is removed from the sample using additional temperature ramps in a 98% helium/2% oxygen atmosphere. The thermally removed carbon compounds are converted to carbon dioxide (CO2) and then to methane (CH4) and measured using a flame ionization detector (FID). As the analysis progresses, each temperature stage results in a sub-fraction (OC1, OC2, OC3, OC4, EC1, EC2, and EC3) of the total carbon (TC) measured.
Some OC compounds may be converted to EC due to incomplete combustion or pyrolysis during the helium stage of analysis. If not accounted for, the pyrolysis products (pyrolC) will bias the OC low and the EC high. To correct for this bias, an optical system consisting of a laser and photo detector continuously monitors the reflectance of the sample punch. Formation of pyrolysis products results in a decrease in reflectance from the reflectance determined at the beginning of the analysis. As the pyrolysis products are removed by oxidation, the reflectance increases. The point in time during the analysis when the reflectance reaches its initial value is called the split point. All carbon evolved before the split point is assigned to OC with the remaining carbon assigned to EC. The portion of carbon that evolves from the beginning of the oxygen stage to the split point is reported as pyrolC. This carbon analysis method is known as the IMPROVE TOR Protocol.
Samples analyzed for the TCEQ contract require the STN Thermal Optical Transmittance (TOT) carbon method of analysis. The STN TOT carbon analysis method is based upon NIOSH method 5040 (reference 16) which includes the determination of OC and EC, the sum of which represents the TC. EPA also requires reporting four fractions of the organic carbon and pyrolysis
Page 15 of 22

carbon: OC1, OC2, OC3, OC4, and PyrolC. The STN TOT method, in many ways similar to the IMPROVE method, thermally evolves OC from an aliquot of the quartz filter sample using heating ramps of increasing temperature (900°C maximum) while in a pure helium atmosphere. EC is removed from the sample using additional increasing temperature ramps (920 °C maximum) in a 98% helium/2% oxygen atmosphere. In order to account for pyrolyzed carbon formed during the helium phase of analysis, a laser signal is monitored to determine when to begin attributing the detector signal to EC.
Although there are similarities between the IMPROVE and STN carbon methods, there are differences that distinguish the methods. The most significant differences are: (1) The IMPROVE and IMPROVE_A protocols use variable length temperature ramps for each carbon fraction. The time spent at each fraction is determined by how long it takes the detector to return to its initial baseline value. This results in distinct resolved peaks for each carbon sub-fraction. The STN protocol requires fixed duration heating ramps for each carbon fraction which can result in switching to the next fraction before the currently evolving peak is fully resolved. (2) The IMPROVE and STN protocols use different temperature set points. (3) The IMPROVE protocols use the laser signal reflected by the sample to determine the OC/EC split point while the STN protocol requires using the laser transmittance through the sample to determine the split point. Carbon analyzers used at DRI monitor both the reflected and transmitted laser information.
Initially, carbon analysis at DRI was performed using first generation model DRI/OGC thermal/optical analyzers. The DRI/OGC analyzers have now been replaced by the DRI Model 2001 analyzer. The new model has been redesigned to perform both the IMPROVE_TOR/TOT method as well as the STN TOT method. Another instrument improvement involves placement of the sample oven temperature sensor very close to the sample for more accurate oven control. DRI has developed a procedure to calibrate the oven temperature set points using quick-drying temperature-indicating liquids. The calibration procedure is included in their carbon SOPs (reference 13 and 14).
In order for the Model 2001 instrument to maintain analytical consistency with the DRI/OGC instrument, a modification of the IMPROVE thermal profile was proposed by DRI. The new protocol, named IMPROVE_A, increases the set point of each temperature ramp by 20 - 40 °C. This allows the new instrument to operate at thermal conditions that are closer to the actual temperature conditions of the original DRI/OGC instrument. The IMPROVE_A protocol has been approved for the Model 2001 instrument by the IMPROVE Steering Committee for samples collected from January 1, 2005 on. At the time of the audit, DRI had two Model 2001 instruments dedicated to the STN method for analysis of TCEQ samples and five Model 2001 instruments dedicated to analysis of IMPROVE samples.
Quality control measures in DRI’s carbon laboratory are virtually identical for STN and IMPROVE samples. New quartz fiber filters are pre-fired to 900 °C to remove possible carbon artifacts that could interfere with analysis. Acceptance testing of the pre-fired batch includes inspection of each filter for defects and carbon analysis of two filters from each batch of 100. Acceptance criteria for pre-fired quartz filters are OC < 1.5 µg/cm2, EC < 0.5 µg/cm2, and TC < 2.0 µg/cm2 for the STN thermal protocol. Instrument calibration is performed using multiple levels of four different standards: two NIST traceable calibration gases and two spiking solutions. Multiple level calibrations are performed twice a year or when a new calibration gas is installed. An automatic calibration check using NIST traceable 5% methane in helium is
Page 16 of 22

performed daily. An automatic injection of the methane calibration gas at the end of each analysis serves as an internal standard to normalize FID response.
Additional quality control elements practiced by the DRI carbon laboratory include the following:
System blanks are analyzed daily to check for contamination of the analyzers.
Method detection limits (MDLs) are determined from the analysis of lab blanks. Frequency of MDL determinations depend on project requirements. MDLs are determined quarterly for Texas STN analyses (see table 5) and annually for IMPROVE_A analyses. MDLs are also determined after major instrument maintenance.
The lower quantifiable Limits (LQLs) are determined from the analysis of field blanks. Frequency of LQL determinations depend on project requirements. LQLs are determined quarterly For Texas STN analyses (see table 5) and annually for IMPROVE_A analyses.
Precision is evaluated using results from duplicate analyses at a rate of one per batch of ten (10% total). The duplicates are performed using an analyzer chosen at random.
Peak area of the calibration gas FID response is plotted on control charts and used to monitor instrument performance.
Temperature calibration of the oven is performed every six months or when the temperature sensor is replaced.
A gas chromatograph/mass spectrophotometer (GC/MS) is used to analyze for oxygen levels inside the analyzer during the helium stage of analysis. This is performed semi-annually to ensure oxygen levels are below 100 parts per billion.
Criteria for all QC measures are listed in the DRI Carbon SOPs (reference 13 and 14). DRI does not analyze a sucrose spike solution as a daily calibration check.
During the interviews in the carbon laboratory, the auditors were able to observe DRI 2001 instruments in operation. The auditors were allowed to examine thermograms from the 2006 PE study at a work station and were also shown details of how the IMPROVE_A and STN method parameters are programmed into DRI 2001 analyzers. Results from the 2006 PE study showed good agreement between DRI and NAREL for OC/EC/TC for both STN and IMPROVE_A methods.
Ms. Bohannan explained in detail the procedure used at DRI to calibrate the carbon analyzer’s oven temperatures using a set of temperature indicating liquids. When applied to a surface, each indicator liquid dries to an opaque film. As heat is applied to the surface, the film liquefies and changes appearance when the rated temperature is reached. The calibration technique involves applying an indicator liquid to a small quartz disk which is then covered with a clean quartz filter punch. This assembly is inserted into the oven in the same manner as a routine sample. A thermal program is initiated that slowly ramps the oven temperature over a small range that includes the indicator’s rated temperature. A sharp change in the laser signal indicates the liquid’s rated temperature has been reached. The instrument’s indicated oven temperature can then be compared to the indicator’s certified temperature. This temperature calibration technique allows the TOA method’s thermal profile to be customized for each instrument. As a result, each instrument has the same temperature at the sample, regardless of variations in temperature sensors and their exact location relative to the sample.
Page 17 of 22

Good laboratory practices, good QC practices, and good record keeping are performed in the Carbon laboratory. No deficiencies were observed for the Carbon laboratory during the TSA.
Data Management
The following documents are available that describe DRI’s data management and validation procedures for PM2.5 Laboratory Support:
Quality Assurance Project Plan, PM2.5 Filter Analysis Program for Texas Commission on Environmental Quality (DRI is in the process of revising this QAPP). (reference 2)
DRI SOP #3-004.2 - PM2.5 FRM Data Processing and Data Validation (reference 17)
DRI SOP # 3-003.4 - Dry Deposition Field, Mass, and Chemical Data Processing and Data Validation. (reference 18)
During the inspections of the various areas of the laboratory, the audit team was able to observe some of the methods used by analysts to enter sample information and analytical data into the laboratory information management system (LIMS). Sample information may be acquired as hard copied data sheets or forms, data entered through bar code readers, data entered by keyboard into a computer file, or data retrieved directly from an instrument and transferred to an electronic database. The LIMS uses Microsoft Access for data entry and reporting and to automate many data management tasks such as verifying manual entries from data sheets for consistency with the computer files. There are standard procedures in place for making corrections to data at all stages of data processing and the database audit trail documents these edits.
When DRI began their PM2.5 CSN support for TCEQ in 2004, data validation and data management procedures were already in place for their laboratory support of the TCEQ PM2.5 FRM program. These procedures were revised to include the additional elements of the speciation program. Field sampling and laboratory validation flags, status codes, data qualifiers and data validation and QC checks have been revised to be compatible with EPA’s AQS qualifiers.
Analytical results undergo a minimum of a level two validation after all results are assembled into the master database. Consistency checks have been developed for CSN data that will identify values that fall outside a range of values determined to be normal. For example, the sum of all species determined for a sample should not be larger than the gravimetric mass of the sample. Samples that fail the consistency checks are reanalyzed or flagged if reanalysis is not possible.
Dr. Tropp demonstrated some of the procedures used to examine data using customized Excel workbooks. For example, field blank and lab blank data are loaded into Excel worksheets to calculate minimum detection limits (MDLs), limits of quantitation (LQLs) and running averages for the CSN analytical parameters. Check limits developed for CSN data help identify problems. Data is also examined to catch abnormalities by comparing to historical data.
DRI submits to TCEQ a preliminary chemical speciation data report as well as a diagnostic report which is then distributed to all CSN field operators and managers for comment. The preliminary report is submitted after every two filter shipments or approximately monthly. A
Page 18 of 22

more detailed preliminary report is submitted to TCEQ quarterly after level 1 and level 2 validations.
DRI submits the TCEQ CSN data and CSN blank data as two separate text files to AQS. The parameters include mass, ions, carbon, and XRF elements along with associated MDLs and uncertainties. If there is a need to modify the submitted data, DRI has written procedures for approving and documenting the changes. Copies of the text files submitted to AQS as well as files used to validate data and additional specialized reports are also made available to TCEQ.
IMPROVE carbon results are reported to Crocker Nuclear Laboratory (CNL). Results are not blank corrected by DRI. Data reported to CNL include TOR as well as TOT results.
DRI Support for Field Activities In addition to the laboratory and logistical support described in this report, Dr. Tropp, provides on site training and instructional information to TCEQ field personnel. The following documents prepared by Dr. Tropp and Brenda Cristani for Texas field technicians are available:
“Instructions for Filter Pack Identification, Completing Field Data Sheets, Shipping and Receiving Filters, and Obtaining Replacement Filters.” [2007 Field Memo.doc] (Reference 19)
“Instructions for Entering Information into the R&P Partisol Plus PM2.5 Sequential Sampler” [2007 Sampler Entry Document] (reference 20).
Sampler File Check Routine [2007 Texas Check Routine rev. 2] (reference 21).
The sampler file check is an automated program that checks to make sure that the record elements are formatted correctly. These documents and check routines help ensure consistent record keeping by field personnel.
Conclusions This TSA was the second inspection of DRI’s Environmental Analysis Facility conducted as part of the EPA required quality assurance oversight of the PM2.5 Chemical Speciation Network and the IMPROVE Network. The DRI laboratory facility provides laboratory support for the TCEQ PM2.5 Chemical Speciation Network and provides all carbon analyses for the IMPROVE Network. Observations made by the audit team on this inspection again found the DRI Laboratory to be a modern facility with state of the art instrumentation, good documentation, and well qualified staff. DRI meets or exceeds compliance with good laboratory practices, the TCEQ QAPP and SOPs.
The auditors as well as DRI staff found one area of concern during the audit regarding the gravimetric laboratory. The gravimetric performance demonstration produced mixed results for filters and metallic samples, indicating a possible balance stability problem. Furthermore, in NAREL’s 2006 PE study, a metallic sample weighed at DRI fell slightly outside of the advisory limits determined for the study (see reference 4). Follow-up telephone conversations and e-mail correspondence from Dr. Tropp have revealed the following actions taken by Dr. Tropp and Brenda Cristani to address the gravimetric concern.
1. The annual maintenance and service of the micro-balance was performed by an independent contractor.
Page 19 of 22

2. A new set of calibration weights was purchased. Balance procedures were modified to include three calibration check weights (50 mg, 100 mg, and 200 mg) at the start of each weighing session.
3. A new 200 mg weight will replace one of the 200 mg check standards discovered to have been damaged, apparently from using metal forceps. The 200 mg weight is used as a span check for every 10 samples.
4. Plastic-tipped forceps to be used only with the check weights are now clearly marked and kept with the check weights. Technicians have been further instructed to use only the marked forceps for the check weights.
5. The gravimetric SOP has been modified to reflect the new procedures.
6. DRI has asked NAREL to participate in follow-up mass comparisons. NAREL has agreed to participate in follow-up mass comparisons with DRI.
Page 20 of 22

References
1. EPA/NAREL. September 14, 2005. Technical Memorandum: DRI Laboratory Audit. U.S. Environmental Protection Agency. [currently available on the web] http://www.epa.gov/ttn/amtic/files/ambient/pm25/spec/driaudit.pdf
2. DRI August 2006, Quality Assurance Project Plan, PM2.5 Filter Laboratory Analysis Program, prepared for the Texas Commission of Environmental Quality. (DRI is in the process of revising this QAPP).
3. DRI August 2006, Quality Management Plan for Laboratory Support for PM2.5 Ambient Air Monitoring Programs
4. EPA/NAREL. March 5, 2007. Technical Memorandum: Experimental Inter-comparison of Speciation Laboratories. U.S. Environmental Protection Agency. [currently available on the web] http://www.epa.gov/ttn/amtic/files/ambient/pm25/spec/Multilab-Speciation-PE-2006.pdf
5. DRI March 2002. Standard Operating Procedure Gravimetric Analysis, DRI SOP #2-114.2, Division of Atmospheric Sciences, Desert Research Institute, Reno NV. (DRI is in the process of revising this SOP).
6. EPA. 1998. Monitoring PM2.5 in Ambient Air Using Designated Reference or Class I Equivalent Methods. Quality Assurance Guidance Document 2.12. U.S. Environmental Protection Agency. Office of Research and Development, Research Triangle Park, NC. 1998. [currently available on the web] http://www.epa.gov/ttn/amtic/files/ambient/pm25/qa/m212covd.pdf
7. DRI March 2002. Standard Operating Procedure PM2.5 FRM Sample Shipping, Receiving, and Chain-of-Custody, DRI SOP #2-113.2, Division of Atmospheric Sciences, Desert Research Institute, Reno NV.
8. DRI March 2002. Standard Operating Procedure PM2.5 FRM Filter Pack Assembly, Disassembly, and Cleaning , DRI SOP #2-112.2, Division of Atmospheric Sciences, Desert Research Institute, Reno NV.
9. DRI March 2002. Standard Operating Procedure Extraction of Ionic Species from Filter Samples, DRI SOP #2-109.5, Division of Atmospheric Sciences, Desert Research Institute, Reno NV. (New version of this SOP is in final review).
10. DRI March 2002. Standard Operating Procedure, Anion Analysis of Filter Extracts and Precipitation Samples by Ion Chromatography DRI SOP #2-203.5, Division of Atmospheric Sciences, Desert Research Institute, Reno NV. (New version of this SOP is in final review).
11. DRI March 2002. Standard Operating Procedure Cation Analysis of Filter Extracts and Precipitation Samples by Ion Chromatography DRI SOP #2-208.1, Division of Atmospheric Sciences, Desert Research Institute, Reno NV. (New version of this SOP is in final review).
12. DRI March 2002. Standard Operating Procedure X-Ray Fluorescence (XRF) Analysis of Aerosol Filter Samples (PANalytical Epsilon 5) DRI SOP #2-209.1, Division of
Page 21 of 22
Atmospheric Sciences, Desert Research Institute, Reno NV. (DRI is in the process of revising this SOP)
13. DRI November 2005. Standard Operating Procedure DRI Model 2001 Thermal/Optical Carbon Analysis (TOR/TOT) of Aerosol Filter Samples - Method STN - DRI SOP #2-201r3, Division of Atmospheric Sciences, Desert Research Institute, Reno NV.
14. DRI November 2005. Standard Operating Procedure DRI Model 2001 Thermal/Optical Carbon Analysis (TOR/TOT) of Aerosol Filter Samples - Method IMPROVE_A - DRI SOP #2-216.1, Division of Atmospheric Sciences, Desert Research Institute, Reno NV. (DRI is in the process of revising this SOP).
15. DRI November 2005. Standard Operating Procedure Pre-firing and Acceptance Testing of Quartz-Fiber Filters for Aerosol and Carbonaceous Material Sampling DRI SOP #2-106.5, Division of Atmospheric Sciences, Desert Research Institute, Reno NV.
16. NIOSH. 1999. Method 5040, Issue 3, Elemental Carbon (Diesel Particulate), NIOSH Manual of Analytical Methods, Fourth Edition. National Institute for Occupational Safety & Health, Cincinnati, OH.
17. DRI March 2002. Standard Operating Procedure PM2.5 FRM Data Processing and Data Validation DRI SOP #3-004.2, Division of Atmospheric Sciences, Desert Research Institute, Reno NV.
18. DRI March 2002. Standard Operating Procedure Dry Deposition Field, Mass, and Chemical Data Processing and Data Validation. DRI SOP # 3-003.4, Division of Atmospheric Sciences, Desert Research Institute, Reno NV.
19. DRI. 2004 Field Memo: “Instructions for Filter Pack Identification, Completing Field Data Sheets, Shipping and Receiving Filters, and Obtaining Replacement Filters.” Division of Atmospheric Sciences, Desert Research Institute, Reno NV.
20. DRI Instructions for Entering Information into the R&P Partisol Plus PM2.5 Sequential Sampler, Division of Atmospheric Sciences, Desert Research Institute, Reno NV.
21. DRI March 2007. Sampler File Check Routine, Division of Atmospheric Sciences, Desert Research Institute, Reno NV.
Page 22 of 22