TECHNICAL - fao.org · 4.1 Multi-criteria analysis ... Box 4.2 Social discount rate ... Figure 3.3...
108
TECHNICAL REPORT Building the Mediterranean future together Methods and tools for socio-economic assessment of goods and services provided by Mediterranean forest ecosystems April 2014 Optimising the production of goods and services by Mediterranean forests in a context of global changes
Transcript of TECHNICAL - fao.org · 4.1 Multi-criteria analysis ... Box 4.2 Social discount rate ... Figure 3.3...

TECHNICALREPORT
Building the Mediterranean future together
Methods and tools for socio-economic assessment of goods and services provided
by Mediterranean forest ecosystems
April 2014
Optimising the production of goods
and services by Mediterranean forests
in a context of global changes

FFEM PROJECT
OPTIMISING THE PRODUCTION OF GOODS AND SERVICES BY MEDITERRANEAN FORESTS IN A CONTEXT OF GLOBAL CHANGES
Component 2: assess the socio-economic value of goods and services provided by Mediterranean forest ecosystems, to support
effective decision-making and strengthen actions to support the sustainable management of these ecosystems
Methods and tools for socio-economic assessment of goods and services provided by
Mediterranean forest ecosystems
Prepared by EFIMED and CTFC for PLAN BLEU

1
Authors Experts: European forest institute Robert Mavsar: [email protected] Fernando Herreros Experts: Forest Sciences Centre of Catalonia (CTFC) Elsa Varela: [email protected] Fabrice Gouriveau: [email protected] PLAN BLEU coordinator: Marion DUCLERCQ: forest ecosystems, biodiversity. [email protected]

2
Methods and tools for socio-economic assessment of goods and services provided by Mediterranean forest ecosystems
Table of contents
Table of contents ............................................................................................................... 2
Table of illustrations .......................................................................................................... 4 LIST OF BOX ................................................................................................... Erreur ! Signet non défini. LIST OF FIGURES ............................................................................................ Erreur ! Signet non défini. LIST OF TABLES .............................................................................................. Erreur ! Signet non défini.
List of abbreviations .......................................................................................................... 6
1 Introduction ................................................................................................................ 7
2 Methodology used in this report ............................................................................. 8 2.1 Literature review ............................................................................................................................. 8 2.2 Survey.............................................................................................................................................. 8
3 Forest ecosystems goods and services in the Mediterranean region ............... 9 3.1 Features and classification of goods and services provided by forest ecosystems .................... 9
3.1.1 Goods and services provided by forest ecosystems ................................................................................ 9 3.1.2 Classification of forest ecosystem goods and services ............................................................................ 9
3.2 Forest ecosystems in the Mediterranean region ........................................................................ 11 3.2.1 Forest cover in the Mediterranean ........................................................................................................ 11 3.2.2 The role of Mediterranean forests in the economy ............................................................................... 11 3.2.3 Ecosystem goods and services provided by Mediterranean forests ..................................................... 12 3.2.4 Beneficiaries of forest goods and services and differences across the Mediterranean basin ............... 17 3.2.5 Drivers of change in Mediterranean forests and their repercussions on the goods and services these ecosystems provide ............................................................................................................................................... 18
4 Evaluation methods ..................................................................................................24 4.1 Multi-criteria analysis .................................................................................................................... 25
4.1.1 Step of a multi-criteria analysis .............................................................................................................. 25 4.1.2 Strengths and weaknesses of multi-criteria analysis.............................................................................. 28 4.1.3 Example of multi-criteria analysis application ........................................................................................ 28
4.2 Cost benefit analysis (CBA) ........................................................................................................... 29 4.2.1 Step of a cost-benefit analysis ............................................................................................................... 30 4.2.2 Strengths and weaknesses of the cost benefit analysis ........................................................................ 35 4.2.3 Example of CBA application .................................................................................................................... 35
4.3 CBA or MCA? ................................................................................................................................. 38
5 Valuation methods ....................................................................................................39 5.1 Introduction to the concept of total economic value ................................................................ 39 5.2 Economic valuation: purpose, implications and limitations ....................................................... 40
5.2.1 A definition of economic valuation ........................................................................................................ 40 5.2.2 Objectives of the economic valuation .................................................................................................... 41 5.2.3 Basic assumptions in environmental valuation ...................................................................................... 41 5.2.4 Requirements and limitations of environmental valuation ................................................................... 42
5.3 Economic valuation methods ...................................................................................................... 43 5.3.1 Revealed preference methods ............................................................................................................... 43 5.3.2 Stated preference methods ................................................................................................................... 57 5.3.3 Benefit transfer method ........................................................................................................................ 65
5.4 Which method to use ?................................................................................................................ 71
6 Recommendations on pilot sites ............................................................................74 6.1 Introduction .................................................................................................................................. 74 6.2 Pilot site: Chréa National Park, Algeria ......................................................................................... 74
6.2.1 Most important goods and services....................................................................................................... 74 6.2.2 Expected changes in the provision of goods and services .................................................................... 75 6.2.3 Recommendation for the valuation of changes in the provision of goods and services ..................... 75
6.3 Pilot site: Jabal Moussa Biosphere Reserve, Lebanon ................................................................. 75

3
6.3.1 Most important goods and services....................................................................................................... 75 6.3.2 Expected changes in the provision of goods and services .................................................................... 76 6.3.3 Recommendation for the valuation of changes in the provision of goods and services ..................... 76
6.4 Pilot site: Maamora forest, Morocco ........................................................................................... 77 6.4.1 Most important goods and services....................................................................................................... 77 6.4.2 Expected changes in the provision of goods and services .................................................................... 77 6.4.3 Recommendation for the valuation of changes in the provision of goods and services ..................... 77
6.5 Pilot site: Düzlerçami forest, Turkey ............................................................................................ 78 6.5.1 Most important goods and services....................................................................................................... 78 6.5.2 Expected changes in the provision of goods and services .................................................................... 78 6.5.3 Recommendation for the valuation of changes in the provision of goods and services ..................... 79
Glossary ..............................................................................................................................82
References .........................................................................................................................86
References of applications of economic valuation methods ....................................90
Annexes ..............................................................................................................................92 Annex 1: Questionnaires for collecting information on previous valuation studies conducted on
the pilot site and surroundings previous valuation studies ....................................................... 92 Annex 2: Questionnaire concerning the importance of forest goods and services on pilot sites ... 94 Annex 3: Forest area in Mediterranean countries (FAO 2010) .......................................................... 105

4
Methods and tools for socio-economic assessment of goods and services provided by Mediterranean forest ecosystems
Table of illustrations
LIST OF BOX Box 3.1 Forest and carbon ........................................................................................................................................................................................... 19 Box 4.1 Example of calculation of a total score for a financing mechanism ...................................................................................... 27 Box 4.2 Social discount rate......................................................................................................................................................................................... 32 Box 6.1Social cost of carbon (SCC) ........................................................................................................................................................................ 80 LIST OF FIGURES Figure 3.1 The five main classes of forest ecosystem services (adapted from MEA, 2005)...................................................... 10 Figure 3.2 Relationships between ecosystems and human well-being along the "service cascade" (adapted from
Haines-Young and Potschin, 2010) .......................................................................................................................................................... 11 Figure 3.3 Different types of NWFP harvested in the Mediterranean countries in 2010, with their weight and
proportion of the overall extraction (FAO 2010) ........................................................................................................................... 12 Figure 3.4 Area of cork oak forest by country, in 2008 (Adapted from APCOR, 2012) .......................................................... 13 Figure 3.5 Percentage of forest area primarily designated for soil and water protection in Mediterranean
countries in 2010 (adapted from FAO, 2010) ................................................................................................................................... 15 Figure 3.6 Forest area dedicated to the conservation of biodiversity in the Mediterranean Region, by country, in
2010. Note: Countries with less than 100 000 ha are not shown (FAO, 2010) ............................................................ 16 Figure 3.7 Interactions between drivers of change, ecosystem services and human well-being (adapted from
MEA, 2005). Note: blue arrows indicate possible interactions. ................................................................................................ 18 Figure 3.8 Population growth in Mediterranean countries, 1950–2100 (Source: United Nations - Department of
Economic and Social Affairs - Population Division, 2011). .......................................................................................................... 21 Figure 3.9 Population trends in Mediterranean countries, 1950–2050 (Source: United Nations - Department of
Economic and Social Affairs - Population Division, 2011). .......................................................................................................... 22 Figure 4.1 Ranking of alternatives .............................................................................................................................................................................. 29 Figure 4.2 Different perspectives on the cost-benefit analysis .................................................................................................................. 30 Figure 4.3 The present value of 10,000 € received at different years with different discount rates r................................. 33 Figure 5.1 Marginal utility curve for income ........................................................................................................................................................ 41 Figure 5.2 Challenges faced when moving from use to non-use values in environmental valuation ................................... 42 Figure 5.3 Graphic representation of a demand function, value, market price and consumer surplus ............................... 44 Figure 5.4 Demand curve and consumer surplus before and after the change in the good or service provision ........ 44 Figure 5.5 Supply curve and producer surplus before and after the change in the good or service provision .............. 45 Figure 5.6 The effect of distance to amenities on housing prices (Tyrväinen 1997) .................................................................... 52 Figure 5.7 Example of valuation question in a CE questionnaire ............................................................................................................. 59 Figure 6.1 Theo ptimal level of pollution .............................................................................................................................................................. 80 LIST OF TABLES Table 3.1 Most significant wood and non-wood forest products in the partner countries of the project, with
their estimated quantity and value (adapted from Merlo and Croitoru, 2005) ............................................................... 14 Table 4.1 Alternative-criteria matrix used to compare the different reforestation methods .................................................. 28 Table 4.2 International real discount rates for cost-benefit analysis ....................................................................................................... 32 Table 4.3 The declining long term discount rate .............................................................................................................................................. 33 Table 4.4 Summary of afforestation scenarios ................................................................................................................................................... 36 Table 4.5 Marginal values of afforestation benefits .......................................................................................................................................... 36 Table 4.6 Cost benefit analysis for Alternative 3 .............................................................................................................................................. 36 Table 4.7 Cost Benefit Indicators for afforestation alternatives ................................................................................................................ 38 Table 5.1 TEV and several examples for forest ecosystems ...................................................................................................................... 40 Table 5.2 Overview of valuation methods presented in this report ..................................................................................................... 43

5
Table 5.3 The estimated economic value of the fodder production provided by the Tazekka National Park .............. 48 Table 5.4 Most common functional forms used in hedonic pricing ....................................................................................................... 50 Table 5.5 The main housing attributes and their expected effects on housing price ................................................................... 51 Table 5.6 Variables used in the travel cost model ........................................................................................................................................... 56 Table 5.7 Econometric estimation of the Poisson model ............................................................................................................................ 56 Table 5.8 Example of the outcomes of a MNL model for the previous choice set example ................................................. 63 Table 5.9 Outcomes of the latent class model ................................................................................................................................................. 65 Table 5.10 Results of the WTP for each of the attributes .......................................................................................................................... 65 Table 5.11 Four categories of similarity between the study site and policy site, and corresponding approximate
transfer errors when performing unit value transfer ....................................................................................................................... 70 Table 5.12 Valuation methods of forest goods and services ..................................................................................................................... 72 Table 5.13 Overview of valuation methods used to valued forest goods and services.............................................................. 73 Table 6.1 Overview of the recommended valuation methods for pilot site Chréa National Park, Algeria ..................... 75 Table 6.2 Overview of the recommended valuation methods for pilot site Jabal Moussa Biosphere Reserve,
Lebanon .................................................................................................................................................................................................................. 76 Table 6.3 Overview of the recommended valuation methods for pilot site: Maamora forest, Morocco ......................... 77 Table 6.4 Overview of the recommended valuation methods for pilot site Düzlerçami forest, Turkey........................... 79

6
Methods and tools for socio-economic assessment of goods and services provided by Mediterranean forest ecosystems
List of abbreviations
BT Benefit transfer CBA Cost benefit analysis CE Choice experiment CEA Cost effectiveness analysis CM Choice modelling CV Contingent valuation method DC Discrete choice FG Focus group GDP Gross domestic product HP Hedonic pricing method LCA Life cycle analysis MCA Multi criteria analysis MEA Millennium ecosystem assessment MNL Multi nominal logit model NWFP Non-wood forest products RP Revealed preference methods SCC Social cost of carbon SFM Sustainable forest management SP Stated preference methods STPR Social time preference rate TC Travel cost method WFP Wood forest products WTA Willingness to accept WTP Willingness to pay

7
1 Introduction
Although forest ecosystems represent only about 9% of the Mediterranean region’s land area (85 million ha) they importantly contribute to poverty alleviation, socio-economic development, food security and the preservation of a healthy environment. However, they suffer from increasing human pressures through urbanization, land use changes, firewood collection and grazing. Moreover, the impacts of climate change lead to an increased risk of forest fires and pests, but also growing problems of soil erosion and desertification.
Mediterranean countries developed policies that should help to overcome these challenges and secure the sustainable provision of goods and services. However, the implementation of these policies through adequate forest management strategies and measures are often hampered, due to a lack of specific knowledge. In this context, the main goal of the project “Optimized production of goods and services by Mediterranean forest ecosystems in the context of global changes” is to incentive an improved management and/or restoration of Mediterranean forest in a perspective of sustainable provision of environmental goods and services.
To this end, several issues are addressed corresponding to specific objectives:
• Component 1: integrate the impact of climate change into forestry management policies and, to achieve this, produce data and develop tools regarding both the vulnerability of forests and their ability to adapt;
• Component 2: assess the socio-economic value of goods and services provided by Mediterranean forest ecosystems, to support effective decision-making and strengthen actions to support the sustainable management of these ecosystems;
• Component 3: improve modes of governance for forest ecosystems at territorial scale to promote local-level strategies for reducing anthropic pressures on these ecosystems while ensuring users that the goods and services on which they depend can be provided in the long term;
• Component 4: optimise and value the role of Mediterranean forests in climate-change mitigation (carbon sinks), via the production of methodological tools to assign monetary values to ecosystem protection and rehabilitation efforts;
• Component 5: promote coordination and sharing of experience between stakeholders in the sub-region via coordination and communication activities within the Collaborative Partnership on Mediterranean Forests (CPMF), with the aim of encouraging dialogue on common strategies for climate-change adaptation and mitigation in the Mediterranean forestry sector.
Component 2 of this project aims at the estimation of social and economic value of goods and services provided by Mediterranean forest ecosystems, with the aim to support decision making processes and to reinforce supporting actions to the sustainable management of ecosystems. To achieve this objective Component 2 of the project breaks down into four successive activities:
• Activity 1: Overview of methods, tools for socio-economic evaluation of goods and services provided by ecosystems across the Mediterranean region and develop methodologies to implement on the selected pilot sites;
• Activity 2: Estimation of the economic and social value of goods and services on a number of selected pilot sites; • Activity 3: Workshops to share lessons between countries, institutions and actors of the region and capitalisation
trough a synthesis report of outcomes at regional level.
This report summarises the outcome of the first activity. It is divided into six chapters. Chapter 2 describes the methodological approach of the study, and chapters 3 to 6 present the main results of the study.
Chapter 3 is dedicated to the identification, characterization and classification of forest goods and services. It also identifies and briefly describes the role of ecosystem goods and services in the Mediterranean region and the main drivers of changes. Chapter 4 is dedicated to description of the characteristics and application of two decision support methods (Cost Benefit Analysis and Multi Criteria Analysis), which can be applied for the evaluation of forest management alternatives. Chapter 5 provides the explanation of the basics of economic valuation and its application in relation to forest goods and services. It also reviews the characteristics and application procedures for the most common valuation methods and provides examples of their application in the Mediterranean region.
Finally, Chapter 6 provides recommendations regarding the methodological approaches for valuation of forest goods and services to be used on the selected pilot sites.

8
Methods and tools for socio-economic assessment of goods and services provided by Mediterranean forest ecosystems
2 Methodology used in this report
In order to achieve the study’s general objective – to acquire summarised information on the economic assessment of forest goods and services in the Mediterranean Region – a literature review and expert surveys have been conducted.
2.1 LITERATURE REVIEW A literature review and web search were undertaken for all studied aspects of forest goods and services – their classification, characterisation, importance, trends and development drivers, and evaluation and valuation, with a specific focus on the Mediterranean region and forests.
Concerning the classification and characterisation of non-market forest goods and services, various studies on terminology, classification and taxonomy of forest goods and services, as well as on the user groups, were reviewed (e.g., MEA, 2005; De Groot, 2002).
The main sources regarding the importance of forest goods and services in the Mediterranean region was the report on the State of Mediterranean Forest (FAO, 2013), but also other sources were considered to provide a better picture of the situation (e.g., Merlo and Croitoru, 2005; Croitoru and Liagre, 2013).
With regards to the evaluation methods and economic valuation of forest goods and services, the literature review focuses on the methodological aspect of the economic valuation and on a number of valuation studies for the most important non-market forest goods and services in Mediterranean. This literature was complemented with reports and publications (e.g., Daly et al., 2012; Pak et al., 2010; Jorio, 2011) submitted in response to questionnaires (see Section 2.2) by the project partner countries.
2.2 SURVEY Two questionnaires were carried out in the countries involved in component 2 of this project, namely Algeria, Lebanon, Morocco and Turkey. The purpose was to obtain information about previous valuation studies conducted on the pilot site and surroundings and about the importance of forest goods and services on pilot sites. This information was used to elaborate recommendations on methodologies that could be applied to value forest goods and services on the selected pilot sites.
The first questionnaire (see Annex 1) was launched at the beginning of March 2013. The corresponding thematic experts in participating countries were asked to provide information about exiting valuation studies on forest goods and services, which were conducted on the selected pilot site or in surroundings. The respondents were also asked to provide the original document or a short description of the main characteristics of the valuation studies (e.g., goods and services valued, method used, data and data collection procedures, valuation scenario, short summary of the main results).
The second questionnaire (Annex 2) was submitted by the end of March and was composed of three parts: A. Importance of forest goods and services on the pilot site. B. Relevant change drivers on the pilot site and their impacts on the provision of forest goods and services. C. Data availability.
The objective of the first part (Part A) of the questionnaire was to gather information on the relative importance of different types of forest goods and services on the selected pilot sites. The area on which they are provided, who are the main beneficiaries and on the demand trends.
The aim of the second part (Part B) of the questionnaire was to provide information on the most relevant drivers of change that can be expected on the country’s pilot site (already existing or foreseen), and how these would affect the provision of relevant forest goods and services. The respondents were asked to indicate main drivers affecting the provision, main goods and services influenced, and whether the impact on the provision is increasing or decreasing the availability of affected goods and services.
Finally, the valuation methodologies to be applied on selected pilot sites will also strongly depend on the data availability. Thus, in the last part (Part C) of the questionnaire, information about the available data and data sources was collected (e.g., indicators for quantification and economic valuation of main goods and services).

9
3 Forest ecosystems goods and services in the Mediterranean region
The overall objective of this chapter is to provide a broad overview of the ecosystem goods and services provided by Mediterranean forests that support and justify the need for the application of economic valuation methods to assess their relevancy. The specific objectives of this chapter are: 1) to define the ecosystem services framework and apply it to Mediterranean forests, with a special focus on the multiplicity and typology of the goods and services these forests provide, 2) To underline the vital role these goods and services play in Mediterranean economies, and how this role is frequently underestimated, and 3) To present the major drivers of ecosystem change and their repercussions (positive and negative) on the provision of forest goods and services, as well as the challenges and opportunities associated with those changes.
3.1 FEATURES AND CLASSIFICATION OF GOODS AND SERVICES PROVIDED BY
FOREST ECOSYSTEMS
3.1.1 Goods and services provided by forest ecosystems Forests provide a wide range of goods and services to the society. Wooden forest products (WFP) (e.g. timber and firewood) are often the first to come to mind. Nonetheless, they provide also plenty of other benefits to humans. Some of them are tangible, e.g. the non-wood forest products (NWFP) such as cork, mushrooms, game, honey, aromatic and medicinal plants, etc., while others are intangible: the regulation of water and nutrient cycles, protection of watersheds and soils, sequestration of carbon and mitigation of climate change, protection and conservation of biodiversity, part of our cultural and historical heritage, and place for outdoor recreation and leisure (Stenger et al., 2009).
In this report the terms "ecosystem goods and services" are regarded as outputs from ecosystems that benefit directly or indirectly to humans, and contribute to their well-being (MEA, 2005).
The multiple ways forests contribute to human well-being can be described according to the ecosystem services paradigm. So called forest functions, only become services to the extent that humans acknowledge them within their social systems of value generation (Nasi et al., 2002). Therefore, the novel aspect of the ecosystem services paradigm is that it encourages people to examine the links between ecosystems and human well-being in novel ways. It emphasises the role that healthy ecosystems play in the sustainable provision of human well-being, economic development and poverty alleviation (Turner and Daily, 2008).
3.1.2 Classification of forest ecosystem goods and services Efforts have been made to develop conceptual frameworks for describing and classifying more rigorously and systematically ecosystem services. Each of these frameworks has intrinsic strengths and limitations, but none is universally accepted (Costanza et al. 1997; De Groot et al., 2002; MEA, 2005; Merlo & Croitoru, 2005; Mantau et al., 2007). Among the many classification schemes, the one proposed in the Millennium ecosystem assessment (MEA) (2005) is the most widely used. The MEA (2005) proposes a specific classification scheme for forest ecosystem services that identifies five main interrelated categories (Figure 3.1).

10
Methods and tools for socio-economic assessment of goods and services provided by Mediterranean forest ecosystems
Figure 3.1 The five main classes of forest ecosystem services (adapted from MEA, 2005)
The resources category refers to all goods that may be obtained from forests (wood and non-wood); the ecological services are those related to protection of water, soil and health; the biospheric services are mainly climate regulation and biodiversity protection; while social and amenity services comprise of different types of recreational activities and the cultural importance of forests.
Although the multiple forest ecosystem services can be categorized to facilitate their analysis, valuation or for communication purpose, they are inherently interdependent and interactive, as part of a whole natural system, and relate to each other in many different ways that can be synergetic, neutral/tolerant, conflicting, exclusive, etc (Elmqvist et al., 2011).
Furthermore, in most cases different ecosystem services appear simultaneously, and the overall benefit from such a "bundle" of services is much higher than just the sum of the values of individual services. Furthermore, forest management activities (e.g. timber extraction, recreation, biodiversity conservation, etc.) might produce a variety of effects in terms of the provision of these ecosystem services. As an illustration, thinning can reduce water interception and increase surface runoff and infiltration, and at the same time, it stimulates tree growth, and the appearance of more species (increased diversity).
Recent debates have stressed the importance to differentiate between closely linked ecosystem services, benefits, functions, ecological processes and human well-being. Although the boundaries are not always clear, their identification helps to underline the mechanisms that underpin the links between natural capital and human well-being. Furthermore, distinguishing between intermediate and final products along the "service cascade" would also contribute to achieve a more reliable and realistic valuation of ecosystem services, avoiding "double counting" (Boyd and Banzhaf, 2007; Fisher et al., 2009).
Figure 3.2 illustrates these relationships, where:
• Biophysical structure and processes refers to the complex interactions between biotic (living organisms) and abiotic (chemical and physical) components of ecosystems, and to the matter and energy fluxes that drive them.
• Ecosystem function refers to the capacity of natural ecological processes, structures and components to provide goods and services that can potentially satisfy human needs, either directly or indirectly (Costanza, 1997; de Groot et al., 2002).
• Services are outputs from those functions that benefit, directly or indirectly, to humans (something we consider as "useful"), and contribute to their well-being in a given context (socio-economic, geographic, cultural, etc.).
• Value is a direct or indirect quantification/measurement (economic, sentimental, etc.) of the benefit obtained from a given service.
Forest ecosystem services
Biospheric Climate regulation, biodiversity protection...
Ecological Water, soil, health protection...
Social Ecotourism, recreation, sports,
hunting...
Amenities Spiritual, cultural, historical...
Resources Timber, fuelwood, non-timber
products...

11
Figure 3.2 Relationships between ecosystems and human well-being along the "service cascade" (adapted from Haines-Young and Potschin, 2010)
3.2 FOREST ECOSYSTEMS IN THE MEDITERRANEAN REGION
3.2.1 Forest cover in the Mediterranean In 2010, forests in Mediterranean countries were estimated to cover over 85 million ha, which represents around 9% of the land area (FAO, 2010) (Annex 3). The forest area has increased by almost 12 million ha between 1990 and 2010, i.e. around 0.7% per year. Nonetheless, the forest cover varies greatly between countries, being higher in northern and western Mediterranean countries (NWMC) than in Southern and Eastern (SEMC).
3.2.2 The role of Mediterranean forests in the economy One of the key aspects of the Mediterranean forests that has been widely acknowledged is their multi-functionality. However, many of the goods and services they provide are not traded in traditional markets and thus do not appear in the official statistics or national accounts. This means that forestry-related activities and products represent a small share of the national Gross domestic product (GDP). In most of the Mediterranean countries the share is significantly below 1% (e.g. 0.93% in Lebanon, 0.50% in Turkey, 0.40% in Morocco, 0.06% in Tunisia, 0.02% in Algeria), and only in some it is over 1% (e.g., 1.5% in France) (Merlo and Croituru, 2005). Likewise, estimates indicating that forests from Middle East - Northern Africa (MENA) contribute less than 1% of labour force of countries (FAO, 2011), capture only formal employment and exclude informal workers and the poorest who depend on forests for subsistence (Croituru and Liagre, 2013).
As Vincent (1999) shows, the value added, as conventionally defined for both industry and agriculture, is frequently overstated from a social standpoint, because a portion of each sector’s operating surplus can be attributed to goods and services provided by forests. For example, forests provide intermediate inputs to other sectors, such as livestock grazing or tourism, but the value of these inputs is not recognised (Lange, 2004). Thus, not only the total benefits from sustainable forestry are underestimated, but other economy sectors are not aware of their dependence on healthy forests (Lange, 2004). This way, forests and forest sector are commonly classified as a marginal element of the economy in a number of countries when evaluated under the GDP framework. This is especially problematic in the Mediterranean region which has a very limited timber production potential.
This also means that those goods and services, that have an established market value (e.g., timber), have more weight in the decisions, due to the frequent undervaluation of non-market goods and services. However, different studies show that timber accounts for only one third of the total economic value of forest in Mediterranean countries (Croituru and Merlo, 2005; Pak et al., 2010; Daly-Hassen et al., 2012) while NWFP account for more than 40% of the total economic value of forests in the Mediterranean countries (Croitoru, 2007).
HUMAN PERSPECTIVE
SERVICES (Contribution to
human well-being)
(e.g. flood protection, harvestable products, good quality water,
recreation)
VALUES (Quantification of the benefit)
(e.g. market or hedonic value; willingness to pay for forest
protection, forestation, wildlife observation, products, good quality water; travel cost to a
touristic site)
ECOSYSTEMS &
ANTHROPOGENIC PRESSURES Perceptions, needs, behaviour in a
geographical, temporal, socioeconomic, political, cultural context
BIOPHYSICAL STRUCTURE and PROCESSES
(e.g. woodland, net primary productivity, decomposition,
nutrient cycling)
ECOSYSTEM FUNCTIONS (capacities)
(e.g. slow water flow, generate biomass,
improve water & soil quality, provide pleasant
space)
Limit pressures via policy strategies & actions plans + sustainable adaptive
management
NATURAL
Feedbacks

12
Methods and tools for socio-economic assessment of goods and services provided by Mediterranean forest ecosystems
3.2.3 Ecosystem goods and services provided by Mediterranean forests This section provides an overview of the goods and services supplied by Mediterranean forest ecosystems following the MEA classification presented in section 3.1.2.
3.2.3.1 Resources: wood and non-wood forest products
Mediterranean forests provide a broad range of tangible products, including wood (timber, fuelwood) and non-wood (food, raw material, etc.) products.
Industrial wood serves for the production of a vast number of products, like industrial round wood, sawn wood, wood-based panels, pulp and paper, particleboard, fibreboard, and plywood, engineered lumber components, softwood lumber, flooring, pallets, veneer, etc. Fuel wood, e.g. twigs, branches and trunks, but also residues or reused wood, are used for energy generation, i.e. heating, cooking, charcoal generation or alcohol production (e.g. methanol). As an illustration of the potential for wood production, in 2010, the estimated total forest growing stock in the Mediterranean countries was around 9 623 million m3 (41% from conifers and 58% from broadleaved species) (FAO, 2013). NWMC obtain significant incomes from timber production while, in SEMC, fuel wood is mainly used by local rural populations.
NWFP are very diverse, and used for human or animal consumption, green chemistry, industry, whether in their raw form or processed. Many of them are marketed (in formal or informal markets) or have the potential to be. This group includes food products (e.g. game, fruits, vegetables, nuts, seeds, stems, flower, roots, mushrooms, honey, royal jelly, beverages, resins, gums, syrups, flavouring and colouring agents, herbs/teas, spices, sugaring agents, acorns, alfa, etc.), health and care products (medicinal and aromatic plants, essential oils, dyes, sap, etc.), construction, insulation and clothing materials (resins, tannins, bark, fibre, leaves, lianas, dyes, etc.), as well as gardening and ornamental materials (plants, shrubs, wildflowers, composting material, etc.).
In the Mediterranean region, many different types of NWFP are harvested (Figure 3.3), generating incomes and rural employment and incentivizing sustainable forest management. However, to unfold this potential, important improvements in the organisation and regulation of NWFP harvesting and use are needed. Currently, in most countries the access to NWFP is free and not well monitored. For, example an important part of the collected NWFP is used for self-consumption by the local population or is traded on gray markets, which is in particular the case in SEMC. Figure 3.3 Different types of NWFP harvested in the Mediterranean countries in 2010, with their weight and proportion of the overall extraction (FAO 2010)
Food 717 686 t; 42%
Hides, skins, trophies;
483 713 t; 29%
Other plant products
249 598 t; 15%
Raw material for medicine, aromatic
products 72 100 t; 4%
Wild meat 69 565 t; 4%
Wild honey, beeswax
47 884 t; 3%
Raw material for utensils, handicrafts,
construction 23 999 t; 2%
Fodder 19 051 t; 1%
Raw material for colorants/dyes 7 000 t; 0.4%
Exudates 6 349 t; 0.4%
Living animals 2 634 t; 0.15%
Ornamental plants 434 t; 0.03%
Other edible animal products
37 t; 0.002%

13
To underline the importance of NWFP, a few examples can be mentioned. Mediterranean countries (Portugal, Spain, Morocco, Algeria, Tunisia, France and Italy) are the main global producers of cork. In these countries cork and cork related activities are an important source of income and employment. Cork oak forests covered around 2.1 million ha in 2008 (Figure 3.4), but their area tends to decrease slightly, due to forest abandonment, deforestation, overgrazing, and lower demand for cork products. Figure 3.4 Area of cork oak forest by country, in 2008 (Adapted from APCOR, 2012)
Among other NWFP, mushrooms and truffles are particularly valued, and are collected for personal or commercial use. However, a large portion is traded on informal markets, resulting in the under-quantification of their real value. Stone pine nuts and cones (Pinus pinea), another NWFP of gastronomic and economic significance, are harvested in France, Italy, Lebanon, Portugal, Spain, Tunisia and Turkey. Stone pine forests currently cover over 0.75 million ha in the Mediterranean region.
In Italy, Greece and Spain, chestnuts are harvested for human consumption. Argan fruits (Argania spinosa) are collected in Morocco and Algeria to elaborate health care products, generating activity and income (see the Argan research network in construction in Morocco). The alfa steppe (Stipa tenacissima) occupies an important role in Algeria, but its area has decreased drastically and it is being degraded at a fast rate, due to overexploitation for production of paper pulp, and by the traditional artisanal sector for basketry and weaving (Kadi-Hanifi, 1998).
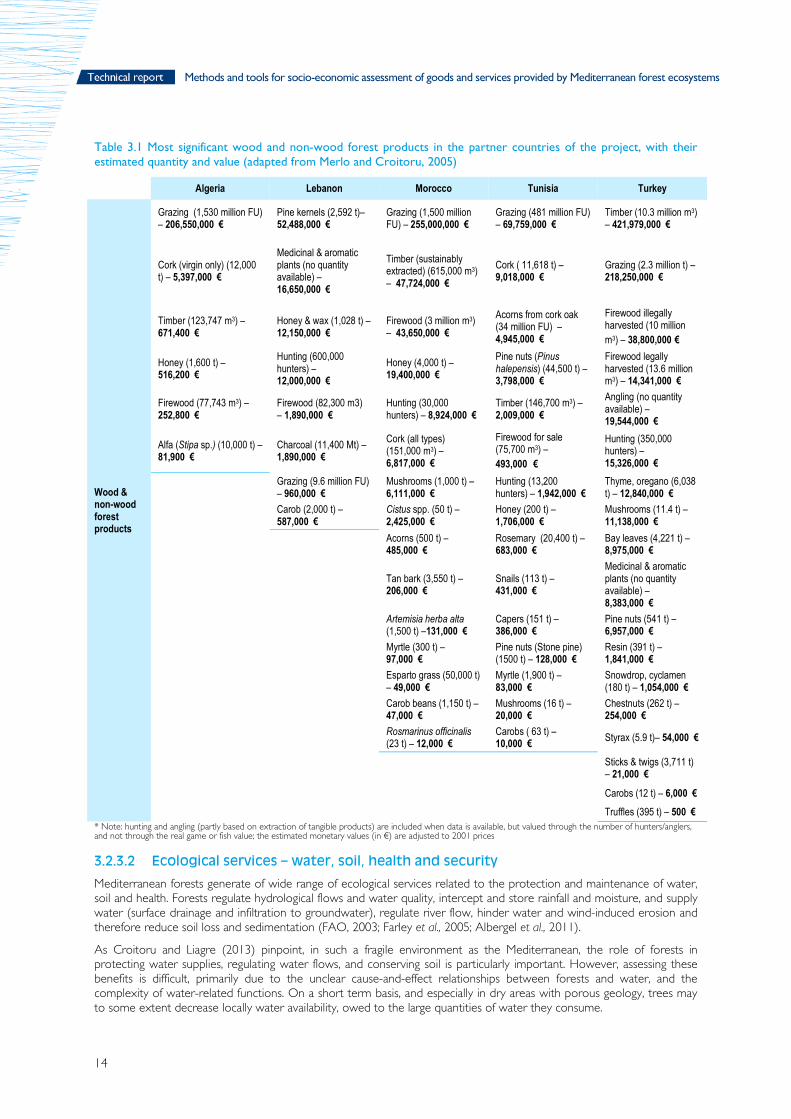
Table 3.1, adapted from Merlo and Croitoru (2005), presents some of the most valued wood and non-wood forest products for the Mediterranean countries involved in the FFEM project "Optimize the production of goods and services by Mediterranean forest ecosystems in a context of global changes". The estimated quantities and economic values proposed are consumptive direct use values derived from studies and data from the forest and agricultural sectors, and obtained from a combination of multiple sources (Forest services, national statistics, surveys, etc.) dating from the years 1999-2001. They are based on several valuation methods using production and consumption data, market prices, fees, market prices of similar goods, opportunity cost of labour, substitute goods, etc. This is an interesting illustration of what can be achieved through the use economic valuation methods.
Portugal 736 000 ha,
34%
Spain 574 248 ha,
27%
Morocco 383 120 ha,
18%
Algeria 230 000 ha,
11%
Tunisia 85 771 ha,
4%
France 65 228 ha,
3%
Italy 64 800 ha,
3%
14
Methods and tools for socio-economic assessment of goods and services provided by Mediterranean forest ecosystems
Table 3.1 Most significant wood and non-wood forest products in the partner countries of the project, with their estimated quantity and value (adapted from Merlo and Croitoru, 2005)
Algeria Lebanon Morocco Tunisia Turkey
Wood & non-wood forest products
Grazing (1,530 million FU) – 206,550,000 €
Pine kernels (2,592 t)– 52,488,000 €
Grazing (1,500 million FU) – 255,000,000 €
Grazing (481 million FU) – 69,759,000 €
Timber (10.3 million m3) – 421,979,000 €
Cork (virgin only) (12,000 t) – 5,397,000 €
Medicinal & aromatic plants (no quantity available) – 16,650,000 €
Timber (sustainably extracted) (615,000 m3) – 47,724,000 €
Cork ( 11,618 t) – 9,018,000 €
Grazing (2.3 million t) – 218,250,000 €
Timber (123,747 m3) – 671,400 €
Honey & wax (1,028 t) – 12,150,000 €
Firewood (3 million m3) – 43,650,000 €
Acorns from cork oak (34 million FU) – 4,945,000 €
Firewood illegally harvested (10 million m3) – 38,800,000 €
Honey (1,600 t) – 516,200 €
Hunting (600,000 hunters) – 12,000,000 €
Honey (4,000 t) – 19,400,000 €
Pine nuts (Pinus halepensis) (44,500 t) – 3,798,000 €
Firewood legally harvested (13.6 million m3) – 14,341,000 €
Firewood (77,743 m3) – 252,800 €
Firewood (82,300 m3) – 1,890,000 €
Hunting (30,000 hunters) – 8,924,000 €
Timber (146,700 m3) – 2,009,000 €
Angling (no quantity available) – 19,544,000 €
Alfa (Stipa sp.) (10,000 t) – 81,900 €
Charcoal (11,400 Mt) – 1,890,000 €
Cork (all types) (151,000 m3) – 6,817,000 €
Firewood for sale (75,700 m3) – 493,000 €
Hunting (350,000 hunters) – 15,326,000 €
Grazing (9.6 million FU) – 960,000 €
Mushrooms (1,000 t) – 6,111,000 €
Hunting (13,200 hunters) – 1,942,000 €
Thyme, oregano (6,038 t) – 12,840,000 €
Carob (2,000 t) – 587,000 €
Cistus spp. (50 t) – 2,425,000 €
Honey (200 t) – 1,706,000 €
Mushrooms (11.4 t) – 11,138,000 €
Acorns (500 t) – 485,000 €
Rosemary (20,400 t) – 683,000 €
Bay leaves (4,221 t) – 8,975,000 €
Tan bark (3,550 t) – 206,000 €
Snails (113 t) – 431,000 €
Medicinal & aromatic plants (no quantity available) – 8,383,000 €
Artemisia herba alta (1,500 t) –131,000 €
Capers (151 t) – 386,000 €
Pine nuts (541 t) – 6,957,000 €
Myrtle (300 t) – 97,000 €
Pine nuts (Stone pine) (1500 t) – 128,000 €
Resin (391 t) – 1,841,000 €
Esparto grass (50,000 t) – 49,000 €
Myrtle (1,900 t) – 83,000 €
Snowdrop, cyclamen (180 t) – 1,054,000 €
Carob beans (1,150 t) – 47,000 €
Mushrooms (16 t) – 20,000 €
Chestnuts (262 t) – 254,000 €
Rosmarinus officinalis (23 t) – 12,000 €
Carobs ( 63 t) – 10,000 € Styrax (5.9 t)– 54,000 €
Sticks & twigs (3,711 t) – 21,000 €
Carobs (12 t) – 6,000 €
Truffles (395 t) – 500 € * Note: hunting and angling (partly based on extraction of tangible products) are included when data is available, but valued through the number of hunters/anglers, and not through the real game or fish value; the estimated monetary values (in €) are adjusted to 2001 prices
3.2.3.2 Ecological services – water, soil, health and security
Mediterranean forests generate of wide range of ecological services related to the protection and maintenance of water, soil and health. Forests regulate hydrological flows and water quality, intercept and store rainfall and moisture, and supply water (surface drainage and infiltration to groundwater), regulate river flow, hinder water and wind-induced erosion and therefore reduce soil loss and sedimentation (FAO, 2003; Farley et al., 2005; Albergel et al., 2011).
As Croitoru and Liagre (2013) pinpoint, in such a fragile environment as the Mediterranean, the role of forests in protecting water supplies, regulating water flows, and conserving soil is particularly important. However, assessing these benefits is difficult, primarily due to the unclear cause-and-effect relationships between forests and water, and the complexity of water-related functions. On a short term basis, and especially in dry areas with porous geology, trees may to some extent decrease locally water availability, owed to the large quantities of water they consume.

15
Nonetheless, in general, forest cover is beneficial to ground and surface water. Indeed, compared to conventional agricultural land, forested catchments supply downstream populations with higher quality water. In countries such as Syria, watershed protection is the most valuable benefit of forests while in the Maghreb countries, it is only second in value after grazing (Croitoru and Liagre, 2013).
The forest cover and root systems play an important role in soil retention and formation. For example, the roots stabilize the soil and make it less susceptible to disintegration preventing losses and landslides. They also exert a mechanical and chemical influence on the ground and rocks, contributing to soil formation. Moreover, the foliage, branches and litter partly intercept rainfall and decrease rain drops speed and impact on the ground, limiting compaction and soil loss, and leaf fall and decay contribute to soil organic matter enrichment and fertility enhancement.
Recognizing the role forests play in soil and water protection, "protective forests" have been designated worldwide to prevent soil erosion and preserve water resources (FAO, 2010; Forest Europe, UNECE and FAO, 2011). According to official data, in the Mediterranean, they represent about 80 million ha, but their cover differs markedly between countries (see Figure 3.5). Figure 3.5 Percentage of forest area primarily designated for soil and water protection in Mediterranean countries in 2010 (adapted from FAO, 2010)
Mediterranean forests also benefit human health and security, through a combination of processes and services: they attenuate floods, drought and landslides, contribute to the remediation of waste and noxious compounds (e.g. they assimilate contaminants, filter airborne particles), supply pharmaceutical substances for medicinal use (their potential is currently untapped) and are for many of us an essential component of mental health and well-being.
3.2.3.3 Biospheric services – climate regulation, biodiversity conservation
Biospheric services include the contribution of forests to the protection, preservation and creation of biodiversity at the gene, species, community and ecosystem levels, as well as their role in climate regulation (i.e. maintenance of climate and weather conditions favourable to human life) and in gas regulation (i.e. influence on the chemical composition of the atmosphere and oceans, including the absorption and sequestration of CO2 and related global warming mitigation).
The striking geographical and topographical variability, the pronounced climatic bi-seasonality are some of the reasons for the exceptional overall biodiversity value of Mediterranean forests, this biodiversity being an essential component of all other services. Indeed, they offer shelter to over 25 000 plant species, 60% of them endemic (c. 13,000 species) (Myers et al., 2000; Thompson et al., 2005; Cuttelod et al., 2009). Vertebrate density is also very high with about 200 species of terrestrial mammals, of which 25% are endemic. A larger number of species, 350, can be counted for the avifaunal communities (Scarascia-Mugnozza et al., 2000).
Mediterranean forests have nearly twice as many woody species as other European forests (247 as opposed to 135), 158 species being exclusive or largely preferential, compared with 46 in central and northern European forests. Their conservation is thus a priority. FAO (2010) estimated to 1.7 million ha (2% of the total forest area) the area of so called primary forests, i.e. "forests of native species in which there are no clearly visible indications of human activity and where ecological processes have not been significantly disturbed".
0102030405060708090
100
Alba
nia
Bulg
aria
Croa
tiaFr
ance
Gre
ece
Italy
Mon
tene
gro
Port
ugal
Spai
nSl
oven
iaCy
prus
Isra
elJo
rdan
Leba
non
Pale
stin
ian…
Syria
Turk
eyAl
geria
Egyp
tLi
bya
Mor
occo
Tuni
sia
% o
f fo
rest
are
a
Country

16
Methods and tools for socio-economic assessment of goods and services provided by Mediterranean forest ecosystems
As an illustration, in 2010, almost 8.5 million ha of forests in the Mediterranean region were designated for the conservation of biodiversity (Figure 3.6), i.e. 10% of the total forest area, and during the last two decades (1990–2010), this area increased by 3% (FAO, 2010). Moreover, the area of forests within protected areas also increased, reaching 18 million ha in 2010, with an annual increment of 3.2% between 1990 and 2010. Figure 3.6 Forest area dedicated to the conservation of biodiversity in the Mediterranean Region, by country, in 2010. Note: Countries with less than 100 000 ha are not shown (FAO, 2010)
In terms of carbon absorption and sequestration, both in aboveground and belowground biomass, estimations indicate that Mediterranean forests are significant and valuable carbon sinks, sequestering overall between 0.01 and 1.08 t C ha−1 annually (Croitoru and Merlo, 2005; Ding et al., 2011), i.e. between 0.8 and 90 million t C per year. In 2010, they were stocking almost 5 billion t of carbon, i.e. 1.6% of the global forest carbon (FAO, 2010), France, Italy, Spain and Turkey storing around 65% of it, and this stock increased by 1.3% during the last two decades.
However, the sink/source behaviour of forests differs across the Mediterranean Region influenced by natural conditions (climate, forest growth, fires, etc.) and human pressures (deforestation, abandonment, overexploitation, etc.). In 2001, while forests from northern and western Europe were net sinks of carbon, forests from a few south and eastern countries (e.g. Morocco, Algeria, Lebanon) were net carbon sources, loosing between 0.1 and 0.5 t C/ha/yr, due to their slow growth and strong human and environmental pressures (UNECE & FAO, 2000).
3.2.3.4 Social services – ecotourism, recreation, sports, hunting, etc.
Social services refer to those multiple opportunities that forests offer for ecotourism (bird watching, fauna/flora observation, etc.), relaxation, recreation through the practice of sports (mountain biking, walking, horse riding, tree climbing, , etc.), fishing/hunting, etc.
Recreation and landscape qualities of Mediterranean forests have always been valued, but demand for those services has been raising significantly, due to income growth, urbanization of the population, better and cheaper transport means, etc. The Mediterranean basin, and especially its coastal areas, is one of the world's leading tourist destinations, and tourism is an essential driver of the socio-economic activity and a major source of income and employment. For example, in 2007, the Mediterranean countries received 275 million international tourists, which is about 30% of the global aggregate. And by 2025, inflows are likely to reach 637 million tourists, of which 312 million in the coastal regions alone (Plan Bleu, 2013). Mediterranean tourism is dominated by France, Spain and Italy which received in 2010 c. 60% of all inbound tourists (26%, 18% and 15% respectively) and 70% of their spending. The six Spanish natural parks located in the Mediterranean area received 1.6 million visitors in 2008, and visits increased by 40% during the last ten years (Mavsar and Varela, 2010). Tourism spending comprises 1.5–2% of the GDP in the Mediterranean region, although there are major national and local disparities. In 2010, for example, foreign tourist spending accounted for 13 % of GDP in Lebanon and 0.7 % in Turkey.
Hunting is another important forest related activity in many Mediterranean countries (sometimes a welcome source of livelihood in the South, and more of a recreational activity in the North). Regional or local administrations sell shooting/hunting permits and reinvest part of the incomes into forest management. Poaching is a preoccupying issue in some countries (e.g. Morocco, Lebanon) threatening to degrade game populations.
0
500
1 000
1 500
2 000
2 500
3 000
3 500
Italy
Spai
n
Turk
ey
Mor
occo
Slov
enia
Rom
ania
Alge
ria
Port
ugal
Fran
ce
Gree
ce
Serb
ia
Fore
st a
rea
for b
iodi
vers
ity
cons
erva
tion
(1 0
00 h
a)

17
3.2.3.5 Amenity services - spiritual, cultural, historical
Mediterranean forests offer a multitude of amenity services that cover a broad range of social, spiritual, cultural and historical services, related to the complexity, structure, aesthetic and beauty of forests, landscapes and their components (fauna and flora) and their use for relaxation, education, reflection, religious/spiritual rituals and gatherings, historical events, national symbols (e.g. the Lebanese cedar), folklore, myths, etc. They are very valuable components of the national cultural heritage that have been modelled for centuries and passed on from generation to generation. They inspire undeniably artistic creativity (painting, drawing, etc.) and are valuable environmental educational playgrounds for school pupils and students to interact with their environment and study ecosystems processes. Those values are particularly strong in remnant ancient forests, which host a wealth of biodiversity in addition to information, know-how, for example regarding management and conservation activities and strategies to enhance resilience and adaptation to threats such as climate change or forest fires (Mansourian and al., 2013).
The way humans perceive forests, the benefits they expect from them, and the goods and services they really extract, are linked to people's values, needs and perception, and shaped by the socioeconomic and political context, the organization of the society, the living standards and availability of consumption alternatives. In the Mediterranean, overall, the improvement in living conditions and welfare has made more relevant and valuable the social and amenity services that forests provide.
3.2.4 Beneficiaries of forest goods and services and differences across the Mediterranean basin
Forests goods and services benefit multiple users, both directly and indirectly, and not only those users that live or act within or in the vicinity of forests. Local communities and rural populations, industrial loggers, but also urban populations, the agricultural sector and the industry all obtain to some extent benefits from forests. Therefore, benefits are indeed spreading at the catchment area scale, but also at the regional and national scale, although the complete scope of forest beneficiaries is rarely fully acknowledged. Nevertheless, identifying those beneficiaries is a key to hindering the loss of forest goods and services and developing relevant mechanisms to finance the sustainable production in public as well as private areas (e.g. user permits, tax incentives, direct funding, cap and trade, certification schemes, partial redistribution of the economic benefits, biodiversity offsets, etc.).
The state of forests in the Mediterranean region can be better understood if seen in light of differences existing in socio-economic development and in the balance between urban and rural areas. The distinction between southern Europe, northern Africa and the near-east may pave the way for learning from the failed experiences of southern European countries.
In the north of the Mediterranean region, the rural exodus that has taken place since the late 1960s resulted in abandoned agricultural lands becoming progressively covered by a woody vegetation of shrubs and young trees that eventually will give rise to natural reforestation as a result of secondary succession. This process is also favoured by the reduction of animal grazing in the forest that previously inhibited the growth of the understory. Forest products such as timber and fuel wood, but also no longer profitable forage, gum and turpentine, have lost some of their importance and marketability. By contrast, the ecological, recreational and landscape functions of the forest have increased their relevance which influences political decisions towards the development of adequate mechanisms to preserve forests and manage them accordingly.
However, because they provide no revenues to their private or communal owners, this results in an even diminished interest of the forest owners in cultivating and maintaining their forests and increases the risk for natural disasters such as soil erosion, landslides and forest fires. The type of forest ownership has important implications on the use and conservation of these forests. In southern Europe, forests are mainly privately owned with very fragmented properties. The lack of profitability (elevated labour cost, difficult access, etc.) and incentives (lack of market and added value for the products harvested) and the difficulties in reaching agreements among the several forest owners, jeopardizes the setup of shared management plans for the enhancement of these forests. This also results in negative externalities, including increased fire risk and damages, loss of landscape quality, more intense use of non-renewable materials, etc. In those regions, the demand from the society for non-use benefits is much higher.
In contrast with the previous, the SEMC face a very different situation. When it comes to ownership, forests largely belong to the state (Scarascia-Mugnozza et al., 2000). In general, local communities are allowed to exploit them, under certain regulations (for grazing, firewood, fodder collection, etc.). However, the level of rural poverty and strong dependence of populations on forest services for subsistence and income generation exert strong pressures on forest ecosystems, resulting in overgrazing, over-extraction of timber and non-wood forest products, and conversion of forest land for agricultural use (Merlo and Croitoru, 2005), with subsequent dramatic consequences such as erosion, CO2 emissions, loss of biodiversity, etc.
Some of the problems faced by forests in SEMC are related to overuse, overgrazing and competition from other land uses. These threats hamper productivity and reduce the provision of environmental services (Croitoru and Liagre, 2013).

18
Methods and tools for socio-economic assessment of goods and services provided by Mediterranean forest ecosystems
In many countries, forest degradation is likely to be a more relevant issue than deforestation itself (CIFOR, 2009). However, it should be reminded that although net deforestation at global level seems to have slowed down, this is only a result of the increasing area under plantations (FAO, 2010b). Croitoru and Liagre (2013) collected some experiences that account for the cost of deforestation and forest degradation in terms of the countries GDP, such as 0.2% of the GDP in Morocco (Ellatifi, 2005) or 0.7% of the GDP in Iran (Croitoru and Sarraf, 2010).
3.2.5 Drivers of change in Mediterranean forests and their repercussions on the goods and services these ecosystems provide
Despite their apparent fragility, Mediterranean forest landscapes have been shaped by human activities for centuries and have demonstrated their strong resilience to anthropogenic changes and natural catastrophes. Forest ecosystems are continuously shaped by multiple drivers of change (direct or indirect), the predominant ones being deforestation, overgrazing, climate change, mismanagement or abandonment, fires. Exposed to these pressures, they undergo important changes, which in turn have significant repercussions on the provided goods and services and ultimately on the well-being of the society, at local, regional and global scale, and in the short and long term (Figure 3.7). Figure 3.7 Interactions between drivers of change, ecosystem services and human well-being (adapted from MEA, 2005). Note: blue arrows indicate possible interactions.
As stressed before, the situations in the Mediterranean region are quite contrasting: indeed, in SEMC, forests suffer relatively heavy anthropogenic pressures, while in northern countries they are rather subject to low intensity management or even abandonment.
Direct drivers of ecosystem change
• Natural, physical & biological disturbances: wild fires, invasive species, pest/disease outbreaks
• Land use & land cover change (e.g. conversion for agriculture, biofuel, urbanization/settling)
• Habitat loss and fragmentation (loss of shelter and connectivity causing a loss of biodiversity)
• Overexploitation & poor management of resources
• Climate change (e.g. temperature rise, change in precipitation patterns, droughts)
• Aridification & desertification exacerbated by mismanagement and/or climate change
• External inputs & pollution (e.g. fertilizers, pesticides, irrigation)
• Technology adaptation and use
Indirect drivers of ecosystem change
• Demographic
• Economic (e.g. globalization, trade, market, policy framework)
• Socio-political (e.g. governance, institutional/legal framework)
• Scientific & Technological
• Cultural & religious (e.g. beliefs, consumption
Forest ecosystem good & services Biospheric, Ecological, Resources, Social, Amenities
Human well-being, living standards Basic material for a good life, health, good social relations, security, etc.

19
3.2.5.1 Impact of climate change on forest goods and services and mitigation opportunities
Drastic changes are expected to take place in the Mediterranean Region, as a result of climate change manifestations, i.e. a decrease in precipitation quantity and shift in its seasonal distribution, more frequent extreme events, temperature rise, repeated droughts, higher evapotranspiration, water stress and vegetation dieback and mortality, more frequent and intense wildfires, insects and diseases outbreaks and spread of invasive exotic species, etc. Overall, climate change is likely to reduce the ability of Mediterranean forests to autonomously accommodate to increased perturbations such as increased frequency and risk of pathogens outbreaks, uncontrolled fires, and other large-scale disturbances (FAO/Silva Mediteranea, 2010).
The Mediterranean area represents a transition zone between arid and humid regions of the world with a large part of its forests at the limit of their bio-geographical distribution. Hence, it is one of the most sensible and vulnerable area to climate change and it is expected that changes will likely become more intense and rapid (IPCC, 2007a, b; Regato, 2008; FAO, 2011; Vayreda et al., 2012).
Climate change is already altering significantly forests growth, dynamics and functions, as well as genetic resources and overall biodiversity, and will have a striking influence on the provision of forest ecosystems goods and services such as the regulation of the water cycle, the storage and emission of carbon (and source or sink behaviour of woodlands), and delivery of wood and non-wood products and services in the medium and long term (MEA, 2005; Martínez-Vilalta et al., 2008; Palahi et al., 2008; FAO, 2013). Dryer and warmer conditions and reduced water availability are expected to favour the expansion of semi-arid and arid systems, and are likely to induce substantial species-range shifts and isolation of populations (IPCC, 2007a, b; Loarie et al., 2009; FAO, 2010).
Nonetheless, the sensitivity and therefore the response of forests to climate change depend on multiple interrelated factors, such as forest type, age, structure and location, tree and plant species considered (diversity and interactions), environmental factors (water, temperature, nutrients, light, etc.), exposure to pests, diseases and fires, management (e.g. thinning practices), etc.
In fact, climate change might influence forest expansion positively or negatively, by enhancing or inhibiting tree growth and carbon storage in aboveground and belowground compartments: CO2 enrichment might stimulate tree growth, while a rise in temperature and more severe and repeated droughts might cause higher soil carbon losses and tree mortality and dieback. In 2003, for example, Europe experienced an exceptionally dry and hot summer in the western and central regions which triggered a considerable increase in carbon fluxes from the land to the atmosphere (Jones and Cox, 2005).
In Mediterranean Europe, most forests consist of sclerophyllous and some deciduous species that are rather well adapted to summer soil water deficits. Therefore, the on-going temperature rise could favour the expansion of some thermophilous tree species (e.g. Quercus pyrenaica) if water availability is not excessively limiting (IPCC, 2001).
Climate change is also expected to favour insect and disease outbreaks as well as tree dieback, which could have significant effects on tree mortality, diversity and subsequently on forest services. The Pine processionary (Thaumetopoea pityocampa), which attacks several species (Pinus halepensis, P. pinaster, P. nigra, P. sylvestris, Cedrus sp., etc.) is already an important economic pest in several Mediterranean countries (Spain, France, etc.) and its impacts could get worse.
Box 3.1 Forest and carbon
Regarding the opportunities for the attenuation and mitigation of climate change and deforestation, a few financing initiatives exist and might be underexploited currently. For example, several flexible project-based mechanisms are being implemented to incentivise greenhouse gas emission reductions or carbon sequestration under the Kyoto Protocol, e.g. joint implementation (JI) and clean development mechanism (CDM) (UNFCCC, 2013), the European Union emissions trading Scheme (EU ETS) (EU Commission, 2013) or the reducing emissions from deforestation and forest degradation scheme (REDD/REDD+) (UN-REDD, 2013). The prospects for the market in carbon emission reductions are promising and the global carbon markets are expanding rapidly, but many challenges remain, regarding financing, monitoring, double-counting of credits, etc.
However, only a small share of the markets is represented by emission reduction from carbon sequestration and forest carbon is not usually enough considered in the current schemes. Voluntary markets and public payments seem to be more likely to be interesting for the forest sector, since buyers are keener on using carbon payments to restore degraded lands and encourage agro-forestry on a large scale. Payments contemplated in the framework of REDD+, for avoided deforestation and forest degradation, carbon stocks enhancement and sustainable management, are of growing interest and could play a significant role in the preservation and expansion of forests.

20
Methods and tools for socio-economic assessment of goods and services provided by Mediterranean forest ecosystems
3.2.5.2 Impact of forest fires on forest goods and services
Evolutionary and paleobotanical studies suggest that fires are a natural phenomenon in the Mediterranean basin. However, some studies suggest that current fire regimes are human induced and surpass by far the natural regimes. Fire may cause disasters in the sense of inducing abrupt community changes or important soil losses (Pausas et al., 2008).
Furthermore, wildfires introduce a high risk of direct damage to humans and structures in most of the highly populated Mediterranean countries, and especially in coastal regions. Their impact is largely influenced by weather conditions (e.g. high temperatures, low moisture and strong winds) but also by forest type, structure and management, fuel availability and characteristics, and the intervention/response of fire fighting means.
Climate change scenarios foresee an increase in the intensity and frequency of high intensity fires in the near future (Flannigan, 2000; IPCC, 2007a, b), which will trigger higher carbon losses and will severely diminish the capacity of recovery of the vegetation in burnt areas, due to both higher fire recurrence and progressive soil degradation and loss.
Therefore, in order to limit the negative impacts of fires on forest services, it appears essential to actively manage forests in an integrated manner, to promote the creation of stands and landscapes more resilient to forest fires. It involves thinning practices to reduce tree density or creation of discontinuities in the landscapes to slow down fires progression and attenuate their intensity.
However, removing fire completely from the ecosystem is an impossible and non-desirable aim. Instead, an integrated fire management approach should be adopted (Rego and al., 2010). This concept embraces planning and operational systems that include social, economic, cultural and ecological evaluations with the objective of minimizing the damage and maximizing the benefits of fire. These systems include a combination of prevention and suppression strategies and techniques that integrate the use of technical fires and regulate traditional burning, e.g. through the use of prescribed fires to control fuel availability and reduce the risk of megafires (Kashian, 2006; Rego and al., 2010; Silva and al., 2010; Vericat and al., 2012).
3.2.5.3 Impact of pests and diseases on forest goods and services
Mediterranean forests are adversely affected by pests, diseases and woody invasive species (table 3.2), as well as by wildlife browsing, parasitic plants (e.g. Loranthus europaeus and Viscum album), and several abiotic disturbances (e.g. air pollution, storms, droughts), which have significant economic repercussions. Their recurrence and impacts are expected to worsen with climate change and introduction of alien species and strains. Table 3.2 Examples of pests, diseases and woody invasive species affecting the project’s partner countries
Pest type Pest name Countries* Order: Family Main host
Insect
Diprion pini TR Hymenoptera: Diprionidae Pine Ips sexdentatus TR Coleoptera: Scolytidae Pine Ips typographus TR Coleoptera: Scolytidae Spruce Leptocybe invasa DZ, LB, MA, TN, TR Hymenoptera: Eulophidae Eucalypt Lymantria dispar DZ, LB, MA, TN, TR Lepidoptera: Lymantriidae Oak Neodiprion sertifer TR Hymenoptera: Diprionidae Pine Ophelimus maskelli TN, TR Hymenoptera: Eulophidae Eucalypt Orthotomicus erosus MA, TN, TR Coleoptera: Scolytidae Pine Phloeosinus aubei TN Coleoptera: Curculionidae Cypress Phoracantha recurva MA, TN Coleoptera: Cerambycidae Eucalypt Phoracantha semipunctata DZ, LB, MA, TN, TR Coleoptera: Cerambycidae Eucalypt Thaumetopoea bonjeani DZ, MA Lepidoptera: Thaumetopoeidae Cedar Thaumetopoea pityocampa DZ, MA, TN, TR Lepidoptera: Thaumetopoeidae Pine Thaumetopoea wilkinsoni LB Lepidoptera: Thaumetopoeidae Pine Tomicus destruens TN Coleoptera: Scolytidae Pine Tomicus piniperda LB Coleoptera: Scolytidae Pine Tortrix viridana TN Lepidoptera: Tortricidae Oak
Disease Cryphonectria parasitica TN, TR Fungus – Ascomycota (Chestnut blight) Chestnut Ophiostoma ulmi TN Fungus - Ascomycota Elm
Invasive tree
Miconia calvescens DZ Tree NA Triadica sebifera DZ Tree NA Acacia saligna MA, TN, DZ Tree NA Leucaena leucocephala MA, TN Tree NA Robinia pseudoacacia TR tree NA
*DZ – Algeria; LB – Lebanon; MA – Morocco; TN – Tunisia; TR – Turkey; Sources: FAO 2010; Global Invasive Species Database 2013 When listing the ten major outbreaks of insects and diseases that occurred since 1990, Mediterranean countries reported a total of 89 insect pests and 34 diseases (FAO, 2010) (Table 3.3). However, forest health indicators are often not systematically monitored and information gaps are important, requiring therefore further efforts in this direction.
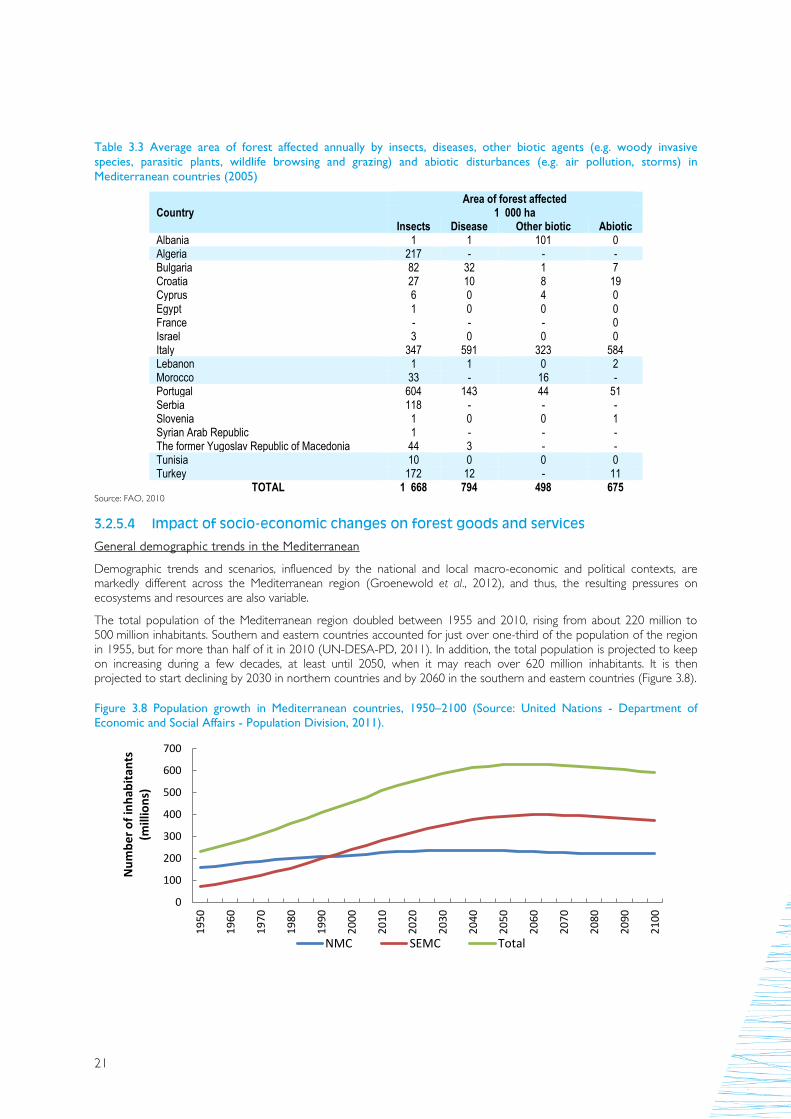
21
Table 3.3 Average area of forest affected annually by insects, diseases, other biotic agents (e.g. woody invasive species, parasitic plants, wildlife browsing and grazing) and abiotic disturbances (e.g. air pollution, storms) in Mediterranean countries (2005)
Source: FAO, 2010
3.2.5.4 Impact of socio-economic changes on forest goods and services
General demographic trends in the Mediterranean
Demographic trends and scenarios, influenced by the national and local macro-economic and political contexts, are markedly different across the Mediterranean region (Groenewold et al., 2012), and thus, the resulting pressures on ecosystems and resources are also variable.
The total population of the Mediterranean region doubled between 1955 and 2010, rising from about 220 million to 500 million inhabitants. Southern and eastern countries accounted for just over one-third of the population of the region in 1955, but for more than half of it in 2010 (UN-DESA-PD, 2011). In addition, the total population is projected to keep on increasing during a few decades, at least until 2050, when it may reach over 620 million inhabitants. It is then projected to start declining by 2030 in northern countries and by 2060 in the southern and eastern countries (Figure 3.8). Figure 3.8 Population growth in Mediterranean countries, 1950–2100 (Source: United Nations - Department of Economic and Social Affairs - Population Division, 2011).
0
100
200
300
400
500
600
700
1950
1960
1970
1980
1990
2000
2010
2020
2030
2040
2050
2060
2070
2080
2090
2100
Num
ber o
f inh
abita
nts
(mill
ions
)
NMC SEMC Total
Country Area of forest affected
1 000 ha Insects Disease Other biotic Abiotic
Albania 1 1 101 0 Algeria 217 - - - Bulgaria 82 32 1 7 Croatia 27 10 8 19 Cyprus 6 0 4 0 Egypt 1 0 0 0 France - - - 0 Israel 3 0 0 0 Italy 347 591 323 584 Lebanon 1 1 0 2 Morocco 33 - 16 - Portugal 604 143 44 51 Serbia 118 - - - Slovenia 1 0 0 1 Syrian Arab Republic 1 - - - The former Yugoslav Republic of Macedonia 44 3 - - Tunisia 10 0 0 0 Turkey 172 12 - 11
TOTAL 1 668 794 498 675

22
Methods and tools for socio-economic assessment of goods and services provided by Mediterranean forest ecosystems
Population growth rates vary between northern and southern/eastern Mediterranean countries but seem to be converging. Southern and eastern countries are indeed characterized by younger populations, higher birth rates and an annual population growth rate around 2-3%, currently slowing down, due to fertility decline. Western and northern European countries, on the contrary, are characterized by an ageing population and a slight population decline, which could cause labour shortage in the future. The share of urban population increases in all countries. However, rural population diminishes in northern, but still grows in southern countries, where it should start decreasing by 2020 (Figure 3.9). Figure 3.9 Population trends in Mediterranean countries, 1950–2050 (Source: United Nations - Department of Economic and Social Affairs - Population Division, 2011).
Rising ecological footprint and changing demand
The ecological footprint of consumption (EF) (human demand, expressed in global hectares (gha) per capita) (Ewing et al., 2010) in the Mediterranean region has increased by 52% between 1961 and 2008 (from 2.1 to 3.1 gha per capita; mostly due to the increase in the carbon component). Simultaneously, the per capita biocapacity (Earth's supply, i.e. the capacity of biologically productive land and sea areas to produce materials and services useful for humans, expressed in gha), decreased by 16% (from 1.5 to 1.3 gha). The ecological deficit, i.e. the difference between the biocapacity and the EF of consumption of a region or country, greater in northern countries, rose by 230%. This unsustainable trend continues, and the EF of all Mediterranean countries surpasses their biocapacity, and is now above the global average biocapacity (1.8 gha/capita) (GFN, 2012).
The rising demographic pressure, growing food, water and energy consumption, waste production and pollution, as well as changes in production objectives and strategies, stimulate the conversion and fragmentation of forest land for other uses (e.g. urbanization, agricultural production, commercial plantations or biofuel generation) with the consequent drastic loss of ecosystem goods and services. For example, clearing and farming on marginal land, overuse of fuel-wood, overgrazing, increased water use or soil degradation are some of the many pressures threatening ecosystem goods and services.
In 2007, the Mediterranean accounted for 8% of the world's energy consumption, and consumption per capita was 13% higher than the world's average, the Region emitting 8% of global CO2 emissions in 2006 (Plan Bleu, 2009). In 2009, the regional installed capacity stood at 496 GW, of which 33% from natural gas, 18% hydro power, 14% nuclear, 13% coal, 12% oil and 10% non-hydro renewable sources (Observatoire Méditerranéen de l'Énergie, 2011). Improvement in technologies and the development and spread of renewable energies in rural contexts could decrease further the demand for fuel wood and thus alleviate the pressure on forests.
Urban populations occupy a growing share of the overall population, as does their EF, and this shift from rural to urban civilizations has profound implications on the relationship between humans and their environment, and especially, on value and treat natural resources.
The overall improvement of living standards across the Mediterranean, as illustrated by the progressive increment in the human development index (HDI) (UNDP, 2011), will result in more financial resources and leisure time for these populations and could trigger a growing demand for amenities and social services (ecotourism, sport, relaxation, etc.), which underlines the importance of the non-market dimension of forests, and could boost the valorisation of those ecosystems, promoting their conservation. Therefore, the increasing demand for forest goods and services can also be seen as an opportunity to stronger promote the sustainable manage those ecosystems.
0
50
100
150
200
250
300
350
1950
1960
1970
1980
1990
2000
2010
2020
2030
2040
2050
Num
ber o
f Inh
abita
nts (
mill
ions
)
Urban population (NMC) Rural population (NMC)Urban population (SEMC) Rural population (SEMC)

23
Rising pressure on water resources
The pressure on water resources is also growing in Mediterranean countries, due to the rising population and use for tourism and agriculture, and this trend is exacerbated by climate change. Water per capita availability in south and eastern countries is already very limited and decreasing steadily. In all those countries except Turkey (with a water availability around 3500 m3/inhabitant/yr), water availability is below 1000 m3 water per capita per year (the threshold characterizing “water-poor” countries), and even below 500 m3 for six countries (Malta, Jordan, West bank, Israel, Algeria, Tunisia), and below 94 m3 in Libya. Under climate change conditions, all SEMCs are projected to experience severe water stress (Plan Bleu, 2006, 2011, 2013; Blinda, 2012; FAO, 2013).
There is no doubt that forests have overall positive effects on the water cycle and soil conservation, by limiting evaporation from the soil, increasing infiltration and recharge of aquifers, slowing down the water flow, and hindering soil erosion. They also benefit greatly water quality, since they are usually less exposed to pesticides and fertilizers, and also retain and transform pollutants.
However, forested areas usually exhibit greater interception, evapotranspiration and infiltration rates than urban and agricultural land, resulting in smaller amounts of surface water directly usable for human consumption down the catchment. This impact is not precisely known and often debated, due to the difficulties in assessing accurately the water balances of forested catchments.
Forests therefore compete to some extent with humans for water, more or less depending on the tree species composing them. Acacia, for example, where they became invasive, may decrease significantly water supplies for nearby communities, due to their high water demand. On the contrary, Pinus pinea (Stone Pine) or Quercus spp. are less water demanding and able to grow in dryer environments, which has a positive impact on watersheds and soils, and affects to a lesser degree human water consumption. Important trade-offs are subsequently involved in terms of goods and services provision, and they have to be carefully accounted for in territorial planning, resource management and to guide site-specific sylvicultural activities.
Recognizing and capturing collectively the multiple values of Mediterranean forests, the potential trade-offs between the goods and services they provide, and their importance in sustaining rural and urban populations is essential to protect them and manage them adequately and sustainably.

24
Methods and tools for socio-economic assessment of goods and services provided by Mediterranean forest ecosystems
4 Evaluation methods
The overall objective of this chapter is to provide a summarised overview of the two main decision support methods, which can be used for the evaluation of forest management alternatives. The cost benefit analysis (CBA) compares the positive and negative impacts of the implementation of a management alternative in monetary terms. The multi-criteria analysis (MCA) compares the performance of management alternatives according to a set of selected evaluation criteria.
Environmental decisions are often complex, multifaceted and involve many different stakeholders with different priorities or objectives. The selection of appropriate management approaches or regulatory processes often involves multiple criteria such as the distribution of costs and benefits, environmental impacts for different populations, safety, ecological risk, or human values (Kiker and al., 2005). To make adequate decisions the situation, preferences of stakeholders and the consequences of the available alternatives have to be well understood (Gregory and al., 2012).
However, research on human judgements and decision making shows that the simplifications which are made to enable to facilitate to deal with complex problems sometimes do not work well. People are inclined to be biased in their assessments of alternatives that can more readily be linked to what is familiar (representativeness heuristic), and to be unduly influenced by recent, memorable, or successful experience (availability heuristic) (Dodgson and al. 2001).
Thus, to facilitate the decision making process different methods can be applied to evaluate the outcomes, strengths and weaknesses of alternative management approaches. The most commonly used decision support tools to evaluate alternatives for achieving a certain objective are the cost-effectiveness analysis (CEA), cost-benefit analysis (CBA), multi-criteria analysis (MCA) and life cycle analysis (LCA) (Ozdemiroglu and al, 2006).
In this report evaluation methods (chapter 4) and valuation methods (chapter 5) are distinguished. Evaluation is considered as the process of determining the performance of an alternative in regard to the objectives, and results of any such action that has been completed; while valuation is the process of estimating what something is worth.
CBA is a decision support method which aims to compare all relevant benefits and costs (in monetary terms) of an alternative (project, policy or programme), including impacts on environmental goods and services. It can be applied before (ex-ante) and after (ex-post) an action is taken. Its application to any natural environment category is limited by the availability of the necessary data on economic value of the affected environmental good or service.
CEA is a decision support method which relates the costs of alternative ways of producing the same or similar outcomes to a measure of those resulting outcomes. Notably CEA is equivalent to one dimension of CBA in that it can answer the question of the most efficient way of achieving a given objective. However, CEA do not consider the benefits that different alternatives can provide. CEA may be employed both ex-ante and ex-post evaluation, and can potentially incorporate both economic and deliberative and participatory measures of value for quantifying both costs and effectiveness. Where effectiveness is expressed in a mixture of monetary and other units, comparisons can be made if scoring and weighting are applied which could be gathered through deliberative and participatory approaches. CEA may also form part of a ranking exercise in MCA.
MCA is a term covering a variety of methods which involve: (i) developing a set of criteria for comparing options; (ii) evaluating the performance of each of the options against each criterion; (iii) weighting each criterion according to its relative importance; and (iv) aggregating across options to produce an overall assessment. Most methods involve some form of averaging weights or evaluations across individuals and use deliberative and participatory approaches, though monetary expressions from economic valuation methods can also be used within an MCA. Some extensions (multi-criteria mapping, stakeholder decision analysis, most recently deliberative mapping) incorporate MCA within a wider deliberative process, aiming to overcome some of the shortcomings of MCA by harnessing its strengths to enhance stakeholder discussions.
LCA is an analytical method that assesses the impacts to the environment, natural resources and human health (e.g., quantity of resources extracted and emissions) associated with all life stages of a products (i.e., from raw material extraction through materials processing, manufacture, distribution, use, repair and maintenance, and disposal or recycling) (Wrisberg and al., 1997). The intention of LCA is to provide a numerical basis for comparison between alternative methods of achieving a specific function or service. In general LCA is a site and time-independent tool with no consideration given to when and where emissions take place. However more recent applications seek to introduce site dependent factors that reflect types of environments and output situations (e.g., Finnveden and Nilsson, 2005).

25
In continuation MCA and CBA are presented, which are the most commonly applied decision support methods for the evaluation of forest and environmental management projects (Myllyviita and al. 2011). In addition, considering the context, the limited resources and time of the project, they are considered as the most suitable.
4.1 MULTI-CRITERIA ANALYSIS Multi-criteria analysis (MCA) is a decision support method that can be used to evaluate different alternatives. These alternatives may be very broad (e.g. different policy options) or concrete cases of applied instruments. Applying MCA helps to compare alternatives according to their performance with regard to a selected set of evaluation criteria. These performances are presented in a so called performance matrix, or consequence table. In this matrix each column represents an alternative (case) and each row describes the performance of the alternative against each criterion (see Box 4.1 p 33). In a basic form of MCA this performance matrix may be the final product and each user can use this matrix to make his own judgement (for details see: DTLR multi-criteria analysis manual1 or EuropeAid multi-criteria analysis guidelines2).
MCA is the method of choice in forest resource planning when:
• There is a need to structure a complex decision problem; • The problems are multi-objective or have multiple criteria to be considered; • There are heterogeneous sets of criteria involved; • There are conflicting objectives involved; • Different management alternatives are to be compared; • There is need for a more rational, transparent, and comprehensive analysis (e.g., in public participation); • There are qualitative and quantitative data at different scales included in the decision model.
More sophisticated MCA techniques convert the information given by the performance matrix into consistent numerical values. Usually this conversion is done by the process of scoring and weighting, and the application of mathematical routines where the estimated scores and weights are combined into overall scores for each alternative.
4.1.1 Step of a multi-criteria analysis The main steps of a MCA are the following:
Step 1: Establish the aims of the MCA, the decision makers and other stakeholders
Before starting the MCA, it is crucial to clearly define the objective of the MCA (why it is done) and to define who should be involved in the MCA process (e.g. decision makers and other stakeholders).
Step 2: Identify alternatives
After the objectives and the stakeholders are identified, the alternatives (e.g. alternative management approaches) to be evaluated should be listed.
Step 3: Define the criteria (and the corresponding objectives) that reflect the relevant consequences of each option
In this step the evaluation criteria are defined. The criteria are measures of performance applied to evaluate the alternatives. To evaluate forest management regimes and alternatives in regards to their specific benefits and to sustainability in general has led to the use of criteria and indicators (C&I) (Prabhu and al., 1996; Van Bueren and Blom, 1997).
According to Prabhu and al. (1999), a criterion is a principle or standard that an issue is judged by, and an indicator is defined as any variable or component of the forest ecosystem used to infer the status of a particular criterion. C&I approaches appear to be highly capable of measuring aspects of sustainable forest management (SFM) at regional, national and forest management unit levels. An additional strength of a C&I approach is that it can be used to collect and report information within a system (e.g., SFM), which is usually characterized by a lack of knowledge, uncertainties, and missing information about impacts, dependencies, and feedbacks (Rametsteiner, 2001; Brang and al., 2002). The power of C&I is limited when (i) there are unclear definitions involved, (ii) there is lack of reliability, (iii) there are no target or threshold values provided, or (iv) a C&I system too strongly simplifies a complex item (Brang and al., 2002).
For example, the ForestEurope process (Forest Europe, 2013) developed a set of C&I for SFM, which can be used to facilitate the evaluation of progress towards it, both at regional and national level. These C&I are:
• Maintenance and appropriate enhancement of forest resources and their contribution to global carbon cycles;
1 http://www.communities.gov.uk/documents/corporate/pdf/146868.pdf 2 http://ec.europa.eu/europeaid/evaluation/methodology/examples/too_cri_res_fr.pdf
26
Methods and tools for socio-economic assessment of goods and services provided by Mediterranean forest ecosystems
• Maintenance of health and vitality of forest ecosystems; • Maintenance and encouragement of productive functions of forests (wood and non-wood); • Maintenance, conservation and appropriate enhancement of biological diversity in forest ecosystems; • Maintenance, conservation and appropriate enhancement of protective functions in forest management (notably soil
and water); • Maintenance of other socio-economic functions and conditions.
However, the choice of an alternative can be made also against other criteria, which are not directly related to SFM, like:
• Effectiveness refers to the success of a management alternative in achieving certain objectives (i.e. improved provision of non-market forest service). The effectiveness of a management alternative must be judged against these predefined objectives.
• Economic efficiency. Ideally, a management alternative should be designed so as to be able to achieve the optimal allocation of resources, which in practice often means the ability to achieve a chosen objective at the lowest cost. Attention should be paid both to the direct costs (e.g. management costs) and the indirect cost in terms of opportunities forgone.
• Implementation complexity refers to the ease of designing and implementing the management, and it can be broken into two components:
- Information intensity represents how much information (e.g. data, predictive modelling skills) is necessary to design a management alternative.
- Administrative feasibility refers to the ease and cost of monitoring and enforcement. Implementation complexity is closely related to the criterion on economic efficiency, because a high administrative cost increases the total cost associated with the management approach.
• Flexibility refers to the easiness to adapt to external changes in markets, technology, knowledge, and social, political and environmental conditions.
• Political considerations affect the choice of management alternative at least as much as any other arguments about their relative merits on the abovementioned dimensions. This criterion encompasses several dimensions, such as:
- Acceptability. It is important for the target groups to accept the management alternative imposed onto them; otherwise the planned outcome of management is in danger.
- Equity. Different management alternatives have different distributive consequences for different interest groups, both within and across generation. For example, in situations where common property or open-access resources become less accessible, attention should be paid to those whose traditional rights will be affected. Equity requires that cost burden imposed by a management approach is carefully considered, both for the actors directly affected (e.g., forest owner) and for the remaining interested parties (e.g. local population, etc.).
- Concordance with institutional frameworks requires that the management is concordant with the main policy principles, such as regional forest management plan and forest policy.
Defining the criteria is a crucial part of the MCA. The selected criteria should reflect all the important characteristics of the evaluated alternatives (e.g. which characteristics would distinguish a good alternative from a bad one) and they have to be operational (e.g. is it possible to judge, in practice, how well an option performs on the selected criteria). The criteria should also facilitate the evaluation of the performance of alternatives (e.g. the efforts needed to implement and operate the management approach in a specific region). When selecting the criteria a balance must be found between the completeness of the applied criteria (considering all the important evaluation aspects) and keeping the evaluation task manageable and transparent (the complexity of the evaluation increases with the number of applied criteria). Thus not all the criteria presented in the above list have to be applied.
Once the criteria are selected and tested for completeness, redundancy, operationally, independence, double counting, number, etc., they can be grouped. The main reasons for grouping criteria are: (a) to facilitate the checking whether the selected set of criteria is appropriate, with regard to the evaluation objective; (b) to ease the process of calculating criteria weights in large applications, where it can be helpful to assess weights within groups of related criteria, but also between groups of criteria.
Step 4: Describe the performance of each alternative against the criteria in the performance matrix and determine the score matrix (scoring)
The next step is to identify how the alternatives perform with regard to the established criteria. This process is also known as scoring. However, before the scoring can be performed, all evaluated alternatives should be described, with regards to the selected criteria. These descriptions should be done in a neutral and objective way, not to influence the evaluation process.
Once this description is available, in the next sequence, the score for the performance of each of the alternatives is ascribed. Scoring is the process of judging the performance of an alternative with regards to the defined criteria. The

27
scoring is done on a selected interval scale, for example from 0 to 100, where 0 represents the lowest level of performance, and 100 the highest. However, very often also simpler and more robust scales are applied. In principle, the scoring reflects the subjective judgment of each user (or group of users) of the MCA. Thus, it is recommendable that the MCA includes several users, representing different stakeholder groups, where in the analysis scores from several users (stakeholders) can be combined or compared, in order to obtain more robust results.
Step 5: Assign weights to each of the criteria to reflect their relative importance (weighting).
The next step of the evaluation process is the weighting of the criteria. This step introduces the relative importance of the criteria, and thus adds another dimension to the evaluation process. The users involved in a MCA may not only differ in their judgement of the performance on criteria, but also in the relative importance they attach to different criteria. Therefore, weights are attached to each criterion. Since the score of an alternative (e.g. a management approach) is calculated as the weighted average of its criteria scores (see next step), the weights are crucial in the aggregation of scores (i.e. to assess the performance of a single management alternative as a whole).
Step 6: Combine the weights and scores for each of the options to derive overall values.
This step involves the calculation procedure, where the performance scores for each criterion are combined with the respective importance weights. The general equation is:
𝑆𝑖 = 𝑤1𝑠𝑖1 + 𝑤2𝑠𝑖2 + ⋯+ 𝑤𝑛𝑠𝑖𝑛 = �𝑤𝑗𝑠𝑖𝑗
𝑛
𝑗=1
where sij is the performance score for alternative i on criterion j, wj is the weight for criterion j and Si is the overall score for alternative i.
The example in Box 4.1 illustrates how the weights of the criteria are transformed into relative weights, which sum up to 1. Therefore the user can apply any set of indicators/numbers that represents the relative importance he attaches to the criteria.
Box 4.1 Example of calculation of a total score for a financing mechanism
Here, for the evaluation of alternative management approach three evaluation criteria are used. The performance of each criterion can be scored with -1, 0 and +1, while the weights ascribed to the criterion can range between 0 and 2. Further the example assumes that three users were performing the scoring, ascribing the following scores and weights:
Alternative 1 Person 1 Person 2 Person 3 Score Weight Score Weight Score Weight
Criterion A +1 1 0 1 +1 1 Criterion B 0 1 +1 1 -1 0 Criterion C -1 1 0 2 +1 1 Total score 0 0,25 1
To calculate the total score per user, the procedure is to multiply the score of a criterion by the weight of that criterion. Then the products for all criteria are summed and divided by the sum of the weights to obtain the total score for that criterion.
For person 1 all criteria are equally important, so all weights are equal to 1 and so the score of the criterion is equal to 1 x 1 + 0 x 1 + (- 1) x 1 = 0 / 3 = 0.
For person 2 criterion C is twice as important as the other criteria. The score of the total score equals 0 x 1 + 1 x 1 + (0) x2 = 1 / 4 = 0.25
Person 3, judges criterion 3 to be three times as important as both other sub-criteria, the score of the criterion equals 1 x 1 + 0 x (-1) + 1 x1 =-2/2 =1
Step 7: Analyse the results
The analysis of the results and comparison between alternatives can be done by comparing the overall scores or by comparing scores on single criterion. Finally, based on the obtained results, recommendations can be made regarding which alternative would be the best (overall) or which performs best on a single criterion.

28
Methods and tools for socio-economic assessment of goods and services provided by Mediterranean forest ecosystems
4.1.2 Strengths and weaknesses of multi-criteria analysis Strengths of multi-criteria analysis:
• Enables taking into account project impacts that are not easily given monetary values. • Facilitates stakeholder involvement. • Makes the appraisal and decision-making process more transparent.
Weaknesses of multi-criteria analysis:
• No built-in standard value, as it applies project specific values (criteria and weights). • Comparisons between studies with different valuation criteria and weights are very limited. • Requires well developed participation processes and strongly depends on stakeholder willingness to participate.
4.1.3 Example of multi-criteria analysis application Espelta and al (2003) have analysed different types of vegetation clearing (mechanical, controlled burning or grazing), soil preparation (ripping or planting holes) and reforestation methods (broadcast seeding, spot seeding and planting) to restore black pine (Pinus nigra) forests. They compared these practices in terms of seedling establishment, but also in the light of their economic costs and ecological impact, through a MCA. This study was carried out in the regions of Bages and Berguedà in Catalonia (north-east of Spain) on three burnt sites. On each of the sites they tested four different vegetation clearing treatments (livestock grazing, controlled burning, mechanical clearing and no vegetation clearing), two reforestation methodologies (planting, sowing), and two soil preparation methods (ripping and planting holes). Different combinations of the above treatments were applied.
To evaluate treatment combinations (alternative), five criteria were used:
• Financial cost: monetary cost of the different combinations of vegetation clearing and soil preparation methods conducted;
• Survival of black pine seedlings: density of black pine seedlings surviving at the end of the experiment; • Height growth of black pine seedlings: absolute mean height growth of black pine seedlings between the start and
the end of the experiment; • Density of small mammals: computed as the difference between the abundance of small mammals captured per plot
at the beginning and at the end of the 2 years study; • Diversity of small mammals: computed as the difference in the Shannon diversity index of the community of small
mammals at the beginning and at the end of the 2 years study.
Table 4.1 Alternative-criteria matrix used to compare the different reforestation methods
Treatment combination*
Criteria G+R G+P B+R B+P M+R M+P C+R C+P Financial cost 1020 1500 1200 1680 1320 1800 1020 1500 Survival of black pine 560 630 644 490 798 434 602 728 Height growth of black pine 7 8 6 7 7 9 7 8 Diversity of small mammals** ±Good ±Good ±Bad ±Bad Bad Bad ±Good ±Good Density of small mammals** Good Good ±Bad ±Bad Moderate Moderate Good Good *Treatments: G - livestock grazing; B - controlled burning; M - mechanical clearing; C - control; R – ripping; P - planting holes. ** The density and diversity of small mammals, was estimated on a 9 degrees scale (ranging from perfect to extremely bad). The sign ± indicates “more or less”. Source: Espelta and al., (2003)
Based on the performance (Table 4.1), the treatment alternatives were ranked (Figure 4.1) according (A) financial cost, survival and height growth of black pine seedlings and (B) adding the impact on the diversity and density of the community of small mammals.

29
Figure 4.1 Ranking of alternatives
Note: Left values, ranking based on the better and much better relations (values range from 0 to 1, indicating how an alternative is better than the rest). Right numbers, ranking based on the worse and much worse relations (values range from 0 to 1, indicating how an alternative is worse than the rest).
The results show that seedling establishment after sowing was very poor and not influenced by vegetation clearing. In plantations, seedling survival was higher in the ripper treatment than in planting holes for all vegetation clearing treatments except the control one. Nevertheless, the higher economic cost of the planting holes treatment and the negative impact of mechanical clearing and burning on the community of small mammals made the stated differences in seedling survival irrelevant. Thus, the MCA revealed that the two most preferred options were planting in un-cleared or lightly grazed areas with soil preparation through ripping.
4.2 COST BENEFIT ANALYSIS (CBA) Cost-benefit analysis (CBA) is a technique for the assessment of the relative desirability of competing alternatives (events, project, management or policy measures). The assessment involves the comparison of the current (base case) situation to one or more alternatives considering the differences between the base case and the alternatives. For example, to evaluate the impact of the application of thinning on the output of forest goods and services in a particular forest, the base case (without thinning) would be compared to the alternative scenario (with thinning). The analysis would focus on the differences in costs and benefits, in the situations with and without the management measure. The CBA compares the costs and benefits measured in monetary terms.
The cost-benefit analysis can be conducted from different perspectives (Figure 4.2). Private CBA considers only those costs and benefits from the analysed alternative, which are imposed onto or accrue to a private agent (e.g. individual or firm). Thus, it also considers transfer payments (e.g., subsidies, taxes), which the private agent receives or pays to the administration. This variety of CBA is also often called financial appraisal.
Social CBA in turn attempts to assess the overall impact of an alternative on the welfare of the society as a whole, rather than of the agent that implements the project. Social analysis differs from the private analysis in terms of (i) the breadth of the identification and evaluation of inputs and outputs, and (ii) the measure of costs and benefits. Social CBA considers the costs and benefits which accrue to the society as a whole. Social costs and benefits usually differ from private ones because of the existing market imperfections, which may take the form of:
• Imperfect competition in the market (e.g. monopoly power); • Government intervention in the market (e.g. taxes, subsidies, price regulation); • Externalities3 and public goods.
Furthermore, a social CBA does not consider transfer payments, like subsidies or taxes, as they are both benefit and cost. For example, a subsidy is a benefit for the forest owner, but at the same time is a cost for the tax payers. Thus, from the social point of view it is a neutral transfer between two agents, which does not affect the overall well-being of the society.
3 An externality is defined as an unintended action caused by an economic agent that influences the utility of another agent (external) without being fully or
directly reflected by market prices (Merlo and Croitoru 2005).
0.49 Control + Ripping 0.04
0.58 Mechanical + Ripping 0.14
51 Control + Ripping 0.02
0.31 Mechanical + Ripping 0.28
0.46 Burning + Ripping 0.11
0.39 Grazing+ Ripping 0.16
0.21 Grazing + Holes 0.26
0.21 Control + Holes 0.26
0.02 Burning + Holes 0.69
0.00 Mechanical + Holes 0.78 0.00 Mechanical + Holes 0.65
0.01 Burning + Holes 0.61
0.26 Burning + Ripping 0.33
0.30 Grazing + Holes 0.15
0.32 Control + Holes 0.15
0.47 Grazing + Ripping 0.09
(A) (B)

30
Methods and tools for socio-economic assessment of goods and services provided by Mediterranean forest ecosystems
Figure 4.2 Different perspectives on the cost-benefit analysis
Ideally, social CBA should take into account all the impacts of the analysed alternative, including those that are difficult to measure (e.g. usually related to environmental externalities).
4.2.1 Step of a cost-benefit analysis The implementation of a CBA follows a set of steps:
Step 1: Event, project or policy definition
A first step in establishing a framework for the analysis is to describe the event, project or policy in sufficient detail in order to be able to determine the relevant benefits and costs. To accomplish this at least the following should be defined:
• Event, project or policy: that should clearly state what is the issue at hand, which problem(s) might occur due to an event or which problems the project seeks to mitigate, what goal(s) it addresses, what – if anything – will be done, where, when, how and by whom. The nature of the problem or goal will determine its intended benefits and recipients. The unintended effects and the affected parties should also be identified, even if these effects may be left out of the CBA.
• Purpose of the CBA: Identifying the purpose of the analysis helps to define the level of detail appropriate for the study. A set of questions should be answered: will the analysis be used to determine if a project should be undertaken? Will it be used to determine which of a group of projects should be selected or which should have highest priority? Will it be used to define the impact of an event?
• Base case and the alternatives: the base case is the situation that will prevail if the event does not occur or the project is not undertaken or if the policy is not implemented. The proposed alternatives correspond to specific events that might happen or actions that can be undertaken.
• Time horizon: it starts with the first project expenditures, and extends through the useful life of the project or its most long-lived alternative, or some future time at which meaningful estimates of effects are no longer possible. The costs and benefits are compared and evaluated for this time horizon. The general principles for selecting the time horizon are:
- It should be long enough to capture the majority of costs and benefits; - It should be consistent with the time horizon used for other analyses being undertaken for the event -
project; - It should be consistent for all alternatives; - All benefits and costs occurring or accruing over this time horizon should be included in the analysis.
Step 2: Identification of relevant project impacts
Once the event, project or policy is defined, the next step is to identify the impacts of its occurrence or implementation. Both tangible and intangible impacts should be recognized. First, the resources used in the implementation of the project should be specified (e.g. labour, raw materials, etc.). Second, the effects of the project on market prices and output levels
Direct costs and benefits
Adjustment for imperfect
competition and other distortions
Assessment of environmental
impacts
Private CBA
Social CBA(without environmental
impacts)
Social CBA(with environmental
impacts)
Incl. transfer payments
Excl. transfer payments

31
of the marketed goods or services in focus, the local employment levels, market prices of related goods and services, as well as the impacts on the surrounding environment should be identified.
The positive impacts – called benefits – refer to the increases in the quantity or quality of goods or services that generate positive utility or a reduction in the price at which they are supplied. The negative impacts – called costs – stand for any decreases in the quality or quantity of such goods or services, or increases in their price. The negative impacts also include the usage of resources (inputs in production) in the project, since they cannot be simultaneously used in any other.
The cost-benefit and cost-efficiency analyses are based on incremental benefits and costs. An important concept in this respect is additionality, which refers to the net impacts of the project (Hanley and Spash, 1993). This means that the costs of the project that are relevant for the assessment are those that would be incurred if the project were undertaken, but that would not be incurred otherwise.
The opportunity cost of the project measures the best alternative option forgone as a result of undertaking the project. Similarly, the benefit of the project is the extra amount of a good (e.g. money, time, etc.) that would be gained if the project were undertaken rather than not undertaken (Sugden and Williams, 1978).
Whenever the implementation of a certain project has an impact on the environment representing positive or negative externalities, these external effects must be taken into consideration in the process of project evaluation. Typical environmental effects are associated with air quality, climate changes, water quality, soil and groundwater quality, biodiversity and landscape degradation and other natural risks.
The impacts of a proposed project may be unevenly distributed across different individuals and population groups, as well as across different geographical regions affected by the project. If distributional effects are to be considered in CBA, the costs and benefits for different groups of agents must be determined in order to identify the winners and the losers of the proposed project.
Step 3: Physical quantification of relevant impacts
This stage involves determining the physical amounts of cost and benefit flows for a project (e.g. in man-days of labour, tons of CO2, etc.), and identifying when in time they will occur. For example, if considering the benefits and costs of improved forest management, which would result in increased wood production. The annual increment of wood (e.g., m3/ha) would be estimated before the improved management and afterwards. Furthermore, the time (e.g., years) it will take that this improved wood production is achieved need to be estimated.
Step 4: Monetary valuation of relevant impacts
In order for physical measures of impacts to be comparable, they must be valued in common units (e.g. euro). The CBA values all the costs and the benefits in monetary units. The general principle of monetary valuation in CBA is to value impacts in terms of their marginal social cost or marginal social benefit.
The marginal social cost measures the opportunity cost of producing a good or service, while the marginal social benefit represents the marginal willingness to pay (WTP) of the consumers for that good or service. Market prices, under certain conditions, can contain correct information about the social costs and social benefits. However, in many cases prices do not adequately reflect the true value of a good and a service to society.
Market power, externalities, taxes or subsidies can distort market prices. Whenever such distortions occur, shadow prices are used as estimates of marginal social costs and benefits to reflect the true value of a good or service.
In some instances, market prices do not exist for relevant impacts. This is the case of many environmental externalities, such as landscape quality, air quality or biodiversity. In this case valuation techniques must be used in order to estimate the WTP for changes in the quantity of these externalities. The main valuation techniques are further presented in the chapter 5 of this report.
Step 5: Discounting of costs and benefits
Once all the relevant costs and benefits are expressed in monetary terms, it is necessary to convert them into a common metric, their present value. This process is called discounting and it is based on the fact that the individuals have time preferences between consumption in different periods. According to this assumption, an individual is not necessarily indifferent between receiving 100 € today and receiving the same 100 € in ten years. This is true even if there is no inflation, because 100 € today can be used productively in the consequent ten years, producing a value greater than the initial 100 €. The rate at which an individual is willing to exchange the present consumption for the future consumption is called the discount rate. The higher is the discount rate, the greater preference is given to the present consumption.
The present value (PV) of a cost or a benefit X received in time t given the discount rate r is calculated as follows:
( )( )t
t
r
XrXXPV
+=+= −
11)(

32
Methods and tools for socio-economic assessment of goods and services provided by Mediterranean forest ecosystems
Discounting can be done in two ways, where both approaches should give identical answers:
• By computing the net value of benefits minus costs for each time period (e.g. each year), and discounting each of these annual net benefit flows through the lifespan of the project;
• By calculating discounted values for each element of the project (costs and benefits), and then summing the discounted elements.
The discount rate used in social CBA is the social discount rate (see Box 4.2), which attempts to reflect the social view on how future benefits and costs should be valued against present ones. This discount rate usually differs from the discount rate used in private CBA (financial appraisal), because of the imperfections in the capital markets.
Theoretical literature and international practice list different approaches in choosing the value of the social discount rate to be adopted. However, the most common solution is to use the market interest rate. Long-term borrowing rate of the government and the pre-tax rate of return to private capital are often used as proxies for the social discount rate (Nas, 1996).
Box 4.2 Social discount rate
The theoretical literature distinguishes several approaches for interpreting and choosing the value of the social discount rate. The aim of this report it is not to summarize the academic debate on this topic, but to provide a brief introduction of the main concepts used in the estimation of the social discount rate.
Social time preference rate (STPR)
STPR measures the society’s preferences between consumption in one period and consumption in another. The approximated formula for the STPR, r, based on Ramsey (1928) is:
r = ng + p,
where p is the rate of pure inter-temporal preference (utility discount rate), n is the elasticity of marginal utility of consumption, and g is the growth rate of per capita real consumption. In most European countries the rate of pure inter-temporal preference is about 1%, the growth rate is around 2% and the elasticity of marginal utility of consumption is between 1 and 2 (EC, 2002). This implies that the STPR is in the range of 3%-5%.
Opportunity cost of capital
The opportunity cost of capital measures the value of the input in the best possible alternative use. When capital is invested in a particular project, the opportunity cost of capital accounts for the loss of income from an alternative project. The empirical estimation of the relevant opportunity cost of capital depends on the project, country and time. According to some authors, the social discount rate is lower than the market return on capital due to taxation (Hanley and Spash, 1993). Others propose that the marginal public investment should have the same return as the private one (EC, 2002). The European Commission suggests the rate of 5% as the lower end of the opportunity cost of capital for private investors (EC, 2002).
Source : Hanley et Spash, 1993 ; CE 2002
For project appraisal different countries suggest discount rates between 3 and 5% (Table 4.2). For example, the European Commission suggests using a 5% social discount rate in the case of European member states (EC, 2002). This is a compromise figure based on the market interest rate, cost of capital and social time preference considerations (see Box 4.2). Table 4.2 International real discount rates for cost-benefit analysis
Region/Country Agency Discount rate (%) European Union European Commission 5.0 France Commissariat général à la stratégie et à la prospective 4.0 Germany Federal Finance Ministry 4.0 Italy Central Guidance to Regional Authorities 5.0 Norway 3.5 The Netherlands Ministry of Finance 4.0 United Kingdom HM Treasury 3.5 Source: Snowdon and Harou, 2012

33
World Bank and EBRD adopt 10% economic rate of return (EC, 2002), which is usually considered as a high cut-off rate and is usually justified by considering development oriented cases. However, in this case the future benefits, are considered as less important (e.g., decreasing the importance of benefits for the next generations).
Thus, when evaluating long term projects (30 years and longer) it is suggested to apply declining discount rates (Table 4.3). The lower discount rates over the long term increases net present values (NPV) of projects that provide net benefits far into the future (i.e. the lower the discount rate the higher the current value of benefits (and costs) encountered in the future). Therefore, it is likely that NPVs of forestry projects will often be higher when long-term declining discount rates are applied. Table 4.3 The declining long term discount rate
Period (Years) 0-30 31-75 76-125 126-200 201-300 301+ Discount rate (%) 3.5 3.0 2.5 2.0 1.5 1.0 Source: Snowdon and Harou, 2012
The choice of discount rate has a critical impact on the analysis. The reason is that with discount rates, the more distant the costs and the closer the benefits are in time, the better a project will be evaluated. And this effect gets more and more pronounced with higher discount rates. Figure 4.3 demonstrates the impact of a discount rate on present value estimates. When evaluating alternative projects, a sensitivity analysis using a range of discount rates is typically used to determine the importance of the discount rate in the relative performance of the projects. Figure 4.3 The present value of 10,000 € received at different years with different discount rates r.
Step 6: Calculating the CBA performance indicators
The main performance indicators for the cost-benefit analysis are:
• The net present value; • The internal rate of return; • The benefit-cost ratio; • The payback period.
The most appropriate performance indicator (or criteria) to use in project appraisal usually depends on the circumstances. In this sub-chapter the use of these indicators in the evaluation of alternatives is explained.
Net present value
The net present value (NPV) of a project is defined as:
( ) ( ) ( )∑∑∑=== +
−+
=+
=T
tt
tT
tt
tT
tt
t
d
C
d
B
d
SSNPV
000 111)(
where St is the net benefit of the project at time t, d is the discount rate and T is the time frame (the last year of the project). The net benefit of the project is the difference between the benefits (Bt) and costs (Ct) associated with the studied alternative.
0
2 000
4 000
6 000
8 000
10 000
0 5 10 15 20 25 30 35 40
EURO
Year
r=1%
r=3%
r=5%
r=10%

34
Methods and tools for socio-economic assessment of goods and services provided by Mediterranean forest ecosystems
The net present value is a simple indicator which is useful both for identifying beneficial projects and for selecting the best project out of several alternatives. A project is accepted whenever NPV > 0, because its benefits outweigh the costs. The greater the NPV, the more desirable is the project. Therefore, alternative projects can be ranked on the basis of their net present values.
When dealing with investment projects, in which early costs are followed by later returns, the negative values in the first years are weighted more heavily than the positive ones in the last years. The opposite happens when a disinvestment project is in question. This implies that the choice of the time frame (T) and the discount rate (d) are crucial for the determination of the NPV.
Internal rate of return
The internal rate of return (IRR) is defined as the critical value of the interest rate at which the project has a net present value of zero, in other words, when all costs are equal to all benefits when discounted by that rate.
( ) 010
=+
= ∑=
T
tt
t
IRR
SIRR
IRR is usually expressed as a percentage. The calculation of the IRR does not require the identification of the discount rate. However, it should be remembered that any project that has relatively large positive net flows in early stages will generate a relatively large IRR. Thus, IRR tends to favour short-term investments (Klemperer, 1996).
When dealing with investment projects, the interpretation of the IRR is straightforward. The project is acceptable if and only if the IRR is greater than the actual value of the interest rate. For disinvestment projects – projects where early returns are followed by later costs – the interpretation of IRR is different. In this case IRR is interpreted as the lowest value of the interest rate that would justify undertaking the project. Thus, the project should be undertaken if IRR is lower than the true value of the interest rate.
IRR is based on the assumption that the cost-benefit flows are reinvested at the internal rate of return. When examining mutually exclusive projects, IRR may yield results that are inconsistent with the ranking based on the NPV criterion. In addition, IRR is not an appropriate criterion to be used when capital rationing exists4.
Benefit-cost ratio
The benefit-cost ratio (BCR) is the relation between the discounted benefits and the discounted costs:
( ) ( )∑∑== ++
=T
tt
tT
tt
t
d
C
d
BBCR
00 11
If BCR > 1, then the discounted benefits outweigh the discounted costs, meaning the project results in net gains for the society. The higher the BCR, the greater are the benefits in proportion to the costs. However, the BCR is insensitive to the magnitude of net benefits and, therefore, may favour projects with smaller costs and benefits over those with higher net benefits.
Payback period
Payback period indicates how long it takes for the accumulated benefits to exceed the accumulated costs. In order to determine the payback period, the costs and benefits should be discounted, and then the accumulated costs and accumulated benefits should be calculated for each year. The first year in which the accumulated benefits exceed the accumulated costs is the so-called payback period.
If all other indicators/criteria are equal, the better investment is the one with the shorter payback period. For example, if a project costs 100,000 € and is expected to return 20,000 € annually, the payback period will be five years (100,000 €/20,000 €).
Step 7: Performing sensitivity analysis
Sensitivity analysis is a method for examining how the outcome of the CBA changes with variations in inputs, assumptions or the setup of the analysis. Typically, the sensitivity analysis should be performed when the following parameters change (Hanley and Spash, 1993):
• The discount rate; • Physical quantities and qualities of inputs and outputs; • Shadow prices of these inputs and outputs;
4 Capital rationing refers to the situation when a fixed capital budget exists and cannot be exceeded.

35
• Life span of the project.
The purpose of the sensitivity analysis is to determine the critical variables and parameters from the model, that is, those to which the NPV outcome is most sensitive.
Sensitivity analysis can be performed either on a variable-by-variable basis or by changing groups of variables at the same time using scenario analysis. Below, a brief overview of how these analyses can be used in the CBA is presented, as well as the advantages and disadvantages of sensitivity analysis are discussed.
Variable-by-variable analysis
This approach attempts to isolate the effect of a change in one variable on the performance indicators of the CBA (e.g. NPV, BCR, etc.). It is performed in four steps.
1. All important factors affecting the cost-benefit flows should be listed. 2. For each factor, a range of possible values should be defined. For example, the estimates for each factor could be
prepared under “best-case (optimistic)”, “most likely”, or “worst-case (pessimistic)” scenarios. In practice, these values are usually based on past experience with similar project evaluations or expert opinion. Moreover, the range is sometimes expressed as one or two standard deviations from a mean (or an expected value).
3. For each value of each factor the relevant performance indicators should be calculated holding the values of all the other factors unchanged.
4. The resulting performance indicators should be examined to determine the degree of overall variation and which factor or factors is/are most responsible for variation in the estimates.
Scenario analysis
Scenario analysis relies on the assumption that factors affecting cost-benefit flows do not operate independently of one another as it is assumed in the variable-by-variable approach. In scenario analysis, the potential future states of the world are divided into best, worst and most likely scenarios. The best case scenario is based on the lowest estimate for costs and the most optimistic estimates for benefits. The worst case scenario is based upon the most pessimistic estimates of costs and benefits.
Advantages and disadvantages of sensitivity analysis
Sensitivity analysis has several advantages. First, it is relatively easy to compute the necessary information required for each approach. Moreover, in many cases the analysis can be based on the range of values around the most likely case, without the need to undertake a great deal of work. Second, sensitivity analysis provides additional information for the decision-making. Particularly, it provides an insight on the impact and importance of uncertainty for the CBA. Finally, the potential interaction of factors is revealed when scenario analysis is employed.
The main disadvantage is related to the accuracy of information upon which the values that correspond to variations in key factors are determined. The methods determining pessimistic, optimistic and most likely estimates are in many cases subjective. Second, the lack of a systematic method for determining the appropriate combination of factors used to define given scenarios limits the reliability of sensitivity analysis. Finally, while the variable-by-variable approach fails to account for factor interaction, the scenario approach usually only includes a small number of potential scenarios.
4.2.2 Strengths and weaknesses of the cost benefit analysis Strengths of the cost benefit analysis:
• Based on well-understood theoretical foundations. • Has a built-in standard for value (in monetary terms). • Only includes benefits that are corresponding to beneficiaries, which actually value the impact. • Because all CBA studies share a common methodology, lessons learned in one study can be easy transferred to
other studies. • Better adopted to be used in benefit transfer - to estimate benefits in one situation by extrapolation or interpolation
from previous studies of similar situations.
Weaknesses of the cost benefit analysis:
• Limited only to impacts that can be measured in monetary terms. • Strong influence on the results of the selected CBA parameters (e.g., discount rate, project duration, costs and
benefits considered)
4.2.3 Example of CBA application In this chapter an example is presented to demonstrate the application of CBA to project evaluation. This example is drawn from Mavsar (2012).

36
Methods and tools for socio-economic assessment of goods and services provided by Mediterranean forest ecosystems
The purpose of the CBA analysis was to analyse the social benefits of an afforestation project in the Mediterranean part of Spain. The afforestation was conducted on abandoned agricultural land and it was expected to have the following impacts:
• Positive impacts (benefits):
- Increased forest area; - Increased carbon sequestration; - Increased diversity of plant species; - Recreation access.
• Negative impacts (costs):
- Initial investment; - Increased maintenance costs.
Three different afforestation scenarios were developed (Table 4.4), differing in the size of the afforestation area, number of additional plant species in the region, recreational access and the quantity of additionally sequestered CO2. Table 4.4 Summary of afforestation scenarios
Benefit Alternative 1 Alternative 2 Alternative 3
Forest area + 5% (140,000 ha)
+ 15% (420,000 ha)
+ 25% (700,000 ha)
Number of additional plant species +40 +90 +140
Recreation access No Yes Yes
Quantity of additionaly sequestrated CO2 +9,320 t CO2 +18,640 t CO2 +27,960 t CO2 Source: Mavsar 2012
For each of the benefits the marginal value have been estimated (i.e., the value of an additional unit of that good or service). These values were obtained in a choice experiment valuation study, where respondents were asked to express their preferences regarding afforestation projects and the output of different forest goods and services (Mavsar 2012). The choice experiment was conducted on the whole territory of Spain and a total of 800 respondents were intervied. The results (marginal values for the benefits) of the choice experiment are presented in Table 4.5. Table 4.5 Marginal values of afforestation benefits
Benefit Unit Marginal Value (€/year/person)
Forest area Ha 9.58
Plant Species 0.65
Recreation Having access 38.60
CO2 t CO2 0.0053
To conduct the CBA, the following assumptions were adopted:
• The afforestation is conducted in initial year (year 0). The average afforestation costs for were assumed to be 10,669€/ha. The afforestation cost were based on the data used for Spain by the European Commission in the frame of the rural development policy 2007-2013 (EU, 2005).
• The initial investment is made in year 0, while every five years there are maintenance costs to bear, which are 5% of the initial investment.
• The benefits will be obtained only 25 years after the afforestation. This was based on the assumption that a young forest will not be able to provide all the benefits (e.g., carbon sequestration level) as a middle aged or mature forest.
• The project duration was limited to 46 years, which is considered as a normal rotation period in Meditarranean pine forests in Spain (Palahi and al., 2007).
• The discount rate was 3% (see Box 4.2).
The detailed calculation results are given in table 4.6. For this example, the calculation for the Alternative 3 is only presented. Table 4.6 Cost benefit analysis for Alternative 3

37
Year Cost (in €)
Net present value of cost (in €)
Benefit (in €)
Net present value of benefit (in €)
Net present value (in €)
0 10,688.8 10,688.8 0.0 0.0 -10,688.8 1 0.0 0.0 0.0 0.0 -10,688.8 2 0.0 0.0 0.0 0.0 -10,688.8 3 0.0 0.0 0.0 0.0 -10,688.8 4 0.0 0.0 0.0 0.0 -10,688.8 5 534.4 461.0 0.0 0.0 -11,149.8 6 0.0 0.0 0.0 0.0 -11,149.8 7 0.0 0.0 0.0 0.0 -11,149.8 8 0.0 0.0 0.0 0.0 -11,149.8 9 0.0 0.0 0.0 0.0 -11,149.8
10 534.4 397.7 0.0 0.0 -11,547.4 11 0.0 0.0 0.0 0.0 -11,547.4 12 0.0 0.0 0.0 0.0 -11,547.4 13 0.0 0.0 0.0 0.0 -11,547.4 14 0.0 0.0 0.0 0.0 -11,547.4 15 534.4 343.0 0.0 0.0 -11,890.5 16 0.0 0.0 0.0 0.0 -11,890.5 17 0.0 0.0 0.0 0.0 -11,890.5 18 0.0 0.0 0.0 0.0 -11,890.5 19 0.0 0.0 0.0 0.0 -11,890.5 20 534.4 295.9 0.0 0.0 -12,186.4 21 0.0 0.0 0.0 0.0 -12,186.4 22 0.0 0.0 0.0 0.0 -12,186.4 23 0.0 0.0 0.0 0.0 -12,186.4 24 0.0 0.0 0.0 0.0 -12,186.4 25 534.4 255.3 17,597.6 8404.7 -4036.9 26 0.0 0.0 17,597.6 8159.9 4123.0 27 0.0 0.0 17,597.6 7922.3 12,045.3 28 0.0 0.0 17,597.6 7691.5 19,736.8 29 0.0 0.0 17,597.6 7467.5 27,204.3 30 534.4 220.2 17,597.6 7250.0 34,234.1 31 0.0 0.0 17,597.6 7038.8 41,273.0 32 0.0 0.0 17,597.6 6833.8 48,106.8 33 0.0 0.0 17,597.6 6634.8 54,741.5 34 0.0 0.0 17,597.6 6441.5 61,183.1 35 534.4 189.9 17,597.6 6253.9 67,247.0 36 0.0 0.0 17,597.6 6071.8 73,318.8 37 0.0 0.0 17,597.6 5894.9 79,213.7 38 0.0 0.0 17,597.6 5723.2 84,936.9 39 0.0 0.0 17,597.6 5556.5 90,493.4 40 534.4 163.8 17,597.6 5394.7 95,724.3 41 0.0 0.0 17,597.6 5237.5 100,961.8 42 0.0 0.0 17,597.6 5085.0 106,046.8 43 0.0 0.0 17,597.6 4936.9 110,983.7 44 0.0 0.0 17,597.6 4793.1 115,776.8 45 534.4 141.3 17,597.6 4653.5 120,289.0
The estimated CBA indicators are provided in table 4.7. The NPV for all three alternatives are positive. However, when applying different discount rates (i.e., 1%, 3% and 5%) the performance indicators change significantly. Also when using the highest discount rate all alternatives have a positive NPV and a BCR greater than 1. From an economic perspective, and considering the used assumptions, the first afforestation programme (Alternative 1) is the best alternative which performs best regardless which indicator is considered.

38
Methods and tools for socio-economic assessment of goods and services provided by Mediterranean forest ecosystems
Table 4.7 Cost Benefit Indicators for afforestation alternatives
Indicator Alternative 1 Alternative 2 Alternative 3 Discount rate=3%
NPV 184,323 152,116 120,289 B/C ratio 15.0 12.6 10.1 IRR 7.69% 6.88% 5.88%
Discount rate=1% NPV 372,281 309,206 246,874 B/C ratio 26.7 22.4 18.1 IRR 10.23% 9.45% 8.52%
Discount rate=5% NPV 91,119 74,236 57,550 B/C ratio 8.3 7.0 5.6 IRR 5.04% 4.15% 3.02% 4.3 CBA OR MCA? The main strength of MCA is that it enables taking into account project impacts for which it is not easy to estimate monetary values. Further strengths of MCA are that it facilitates stakeholder involvement, and that it makes the appraisal and decision-making process more transparent.
However, the ability of MCA to take account of a wider range of project impacts than can CBA is a product of its much looser theoretical structure.
The main strength of CBA is that it is based on well-understood theoretical foundations. This gives CBA a high degree of internal consistency. Because all CBA studies share a common methodology, lessons learned in one study (or, indeed, in microeconomics more generally) can be easy transferred to other studies, allowing the accumulation of expertise.
It is particularly significant that CBA has a built-in standard for value. For example, benefits are measured by the maximum amount of money that beneficiaries would pay for them. Thus in a CBA any given benefit or cost is expressed in an absolute amount of money. It is not defined relative to any particular view about the objectives of the project that creates those benefits or costs. CBA only includes benefits that are corresponding to a class of beneficiaries, which actually value the impact. It is not open to the any stakeholder to stipulate that some type of impact is desirable or valuable.
In contrast, MCA has no built-in standard value. It might seem that this feature gives MCA greater flexibility. But meaningful comparisons can be made between appraisals only if they use a common standard of value. MCA applies a standard of value that is specific to a project, in two senses. First, the relative weights given to different impact categories are defined separately for each project, to reflect the particular concerns of stakeholders at the project level. Second, the system for scoring impacts uses project-specific scales. Thus, scores are not comparable across projects, only across alternative options for a given project (e.g. different levels of forest management measures at a given site). This prevents the scores from being used in choosing between projects – one of the main functions of appraisal. For the same reason, cross-project inconsistencies in decision-making are made harder to detect – a serious loss of transparency relative to CBA.
Because different CBA studies use a common standard of value, a much larger set of studies can be used to test the credibility of the findings of any particular one. As experience of CBA accumulates, it becomes possible to use benefit transfer methods (i.e. to estimate benefits in one situation by extrapolation or interpolation from previous studies of similar situations) (see also Chapter 5 section 5.3.2.3).
Nevertheless, MCA and CBA can be seen as complementary methods. For example, in cases where a broad range of different alternatives exist, MCA can help to define a narrow set of options and CBA is the used to evaluate them. Furthermore, CBA can be used to handle measurable costs and benefits while MCA deals with qualitative costs and benefits. So, the question is not that much which method is better, but rather how to combine them in a most efficient way.

39
5 Valuation methods
The objective of this chapter is to present the basic concepts related to the economic valuation of forest goods and services, and to describe the main valuation methods. The economic valuation can contribute to an improved decision making processes as it helps to understand the social preferences for the whole range of forest goods and services. The total economic value concept has been developed as a guarantee that all the benefits are considered systematically and comprehensively, without any double counting.
Economic valuation methods attempt to elicit the monetary value of a certain change in the quantity and/or quality of the environmental goods and services. The main types for these methods are revealed preference and stated preference methods. The revealed preference methods (e.g., market price and cost based methods, hedonic pricing method, travel cost method) are based on actual observed people behaviours. The stated preference methods (e.g., contingent valuation, choice modelling) are based on people responses to questions describing hypothetical markets or situations.
A specific method is the benefit transfer, which is not a valuation method, but uses (transfers) economic estimates from previous studies that have similar changes in environmental goods and services, to estimate the value of environmental changes at the valued site.
Only a few of the many benefits that Mediterranean forests provide enter formal markets, usually WFPs and some NWFPs (Daly and al., 2010). For these goods and services that are traded in formal markets, their price provides an estimation of their value and scarcity. Other forest benefits are either traded only in informal markets, as is typically the case for many NWFPs (e.g. firewood for self-consumption). Estimation of their value can be obtained through established markets for substitute products.
However, other goods and services do not enter markets at all (Merlo and Croitoru, 2005) and despite being consumed by the society or forest owners, they do not have a price that would serve as an indicator of their scarcity or to predict their demand (Sills and Abt., 2004). This mostly means that management decisions only consider the marketed goods and services, but omit non-market component of the provided benefits. Such management decisions tend to be suboptimal, as the focus is placed on the production of commodities, and may lower the provision of non-market goods and services to an extent that it results in a net social welfare loss (losses are higher than the benefits obtained by the production of these commodities) (Holmes, 2004).
To correct this situation, economists have developed a set of methods that can be applied to estimate the economic value of non-market goods and services. This chapter presents the most commonly applied methods, how they are applied, and which are their main strengths and weaknesses.
In the context of this project, economic valuation methods will provide the needed inputs (i.e., values of ecosystem goods and services) to perform the evaluation of different forest management alternatives.
5.1 INTRODUCTION TO THE CONCEPT OF TOTAL ECONOMIC VALUE Managed ecosystems are almost constantly changing as the result of natural processes and human interventions (Turner, 2000). As explained in the previous chapter, it is important to be able to assess the impact of alternative sets of management actions or strategies in order to judge their social acceptability against a range of criteria such as environmental effectiveness, economic efficiency, fairness across different stakeholder interests (including different generations), etc. (Turner, 2000).
The data required for monitoring environmental change can be classified in terms of three dimensions of value (Turner, 2000):
• Primary value possessed by ecosystems: related to the ecosystem integrity in terms of structure, composition and functioning. Both quantitative and qualitative descriptive indicators of ecosystem integrity are required because of the level of uncertainty that surrounds the scientific understanding of the functioning of complex systems.
• Socio-cultural, historical and symbolic values, which are inherent in some environmental assets: when evaluating a management action, the social welfare account should include changes in properties such as sense of identity, culture and historical significance of ecosystem components and landscapes. Compiling values data in this context is likely to be a more qualitative exercise, involving more deliberative and inclusionary interest group approaches such as consensus conferences, citizen juries and focus group interviewing.

40
Methods and tools for socio-economic assessment of goods and services provided by Mediterranean forest ecosystems
• Total economic value (TEV) assigned to ecosystem function outputs: the TEV concept links ecosystem processes and functioning with outputs of goods and services, which can be assigned monetary economic values.
This chapter focuses on the TEV and on how monetary values can be assigned to ecosystem outputs. The TEV is an anthropocentric concept that stresses values that bring benefits to human beings whether directly or indirectly (Merlo and Croitoru, 2005).
The wide range of benefits that ecosystems provide requires a coherent analytical framework. The concept of TEV has been developed as a guarantee that the benefits are considered systematically and comprehensively, without any double counting. In recent years, the TEV has been widely used to quantify the full value of the different components of ecosystems, such as forests (Merlo and Croitoru, 2005). The TEV is the sum of use values and non-use values. These two main TEV categories can be further broken down as follows:
• Use Values
- Direct use value: includes interaction with the ecosystem through consumptive use such as the harvesting of timber, or may be non-consumptive such as recreational activities.
- Indirect use value: is derived from ecosystem services, such as cleaner water to downstream users, carbon sequestration, and flood control or erosion prevention.
- Option value: considers having the option of using the resource in the future, directly or indirectly.
• Non-Use Values
- Altruistic value: is derived from the satisfaction of knowing that other people have access to benefits of the nature.
- Bequest value: arises from the interest in preserving a certain ecosystem or species for future generations. - Existence value: is derived from the knowledge of the existence of a particular ecosystem or species.
Table 5.1 shows the TEV concept applied to forest ecosystems and how it relates to their ecological features. In the past, use values were most important and their provision was the main objective of forest management. However, nowadays there is an increasing social demand for non-use values (Kramer and al., 2004). Table 5.1 TEV and several examples for forest ecosystems
TOTAL ECONOMIC VALUE (TEV)
USE VALUES NON-USE VALUES
Direct use value Indirect use value Option value Altruistic value Bequest value Existence value
Direct consumption
products
Ecosystem functions
Direct or indirect future use values
Value for the enjoyment of other people
Value for future generations
Value derived from the existence of the
resource
Timber, recreation, hunting
Water regulation, carbon sequestration
Biodiversity, preserved habitat
Recreational opportunities
enhanced for other people
Habitats, avoid irreversible changes
Endangered species
When assessing the TEV or a particular value attention should be placed on who are the beneficiaries. For example, erosion protection mainly benefits local populations, while recreational services can benefit both, local population and visitors. Therefore, understanding preferences of an individual requires an examination of the specific subset of the benefits they receive from forests and the costs they have to recur.
5.2 ECONOMIC VALUATION: PURPOSE, IMPLICATIONS AND LIMITATIONS
5.2.1 A definition of economic valuation The economic valuation is a set of techniques and methodologies that intend to measure, in monetary terms, the expected increase or decrease in welfare resulting from the use of a good or service (Romero, 1994).
The economic valuation is implicitly linked to a choice. The value then arises from the interaction between a subject and an object (e.g., environmental good or service) as an expression of individual’s preferences, and assuming that the changes in the provision of the good or service have an impact on the individual welfare. That is, the environmental benefit (or cost) is understood as a benefit (or cost) for the human being and it is expressed in monetary units.
The substitutability between one and other goods is also central to the concept of value. The exchanges or sacrifices people make when they choose less quantity of a given good and substitute it for a higher amount of other goods reveal the values people give to each of these goods (Freeman, 2003).

41
5.2.2 Objectives of the economic valuation Following Pritchard (2000) and according to the aim of this report, the objectives for conducting an economic valuation study are:
• Demonstrative purposes, to show that forest ecosystems are linked to human well-being and should be represented in the decision-making processes.
• To describe the relative importance of different types of forest ecosystems. • To support or reject management or policy decisions that will influence the state of a certain forest ecosystem (e.g.,
through the use of cost-benefit analyses)
It is important to understand that the fundamental aim of valuation is not to put a ‘‘price tag’’ on a certain forest ecosystem, or its components, but rather to express the importance people put on changes in ecosystem goods and services provision, in comparison to other goods or services (Randall, 2002; Hanley and Shogren, 2002 in Turner, 2003). Accordingly, the assignation of a monetary value corresponds more to a need of establishing indicators, which can be used for the decision-making process, rather than of establishing a hierarchy of these goods and services.
In the Mediterranean, many of the forest ecosystem goods and services are only traded in informal markets or not at all. Thus, estimating these values is relevant when deciding about the allocation of limited resources for forest management or when considering alternative land uses.
5.2.3 Basic assumptions in environmental valuation The environmental valuation relies on the neoclassic theory that presumes individuals make their choices with the aim to maximise their welfare. This maximization always takes place in presence of restrictions such as income, time or limited provision of goods or services. The value is therefore the outcome of preferences of an individual with limited means. Through their choices individuals reveal a preference order for a set of goods and services, which can be presented as a utility (welfare) function. The economic theory also assumes that preferences of an individual are well defined and are stable. These conditions are necessary for estimating and maximizing the social welfare (Shapansky and al., 2002).
The same assumptions (i.e., utility maximization of an individual, and established and stabile preferences) are also adopted in the environmental valuation framework. Furthermore, it presumes that a change in the provision of environmental goods and services has an impact on the welfare of an individual.
Accordingly, the environmental valuation assesses the difference in welfare (marginal utility) derived from a change (increase or decrease) in the provision of ecosystem goods or services. However, the marginal utility of goods or services is not constant. It increases with the scarcity of a good and decreases with its abundance. For example, the marginal utility of income (Figure 5.1) decreases as income of an individual increases. For a person with low income, every additional monetary unit received has a higher marginal utility, than for someone with a high income. Figure 5.1 Marginal utility curve for income
As a consequence the estimated economic values are conditioned, among other things, by the scale of the change and the scarcity of the valued good or service. Although economic valuation has also been used to estimate the value of the totality of ecosystem goods and services at a given time (e.g., Costanza and al., 1997). This approach has been strongly criticised (e.g. Pearce, 2001; Bockstael, 2000; Turner, 2003). For example, the removal of all forests would involve the loss
Marginal utility
Income

42
Methods and tools for socio-economic assessment of goods and services provided by Mediterranean forest ecosystems
of a major life support system and not only of recreation possibilities. Thus economic values are only applicable to small (marginal) changes in ecosystem services.
Therefore, the assessed monetary values can only be used to express the changes in social welfare for marginal variations and do not imply a large scale alteration of the flow of environmental goods and services (Azqueta and Tirado, 2008). Actually, it is the marginal nature of these changes in the quantity/quality of these environmental assets that is useful in the decision making process.
5.2.4 Requirements and limitations of environmental valuation The first step in applying environmental valuation methods is to characterize the decision problem and the environmental change at stake.
When defining the environmental change, there are some key questions, which have to be addressed, such as (Champ, 2003):
• Geographic and temporal scope; • Associated types of values; • Who benefits and who loses; • What type of values are affected;
The second step is to estimate how the environmental change will impact the flow of relevant goods and services provided by the ecosystem. The nature of the value these goods and services portray (whether these are use values, non-use values, etc.) will have an important implication on the selection of the valuation technique.
The third step, directly linked with the previous, is the identification of individuals affected by the change. The distribution of the potential costs and benefits and the scale at which benefits and costs are captured are very important. Local users are more affected by changes in direct benefits (e.g., consumption and/or sale of forest products), while at the countrywide or international level, individuals assign more importance to indirect services (e.g., carbon sequestration, biodiversity conservation).
Despite the potential of environmental economic valuation as a decision support tool, there are some constraints to its use. The main limitations and challenges for environmental valuation are found in situations where there is a lack of well-trained individual or when certain services cannot be measured. Figure 5.2 shows some of the difficulties and constraints that may appear. Figure 5.2 Challenges faced when moving from use to non-use values in environmental valuation
Source: Bateman and Turner, 1993
Use values Revealed
by the market
Non-use values Not revealed by the market
Degree of familiarity decreases
Difficulties in perception increase
Problems of trust/ validity of results increase
Dependency of the results on multidisciplinary research increases
MOVING FROM USE TO NON-USE VALUES IN ENVIRONMENTAL VALUATION

43
As already mentioned, environmental valuation assumes that individuals have defined preferences for the valued goods and services. This is mostly true for goods and services that are commonly known to individuals (e.g., wood, mushrooms, and recreation). However, when asked to express their preferences for goods or services that they are not familiar with (e.g., existence of a plant species, biodiversity protection, soil erosion) (Bateman and al., 2008 a,b, 2010), the preferences are only established during the valuation process (Atkinson, 2012).
5.3 ECONOMIC VALUATION METHODS A variety of environmental valuation methods has been developed to estimate the value of ecosystem goods and services. The main types for these methods are revealed preference (RP) and stated preference (SP) methods (table 5.2). Table 5.2 Overview of valuation methods presented in this report
Method group Valuation method
Revealed preferences
Market price Costs based Hedonic pricing Travel costs
Stated preferences Contingent valuation Choice modelling
Benefit transfer Unit value transfer Function transfer
5.3.1 Revealed preference methods The revealed preference methods (RP) are based on actual observed behaviour data, including some techniques that deduce values indirectly from behaviour in surrogate markets, which are assumed to have a direct relationship with the ecosystem service of interest (Atkinson, 2012). These methods are suitable when a relationship exists between the environmental good or services at stake and a functional and well established market (Morrison and al., 1996). For example, often part of the real estate value is associated with the environmental quality (e.g., pollution level). It is very likely that RP methods underestimate the value of public goods, as they are not able to capture all the possible ways in which people benefit from them (i.e. non-use values).
A number of variants of the revealed preference methods exist, depending on whether the environmental good or service and the related market good are complements, substitutes, or one is an attribute of the other. The following sections provide descriptions for the most commonly applied RP valuation methods, namely, market price, cost based methods, hedonic pricing and travel cost method.
5.3.1.1 Market price method
General
Market price method is used when the actual market for the valued good or service exists (e.g., timber, non-wood forest products, carbon). In this case, the valuation is done on the basis of observed market prices. The market price valuation technique uses the standard economic methods for measuring the economic benefits from market impacts, based on the quantity demanded and supplied at different prices. Where market values exist, market price method should be preferred to any other valuation technique (Riera and al., 2005).
In a market economy, monetary units (e.g., euro) are a universally accepted measure of economic value, because the number of monetary units that an individual is willing to pay for a good or service tells how much of other goods and services this individual is willing to give up. This is often referred to as willingness to pay (WTP).
It is often incorrectly assumed that the market price of a good measures its economic value. The market price only indicates the minimum amount that people who buy the good or service are willing to pay for it (King and Mazzotta, 2000). When people purchase a good or service, they compare the amount of money they are willing to pay for that good or service with its market price. They will only purchase the good or service if their WTP is greater or at least equal to the price. Many people are actually willing to pay more than the market price for a good or service, and thus their values exceed the market price.
Figure 5.3 illustrates this difference, where VX1 represents the value (WTP) of the unit X1 of a good, while PX1 is the market price the individuals are asked to pay for this good. The illustration clearly shows that in the case of the product unit X1 the value is higher than the market price. The difference between the price actually paid for a good, and the maximum amount that an individual is willing to pay for it is called consumers surplus.

44
Methods and tools for socio-economic assessment of goods and services provided by Mediterranean forest ecosystems
Figure 5.3 Graphic representation of a demand function, value, market price and consumer surplus
Main steps in the application of the market price valuation
The objective is to measure total economic surplus for the change (increase or decrease) in provision of a good or service (e.g., improved wood production due to optimised forest management). This is the sum of consumer surplus plus producer surplus5.
Thus, the value of the change in the provision of a good or service equals the difference between economic surplus before and after the management improvement.
Step 1: Estimate of demand function before the change in provision
The first step of the procedure is to use market data to estimate the market demand function6 and consumer surplus for the valued good or service before the change in the provision. An example is presented in figure 5.4. Given a demand curve D and the initial market price MP1, the initial consumer surplus equals the light shaded area CS1. Figure 5.4 Demand curve and consumer surplus before and after the change in the good or service provision
Step 2: Estimate of demand function after the change in provision
The second step is to estimate the market demand function and consumer surplus for the good or the service after the change in provision has occurred. In figure 5.4 the provision of the valued good or service will increase, which would result in a decreased market price (MP2), while the demand function (D) would remain unchanged. Thus, the consumer surplus after the change in provision would equal the sum of the area CS1 and CS2.
5 The difference between the total amounts earned from a good (market price times quantity sold) and the variable production costs. 6 The mathematical function that relates price and quantity demanded for goods or services. It tells how many units of a good will be purchased at different
prices.
Demand curve
Monetary unit
Product unit x1
Market price
VX1
PX1
Consumer surplus for unit X1
D
Price per unit
Quantity of product
MP1
CS1
CS2 MP2

45
Step 3: Estimate of the change in economic benefits to consumers
The third step is to estimate the change (loss or gain) in economic benefits to consumers, by calculating the difference in benefits before and after the change in provision. In figure 5.4 this difference (increased benefits) would correspond to the area CS2.
Step 4: Estimate of supply function before the change in economic benefits to producers
Because this is a marketed good or service, the changes in producer surplus (e.g., forest owner producing the wood) should be considered. As with consumer surplus, the producers surplus before and after the change, are estimated and the difference is calculated.
For example, in figure 5.5 for the production of a good or service the initial supply function is S1 and the market price is MP1. The resulting producer surplus is the sum of areas PS1 and PS2.
Step 5: Estimate of supply function after the change in economic benefits to producers
Next, the producer surplus is measured after the change in the provision of the valued good or service occurred. In figure 5.5, due to the increased supply, the market price decreased to MP2. Thus, the producer surplus is now only the area PS1. Figure 5.5 Supply curve and producer surplus before and after the change in the good or service provision
Step 6: Estimate of the change in economic benefits to producers
The next step is to calculate the difference in producer surplus due to the change in the provision of the valued good or service. In figure 5.5, this would be the difference between the initial producer surplus (PS1+PS2) and the final producer surplus (PS1). This means that the producer surplus after the change decreased by PS2.
Step 7: Estimate of the total economic change
The final step is to calculate the total economic change due to the modified provision of the valued good or service. This change equals the sum of changed consumer surplus and changed producer surplus.
Strengths and weaknesses of the market price method
Strengths of the market price method
• The market price method reflects a WTP of an individual for costs and benefits of goods or services that are bought and sold in markets, such as fish, timber, or fuel wood. Thus, people values are likely to be well-defined.
• Price, quantity and cost data are relatively easy to obtain for established markets. • The method uses observed data of actual consumer preferences. • The method uses accepted economic techniques.
Weaknesses of the market price method
• Market data may only be available for a limited number of goods and services provided by an ecological resource and may not reflect the value of all productive uses of a resource.
• The true economic value of goods or services may not be fully reflected in market transactions, due to market imperfections and/or policy failures.
S1
Price per unit
Quantity of product
MP1
PS1
PS2
MP2

46
Methods and tools for socio-economic assessment of goods and services provided by Mediterranean forest ecosystems
• Seasonal variations and other effects on price must be considered. • The method cannot be easily used to measure the value of larger changes that are significantly affecting the supply of
or demand for a good or service. • Usually, the market price method does not deduct the market value of other resources used to bring ecosystem
products to market, and thus may overstate benefits.
Application of market price method
The market price method uses prevailing prices for goods and services traded in markets, such as timber, mushrooms, berries, cork, medicinal and aromatic plants, decorative plants and material, game meet, hunting licences, etc. The study conducted by Daly and al. (2012) gives a good overview of the variety of goods and services for which market prices can be used to assess their economic value.
Application of the market price method requires data to estimate consumer surplus and producer surplus. To estimate consumer surplus, the demand function must be estimated. This requires time series data on the quantity demanded at different prices, plus data on other factors that might affect demand, such as income or other demographic data. To estimate producer surplus, data on variable costs of production and revenues received from the good or service are required. However, in practice seldom all these information is available. Thus, mostly the value of a marginal change is estimated considering a stable market price.
For example, Daly and al. (2012) estimated the value of annual wood production for the forests in the Barbra watershed basin. Forests cover around 31% of the total area of this watershed basin. One of the benefits these forests provide is wood. It was estimated that in 2010 the annual wood increment for the total area was 4,516 m3. A survey conducted in the study area showed that households consume on average 1.48 m3 of fire wood and 155 kg of charcoal per year. Multiplying these amounts by the number of households in the area this means that the total consumption was 10,351 m3 of wood (6,650 m3 of fire wood and 3,701 m3 wood for charcoal production), which is much higher than the estimated annual production capacity of the forests in the Barbra watershed basin. This clearly indicates the importance of the consideration of self-consumption of forest products by the population.
To estimate the annual benefit of wood production for the local population the market price for fire wood was used, which was in 2010 around 4.35 €7/m3. Thus, estimated the total annual benefit was 45,026 €.
5.3.1.2 Cost based methods
General
A particular case of market price methods is the group of cost based methods. This group includes the damage cost avoided method, replacement cost method, and substitute cost method. These methods can be used to estimate values of ecosystem goods and services based on either the costs of avoiding damages due to lost goods and services, the cost of replacing ecosystem goods and services, or the cost of providing substitute goods and services (King and Mazzotta, 2000). Often they are applied when estimating the value of protecting services (e.g., flood prevention, erosion mitigation, dam sedimentation, water purification).
However, they do not provide strictly measure of economic values, which are based on peoples’ WTP for a good or service. Instead, they assume that the costs of avoiding damages, replacing or substituting ecosystems goods and services, are useful estimates of their value. This is based on the assumption that, if people incur costs to avoid damages caused by lost ecosystem services, or to replace or substitute ecosystem goods and services, then those goods and services must be worth at least what people paid to avoid the loss or substitute or replace them. These methods are most appropriately applied in cases where damage avoidance or substitution or replacement expenditures have actually been, or will be, made.
The main underlying assumptions for this approach refer to the predictability of the extent and nature of physical expected damage (there is an accurate damage function available) and that the costs to substitute, replace or restore damaged assets can be estimated within a reasonable degree of accuracy. It is further assumed that the substitution, replacement or restoration costs do not exceed the economic value of the good or service.
The latter assumption may not be valid in all cases. The value of a good or service may fall short of the replacement, substitution or restoration costs, either because there are few users or because the use of the good or service is in low-value activities.
Main steps in the application of the cost based method
An example will be used to illustrate the main steps of the cost based methods. In this example a public agency is considering to restore a degraded forest area to improve the ability of these forests to protect the surrounding
7 This price was recalculated from Tunisian dinar (TD) using an exchange rate 1 TD = 0.46 €.

47
agriculture area from erosion. Before implementing such a restoration, the value of the increased erosion protection will be estimated to assess the potential benefits.
Step 1: Ecological assessment of the provided good or service
The first step is to conduct a physical assessment of the valued ecosystem good or service (e.g., level of soil erosion in tonnes of eroded soil per ha and year). This assessment should determine the current level of the ecosystem good or service, and the expected level if any change in the ecosystem would occur (e.g., restoration of the degraded forest).
Step 2: Cost assessment
This step depends on the specific method chosen.
The damage cost avoided method might be applied using two different approaches:
• One approach is to use the information on erosion protection obtained in the first step to estimate potential damages to agriculture land if erosion is to occur. In this case, the monetary value of the probable damages to property, if the forest is not restored, is considered.
• • The second approach would be to determine whether nearby property owners have spent money to protect their
property from the possibility of erosion damage, for example by purchasing additional insurance or by reinforcing the protection of their agriculture land. These avoidance expenditures would be summed over all affected properties to provide an estimate of the benefits from increased erosion protection. Thus the restoration of the forest area would only be implemented if the avoidance costs are expected to be less than the possible damages to agricultural area.
The replacement cost method is applied by estimating the costs of replacing the affected ecosystem goods and services. In this case, erosion protection services can be directly replaced by alternative investments (e.g., protection walls, terracing).
The substitute cost method is applied by estimating the costs of providing a substitute for the affected goods and services. Thus, the cost of building and maintaining such protection measures is estimated. It must be also determined whether people would be willing to accept the alternative protection measures in place of a restored forest.
Strengths and weaknesses of the cost based methods
Strengths of the cost based methods
• The methods may provide a rough indicator of economic value, subject to data constraints and the degree of similarity or substitutability between related goods.
• It is easier to measure the costs of producing benefits than the benefits themselves, when goods, services, and benefits are non-marketed. Thus, these methods are less data- and resource-intensive.
• It provide surrogate measures of value that are as consistent with the economic concept of use value, for goods or services which may be difficult to value by other means.
Weaknesses of the cost based methods
• These methods assume that expenditures to repair damages or to replace ecosystem goods and services are valid measures of the benefits provided. However, costs are usually not an accurate measure of benefits, which should be measured by peoples’ WTP.
• These methods do not consider social preferences for ecosystem services, or behaviour of individuals in the absence of those services.
• The methods may be inconsistent because few environmental actions and regulations are based solely on benefit-cost comparisons, particularly at the national level. Therefore, the cost of a protective action may actually exceed the benefits to society. It is also likely that the cost of actions already taken to protect an ecological resource will underestimate the benefits of a new action to improve or protect the resource.
• The replacement cost method requires information on the degree of substitution between the market good or service and the natural resource. Few environmental resources have such direct or indirect substitutes. Substitute goods or services are unlikely to provide the same types of benefits as the natural resource.
• The goods or services being replaced probably represent only a portion of the full range of services provided by the natural resource. Thus, the benefits of an action to protect or restore the ecological resource would be understated.
• These methods should be used only after a project has been implemented or if society has demonstrated their WTP for the project in some other way (e.g., approved spending for the project). Otherwise there is no indication that the value of the good or service provided by the ecological resource to the affected community greater than the estimated cost of the project.

48
Methods and tools for socio-economic assessment of goods and services provided by Mediterranean forest ecosystems
• Without evidence that the public would demand the alternative, these methods are not an economically appropriate estimator of ecosystem good or service value. Nevertheless, in the absence of other valuation alternatives (e.g., lack of resources or expertise) the cost based methods are still often applied.
Application of cost based methods
In the EU (e.g., Ciancio and al., 2007; EU, 2005), cost based methods are commonly used by the public administrations to realize CBA, economical assessment of environmental policies and projects, etc., as the application of these methods is less demanding and the estimates are relatively robust (e.g., the prices for damage avoidance measures are stable). However, in most Mediterranean countries the application of these methods is still rather exceptional and only used in pilot or research studies (e.g., Merlo and Croitoru, 2005; Daly and al., 2012).
Some examples of cases where these methods might be applied include:
• Valuing improved water quality by measuring the cost of controlling effluent emissions; • Valuing erosion protection services of a forest or wetland by measuring the cost of removing eroded sediment from
downstream areas; • Valuing the water purification services by different ecosystems by measuring the cost of filtering and chemically
treating water; • Valuing storm protection services by measuring the cost of building retaining walls; • Valuing habitat and nursery services by measuring the cost of breeding and stocking programs.
For illustrating the application of the cost based methods, a study conducted by Jorio (2011) was used. The study is aiming at the estimation of the total economic value of goods and services provided by the Tazekka national park, and it includes different types of goods and services and different valuation techniques. In the following example only the substitute cost method will be considered.
The Tazekka national park is located in the Middle Atlas, near the city of Taza, in Morocco. The park was created to protect the natural resources, particularly the cedar grove (Cedrus atlantica). With a surface of 13,730 ha it embarks a great variety of fauna and flora. The park provides a wide range of ecosystem goods and services as it contributes to the local economic development, (e.g., income from tourism, agricultural and forest products). The ecosystem goods and services provided by the Park were grouped into:
• Economic: agricultural production, forest products, fodder, water provision; • Ecological: soil conservation, water reserves and quality, carbon sequestration, biodiversity conservation; • Social: recreation, tourism, cultural, education, and spiritual.
The forest fodder production value was estimated by using the substitute cost method. The quantities of the forest fodder and costs of substituting it by barley were estimated. Using this approach (see table 5.3) it was estimated that 11,006 ha of forests provide approximately 4 million fodder units. Considering the market price for barely of 0.315 €8/kg , the total economic value obtained for the fodder production was 1.26 million euros.
Further, the authors also considered the degradation caused by overgrazing, for which they assessed a cost of 32.58 €/ha (table 5.3). Reducing the total benefit of fodder provision by the cost of overgrazing the total benefit of fodder production was estimated at 902,775 € or approximately 82 € per ha. Table 5.3 The estimated economic value of the fodder production provided by the Tazekka National Park
Forest area (ha) 11,006 Fodder quantity (UFL-fodder units) 4,004,288
Barley price (€/Kg) 0.315 Value of fodder (€) 1,261,351 Degradation cost (€/ha) 32.58 Total degradation cost (€) 358,575 Net value (€) 902,775
Source: Jorio 2011
Further examples of market price and cost based methods for different Mediterranean countries can be found in Merlo and Croitoru (2005).
8 The original values were reported in Moroccan dirham (MAD), which we converted into EUR using an exchange rate 1MAD=0.09 EUR

49
5.3.1.3 Hedonic pricing method
General
The hedonic pricing method (HP) relies on market transactions for differentiated goods to estimate the economic benefits or costs associated with environmental quality, including air pollution, water pollution, noise and environmental amenities, such as aesthetic views (Paterson and Boyle, 2002), and proximity to recreational sites. It is most commonly applied to variations in housing prices that reflect the value of local environmental attributes (Taylor, 2003). As a consequence, this method is suitable for investigating the influence of forest view or forest proximity in the price of a house. The theoretical framework for the HP method was developed by Rosen (1974).
The basic premise of the HP method is that the price of a marketed good is related to its characteristics, or the services it provides. For example, the price of a house reflects its characteristics, such as the number of bedrooms and size of the house, as well as the external characteristics, either in terms of proximity to services (i.e., school, hospital, etc.) or proximity to environmental amenities (i.e., park, lake, forest, etc.). The individual characteristics of a house, or other good, can therefore be valued by investigating how much people are willing to pay for its changes.
𝑃 = 𝛼1 + 𝛽1𝑥1 + 𝛽2𝑥2 … + 𝛽𝑛𝑥𝑛 + 𝛽𝑛+1𝑧1 + 𝛽𝑛+2𝑧2 …𝛽𝑛+𝑚𝑧𝑚
where the dependent variable (P) is the sales price of a property and the independent variables are the structural characteristics (x=x1, x2, xn), the environmental characteristics of the commodity (z=z1, z2, zm) and the regression parameters (±1, ² 1...² n).
As such, HP is an indirect valuation method, because the value people place on the characteristics is derived from observable market transactions, rather than making a straightforward estimate.
Main steps in the application of the hedonic pricing method
The following steps are followed to estimate the HP function:
Step 1: Collection of data on property value and attributes, and environmental quality attributes
The goal is to estimate a hedonic price function in order to calculate implicit prices, which are the marginal WTP for the evaluated attributes of the property. Thus, property values (the dependent variable) and property attributes and environmental quality characteristics for the independent variables are needed. In collecting the data the following issues should be taken into account: sources, selection and potential biases.
For property values market prices are usually taken, but values assessed by homeowners or tax authorities can also be cautiously taken into account. Availability and reliability of data within the country is a crucial issue. In some countries, the data may be not entirely reliable as the recorded sales price might be underestimated to avoid the payment of higher property taxes. Therefore, direct surveys are preferred. Data collected by private firms are sometimes available upon sale. Homeowners can be asked within specific surveys to provide the price they paid to purchase their property along with the year of the sale and attributes of the house. Although these data may differ from the market sales, they can be considered a reasonably good approximation.
Broadly speaking, data that can be used as independent variables are property characteristics, neighbourhood characteristics and environmental quality characteristics.
Data on property characteristics may include the size of the plot (typically measured in hectares or acres), size of the building, the number of bedrooms and bathrooms (typically measured in squared metres or feet), and age of the structures. For apartments, other components such as floor level, the presence of a lift, the presence of a garage or parking place may play a crucial role. Data are generally gathered from records of tax authorities or homeowner surveys.
Neighbourhood characteristics deal with quality and location. The first group often includes the quality of local school, level of crime, average income, average age and ethnic composition. These data are usually available from the government census. Location characteristics deal with distance to the town centre, nearest shopping centres, distance to train station, nearest light rail or bus stop, nearest motorway exit.
Environmental characteristics also deal with quality and location. Environmental amenities include the quality of the air (pollution level) or the clarity of the water of the lake close to the property. Scientific measures of these variables are typically used. Information about the location include: distance to an open space, a forest, a public park, a lake, a landfill, a quarry. These are usually measured in kilometres and obtained through a GIS software package.
Step 2: Sampling
Before sampling the size of area and the period for which the data is collected have to be considered.
The size of the sampling area is crucial, because to get a more reliable estimation of the regression parameters (also see next step) enough variation in environmental characteristic is needed. It seems easier to allow for variation in location (e.g., distance to a nice forest) then for quality variation (e.g., level of water quality). The geographical area of the

50
Methods and tools for socio-economic assessment of goods and services provided by Mediterranean forest ecosystems
properties could involve more than one market. Although each urban area can be considered as a single market, there may be market segmentation within the same area, due to social aspects or product heterogeneity.
Also the considered time period should be long enough to guarantee enough variation in market conditions. For example, the effect of an improved environmental characteristic can be very strongly reflected in the housing price just after the improvement happened, but will decrease over time. However, when considering longer time periods also the inflation rate should be taken into account. Thus, in the regression model variables are used that represent (see next step) a price index (e.g., relative prices with reference to a selected base year) or the year of the house sale.
Step 3: Model estimation and welfare estimates
Once the data is collected and compiled, the next step is to statistically estimate a function that relates property values to the property characteristics, including the distance to open space. The resulting function measures the portion of the property price that is attributable to each characteristic.
The choice of the functional form is a crucial issue as it can substantially impact results. As the price is determined at market equilibrium by buyers and sellers, there is no specific rule to follow in choosing the functional form. The most common functional forms are (Table 5.4) linear, semi-log, double-log, quadratic, and quadratic Box-Cox. There is no general rule how to select the functional form, as the dependent variable (e.g., house price) is formed on the market by buyers and sellers, and it does not follow any specific rule. Table 5.4 Most common functional forms used in hedonic pricing
Functional form Equation Implicit price
Linear 𝑃 = 𝛼1 + �𝛽𝑛𝑥𝑛 𝜕𝑃𝜕𝑥𝑖
= 𝛽𝑖
Semi-log 𝑙𝑛𝑃 = 𝛼1 + �𝛽𝑛𝑥𝑛 𝜕𝑃𝜕𝑥𝑖
= 𝛽𝑖 ∙ 𝑃
Double-log 𝑙𝑛𝑃 = 𝛼1 + �𝛽𝑛𝑙𝑛𝑥𝑛 𝜕𝑃𝜕𝑥𝑖
= 𝛽𝑖 ∙𝑃𝑥𝑖
Quadratic 𝑃 = 𝛼1 + �𝛽𝑖𝑥𝑖
𝑛
𝑖=1
+12��𝛿𝑖𝑗𝑥𝑖𝑥𝑗
𝑛
𝑗=1
𝑛
𝑖=1
𝜕𝑃𝜕𝑥𝑖
= 𝛽𝑖 ∙𝑃𝑥𝑖
+ �𝛿𝑖𝑗𝑥𝑗 + 𝛿𝑖𝑖𝑥𝑖
𝑛
𝑗≠1
quadratic Box-Cox
𝑃(𝜃) = 𝛼1 + �𝛽𝑖𝑥𝑖(𝜆)
𝑛
𝑖=1
+12��𝛿𝑖𝑗𝑥𝑖
(𝜆)𝑛
𝑗=1
𝑥𝑗(𝜆)
𝑛
𝑖=1
𝜕𝑃𝜕𝑥𝑖
= �𝛽𝑖 ∙𝑃
𝑥𝑖(𝜆) + �𝛿𝑖𝑗𝑥𝑖
(𝜆−1)𝑥𝑗(𝜆)
𝑛
𝑗≠1
�𝑃1−𝜃
In the linear functional form the implicit price for any specific attribute (structural or property characteristics, neighbourhood issues and environmental attributes) is simply the estimated coefficient. Implicit prices9 differ across attributes, but are constant within each attribute. Linear functional forms should be avoided, because of their inability to allow for incremental changes.
The impact of each functional form on the results is very different and it is related to the specific dataset. Implicit prices provide information about the possible capitalization of an environmental characteristic on the market. They do not express the value placed by consumers on a discrete change in the environmental characteristics.
Strengths and weaknesses of the hedonic pricing method
Strengths of the hedonic pricing method:
• The main strength is that it can be used to estimate values based on actual choices. • Property markets are relatively efficient in responding to information, so they can be good indications of value. • The method is versatile, and can be adapted to consider several possible interactions between market goods and
environmental quality. • Property records are typically very reliable.
Weaknesses of the hedonic pricing method:
• The scope of environmental benefits that can be measured is limited to things that are related to housing prices. • The method will only capture WTP of people for perceived differences in environmental attributes, and their direct
consequences. Thus, if people are not aware of the linkages between the environmental attribute and benefits to them or their property, the value will not be reflected in home prices.
9 Implicit price is not showed or reported as a separate price of a good or service, but forms only part of the overall price of a good or service.

51
• The method assumes that people have the opportunity to select the combination of features they prefer, given their income. However, the housing market may be affected by outside influences, like taxes, interest rates, or other factors.
• The results depend heavily on model specification. • Large amounts of data must be gathered and manipulated. • The method is relatively complex to implement and interpret, requiring a high degree of statistical expertise. • The time and expense to carry out an application depends on the availability and accessibility of data.
Application of the hedonic pricing method
The hedonic pricing method is mainly used to estimate economic values for benefits or costs associated with:
• Environmental quality, including air pollution, water pollution, or noise; • Environmental amenities, such as aesthetic views or proximity to recreational sites.
It is most commonly applied to variations in housing prices that reflect the value of local environmental attributes, for instance, living near a green area or a lake.
In Europe and Mediterranean region, it exists very few hedonic pricing applications. Partly this is because of its limited scope, but mainly due to the difficulty to obtain reliable data for housing. For example, Le Goffe (2002) applies the hedonic pricing, using rental prices for rural cottages, to estimate the effects of agricultural and forestry activities on tourism income and public welfare. Lovri� (2009) used house prices in Zagreb (Croatia) to estimate the value of urban forests.
Given the absence of the applications of this method in the Mediterranean countries the work conducted by Tyrväinen (1997) was selected to show its use. In the selected study it was explored whether and how urban forests benefits are capitalized in property prices in Joensuu (Finland). As the dependent variable real estate prices (€/m2)10 from 14 different housing areas (a total of 1006 observations) and as independent variables different housing characteristics (table 5.5) were used. Table 5.5 The main housing attributes and their expected effects on housing price
Housing attribute Expected influence on house price
Housing attribute Expected influence on house price
Apartment characteristics (A) Size Number of rooms Age Flat roof Renovations Brick facade
+ + - - + +
Environment (E) Watercourse Wooded recreation area Wooded park Low housing density Own garden Traffic noise Pollution
+ + + + + - - Location (L)
Town centre School Shops Other public services Low status of area
+ + + + -
Source: Tyrväinen, 1997
The author applied a linear and semi-log regression models to estimate the impact on housing, location and environmental characteristics on the housing price. The obtained results indicate that the proximity to different environmental amenities positively affects housing prices. For example, a 100 m increase in distance to a watercourse decreased the housing price by 25.9 €/m2. In the same way, an 100 m increase of distance to forest recreation site decreases the housing price by 7.06 €/m2 (figure 5.6).
10 In the paper all the values were reported in Finnish Marks (FIM). However, for this report original values were converted to euros using an exchange rate 1
FIM =0.168 €

52
Methods and tools for socio-economic assessment of goods and services provided by Mediterranean forest ecosystems
Figure 5.6 The effect of distance to amenities on housing prices (Tyrväinen 1997)
Source: Tyrväinen 1997
5.3.1.4 Travel cost method
General
The travel cost method (TC) uses the cost of travel, observed site characteristics and observed trip patterns to value the characteristics, or existence, of a site-specific environmental amenity (for example, how much they spent to arrive and stay at their destination (e.g., forest) for the entire length of their visit). To do this, the TC method estimates use values for site-specific amenities, particularly use values that can only be obtained by visiting a site. Its use requires that out of pocket expenses do occur and that they vary across users. The method is typically applied to value recreational, scenic and cultural destinations.
Typically, a demand of an individual for trips to a site is modelled as a function of the cost of a trip to the site, the cost of visiting substitute sites, the characteristics of the site, the characteristics of its substitutes, income and other non-financial demographic characteristics of the respondent. The number of trips should decrease as the cost of a visit increases and should increase as the quality of the site increases. The initial idea was developed by Hotelling (1947) and later implemented by Clawson and Knetsch (1966).
If the focus is on a single site, then the model which most likely is going to be used is based on a demand function: 𝑡𝑛𝑗 = 𝑓(𝑐𝑡 , 𝑐𝑠,𝑦, 𝑧)
where t is the number of visits made by an individual n to a site j during a season, ct is the trip cost to the site, cs is a vector of trip costs to reach other substitute sites, y is income and z is a vector of socio-economic variables.
There are several varieties of the travel cost method (King and Mazzotta, 2000):
• A simple zonal travel cost method, using mostly secondary data (e.g., visitor statistics), with some simple data collected from visitors: this is the simplest and least expensive approach. It will estimate a value for recreational services of the site as a whole. It cannot easily be used to value a change in quality of recreation for a site, and may not consider some of the factors that may be important determinants of value. The zonal travel cost method is applied by collecting information on the number of visits to the site from different distances. Because the travel and time costs will increase with distance, this information allows the researcher to calculate the number of visits “purchased” at different “prices”. This information is used to construct the demand function for the site, and estimate the economic benefits, for the recreational services of the site.
• An individual travel cost method, using a more detailed survey of visitors: is similar to the zonal travel cost method, but uses survey data from individual visitors in the statistical analysis, rather than data from each zone. This method thus requires more data collection and slightly more complicated analysis, but will give more precise results. This method requires the implementation of a visitor survey.
• A random utility travel cost method using survey and other data, and more complicated statistical techniques: this is the most complicated and expensive of the travel cost methods. It is also the most recent, and allows much more flexibility in calculating benefits. It is the best way to estimate benefits for specific characteristics, or quality changes, of sites, rather than for the site as a whole. It is also the most appropriate when there are many substitute sites. The random utility travel cost method assumes that individuals will pick the site that they prefer, out of all possible sites. Individuals make trade-offs between site quality and the price of travel to the site. Hence, this model requires information on all possible sites that a visitor might select, their quality characteristics, and the travel costs to each site.
Hous
ing
pric
e in
EUR
/m2
Distance to amenity in km
Distance to watercourse
540
440
480
500
520
460
0.5 1.5 2.5 3.0 3.52.01.00.0
Distance to wooded recreation area

53
These approaches differ in the way the variables are defined and measured, on the specification of the model, on the estimation procedures employed and in the computation of consumer surplus. Moreover, if the aim is to value changes in the characteristics of different sites simultaneously, an appropriate model which handles multiple-sites needs to be specified. As a consequence, some preliminary decisions need to be taken before the study begins.
Firstly, it is important to define what the exact purpose of the study is. TC models can be used to value access to sites, i.e., the welfare effects of the elimination of a recreational site, or to value the characteristics of a site, i.e., a change in the level of the quality of the site. Models differ depending on the goal of the study, such as estimating the loss of welfare due to a change in land use from public to commercial, or the closure of the site to public access.
Secondly, TC models are commonly used to estimate benefit changes due to the implementation of an environmental policy which aims, for example, at decreasing the level of water pollution in a lake or extending the number and/or length of hiking trails in a forest. More generally, it might be interesting to value changes in site attributes considering a set of recreation sites; or to determine how the variation in the site quality affects the probability of choosing one site over another.
Main steps in the application of the travel cost method
Although travel cost method approaches are quite different, they share a similar pattern of estimation in terms of operative steps (Riera and Signorello, 2012).
Step 1: Definition of the site
One issue is the definition of the boundaries of the site to be valued. In some cases (e.g., urban forest, national park) boundaries are easy to identify, while in others this may be more difficult (e.g., hunting area). Forests might not have particular problems in defining the boundaries, depending on the area where they are located.
Step 2: Definition of the target population
The population of interest are the users and potential users of the sites. People visiting the site may take a day-trip or stay overnight. This is one of the main issues with travel cost, because trips to the site should be of the same length for each person. It is preferable not to mix one day and two or more day trips in the same analysis (Haab and McConnell, 2002). Most common is to use day-trip data, overnight trips can be used, but less common.
For geographical area of relevance, Parsons (2003) suggests to define boundaries in terms of one day of driving.
A related issue is sites having multiple recreation uses. This might be the case of a forest, where people would go for short walks, hiking, picnicking, mushroom picking, bird-watching, hunting, just resting, etc. One solution might be to aggregate similar recreation activities, in order to simplify data collection and analysis, even if great care must be taken. Another solution is to identify the primary purpose of a recreation trip and ask respondents to report the number of trips taken according to several purposes. Nevertheless, there are also studies (e.g., Yeh and al. 2006) that account for multiple activities in different sites by specifying utility functions that allow activities to enter in a separable way. This is particularly useful when sites with similar attributes support a similar set of activities (Bowman and al., 2007).
People may visit other recreation sites nearby or visit friends or do something else besides the main purpose of the trip. The problem is the treatment of expenses, since they appear to be no longer attributable only to the main recreation experience.
The cost allocation to different purposes is generally not feasible, or at least quite complicated. Day-trip data are usually reasonably assumed to be single-purpose, whereas it is more difficult with overnight data. A general solution is to drop multipurpose trips from the dataset or to treat them separately.
Step 3: Definition of the sampling strategy
Sampling strategies depend on the aim of the study, the population of interest and the type of model. Both users and potential users should be taken into account. Within on-site sampling, commonly used in single-site models, visitors are surveyed at the site. The advantage is that the sample size can be smaller. Nonetheless, respondents with zero trips will not be considered, partly biasing the demand function, and, if not corrected, the welfare estimates (Parsons, 2003). It is easier to sample sites with clear entry points and this may not be the case with forests.
In off-site sampling respondents are sampled from the general population, thus by allowing both users and non-users to be contacted. Most of the biases described above can be avoided. On the other hand, off-site samples can be costly due to the low participation rate.

54
Methods and tools for socio-economic assessment of goods and services provided by Mediterranean forest ecosystems
Step 4: Survey implementation
Adequate survey methodology is crucial. The introduction is particularly relevant to explain the purpose of the study. Some easy questions make the respondent familiar with the issue of the survey. Relevant issues in the questionnaire are: a) a detailed description of the valued area, b) potential problems affecting the place (e.g., congestion, lack of services), c) a short list of amenities (e.g., presence of specific trees in a forest). Potential effects of environmental policies should also be described.
A specific section should focus on costs and trips, by explicitly asking questions on the number of trips taken to the site(s) over a specific period of time. Ideally, information should be collected for each trip taken to the sites, in practice this is impossible, so information concern the last trips to the sites.
Step 5: Calculation of travel costs and other costs
Although there is no fixed answer, which costs should be considered, the general agreement is to sum the day trip expenditures, typically transportation cost, access fee and time cost.
Costs can be explicitly asked to respondents or computed by the researcher (e.g., using travel software (e.g., Google maps) to calculate the distance and then multiplying with average cost per kilometre). The latter case, which is the most common, would ensure more uniform data and avoid missing data of respondents.
Costs of travel usually include all transit expenses. Specifically, when most of the visits are made by car, round-trip costs include fuel, upkeep and tolls. Software package can be of help in calculating the distance and the related figures of cost. It is important to know the number of people sharing a car in order to correctly compute the travel cost per person.
Entrance fees have to be included in the trip cost if a fee is paid to visit a recreation area. This might be the case in a protected area or a park.
Equipment costs might be also considered. They may differ quite a lot depending on the type of recreation activity practiced. For example, activities that can be practiced in a forest and the related equipment, such as the hunter’s gun or the biking equipment for mountain biking. Equipment costs are difficult to estimate and are usually not computed.
One of the most discussed and crucial issue is probably the estimation of the opportunity cost of time associated to the trip. If the value of travel time is not considered it may affect the travel costs and subsequently the welfare measures, which may be underestimated. One needs to deal with the value of opportunities lost while spending time reaching the site, staying there and returning home. Since the cost of time is generally related to a person’s income, the estimation of the time cost is commonly derived by multiplying the hourly wage by the travel time to the site.
Step 6: Model estimation and welfare estimates
The choice of the model is strictly associated to the data and the aim of the estimation.
Single-site travel cost regression models
Regression models for count data are mostly used for single-site applications of TC, for two reasons: first, the dependent variable (number of trips) is nonnegative and integer and second, there is a significant fraction of people taking zero or small number of trips. The Poisson regression, which is the basic specification, estimates the probability (Pr) of observing an individual take t trips during a selected period of time:
Pr(𝑡) =exp (−𝜆) ∙ 𝜆𝑡
𝑡!
where the parameter 𝜆 is the expected number of trips and is assumed to be a function of the variables specified in the demand model. A very simple version of such a function would be:
𝜆 = 𝛼 + 𝛽 ∙ 𝑇𝐶
where the number of trips (𝜆) is a function of travel costs (TC), and 𝛼 and 𝛽 are regression parameters.
The Poisson model is characterized by a strong assumption that the chance of making a trip is randomly distributed and all individuals have an equal chance of making the same number of trips. However, this assumption may be incorrect: it can be observed that relatively more people make a higher number of trips than the model predicts. The negative binomial model and the generalized negative binomial model are variations of the Poisson model, but relaxing this constraint.
Consumer surplus (CS) estimates can be expressed in several ways: as a mean seasonal value per person, as a total seasonal value for the population and as an average per trip per person. The average per trip per person value based on the Poisson regression model is:
𝐶𝑆𝑡 = 1 −⁄ 𝛽𝑇𝐶
where CS is the consumer surplus (benefit) per trip and 𝛽 is the regression parameter associated to travel costs (TC).

55
Random utility travel cost regression models
The basic random utility model is a multinomial logit regression model (MNL), which states that the probability (Pr) of visiting a selected site j depends on the attributes of that site and the attributes of all the other sites within the choice set:
Pr(𝑗) =exp (𝛽𝑐𝑐𝑗 + 𝛽𝑝𝑝𝑗)
exp(𝛼0 + 𝛼1𝑘) + ∑ exp (𝛽𝑐𝑐𝑖 + 𝛽𝑝𝑝𝑖)𝑐𝑗=1
As an example, the welfare loss expressed as per choice occasion due to the closure of other three forests is:
𝐶𝑆𝑛 =𝑙𝑛�exp(𝛼�0 + 𝛼�1𝑘) + ∑ exp (�̂�𝑐𝑐𝑖 + �̂�𝑝𝑝𝑖)𝑐
𝑗=4 � − 𝑙𝑛�exp(𝛼�0 + 𝛼�1𝑘) + ∑ exp (�̂�𝑐𝑐𝑖 + �̂�𝑝𝑝𝑖)𝑐𝑗=1 �
−�̂�𝑐
For the estimation of a multi-site model, also other more complex models can be used (e.g., nested logit, mixed logit). The advantage of these more complex models is their ability to overcome some strong restrictions associated with the MNL model. The most common restriction is the independence of irrelevant alternative (IIA), which implies that the probability of choosing between two sites is not influenced by modifications involving other sites of the choice set. It means that a decrease in a quality attribute of a forest site would induce a proportional increase in the probability of visiting all the other sites, by suggesting that all other forests are good substitutes.
Strengths and weaknesses of the travel cost method
Strengths of the travel cost method:
• The travel cost method closely simulates the more conventional empirical techniques used by economists to estimate economic values based on market prices.
• The method is based on actual behaviour—what people actually do—rather than stated WTP—what people say they would do in a hypothetical situation.
• On-site surveys provide opportunities for large sample sizes, as visitors tend to be interested in participating. • The results are relatively easy to interpret and explain. • The method is relatively inexpensive to apply.
Weaknesses of the travel cost method:
• The travel cost method assumes that people perceive and respond to changes in travel costs the same way that they would respond to changes in admission price.
• The travel cost method is limited in its scope of application because it requires user participation. It cannot be used to assign values to on-site environmental features and functions that users of the site do not find valuable. It cannot be used to value off-site values supported by the site. Most importantly, it cannot be used to measure non-use values. Thus, sites that have unique qualities that are valued by non-users will be undervalued.
• Standard travel cost method approaches provides information about current conditions, but not about gains or losses from anticipated changes in resource conditions.
• The simplest models assume that individuals take a trip for a single purpose to visit a specific recreational site. Thus, if a trip has more than one purpose, the value of the site may be overestimated. It can be difficult to apportion the travel costs among the various purposes.
• The availability of substitute sites will affect values. For example, if two people travel the same distance, they are assumed to have the same value. However, if one person has several substitutes available but travels to this site because it is preferred, this person’s value is actually higher. Some of the more complicated models account for the availability of substitutes.
• Those who value certain sites may choose to live nearby. If this is the case, they will have low travel costs, but high values for the site that are not captured by the method.
• Interviewing visitors on site can introduce sampling biases to the analysis. • Measuring recreational quality and relating recreational quality to environmental quality can be difficult. • Defining and measuring the opportunity cost of time, or the value of time spent traveling, can be problematic.
Because the time spent travelling could have been used in other ways, it has an opportunity cost. This should be added to the travel cost, or the value of the site will be underestimated. However, there is no strong consensus on the appropriate measure - the wage rate of a person, or some fraction of the wage rate - and the value chosen can have a large effect on benefit estimates. In addition, if people enjoy the travel itself, then travel time becomes a benefit, not a cost, and the value of the site will be overestimated.
• In order to estimate the demand function, there needs to be enough difference between distances travelled to affect travel costs and for differences in travel costs to affect the number of trips made. Thus, it is not well suited for sites near main population centres where many visitations may be from "origin zones" that are quite close to one another.
• As in all statistical methods, certain statistical problems can affect the results. These include choice of the functional form used to estimate the demand curve, choice of the estimating method, and choice of variables included in the model.

56
Methods and tools for socio-economic assessment of goods and services provided by Mediterranean forest ecosystems
Application of the travel cost method
The travel cost method is used to estimate the value of recreational benefits generated by ecosystems. It assumes that the value of the site or its recreational services is reflected in how much people are willing to pay to get there. The travel cost method can be used to estimate the economic benefits or costs resulting from:
• Changes in access costs for a recreational site; • Elimination of an existing recreational site; • Addition of a new recreational site; • Changes in environmental quality at a recreational site.
The TC method for valuing forest goods and services has been relatively frequently used in the Mediterranean area, at least, since the middle of the 1990 decade. Examples of applications are, studies in Tunisia (Daly and al., 2012), Morocco (Jorio, 2011), France (Scherrer, 2003), Spain (Riera and al., 1995; Caparrós and Campos, 2002; Bujosa and Riera, 2008), and Italy (Tempesta and al., 2002). The TC method is mainly used for valuing direct use recreational forest services, such as picnicking, tourism, sports (Bujosa and Riera, 2008; Jorio, 2011; Daly and al., 2012; ), cultural and spiritual events (Jorio, 2011), as well as non-use services as biodiversity or landscape values (Bujosa & Riera, 2008). When the main objective is not commercial, certain uses of forests such as mushroom picking may be included within the use recreational services, as their principal component can be enjoying the forest by itself (Martínez de Aragón and al., 2011).
For illustrating the application of TC method, an application of the method by Martínez de Aragón and al. (2011) was used. In this paper the authors apply an individual TC method to estimate the benefits of mushroom picking in a rural Mediterranean area. The data were obtained through a sample of 300 mushroom pickers in the forests of the Solsones County in Catalonia (North East Spain). To estimate the pickers benefits obtained from mushroom picking data were collected about attitudes of the respondent and mycological knowledge, expenses incurred during the trips, frequency of trips, amount of collected mushrooms and socioeconomic data of the respondent (for details see table 5.6). Table 5.6 Variables used in the travel cost model
Variable Description
Dependent variable
Number of trips number of trips made by an individual during a given mushroom season in the Solsones forests
Explanatory variables
Travel cost Trip expenses of an individual (in €)
Species Number of edible mushroom species that the individual can recognize
Quantity Amount of kilograms of mushrooms the individual expected to harvest when deciding to take the trip
Age Age of the respondent Source: Martínez de Aragón and al., 2011
Table 5.7 summarises the results obtained from the econometric estimation of the Poisson model. The cost of the trip (TC) was negatively related to the number of trips. Knowing more mushroom species (Species) and expecting to collect more mushrooms (Quantity) increased the probability of making more trips. The same was found for Age, suggesting that younger people are not so frequently going on mushroom trips as older persons. Table 5.7 Econometric estimation of the Poisson model
Variables Coefficient (b) Standard error b / St.Er. P[− Z| N z] 95% Confidence interval Constant 1.1159 0.1548 7.21 0.000 0.8124; 1.4193 TC − 0.0255 0.0028 − 8.98 0.000 − 0.0310; –0.0199 Species 0.0528 0.0528 3.21 0.001 0.0206; 0.0851 Quantity 0.1189 0.1189 5.14 0.000 0.0736; 0.1642 Age 0.0053 0.0022 2.43 0.015 0.0010; 0.0095
Pseudo R2 = 0.12 Journeys average = 4.57 Source: Martínez de Aragón and al., 2011
The benefit (consumer surplus) of an additional trip to pick mushrooms in Solsones County was calculated according to the equation 1 −⁄ 𝛽𝑇𝐶 , where 𝛽𝑇𝐶 is the regression parameter for travel cost.

57
The estimated consumer surplus was −1/ −0.0255 = 39.26 €/trip. The authors reported that a total of 18,000 where counted mushroom picking season. Thus, the total consumer surplus was about 710,000€ per mushroom picking season. The consumer surplus has two components, as individuals base their decisions on the recreational experience they obtain, as well as the products they expect to collect. To estimate the recreational surplus, the value of collected mushrooms was deducted from the total surplus. The product value was estimated by the earnings an individual would obtain in the market by selling the amount of mushrooms harvested at the market price. The average market value of the collected mushrooms per trip was about 7.00 €. Thus, the recreational surplus was estimated at 32.43 €/trip or about 586,000 €/season.
5.3.2 Stated preference methods Stated preference (SP) methods use surveys to simulate a hypothetical market for the goods or services at stake. These surveys aim at eliciting individual preferences and obtaining directly or indirectly monetary valuations from the respondents. These valuations are commonly referred to as WTP or alternatively (and less commonly used) willingness to accept (WTA). The main advantage of these methods is that they can be applied for valuation of use and non-use values (Riera and al., 2012), while the RP methods are mostly limited to use values.
SP methods are generally grouped into two categories: contingent valuation (CV) method and the choice modelling (CM) family of methods. In CV questionnaires, people are presented with a hypothetical change in the provision of a goods and/or services and are asked to state their WTP (or WTA). Whereas in a typical CM questionnaire respondents are faced with several alternatives and are (in most cases) asked to pick their most preferred alternative (Riera and al., 2012); this variant of CM is known as choice experiment (CE).
Because in forest related studies the CE is the most widely used method within the CM family, this section will focus on the description of the CE method. Choosing between CV and CE depends on several criteria, such as the study aim and the nature of the change to be valued. When the change is multi-dimensional and affects several goods and services then CE is preferred.
CV is a relevant method for the valuation of forest goods and services, as the forest ecosystems provide goods and services in bundles that cannot easily be split into separate characteristics or attributes11. In fact, it constitutes a suitable tool when valuing forest components that work, move and behave all at the same time. Therefore, the CV leads to a more holistic approach than CE that focuses on single components (Kramer and al., 2004). However, the CV only provides a single WTP (WTA) estimate for the complete change, while the CE delivers marginal WTP (WTA) for each of the components.
In the CV method, the term “contingent” suggests that the results are dependent on the simulated hypothetical market for the good or service in question.
CE method focuses on the value of a number of attributes relevant for policy design or forest management (Holmes and Boyle, 2004) rather than focusing on the total (holistic) value of the forest ecosystems. This approach is best suited for management decisions that are concerned with changing attribute levels rather than estimating the overall change in the provision of environmental goods and services (Hanley and al., 2001b).
In a CE method ecosystem goods and services are characterised in terms of a number and levels of its attributes. These attributes are then combined into hypothetical scenarios (also called alternatives) and these alternatives are then combined into choice sets. In a typical choice set one of the alternatives represents the current situation, showing the current level of the various attributes without any additional cost, while other alternatives represent other possible scenarios in terms of attribute levels and costs (see Figure 5.7 below) (Bennet and Adamowicz, 2001).
These choice sets are then shown to respondents in a non-random manner. Respondents are asked to choose, amongst the offered alternatives, their preferred one.
Thus, when respondents make their choice, they implicitly make trade-offs between the levels of the attributes of the different alternatives presented in a choice set (Alpizar and al., 2003). Given that, one of the attributes represents monetary cost, it is possible to estimate how much people are willing to pay to achieve a certain level of an attribute. Furthermore, it is possible to use the results to infer the amounts people are willing to pay to move from the current situation of attribute levels to a specific alternative.
11 In economic valuation the characteristics of a given ecosystem or good or service are called attributes. For example, biodiversity of a forest ecosystem could
be described in terms of the number of mammals, plants and insects. Each of them would be one of the biodiversity attributes of this forest ecosystem.

58
Methods and tools for socio-economic assessment of goods and services provided by Mediterranean forest ecosystems
5.3.2.1 Main steps in the application of SP methods
The main steps in applying SP valuation methods are (Riera and Signorello, 2012):
Step 1: Definition of the valuation objective
The first step is to clearly define the valuation objective. This includes determining which goods or services should be valued and why this valuation is necessary. The objective is to clearly specify the valuation question and the marginal changes to be valued. For example, the valuation question could be “What is the value individuals in region A put on an improvement of management in forest X, which would improve plant diversity”; in this case the marginal change would be the additional plant species in forest X.
If the valuation question entails valuing only the change of one good or service, then CV would be more suited, i.e., valuing the change on endangered species. On the contrary, if the aim is to value changes of multiple goods and services (e.g., plant diversity, carbon sequestration, recreation access) then CE is better suited.
Step 2: Selection of the survey type
The selection of the survey type will depend on the target population (i.e., the size of the population that would be directly or indirectly affected by the valued changes), the characteristics of the sample, types of questions, topics included in the valuation survey, the expected response rate and moreover, on the budget and time available to conduct the study. In continuation the most typical survey types are presented.
Face to face surveys are the most costly and time consuming survey type. However, generally they provide the best data quality, as they facilitate the interaction with the respondents (e.g., during a face to face survey the respondent is more focused on answering the questions as this might be the cases in web-based surveys). They also allow presenting even more complex topics, and capturing preferences of people that in other survey types might not be included in the sampling (e.g., people with no phone or internet access).
Mail surveys are in general less costly and allow the presentation of complex valuation topics (e.g., detailed instructions and description of the topics can be provided to the respondent), but require more time and mostly result in low response rates (e.g., typically response rates vary between 5 and 50 %).
Phone surveys are cheap and less time consuming. However, they are only adequate for simple questionnaires, where the valuation topic is well known to the respondents. They are also limiting the sample to individuals with phone access. Often phone surveys are combined with mail surveys (e.g., the respondent is contacted by phone and then the survey material is send via mail).
Finally web questionnaires are relatively cheap and fast. However, it has the drawback of limiting the sampled population only to those with internet access, which can differ significantly from the general population (e.g., respondents from older age groups (above 60 years) are underrepresented in this type of surveys).
Step 3: Questionnaire elaboration
SP methods are based on questionnaires. Thus, designing the valuation questionnaire is one of the most crucial steps on the path to accurate value estimates.
First a draft valuation questionnaire is prepared. This already contains the description of the valuation topic (e.g., the current situation, possible changes, goods and services it will affect) and the valuation question. The valuation question has to be clear and credible, so that the respondents have no difficulties to understand it and that they also believe that the anticipated change is possible.
The way the valuation question is presented will depend on the valuation method. If using the CV, the respondents are directly asked about their WTP or WTA. For example: “This recreation forest is currently lacking young trees, due to intensive grazing. Would you be willing to pay a 2 € entrance fee that would support the creation of fenced areas where the young trees would be better protected?”
In the case of a CE study, the respondents are asked a series of questions where they will have to select the most preferred alternative among a choice set (see example figure 5.7).

59
Figure 5.7 Example of valuation question in a CE questionnaire
Which of the following three options (Current Situation, alternative 1, alternative 2) do you prefer that may be achieved under an active management of current Aleppo pine forests in Catalonia?
STATUS QUO
(no management) ALTERNATIVE 1 ALTERNATIVE 2
TREE SPECIES (biodiversity
level)
1 tree species (Aleppo pine)
Low biodiversity level
7 tree species
Very high biodiversity level
3 tree species Medium biodiversity level
% of ALEPPO FORESTS
SUITABLE FOR RECREATIONAL
PURPOSES
10%
25%
55%
STORED CARBON
EQUIVALENT TO THE
EMISSIONS OF
10.000 citizens/year
25.000 citizens/year 40.000 citizens/year
ADDITIONAL COST
0 €/year 100 €/year 60€/year
Source: Mavsar and Varela, 2010
The typical questionnaire consists of several sections (Carson, 2000):
• The first section is devoted to introduce the survey purpose, the context for making a decision. • The second section provides a clear and detailed description of the good or service to be valued. This section
usually collects also data about previous knowledge of respondents and attitudes towards the good or service valued.
• The third section presents the valuation scenarios including current or baseline situation (also denominated as the “status quo”) and possible future states of the ecosystem good or service in case of no change happens (e.g., no change in management is applied).
• The forth section or elicitation section asks respondents maximum WTP to obtain the environmental good or service or minimum WTA for giving it up.
• The fifth section analyses the respondents understanding and certainty of the answers provided. • The last section is devoted to collect some debriefing questions on socio-demographic characteristics of the
respondents.
The null alternative
When creating a SP study, an important element to consider is what will happen if the project is not implemented. In other words, the null alternative is crucial. This element helps clarify the stakes of the valuation study. The null alternative must be defined clearly. Its definition will depend on the context, but typically refers to the do-nothing situation explaining what will happen if the project is not implemented. The null alternative is frequently named also the status quo or business as usual situation.
In the case of CV, a study may estimate the WTP for an improvement in environmental quality or quantity, or the WTA if this hypothetical improvement does not occur.
In CE, the null alternative is an alternative that the respondent can select from a choice set. Each choice set, or valuation question, typically consists of the reference situation and at least one alternative scenario, while the former remains identical to the valuation sequence (see figure 5.7).

60
Methods and tools for socio-economic assessment of goods and services provided by Mediterranean forest ecosystems
The payment vehicle
In a SP valuation questionnaire, a hypothetical market is established, and individuals are asked to state their maximum WTP or WTA for a given environmental change. In order to provide a meaningful context for the valuation, respondents are asked about their WTP or WTA through a payment vehicle. A payment vehicle defines the way how the amount of money the respondents are willing to pay would be collected. Taxes (e.g., income, property), service fees (e.g., water bill), entrance fees, and donations are some of the typical payment vehicles used in SP questionnaires.
The payment vehicle used should be realistic and relevant. For example, it would not be realistic to establish an entrance fee to a forest, if there is currently an open access policy in place. Or it would not be relevant to ask about an increase in income tax, if the respondent does not pay income taxes, due to a lack of income.
Payments could be expressed as total nominal amounts, as proportions of income or taxes. If the respondent is only supposed to pay part of the amount and the other part will be paid by another entity (e.g., public administration) the questionnaire should specify this.
Depending on the intended use of the value estimates, payments could be made periodical, say for five years, or indefinitely, or on a one-time only basis. If periodical, or if the one-time payment, it must be clearly stated whether the value is expressed in nominal or real prices. Furthermore, it should be specified whether the payment refers to the household, or the respondent.
Specific issues on questionnaire elaboration for CV
One of the most crucial decisions in designing a CV questionnaire is the choice of the elicitation response format, as the information given to respondents through the elicitation format may influence their responses. Elicitation formats also differ in the amount of information conveyed to respondents, and also on the amount of information that can be collected from respondents. Overall, it is important to be aware that all elicitation formats influence the determined WTP in some way and could have a strong influence on the estimated welfare (Riera and Signorello, 2012). Some examples of elicitation formats are (Riera and Signorello, 2012):
• Open-ended format: respondents are directly asked about their maximum WTP for changes in the provision of the good in question. It is very informative but does not provide respondents with clues concerning their potential WTP. Drawbacks are that they are not incentive compatible and may evoke a large number of zeros and outliers.
• Discrete choice (DC) question format asks respondents whether they are willing to pay a certain amount of money for a specified change in the provision of a certain good. Respondents answer with “yes” or “no”. The bid amount is varied over different respondents. The main advantage is that it is incentive compatible, although the information obtained per respondent is very limited (i.e. if only one DC question is asked during the interview, all that is known is whether the respondents WTP is higher or lower, than the amount presented).
• Double bound discrete choice: as in a bidding game, the respondents are presented with a second bid depending on their responses to the first bid. If to the first bid the respondents answers with “no” the second bid is lowered and increased when they answer to the first bid “yes”. Thus, it provides an interval for the WTP and therefore requires fewer interviews that the DC with only one question added.
• Bidding game: respondents face a series of DC questions. Depending on their responses, subsequent responses present a lower or a higher bid, until the respondents agree to pay the offered amount or until they are not willing to pay the higher amount. The major drawback of the bidding game is that the final estimate may strongly depend on the starting point, i.e. the initial monetary amount presented to the respondent.
• Payment card method can also be used. Here respondents are presented with a number of preselected bids on the payment card and are asked to select the maximum amount of money they would be willing to pay. This method does avoid anchoring effect but the range of monetary amounts can still bias the results.
Carson and Hanemann (2005) highlight three factors affecting the design of a CV survey that contribute to incentive compatibility, independently of the elicitation format used: (i) consequentiality, respondents need to see that the survey aims at knowing whether the public supports a given policy at a given cost; (ii) plausibility, respondents see as plausible the good being valued and its costs; and (iii) appropriateness of the payment vehicle that can impose costs on all individuals if the policy is undertaken.
Specific issues on questionnaire elaboration for CE
One of the most important points for designing a CE questionnaire is to identify and describe the attributes and their levels. The attributes have to inform about the environmental change and provide relevant information to decision-makers. However, with increasing number of attributes, also the complexity of the task for the respondents is increasing. Thus, it is important to find a good balance between both aspects.
The combinations of attributes and their levels should form plausible alternatives. Holmes and Adamowicz (2003) pointed out that attributes in forest management may be highly correlated with natural processes. For example, the

61
attributes species diversity and area not harvested may be so highly correlated that it is not possible to reach a high level of species diversity when only a small forest area is not harvested.
Once the attributes are selected, a plausible range of levels for them has to be decided. A larger number of levels will be more informative, but it will produce a larger experimental design (see step 2).
Once the attributes and their levels are selected, the number of alternatives presented in a choice set and a how the attribute levels are combined to create these alternatives has to be decided. A typical choice set has a current situation alternative and two hypothetical alternatives describing different forest situations that might be obtained in the future (see figure 5.6).
The experimental design theory enables combining the attribute levels in a non-random manner, such that the effects that are interesting can be unveiled afterwards in the statistical analysis.
Step 4: Definition of the target population
Once the survey is written, the most appropriate target audience to answer the questions must be determined. It generally corresponds to those people who may benefit (directly or indirectly) from the provision of the valued goods or services.
According to Carson and Hanemann (2005), there are two different perspectives on defining the population of interest in a valuation survey. The first perspective is a legal and/or political one. The agency funding the survey may only be interested about the welfare of particular population subgroups, such as taxpayers in their jurisdiction. The second perspective is based on a rough consideration of the costs and benefits of sampling from different groups. This means that when deciding where to sample, different population groups (e.g., users and non-users) should always be considered. However, there is always a trade-off between the sampling cost and completeness of the sampled population. Especially, at it is rather challenging to define the population that holds non-use values. Bateman and al. (2002) list some factors to consider when determining non-user population(s):
• Uniqueness or substitutability of the good or service in question. Unique resources are more likely to attract non-use values and their valuation requires sampling beyond the user population.
• Familiarity of respondents with the good or service. Related to the uniqueness, the familiarity with certain resources can decline with the distance. Hence, it is possible that with beyond certain distance, the good or service that is the topic of the survey will have no effect on the population.
• Scale of change. The more significant the change, the more likely it is to affect larger populations.
Step 5: Definition of the sampling
Once the relevant population is defined, the sampling approach has to be specified. Stratification is a common procedure as it increases sampling efficiency when compared to random sampling, where all the individuals from the target population have the same probability of being selected (Carson and Hanneman, 2005).
For example, in a national survey, provinces can represent strata. Drawing the correct proportion from each stratum eliminates the possibility of having a sample that comes disproportionately from one province. One reason to use stratification is also to capture interest differences, for example, because they represent key subgroups of the population for which the researcher wishes to obtain separate estimates (e.g. rural/urban populations, users/non-users) (Bateman and al., 2002). The relevant strata can also be decided based on representativeness issues as well as on the relevant features of the population which allow controlling for its representativeness (e.g. gender, education, income).
Step 6: Test the questionnaire in focus groups and pilot surveys
A focus group is an interview conducted by a moderator among a small group of respondents in an unstructured manner. Focus groups typically have 6-12 participants plus a moderator and an assistant, who takes notes and records the session.
Thus, in the process of the questionnaire design, it is recommended to test whether the questionnaire is well understood, correctly worded, and has a credible scenario (Riera and al. 2012). Once the questionnaire is finished it is advisable to test it in focus groups to gain insights about issues of interest and particular questionnaire design characteristics (Bateman and al. 2002).
The final stage of pre-testing the questionnaire involves carrying out a pilot survey. A pilot survey consists in administering a draft questionnaire to a sample of respondents similar to the one that will be used in the final survey. It serves the purpose of fine-tuning the questionnaire and of training the interviewers. 20 respondents constitute the minimum for a pilot survey.
Step 7: Launch the survey and collect the data for your sample
Depending on the survey type chosen, the data collection may take from two months (for telephone or mail survey) to one month (for face-to-face surveys) or even less (for Internet based surveys). If a poll company is hired, they usually

62
Methods and tools for socio-economic assessment of goods and services provided by Mediterranean forest ecosystems
provide with the data formatted as need for ulterior analysis. Otherwise, data processing is needed to adapt it for its analysis.
Step 8: Statistical analysis Stated preference data is analysed through probabilistic regression models that take different approaches depending in whether CV or CE data is analysed.
Specific issues for statistical ana lysis of contingent va luation data
Once the CV survey has been conducted, data has to be analysed. The first step is defining the bid function to employ. The bid function explains the variation in WTP or WTA response based on the change in and the characteristics of the non-market good or service and other socio-economic characteristics of the respondents.
Following standard economic theory, an indirect utility function V can be defined, that describes the maximum amount a respondent derives from his income, Y, given the prices of goods, P, and the level of provision of the good or service, Q. It is also assumed that the utility of the respondent will depend on other demographic and economic factors, S. Hence, the indirect utility of the respondents can be written in the general form:
V(Y,P,S, Q)
When answering a CV question, respondents are assumed to be comparing their utility or well-being at the two levels of provision of the environmental good or service, Q0 and Q1. Assuming that the respondents experience a greater wellbeing at the higher level of provision, it seems reasonable to assume that they will be prepared to pay at least something to achieve Q1. The quantity C can be defined such as:
V(y, P, S, Q0)= V(Y- C, P, S, Q1)
where C is the household’s maximum WTP to achieve the increase in provision of the good or service. By manipulating the equation above, C can be defined as a function of the other parameters in the model. This function, denoted as C, is known as the bid function and can be written in a general form as:
C= C(Q0, Q1, Y, P, S) = WTP
Assuming a non-negative WTP for the respondents, economic theory states that the maximum WTP of respondents for any good or service is bounded by their ability to pay. In other words, their WTP must not be greater than their income, Y:
0 ≤ C= C(Q0, Q1, Y, P, S) = WTP ≤ Y
In summary, the WTP values given by respondents to CV questions can be seen as the solution to a constrained utility maximising problem. The solution to this problem is represented by the bid function that relates WTP values to income of respondents, characteristics of the respondents and the characteristics of the good or service to be valued.
Once the bid function is defined, a probability function should be specified. A probability function described the likelihood of observing any particular value of a random variable, in this case the WTP variable. A probability function in CV studies is usually defined by:
• A location parameter, which fixes the value of the central point in the distribution; • A scale parameter, which determines the dispersion of values around the central point.
Some of the most usual probability functions employed in CV studies are the normal, log-normal, logistic, log-logistic or exponential.
Once the bid function is defined and also the distributional assumption is described, the analyst is in position of estimating the parameters of the model:
• a, that determines the mid-point of the distribution of the WTP variable and what is the value usually reported in CV studies;
• Ã2, that determines the spread of the probability distribution of WTP; • Á, which determines the probability that a household will have zero WTP;
Specific issues for statistical ana lysis of CE data
The statistical analysis of the choice data informs the researcher about the likelihood that an individual will choose an alternative based on the attribute levels. The multinomial logit model (MNL) is the basic model to analyse the choice probability P that an individual n will choose alternative i out of j alternatives:
∑∈
=
Cj
in Vjn
VinP
)μexp(
)μexp(
Where Vin = ² ' X, is the deterministic part of utility, ² ' are the estimated coefficients and X are the attributes.

63
The outcomes of the MNL model are coefficient estimates for each of the attributes. These coefficients express how each attribute impacts the welfare of the population. Table 5.8 shows the results of an MNL model from a survey conducted in Morocco (Mavsar and Farreras, 2010) to assess the non-market values of the Bouhachem forest.
The results show that the population have a negative preference for the increase of degraded and eroded in the Bouhachem forest. So an increase in the degradation and erosion would have negative impact on population’s welfare. Further, applying use restrictions and having more recreational opportunities in the site, would contribute positively to the respondents welfare.
Table 5.8 Example of the outcomes of a MNL model for the previous choice set example
Attribute ² coefficients Standard deviation
CONSERVATION -0.10312*** 0.0101
EROSION -0.2078*** 0.0254
RESTRICTIONS TO THE USE (EXCLOSURES) 0.0362*** 0.0082
RECREATION 1.1560*** 0.8995
PAYMENT -0.02159*** 0.0016
Log Likelihood -1020.477
Pseudo R2 0.017
Nº of Observations 1,165 Source: Mavsar and Farreras, 2010
Once the attributes’ coefficients are estimated, implicit price for each of these attributes can be calculated. The implicit price IP is calculated as the ratio between any non-monetary attribute coefficient β and the negative of the price attribute coefficient.
ice
AttributeIPPrβ
β−=
5.3.2.2 Strengths and weaknesses of the stated preference methods
Strengths of stated preference methods
• They are the only available methods to estimate non-use values. • They can also be employed to estimate use values. • The use of surveys allows to collect relevant socioeconomic and attitudinal data on the respondents that could be
relevant for understanding the variables influencing social preferences and choices. • The use of surveys allows to estimate hypothetical changes and their impact before they have taken place. • Participative or deliberative approaches before valuing the good or service at stake seem to provide with more
stable results (Christie and al., 2012).
Weaknesses of stated preference methods
• Preferences for non-use values tend to be less stable. • Complex questionnaire development and data analysis. • Budget and time demands are high. • High risk of biases that may lead to inaccurate WTP estimations. • If the surveyed population has a low level of literacy it would pose significant constraints for the implementation of a
questionnaire where respondents have to read. In such cases, face-to-face interviews, use of local language and local enumerators are suggested.
• The traditional knowledge people have, particularly in rural areas, may not always align with the approached used by experts in questionnaires.
5.3.2.3 Application of the Contingent Valuation method
The contingent valuation method is one of the most used economic valuation methods in economic science in the Mediterranean. As an example, it can be mentioned several works that have been developed in different countries of the region, both in the southern and the northern parts of the basin: Turkey (Tümay and Brouwer, 2007; Pak and Türker, 2006), Italy (Tempesta and al., 2004), France (Garcia and al., 2007), Spain (Soliño and al., 2010; Riera and Mogas, 2004).

64
Methods and tools for socio-economic assessment of goods and services provided by Mediterranean forest ecosystems
To illustrate the application of the CV method the study chosen was developed in France. A specific CV study exists in Turkey, although it estimates the recreational use value of a forest site. Because the appealing of stated preference methods is their capacity of estimating non-use values, the chosen application is a study developed by Garcia and al. (2007) where the CV method is applied to estimate biodiversity values at the national level in France. The main goods and services valued were both use (e.g., resistance to catastrophes, food provision, medicines, raw materials, water supply, carbon storage, leisure, tourism) and non-use values (existence, legacy).
The scenario of valuation was the hypothetic implementation of different protection and maintenance measures to conserve the biodiversity of forests. The main question was : what amount (between 6€ and 90€) would the households be willing to pay in order to finance those measures?
The system used for surveying a reasonably large number of French citizens from the whole country was to prepare a referendum questionnaire that was presented by telephone to a sample of 4,500 households representing the whole society. The households were asked if they had visited any forests during the time surveyed, and more generally about their different activities in the forests.
The values obtained vary according the revenues and regions. The main WTP for the whole country fluctuated between 45€ and 64€ per household per year, while the results showed significant differences between the north (including Paris) with a mean of around 64€, the east (between 50€ and 55€) and the South-West of France (45€).
5.3.2.4 Applications of choice experiment method
The range of goods and services than can be valued using this method is very wide, including both use values (forest fires risk prevention, leisure, sport, tourism, carbon sequestration, delaying erosion and loss of land productivity, raw materials, timber, non woody forest products, wood and forage, water cycle regulation, creation of jobs, pollution absorption), and non-use values: existence (biodiversity, landscape), legacy (to the posterity), etc.
A considerable number of CE method applications were found in different Mediterranean countries, both in the northern and in the southern basin. For instance: Tunisia (Daly and al., 2012), Morocco (Mavsar et Farreras, 2011), Spain (Colombo and al., 2006; Brey and al., 2007) and France (Bonnieux and al., 2006). A non-Mediterranean study to be highlighted was carried out in the United Kingdom at the national level. This study was developed in cooperation with the public administration to support and assess forest policies (Willis and al., 2003).
A study by Mavsar and Farreras (2011) illustrates the application of the CE method. This study assesses the WTP of the Moroccan society for different management options, aimed to improve or conservation different ecosystem goods and services provided by the Bouhachem forest, in northern Morocco. The main forest goods and services valued on the study are food and forage production, soil protection, water cycle regulation, biodiversity conservation, recreation and tourism.
The study values how would different management programs affect to the provision of forest goods and services after ten years of application. Each program would be composed by different attributes, applied in different degrees: conservation (reducing the loss of biodiversity and the perturbations in the cycle of water), soil protection (presented as erosion), restrictions to wood and forage provision, recreational and touristic activities. Each management option would cost a given amount of money, unless the status quo scenario, which would not have any cost.
To obtain the data, a questionnaire was distributed to a sample of 396 individuals representing the Moroccan society (terms of age, residence and gender diversity). Moreover, to obtain more precise results, the researchers used a Latent Class Model. This type of models assumes that the population is divided into a number of finite groups or classes within which the preferences are relatively homogeneous and different from these of the other groups or classes. The model that provided the best adjustment was a four-class model. The classes differ in socio-demographic parameters, for instance, rural or urban origin, incomes, use of forests, education, gender, etc.
The results show (table 5.9) that the WTP of the Group 1 for the conservation, erosion and recreation attributes are not significant, which means that for this group changes in erosion and recreation attributes have no impact on the welfare. On the other hand, they would pay 0.40€12 for restricting the use of the forest. The WTP of Group 2 for the conservation attribute is the value is 0.28€, which is the amount of money that the respondents would be willing to pay to conserve biodiversity.
On the other hand, they would experience a loss of welfare of -0.61€ per each extra unit (ha) of eroded forest area, and of -0.38€ if the use of the forest is restricted. The WTP of Group 3 for the conservation attribute is 0.44€ (they would pay for conserving biodiversity). They would experience a loss of welfare of -0.61€ for each extra unit of eroded surface. Their WTP for the restriction of the use of the forest is 0.17€, and their WTP for the recreational attribute is 1.06€. The WTP of the Group 4 for the conservation, erosion and restriction attributes is not significant. They would experience a welfare increase of 2.47€ if the forest would be contributing to an increase of tourism. 12 In the study all the values were reported in Moroccan dirham (MAD). However, for this report the values were converted to euro using an exchange rate 1
MAD =0.09€

65
Table 5.9 Outcomes of the latent class model
Attribute Group 1 Group 2 Group 3 Group 4
² coefficients (standard deviation)
CONSERVATION 2.0998
[6.4885] 0.16785***
[0.0459] 0.13763***
[0.0175] 0.0529
[0.1602]
EROSION -0.2306 [8.5802]
-0.36924*** [0.0785]
-0.19187*** [0.0325]
0.3141 [0.2220]
RESTRICTIONS TO THE USE (EXCLOSURES)
3.8165*** [0.8636]
-0.22863** [0.1104]
0.05290*** [0.0171]
0.0413 [0.0804]
RECREATION -32.8970 [141.6337]
22.5547 [319407.3]
0.33203** [0.1298]
1.5309* [0.8896]
PAYMENT -0.8564*** [0.2299]
-0.0545*** [0.0120]
-0.02827*** [0.0031]
-0.0558*** [0.0216]
Source: Mavsar and Farreras, 2011 Table 5.10 Results of the WTP for each of the attributes
Attribute Group 1 Group 2 Group 3 Group 4
EUR/person and year
CONSERVATION not signifcant 0.28 0.44 not signifcant
EROSION not signifcant -0.61 -0.61 not signifcant
RESTRICTIONS TO THE USE 0.40 -0.38 0.17 not signifcant
RECREATION not signifcant not signifcant 1.06 2.47 Source: Mavsar and Farreras, 2011
5.3.3 Benefit transfer method Benefit transfer (BT) is not a valuation method as such, but it is a method that involves transferring economic, or damage, estimates from previous studies (often termed study sites) of similar changes in environmental quality to value the environmental change at the policy site.
The policy uses of the transferred economic estimates include:
• CBA of investment projects and policies aimed at managing forests (e.g., preservation of forests, restrictions on cutting practices, and forest fire prevention measures), or projects that affect forests (e.g., road construction);
• Environmental accounting at the national level, i.e., including externalities of forests in green national accounts; • Environmental costing, i.e., calculating marginal external costs as a basis for the optimal economic management of the
forests and design of optimal regulatory instruments (e.g., environmental charges); • Natural resource damage assessment according to the environmental liability directive, i.e., calculating compensation
payments for acute injuries to forest ecosystems. The demand for accuracy increases when moving down this list of policy uses (Navrud, 2004), however, the most frequent use of BT is in the CBA of projects and policies. There are two primary groups of BT methods (Navrud, 2004):
• Unit value transfer method;
- Simple unit value transfer - Unit value transfer with income adjustments
• Function transfer method.
- Benefit function transfer - Meta-analysis
5.3.3.1 Unit value transfer method
A simple unit value transfer (i.e., from one study, or as a mean value estimate from several studies) is the simplest method to transferring benefit estimates from a study site, or as a mean from several study sites, to the policy site. This method

66
Methods and tools for socio-economic assessment of goods and services provided by Mediterranean forest ecosystems
assumes that the well-being experienced by an average individual at the study site is the same as will be experienced by the average individual at the policy site, and that the change in the environmental amenity being valued is the same at the two sites. Thus, the benefit estimate can be transferred directly, often expressed as a mean WTP (e.g., per household/year, per individual/visit) from the study site to the policy site.
The main problem with simple unit value transfer is that individuals at the policy site may not value ecosystem services the same as the average individual at the study sites. There are two principal reasons for this difference. First, people at the policy site might be different from individuals at the study site in terms of income, education, religion, ethnic group or other socio-economic characteristics that affect their demand for recreation. Second, even if individual preferences at the policy and study sites were the same, the ecosystem services and the change in the good valued, might not be.
It is recommended using the WTP/household/year as the transfer unit, and then aggregating over the total number of affected households to obtain an estimate of total benefits. Using WTP/individual/year might lead to the overestimation of total benefits when aggregated over individuals, as shown by Lindhjem and Navrud (2009).
Unit value transfer for non-use values, (e.g., environmental amenities), from SP studies might be more difficult to transfer than use values (e.g., recreation) for at least two reasons. Firstly, the unit of transfer is more difficult to define. While the obvious choice of unit for use values are consumer surplus per activity day, there is greater variability in reporting non-use values from CV surveys, both in terms of WTP for whom, and for what, time period. WTP can be reported as per household or per individual, and as a one-time payment, annually for a limited time period, annually for an indefinite time, or as an indefinite monthly payment. Secondly, the WTP is reported for one or more specified discrete changes, e.g., forest ecosystem services, and not on a marginal (e.g., per hectare) basis.
WTP, as a one-time amount, might lead to an underestimation of annual WTP, as reported WTP will be the present value of a flow of annual WTP amounts and will be constrained by income of the respondents in the year they report their one-time WTP amount. Using this transfer unit for a specified change in environmental amenities also avoids the procedure of scaling up, or down, the reported WTP in relation to the size of the area at the policy site. Such scaling assumes a constant value per hectare and linearities in valuation (e.g., the marginal utility are constant over the whole range), which does not seem to be the case in practice (see Figure 5.1) (see e.g. Lindhjem, 2007; Lindhjem and Navrud, 2008).
The simple unit value transfer approach should not be used for transfers between countries with different income levels and costs of living (or between regions with very different income levels within a country). To conduct this operation properly, the unit value transfer with income adjustments should be applied, using income elasticities of WTP between 0 and 1 (Kriström and Riera, 1996). When there is a lack of data on the income levels of the affected populations at the policy and study sites, gross domestic product (GDP) per capita figures can used as proxies for income in international BT. However, this approach could provide incorrectly estimated results in BT between countries, when income levels at the local study and/or policy site deviates from the average income level of the countries.
Using official exchange rates to convert transferred estimates from the value at the study site, such as euro, to the national currency does not reflect the true purchasing power of currencies, since the official exchange rates reflect political and macroeconomic risk factors. Thus, purchasing power parity, otherwise called adjusted exchange rates, should be used when transferring values from other countries.
5.3.3.2 Function transfer method
Transferring the entire benefit function13 is conceptually/theoretically more appealing than just transferring unit values, because more information is effectively taken into account in the transfer. However, transfer evidence is mixed in regard to whether function transfers performs better than unit value transfers (Bateman and al., 2009; Ready and al., 2004). Often, it seems that the benefit function transfer does not reduce transfer errors significantly, in comparison to a simple unit value transfer.
The benefits set to be transferred from the study site or several study sites to the policy site can be estimated using either RP methods like TC and HP or SP methods like the CV and CM. For example, for a CV the benefit function can be written as:
𝑊𝑇𝑃𝑖𝑗 = 𝛽0 + 𝛽1𝐺𝑗 + 𝛽2𝐻𝑖𝑗 + 𝜀
Where: WTPij is the willingness to pay of household i for site j; Gj is the set of characteristics of the environmental good at site j, and Hij is the set of characteristics of household i at site j, and 𝛽0, 𝛽1 and 𝛽2 are sets of parameters; and 𝜀 is the random error.
To implement this approach, first a study in the existing literature has to be found, with estimates of the constant 𝛽0, and the sets of parameters, 𝛽1 and 𝛽2. Then data on the two groups of independent variables, G and H, at the policy site have to be collected, and inserted into the equation, and estimate household WTP at the policy site.
13 The benefit function statistically relates peoples’ willingness to pay to characteristics of the ecosystem and the people whose values were elicited.

67
Instead of transferring the benefit function from one selected valuation study, results from several valuation studies could be combined in a meta-analysis to estimate one common benefit function (see Lindhjem, 2007; Zandersen and Tol, 2009 for meta analyses of forest externalities). The function transfer enables the researcher to evaluate the influence of a wider range of the environmental good or service characteristics , the characteristics of the samples used in each analysis (i.e., including characteristics of the population affected by the change in environmental quality), and the modelling assumptions. In practice, however, detailed characteristics of the good or service per study site and the population are often not reported in the primary studies.
The regression equation for a meta-analysis would look similar to above equation, but a set of variables reflecting differences in the environmental valuation method applied needs to be added; i.e., Cs = characteristics of the methodology applied in study site; as meta analyses typically find that differences in valuation methodologies account for a significant part of the variation in the mean WTP across studies; WTPs. Thus, the meta-analysis equation would be:
𝑊𝑇𝑃𝑆 = 𝛽0 + 𝛽1𝐺𝑆𝑗 + 𝛽2𝐻𝑆𝑗 + 𝛽3𝐶𝑆 + 𝜀
5.3.3.3 Main steps in the application of the benefit transfer method
Based on the general guidelines for benefit transfer there is an eight step procedure (Riera and Signorello, 2012):
Step 1: Identify the change in the environmental goods and services to be valued at the policy site
The environmental goods and services that should be valued must be defined, their baseline level (e.g. frequency of recreational use at the policy site, and availability and quality of substitute sites), and the magnitude and direction of change.
Step 2: Identify the affected population at the policy site
It is important to identify the size of the affected population at the policy site before the review of the valuation literature. The transferred value should come from the same type of affected individuals in terms of spatial scale. Population characteristics also need to be similar in order to ensure they share the same type and level of welfare determinants.
For example, when valuing the use value of recreation activities, the relevant affected population is the recreationists. However, if estimating both use and non-use values, and the policy site is only of local importance (e.g. a small forest area with many substitute sites regionally), only the local population (e.g., municipality) is used.
For use values, the number of individuals (e.g., recreationists) should be estimated before and after the change. In the case of non-use values (or use and non-use values combined) the number of households should be the unit of aggregation at the relevant geographical scale (community, regional/county or national level).
Step 3: Conduct a literature search to identify relevant primary studies
The next step is to conduct a literature search to identify relevant primary studies. The preferred source are database, but supplemented by journal and general web search. Databases like EVRI14, ENVALUE15 and ValueBaseSWE16 can be used to identify similar studies from the same country or other closely located countries (which share the same type of institutional and cultural context) (Lindhjem and Navrud, 2008). Journal articles and databases of valuation studies often do not have all the data needed to determine whether a study is relevant. Thus, if available, the full study report should be collected.
Step 4: Assessing the relevance/similarity and quality of study site values for transfer
The quality of the relevant valuation studies is assessed in terms of scientific soundness and richness of information. Desvousges and al. (1998) identify the following criteria for assessing the quality and relevance of candidate studies for transfer:
• Scientific soundness - the transfer estimates are only as good as the methodology and assumptions employed in the original studies:
- Sound data collection procedures (for SP surveys this means either personal interviews, or mail/internet surveys with high response rate (>50 %), and questionnaires based on results from focus groups and pre-tests to test wording and scenarios);
- Sound empirical methodology (i.e. large sample size; adhere to “best practice”-guidelines guidelines for SP and RP studies, e.g., Riera and Signorello, 2012);
- Consistency with scientific or economic theory (e.g. links exists between endpoints of dose-response functions and the unit used for valuation, statistical techniques employed should be sound; and CV, CM, HP and TC functions should include variables predicted from economic theory to influence valuation).
14 Available at: www.evri.ca 15 Available at: http://www.environment.nsw.gov.au/envalue/StudyCnt.asp 16 Available at: http://www.beijer.kva.se/valuebase.htm

68
Methods and tools for socio-economic assessment of goods and services provided by Mediterranean forest ecosystems
• Relevance - the original studies should be similar and applicable to the new context:
- Magnitude (and direction) of change in the ecosystem goods and services should be similar; - Baseline level of the environmental good or service should be similar; - Affected eco-system services and environmental goods should be similar; - The affected sites should be similar when relevant (e.g. when assessing recreational values); - Duration and timing of the impact should be similar; - Socio-economic characteristics of the affected population should be similar; - Property rights, culture, institutional setting should be similar.
• Richness in detail – the original studies should provide a detailed dataset and accompanying information:
- Identify full specification of the primary valuation equations, including precise definitions and units of measurements of all variables, as well as their mean values;
- Explanation of how substitutes (and complementary) goods or services per sites were treated; - Data on participation rates and extent of aggregation employed; - Provision of standard errors and other statistical measures of dispersion.
All three criteria and their components are equally important for assessing the relevance and quality of the study. Based on these three criteria, Riera and Signorello (2012) developed a check list for judging the similarity of characteristics of the good or service and population at the study sites versus policy site for forest externality valuation studies:
• Characteristics of the good:
- Similar good or service? (i.e. similar type forest, similar use and/or non-use value components; similar recreational activities, similar ecosystem services);
- Similar baseline, size and direction of change in the good or service valued? (To avoid scaling up and down values according to the size of the area, involving strict assumptions in terms of e.g. constant value per ha of use and/or non-use values; rather consider foreign study sites with nearly similar size than domestic study sites with a very different scale. The same applies to the baseline and the direction of the change. However, the general recommendation is to choose a domestic study site geographically as close as possible);
- Similar availability of substitute sites? (For use values: recreational sites; for non-use values: national parks and other preserved areas and the ecosystem services they contain);
- Similar forestry management regimes? (Similar property rights, similar access rights to private forests for recreation, etc.).
• Population characteristics:
- Similar average income level (and income distribution)? (If not, income adjustments should be made when performing the value transfer);
- Similar gender, age and educational composition?; - Similar size of affected population? Expected similar distance decay, if any, in non-use values?; - Similar attitudes to forest preservation? (attitudinal and cultural factors).
Step 5: Select and summarize the data available from the study site(s)
Several parallel approaches should be applied, and the results from these should be used to present a range of values: studies providing low and high estimates, which can define a lower and upper bound for the transferred estimate, respectively. Data on the mean value estimate and standard error, and specific spatial transfer errors should be collected if available.
Relevant meta-analyses should be consulted (e.g. Rosenberger and Loomis, 2000 for recreational activities, and Lindhjem, 2007 for both recreational use and non-use values) to see if the scope of these is narrow enough to provide relevant information about the estimates to be transferred. The scope of the meta-analysis could be too wide to produce reliable estimates if the meta-analysis consists of studies which vary a lot in terms of methodology, and the environmental good considered.
Step 6: Transfer value estimate from study site(s) to policy site
This step consists of three main activities:
Determine the transfer unit
The recommended unit of transfer for use and non-use values is the WTP per individual (household) and year. However, in some cases also other unit values can be used. For example, consumer surplus per day (or per visit) for recreation or unit costs for carbon sequestration (e.g., cost per ton of carbon).

69
When using WTP per ha of an ecosystem or landscape type it assumes both the same size of the affected population and that the value per ha is constant. However, empirical evidence shows that WTP does not increase proportionally with the number of ha of ecosystems or landscape types (for non-timber benefits of forests; see Lindhjem, 2007). Since SP surveys clearly show that WTP per unit of area varies widely, it is not recommended converting households´ stated mean WTP for a discrete change in environmental quality to marginal values like WTP per ha.
Determine the transfer method for spatial transfer
If the policy site is considered to be very close to the study sites in all respects, unit value transfer can be used. If there are several equally suitable study sites to transfer from, they should all be evaluated and the transferred values calculated to form a value range.
For unit transfers between countries, differences in currency, income and cost of living between countries can be corrected for by using purchase power parity (PPP) corrected exchange rates17. Within a country unit value transfer can be used with an adjustment for differences in income level, and an income elasticity of WTP lower than 1.
Function transfer can be used if value functions have sufficient explanatory power18 and contain variables for which data is readily available at the policy site. Most often the “best” model is based on variables where new surveys have to be conducted at the policy site to collect data. This in most cases will require similar effort (resources and time) as a complete valuation study.
In general unit transfer method with income adjustment (where necessary) is recommended as the simplest and most transparent way of transfer both within and between countries. This transfer method has in general also been found to be just as reliable as the more complex procedures of value function transfers and meta-analysis. This is mainly due to the low explanatory power of WTP functions of SP studies, and the fact that methodological choice has a stronger impact on the results than the characteristics of the site and the affected populations.
Determine the transfer method for temporal transfer
The standard approach to adjust the value estimate from the time of data collection to current currency is to use the consumer price index (CPI) for the policy site country. If values from a study site are transferred outside the policy site country, the first point is to convert to local currency in the year of data collection; using PPP corrected exchange rates in the year of data collection, and then use the national CPI to update to current-currency values.
Step 7: Calculate total benefits or costs
For non-use values, mean WTP/household/year is multiplied by the total number of affected households to derive the annual benefit or cost. If WTP at the study site is stated as annual WTP for e.g. 5 or 10 years, the total benefits or costs should be calculated as the present value (PV) over that same period. On the other hand, if WTP is stated as one-time amounts, the amounts must be viewed as a present value (of all benefits from the environmental good in question).
The general equation for calculation the present value of the benefits PV (B) is:
𝑃𝑉(𝐵) = �𝐵𝑡(1 + 𝑟)𝑡�
𝑇
𝑡=0
where Bt is the total benefits in year t, T is the time horizon (for the stated WTP amounts) and r is the social discount rate.
If the time horizon is not stated in the WTP question in SP surveys, it is assumed that this is an annual payment over an infinite time horizon. In this case, and if the annual benefits Bt are the same each year:
𝑃𝑉(𝐵) = 𝐵𝑡 𝑟�
Annual benefits Bt are equal to aggregated WTP over the affected population (WTPtot), which can be calculated as:
WTPtot = n x WTPi
where n is the number of affected households, and WTPi is mean WTP for household i. Since WTP per household varies between different parts of the affected population (e.g. with distance from the site, whether users and/or non-users are considered etc.), the estimates from the study site(s) should be based on the same type of affected population as at the policy site.
When calculating use values, in the above equations households are replaced by individuals (e.g., recreationists). Hence, total value of the change is estimated by multiplying the consumer surplus per activity day with the increase or decrease in number of activity days. For uses other than recreation, values are often elicited on a household basis, and the same procedure as for non-use values can be employed. 17 For example: http://www.oecd.org/dataoecd/61/56/1876133.xls 18 Roughly said to be having a higher adjusted R2 than 0.5, i.e. explaining more than 50 % of the variation in value

70
Methods and tools for socio-economic assessment of goods and services provided by Mediterranean forest ecosystems
Step 8: Assess the uncertainty and transfer error / Conduct a sensitivity analysis
Validity tests of benefit transfer (Navrud, 2004) indicate that the transferred economic estimates should be presented with error bounds of + 40 %. However, if the sites are very similar, or the primary study was designed with transfer to sites similar to the policy site in mind, an error bound of + 20 % could be used.
If the study and policy sites are not quite close, unit transfer could still be used, but arguments for over- and underestimation in the transfer should be listed and the unit value should be presented with error bounds of + 100%. Ready and Navrud (2006) summarize the experience from international validity studies and find that these transfer errors are not different from those observed for transfers within a country. They find that the average transfer error for international benefit transfers tends to be in the range of 20% to 40%, but individual transfers have errors as high as 100–200%.
Riera and Signorello (2012) define four categories of how good the fit is between the study site and the policy site (Table 5.11). The level of fit is based on the check list for judging the similarity between the study and policy sites (see step 4). Table 5.11 Four categories of similarity between the study site and policy site, and corresponding approximate transfer errors when performing unit value transfer
Category Level of fit between primary study and
policy site Percentage transfer error (%)
1 Very good fit + 20 2 Good fit + 50 3 Poor fit + 100
4 Very poor fit Discard primary study for unit value transfer (meta analysis is the only option)
The transfer errors in the table 5.11 refer to the mean WTP estimate, and would come in addition to the uncertainty of the valuation methods applied in the primary valuation study. The uncertainty about the size of the affected population would also have to be added to the estimate of total benefits.
When there is a need for value estimates of environmental goods and services for policy purposes, it is recommended to conduct a CBA or conducting a new valuation study. This CBA should help to determine whether the costs of a new valuation study are worth the benefits in terms of taking the wrong decision.
5.3.3.4 Strengths and weaknesses of the benefit transfer method
Strengths of the benefit transfer method
• Benefit transfer is typically less costly than conducting an original valuation study. • Economic benefits can be estimated more quickly than when undertaking an original valuation study. • The method can be used as a screening technique to determine if a more detailed, original valuation study should be
conducted. • The method can easily and quickly be applied for making gross estimates of recreational values. The more similar the
sites and the recreational experiences, the fewer biases will result.
Weaknesses of the benefit transfer method:
• Benefit transfer may not be accurate, except for making gross estimates of recreational values, unless the sites share all of the site, location, and user specific characteristics.
• Good studies for the policy or issue in question may not be available. • It may be difficult to track down appropriate studies, since many are not published. • Reporting of existing studies may be inadequate to make the needed adjustments. • Adequacy of existing studies may be difficult to assess. • Extrapolation beyond the range of characteristics of the initial study is not recommended. • Benefit transfers can only be as accurate as the initial value estimate. • Unit value estimates can quickly become dated.
5.3.3.5 Applications of the benefit transfer method
As already mentioned, benefit transfer is not a valuation method, but just transfers values from existing valuation studies. Thus, the benefit transfer method can be used for the valuation of any ecosystem good or service for which valuation studies are available. However, the benefit transfer accuracy very much depends on the quality of the initial valuation

71
studies and the similarity of the characteristics of the valued ecosystem of ecosystem goods and services, and the population characteristics.
In general, benefit transfer based on SP surveys (especially CV) usually have much lower explanatory power than functions based on TC and HP studies. Thus, it could be more relevant to use function transfer transferring estimates from RP methods.
Benefit transfer studies carried out in the field of environmental valuation have been applied to a variety of fields, including the provision of wetland functions across North America and Europe (Brouwer and al., 1999), fresh water fishing (Sturtevant and al., 1995), air pollution (Smith and Huang, 1995), benefits of endangered species (Loomis and White, 1996), visibility in national parks (Smith and Osborne, 1996) and general outdoor recreation (Smith and Kaoru, 1990a and Smith and Kaoru, 1990b; Walsh and al., 1992).
Two function transfer analysis in Europe have focused specifically on recreation in forests as opposed to general outdoor recreation. These have focused on studies carried out in the UK (Bateman and al., 1999; Bateman and Jones, 2003). Two further European studies have focused on wider non-market benefits derived from forests such as the value of forest protection, biodiversity and multiple use forestry in Norway, Sweden and Finland (Lindhjem, 2007) and in Finland (Pouta and Rekola, 2005).
Zandersen and Tol (2009) conducted a function transfer method to study recreational values in Europe. This study systematically analysed the variation in data from different sources, to identify the extent to which methods, design and data affect reported forest recreation values. Only studies conducted in Europe that have applied the travel cost method had been considered. A total of 26 studies from nine European countries published between 1977 and 2001 were used.
The data indicates that there is a substantial variance in forest recreation values across studies, ranging from 0.66 to 112€ per trip with a median of 4.52€. Despite the similarities in valuation methods applied (all studies were conducted with travel cost method) and environmental service valued, the summarised benefit estimates reflect methodological, geographical and temporary differences. Namely, the values are influenced by the measurement of value (e.g., value per trip, per day or per season), by the travel cost approach (i.e., zonal versus individual travel cost method), by the definition of costs (i.e., inclusion and level of opportunity cost of time, composition of car-borne travel costs) and other methodological issues (e.g., inclusion of substitute sites, postal or face to face interviews, or specification of functional form of the meta-analysis).
Also, the inclusion of exogenous data on location and site characteristics reveals that site-specific characteristics such as size, age diversity, area of open land within a forest site have distinctive effects on benefits summarised in a meta-analysis.
According to our best knowledge, there were no systematic implementations of the benefit transfer.
5.4 WHICH METHOD TO USE ? This chapter lists several methods for the valuation of forest goods and services. Some of them (e.g. travel cost method, hedonic pricing) are relaying on the revealed behaviour of the users for these goods, while others are using surveys and directly asking users about their WTP for certain goods or services (e.g. contingent valuation method, choice modelling).
The advantage of the first group of methods (revealed preference methods) is that they are based on actual market behaviour of users of the non-market goods and services (e.g. paying a higher price for a house because of a nice forest view); however, their applicability is limited only to a few non-market forest goods and services (recreation, tourism and landscape aesthetics).
The methods in the second group (stated preference methods) can be applied to all types of non-market forest goods and services. Although SP methods can also be employed to measure use values, they are thought to be the only option available for estimating these services that are valued for non-use purposes (Kramer and al., 2004).
However, their main disadvantages are that they are based on hypothetical situations (no real market transaction is performed and the received answer might not reflect the real situation) and their application is complex (specialists are needed for the development of the questionnaire and for data analysis) and time consuming. Nevertheless, in the last decade the methodology and knowledge on these methods have improved considerably, enabling sound estimation of economic values of non-market goods and services.
Table 5.12 and 5.13 show an overview of the valuation methods and in which cases they are suitable. The recommendations are very general, and are based on the objective to be less time and resource consuming. Mostly RP methods are preferred because they are based on actual behaviour, that is always more reliable than hypothetical behaviour. Furthermore, RP methods rely on historical data (decision already made) while SP methods are more flexible, allowing the assessment of hypothetical future situations/policies.

72
Methods and tools for socio-economic assessment of goods and services provided by Mediterranean forest ecosystems
Table 5.12 Valuation methods of forest goods and services
Method group
Valuation method
Forest good or service valued
Value captured
Affected population captured
Benefits of method
Limitations of
method
Revealed preference methods
Market price
Those that are traded in markets, mainly
resources (e.g., timber, fuel-wood, cork, non-wood forest products)
Direct and indirect
use Users
Market data available and
robust
Limited to market goods and services
Cost-based *
Mainly ecological services: soil
protection, water protection, climate
regulation
Direct and indirect
use Users
Market data available and
robust
Can potentially overestimate actual
value
Hedonic pricing
Services that contribute to the
quality of attributes of a certain market good,
e.g., air quality, landscape aesthetics,
noise reduction
Direct and indirect
use Users Based on
market data
Very data intensive and limited mainly to
data related to property
Travel cost All ecosystem services
that contribute to recreational activities
Direct and indirect
use Users
Based on observed behaviour
Limited to recreation and problematic for multiple destination
trips
Stated preference
method
Contingent valuation All goods and services Use and
non-use Users and non-users
Able to capture all
use and non-use values
Potential bias in response,
hypothetical market (not observed
behaviour), resource-intensive
Choice experiment All goods and services Use and
non-use Users and non-users
Able to capture all
use and non-use values
Potential bias in response,
hypothetical market (not observed
behaviour), resource-intensive
* Cost based methods category considers all three approaches (damage costs avoided, replacement costs and substitution costs) which are equally applicable.

73
Table 5.13 Overview of valuation methods used to valued forest goods and services
Group Forest Good/Service Valuation method*
MP CB** HP TC CV CE
Resources
Industrial wood + o - - - - Fuelwood + o - - - - Cork + o - - - - Food products + o - - - - Fodder and forage + + - - - - Decorative material + o - - - - Hunting and game products + o - - - - Pharmaceuticals, Cosmetics and other raw materials for industrial application
+ o - - - -
Biospheric
Biodiversity protection - o - - + + Climate regulation - + - - + + Air quality regulation - + + - + + Carbon sequestration o + - - + +
Ecological
Health protection - + - - + + Water regulation - + - - + + Water purification o + - - + + Soil protection o + - - + +
Social Recreation o o - + + + Tourism o o - o + +
Amenities Spiritual and cultural services - - - - + + Historical and educational services - - - - + + Aesthetic services - o + o + +
*MP – market price based methods; CB – cost based methods; HP – hedonic pricing method; TC – travel cost method; CV – contingent valuation method; CE – choice experiment method ** Cost based method category considers all three approaches (damage costs avoided, replacement costs and substitution costs), which are equally applicable. +- typically used; o – sometimes used; - not applicable
All these methods are potential tools; employing one or the other will depend on the objectives of the study and of the degree of familiarity the researcher has with the different methods. The final selection of the method depends on many factors, like: (i) type and number of objects to be valued; (ii) relevant population (e.g. users or non-users or both; geographical scope (local, regional, national, international); (iii) data availability (e.g. restricted data access – data on house values); (iv) available time and financial resources; (v) team (e.g. experience).
The benefit transfer method is an alternative to RP and SP methods, as it typically requires less resources and time. However, it is not a valuation method, as it only uses values estimated in other valuation studies, which are performed for similar goods or services, and then transfers this values to estimate the value of goods or services on another site by using correction factors or meta-data analysis. However, the method is still relatively new and no widely accepted standards for its application have been adopted yet. Thus, the obtained values can be significantly biased (e.g., in some cases estimation errors above 100% have been found). Therefore, it should be used with care and precaution as a result of its limitations (e.g. accuracy of the estimated values depending on the accuracy of values used for transfer).

74
Methods and tools for socio-economic assessment of goods and services provided by Mediterranean forest ecosystems
6 Recommendations on pilot sites
The objective of this chapter is to present currently important goods and services on the four selected pilot sites and the expected future changes that could influence the provision of these forest goods and services. This data is then completed with recommendations regarding the methods that could be applied to estimate the economic value of the potential changes in goods and services provision.
6.1 INTRODUCTION Based on the questionnaires distributed to the thematic experts, information was collected about forest goods and services currently important at the four selected pilot sites (Chréa National Park in Algeria, Jabal Moussa Biosphere Reserve in Lebanon, Düzlerçami forest in Turkey, and Maamora forest in Morocco). Furthermore, the main drivers of change and their possible impact on the provision of forest goods and services on these sites were explored. This information served to develop recommendations on methods that could be applied for the valuation of changes in the provision of forest goods and services.
When developing these recommendations following general rules were considered:
1. Literature and established good practice guidelines: the recommendations follow the established scientific knowledge and guidelines available in literature. Furthermore, they are based on the acquired expertise of the authors of this report.
2. Limited resources and time: the implementation of the evaluation is foreseen to take place in the second year of the project. Certain valuation methods require significant financial resources and participation of different stakeholder groups, which is often very time consuming. Thus, a general guideline was to always select methods that would be less resource demanding and time consuming.
Thus, it was decided that the evaluation of management alternatives should be done with the CBA. The application of this method requires that all impacts of alternative management approaches are estimated in monetary terms. Hence, in the following sections recommendations have been made on which of these methods could be applied on the selected pilot sites.
6.2 PILOT SITE: CHRÉA NATIONAL PARK, ALGERIA
6.2.1 Most important goods and services The main goods and services provided by the forest of Chréa are:
Direct use values: main identified direct use values are leisure, tourism, and historic and educational services. They are provided on 80% of the protected area. The main beneficiaries are visitors, and its provision trend seems to be increasing. Aesthetic services were also identified. They are provided by the whole surface of the protected area, and benefit the local rural and urban population, as well as visitors. The trend of provision seems to be increasing.
Direct use values with market prices: about 50% of the surface of the protected area allows food production, which seems to have a constant provision level. Approximately 10%-20% of the pilot site area provides possibilities to collect decoration materials (decreasing trend), pharmaceuticals, cosmetics and other raw materials for industrial application (increasing). The main beneficiaries of this group of products are the local rural and urban population and site visitors.
Indirect use values: between 80%-100% of the pilot site area provides a variety of indirect use - ecological services. Among these water cycle regulation (constant trend) and carbon sequestration (increasing trend) are benefiting the whole society. Furthermore, 100% of the protected area provides ecological services that benefit local rural population, as well as the local urban population, and visitors. Those services are: water purification (constant trend), water protection (increasing trend), health protection (increasing trend), and, finally, climate regulation (constant trend), which also affects a wider range of beneficiaries.
Non-use values: main identified non-use forest services are existence and heritage values, which are mainly derived from biodiversity protection. These services are provided on the whole pilot site area, it benefits the whole society, and the provision trend seems to be constant.

75
6.2.2 Expected changes in the provision of goods and services The main drivers that affect the provision of goods and services are:
• Increase in number of forest visitors, which affects negatively the biodiversity protection and forest aesthetics. • Forest fires, which also affect negatively the biodiversity protection, as well as forest aesthetics, and soil protection. • Illegal harvesting of non-wood forest products (medicinal plants, lichens, mushrooms…) affects negatively the
biodiversity protection and forest aesthetics.
6.2.3 Recommendation for the valuation of changes in the provision of goods and services
Table 6.1 summarises the above mentioned drivers and goods and services that would be affected, and proposes methods that could be applied for the valuation of different impacts. Table 6.1 Overview of the recommended valuation methods for pilot site Chréa National Park, Algeria
Main goods and services affected
Main drivers affecting the provision Recommended
valuation methods* Alternative valuation
methods*
Biodiversity protection
Significant increase of forest visitors MP CV or CE Forest fires CB (DA) -
Illegal harvesting of non-wood forest products MP CV or CE
Soil protection Forest fires CB (DA or RC) -
Aesthetic
Significant increase of forest visitors CV or CE - Forest fires CV or CE -
Illegal harvesting of non-wood forest products CV or CE -
*MP – market price based methods; CB – cost based methods; DA – damage cost avoided; RC – replacement cost; HP – hedonic pricing method; TC – travel cost method; CV – contingent valuation method; CE – choice experiment
The main services that would be affected are biodiversity protection, aesthetics and soil protection.
According to the case study description, it seems that this site is rather important in terms of provision of non-wood forest products. Thus, a loss in biodiversity would also have negative effects on the quantities and quality of these products. Hence, to assess the value of biodiversity protection market price based method would be applied to assess the losses of consumer surplus due to decreased harvesting of non-wood forest products. Alternatively, if sufficient resources are available, the biodiversity protection could also be valued by the application of stated preference methods. In this case, the value of certain or a number of plant and animal species, which could be lost if no improvement in management is implemented, would be estimated.
In the case of soil protection the valuation can be performed with cost based methods. By applying the replacement cost method, the cost of replacing the lost soil would be assessed. Alternatively, the damage cost avoided method would consider the cost of protection measures (e.g., barriers) to estimate the value of soil protection.
Finally, for aesthetics services, the application of stated preference methods (choice experiment or contingent valuation) is recommended where visitors and residents could assess the economic value of the current and alternative landscape images. However, it should be noted that this would require significant resources and expertise.
6.3 PILOT SITE: JABAL MOUSSA BIOSPHERE RESERVE, LEBANON
6.3.1 Most important goods and services The main goods and services provided by the forest of Jabal Moussa are:
Direct use values with market prices: the main identified direct values are ecotourism, and cultural values. Ecotourism benefits the local rural and urban population, and the visitors. Its trend of provision seems to be increasing. Furthermore, a number of other direct use values were listed:
• Charcoal and firewood benefit forest owners and the local rural population, and its trend of provision is constant; • Aromatic plants (e. g., Origanum syriacum, Salvia fruticosa), whose main beneficiaries are forest owners, local rural
population, the local urban population, and the traders (trend of provision increasing); • Medicinal plants (e. g., Myrthus communis), whose main beneficiaries are forest owners and the local rural population
(constant trend of provision);

76
Methods and tools for socio-economic assessment of goods and services provided by Mediterranean forest ecosystems
• Honey production, whose main beneficiaries are forest owners, local rural and urban population, and the retailers (constant trend of provision);
• Game (e. g., migratory birds), whose main beneficiaries are forest owners, the local rural population, the local urban population (constant trend of provision);
• Pastures, whose main beneficiary is the local rural population (constant provision trend); • Moreover, fruits harvesting (e. g., pinions of Pinus pinea) benefits local rural population (constant provision trend).
Non-use values: the main non-use forest service identified for the forest of Jabal Moussa is the conservation of the Lebanon Cedrus (Cedrus libani), as a cultural and natural legacy. This beneficiary of this service is the whole population of Lebanon.
6.3.2 Expected changes in the provision of goods and services The main drivers that affect the provision of the mentioned goods and services are:
• Climate change (increased temperatures, decreased rainfall) affects negatively the production of honey, the harvesting of fruits, and of aromatic and medicinal plants, as well as the production of fodder.
• Forest fires have a negative effect on ecotourism and production of fruits, aromatic and medicinal plants. In exchange, they affect positively the production of charcoal.
• Urbanisation affects negatively ecotourism, production of honey, fruits, and aromatic and medicinal plants. • Implementation of a ministerial decision for the protection of medicinal and aromatic plants will affect positively the
production and harvesting of aromatic and medicinal plants.
6.3.3 Recommendation for the valuation of changes in the provision of goods and services
The expected changes in the provision of forest goods and services, will mainly affect the provision of non-timber forest products and the possibilities for ecotourism (table 6.2).
This pilot site is considered as an important source of non-timber forest products, like honey, fruits, medicinal and aromatic plants, fire wood. Thus, a loss in the provision of these products would have a negative effect on the income generation possibilities for the local population and visitors. Hence, to assess the value of these products the market price based method could be used. With the help of this method the losses of consumer surplus due to decreased harvesting of non-wood forest products would be estimated. An alternative approach would be to estimate the cost of replacement of some of these products (e.g., fodder), with alternative products (e.g., barley).
Table 6.2 Overview of the recommended valuation methods for pilot site Jabal Moussa Biosphere Reserve, Lebanon
Main goods and services affected
Main drivers affecting the provision Recommended
valuation methods* Alternative valuation
methods* Fire wood (charcoal) Forest fires MP
Honey production Climate change MP - Urbanisation MP -
Collecting of fruits, medicinal and aromatic plants
Climate change MP - Forest fires MP -
Urbanisation MP - Implementation of a ministerial decision for the protection of medicinal and aromatic
plants MP -
Pasture Climate change MP CB (RC)
Ecotourism Forest fires MP TC
Urbanisation MP TC *MP – market price based methods; CB – cost based methods; DA – damage cost avoided; RC – replacement cost; HP – hedonic pricing method; TC – travel cost method; CV – contingent valuation method; CE – choice experiment method
Another important impact could be the decrease in number of visitors (ecotourism) to this pilot site, due to the impacts of forest fires and urbanisation in the area. The estimation of the economic loss caused by decreased ecotourism activities could be done with market prices. The approach would consider the lost number of visitors and consequently the loss of income for the local/regional economy.
This loss could be estimated based on the average expenditure per visitor (e.g., accommodation, entrance fees, food) and the number of lost visitors. Alternatively this could be estimated by using the travel cost method, where the number of visitors and their consumer surplus per visit would be estimated on-site.

77
6.4 PILOT SITE: MAAMORA FOREST, MOROCCO
6.4.1 Most important goods and services The main goods and services provided on the whole area of the Maamora forest and showing an increasing trend in the demand by the population, are:
Direct use values: Recreation is provided to the local population and to visitors. Further, these activities are a source of employment for the rural and urban local population. There is a vast diversity of other forest products produced in the Maarmora forest that benefit the forests administration and the local rural and urban population:
• Cork extraction, which mainly benefits the administration and the rural population; • Extensive grazing is benefiting local rural and urban population; • Truffles produce benefits for the local rural and urban population; • Fuel wood is important for the whole society, although it is in particular important for the local residents.
Indirect use values: soil protection, air purification and carbon sequestration are the main indirect use values provided by the Maamora forests and they benefit the whole society.
Non-use values: biodiversity enhancement is provided on the whole pilot site area, and is benefiting the whole Moroccan society.
6.4.2 Expected changes in the provision of goods and services The main drivers that affect the provision of the goods and services mentioned below are a compilation of the two contributors that seem to have filled in the form:
• Intensification of agriculture, which is expected to be triggered by the adoption of a policy that should prevent migration from rural areas. Most likely this will increase the production of food and fodder but, due to the likely increase pressure on the resource, the forest cover is expected to be reduced. Therefore soil protection and biodiversity protection will be reduced.
• Overgrazing may increase the erosion processes and the availability of water. On the other hand the decreased density of forest stands, may have a mitigation impact on forests fires.
• Development of tourism in the area will increase recreational opportunities for the visitors and the revenues from this activity for local population. On the other hand, it is very likely that the traditional activities linked to the use of forest products will gradually disappear, entailing a loss of knowledge.
• Implementation of forest conservation policy, that foresees to increase the quality and the protection of forests. This program is linked to a program of touristic enhancement. A significant effort will be made in reducing forest fires to ensure with more security to the visitors and maintain the forest cover. This program will increase the tourism in the area and the fire protection, while it is expected that it will decrease fuel wood production and water provision.
6.4.3 Recommendation for the valuation of changes in the provision of goods and services
The main drivers and expected changes in the provision of goods and services are summarised in table 6.4.
Table 6.3 Overview of the recommended valuation methods for pilot site: Maamora forest, Morocco
Main goods and services affected Main drivers affecting the provision Recommended
valuation methods* Alternative valuation
methods* Fuel wood Overgrazing MP CB (RC)
Fodder Urbanisation CB (RC) MP Overgrazing CB (RC) MP
Soil protection Urbanisation CB (DA) CB (RC) Overgrazing CB (DA) CB (RC)
Recreation Intensive forest recreation TC CV or CE
Implementation of a strategy for protection of urban and peri-urban forests TC CV or CE
Aesthetics Implementation of a strategy for protection of urban and peri-urban forests CV or CE HP
Waste Intensive forest recreation CB (DA) -
Biodiversity Urbanisation CV or CE MP
Intensive forest recreation CV or CE MP *MP – market price based methods; CB – cost based methods; DA – damage cost avoided; RC – replacement cost; HP – hedonic pricing method; TC – travel cost method; CV – contingent valuation method; CE – choice experiment method

78
Methods and tools for socio-economic assessment of goods and services provided by Mediterranean forest ecosystems
For the valuation of the economic value of grazing (fodder) the replacement cost method could be used, where the costs of alternative grazing possibilities would be considered. Another possibility would be to use market prices of the lost fodder units.
A similar approach would also be taken in the case of fuel wood where the replacement of fuel wood by alternative energy sources would be considered. In this case the price of alternative energy and the costs of replacing the current energy generating equipment (e.g., stoves) should be considered. The second possible approach would be the calculation of the lost consumer/producer surplus, due to reduced fuel wood consumption/production.
In the case of soil protection the valuation can be performed by applying the replacement cost method to assess the cost of replacing the lost soil (e.g., the cost of transportation and distribution of new soil). Alternatively, the damage cost avoided method would take into account the cost of protection measures (e.g., barriers) to estimate the value of soil protection.
Recreation value would be estimated with the help of the individual or zonal travel cost method. To accomplish this task information on the number of visits and the costs incurred by visitors to reach the forest for recreation activities should be collected.
Improvement of landscape aesthetics would be another positive effect of the implementation of a strategy for protection of urban and peri-urban forests. In this case stated preference methods (contingent valuation of choice experiment) would be the first choice. However, an alternative would be the hedonic pricing method as it is expected that housing prices in the area would reflect the improved forest aesthetics. Although, the application of a hedonic pricing method is very dependent on the real estate market data availability.
It is expected that waste accumulation would be one of negative effects of increased recreation activities. To estimate the economic value of this negative effect, the damage cost avoided method could be applied. In this case the value would be assessed costs of waste removal, which would be needed to avoid ecosystem damage.
Finally, to estimate the value of biodiversity enhancement most likely one of the stated preference method (contingent valuation method or choice modelling) would be applied. Although, these methods are complicated and costly in application, they would provide good information about the social value of biodiversity (e.g., providing the value of non-use values). Depending on the exact type of ecosystem services considered, an alternative approaches could be taken. For example, in the case of hunting or collection of certain plant species, market value of the collected products or hunting permits can be used.
6.5 PILOT SITE: DÜZLERÇAMI FOREST, TURKEY
6.5.1 Most important goods and services The main goods and services provided by the forest of Düzlerçami forest are:
Direct use values: about 20% of the area is tourism and recreation activities benefit visitors, but are also important for the local population. It is expected that these services will be even more important in the future. Furthermore, there are also other products that are extracted from this forest:
• Fodder and forage, which benefits the local population and is obtained from about 20% of the area; • Fuelwood extraction, undertaken on the whole pilot site area and benefits the local population, but is thought to be
of decreasing importance; • Extraction of industrial wood that is undertaken on a small part of the forest (5%) and benefits the forest
administration and the local population.
Indirect use values: Water related services (water cycle regulation) and carbon sequestration are provided on the whole pilot site area, while soil protection is provided on approximately 20% of the site. While water and soil related mainly benefit the local rural and urban population, is the carbon sequestration important for the whole society and wider. All of these services are considered of increasing importance.
Non-use values: the area has a high biodiversity value with a wildlife protection area, a seed orchard, and counts with a rich diversity of endemic and endangered plant species. These values are provided on 75% of the pilot site and are of increasing importance for the whole society.
6.5.2 Expected changes in the provision of goods and services The main drivers that affect the provision of the mentioned goods and services are:
• Deforestation due to intensive grazing is expected to stimulate the production of fodder and forage, but threaten some species of wild fauna and flora, and affect negatively to the soil protection and water related issues. Also tourism and timber production would be negatively affected.

79
• Illegal hunting threatens the protection of wildlife (e.g. fallow deer, wild goats and lynx). • Intensification of tourism activities, affects negatively the biodiversity protection, specially the flora. • Implementation of forest and scrubs restoration programme should increase timber production and carbon
sequestration levels, but it may negatively affect biodiversity levels and water supply. • Climate change is mentioned as an overall driver that will decrease the provision of all of the above mentioned
goods and services.
6.5.3 Recommendation for the valuation of changes in the provision of goods and services
The main environmental and social drivers are expected to have significant impacts on the whole range of goods and services provided by the Düzlerçami forest (table 6.3). To estimate the economic values of such a wide range of goods and services requires the application of very different valuation methods.
Table 6.4 Overview of the recommended valuation methods for pilot site Düzlerçami forest, Turkey
Main goods and services affected Main drivers affecting the provision Recommended
valuation methods* Alternative valuation
methods*
Wood Intensive grazing MP -
Implementation of forest restoration programme MP - Climate change MP -
Food and forage production
Intensive grazing MP CB (RC) Climate change MP CB (RC)
Recreation Intensive grazing MP (entrance fee) TC
Intensive forest recreation and ecotourism MP (entrance fee) TC Climate change MP (entrance fee) TC
Ecotourism Intensive grazing MP (entrance fee) TC
Intensive forest recreation and ecotourism MP (entrance fee) TC Climate change MP (entrance fee) TC
Soil protection Intensive grazing CB (DA) - Climate change CB (DA) -
Water supply and purification
Intensive grazing CB (DA) CB (RC) Implementation of forest restoration programme CB (DA) CB (RC)
Climate change CB (DA) CB (RC)
Carbon sequestration Intensive grazing MP SCC
Implementation of forest restoration programme MP SCC Climate change MP SCC
Biodiversity protection Implementation of forest restoration programme CV or CE -
Climate change CV or CE - Biodiversity protection (Fallow deer habitat) Intensive grazing MP (hunting permits) CV or CE
Biodiversity protection (Fallow deer, wild goats and lynx)
Illegal and excessive hunting CV or CE -
Biodiversity protection (flora)
Intensive grazing CB (RC) CV or CE Intensive forest recreation and ecotourism CB (RC) CV or CE
*MP – market price based methods; CB – cost based methods; DA – damage cost avoided; RC – replacement cost; HP – hedonic pricing method; TC – travel cost method; CV – contingent valuation method; CE – choice experiment method; SCC – social cost of carbon
As already explained in previous cases, the economic value change in provision of market products (e.g., fodder, forage, fuel wood and wood) could be estimated with market prices, or in the case of fodder also with replacement costs (e.g., costs of replacing the forest fodder with other animal food).
Also in the case of carbon sequestration the economic value can be assessed by using the market price (carbon credits). However, there is considerable uncertainty about these prices and, arguably, the market failure that remains within the European trading scheme (ETS) means that prices remain too low to drive the necessary abatement. A similar situation exists in the non-traded sector where CO2 prices remain too low to incentivise abatement to meet targets. Thus, an alternative approach would be to use the social costs of carbon (SCC). SCC is a monetary indicator measuring the present value of the global damage caused by an additional tonne of green-house gasses emitted into the atmosphere (see Box 6.1).

80
Methods and tools for socio-economic assessment of goods and services provided by Mediterranean forest ecosystems
In the case of water supply and purification and soil protection the valuation can be performed with cost based methods. By applying the replacement cost method, the cost of replacing the lost ecosystem service could be assessed (e.g. the replacement of clean tap water by bottled water); while, the damage cost avoided method would consider the cost of protection measures (e.g. barriers).
Biodiversity protection can be valued in different manners, depending which aspects are considered. When considering the benefits obtained from hunting activities a good proxy could be the value of hunting permits. However, when taking into account also other aspects of biodiversity (e.g., existence value, protection of plant species) the value can only be obtained by the application of more complex valuation approaches (e.g., choice modelling). In some cases, when the protection of biodiversity is directly related to recreation and tourism activities, the value of plant and animal species richness can be assessed using the replacement cost method (e.g., the costs of replacing a plant/animal specimen by artificial introduction).
Finally, recreation and tourism services can be assessed by using market prices for entrance fees or the travel cost method, which would enable to consider a more complete range of costs incurred to enjoy the recreation amenities of the valued pilot site.
Box 6.1Social cost of carbon (SCC)
SCC is a monetary indicator measuring the present value of the global damage caused by an additional tonne of green-house gasses (GHG) emitted into the atmosphere. The SCC is often used in cost-benefit analysis to measure the value of the avoided damages, and thus the benefit of mitigation projects.
The SCC can be applied to estimate the economically optimal level of pollution. As in many other cases of environmental pollution, the optimal level is not zero pollution, as this would be too expensive. Figure 6.1 shows an economically optimal level of abatement measures, based on SCC and marginal abatement costs, would be defined. The marginal abatement costs (MAC) are rising as the pollution level is decreasing (on figure 6.1, Mac curve decreases as CO2 increases).
At the same time, the higher the pollution level, the higher the SCC. Thus, the optimal level of pollution is found where the MCA equals the SCC, which is at pollution level p and abatement costs q. This means, that the costs for removing an additional tonne of GHG from the atmosphere are equal to the global economic damage this tonne of GHG causes. Figure 6.1 Theo ptimal level of pollution
The SCC is generally estimated by employing an integrated assessment model, which combines a scientific model of global warming with a socio-economic model of the underlying value of the social impacts. In these models,
SCC
MAC
CO2 concentration
€/
tCO2
p
q

81
impacts at different times in the future are estimated and discounted back to present values to find the damage of a marginal tonne emitted into the atmosphere.
Numerous studies were conducted to estimate the SCC. For example, Tol (2005) gathered 103 estimates from 28 published studies. He estimated a probability density function with a mean of 77€/tCO2, and the 95 percentile 290 €/tCO2 (in 2007 prices). He concludes that the marginal damage costs of carbon dioxide emissions are unlikely to exceed 41 €/tCO2, and should realistically be much lower. These significant differences between the estimates reflect the uncertainties in the estimation of the integrated models (Guo and al. 2005). These uncertainties are related to scientific, economic and ethical assumptions used in the assessment models, like population and economic growth projections, the damages associated to climate change, the selection of the discount rate, method used for the valuation of non-market goods and services, etc. For example, Hope (2006) estimated that the main drivers of SCC estimates sensitivity are the estimated damages produced under different climate change scenarios and the selection of the discount rate

82
Methods and tools for socio-economic assessment of goods and services provided by Mediterranean forest ecosystems
Glossary
Additionality (Cost benefit analysis) The costs of the project that are relevant for the assessment only if they incur if the project is undertaken, but not otherwise.
Altruistic value The value placed of maintaining an asset or resource that is not used by the individual, so that others may use it.
Attribute (choice experiment) Characteristics of a given ecosystem or good or service.
Availability heuristic People are inclined to be biased in their assessments of alternatives that can be unduly influenced by recent, memorable, or successful experience?
Benefit function The benefit function statistically relates peoples’ willingness to pay to characteristics of the ecosystem and the people whose values were elicited.
Benefit transfer method Estimates economic values by transferring existing benefit estimates from studies already completed for another location or issue.
Benefit-cost ratio The relation between the discounted benefits and the discounted costs.
Benefits (CBA) The increases in the quantity or quality of goods or services that generate positive utility or a reduction in the price at which they are supplied.
Bequest value The value that people place on knowing that future generations will have the option to enjoy something.
Bidding game
Contingent valuation method elicitation format, where respondents face a series of discrete choice questions. Depending on their responses, subsequent responses present a lower or a higher bid, until the respondents agree to pay the offered amount or until they are not willing to pay the higher amount.
Biocapacity (Earth's supply) The capacity of biologically productive land and sea areas to produce materials and services useful for humans, expressed in gha.
Biophysical structure and processes Refers to the complex interactions between biotic (living organisms) and abiotic (chemical and physical) components of ecosystems, and to the matter and energy fluxes that drive them.
Choice experiment A variety of choice modelling, where respondents are asked to select their most preferred alternative.
Choice modelling Survey based method to estimate the economic values of ecosystem goods and services by indirectly asking individuals about their preferences with regard to the provision of these goods and services.
Consumers surplus The difference between the price actually paid for a good, and the maximum amount that an individual is willing to pay for it.
Contingent Valuation Survey based method to estimate the economic values of ecosystem goods and services by directly asking individuals about their willingness-to pay for or willingness to accept a change in the provision of these goods and services.
Cost-Benefit Analysis A decision support method which aims to compare all relevant benefits and costs (in monetary terms) of an alternative (project, policy or programme), including impacts on environmental goods and services.
Cost-Effectiveness Analysis A decision support method which relates the costs of alternative ways of producing the same or similar outcomes to a measure of those resulting outcomes.
Costs (CBA) Any decreases in the quality or quantity of such goods or services, or increases in their price.
Costs based methods Estimate values of ecosystem goods and services based on either the costs of avoiding damages due to lost goods and services, the cost of replacing ecosystem goods and services, or the cost of providing substitute goods and services.
Criterion Is a principle or standard that an issue is judged by
Damage cost avoided method
The damage cost avoided method is applied using two different approaches: (i) to use the monetary value of the probable damages if nothing is done; or (ii) to determine the avoidance expenditures against a damage in order to provide an estimate of the benefits from the change in the ecosystem (family of the cost based methods).

83
Direct use value Is derived from interaction with the ecosystem through consumptive or non-consumptive use.
Discount rate The rate used to reduce future benefits and costs to their present time equivalent.
Discounting The process of determining the present value of a cost or a benefit that is to be received in the future.
Discrete choice Contingent valuation method elicitation format, where respondents are asked whether they are willing to pay a certain amount of money for a specified change in the provision of a certain good.
Double bound discrete choice Contingent valuation method elicitation format, where respondents are presented with a second bid depending on their responses to the first bid. The second bid is lowered when respondents answer “no” and increased when they answer “yes”.
Ecological footprint of consumption Human demand,measures the biologically productive surface area required to produce the resources consumed by a person or population and to absorb the waste generated, expressed in global hectares (gha) per capita.
Economic evaluation The process of determining the economic performance of an alternative in regard to the objectives, and results of any such action that has been completed.
Economic valuation The process of estimating the economic value of a good or service.
Ecosystem function refers to the capacity of natural ecological processes, structures and components to provide goods and services that can potentially satisfy human needs, either directly or indirectly.
Ecosystem Goods Tangible outputs from ecosystems that benefit directly or indirectly to humans, and contribute to their well-being.
Ecosystem Services Intangible outputs from ecosystems that benefit directly or indirectly to humans, and contribute to their well-being.
Elasticity A measure of the degree to which individuals (consumers/producers) change their demand/amount supplied in response to price or income changes.
Existence value The value that people place on simply knowing that something exists, even if they will never see it or use it.
Externalities Uncompensated side effects of human actions.
Function transfer method Estimates economic values by transferring existing benefit functions from studies already completed for another location or issue.
Hedonic pricing Estimates economic values for ecosystem or environmental services that directly affect market prices of some other good.
Implicit price Implicit price is the value of an characteristic of an valued good or services.
Indicator Is defined as any variable or component of the forest ecosystem used to infer the status of a particular criterion.
Indirect use value Is derived from ecosystem services, such as cleaner water to downstream users, carbon sequestration, flood control or erosion prevention.
Intangible value Value of an asset that cannot be seen or touched (e.g., ecosystem service).
Internal rate of return The critical value of the interest rate at which the project has a net present value of zero.
Investment projects Long-term allocation of funds (with or without recourse to the project's sponsor) to carry an investment idea through to its stable-income generation stage.
Life Cylcle Analysis
An analytical method that assesses the impacts to the environment, natural resources and human health (e.g., quantity of resources extracted and emissions) associated with all life stages of products (i.e., from raw material extraction through materials processing, manufacture, distribution, use, repair and maintenance, and disposal or recycling).
Marginal social benefit The benefit that the society receives by the provision of an additional unit of a good or service.
Marginal social cost The cost that the society has to bear due to the provision (or loss) of an additional unit of a good or service.
Marginal utility The utility of receiving an additional unit of a good or service
Marginal value The value of an additional unit of a good or service

84
Methods and tools for socio-economic assessment of goods and services provided by Mediterranean forest ecosystems
Market price method Estimates economic values for ecosystem goods or services based on market prices.
Multi-Criteria Analyisis Is a decision support method that can be used to evaluate different alternatives and compare alternatives according to their performance with regard to a selected set of evaluation criteria.
Net present value The current value of net benefits (benefits minus costs) that occur over time.
Non-Use Values Values which are not associated with actual use, or even the option to use a good or service.
Null alternative In a SP valuation refers to the do-nothing situation explaining “what will happen if a project is not implemented”
Open-ended format Contingent valuation method elicitation format, where respondents are directly asked about their maximum WTP for changes in the provision of the good in question.
Opportunity cost Measures the best alternative option forgone in a situation in which a choice needs to be made between several mutually exclusive alternatives given limited resources
Option value The value that people place on having the option to enjoy something in the future, although they may not currently use it.
Payback period Indicates how long it takes for the accumulated benefits to exceed the accumulated costs.
Payment card method Contingent valuation method elicitation format, where respondents are presented with a number of preselected bids on the payment card are asked to select the maximum amount of money they would be willing-to-pay.
Payment vehicles Defines the way how the amount of money the respondents are willing to pay would be collected.
Present value The current value of benefits or costs.
Private CBA Considers only those costs and benefits from the analysed alternative, which are imposed onto or accrue to a private agent (e.g. individual or firm).
Producer surplus The difference between the total amount earned from a good (market price times quantity sold) and the variable production costs.
Random sampling Each population element has an equal probability of selection: the population is not subdivided or partitioned.
Replacement cost method Is applied by estimating the costs of replacing the affected ecosystem goods and services (family of the cost based methods).
Representativeness heuristic People are inclined to be biased in their assessments of alternatives that can more readily be linked to what is familiar.
Revealed preferences
Estimate the values of ecosystem goods and services are based on actual observed behaviour data, including some techniques that deduce values indirectly from behaviour in surrogate markets, which are assumed to have a direct relationship with the ecosystem service of interest.
Sensitivity analysis A technique used to determine how different values of an independent variable will impact a particular dependent variable under a given set of assumptions.
Shadow prices The marginal opportunity cost of using a resource as estimated in a situation where there is no market price or the market price reveal opportunity cost sufficiently imperfectly.
Simple unit transfer Is used to transfer benefit estimates from a study site to the policy site without any adjustments.
Social CBA Considers the costs and benefits which accrue to the society as a whole
Social costs of carbon (SCC) SCC is a monetary indicator measuring the present value of the global damage caused by an additional ton of green-house gasses emitted into the atmosphere.
Social discount rate Measures the society’s preferences between consumption in one period and consumption in another
Stated preferences Survey based methods to estimate the economic values of ecosystem goods and services by directly or indirectly asking individuals about their willingness-to pay for or willingness to accept a change in the provision of these goods and services.
Stratified sampling
Where the population embraces a number of distinct categories, the frame can be organized by these categories into separate "strata." Each stratum is then sampled as an independent sub-population, out of which individual elements can be randomly selected.

85
Substitute cost method Is applied by estimating the costs of providing a substitute for the affected goods and services (family of the cost based methods).
Tangible value Value of an physical asset (e.g., ecosystem good)
Time preferences The relative valuation placed on a good at an earlier date compared with its valuation at a later date
Total economic value The sum of all types of use and non-use values for a good or service.
Travel cost method Estimates economic values of ecosystem goods or services based on how much people are willing to pay to travel to visit the site.
Unit value Value derived from actual use of a good or service.
Unit value transfer Is used to transfer benefit estimates from a study site to the policy site. This transfers can be with (e.g., Unit value transfer with income adjustments) or without (simple unit transfer) adjustments.
Value Is a direct or indirect quantification/measurement (economic, sentimental, etc.) of the benefit obtained from a given service.
Willingness to accept The amount—measured in goods, services, or monetary units—that a person is willing to accept in exchange for giving up a particular good or service.
Willingness to pay The amount—measured in goods, services, or monetary units—that a person is willing to give up to get a particular good or service.

86
Methods and tools for socio-economic assessment of goods and services provided by Mediterranean forest ecosystems
References
Albergel, J., Collinet, J., Zante, P. & Hamrouni, H., 2011. Role of the Mediterranean forest in soil and water conservation. In Y. Birot, C. Gracia & M. Palahi, eds., Water for forests and people in the Mediterranean region: a challenging balance. What Science Can Tell Us No. 1. Helsinki, European Forest Institute.
Alpizar, F,, Carlsson, F., Martinsson, P. 2003. Using Choice Experiments for Non-Market valuation. Economic Issues. 8:83- 111. APCOR, 2012. Portuguese Cork Association website. Cork, 2012. [URL: www.apcor.pt/userfiles/File/Publicacoes/AnuarioAPCOR2012.pdf]. Atkinson, G., Bateman, I., Mourato, S., 2012. Recent advances in the valuation of ecosystem services and biodiversity. Oxford review of
Economic Policy 28(1): 22-47. Bateman, I. J., Turner, R. K., 1993. Valuation of the environment, methods and techniques: the contingent valuation method. In: Sustainable
Environmental Economics and Management: Principles and Practice, Belhaven Press,K Tuner (Ed.) London: 120-191. Bateman, I., Jones, A., 2003 Contrasting conventional with multi-level modeling approaches to meta-analysis: expectation consistency in UK
woodland recreation values Land Economics, 79, p. 235–258 Bateman, I., Lovett, A., Barinard, J., 1999 Developing a methodology for benefit transfers using geographical information systems: modelling
demand for woodland recreation Regional Studies, 33, p. 191–205 Bateman, I.J., Burgess, D., Hutchinson, W.G., Matthews, D.I. 2008a. Learning design contingent valuation (LDCV): NOAA guidelines, preference
learning and coherent arbitrariness. Journal of Environmental Economics and Management 55(2):127-41. Bateman, I.J., Carson, R.T., Day, B., Hanemann, M., Hanley, N., Hett, T., Jones-Lee, M., Loomes, G., Mourato, S., Özdemiroglu, E.,2002. Economic
valuation with stated preference techniques: a manual. Edward Elgar Publishing. Cheltenham. UK. Bateman, I.J., Fisher B., Fitzherbert E., Glew, D., Naidoo, R. 2010, ‘Tigers, Markets and Palm Oil: Market Potential for Conservation’, Oryx, 44(2):
230–4. Bateman, I.J., Munro, A., Poe, G. L. 2008b, Asymmetric Dominance Effects in Choice Experiments and Contingent Valuation. Land Economics 84:
115–27. Bateman, I.J., R. Brouwer, M. Cranford, S. Hime, E. Ozdemiroglu, Z. Phang and A. Provins 2009a: Valuing Environmental Impacts: Practical
Guidelines for the Use of Value Transfer in Policy and Project Appraisal.Value Transfer Guidelines. Eftec, London. Submitted to Department for Environment, Food and Rural Affairs (Defra), December 2009 [URL: http://www.defra.gov.uk/environment/policy/natural-environ/using/valuation/index.htm]
Bennet, J., Adamowicz, V., 2001. Some fundamental of environmental choice modelling. In: The choice modelling approach to environmental valuation. Bennet J, Blamey R (Eds.).. Cheltenham, Glos, UK: Edward Elgar Publishing; 2001
Bockstael N.E., McConnell K.E., 2007. Environmental and Resource Valuation with Revealed Preferences. A Theoretical Guide to Empirical Models, Springer Netherland
Bockstael, N.E., Freeman, A. M., Kopp, R. J., Portney, P. R., Smith, V. K. (2000) On measuring economic values for nature. Environ. Sci. Technol., 34 (8), 1384–1389.
Bonnieux, F., Desaigues, B. 1998. Economie and politique de l’environment. Dalloz. Paris. Bowman Cutter W., Linwood Pendleton, J., DeShazo, R., 2007. Activities in Models of Recreational Demand Land Economics 83(3):370-381. Boyd, J., and S. Banzhaf. 2007. What are ecosystem services? The need for standardized environmental accounting units. Ecological Economics of
Coastal Disasters 63(2-3):616-626. Brang, P., Courbaud, B., Fischer, A., Kissling-Näf, I., Pettenella, D., Schönenberger, W., Spörk, J., Grimm, V., 2002. Developing indicators for the
sustainable management of mountain forests using a modelling approach. For. Pol. Econ. 4, 113–123 Brouwer, R., Langford, I., Bateman, I., Turner, R., 1999.A meta-analysis of wetland contingent valuation studies. Regional Environmental Change, 1
(1999), pp. 47–57 Butry, David T.; Mercer, D. Evan; Prestemon, Jeffrey P.; Pye, John M.; Holmes, Thomas P. (2001), What Is the Price of Catastrophic Wildfire?
Journal of Forestry 99(11):9-17 Carson, R. T., Hanemann, M.W. 2005. Contingent valuation. In K.G. Mier & J.R. Vincent eds., Handbook of environmental economic. Vol 2: 821-
936. Elsevier. Carson, Richard T. 2000. Contingent valuation: a user's guide. Environmental science & technology 34(8): 1413-1418. Christie, M., Fazey, I., Cooper, R., Hyde, T., Kenter, J.O. 2012. An evaluation of monetary and non-monetary techniques for assessing the
importance of biodiversity and ecosystem services to people in countries with developing economies. Ecological Economics 83:67-78. Ciancio, O., Corona, P., Marinelli, M., Pettenella, D., 2007. Evaluation of forest fire damages in Italy. In. Academia Italiana di Scienze Forestali,
Firenze, p. 60. CIFOR (2009). Realising REDD. National Strategy and Policy Options. CIFOR. Bogor. Clawson M., Knetch J., 1966. Economics of Outdoor Recreation. Baltimore, Johns Hopkins University Press. Costanza, R., d'Arge, R., de Groot, R., Farber, S., Grasso, M., Hannon, B., Limburg, K., Naeem, S., O'Neill, R., Paruelo, J., Raskin, R., Sutton, P., &
van den Belt, M. (1997) The value of the world's ecosystem services and natural capital. Nature, 387, 253-260. Cuttelod, A., García, N., Abdul Malak, D., Temple, H. J. & Katariya, V., 2009. The Mediterranean: a biodiversity hotspot under threat. In J-C. Vié,
C. Hilton-Taylor & S.N. Stuart, eds. Wildlife in a changing world: an analysis of the 2008 IUCN Red List of Threatened Species. Gland, Switzerland, IUCN.
DeGroot, R., Matthew, A.W., Roelof, M.J.B., 2002. A typology for the classification, description and valuation of ecosystem functions, goods and services. Ecological Economics, 41: 393–405.
Desvousges, W., Johnson, F., Banzhaf, H., 1998: Environmental Policy Analysis with Limited Information. Principles and Applications of the Transfer Method. New Horizons in Environmental Economics. Edward Elgar, Cheltenham, UK and Northampton, MA, USA.
Dodgson, J., Spackman, M., Pearman, A., Phillips, L. (2001) Multi Criteria Analysis: A Manual. [URL: http://www.nera.com/nera-files/Multi-criteria_Analysis_Model.pdf]

87
EC DG Agri, 2008. Study on the Development and Marketing of Non-Market Forest Products and Services. DG AGRI, Study Contract No: 30-CE-0162979/00-21. Study Report, 145 p.
EC, 2002, Guide to cost-benefit analysis of investment projects. European Commission, DG Regional Policy. Ellatifi, M., 2005. In: Merlo, M. & Croitoru, L. (eds.), 2005. Valuing Mediterranean forests: towards total economic value. Wallingford, UK, CAB
International. Elmqvist T., Tuvendal M., Krishnaswamy J. and Hylander K., 2011. Environment for Development - Managing Trade-offs in Ecosystem Services.
Ecosystem Services Economics (ESE) - Working Paper Series. Division of Environmental Policy Implementation. 17 p. EU, 2005. Council Regulation (EC) No 1698/2005 of 20 September 2005 on support for rural development by the European Agricultural Fund
for Rural Development (EAFRD). In: Union, C.o.t.E. (Ed.), Offical Journal L 277, Brussels, pp. 1-40. EU, 2013. The EU Emissions Trading System (EU ETS). http://ec.europa.eu/clima/policies/ets/index_en.htm. Accessed January 2013. EU. 2005. Council Regulation (EC) No 1698/2005 of 20 September 2005 on support for rural development by the European Agricultural Fund
for Rural Development (EAFRD). In Offical Journal L 277, edited by C. o. t. E. Union. Brussels. Ewing, B., Moore, D., Goldfinger, S., Oursler, A., Reed, A., & Wackernagel, M., 2010. The Ecological Footprint Atlas 2010. Oakland, Global
Footprint Network. FAO (Food and Agricultural Organization), 2003. The State of the World's Forests. FAO, Rome. FAO, 2010. Global forest resources assessment 2010. Main report. FAO Forestry Paper No. 163. Rome. FAO, 2013. State of Mediterranean Forests (SoMF). Rome, Italy, 194 p. FAO/Silva Mediterranea. 2010. State of Mediterranean Forests. Concept Paper. Farley, K.A., Jobbagy, E.G. & Jackson, R.B., 2005. Effects of afforestation on water yield: a global synthesis with implications for policy. Global
Change Biology, 11: 1565–1576. Finnveden and Nilsson (2005) Site-dependent Life-Cycle Impact Assessment in Sweden, International Journal of Life Cycle Assessment, 10 (4)
235-239. Fisher, B., Turner, R.K., Morling, P. (2009). Defining and classifying ecosystem services for decision making. Ecological Economics 68: 643-653. Flannigan, M.D., Stocks, B.J. & Wotton, B.M., 2000. Climate change and forest fires. The Science of the Total Environment, 262: 221–229. FOREST EUROPE, UNECE, FAO, 2011. State of Europe’s forests 2011: status & trends in sustainable forest management in Europe. Oslo,
FOREST EUROPE Liaison Unit, Geneva, Switzerland, UNECE and Rome, FAO. Freeman III, A. M., 2003. Economic valuation: what and why. In: A primer on nonmarket valuation. (Vol. 3) Champ, P. A., Boyle, K. J., & Brown, T.
C. (Eds.). Springer.Netherlands. GFN (Global Footprint Network), 2012. Mediterranean Ecological Footprint trends. 46 p.
http://www.footprintnetwork.org/images/article_uploads/Mediterranean_report_FINAL.pdf. Goio, I., Gios, G., Pollini, C., 2008. The development of forest accounting in the province of Trento (Italy). Journal of Forest Economics 14: 177-
196. Gregory, R., Failing, L., Harstone, M., Long, G., McDaniels, T., Ohlson, D. (2012) Structured Decision Making: A Practical Guide to Environmental
Management Choices. John Wiley & Sons. Groenewold, G., de Beer, J., Huisman, C., 2012. Population scenarios for South Mediterranean Countries 2010-2050. WP3-Demography, health
and ageing. MEDPRO Report No. 2, August 2012. 65 p. Haab T.C., McConnell K.E. (2002) Valuing Environmental and Natural Resources: The Econometrics of Nonmarket Valuation. Northampton,
MA, Edward Elgar. Haines-Young, R.H. and Potschin, M.B., 2009: Methodologies for defining and assessing ecosystem services. Final Report, JNCC, Project Code
C08-0170-0062, 69 pp. Haines-Young, R.H. and Potschin, MB, 2010. The links between biodiversity, ecosystem services and human well-being. In: Raffaelli, D. & C. Frid
(eds.) Ecosystem Ecology: a new synthesis. BES Ecological Reviews Series, CUP, Cambridge (in press). Hanley, N., Mourato, S., Wright, RE. 2001b. Choice modelling approaches: a superior alternative for environmental valuation? Journal of
Economic Surveys 15(3):435- 62. Hanley, N., Shogren, J., White, B., 2001, Introduction to environmental economics. Oxford University Press. Hanley, N., Shogren, J.F., 2002. Awkward choices: economics and nature conservation. In: Bromley, D.W., Paavola, J. (Eds.), Economics, Ethics
and Environmental Policy: Contested Choices. Blackwell Publishing, Oxford. Hanley, N., Spash, C., 1993, Cost-benefit analysis and the environment. Edward Elgar Publishing Ltd. Cheltenham, UK. Holmes, T. P., Adamowicz, W. L., 2003. Attribute-based methods. In: A primer on nonmarket valuation. Springer Netherlands. Holmes, T.P., 2004. Non-market valuation. In: Forests in a market economy. E. O. Sills and K. Lee Abt. Dordrecht (Eds.), The Netherlands,
Kluwer Academic Publishers. Hotelling, H. 1947. Letter to the Director of the National Park Service in Roy A. Prewitt, The Economics of Public Recreation. Washington, June
18, 1947. IPCC, 2001. Intergovernmental Panel on Climate Change, Climate Change 2001: The Scientific Basis. Cambridge University Press, Cambridge,
UK, p. 881. IPCC, 2007a. Climate Change 2007: The Physical Science Basis. Contribution of Working Group II to the Fourth Assessment Report of the
Intergovernmental Panel on Climate Change. In: M.L. Parry, O.F. Canziani, J.P. Palutikof, P.J. van der Linden and C.E. Hanson (eds). Cambridge University Press, Cambridge, UK and New York, USA, 976 p.
IPCC, 2007b. Climate Change 2007: Synthesis Report. Contribution of Working Groups I, II and III to the Fourth Assessment Report of the Intergovernmental Panel on Climate Change. [Core Writing Team, Pachauri, R.K and Reisinger, A. (eds.)]. IPCC, Geneva, Switzerland, 104 pp.
Kadi Hanifi, H., 1998. L'alfa en Algérie. Thèse Doctorale. Science. USTHB, Alger, 270 p. Kashian, D.M., Romme, W.H., Tinker, D.B., Turner, M.G., Ryan, M.G., 2006. Carbon storage on coniferous landscapes with stand-replacing fires.
BioScience, 7: 598-606.

88
Methods and tools for socio-economic assessment of goods and services provided by Mediterranean forest ecosystems
Kenter, J.O., Hyde, T., Christie, M., Fazey, I., 2011. The importance of deliberation in valuing ecosystem services in developing countries-Evidence from the Solomon Islands. Global Environmental Change 21, 505–521.
Kiker, G., Bridges, T., Varghese, A., Seager, T., Linkov, I., (2005) Application of Multicriteria Decision Analysis in Environmental Decision Making. Integrated Environmental Assessment and Management, Vol. 1, Nr. 2, p. 95–108.
King, D., Mazzotta, 2000. Ecosystem valuation. [URL: http://ecosystemvaluation.org/] Klemperer, W.D. (1996), Forest resource economics and finance. McGraw-Hill, New York. Kriström, B, Riera, P., 1996 : Is the income elasticity of environmental improvements less than one? Environmental and Resource Economics 7
(1); 45-55. Lange, G-M., 2004. Manual for environmental and economic accounts for forestry: a tool for cross-sectoral policy analysis. FAO Forestry
Department. Rome, Italy. 116 pages. Loarie, S.R., Duffy, P.B., Hamilton, H., Asner, G.P., Field, C.B. & Ackerly, D.D., 2009. The velocity of climate change. Nature, 462: 1052–1055. Mantau, U., Wong, J.L.G., Curl, S., 2007. Towards a Taxonomy of Forest Goods and Services. Small-Scale Forestry 6: 391-409. Martínez-Vilalta, J., Lopez, B.C., Adell, N., Badiella, L. & Ninyerola, M., 2008. Twentieth century increase of Scots pine radial growth in NE Spain
shows strong climate interactions. Global Change Biology, 14: 2868–2881. MEA, 2005. Ecosystems and Human Well-being: Current State and Trends, Volume 1. Findings of the Condition and Trends Working Group of
the Millennium Ecosystem Assessment. Mendoza, G., Macoun, P. (1999) Guidelines for Applying Multi-Criteria Analysis to the Assessment of Criteria and Indicators. Center for
International Forestry Research, The Criteria & Indicators Toolbox Series No. 9, 82 p. URL: http://www.cifor.cgiar.org/acm/methods/toolbox9.html
Mishan, E.J. 1976. Cost-Benefit Analysis: New and Expanded Edition. New York, NY: Praeger Publishers; 454 p. Morrison, M.D., Blamey, R.K., Bennet, J.W., Louviere, J.J.,1996. A comparison of stated preference techniques for estimating environmental values.
Canberra: School of Economics and Management. Research Report No.1. Myers, N., Mittlemeier, R.A., Mittlemeier, C.G., Da Fonseca, G.A.B. & Kent, J., 2000. Biodiversity hotspots for conservation priorities. Nature, 403,
853–858. Myllyviita, T., Hujala, T., Kangas, A., Leskinen, P. (2011) Decision Support in Assessing the Sustainable Use of Forests and Other Natural
Resources - A Comparative Review. The Open Forest Science Journal, 2011, 4, 24-41. Nas, T.F. (1996), Cost-benefit analysis: theory and application. Sage Publications, Thousand Oaks. Navrud, S. 2004: Value transfer and environmental policy. Chapter 5 (pp. 189-217) in Tietenberg, T. and H. Folmer (eds.) 2004: The
International Yearbook of Environmental and Resource Economics 2004/2005. A survey of Current Issues. Edward Elgar Publishing, Cheltenham, UK and Northampton, MA, USA.
Navrud, S., Ready, R. (eds.) 2007: Environmental Value Transfer: Issues and Methods. Springer (Kluwer Publishers), Dordrect, The Netherlands. Observatoire Méditerranéen de l’Energie, 2011. Mediterranean Energy Perspectives 2011. Executive summary, 16 p. Palahí, M., Mavsar, R., Gracia, C., Birot, Y., 2008. Mediterranean forests under focus. International Forestry Review, 10: 676–688. Palahí, M., Pukkala, T., Trasobares, A. 2007. Modelling the diameter distribution of Pinus sylvestris, Pinus nigra and Pinus halepensis forest stands
in Catalonia using the truncated Weibull function. Forestry 79(5):553-562. Palmquist R.B., 2005. Property value models, in K-G. Mäler and J. Vincent, (eds.), Handbook of Environmental Economics, Chapter 16 V.2,
Valuing Environmental Changes, Amsterdam, North Holland Publisher, 763-819. Parsons G.R. (2003) The travel cost model, Chapter 9 in A Primer on Nonmarket Valuation, P.A. Champ, K.J. Boyle and T.C. Brown (eds.),
London, Kluwer Academic Publishing. Patterson R.W., Boyle K. J., 2002. Out of Sight, Out of Mind? Using GIS to Incorporate Visibility in Hedonic Property Value Models, Land
Economics 78(3), 417-425. Pausas, J.G., Llovet, J., Rodrigo, A., Vallejo, R.,2008. Are wildfires a disaster in the Mediterranean basin?- A review. International Journal of
Wildland Fire 17: 713-723. Plan Bleu, 2009. Energy sector in the Mediterranean region, situation and prospective 2025. Blue Plan Notes - Environment and Development in
the Mediterranean, No. 13, 4 p. Plan Bleu, 2013. Website: http://www.planbleu.org/themes/tourismeUk.html. Accessed February 2013. Prabhu, R., Colfer, C., Venkateswarlu, P., Tan, L.C., Soekmadi, R., Wollenberg, E., 1996. Testing Criteria and Indicators for the Sustainable
Management of Forests. Phase I: Final Report. CIFOR special Publication, Jakarta. Prabhu, R., Colfer, C.J.P., Dudley, R.G., 1999. Guidelines for Developing, Testing and Selecting Criteria and Indicators for Sustainable Forest
Management. Center for International Forestry Research, Jakarta. Rametsteiner, E., 2001. SFM indicators as tools in political and economic context: actual and potential roles. In: Raison, R.J., Brown, A.G., Flinn,
D.W. (Eds.), Criteria and Indicators for Sustainable Forest Management. IUFRO Research Series 7. CABI Publishing, Wallingford, UK, pp. 107–130.
Ramsey, 1928, A mathematical theory of saving. Economic Journal, vol. 38: 543-559. Randall, A., 2002. Benefit cost considerations should be decisive when there is nothing more important at stake. In: Bromley, D.W., Paavola, J.
(Eds.), Economics, Ethics and Environmental Policy: Contested Choices. Blackwell Publishing, Oxford. Regato, P., 2008. Adapting to Global Change: Mediterranean Forests. Malaga, Spain: IUCN Centre for Mediterranean cooperation. Rego, F.C., Rigolot, E., Fernandes, P., Montiel, C. & Silva, J.S., 2010. Towards integrated fire management. EFI Policy Brief 4. Joensuu, Finland,
European Forest Institute. Riera, P., Garcia, D., Kriström, B., Brännlund, R., 2005. Manual de Economia Ambiental y de los Recursos Naturales. Thomson, Madrid. Riera, P., Signorello, G., (Eds.) 2012. Good Practice Guidelines for the Non-Market Valuation of Forest Goods and Services. University of
Catania. [URL: http://www.efi.int/files/attachments/e45/publications/ 1cost_e45_guidelines.pdf]
Romero, Carlos. Economía de los recursos ambientales y naturales. Alianza, 1994. Rosen S., 1974. Hedonic prices and implicit markets: product differentiation in pure competition. Journal of Political Economy. 82, 34-55.

89
Scarascia-Mugnozza, G., Oswald, H., Piussi, P., Radoglou, K., 2000. Forests in the Mediterranean region: gaps in knowledge and research needs. Forest Ecology and Management 132: 97-109.
Sills, E. O., Abt K., Lee 2004. Introduction. In: Forests in a market economy. E. O. Sills and K. Lee Abt. Dordrecht (Eds.), The Netherlands, Kluwer Academic Publishers.
Silva, J.S., Rego, F.C., Fernandes, P. & Rigolot, E., 2010. Towards integrated fire management: outcomes of the European project Fire Paradox. EFI Research Paper No. 23. Joensuu, Finland, European Forest Institute.
Sugden, Robert and Williams, Alan (1978), The principles of practical cost-benefit analysis. Oxford University Press. Taylor L., 2003. The hedonic method, Chapter 10 in P.A. Champ, K.J. Boyle and T.C. Brown (eds.). A Primer on Nonmarket Valuation. London,
Kluwer Academic Publishing. Thompson, J.D., Lavergne, S., Affre, L. Gaudeul, M. & Debussche, M., 2005. Ecological differentiation of Mediterranean endemic plants. Taxon,
54: 967–976. Turner, R.K. & Daly, G.C., 2008. The ecosystem services framework and natural capital conservation. Environmental & Resource Economics
39(1): 25-35. UN-DESA-PD (United Nations, Department of Economic and Social Affairs, Population Division), 2011. World Population Prospects: The 2010
Revision. CD-ROM Edition. UNDP (United Nations Development Programme)–Human Development Report Office 2011. The Human Development Index (HDI). New
York.( also available at http://hdr.undp.org/en/statistics/hdi/. UNECE (United Nation Economic Commission for Europe), FAO, 2000. Global Forest Resource Assessment 2000. Main report. UN
publications, Geneva. UNFCCC, 2013. United Nations Framework Convention on Climate Change. Available at: http://cdm.unfccc.int. Accessed January 2013. United Nations, 1992. Report of the United Nations Conference on Environment and Development (Rio de Janeiro, 3-14 June 1992), Annex III
- Non-Legally binding authoritative statement of principles for a global consensus on the management, conservation and sustainable development of all types of forests. Available at: http://www.un.org/documents/ga/conf151/aconf15126-3annex3.htm.
UN-REDD, 2013. About REDD+. Available at: www.un-redd.org. Accessed January 2013. Van Bueren, E.M.L., Blom, E.M., 1997. Hierarchical Framework for the Formulation of Sustainable Forest Management Standards. Tropenbos
Foundation, Wageningen The Netherlands. Vayreda, J., Martínez-Vilalta, J., Gracia, M., Retana, J., 2012. Recent climate changes interact with stand structure and management to determine
changes in tree carbon stocks in Spanish forests. Global Change Biology, 18: 1028-1041. Vericat, P., Piqué, M., Serrada, R., 2012. Gestión adaptativa al cambio global en masas de Quercus mediterráneos. Forest Sciences Center of
Catalonia, Solsona, Spain. 172 p. Vincent, J.R. 1999. A framework for forest accounting. Forest Science, 45: 552-561. Wrisberg and al., 1997. A strategic research programme for LCA, in Udo de Hael, H.A. and Wrisberg, N. (eds.) (1997) Lifecycle Assessment:
State of the Art and Research Priorities, Eco-Informa Press.

90
Methods and tools for socio-economic assessment of goods and services provided by Mediterranean forest ecosystems
References of applications of economic valuation methods Azqueta Oyárzun, D., Tirado Herrero, S., 2008. La valoración económica de los activos naturales de España desde una perspectiva geográfica:
retos conceptuales y metodológicos. In: Campos Palacín P, Casado Raigón JM, editors. Gestión del medio natural en la Península Ibérica: economía y políticas públicas. Madrid: Fundación de las Cajas de Ahorros.
Bateman, I.J., Carson, R.T., Day, B., Hanemann, M., Hanley, N., Hett, T., Jones-Lee, M., Loomes, G., Mourato, S., Özdemiroglu, E., Pearce, D., Sugden, R., Swanson, J., 2002. Economic valuation with stated preference techniques. A manual. Edward Elgar Publishing. UK.
Bonnieux, F., Carpentier, F., Paoli, J.-C. 2006. Priorités des résidents and des visiteurs pour la protection and l’aménagement de la forêt en Corse : exemple de la forêt de Bonifatu. Revue Forestière Française. LVIII - 2- 2006.
Brey, R., Riera, P., Mogas, J. 2007. Estimation of forest values using choice modeling: An application to Spanish forests. Ecological Economics 64: 305-312.
Bujosa A., Riera A., 2008. Environmental diversity in recreational choice modelling - Centre de Recerca Econòmica, Documents de treball 2008/5
Caparrós Gass, A., Campos Palacín, P. 2002. Valoración de los usos recreativo y paisajístico en los pinares de la sierra de Guadarrama. Estudios Agrosociales y Pesqueros, 2002, 195, p 121-146.
Colombo, S., Calatrava Requena, J., Hanley, N., 2006. Analysing the social benefits of soil conservation measures using stated preference methods, Ecological Economics 58: 850-861.
Croitoru, L. and M. Sarraf. (Eds.) 2010. The Cost of Environmental Degradation: Case Studies from Middle East and North Africa Region. World Bank. Directions in Development. Washington D.C.
Croitoru, L., 2007.How much are Mediterranean forests worth? Forest Policy and Economics 9: 536-545. Croitoru, L., Liagre, L., 2013. Contribution of forests to a green economy in the Middle East and North Africa,. Evidence, drivers and policy
orientations. Publication Elaborated bythe GIZ regional project “Adoating Forest Policy Conditions to Climate Changein the MENA region”. Daly, H., Croitoru, L., Tounsi, K., Ali, A., Sihem, J., 2012. Evaluation économique des biens and services des forêts tunisiennes - Rapport final,
Société des Sciences Naturelles de Tunisie (SSNT). Daly, H., Mendes, A., Montgolfier, J., Riera, P., 2010. Goods and services provided by Mediterranean woodlands: Economics and Politics.
Presented at Third Mediterranean Scientific Conference GID, Alexandria 22-24 June 2010. [URL : http://g-i-d.org/diapos/alexandrie/montgolfier/montgolfier.html
Daly-Hassen, H., Croitoru, l:, Tounsi, K., Aloui, A. & Jebari, S., 2012. Evaluation économique des bienset services des fôrets tunisiennes, prepare pour le Ministère de lÁgriculture and de l’ Environnement and la FAO.
Ding, H., Nunes, P. & Telucksingh, S., 2011. European forests and carbon sequestration services: an economic assessment of climate change impacts. Ecosystem Services Economics Working Paper Series No. 9. Division of Environmental Policy Implementation.
Espelta, J.M., Retana, J., Habrouk, A. (2003) An economic and ecological multi-criteria evaluation of reforestation methods to recover burned Pinus nigra forests in NE Spain. Forest Ecology and Management, (180), 1–3, p. 185–198.
Garcia, S., Harou, P., Montagne, C., Stenger, A., 2007. Valuing Forest Biodiversity from a National Survey in France: A Dichotomous Choice Contingent Valuation. Document de travail du Laboratoire d’Economie Forestière (LEF), INRA, n°2007-08
Goffe, P., 2002. Hedonic Pricing of Agriculture and Forestry Externalities. Environmental and Resource Economics, 15, 2002, 397-401 Hanemann, W. M. 1984. Welfare evaluations in contingent valuation experiments with discrete responses. American journal of agricultural
economics 66(3): 332-341. Jorio, A.,2011. Evaluation économique de la biodiversité and des services écosystèmiques du Parc national de Tazekka and impact des
changements climatiques sur ces services, Haut Commissariat aux Eaux and Forêts and à la Lutte contre la Désertification, Royaume du Maroc.
Kramer, R., Holmes, T., Haefele, M., 2004. Contingent Valuation Estimation of Forest Ecosystem Protection. In: Forests in a Market Economy, E. Sills and K. Abt (Eds.). Kluwer Academic Publishers, Dordrecht, Netherlands.
Lindhjem, H. 2007: Non-Timber Benefits from Fennoscandian Forests: A Meta-Analysis. Journal of Forest Economics 12; 251-277. Lindhjem, H. and S. Navrud 2008: How Reliable are Meta-Analyses for International Benefit Transfer? Ecological Economics, 66(2-3); 425-435. Lindhjem, H. and S. Navrud 2009: Asking for Individual or Household Willingness to Pay for Environmental Goods? Implications for aggregate
welfare measures. Environmental and Resource Economics 43; 11-29. Loomis, J., White, D., 1996. Economic benefits of rare and endangered species: summary and meta-analysis. Ecological Economics, 15, p. 197–
206 Lovri� , M., 2009. The value of urban forests in residential land uses. An exploratory study of the influence of urban forests on the price of
housing real estates in Zagreb, Croatia, International Master Program in Forest Policy and Economics, University of Sarajevo, Forestry Faculty, Sarajevo.
Martinez de Aragon, J., Riera, P., Giergiczny, M., Colinas, C., 2011. Value of wild mushroom picking as an environmental service. Forest Policy and Economics, 13, 6, 419-424.
Mavsar, R., 2012. Application of the discret choice method for the economic valuation of forest goods in Mediterranean forests. PhD dissertation. Maribor, 234 p.
Mavsar, R., Farreras, V. 2011. Gestion durable du capital naturel de la forêt de Bouhachem (Chefchaouen, Maroc) : garantie des bénéfices sociaux, économiques and environnementaux. CTFC.
Mavsar, R., Varela, E., 2010. The Mediterranean region case. In L. Tyrväinen & E. Mäntymaa, eds. A report describing the role of key externalities across case studies. Deliverable 2.1 of the NEWFOREX project. http://newforex.org/index.php?option=com_content&view=article&id=12&Itemid=12. Accessed January 2013.

91
Mendes, Américo M.S. Carvalho (2004), The Portuguese forests. Country level report delivered to the EFFE project. [URL: http://www.efi.int/files/attachments/effe_countryreport_portugal.pdf]
Merlo, M. & Croitoru, L. (eds.), 2005. Valuing Mediterranean forests: towards total economic value. Wallingford, UK, CAB International. Mogas, J., Riera, P., Bennett, J., 2006. A comparison of contingent valuation and choice modelling with second-order interactions, Journal of
Forest Economics, 12, 1, p. 5-30. Nasi, R., Wunder, S., Campos A., J.J., 2002. Forest Ecosystem Services: can they pay our way out of deforestation?. Discussion paper. Forestry
round table. Costa Rica. Ozdemiroglu, E., Tinch, R., Johns, H., Provins, A., Powell, J., Twigger-Ross, C. (2006) Valuing Our Natural Environment – Final Report. EFTEC,
London. [URL: http://earthmind.net/rivers/docs/ukdefra-eftec-valuing-our-natural-environment.pdf] Pak, M., Türkerand, M.F., & Oztürk, A., 2010. Total economic value of forest resources in Turkey. African Journal of Agricultural Research 5(15):
1908-1916. Pearce, D. (2001) Valuing biological diversity: issues and overview. In: OECD: Valuation of Biodiversity Benefits. Selected Studies. Paris, OECD,
pp. 27-44. [URL: http://www.oecd-ilibrary.org/ environment/valuation-of-biodiversity-benefits_9789264195844-en]
Pouta, E., Rekola, M., 2005. Meta analysis of forest valuation studies. Working paper Ready, R., Navrud, S., 2006: International Benefits Transfer: Methods and Validity Tests. Ecological Economics 60(2), 429-434. Ready, R.C. S. Navrud, B. Day, R. Dubourg, F. Machado, S. Mourato, F. Spanninks and M.X.V. Rodriquez 2004: Benefit Transfer in Europe. How
Reliable Are Transfers Between Countries? Environmental and Resource Economics 29; 67-82. Riera, P., Descalzi, C.,Ruiz, A., 1995. El valor de los espacios de interés natural en España. Aplicación de los métodos de valoración contingente y
el coste del desplazamiento. Revista Española de Economía (Monográfico sobre Recursos Naturales y Medio Ambiente). Riera, P., Mogas, J., 2004. Evaluation of a risk reduction in forest fires in a Mediterranean region. Forest Policy and Economics 6 (2004) 521-528. Rosenberger, R., Loomis, J., 2000 Using meta-analysis for benefit transfer: In-sample convergent validity tests of an outdoor recreation database.
Water Resources Research 36(4): 1097-1107. Rosenberger, R., Loomis, J., 2003 Meta-Analytic Benefit Transfer of Outdoor Recreation Economic Values: Testing Out-of-Sample Convergent
Validity. Environmental and Resource Economics 25: 79-100. Scarpa, S., Hutchinson, W., Chilton, S., Buongiorno, J., 2007: Benefit value transfers conditional on site attributes: some evidence of reliability
from forest recreation in Ireland. Chapter 10 in Navrud, S and R. Ready (eds.) 2007: Environmental Value Transfer: Issues and Methods. Springer , Dordrect, The Netherlands.
Scherrer, S., 2003. Evaluation économique des aménités récréatives d'une zone humide intérieure : le cas du lac du Der. Working paper, Department of economic studies and environmental valuation, French Ministry of Environment.
Shapansky, B., Adamowicz, W., Boxall, P., 2002. Measuring Forest Resource Values: An Assessment of Choice Experiments and Preference Construction Methods as Public Involvement Tools. Edmonton (Canada): Departament of Rural Economy. Faculty of Agriculture & Forestry, and Home Economics. University of Alberta, Project Report 02-03
Smith, V., Huang, J., 1995. Can markets value air quality? A meta-analysis of hedonic property value models. Journal of Political Economy, 130, p. 209–227
Smith, V., Kaoru, Y., 1990a. What have we learned since Hotelling's letter? A meta-analysis. Economics Letters, 32, p. 267–272 Smith, V., Kaoru, Y., 1990b. Signals or noise? Explaining the variation in recreation benefit estimates. American Journal of Agricultural Economics,
72, p. 419–433 Smith, V., Osborne, L., 1996. Do contingent valuation estimates pass a ‘‘Scope’’ test? A meta-analysis. Journal of Environmental Economics and
Management, 31, p. 287–301 Söderqvist, T., Soutukorva, A., 2009. On how to assess the quality of environmental valuation studies, Journal of Forest Economics, 15, 1–2, p.
15-36 Soliño, M. 2010. External benefits of biomass-e in Spain: An economic valuation, Bioresource Technology 101: 1992-1997. Stenger, A., Harou, P. & Navrud, S. , 2009. Valuing environmental goods and services derived from the forests. Journal of Forest Economics, 15:
1-14. Sturtevant, L., Johnson, F., Desvousges, W., 1995.A Meta-Analysis of Recreational Fishing. Triangle Economic Research, Durham, UK (1995) Tempesta, T., Marangon F., 2004. Stima del valore economico totale dei paesaggi forestali italiani tramite valutazione contingente. Genio rurale. Tempesta, T., Visintin, F., Rizzi, L., Marangon, F., 2004. Il valore ricreativo dei paesaggi forestali. Rivista di Economia Agraria Tol, R.S.J. (2005) The Marginal Damage Costs of Carbon Dioxide Emissions: An Assessment of the Uncertainties. Energy Policy, 33 (16): 2064-
2074. Tumay, A. B., Brouwer R. 2007. Nonmarket Valuation of Water Quality in A Rural Transition Economy in Turkey Applying A Posteriori Bid
Design Water Resources Research 43:1-13. Turner, R. K., Paavola, J., Cooper, P., Farber, S., Jessamy, V., Georgiou, S. 2003. Valuing nature: lessons learned and future research directions.
Ecological Economics 46(3): 493-510. Turner, R.K., Brower, R., Georgiou S., Bateman, I.J., 2000. Ecosystem functions and services: an integrated framework and case study for
environmental valuation. CSERGE Working Paper GEC 2000-21. Tyrväinen, L., “The amenity value of the urban forest: an application of the hedonic pricing method”, Landscape and Urban Planning, 37, 1997,
21 -222 Walsh, R., Johnson, D., McKean, J. 1992. Benefit transfer of outdoor recreation demand studies, 1968–1988. Water Resources Research, 28, p.
707–713 Willis, K.G., Garrod, G., Scarpa, R., Powe, N., Lovett, A., Bateman, I.J., Hanley, N., MacMillan, D.C. 2003. The social and environmental benefits of
forests in Great Britain. Report to Forestry Comission. Centre for Research in Environmental Appraisal & Management University of Newcastle
Yeh, C-Y., Haab, T. C., Sohngen, B. L:, 2006. Modeling Multiple-Objective Recreation Trips with Choices over Trip Duration and Alternative Sites. Environmental & Resource Economics (2006) 34: 189–209
Zandersen, M. and R.S.J. Tol 2009: A meta-analysis of forest recreation values in Europe Journal of Forest Economics 15 (1-2), 109-130.

92
Methods and tools for socio-economic assessment of goods and services provided by Mediterranean forest ecosystems
Annexes
ANNEX 1: QUESTIONNAIRES FOR COLLECTING INFORMATION ON PREVIOUS VALUATION STUDIES CONDUCTED ON THE PILOT SITE AND SURROUNDINGS PREVIOUS VALUATION STUDIES We kindly ask you to provide us the original report/paper for any economic valuation study on forest goods and services that you know to have been conducted at the pilot site, at the regional and at the country level. The list of documents should be send with the following information: Title: Author: Study sponsor: Date of publication: Location of the study: Complete reference:
If you have an electronic copy of the reports or articles, please send them to: [email protected]
In case you only have access to printed versions of these documents, please, send a copy to the following address:
European Forest Institute Robert Mavsar Recinto histórico de Sant Pau - Pabellón Santa Victoria St. Antoni M. Claret, 167 08025 Barcelona Spain
If you are not able to provide the documents, we kindly ask you to summarize the main characteristic of the relevant valuation studies. The summary should contain at least the following information:
• Goods and services valued: For which forest goods and services the economic value is assessed? (e.g., wood, recreational activities, grazing, carbon sequestration, water purification...).
• Method used: Market prices, Avoided costs, Cost of restoration, Contingent valuation, Choice modelling, Travel cost, Hedonic pricing, etc. In case different methods have been applied, please report all of them.
• Data and data collection: What type of data was used (primary/secondary)? What data collection procedure was followed (from available databases, expert consultation, interviews with users...). If applicable, please also specify sample size and type.
• Valuation scenario: Some valuation studies assess the changes taking place from situation “A” to situation “B”. If it is the case, we would like you to provide information about: The characteristics of the valued change? Is this change triggered by ecological (e.g., climate change), socioeconomic (e. g., urbanisation, land use changes, demographic pressure) or institutional (e.g., change of ownership, changed legislation) processes? Is the valued change hypothetical or actually happening?
• Results: short summary of the main results (values) obtained. For further clarification please see the illustrative example provided below. Example:
Title: Estimation of forest values using choice modeling: An application to Spanish forests
Author: Raul Brey, Pere Riera, Joan Mogas
Summary: Application of the choice modelling method to value the forests goods and services of an afforestation
93
program in the Northeast of Spain.
Scenario of valuation: Increasing the total forest coverage in Catalonia from 40% to 50%. The additional 10% of forest area would be created at the expense of marginal agricultural land.
Goods and services valued: carbon sequestration, delayed erosion and loss of land productivity, being allowed to picnic in the new forests, being allowed to drive cars in the new forests, being allowed to pick mushrooms in the new forests.
Method used: Choice modelling method
Data and data collection: Focus groups for the design of the experiments and the identification of the key Goods and Services to be valued; elaboration of a questionnaire on afforestation alternatives and costs; random distribution of the questionnaires to a stratified sample of 800 individuals from all Catalonia; collection of data made on the basis of the questionnaires.
Results: the results reveal that, on average, individuals would pay 11.79 €/person to sequester 68000 tonnes of CO2, and 0.12 €/person for delaying the loss of land productivity during ten years. Picnic users would pay 6.33 €/person for being allowed to picnic in the new forests; people who live in rural areas would pay 12.82 € for being allowed to pick mushrooms in the new forests. On the other hand, individuals would experience a loss in welfare equivalent to -9.67 €/person if car driving were allowed in the new forests.
Complete reference: Ecological Economics 64 (2007), issue, pages
Title: Author: Summary: Scenario of valuation: Goods and services valued: Method used: Data and data collection: Results: Complete reference: Title: Author: Summary: Scenario of valuation: Goods and services valued: Method used: Data and data collection: Results: Complete reference: Title: Author: Summary: Scenario of valuation: Goods and services valued: Method used: Data and data collection: Results: Complete reference:
Thank you very much for your cooperation and important contribution to this survey!
Please send the completed questionnaire by 5 April 2013 to: [email protected]

94
Methods and tools for socio-economic assessment of goods and services provided by Mediterranean forest ecosystems
ANNEX 2: QUESTIONNAIRE CONCERNING THE IMPORTANCE OF FOREST GOODS AND SERVICES ON PILOT SITES
COUNTRY:
Pilot Site
Date of submission:
Correspondent: Name:
Title Organisation:
Address: Phone/Fax:
E-mail: Web address:
Others contributing to the questionnaire:
Name: Title
Organisation: E-mail: Name:
Title Organisation:
E-mail: Name:
Title Organisation:
E-mail:

95
A. Importance of forest goods and services (G&S) on your pilot site
In this part of the questionnaire you are asked to provide data on the current importance of the forest goods and services on your pilot site. Forest goods are materials removed from or consumed in the forest, e.g. wood, cork, fodder, mushrooms. Forest services are direct or indirect benefits that humans derive from forests such as recreation, amenity, water quality, biodiversity, etc.
Indicators
• Forest good / service: list up to 10 most important services/goods on the pilot site in descending order, from the most to the least important (for guidance see list in Annex 1).
• Area - % of the pilot site area important for the production/provision of a certain forest good/service. • Main beneficiaries – Who is mostly benefiting from the use (direct or indirect) of this forest good/service (1 -Forest owners, 2- forest administration, 3- local rural population,
4 - local urban population, 5 – visitors, 6 – whole society, 7- other, 8 – don’t know). • Trend of demand – how the future demand for a product/service is expected to be (-1 – decreasing; 0 – constant; +1 – increasing). • Remarks – add all information you consider useful to complete and clarify the data reported (e.g. details of product or services most valued, e.g. pine nuts, mushrooms or
honey within the "Food" category, wildlife watching within the "Tourism" category, etc.). As guidance, an exhaustive list of different forest goods and services is provided in Annex 1 of this questionnaire.

96
Forest good / service
Good or Service ranked from the most important to the less
important for the pilot site
Area
% of total pilot site area important for provision of
good/service
Main beneficiaries (choose as many options as
needed) 1 - forest owners
2 - forest administration 3 - local rural population 4 - local urban population
5 - visitors 6 - whole society
7 - other (please specify) 8 - don’t know
Demand Trend (choose one of the
three options)
1 - decreasing 2 - constant
3 - increasing
Remarks
1
2
3
4
5
6
7
8
9
10 Additional remarks

97
B. Relevant change drivers on the pilot site and their impacts on the provision of forest goods and services Economic valuation techniques aimed at valuing forest goods and services do not value goods and services per se, but assess changes in the current situation and how these changes would affect the provision of the relevant ecosystem services. These changes in provision can be driven by a wide array of factors, such as biophysical effects of the climate change, changes in the legislation or the ownership status, demographic and socioeconomic processes, management policies, pressures from industrial or commercial sectors, etc. Hence, to be able to develop relevant valuation methodologies for the pilot site in your country, we kindly ask you to provide information on the most relevant drivers of change that can be expected on your country’s pilot site (already existing or foreseen), and how these would affect the provision of relevant forest goods and services. In order to gather all this information from your pilot site, please complete the table you will find in the next page. Definitions of each of the rows are provided here below:
- Main drivers affecting the provision: specify the main forces that are likely to jeopardise or enhance the sustainable provision of the goods and services previously identified (in part A). Please, consider only those affecting the pilot site and its surroundings
- Main goods and services influenced: among the goods and services provided by the forests, we ask you to list those which, under a certain change, would be the most affected, either positively or negatively. Only up to three goods and services can be specified per change.
- Impact on the G&S provision: together with the good or service affected, you should also define whether the provision is expected to be affected positively (increased
provision), negatively (decreased provision) or neutrally (unchanged provision).
- Remarks: add all information you consider needed to clarify/complement the data reported.

98
The following is an illustrative example:
Main drivers affecting the
provision Main goods and services affected
Impact on the G&S provision Decreased provision Unchanged provision Increased provision
Remarks
1
Agricultural intensification due to the implementation of a policy to reduce rural migration
Food and forage production 3 – increased provision The tree layer is expected to decrease due to the agricultural pressure on the forest. The rangeland will likely increase, providing suitable fodder, but species linked to the forest humid environments are more likely to decrease/disappear.
Soil protection 1 – decreased provision
Biodiversity protection 1 – decreased provision
2 Desertification due to intensive grazing
Food, timber and wood production 1 – decreased provision This process is intimately linked to the land use: high levels of grazing and ploughing contribute to erosion and reduce the capacity of forests to retain water. On the other hand, open forest cover is less likely to suffer from severe wildfires.
Water supply and purification 1 – decreased provision
Forest fires protection 1 – decreased provision
3 Touristic development (e. g., within the framework of Plan Azur)
Recreation 3 – increased provision Increase of recreational activities will attract visitors. Aesthetics will be very relevant. Locals will make their living out of it and hence, the pressures on forests resources are expected to decrease, while traditional forest activities are also expected to disappear, entailing a loss of local knowledge.
Aesthetic 2 – unchanged provision
Touristic incomes 3 – increased provision
4 Implementation of a n policy for the conservation of forests
Tourism 3 – increased provision This change in legislation seeks to increase the quality and protection of forests as a touristic value. It is linked to a touristic development program. A great effort will be done on reducing forest fires in order to increase the security of the visitors and the durability of the resource.
Forest fire protection 3 – increased provision
Timber and wood production 1- decreased provision
Water supply and purification 1 – decreased provision
Forest fires protection 1 – decreased provision

99
Please fill-in the table according to the explanations and example provided. You are free to add more lines if needed!
Main drivers affecting the provision
Main goods and services affected
Impact on the G&S provision 1 – decreased provision 2 – unchanged provision 3 – increased provision
Remarks
1
2
3
4
5
6
7
8
9
10

100
Additional remarks

101
C. Data availability The definition of the valuation methodologies to be applied on selected pilot sites will also strongly depend on the data availability. In this section you are asked to provide information about existing data and potential data sources concerning your pilot site. In the following table you are asked to provide information about: Forest good / service – list the relevant forest goods and services, which you identified as important on the pilot site in Section A. Indicator for quantification of good/service – Specify, which data are available for your pilot site that could be used to define the quantity (in physical units) of a good/service provided on the pilot site. For example the annual production of wood can be measured in m3 per hectare per year. See Annex 2 for some further examples. Indicator for economic valuation of good/service – Specify, which data are available for your pilot site that could be used to define the economic value (in monetary units) of a good/service provided on the pilot site. For, example the value of wood can be measured by the market price for wood (e.g., EURO per m3). See Annex 2 for some further examples. Remarks - Add any information you consider useful to clarify the data reported (e.g., bibliographic source, geographic scale, year of data collection)
Forest good / service
Indicator for quantification of good/service (in physical units)
Indicator for economic valuation of good/service (in monetary units)
Remarks
1
2
3
4
5
6
7
8
9
10

102
ANNEX 1: Specification of forest goods and services classes applied in this questionnaire
Forest Goods and Services Examples
Industrial wood Wood used for industrial purposes (woodworking industries and pulp and paper industries) like timber, some wood chips and pulp wood
Fuelwood Wood used for energy purposes, like fuel wood pieces, wood some wood chips, peat, charcoal
Cork cork
Food products mushrooms, berries, vegetables, seeds, nuts, honey, herbs and spices, gums, essential oils, crops, flavouring agents (excluding game meat)
Fodder and forage fodder, forage, grass, silage (animal food products)
Decorative material christmas trees, cone crafts, bark crafts, wood crafts, carvings, floral arrangements, garlands, swags, natural dyes, souvenirs
Hunting and game products game meat, trophies, skins
Pharmaceuticals, Cosmetics and other raw materials for industrial application
biochemicals, pharmaceuticals, natural medicine, drugs, cosmetics, aromatherapy oils, essential oils, dyes, resins, gums, tannins, herbal health products, nutraceuticals, perfumes and fragrances, pet care products, shampoos, soaps
Biodiversity protection habitat protection, maintenance of biological and genetic diversity/resources
Climate regulation Regulation of: temperature, precipitation, storm protection, flood prevention, drainage and natural irrigation
Air quality regulation maintenance or improvement air quality, UV-protection by O3
Carbon sequestration carbon sink and store
Health protection Pollution control, detoxification, filtering of dust, abatement of noise pollution,
Water regulation capture and store of rainfall and moisture, regulating run-off and river flow
Water purification maintenance/improvement of water quality, decreased levels of pollutants, sediments
Soil protection maintenance of soil fertility, natural productive soils and arable land, soil erosion protection, land slide protection
Recreation walking, hiking, camping, picnicking, horseback riding, hunting, skiing, mountain biking, jogging, etc.
Tourism Guided tours, eco-tourism, biodiversity related tourism, guided non-wood forest products picking activities
Spiritual and cultural services Cultural monuments, religious and spiritual worship, funerals/burying, role play
Historical and educational services Archeological locations, school excursions, scientific research, historic, cultural and spiritual sites
Aesthetic services Scenery and landscape enjoyment,

103
ANNEX 2: Examples of Physical and Monetary Indicators that could be used on pilot sites
GOODS AND SERVICES
Physical units for quantification of good/service Monetary data for economic valuation of good/service
Industrial wood Annual increment wood (m3/ha yr) Market price for wood in local or other currency (EURO/m3)
Fuel wood Annual increment (m3/ha yr) Market price for fuel wood in local or other currency (EURO/m3
or EUR/t) Total fuelwood production (m3/ ha yr)
Cork Annual production (m3/ha) Market price for cork in local or other currency
Food Quantity of berries/mushrooms/etc. Market price of berries/mushrooms/etc. in local or other currency (EURO/kg)
Fodder and forage Quantity of fodder units (FU/yr)
Market price of fodder unit equivalent (EURO/FU) Quantity and type of grazing animals (number/ha)
Hunting and game products
Number of hunting permits (number/year) Market price of hunting permits (EURO/permit)
Number of skins, trophies, and other game products (pices/year) Market price of skins, trophies and other game products (EURO/piece)
Quantity and type of wild meat extracted from forest (t/ha/yr) Market price of different types of wild meat (EURO/kg)
Pharmaceuticals, cosmetics and raw
materials for industry
Quantity and type of plants and animals extracted for pharmaceuticals, cosmetics and raw material (kg/year)
Market price of different types of plants and animals used for pharmaceuticals, cosmetics and raw material (EURO/kg)
Biodiversity conservation/protection
Plant and animal species richness (no. of species) (e.g. birds, insects; plants/trees)
Monetary value of preservation of an additional plant or animal species (EURO/species)
Forests surface area within different levels of IUCN protected areas (ha/IUCN class)
Monetary value of habitat protection (EURO(ha)
Carbon sequestration Annual increment of biomass (m3/ha year or t/ha year) – above and belowground Market price of carbon credits (EURO/t CO2)
Health protection Safety
Negative impacts of forest fires on neighbouring land uses and infrastructure (e.g., ha of burned agriculture land, houses burned, electricity lines damaged, etc.)
Market value of damaged properties (EURO/property type)
Water purification/water
quality Water dam sedimentation levels with and without forests (t/ha) Restoration costs of water dam cleaning – sediment removal
(EURO/t of sediment)
Soil protection Soil erosion level with forest vegetation (t/ha year)
Restoration ( replacement of eroded soil, fertilisation) Soil erosion level without forest vegetation (t/ha year)
Recreation Number of visitors (No./Yr) Entrance price in local or other currency ( EUR/visit)
Value per visit ( EUR/visit) estimated with non-market methods ( travel cost, contingent valuation)

104
GOODS AND SERVICES
Physical units for quantification of good/service Monetary data for economic valuation of good/service
Tourism Number of overnights (number/year) Market price of accommodation ( EUR/night)
Spiritual and cultural services
Number of cultural monuments (number) Number of cultural related visits (number/year)
Entrance price in local or other currency ( EUR/visit)
Value per visit ( EUR/visit) estimated with non-market methods ( travel cost, contingent valuation)
Number of spiritual/religious monuments (number) Number of spiritual/religious related visits (number/year)
Entrance price in local or other currency ( EUR/visit)
Value per visit ( EUR/visit) estimated with non-market methods ( travel cost, contingent valuation)
Historical and educational services
Number of education related visits (schools, universities) Entrance price in local or other currency ( EUR/visit)
Value per visit ( EUR/visit) estimated with non-market methods ( travel cost, contingent valuation)
Aesthetic services
Number of mature trees (number/ha)
Value of forest related forest features Stand density – openness of forest structure ( trees/ha)
Tree species mixture ( % of certain species)

105
ANNEX 3: FOREST AREA IN MEDITERRANEAN COUNTRIES (FAO 2010)
Country Land area (1,000 ha)
Forest Other wooded land (OWL)
Total Forest + OWL
1,000 ha % of land area 1,000 ha % of
land area 1,000 ha % of land area
Albania 2,740 776 28 255 9 1,031 37.6
Algeria 238,174 1,492 1 2,685 1 4,177 1.8
Bosnia & Herzegovina 5,120 2,472 48 549 11 3,021 59.0
Bulgaria 10,864 3,927 36 0 0 3,927 36.1
Croatia 5,592 1,920 34 554 10 2,474 44.2
Cyprus 924 173 19 214 23 387 41.9
Egypt 99,545 70 0.0007 20 0.0002 90 0.1
France 55,010 15,954 29 1,618 3 17,572 31.9
Greece 12,890 3,903 30 2,636 20 6,539 50.7
Israel 2,164 154 7 33 2 187 8.6
Italy 29,411 9,149 31 1,767 6 10,916 37.1
Jordan 8,824 98 1 51 1 149 1.7
Lebanon 1,023 137 13 106 10 243 23.8
Libya 175,954 217 0.001 330 0.002 547 0.3
Montenegro 1,382 467 34 277 20 744 53.8
Morocco 44,630 5,131 11 631 1 5,762 12.9
Others 686 25 4 0 0 25 3.6
Portugal 9,068 3,456 38 155 2 3,611 39.8
Serbia 8,746 2,713 31 410 5 3,123 35.7
Slovenia 2,014 1,253 62 21 1 1,274 63.3
Spain 49,919 18,173 36 9,574 19 27,747 55.6
Syrian Arab Republic 18,378 491 3 35 0.002 526 2.9
Former Yugoslav Republic of Macedonia 2,543 998 39 143 6 1,141 44.9
Tunisia 15,536 1,006 6 300 2 1,306 8.4
Turkey 76,963 11,334 15 10,368 13 21,702 28.2
TOTAL Mediterranean 878,100 85,489 9.7 32,732 3.7 118,221 13.5 Note: Others = Andorra, Gibraltar, Holy See, Malta, Monaco, Palestine and San Marino.

Plan Bleu pour l’environnement et le développement en Méditerranée15, rue Beethoven, Sophia Antipolis, 06560 Valbonne, France
+33 (0)492 387 130 - www.planbleu.org