Technical Efficiency Estimation of Rice Production in ... Mohammed... · Technical Efficiency...
16
1 Technical Efficiency Estimation of Rice Production in South Korea Rezgar Mohammed, and Sayed Saghaian Department of Agricultural Economics, University of Kentucky Selected paper prepared for presentation at the 2014 Southern Agricultural Economics Association (SAEA) Annual Meetings in Dallas, TX: Feb 1-4, 2014.
Transcript of Technical Efficiency Estimation of Rice Production in ... Mohammed... · Technical Efficiency...

1
Technical Efficiency Estimation of Rice Production in South Korea
Rezgar Mohammed, and Sayed Saghaian
Department of Agricultural Economics, University of Kentucky
Selected paper prepared for presentation at the 2014 Southern Agricultural Economics
Association (SAEA) Annual Meetings in Dallas, TX: Feb 1-4, 2014.

2
Technical Efficiency Estimation of Rice Production in South Korea
Rezgar Mohammed, and Sayed Saghaian
Department of Agricultural Economics, University of Kentucky
Abstract
This paper uses stochastic frontier production function to estimates the technical
efficiency of rice production in South Korea. Data from eight provinces have been taken between
1993 and 2012. The purpose of this study is to realize whether the agricultural policy made by
the Korean government achieved a high technical efficiency in rice production and also to figure
out the variables that could decrease a technical inefficiency in rice production. The study
showed there is a possibility to increase the efficiency of production. The effect of location on
the production efficiency is significant.
Keywords: Stochastic Frontier; Rice Production Efficiency; South Korea
Introduction
Rice considers the most important agricultural commodity produces in South Korea
which has been cultivated several thousand years. Sufficient rice production for the Korean
people has been a critical objective of all political leaders and is still important to the Republic of
Korea in the current era (Cho, 1996). Rice farming is also the most important source of income
for farmers and determines food security as a whole. Agriculture in general and rice production
in particular has been subjected to a variety of subsidies provided by the Korean government
(KREI, 2010) in order in develop this sector. As the most important single crop, rice production
has been heavily subsidized in terms of both inputs and outputs (Nguyen et. al., 2012). Since
2005 the direct payment program has provided fixed and variable payments to rice farmers

3
(Nguyen et. al., 2012) which confirms the importance of this crop for Korean government. The
main objective of this study is to estimates the technical efficiency of rice production in South
Korea between 1993 and 2012 and to find the possibility of enhancing the technical efficiency in
production for oncoming years.
Efficiency in production can be defined in terms of the production function that relates
the level of various inputs (Fraser and Cordina, 1999). Technical efficiency is a measure of a
farm’s success in producing maximum output from a given set of input; in other words, technical
efficiency refers to the physical relationship between inputs used in the production process
(Fraser and Cordina, 1999).
Stochastic Frontier Production Function (SFPF) uses to estimate the technical efficiency
in order to know if rice production is located on the production frontier. This parametric
approach has been used extensively in the past two decades by some researchers to analyze the
technical efficiency of different productions and businesses (Idiong 2007, Alemu et al, Khai and
Yabe 2011, Revilla-Molina et al, Nguyen and Giang 2005& 2009, Kyi and Oppen 1999,
Margono and Sharma 2004, Kebede 2001, Omonona et al 2010). The study of cost and
environmental efficiency of rice farms in Gangwon province of South Korea between 2003 and
2007 showed that only 15.4% of farms were operating on the production frontier (Nguyen et. al.,
2012). In this study, they showed that the mean of technical efficiency among rice farmers is
about 0.772 suggesting that the average farm is able to produce their current level of output with
22.8% fewer inputs (Nguyen et. al., 2012).

4
Analytical Framework
This paper uses parametric approach to estimate efficiency of rice production in eight
provinces of South Korea between 1993 and 2012 based on stochastic frontier production
function (SFPF) technique using panel data. The stochastic frontier model was originally
proposed for the analysis of the panel data by Battese and Coelli, 1995. It has the ability to
separate the effects of noise from the effects of inefficiency and confound the effects of
misspecification of functional form with inefficiency, but generates good results only for single
output and multiple inputs (Khai and Yabe, 2011). A production frontier model by Battese and
Coelli, 1991 can be written as:
( ) ( ) ( )
Where is a production of the th province, is a suitable production function such as
the Cobb-Douglas or translog where is a (1 x k) vector of inputs of production of the th
province and is a (k x 1) vector of parameters to be estimated. The term is a two sided
(-∞ ˂ ˂∞) normally distributed random error ( ) that represents the systematic
error which accounts for random variation in output due to factors beyond the control of the
farmer. The term is a one sided ( ) efficiency component that captures the inefficiency
in production relative to the stochastic frontier (Coelli et al, 2005). The half-normal distribution
of term ( ) is used in this study. The two components of and are assumed to
be independent of each other.
The technical efficiency is defined in terms of the ratio of the observed output to the
corresponding frontier output given the available technology (Onyenweaku and Effiong, 2006).

5
( )
( )
( ) ( ) ( ) ( )
( ) ( )
Where
Yi = observed Output, and Yi* = Frontier Output
Equation (1) specifies the stochastic frontier production function in terms of the original
production values. The technical inefficiency effect model, , proposed by Battese and Coelli
(1995) is described by:
( )
Where
= non negative random variable representing inefficiency in production relative to the
stochastic frontier in the th time period.
= Vector of explanatory variables associated with the technical inefficiency effects in the
th time period.
δ = Vector of unknown parameters to be estimated.
= 0 means the production is on the frontier and it is technically efficient while
greater than zero means production is inefficient since it will lie below the frontier (Idiong,
2007).
6
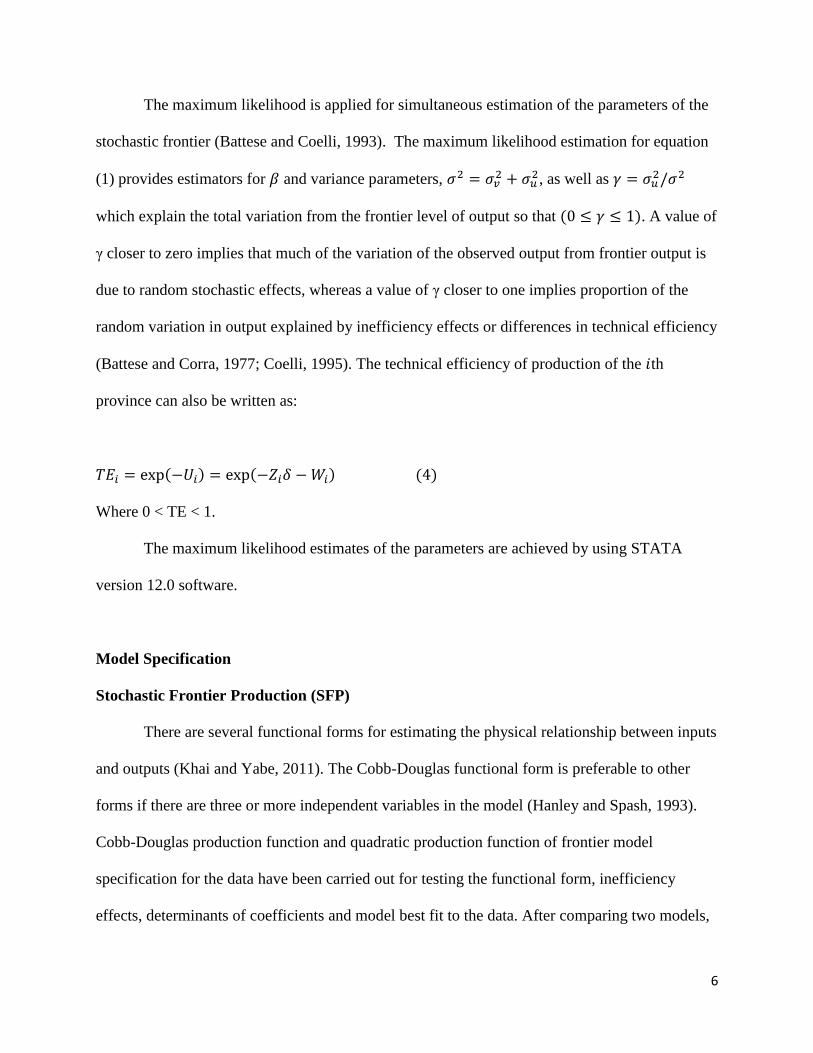
The maximum likelihood is applied for simultaneous estimation of the parameters of the
stochastic frontier (Battese and Coelli, 1993). The maximum likelihood estimation for equation
(1) provides estimators for and variance parameters,
, as well as
which explain the total variation from the frontier level of output so that ( ). A value of
γ closer to zero implies that much of the variation of the observed output from frontier output is
due to random stochastic effects, whereas a value of γ closer to one implies proportion of the
random variation in output explained by inefficiency effects or differences in technical efficiency
(Battese and Corra, 1977; Coelli, 1995). The technical efficiency of production of the th
province can also be written as:
( ) ( ) ( )
Where 0 < TE < 1.
The maximum likelihood estimates of the parameters are achieved by using STATA
version 12.0 software.
Model Specification
Stochastic Frontier Production (SFP)
There are several functional forms for estimating the physical relationship between inputs
and outputs (Khai and Yabe, 2011). The Cobb-Douglas functional form is preferable to other
forms if there are three or more independent variables in the model (Hanley and Spash, 1993).
Cobb-Douglas production function and quadratic production function of frontier model
specification for the data have been carried out for testing the functional form, inefficiency
effects, determinants of coefficients and model best fit to the data. After comparing two models,

7
results showed that the Cobb-Douglas model fitted the data and the quadratic model has been
rejected.
Under the parametric approach, the Cobb-Douglas stochastic production frontier has been
used to estimate efficiency levels of the rice production in the sample provinces. The production
function with five independent variables was applied in this study as follows which represents
the variable returns to scale (VRS) technology:
( )
Where is an output and ’s are inputs for the rice production in the th province. Specifically,
these variables are defined as follows:
• (Output) is the gross products of the th province and measured in kilograms.
• (Labor) is the labor force used in the th province and measured in hours per 10a.
• (Fertilizers) is the total amount of inorganic fertilizer used in the th province and measured
in kilograms per 10a.
• (Land) is the total land area used for this activity in the th province and measured in
thousand hectares.
• (Seed) is the total amount of seed or seedlings used for this activity in the th province and
measured in kilograms per 10a.
• (Machinery) is the hours of capital used in rice farms in the th province per 10a.
• are parameters to be estimated.
• is the composite error term.

8
Inefficiency Model for the Panel Data
The technical inefficiency could be estimated by subtracting TE from unity (Backman et
al). The following linear regression model was used to determine factors that have an effect on
the technical efficiency of rice production as follows:
(
) (
) (
) (
) ∑
( )
Where:
• ( / ) is the natural logarithm of machinery per labor.
• ( / ) is the natural logarithm of inorganic fertilizer per organic fertilizer.
• ( / ) is the natural logarithm of hired labor per family labor.
• ( / ) is the natural logarithm of female labor per male labor.
• is a dummy variable of location and it is equal to 1 if province 1, as an example, is in the
region 1 and equal to zero otherwise.
• is an error term.
• t is time.
Data
Data used for this paper include inputs and output of rice production for eight provinces
of South Korea which are Gyeonggi-do, Gangwon-do, Chungcheongbuk-do, Chungcheongnam-
do, Jeollabuk-do, Jeollanam-do, Gyeongsangbuk-do, Gyeongsangnam-do between years 1993 to
2012. Data were obtained from the Microdata Service System of the Korean National Statistical
Office. These provinces have been chosen because of the availability of data for these provinces

9
in the mentioned official office website. A statistical summary of inputs and output are presented
in Table 1.
Table 1. Statistical Summary of Inputs and Output
Variable Mean Std. Dev. Min. Max.
Output 783817.9 342960.5 218209 1456236
Labor 25.57969 8.957743 11.86 51.9
Fertilizer 70.09444 14.11713 47.8 129.07
Land 120.3812 50.93514 35 226
Seed 6.62575 0.8312918 4.5 8.89
Capital 7.535125 4.286053 2.55 47.57
The output is the total amount of rice produced in each provinces annually. The data
related to output indicate that the amount of rice produced was almost constant in some
provinces for the first decade and was decreasing for all provinces in the second decade. One
reason behind that could be the decrease of the cultivated land size during the study period
because it was in decreasing rate, too. The hours of labor include both own and hired male and
female labor force in rice farms. Family labor used in rice farms in huge amount compared to
hired labor and most of the labor have been done by male. Fertilizer represents inorganic
kilograms of fertilizer used for production. Land is thousand hectares of land used for rice
production. Jeollanam-do province has the biggest rice area cultivation. Seed represent total
kilograms of seed and seedlings used for this purpose. Capital is the hours of machinery used in
rice farms.
Results and Discussion
The output elasticity estimates with respect to five production inputs used is shown in
table 2. The table shows that the production partial elasticities are not within the expected sign.
10
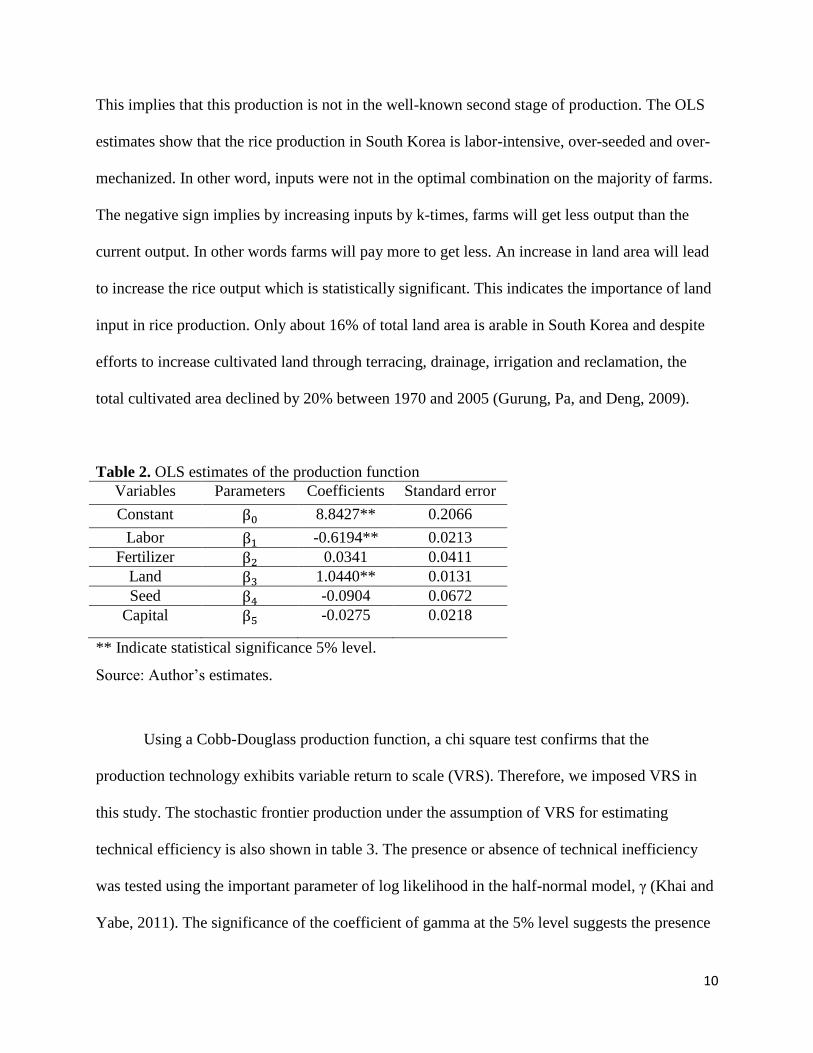
This implies that this production is not in the well-known second stage of production. The OLS
estimates show that the rice production in South Korea is labor-intensive, over-seeded and over-
mechanized. In other word, inputs were not in the optimal combination on the majority of farms.
The negative sign implies by increasing inputs by k-times, farms will get less output than the
current output. In other words farms will pay more to get less. An increase in land area will lead
to increase the rice output which is statistically significant. This indicates the importance of land
input in rice production. Only about 16% of total land area is arable in South Korea and despite
efforts to increase cultivated land through terracing, drainage, irrigation and reclamation, the
total cultivated area declined by 20% between 1970 and 2005 (Gurung, Pa, and Deng, 2009).
Table 2. OLS estimates of the production function
Variables Parameters Coefficients Standard error
Constant 8.8427** 0.2066
Labor -0.6194** 0.0213
Fertilizer 0.0341 0.0411
Land 1.0440** 0.0131
Seed -0.0904 0.0672
Capital -0.0275 0.0218
** Indicate statistical significance 5% level.
Source: Author’s estimates.
Using a Cobb-Douglass production function, a chi square test confirms that the
production technology exhibits variable return to scale (VRS). Therefore, we imposed VRS in
this study. The stochastic frontier production under the assumption of VRS for estimating
technical efficiency is also shown in table 3. The presence or absence of technical inefficiency
was tested using the important parameter of log likelihood in the half-normal model, γ (Khai and
Yabe, 2011). The significance of the coefficient of gamma at the 5% level suggests the presence

11
of one-sided error component and rejects the null hypothesis that there is no inefficiency effect.
This means that the effect of technical inefficiency is significant. The estimated variance ratio of
0.9204 means about 92% of the discrepancies between observed output and the frontier output
are due to technical inefficiency. The small value of σ2 indicates that there were insignificant
changes in the rice production outputs of the sampled provinces over the past decade.
Table 3. Maximum likelihood estimates of stochastic production frontier model
Variables Parameters Coefficients Standard error
Constant 9.0632* 0.2417
Labor -0.1518* 0.0291
Fertilizer -0.0390 0.0443
Land 1.0619* 0.0164
Seed 0.0510 0.0758
Capital 0.0057 0.0224
Sigma-squared σ2 0.0594 0.2406
Gamma γ 0.9204* 0.3225
Log likelihood 193.9809
* Indicate statistical significance 5% level.
Source: Author’s estimates.
The negative sign of the parameters in table 4 means the associated variables have a
positive effect on technical efficiency. The machinery per labor variable was used in order to
know whether the technical efficiency increases when more machinery use in rice farms than
labor. The result shows that it leads to the insignificant increase in the technical efficiency of the
rice production. Use of more inorganic fertilizer than organic causes an insignificant increase in
the technical efficiency, too. The significance of the inefficiency effect of hired labor per own or
family labor variable indicates that technical inefficiency tends to increase as the weight of
family labor increases. This interesting result explains that the labor cost of family labor farms is
high compare to the labor cost of hired labor farms because in the first case there is no pressure

12
on farms to decrease the labor cost. Data showed that the family labor is dominant on the hired
labor at rice farms. One problem of agricultural sector with respect to the labor force in South
Korea is starting with industrialization, an increasing number of younger members of farm
households migrate to urban areas, made a declining in labor force and depending of farms on
aging household members (Gurung, Pa, and Deng, 2009).
Table 4. Maximum likelihood estimates of technical inefficiency model
Variables Parameters Coefficients Standard error Mean TE
Constant 1.5437* 0.5355
(machinery/labor) -0.0031 0.0026
(in.fert./o.fert.) -0.0008 0.0018
(hired l./own l.) -0.0075* 0.0023
(female/male) 0.0121 0.0062
Province 2 -1.1483* 0.3991 0.98
Province 3 -1.3641* 0.4739 0.99
Province 4 -1.2220* 0.4247 0.98
Province 5 -1.2552* 0.4336 0.98
Province 6 0.2274 0.1159 0.90
Province7 -1.1668* 0.4036 0.98
Province 8 -0.6232* 0.2207 0.95
Sigma-squared σ2 0.8918 1.6433
Gamma γ 0.9999* 0.0001
Log likelihood 530.3058
* Indicate statistical significance at 5% level.
Source: Authors’ estimates.
The significance of the inefficiency effects of variables representing provinces, except
Jeollanam-do province, indicate that location has also a significant impact on the efficiency of
rice production in South Korea which could be caused by the environmental conditions and
13
technical efficiency will increase by more production in these provinces. Province 3 has the
highest technical efficiency among provinces.
Conclusion
Despite the importance of rice production to Korean economy, technical efficiency of
rice production has not been studied much in South Korea. This study revealed the high
technically efficient of rice production in South Korea caused by an implementation of a
successful agricultural policy which aimed to get the country to the self-sufficiency level. There
is not a big difference in technical efficiency between provinces which the study showed that the
technical efficiency of rice production ranged from 79% in Jeollanam-do in 2012 to 99% in
Chungcheongbuk-do in 1993 and the reason behind having inefficiency in production is the
labor-intensive, over-seeded and over-mechanized during a production which made producers to
use more and get less. There is a possibility to increase the technical efficiency if more hired
labor uses rather than family labor. The effect of location is also significant on technical
efficiency.

14
References
Alemu, B.A., Nuppenau, E-A., and Boland H. Technical Efficiency of Farming System Across Agro-Ecological
Zones in Ethiopia: An application of Stochastic Frontier Analysis. Online Publication.
Backman, S., Islam, K.M.Z., and Sumelius, J. Determinants of Technical Efficiency of Rice Farms in North-Central
and North-Western Regions in Bangladesh. Online Publication.
Battese, G.E. and Corra, G.S., 1977. Estimation of a Frontier Model: With Application to the Pastoral Zone of
Eastern Australia. Australian Journal of Agricultural Economics, 21:167-179
Battese, G.E. and Coelli, T.J. 1991. Frontier Production Functions, Technical Efficiency and Panel Data: With
Application to Paddy Farmers in India.
Battese, G.E. and Coelli, T.J. 1993. A stochastic frontier production function incorporating a model for technical
inefficiency effects. Working Papers in Econometrics and Applied Statistics No 69, Department of Econometrics,
University of New England, Armidale, Australia.
Battese, G.E. and Coelli, T.J. 1995. A model for technical inefficiency effects in a stochastic frontier
production function for panel data. Empirical Economics, 20, 325-332.
Cho, M. K.D., 1996. Economic Analysis of the Government Pricing Program for Rice in South Korea, PhD
Dissertation Submitted to the Texas Tech University, p. 7.
Coelli, T.J., 1995. Recent Developments in Frontier Modeling and Efficiency Measurement. Australian Journal of
Agricultural Economics, 39(3):219-245.
Coelli ,T.D.P.R., and George, E.B., 2005. An Introduction to Efficiency and Productivity Analysis, Springer
Science, New York.
Fraser, I., and D. Cordina, 1999. An Application of Data Envelopment Analysis to Irrigated Dairy Farms
in Northern Victoria, Australia. Agr. Systems 59: 267-82.

15
Gurung, R., Pa, C., and Deng, H., 2009. South Korea Agriculture Policy Review. Agriculture and Agri-Food
Canada, Vol. 5, No. 1.
Hanley, N. and Spash, C.L., 1993. Farm Management Research for Small Farmer Development, Food and
Agriculture Organization of the United Nations, Rome.
Idiong, I.C., 2007. Estimation of Farm Level Technical Efficiency in Smallscale Swamp Rice Production in Cross
River State of Nigeria: A Stochastic Frontier Approach. IDOSI Publications, World Journal of Agricultural Sciences
3 (5): 653-658.
Kebede, T.A., 2001. Farm Household Technical Efficiency: A Stochastic Frontier Analysis. A Study of Rice
Producers in Mardi Watershed in the Western Development Region of Nepal. A Master Thesis Submitted to
Department of Economics and Social Sciences, Agricultural University of Norway.
Khai, H.V., and Yabe, M., 2011. Technical Efficiency Analysis of Rice Production in Vietnam, J. ISSAAS, Vol. 17,
No. 1:135-146.
KREI, 2010. Agricultural Outlook Forum, USDA Foreign Agricultural Service.
Kyi, T., and Oppen, M. V., 1999. Stochastic Frontier Production Function and Technical Efficiency Estimation: A
Case Study on Irrigated Rice in Myanmar. Deutscher Tropentag 1999 in Berlin, Session: Sustainable Technology
Development in Crop Production.
Margono, H., and Sharma, S.C., 2004. Technical Efficiency and Productivity Analysis in Indonesian Provincial
Economics. Discussion Papers. Paper 26.
Nguyen, K.M., and Giang, T.L., 2005. Efficiency of Construction Firms in Vietnam. Munich Personal RePEc
Archive, MPRA Paper No. 968, Online Paper.
Nguyen, K.M., and Giang, T.L., 2009. Efficiency Estimates for the Agricultural Production in Vietnam: A
Comparison of Parametric and Non-parametric Approaches. Agricultural Economics Review, Vol. 10 No. 2.

16
Nguyen, T.T., Hoang, V.N., and Seo, B., 2012. Cost and Environmental Efficiency of Rice Farms in South Korea,
Agricultural Economics 43 (2012) 369-378.
Omonona, B.T., Egbetokun, O.A., and Akanbi, A.T., 2010. Farmers Resource-Use and Technical Efficiency in
Cowpea Production in Nigeria. Economic Analysis and Policy, Vol. 40 No. 1.
Onyenweaku, C. E., Effiong, E. O., 2006. Technical efficiency in pig production in Akwa-Ibom State, Nigeria,
paper presented at the 40th Annual Conference of the Agricultural Society of Nigeria held at NRCRI, Umudike.
Revilla-Molina I.M., Bastiaans L., Van Keulen, H., Mew, T.W., Zhu, Y.Y., and Villano, R.A. Improvement of
Technical Efficiency in Rice Farming through Interplanting: A Stochastic Frontier Analysis in Yunnan, China.
Online Publication.