
Technical & Economic Assessment Grid, Mini-grid & Off-grid Electrification Technologies Chubu...
15
Technical & Economic Assessment Grid, Mini- grid & Off-grid Electrification Technologies Chubu Electric Power Co.,Inc. (CEPCO) Toyo Engineering Co. (TOYO) The Energy and Resources Institute (TERI) Princeton Energy Resources Institute (PERI)
-
Upload
marissa-thomas -
Category
Documents
-
view
230 -
download
10
Transcript of Technical & Economic Assessment Grid, Mini-grid & Off-grid Electrification Technologies Chubu...

Technical & Economic Assessment Grid, Mini-grid & Off-grid Electrification Technologies
Chubu Electric Power Co.,Inc. (CEPCO)Toyo Engineering Co. (TOYO)The Energy and Resources Institute (TERI)Princeton Energy Resources Institute (PERI)

Study Objective
To characterize the current and future comparative economic costs of generation from renewable and fossil fuel-fired electricity generation technologies configured to suit off-grid, mini-grid and grid applications (50 W to 500 MWs)

Generating Types
Off-grid Mini-grid Grid-connected 10w 100w 1kw 10kw 100kw 1MW 10MW 100MW 1GW
Renewable(13)
Solar PV Wind PV-Wind Hybrids Solar thermalGeothermal Biomass Gasifier Landfill Gas Biomass SteamBiogasPico/Micro HydroMini HydroLarge HydroPumped storage Hydro
Fossil(9)
Diesel/Gasoline GeneratorMicro TurbinesFuel CellsOil/Gas Combustion Turbines Oil/Gas Combined Cycle Coal Steam (subcritical, SC, USC)
Coal IGCCCoal AFB Oil Steam
Power Generation Options

Estimated by Study team, based on World Energy Outlook 2005(IEA), International Energy Outlook (DOE) and World Bank.
Fuel cost include transportation cost and refinery cost.(Gasoline:50%, LO: 40%) Base crude oil : 38$/bbl
Levelized Fuel Cost
(2004 $/GJ)
Generating Technology
Oil
Gasoline19.6
(2.4$/gal) Gasoline-generator
Light oil 14.7(2.0$/gal)
Diesel-generator, Combustion-turbine, Combined-cycle
Residual Oil 5.7 Diesel-generator, Oil steam
Coal
India (Sulfur 0.6%) 1.6 AFBC
Australia (Sulfur 0.8%)
2.1 Coal-steam, IGCC
Gas Natural gas 5.7Combustion-turbine, Combined-cycle, Micro-turbine
Fuel Prices

Power Generation Options for Off-grid, Mini-grid and Grid-connected Applications
Pico Hydro 1kW
Gas Combined Cycle 300MW
Coal Steam subcritical 300MW
Coal IGCC 300MW
Coal AFBC 300MW
Oil Steam 300MW
Biomass Gasifier 100kW
Biogas 60kW
Micro Hydro 100kW
Wind 10MW
Geothermal 50MW
Bio Steam 50MW
MSW/ Landfill Gas 5MW
Mini Hydro 5MW
Diesel Generator 5MW
Fuel Cells 5MW
0 2 4 6 8 10 12 14 16 18
20042015
20042015
20042015
20042015
20042015
20042015
20042015
20042015
20042015
20042015
20042015
20042015
20042015
20042015
20042015
20042015
Off
-Gri
dM
ini-
Gri
dG
rid
con
necte
d
(cent/kWh)
Average
Sensitivity Range

Many renewables are generally more economical than comparable conventional
generation options in off-grid (1 kW or less) configurations
0 10 20 30 40 50 60 70 80 90
2004
2015
2004
2015
2004
2015
2004
2015
2004
2015
2004
2015
2004
2015
2004
2015
(cent/kWh)
Diesel/Gasolene Generator 1kW(CF=30%)
Diesel/Gasolene Generator 300W(CF=30%)
Pico Hydro 1kW(CF=30%)
Pico Hydro 300W(CF=30%)
PV-Wind Hybrid 300W (CF=30%)
Wind 300W(CF=30%)
Solar PV 300W(CF=20%)
Solar PV 50W(CF=20%)
Average
Sensitivity Range

Renewables also compare favorably with comparable conventional generation options
in mini-grid (5kW-500kW) configurations
0 5 10 15 20 25 30 35 40 45 50 55 60
2004
2015
2004
2015
2004
2015
2004
2015
2004
2015
2004
2015
2004
2015
2004
2015
2004
2015
2004
2015
(cent/kWh)
Solar PV 25kW(CF=20%)
Wind 100kW(CF=30%)
PV-Wind Hybrid100kW (CF=30%)
Geothermal 200kW(CF=70%)
Biomass Gasifier 100kW (CF=80%)
Biogas 60kW(CF=80%)
Micro Hydro 100kW(CF=30%)
Diesel Generator 100kW (CF=80%)
Micro Turbines 100kW(CF=80%)
Fuel Cells 200kW(CF=80%)

Some renewables are more economical than conventional generation in small (5MW –
50MW) grid-connected applications
0 5 10 15 20 25
2004
2015
2004
2015
2004
2015
2004
2015
2004
2015
2004
2015
2004
2015
2004
2015
2004
2015
2004
2015
2004
2015
2004
2015
(cent/kWh)
Wind 10MW(CF=30%)
Solar Thermal without storage 30MW (CF=20%)
Solar Thermal with storage 30MW (CF=54%)
Geothermal 20MW(CF=85%)
Geothermal 50MW(CF=90%)
Biomass Gasifier 20MW (CF=80%)
Bio Steam 50MW(CF=80%)
MSW/Landfill Gas 5MW (CF=80%)
Mini Hydro 5MW(CF=45%)
Diesel Generator (Base)5MW (CF=80%)
Diesel Generator (Peak)5MW (CF=10%)
Fuel Cell 5MW(CF=80%)

Conventional generation options remain more economical for grid-connected applications
0 2 4 6 8 10 12 14 16 18
2004
2015
2004
2015
2004
2015
2004
2015
2004
2015
2004
2015
2004
2015
2004
2015
2004
2015
(cent/kWh)
Wind 100MW(CF=30%)
Geothermal 50MW(CF=90%)
Large Hydro 100MW(CF=50%)
Gas Comb. Turbines (Peak) 150MW (CF=10%)
Gas Combined Cycle 300MW (CF=80%)
Coal Steam 300MW(CF=80%)
Coal IGCC 300MW(CF=80%)
Coal AFBC 300MW(CF=80%)
Oil Steam 300MW(CF=80%)

Many Coal generation options; best choice depends on fuel costs and environmental
requirements
0 1 2 3 4 5 6 7
2004
2015
2004
2015
2004
2015
2004
2015
2004
2015
2004
2015
2004
2015
2004
2015
(cent/kWh)
Coal Steam subcritical300MW (CF=80%)
Coal IGCC 300MW(CF=80%)
Coal AFBC 300MW(CF=80%)
Coal Steam subcritical500MW (CF=80%)
Coal Steam SC500MW (CF=80%)
Coal Steam USC500MW (CF=80%)
Coal IGCC 500MW(CF=80%)
Coal AFBC 500MW(CF=80%)
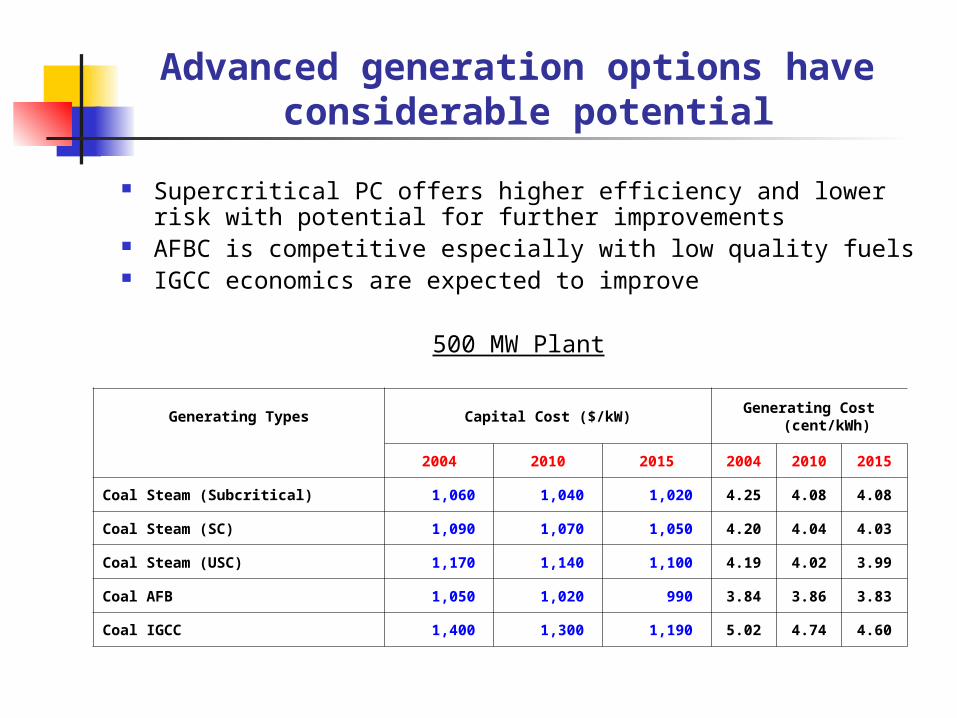
Advanced generation options have considerable potential
Supercritical PC offers higher efficiency and lower risk with potential for further improvements
AFBC is competitive especially with low quality fuels IGCC economics are expected to improve
500 MW Plant
Generating Types Capital Cost ($/kW)Generating Cost
(cent/kWh)
2004 2010 2015 2004 2010 2015
Coal Steam (Subcritical) 1,060 1,040 1,020 4.25 4.08 4.08
Coal Steam (SC) 1,090 1,070 1,050 4.20 4.04 4.03
Coal Steam (USC) 1,170 1,140 1,100 4.19 4.02 3.99
Coal AFB 1,050 1,020 990 3.84 3.86 3.83
Coal IGCC 1,400 1,300 1,190 5.02 4.74 4.60

Factors being taken into account
Fuel price forecasts Technology development trends Grid connection costs and issues Risks Climate change considerations

Fuel Price Forecasts
0.0
2.0
4.0
6.0
8.0
10.0
12.0
14.0
16.0
($/G
J, in
200
4)
33$/bbl → 38$/bbl
4.1$/MMBtu → 5.1$/MMBtu
35$/ton → 40$/ton
High-case
2005, Reference-
case
High-case
2005, Reference-
case
High-case2005, Reference-case
2004, Reference-
case
OilGasCoal
2004, Reference-
case
2004, Reference-case
Source: Estimated by Study team, based on World Energy Outlook 2005(IEA), International Energy Outlook (DOE) and World Bank

500 MW Thermal Power PlantCO2 Reduction Potential
Net Efficiency (%LHV)
Annual CO2 Reduction
(million tons/year)
Value of CO2 Reductions at
$20/ton ($millions/year
)
Subcritical 39.0 Base BaseSupercritical 41.0 -0.138 -2.75Ultra-supercritical
44.0 -0.320 -6.41
IGCC (2005) 43.2 -0.274 -5.48IGCC (2020) 45.0 -0.376 -7.52
Capacity Factor: 80%

Conclusions Renewables are competitive especially
for off-grid and mini-grid applications Thermal power still preferable for large
grid connected applications Technological developments and
climate change may alter the cost-effectiveness of technologies
Site-specific factors affect significantly the technology selection
Remaining activities under the project: Complete risk assessment Develop spreadsheet to assess costs
considering site-specific considerations