Technical Documentation Page 1. Report No. 2. Government ...
52
Technical Documentation Page 1. Report No. 2. Government Accession No. 3. Recipient's Catalog No. 4. Title and Subtitle 5. Report Date May 1982 Analysis of Saturation Flow at Signalized 6. Performing Organization Code Intersections 8 . Performing Organization Report No. 7. Author( s) . K. R. Agent and J, D. Crabtree UKTRP-82-8 9. Performing Organization Name and Address 10. Work Unit No. (TRAlS) Kentucky Transportation Research Program College of Engineering 11. Contract or Grant No. University of Kentucky KYHPR-80-82 Lexington KY 40506 13. Type of Report and Period Covered 12. Sponsoring Agency Name and Address Kentucky Department of Transportation Interim State Office Building Frankfort, KY 40622 14. Sponsoring Agency Code 15. Supplementary Notes ---- Study Title: Capacity of Signalized Intersections 16. Abstract The accuracy of saturation flow values is of prime importance when determining the capacity of signalized intersections. The objective of this study was to collect a large sample of field measurements so that reliable saturation flow values could be obtained and the factors affecting saturation flow could be identified. The results identified several factors which had significant influence on saturation flow. A formula was recommended for use in estimating an appropriate saturation flow value for a specific lane on an approach to an intersection. Adjustment factors were applied to a "base'' saturation flow value. Adjust- ments 'werec·developed for the follmoing factors; location in city, city population, vehicle type and turning maneuver, gradient, width of lane, turning radius (jar right-turning vehicles), pedestrian activity, type of lane, speed limit, and light condition. f-------- 17. Key Words 18. Distribution Statement saturation flow lane width signal:lzed intersection gradient intersection capacity vehicle type turning maneuver 19. Security Classif. (of this report) 20. Security Classif, (of this page) 21. No. of Pages 22, Price Form DOT F 1700.7 <B-72l Reproduction of completed page authorized
Transcript of Technical Documentation Page 1. Report No. 2. Government ...
Technical ~eport Documentation Page
1. Report No. 2. Government Accession No. 3. Recipient's Catalog No.
4. Title and Subtitle 5. Report Date
May 1982 Analysis of Saturation Flow at Signalized 6. Performing Organization Code
Intersections 8 . Performing Organization Report No.
7. Author( s) .
K. R. Agent and J, D. Crabtree UKTRP-82-8 9. Performing Organization Name and Address 10. Work Unit No. (TRAlS)
Kentucky Transportation Research Program College of Engineering 11. Contract or Grant No.
University of Kentucky KYHPR-80-82
Lexington KY 40506 13. Type of Report and Period Covered
12. Sponsoring Agency Name and Address
Kentucky Department of Transportation Interim
State Office Building Frankfort, KY 40622 14. Sponsoring Agency Code
15. Supplementary Notes ----
Study Title: Capacity of Signalized Intersections
16. Abstract
The accuracy of saturation flow values is of prime importance when determining the capacity of signalized intersections. The objective of this study was to collect a large sample of field measurements so that reliable saturation flow values could be obtained and the factors affecting saturation flow could be identified.
The results identified several factors which had significant influence on saturation flow. A formula was recommended for use in estimating an appropriate saturation flow value for a specific lane on an approach to an intersection. Adjustment factors were applied to a "base'' saturation flow value. Adjust-ments 'werec·developed for the follmoing factors; location in city, city population, vehicle type and turning maneuver, gradient, width of lane, turning radius (jar right-turning vehicles), pedestrian activity, type of lane, speed limit, and light condition.
f--------
17. Key Words 18. Distribution Statement
saturation flow lane width signal:lzed intersection gradient intersection capacity vehicle type turning maneuver
19. Security Classif. (of this report) 20. Security Classif, (of this page) 21. No. of Pages 22, Price
Form DOT F 1700.7 <B-72l Reproduction of completed page authorized

Research Report UKTRP-82-8
ANALYSIS OF SATURATION FLOW AT SIGNALIZED INTERSECTIONS
by
Kenneth R. Agent Chief Research Engineer
and
Joseph D. Crabtree Senior Research Engineer
Kentucky Transportation Research Program College of Engineering University of Kentucky
Lexington, Kentucky
in cooperation with Department of Transportation
Commonwealth of Kentucky
and
Federal Highway Administration U.S. Department of Transportation
The contents of this report reflect the views of the authors, who are responsible for the facts and
accuracy of the data presented herein. The contents do not necessarily reflect the official views or
policies of the University of Kentucky, the Federal Highway Administration, or the Kentucky Department
of Transportation. This report does not constitute a standard, specification, or regulation.
July 1982

ACKNOWLEDGEMENTS
Special appreciation is expressed to members of the Study Advisory
Committee who devoted their time and effort throughout the research
period. Advisory Committee members are: Jon Clark, Chairman,
representing the Kentucky Department of Transportation, Dave Uckotter,
representing the Lexington-Fayette Urban County Government, and Robert
Farley, representing the Federal Highway Administration.


I.
II.
III.
IV.
TABLE OF CONTENTS
Introduction . Review of Literature
Procedure . . . A. Data Collection
B. Data Analysis
Results . .
Page
1
l
1
1
2
3
A. Vehicle Position in Queue 3
B. Location in City and Pedestrian Activity 3
C. City Size 4
----------ro~-c.--l!'tf"'e>thrii-occll"e.---'fT"'Y"'P"'e~a n d Turn r n g 11 an e u v e r 5
E. Gradient • 5
F. Lane Width 6
G. Turning Radius 6
H. Parking 6
I. Approach Width or Width of Adjacent Lane 7
J. Type of Lane •
K. Time of Day (Peak or Non-Peak Hours)
L. Speed Limit
7
8
8
_____________ 1'1_. __ j,Je a ll1_er-_o_r Road_ S u l"i ace Con d i t i Q~__. __ .__ _ , __ _§__________ __________ _ _________ _
H. Light Conditions
V. Recommendations
VI. Implementation
VII. Figures
VIII. Tables .
•.
IX.
X.
Appendix A.
Appendix B.
Results of Literature Review
Case Studies
XI. References •
9
9
11
13
23
29
37
43


IHTRODUCTIOH
When the green signal phase begins on an approach to an intersection, vehicles take some time to reach a normal running speed; but after a few seconds, the queue discharges at a more or less constant rate termed saturation flow. The basic model of the variation of discharge rate of a queue with time in a fully saturated green period is illustrated in Figure l Cll. A fully saturated green period is one in which the queue is not completely discharged during the green period. Saturation flow is the maximum constant departure rate from the queue during the green period, and it remains fairly constant unti I either the queue is exhausted or the green period ends. Saturation flow may vary as a functi~n of
turning radius, pedestrian activity, parking, approach width, type of lane, time of day, speed I i mit,
1
weather or road surface condition, and I ight conditions.
A detailed summary of results of the I iterature review is in Appendix A.
PROCEDURE
DATA COLLECTION
---~---jtetns such as layout (lane width, grade, turning vehicles, and the traffic stream.
nf the intersect i-Dni----.LD!<IaU collect i on--e~~~---f'J"--i-Jn<l~i-1¥-----etc.l, number of of measuring time intervals between when
types of vehicles in the signal turned green and when the rear
Accuracy of saturation flow values is of prime importance when determining the capacity of signalized intersections. The objective of this study was to collect a large· sample of field data so that rei iable saturation flow values could be computed and factors affecting saturation flow could be identified. These saturation flow values may be used as input for determining intersection capacity and when using computer models to simulate and optimize signal systems.
REVIEW OF LITERATURE
wheels of each vehicle in the queue crossed the stop bar. The stop bar was selected as the screenline because it was felt that it would give the best and most consistent results. At many intersections, cross-streets were offset or intersected at an angle, which made determination of point of vehicle entry into the intersection difficult. The major problem encountered with using the stop bar occurred whenever a vehicle stopped past that line. In such a situation, the time for that vehicle was omitted, although its presence was noted.
The first phase of the study involved selecting intersection approaches where
-~-------------------------aa-ta--wouTcloe-coTiected. Tile rna -JoYfly--or ____ _ An extensive literature review was
conducted on the topics of intersection capacity and saturation flow. This review identified various methods which had been used to measure saturation flow. It also identified many factors which had been found to affect saturation flow. These factors were:
vehicle position in queue, location in city, city size, vehicle type and turning maneuver, gradient, lane width,
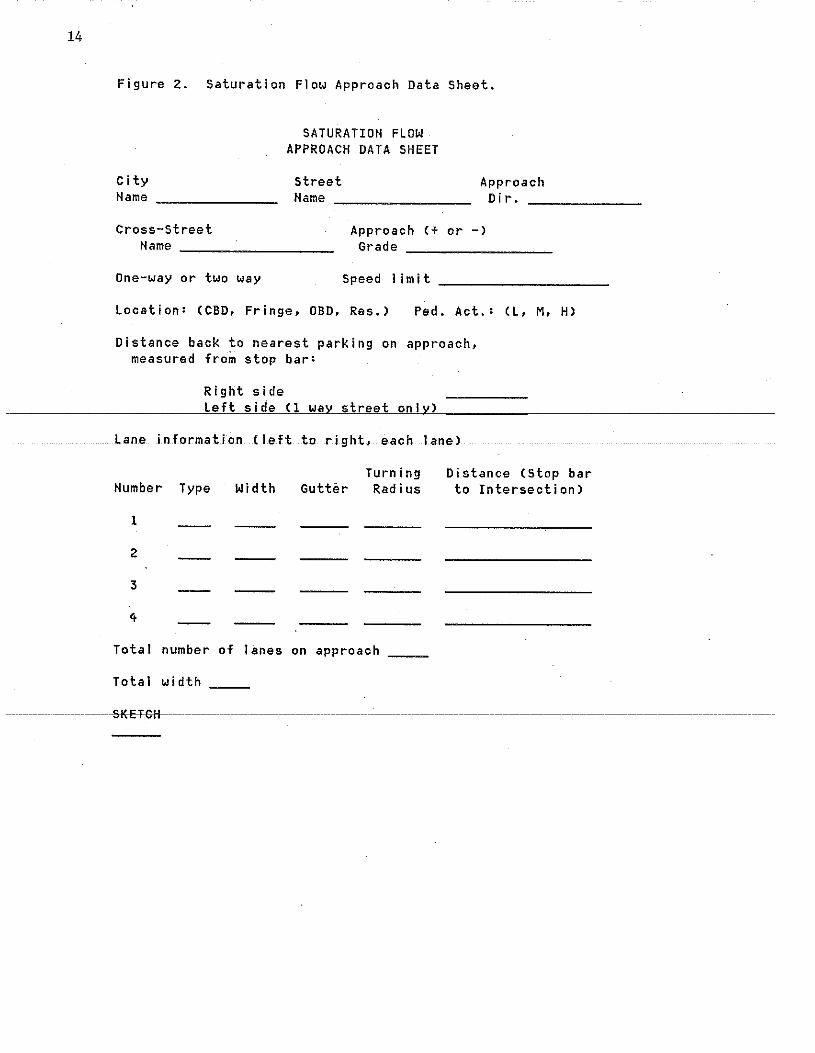
data was collected in lexington, Kentucky. Approaches were selected so that a range in values for the variables would be available for data analysis. In other words, an attempt was made to select approaches in different areas having a range in such variables as lane width and gradient. Various cities across the state were selected for data collection. The objective was to select cities which had a wide range of populations and were distributed throughout the state. Data describing each approach were recorded onto a data sheet (Figure 2). All

2
necessary measurements were made at subject approaches. Approach grade was obtained using an Abney hand level meter.
The data sheet used for collecting actual saturation flow data is shown in Figure 3, and descriptions of codes used thereon are given in Figure 4. The data sheet contained information describing the intersection, in addition to basic information obtained for each vehicle in the queue. For each vehicle, the time from start of green to when the rear wheels crossed the stop bar was recorded <tl. A description of the vehicle and/or its action was recorded when appropriate <dl. Specifically, ~hen a vehicle turned, when it was anything other than a passenger car (pick-up trucks and vans were included with cars), or when its progress was interrupted, the appropriate
----<Yo"d·e, as de-seriiled i 11 I'Tgura-tr.-.rasonrt8l. Vehicles that were interrupted were excluded from the subsequent analysis.
Data were collected for each vehicle in the queue and recorded as a function of the vehicle's position in the queue <nl. When vehicles changed lanes or entered the queue from an adjacent driveway, thereby disrupting normal movement, data collection was discontinued for that· cycle. When more than 25 vehicles went through the intersection during a signal phase, the time and number of the last vehicle were recorded. Data were collected only for those vehicles that were part of the queue when the signal indication turned green or became a part of the queue before reaching the stop bar.
If the entire green phase was uti! ized without exhausting the queue, the phase was termed "loaded", and that was noted. Green-plus-yellow times were noted for loaded cycles to determine the lost times at the ends of cycles. This will be used in intersection capacity calculations. In many instances, the green-plus-yellow time was constant for loaded cycles. The yellow time was also noted for most approaches.
All times for individual vehicles were obtained with a split/cumulative timer that displayed time to the nearest 0.01 second. The timer had a digital display which was easy to read. The timer
was started at the beginning of green and a button was pushed when each vehicle crossed the stop bar. Elapsed time since starting of the timer was displayed for each vehicle and noted to the nearest 0.1 second on the data sheet.
DATA ANALYSIS
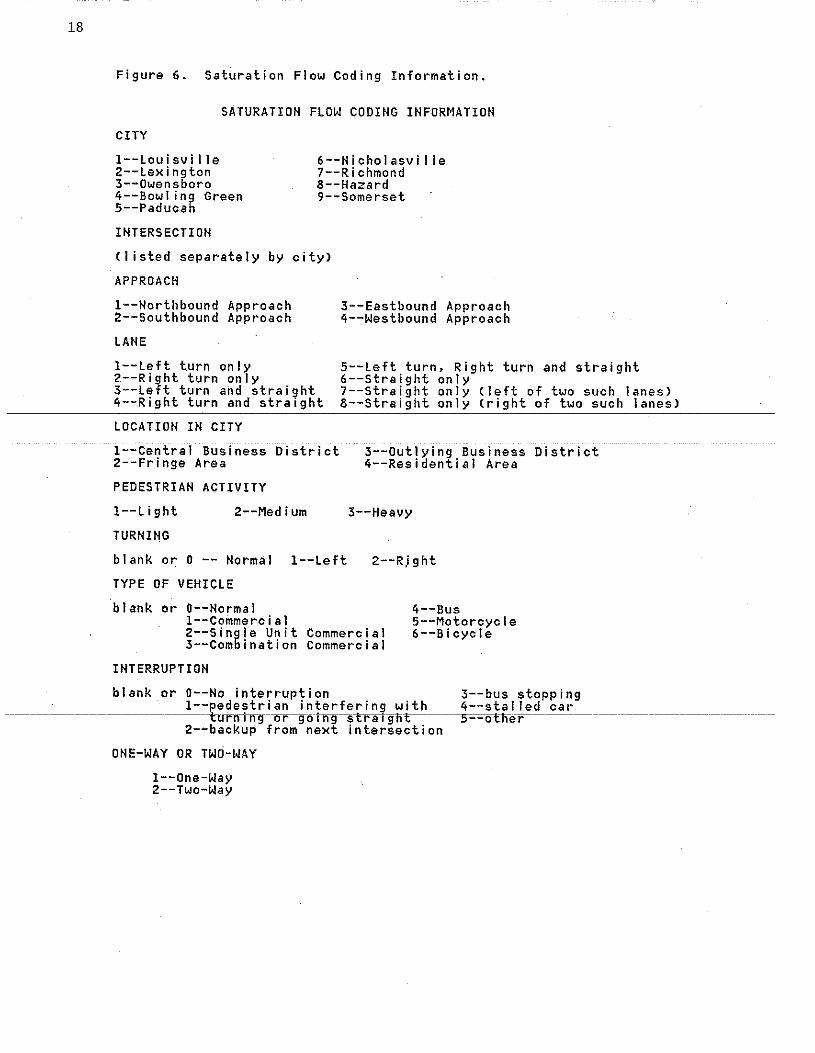
Data were transferred from data sheets to a computer file by entering at a remote terminal. The format used is shown in Figure 5. Explanations of various codes are given in Figure 6. All data for a particular lane were grouped and preceded by a header card that contained information concerning that intersection, approach, and lane. Inapplicable fields were left blank. The field for "headway" on the d--a La r e"C?Jf ds was uo t ente-re-d--, initially; a computer program was used to calculate headways and enter them in that field. The headway for a specific vehicle was calculated by taking the time recorded when that vehicle's rear wheels crossed the stop bar and subtracting the corresponding time for the preceding vehicle. For example, the headway for the tenth vehicle would be the time between the ninth and tenth vehicles. The headway for the first vehicle was the time between the onset of green and the rear wheels of that vehicle crossing the stop bar. Headways tend to be highest for the first vehicle in the queue, and decrease for succeeding vehicles unti I reaching a constant level. Saturation flow is calculated by dividing 3,600 by that constant headway. It is usually given in terms of vehicles per hour of green <vphgl.
For two situations, the headway field was left blank because of irregularities in traffic flow. One was when the first vehicle stopped beyond the stop bar. In that case, the headways for the first two vehicles were left blank. The other situation was when an interruption code was encountered. In that case, headways were left bla~k for the interrupted vehicle and the following vehicle.
Another program was written and executed that checked for various types of

errors in discovered which were analysis.
the data. This program several minor coding errors, corrected prior to subsequent
A summary program was written to allow the data to be summarized. That program was designed so that the data included in each summary could be I imited, based upon values of all important variables. The program also allowed each summary to be presented by various categories, with the categories defined as desired. A sample of output from that program is shown in Figure 7.
An earlier version of the program, having different output, was also used in the initial stage of analysis. A sample of output from this program is shown In Figure 8.
Analysis was performed by limiting values of a) I but one important var·jahJe.
allowing that variable to vary, and observing the effect of that variance on saturation flow. The analysis was a careful, step-by-step process, with results of each step affecting limitations applied to successive steps. Where necessary, assumptions were made and later verified. If assumptions were found to be invalid, certain steps of the analysis were repeated with necessary corrections. Additional data also were collected to fl II in gaps that became apparent during analysis. The data file contained a total of approximately 47,000 headways, of which approximately 32,000 were collected in Lexington.
3
became fairly constant. This goal was accomplished by obtaining a printout of average headway versus queue position.
For these summaries, data for which lane width was 10 to 15 feet and grade was from minus three to plus three percent were included. The first summary prepared was for through (non-turning) passenger cars in Louisville and Lexington. The results of that summary, presented In Figure 9, Indicated that headways became fairly constant after the first three vehicles, i.e., beginning with vehicle number four. Another summary, for through passenger cars in all other cities, generated the same conclusion. A third summary, for commercial vehicles in all cities, indicated the first four vehicles had higher headways, and saturation flow began with the fifth. Based upon those res' r I + s , an d can s i de r i n_g---t.h4-±------p..a-S--S--e-.Q_g-e-~ ---cars comprise the majority of most traffic streams, it was decided to define saturation flow as beginning with the fourth vehicle in the queue. All subsequent summaries used that definition.
LOCATION IN CITY AND PEDESTRIAN ACTIVITY
Each studied intersection was classified as being In a central business district CCBDl, fringe area, outlying business district, or residential area. This classification used the following definitions from the Highway Capacity Manual (2).
l. Central business district-- That portion of a municipality in which
-------I<E-stJt-;s-------------------t:~oe------aom 1 nan t 1 an~a~---u~sels-----r1ltense ----------
VEHICLE POSITION IN QUEUE
The first step In data analysis was to determine how average headway varied with vehicle position in the queue. Average headway should be highest for the first vehicle, decrease slightly for the next few vehicles, and then become fairly constant. This constant headway is used to calculate saturation flow. The purpose of this first step was to determine how many initial vehicles had to pass at the beginning of a green phase before headways
2.
3.
business activity. Fringe area -- That portion of a municipality immediately outside the central business district in which there is a wide range in type of business activity, generally including small commercial, I ight industrial, warehousing, automobile service activities, and intermediate strip development, as we II as some concentrated residential areas. Outlying business district -- That portion of a municipality or an

4
area within the influence of a municipality, normally separated geographically by some distance from the central business district and its fringe area, in which the principal land use is for business activity.
4. Residential area That portion of a municipality, or an area within the influence of a municipality, in which the dominant land use is residential development, but where smal I business areas may be included.
level of pedestrian activity was observed to be closely related to location in city. Each studied intersection was classified as having I ight, moderate, or heavy pedestrian activity. The pedestrian
--------<aHe>1t04iKIV i-t-y-----l'at--1~---wa s s" a j~ 'J e an d "~ the following guide! ines. Locations rated as having heavy pedestrian activity had fairly continuous pedestrian flows, with pedestrians crossing on every cycle and frequent interference with turning vehicles. These locations generally had
and left-turning passenger cars, lane widths from 10 to 15 feet, grades from minus three to plus three percent, speed I imits of 35 to 45 miles per hour <mphl, and approaches with no parking within 200 feet of the stop bar.
Results of the summary are presented in Table 1, which shows saturation flow for various combinations of location in city and level of pedestrian activity. Saturation flow was lowest for locations with heavy pedestrian activity and for locations in the CBD, although the single lowest value was for heavy pedestrian activity in fringe areas. There was I ittle difference between values for fringe areas, outlying business districts, and residential areas. There also was little difference between values for I ight and moderate pedestrian activity levels. Lee at i~ h 11 e avy---pe<f~-an---iHlt-i-11-i-ty-had saturation flow levels about four percent lower than other locations, as did locations in the CBD.
CITY SIZE
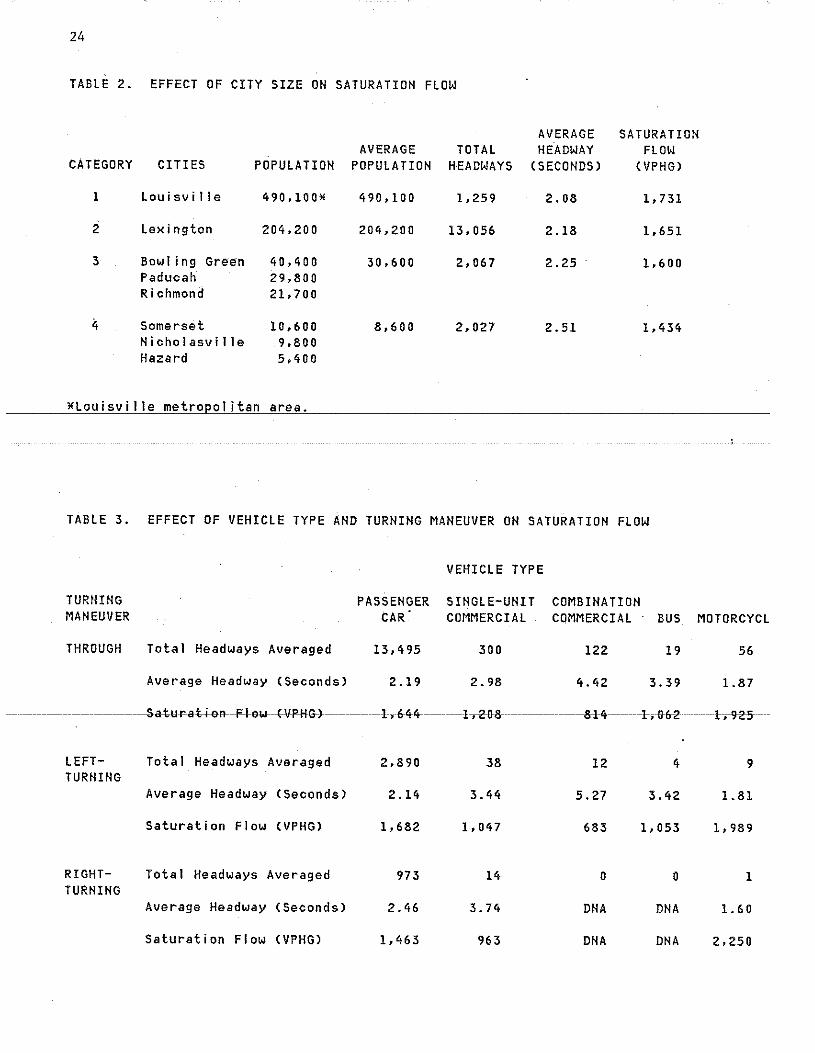
marked crosswalks and pedestrian signals. To determine effects of city size on Moderate pedestrian activity was saturation flow, the eight cities for characterized by less continuous flows, which data had been collected were with pedestrians crossing on some, but not classified into four categories based upon all, cycles, and interference with turning population. Populations of those cities, vehicles occuring less frequently. light the method ~f classification, and average pedestrian activity was coded for population for each category are shown in locations with few pedestrians, with most Table 2. Included in that summary were cycles going unused for pedestri~n lane widths of 10 to 15 feet, grades from crossing, and with rare or nonexistant minus three to plus three percent, and and interference with turning vehicles. speed I i~its of 35 to 45 mph. The summary
Data were not included in the was I imited to through and left-turning --------ana I y sis-TOr-any -ve liTcle-wnfc_fi_eii-co-unterea ____ passenge_r ___ car-s;--a n cr-aaTa ___ tal<en--Tii -Tfie
actual pedestrian interference. The central business district were excluded. purpose of this analysis was to determine Also excluded were locations with heavy the effect of the general level of pedestrian activity and approaches with pedestrian activity, exclusive of lost parking within 200 feet of the stop bar. time due to individual cases of Results of that summary are also interference. included in Table 2.. Saturation flow
Due to the strong relationship increased with increasing population, with between pedestrian activity'and location levels in louisville 21 percent higher in city, these two factors were combined than in the lowest population category. for analysis. To control for effects of For the top three population categories, other significant variables <which are the increase amounted to an eight percent discussed in following sections), the difference over a population range of summary excluded cities with populations 30,000 to 500,000. For the lowest under 20,000, and' included only through population category, saturation flow

levels decreased sharply, with a value 10 percent lower than for the next lowest category. Thus, it appears that for populations of about 20,000 to 500,000, population has a moderate effect on saturation flow. However, for populations under 20,000, saturation flow values decrease substantially. Unless otherwise noted, all following summaries excluded cities in the lowest population category,
VEHICLE TYPE AND TURNING MANEUVER
Saturation flow levels have been noted to vary significantly as a function of vehicle type and turning maneuver. Right- and left-turning vehicles were identified as such during data collection. All left turns observed were made during protected phases, so opposing traffic was not a factor. Vehicle types other than those included in the passenger car
5
Typically, some type of equivalency value has been used to compare vehicle types and turning maneuvers. "Through car equivalent" CTCEI values, by vehicle type and turning maneuver, are in Table 4. All categories were related to the through passenger car category. For passenger cars, left turns had I ittle effect, but right-turning passenger cars had a TCE value of 1.1. Combination commercial vehicles had the highest TCE values. One through combination commercial vehicle was equivalent to 2.0 through passenger cars. Turning combination commercial vehicles were equivalent to 2.4 through passenger cars. Through and left-turning motorcycles had the lowest TCE values, at about 0.8. Single-unit commercial trucks and ~uses had TCE values around 1.5.
GRADIENT
category Cwhich included pickup trucks and To determine effects of approach vansl were also noted on the data sheet. grade on saturation flow, computer A single-unit commercial vehicle was summaries which categorized the data by defined as any single-unit truck that had grade were prepared. Each of these more than four tires. A combination summaries included locations having lane commercial vehicle was defined as any widths from 10 to 15 feet and speed I imits regular combination truck or truck with a of 35 to 45 mph. Excluded were locations trailer. Data for this analysis were in a CBD or in a city having a population limited to locations with lane widths of under 20,000. Also excluded were 10 to 15 feet, gradas from minus three to locations with heavy pedestrian activity plus three percent, speed limits of 35 to or with parking on the approach within 200 45 mph, and no parking on the approach feet of the stop bar. The first summary within 200 feet of the stop bar. In was for through and left-turning passenger addition, locations with heavy pedestrian cars. Results are shown in Table 5. activity, locations in a CBD, and cities Increasing grade decreased saturation with populations under 20,000 were flow, although the top grade category excluded from the analysis. For right- (grade greater than three percent! did not t a r 11 i 11 9 ""trrc-t.,s-.--orrlv--tcn;atlo!'rs----..r~h-~s"h~o w-t.~he----exp e ctea------incre ase~:------ror-oTnef~------~ turning radii from 25 to 44 feet were categories, the magnitude of the effect included. was about a 1.1 percent decrease in
A summary of data collected, by saturation flow for every one percent vehicle type and turning maneuver, is in increase in grade. It is difficult to Table 3. Headways were lowest for through explain the results for grades greater vehicles and highest for right-turning than three percent, as they were vehicles. Combination commercial vehicles approximately equal to the results for had the highest average headways (lowest grades between one and three percent. It saturation flow levels! of any vehicle was expected that saturation flow would type. Values for single-unit commercial drop for higher grades. vehicles and buses were similar. A second summary, including only Motorcycles had the lowest average headway through commercial vehicles and buses, was (highest saturation flowl of the vehicle prepared. It was expected that grade types I isted. would have a more profound effect on those

6
vehicles than on passenger cars. Because of I imited data for thoese vehicles, this summary was combined into three grade categories. Results are shown in Table 5. Again, positive grades did not show the expected effect, although negative grades did increase saturation flow substantially.
To attempt to quantify the effect of steep positive grades, additional data were collected for a location with a positive grade of 6.5 percent. Results for this location were then compared to locations having similar characteristics but different grades. Only passenger cars were included. The resulting saturation flow was five percent lower for the steep grade than for flat grades.
LANE WIDTH
A summary of results of the lane width analysis is in Table 6. The summary excluded data taken in cities with populations under 20,000. Also excluded w~re locations in a CBD, locations with heavy pedestrian activity, and locations with parking on the approach within 200 feet of the stop bar. Included in the summary were approach grades of minus three to plus three percent and speed I imits of 35 to 45 mph. Only through and left-turning passenger cars were included.
The analysis indicated than lane width did not have an effect on saturation flow for lane width~ of 10 feet or more. For lane widths between nine and ten feet, a five percent reduction in saturation flow was found compared to lane widths of 10 or more feet. Ho lane widths below nine feet were observed. There was a slight unexplained reduction in saturation flow for lane widths greater than 15 feet. A similar analysis was performed with the limited data available for commercial vehicles, and no effect was found, even for lane widths below 10 feet.
TURHIHG RADIUS
Summaries were prepared, categorized by turning radius, to determine the effect of turning radius on right-turning vehicles . The summaries were I imited to
non-CBD locations in cities with populations of 20,000 or more having lane widths of 10 to 15 feet, grades from minus three to plus three percent, and speed I imits of 35 to 45 mph. Excluded from the summary were locations with heavy pedestrian activity or with parking on the approach within 200 feet of the stop bar. The initial summary was limited to right-turning passenger cars. Results of that summary are in Table 7. Locations having turning radii less than 25 feet had saturation flows approximately eight percent lower than locations having turning radii in the 25-to-44 foot range. Increasing the right-turning radius above 44 feet increased the saturation flow by about two percent.
Turning radius was expected to have a greater effect on large vehicles, such as
rue s and buses, tnan on passenger cars-.--Therefore, a second summary was prepared for right-turning commercial vehicles and buses. However, there were too few of those vehicles in the data to allow a meaningful analysis. Turning radii for left turns generally are sufficiently large so that they are not a factor. An exception is left turns from a one-way street onto another one-way street (from the left-most Janel, for which the radius may irdeed be a factor. For this case, the results for right turns could be applied to left turns as well.
PARKING
A summary was prepared to compare saturation flows ·for locations with and without parking. The objective was to determine whether parking on an approach affected the saturation flow level on that approach. Only parking on the right side of an approach was included, and parking had to be within 200 feet of the stop bar. Cities with populations under 20,000 were excluded, and only the right-most lane on each approach was considered as having parking when parking existed. Because of the I imited number of locations where parking was allowed, this summary was I imited to CBD locations having heavy pedestrian activity, grades from minus three to plus three percent, speed I imits

of 35 m'ph, and no parking on the left side of the approach. The summary included lane widths of 17 to 22 feet, which included the width used for parking. This is equivalent to lane widths of about 10 to 15 feet n·ot including the width used for parking. Only through passenger cars were included. Results of that summary indicated no effect due to parking, with an average headway of about 2.74 in each case.
Additional comparisons were made of locations which were simi Jar except that one had parking and the other did not. Two such comparisons were made, each comparing an approach having marked parking adjacent to an 11- to 13-foot lane with an approach having a similar lane width but no parking. Neither of these comparisons showed any effect of parking.
Apparently. for lane widths
considered here, it was possible to provide parking without interfering with traffic flow. If parking were located where it decreased the effective width of the adjacent lane to less than 10 feet, it should cause a decrease in saturation flow. However, sufficient data are not available to validate this assumption.
APPROACH WIDTH OR WIDTH OF ADJACENT LANE
Th~ effect of the approach width or,
7
pedestrian activity, and parking in order to I imit the effects of those factors.
An initial analysis was performed where the lane width was controlled to be from 10 to 15 feet. Saturation flow dropped slightly when the total approach width of two through lanes was below 22 feet. However, widths of the two individual lanes could not be estimated from that summary. A second analysis was conducted, as shown in Table 8, in which lane width was I imited to between 11.5 and 12.5 feet. That a! lowed the approximate width of the adjacent lane to be determined. The summary indicated that an adjacent lane width above 10 feet did not affect saturation flow for a traffic lane. Ho data were available for a 12-foot lane with an adjacent lane less than 10 feet wide. A search detected two locations with lane widths of ll and 13 feet tha~t __ _ had adjacent lanes between 9 and 10 feet wide. The average of 118 headways at those locations yielded an average headway of 2.22 seconds, which was not significantly above that ·observed for lanes with wide adjacent lanes.
This analysis indicated no substantial effect of approach width or, more specifically, width of an adjacent lane on the saturation flow level of a particular lane.
more specifically, the· width of an TYPE OF LANE adjacent lane on the saturation flow level of a particular lane was analyzed. In This segment of the analysis first this analysis, data at approaches having analyzed saturation flows on different two through lanes were summarized to types of through lanes. The summary determine whether width of the adjacent included non-CBD locations in cities with
------rarren<rd----.:m-errerrcm--sa-turrt-r-on--rloliraf----..------pu p u 1 a t i-urrs-uv-e-r-~e , IN i-t-h-1-an-e-~N-i-dt-h-s-------
through lane. In this report, a through of 10 to 15 feet, approach grades from lane is defined as any lane from which a minus three to plus three percent, and vehicle may proceed straight through the speed I imits of 35 to 45 mph. Heavy intersection, without turning. This may pedestrian flows were excluded, as were or may not be a through-only lane. The approaches with parking within 200 feet of width of the adjacent lane was not coded the stop bar. Only passenger cars were in the data, but had to be obtained included. Results of the summary for indirectly. This was achieved by I imiting through lanes are in Table 9. Saturation the summaries to locations with two flows were calculated for; single throughthrough lanes, restricting the lane width, only lanes Cthe only lane on an approach and allowing the total through width to which is strictly for through movements), vary. The data were controlled for the left and right of dual through-only vehicle type, turning maneuver, city size, lanes, and each lane of triple through-location in city, grade, speed I imit, only lanes. The single through-only lane

8
had the lowest saturation flow, followed by the right dual, left dual, right
TIME OF DAY (PEAK OR NON-PEAK HOURS>
triple, left triple, and middle triple. To determine the effect of time oi This suggests that saturation flow is day, or peak and non-peak traffic volumes,
affected by the amotint of "friction" a comparison was made of data collectec between adjacent lanes, with friction during loaded and non-loaded cycles. ~ depending on relative speeds and vehicle loaded cycle is one that is full> maneuvers. The single through-only lane utilized; that is, one for which the queue has the highest friction, since it is does not fully discharge during the green-adjacent to either turning lanes, plus-yellow phase. combination through and turning lanes, Factors noted to affect saturation opposing traffic, or the roadway edge. flow levels were control led. The analysi~ Friction is reduced by going to multiple excluded data collected in small cities, through-only lanes. the lowest friction in CBD's, or at locations having _heav> is for the middle of three through-only pedestrian activity. The analysis wa~ lanes. I imited to through and left-turning
A similar summary was prepared for passenger cars, lane widths between 10 and saturation flow in through-only lanes as a 15 feet, approach grades between plus function of number of through lanes. three and minus three percent, speed Number of through lanes means the number limits of 35 to 45 mph, and no parking on
-----<0>.1fe-.--<l-<all1n~ on t he a pp.r...o<~.c.h---f-r..cm----Wl1~-<>Jl~e-apfH"-s.a.c.h---w-i~-eet-<:>.f---...t.he-s-t.e~ through movements are allowed, including bar. combination through and turning lanes. Results are also in Table 9. These. results effectively demonstrate the increase in saturation flow in a through
It was thought that saturation flow levels might be higher during peak conditions (periods with loaded cycles). However, results in Table 10 show no major difference between saturation flow levels for loaded and non-loaded cycles. Loaded cycles had about a one percent higher saturation flow level when compared to non-loaded cycles.
only lane caused by providing additional through lanes. A four percent increase occured when one additional through lane was provided, while an eight percent increase resulted from providing two addition a I through I anes.
A summary was also prepared for single versus multiple left-turn lanes.
SPEED LIMIT
As shown in Table 9, the effect of A summary was prepared to determine multiple lanes for left turns was opposite the effect of approach speed I imit on that for through vehicles. Saturation saturation flow. Data were control led for flow for single left-turn lanes was higher city size, location in city, lane width, than for either of the dual left-turn grade, pedestrian activity, and parking.
----t-1 a"'ne s, wr-t-n-thel owe-n-oell\_g __ fortne---ren-----un-ry-t:n rou gnancf-Te-nc:-tu rn·rn-9---p-assen-ge!r of the duals. Saturation flow was five cars were included. Results of that percent lower on the left dual than on the summary are in Table 11. As speed I imit right dual, while average saturation flow increased, saturation flow also increased. per lane for duals was five percent lower However. the effect was relatively small, than for a single lane. This effect was amounting to approximately four percent not totally unexpected. Drivers are often over the range from 35 to 55 miles per uncomfortable with dual turning lanes. hour. This type of lane is fairly uncommon and drivers are sometimes unsure of the proper path to follow. That attitude would tend to increase headways and decrease saturation flow.
WEATHER OR ROAD SURFACE CONDITIONS
Data collected on one approach during a I ight rain when the pavement was wet were compared to data collected on the same approach during dry conditions. The

data were collected on a through-only lane, and only passenger cars were included in the analysis. During dry conditions, an average headway of 2.17 seconds was noted <representing almost 500
headwaysl. That compared wel 1 with the overal 1 average headway for through passenger cars (2.19 seconds). The average_ of approximately 300 headways collected during a 1 ight rain <wetpavement conditions) was 2.20 seconds. That represents a very slight increase (1.~ percent) in average headway, which would result in a corresponding slight decrease in saturation flow. The difference is too small to consider this a factor affecting saturation flow. Of course, a heavy rain, reducing visibi 1 ity, would be expected to reduce saturation flow levels, as would snow or ice. However, these are unusual conditions which generally would not be used in routine design procedure.
LIGHT CONDITIONS
To evaluate the effect of 1 ight conditions on saturation flow, data were collected at a selected location during both daylight and darkness. Only through' passenger cars were included. Average saturation flow levels observed were 1,659
vphg during daylight and 1,558 vphg during darkness. This represents a six-percent difference. The reduction indicates there is some alteration of driver behavior due to 1 ight conditions, with slightly lower saturation flow levels during darkness.
While this is an interesting ----p·henonre-n-orr,------i-t------m-ay 11 o t have 811)1
significant bearing on intersection design. It would be important if an intersection was expected to handle peak volumes of traffic during darkness.
RECOMMENDATIONS
Results from data analyses identified several factors that significantly influenced saturation flow. To determine an accurate saturation flow value for a specific intersection, approach, and lane, appropriate adjustment factors can be
9
applied to a "base" saturation flow value. The "base" value applies to passenger cars proceeding straight through an intersection under generally typical conditions. That value, on a per-lane basis, was shown to be 1,650 vehicles per hour of green Cvphgl.
The following formula is recommended for use in estimating an appropriate saturation flow value for a specific lane on an approach to an intersection:
S = SbCFlplCFcl(Fvtl<Fgl<Fwl<Frl<Ftl <FsHFdl
in which S = saturation flow for a specific intersection approach lane <vehicles per hour of green <vphgll
Sb = base saturation flow value (1,650 vphgl,
Flp = adjustment factor for location in city and le~el of pedestrian activity,
Fe = adjustment factor for city population,
Fvt = adjustment factor for vehicle type and turning maneuver,
Fg = adjustment factor for gradient,
Fw = adjustment factor for width of lane,
Fr = adjustment factor for turning radius for right-turning vehicles,
Ft = adjustment factor for type of lane
------jf's--=---a-<H-u s tm e A t f a G t 9-1'---f<>-1'----
speed I imit, and Fd = adjustment factor for
1 ight conditions.
Following recommended appropriate
is a discussion of the methods for determining
adjustment factors.
Flp <adjustment factor for location in city and level of pedestrian activity)
Flp = 0.96 for locations with heavy pedestrian

10
activity. Flp = 0.97 for CBD locations with
light or moderate pedestrian activity.
Flp = 1.00 for all other locations.
Fe (adjustment factor for city population> Fe = 0.87 for population under
10,000. Fe = 0.92 for population of
10,000 to 19,999. Fe = 0.97 for population of
20,000 to 99,999. Fe = 1. 00 for population of
100,000 to 249,999. Fe = 1.05 for population of
250,000 to 500,000.
Fvt·cadjustment factor for vehicle type and turning maneuver>
Fvt = 100/CCP1lCT1l + CP2l(T2l+ ••• +CP10HT10ll
in which P1 through P10 are the percentages of different vehicle types in the anticipated or actual traffic stream for the lane being considered and T1 through T10 are the corresponding "through cdr equivalents" for these vehicle types. P1 through P10 must total to 100 percent.
P1: throug~ passenger cars, Tl = 1.00
P2: left-turning passenger cars, T2 = 0.98
P 3 : 1 i g li t t urn+nrP<r!>serrgFrcars, T3 = 1.12
P4: through single-unit commercial vehicles, T4=1.36
P5: left-turning single-unit commercial vehicles, T5=1.57
P6: right-turning single-unit commercial vehicles, T6=1.71
P7: through combination commercial vehicles, T7=2.02
pg: turning combination commercial vehicles, T8=2.41
P9: all buses, T9=1.55 PlO: all motorcycles, T10=0.85
Fg (adjustment factor for approach gradient>
Fg = 1 - 1.1CGrade/100) for downhi II approach.
Fg = 1 - 0.5{Grade/100l for uph iII approach.
CNote: Enter grade in percent, negative for downhill approach>.
Fw (adjustment factor for width of Janel Fw = 0.95 for lane width of
9.0 to 9.9 feet. Fw 1.00 for lane widths of
10 or more feet.
Fr (adjustment for turning radius.
l't
Equation given is for effect on right-turning vehicles. For left +urns from one o~~eet to another, switch the terms "right-turning" and "left-turning" in the equation.)
in
Fr = (percent through and left-turning vehiclesl/100 + FrdCpercent right-turning vehiclesl/100
which Frd = 0.93 for turning radius less than 25 feet.
Frd = 1. 00 for turning radius of 25 to 44 feet.
Frd = 1. 03 for turning radius of 45 or more feet.
c-mtiurtJmmt·-tartor-ror-cyp-e--o·r--ran-e-r---Ft = 1.02 for a single
left-tur.n-only lane. Ft = 0.95 for left of dual
I eft-turn-on I y lanes. Ft = 1.10 for a through-only
lane with through I anel on both sides.
Ft = 1. 05 for left or right of triple through-only lanes.
Ft = 0.96 for through lane that is the only through lane on approach.
Ft = 1. 00 for a II other lane
types.
Fs (adjustment for speed 1 imi tl Fs = l. 03 for speed 1 imi t above
45 mph. Fs = l. 00 for speed 1 i mit of
45 mph or less.
Fd (adjustment for darkness) Fd = 0.94 for locations where
peak volumes are expected to occur during darkness.
Fd = 1.00 for all other locations.
While this equation formidable at first, it is use. This is illustrated
may appear quite easy to
in Appendix B, __ w_h_Lcb examines case studies and compares
11
measured and predicted saturation flows.
IMPLEMENT A TIOH The methodology developed in this
study will allow the determination of saturation flow values representative of conditions at a given intersection. These saturation flow values provide basic input needed in the calculation of intersection capacity. This type of information is also needed as input when using computer models which simulate and optimize signal systems. Accurate saturation flow values are necessary in order to properly uti 1 ize these computer models. For example, portions of the data collected in this study were used as input into the TRAHSYT, HETSIM, and SIGOP computer simulation models when they were used to simulate traffic flow in Lexington. Kentucky.

12

13
;ure l. Variation of Discharge Rate of a Queue with Time.
"' t.:l ~ < ~ u "' Q SATURATION ~ 0
FLOW
"' 1-< < ~
v \ TIME --
GREEN AMBER RED
14
Figure 2. Saturation Flow Approach Data Sheet.
City Name ---------------
SATURATION FLOW APPROACH DATA SHEET
Street Name
Approach Dir.
Cross-Street Name-----------
Approach (+ or -> Grade
One-way or two way Speed I imit -------------------
Location: CCBD, Fringe, OBD, Res.) Ped. Act.: CL, M, Hl
Distance back to nearest parking on approach, measured from stop bar:
Right side Left side Cl way street only)
Lane information Cleft to right, each Janel
Number Type
1
2
3
4
Width Turning
Gutter Radius
Total number of lanes on approach ___ _
Total width
Distance (Stop bar to Intersection)
----------- -----------5K ET G II

Date -Street -Conments•--~~~~~~~~~~~~-
1 2 3
I SATURATION FLOH DATA SHEET
CroLs-Street - App oach -Time _I City - l
Y- f If fixed time- G- -----1~~ I
! 4 I
Cycle Humber 5 6 7
n T d T d 1" d r d 1" d 1" d T I d 1 ----z ----3 ----4 ----5 ----6 ----7 ----8 ----9 ----
10 ----11 ----12 ----13 ----14 ----15 ----16 ----17 ----18 ----19 ----20 ----21 ----22 ----23 ----24 ----25 ----
----L G + y
-+-== -+----+---+-----r--~--
--+- --
+ +== --r----r----r----r--=t=== -+-- == --T---,----+- -----~'-- ~--- ~
c Lane---~~~
8 9 1 t d T d 1"
'"rj ..... OQ
" " (1)
w
(J)
"' rt
" " "' rt ..... 0 ::> '"rj >-'
~
"' "' rt
"' (J)
::r' (1) (1) rt
>-' Ln

16
Figure 4. Saturation Flow Data Collection Coding.
SATURATION FLOW DATA COLLECTION CODING
Lane Type Code
1--Left Turn Only 2--Right Turn Only 3--Left Turn and Straight 4--Right Turn and Straight
N--Vehicle Number in Queue
5--Left Turn, Right Turn, and Straight 6--Straight Only COne Lane> 7--straight Only Cleft of Two Such Lanes> a--Straight Only CRight of Two Such Lanes>
T--Time from Start of Green to Screen Line CRear Axle over Stop Bar>
D--Description
TURNING
L--Left Turn R--Right Turn
TYPE
B--Bus M--~totorcyc I e S--Single Unit Truck C--Combination Truck !--Bicycle
L--Check If Cycle is Loaded
INTERRUPTION
P--Pedestrian T--Bus Stepping V--Stalled Vehicle N--Back from Next Intersection 0--0ther (Specify)
G--Green Time (Seconds> (If fixed time, note1
in comments>
Y--Yellow Time (Seconds>
C--Cycle Length CSecondsl

Figure 5. Saturation Flow Data Format.
HEADER RECORD
COLUMN VARIABLE NAME
1 CITY 2-3 IHT 4 APP 5 LANE 6 7 LOC 8-ll WAPP 12-15 WTHRU 16-19 WLANE 20-22 WGUTTER 23 24 HLAHES 25 HTHRU 26-29 GRADE 30 OHETWO 31-32 SPEED 33 PED 34 35-37 PARKR
COMMENTS
City Code Intersection Code Approach Code Lane Code
Location in Urban Area Code Width of Aproach CFeetiCe.g. 25.01 Width of Through Lanes Width of Lane Width of Gutter (if appl icablel
Humber of Lanes Number of Through Lanes Grade in Percent (e.g. +1.51 One-way or Two-way Street Code Speed Limit CMPHI Pedestrian Activity Code
17
38-40 PARKL ----~4Hl~-~4~2--------~T·URURAD
43-44 DISTB
Distance to Parking CFtiCRight Sidel Distance to Parking CFtiCLeft Sidel T~~~~4~~~~~~~~~~--------------------Distance from Stop Bar to Intersection
45 46-50 CYCLE 51-53 YELLOW
Cycle length (sec) (if fixed) (to 0.1 sec) Yellow Time in Seconds Cto 0.1 secl
60 HEADER Header Card Flag <Code 11
DATA RECORD
1 2-3 4 5 6-7 8 9-10 11-15 16 17 18 19 20 21 22 23
... ------~4-
25-28
29 30-33 34 35
36 37.
CITY IHT APP LANE CYCLE
VNUM TIME
VTURN VTYPE IHTCODE
LAST LOADED LASTC
City Code Intersection Code Approach Code lane Code Cycle Humber
Vehicle Humber in Queue Time from Start of Green
Turning Code Type of Vehicle Interruption Code
Last Car of Cycle FlagCO-no; 1-yesl Loaded Cycle Flag Cl-yesl Last Cycle for This Lane Flag (1-yesl
----
GYPT
HEADWAY
WET
DARK
Green plus Yellow in Csecl Cif loaded cycle I
Headway in Seconds <to 0.1 secl
Wet Surface Flag Cl-yesiCfirst vehicle in cycle I
Darkness Flag Cl-yesl(first vehicle in cycle>
18
Figure 6. Saturation Flow Coding Information.
SATURATION FLOW CODING INFORMATION
CITY
!--Louisville 2--Lexington 3--0wensboro 4--Bowling Green 5--Paducah
6--Nicholasville 7--Richmond 8--Hazard 9--Somerset
INTERSECTION
Cl isted separately by city)
APPROACH
!--Northbound Approach 2--Southbound Approach
LANE
1--Left turn only 2--Right turn only 3--Left turn and straight 4--Right turn and straight
LOCATION IN CITY
!--Central Business District 2--Fringe Area
PEDESTRIAN ACTIVITY
1--Light
TURNING
2--Medium
3--Eastbound Approach 4--Westbound Approach
5--Left turn, Right turn and straight 6--Straight only 7--Straight only Cleft of two such lanes> a--Straight only (right of two such lanes>
3--0utlying Business District 4--Residential Area
3--Heavy
blank or 0 -- Normal 1--Left 2--R.i g ht
TYPE OF VEHICLE
blank or a--Normal !--Commercial 2--Single Unit Commercial 3--Combination Commercial
INTERRUPTION
4--Bus 5--Motorcycle 6--Bicycle
blank or 0--No interruption 3--bus stopping !--pedestrian interfering with 4--stalled car -----------------------------turn--rng--o r -gcrilrgs-naTgllt-------s=otlH!r __________________________ _ 2--backup from next intersection
ONE-WAY OR TWO-WAY
l--One-Way 2--Two-Way

Figure 7. Sample of Summary Program Output.
SATURATION FLOW DATA ANALYSIS
ALL CITIES URBAN LOCATIONS INCLUDED = 2 3 4 LANE WIDTHS INCLUDED = 10.0 - 15.0 GRADES INCLUDED = -3.0 - 3.0 SPEED LIMITS INCLUDED = 35 - 45 PEDESTRIAN ACTIVITY CODES INCLUDED = 1 2 RIGHT PARKING DISTANCES INCLUDED = 0 - 0 LEFT PARKING DISTANCES INCLUDED = 0 - 0 VEHICLE TURNING CODES INCLUDED = 0 1 VEHICLE TYPES .INCLUDED = 0 0 0 0 INTERRUPTION CODES INCLUDED = 0
DESCR. OF CATEGORIES: !=LOUISVILLE 2=L EX!NGTON 3=BOW GR,PADUCAH,RICMMOND 4=NICH,HAZARD,SOMERSET S=OTHER 6= 7=
CATEGORY=! AVG HDWYS FOR VHUM=l,2,3,ETC.=2.84 2.50 2.31 AVG HDWY FOR VNUM>3 IS 2.08 AVG LOST TIME=l.43 TOTAL HDWYS AVERAGED= 1259
CATEGORY=2 AVG HDWYS FOR VNUM=l,2,3,ETC.=2.82 2.52 2.41 AVG HDWY FOR VNUM>3 IS 2.18 AVG LOST TIME=l.21 TOTAL HDWYS AVERAGED=l3056
CATEGORY=3 AVG HDWYS FOR VNUM=l,2,3,ETC.= 3.26 2.72 2.58 AVG HDWY FOR VNUM>3 IS 2.25 AVG LOST TIME= 1.74 TOTAL HDWYS AVERAGED= 2067
19
CATEGORY=4 AVG HDWYS FOR VNUM=l,2,3,ETC.= 2.76 2.52 2.54 --------A-IJG-+HJW¥-HH~-\m~I&-~~l---i\\/4--lo9~H--T-H4E=-l-.-~ ---------------------------------------- -----------------------
TOTAL HDWYS AVERAGED= 2027
CATEGORY=5 NO DATA PROCESSED.
CATEGORY=~ NO DATA PROCESSED.
CATEGORY=7 NO DATA PROCESSED.

20
Figure 8. Sample Output of Summary Program Variation.
SATURATION FLOW DATA ANALYSIS
CITIES INCLUDED = l 2 0 0 LANE WIDTHS INCLUDED = 10.0 - 15.0 GRADES INCLUDED - -3.0 - 3.0 VEHICLE TURNING CODES INCLUDED = 0 0 VEHICLE TYPES INCLUDED = 0 0 0 INTERRUPTION CODES INCLUDED = 0
VNUM 1 2 3 4 5 6 7 8 9
10 11 12 13
AVG HDWY 2.9 2.6 2.4 2.3 2.3 2.2 2.2 2.1 2.2 2.1 2.2 2.2 2.2
NUMBER OF VALUES AVERAGED
1648 1581 1586 1583 1493 1401 1307 1192 1104
987 891 779 667
15 2.1 478 16 2.1 396 17 2.1 327 18 2.1 283 19 2.2 225 20 2.1 175 21 2.1 137 22 2 .• 2 103 23 2.2 79 24 2.1 49 25 2.3 32 26 2.6 7 27 1.4 1 28 0. 0 0 29 0.0 0 30 0.0 0 31 0.0 0 32 0. 0 0 33 0.0 0 34 0. 0 0 35 0.0 0 36 0.0 0 37 0.0 0 38 0. 0 0
-------3-9------ --G-.-9-------------- ----------a-AVERAGE HEADWAY WHEN VNUM > 4 = 2.2 TOTAL NUMBER OF: INTERSECTIONS: APPROACHES LANES
45 71 99
HEADWAYS TOTAL NUMBER OF END LOST TIME AVERAGE TIME= 1.5
= 19080
NUMBER OF VALUES AVERAGED = 251

5.0
4.6
42
3.8
~ z 0 ~3.4 ~ > < ~ < "' 3.0
"' (.:) < ~
"' ;> < 2.6
22
1.8
THROUGH COMMERCIPjL VEHICLES (ALL CITIES)
fASSENGER CARS (OTHER CITIES) I
'---J.._THROUGH PASSENGER CARS (LEXINGTON ANp LOUISVILLE)
II 13 VEHICLE POSITION IN OUEUE
3 5 IS! 17 19 21 23
., ~-;;:
"' > < ~ ~
"" ~ if " p..
" " '<
~ i'! ~
-;;. ,. ;;·
" ;]'
=-· a· " s· 0 " ~ " ~
N f-'

22

23
TABLE l. EFFECT OF LOCATION IN CITY AHD LEVEL OF PEDESTRIAN ACTIVITY ON SATURATION FLOW
LEVEL OF PEDESTRIAN ACTIVITY
LIGHT MODERATE HEAVY All lEVELS LOCATION IN CITY
Central Business Number of Headways District Averaged 0 22 1.173 1.195
Average Headway CsecondsJ DNA 2.25 2.26 2.26
Saturation Flow Cvphgl* DNA 1,600 1.-5 93 1,593
Fringe Area Number of Headways Averaged 1. 96 7 2,741 569 5,277
Average Headway e.conds) 2 22 2 20 2 32 2 22
Saturation Flow Cvphgl* 1.622 1,636 1,552 1.621
Outlying Business Number of Headways District Averaged 9,859 888 0 10.747
Average Headway CsecondsJ 2.16 2.18 DNA 2.16
Saturation Flow (vphgl* 1,667 1. 651 DNA 1,665
Residential Area Number of Headways Averaged 927 0 0 927
Average Headway (seconds) 2.21 DNA DNA 2.21
Saturation Flow (vphgl* 1.629 DNA DNA 1.629
- -------------------------------
All AREA Number of Headways Averaged 12.753 3,651 1.742 18,146
Average Headway (seconds) 2.17 2.20 2.28 2.19
Saturation Flow (Vphgl* 1. 657 1. 640 1.579 1,646
* Vehicles (per lanel per hour of green.
24
TABLE 2. EFFECT OF CITY SIZE ON SATURATION FLOW
AVERAGE SATURATION AVERAGE TOTAL HEADWAY FLOW
CATEGORY CITIES POPULATION POPULATION HEADWAYS CSECONDSl CVPHGl
1 Louisvi lie 490,100* 490,100 1,259 2. 08 1,731
2 Lexington 204,200 204,200 13,056 2.18 1,651
3 Bowling Green 40,400 30,600 2,067 2.25 1,600 Paducah 29,800 Richmond 21,700
4 Somerset 10,600 8,600 2,027 2.51 1,434 Nicholasvi lie 9,800 Hazard 5,400
*Louisville metropo I i tan area.
TABLE 3. EFFECT OF VEHICLE TYPE AND TURNING MANEUVER ON SATURATION FLOW
VEHICLE TYPE
TURIHNG MANEUVER
PASSENGER CAR
SINGLE-UNIT COMMERCIAL
COMBINATION COMMERCIAL BUS_ MOTORCYCL
THROUGH Total Headways Averaged 13,495 300 122 19 56
Average Headway CSecondsl 2.19 2.98 4.42 3.39 1.87
--------------------------Sa-tu-F'at-~en--F-~ew---(-V-f>l+G-}-------------h~44---------h-c08- -------------8-l-4--------b{)-6-2 ----------];--,')25-
LEFT- Total Headways Averaged 2,890 38 12 4 9 TURNING
Average Headway CSecondsl 2.14 3.44 5.27 3.42 1.81
Saturation Flow CVPHGl 1,682 1,047 683 1,053 1' 989
RIGHT- Total Headways Averaged 973 14 0 0 l TURNING
Average Headway <Seconds) 2.46 3.74 DNA DNA 1. 60
Saturation Flow CVPHGJ 1,463 963 DNA DNA 2,250

TABLE 4. THROUGH CAR EQUIVALENTS <TCE) BY VEHICLE TYPE AND TURNING MANEUVER
(THROUGH-CAR EQUIVALENTS <TCE)
VEHICLE TYPE THROUGH LEFT-TURNING RIGHT-TURNING
Passenger Car 1.0 1.0 l.l
Single-Unit Commercial 1.4 1.6 1.7
Combination Commercial 2.0 2.4 2.4*
Bus 1.6 1.6 l. 7*
Motorcycle 0.9 0.8 1. 0*
* Because of insufficient data, tnis value is an estimate. An analysis in which some of thj data I imitations were omitted was used to obtain these estimates.
TABLE 5. EFFECT OF GRADIENT ON SATURATION FLOW
GRADE· <PERCENT>
Less than -3
-3 to -1.1
-1 to +1
+1.1 to +3
Greater than +3
TOTAL HEADWAYS
1.481
4,154
10,763
1,465
798
PASSENGER CARS
AVERAGE HEADWAY
<SECONDS)
2.09
2.12
2.19
2.23
2.22
SATURATION FLOW
<VPHG)
1. 719
l. 6 98
1.644
1.614
1,622
COMMERCIAL VEHICLES AND BUSES
Less than -1 88 3.10 1.160
-1 to +1 361 3.48 l. 034
Greater than +1 51 3.48 1,035
25

26
TABLE 6. EFFECT OF LANE WIDTH ON SATURATION FLOW
AVERAGE SATURATION LANE WIDTH TOTAL HEADWAY FLOW
(FEET l HEADl4AYS <SECONDS) <VPHGl
9 - 9.9 858 2.29 1,572
10 - 10.9 2,839 2.16 1, 667
11 - 12.9 11,089 2.18 1,651
13 - 14.9 2,454 2.18 1,651
15 or More 680 2.21 1,629
10 - 14.9 16,382 2.18 1,654
10 or ~lore 17,062 2.18 1,653
TABL~ 7. EFFECT OF TURNING RADIUS ON SATURATION FLOW OF RIGHT-TURNING PASSENGER CARS
RADIUS ( FEETl
Less than 25
25 to 44
45 or more
TOTAL HEADWAYS
321
973
180
AVERA.GE HEADWAY
(SECONDS)
2.66
2.46
2.40
SATURATION FLOW
(VPHGl
1,354
1,465
1,500

TABLE 8. EFFECT OF APPROACH WIDTH (SPECIFICALLY, THE WIDTH OF· AN ADJACENT LANEJ ON SATURATION FLOW
LANE WIDTH 11.5-12.5 FEET
APPROXIMATE WIDTH OF TWO AVERAGE SATURATION WIDTH OF THROUGH LANES TOTAL HEADWAY Flat~ ADJACENT LANE
( FEETl HEADWAYS (SECONDS) (VPHGl (FEET l
20 - 21.9 0 * * 8-10
22 - 23.9 2,722 2.15 1,674 10-12
24 - 25.9 2,784 2.23 1,614 12-14
26 - 27.9 765 2.22 1,622 14-16
28 or More 0 * * 16 or More
*No data available in this category. However, data for two through lanes 11 and 13 feet wide, respectively, with an adjacent lane between 9 and 10 feet wide were summarized. The average of 118 headways was 2.22 seconds, for a saturation flow level of 1,622 vphg.
TABLE 9. EFFECT OF TYPE OF LANE ON SATURATION FLOW
TYPE OF LANE TOTAL
HEADWAYS
AVERAGE HEADWAY
(SECONDS)
SATURATION FLOW
(VPHGJ
Through-Only (Only One on Approach) 2,785 2.21 1,629 Left of Two Through-Only Lanes 1,873 2.17 1,659
27
·· ····Jhg-ht--o+--"Fwo-rh-ro-t:tgh-en+y--t:-a~s-------------3-.,--7-58--- -----------c-~1-9--- --------h-6-44---------------- ----------------Left of Three Through-Only lanes 224 2.05 1,756 Middle of Three Throuth-Only lanes 234 1.98 1,818 Right of Three Through-Only Lanes 222 2.10 1,714
One Through Lane on Approach* 146 2.28 1,579 Two Through Lanes on Approach* 7' 97 9 2.19 1,644 Three Through Lanes on Approach* 971 2.12 1 '6 98
Single left-Turn-Only lanes 1,995 2.09 1,722 left of Two left-Turn-Only lanes 149 2.26 1,593
Right of Two Left-Turn-Only lanes 406 2.14 1,682
* Data are for through-only lanes.

28
TABLE 10. EFFECT OF LO~DED CYCLES ON SATURATION FLOW
Loaded Cycles
Non-Loaded Cycles
TOTAL HEADWAYS
4, 375
18,057
AVERAGE HEADWAY
(SECONDS)
2.16
2.18
SATURATION FLOW
CVPHGl
1,667
1,651
TABLE 11. EFFECT OF SPEED LIMIT ON SATURATION FLOW
SPEED AVERAGE SATURATION LIMIT TOTAL HEADWAY FLOW CMPHl HEADWAYS CSECONDSl CVPHGl
35 4,614 2.19 1,644
40 1,042 2.15 1,674
45 10,726 2.17 1,659
50 489 2.13 1,690
55 391 2.11 1,706
29
APPENDIX A
RESULTS OF LITERATURE REVIEW

30

MEASUREMENT OF SATURATION FLOW period, excluding the five-second interval,
31
initial by the
Measurement of saturation flow average saturation period minus involves measuring times from the five seconds. beginning of the green phase until certain 2. In a Road Research Laboratory vehicles cross a reference line or method, a stopwatch is started screen! ine. A basic question concerns when the signal changes to green, what screen! ine to use. In one paper, and the numbers of vehicles four alternate screen! ines for measuring crossing the stop bar in regular queue discharge headways at signals were time intervals <such as five compared (3). Screenline positions were seconds) are recorded until the the following: end of the green. Duration of
1. the stopped front wheels of the green and time at which first vehicle, saturation flow ceased are_noted
2. the stop I ine, (5J. 3. the crosswalk I ine <either the 3. A method of obtaining small
upstream or downstream I ineJ, and samples of accurate data used a 4. the entry to the intersection. pen recorder to record times <to
For the first three alternate screen! ines, the nearest 0.1 secJ at which the time could be recorded when either the vehicles crossed a tape switch front or rear whee Is crossed the pI aced across the roadway (5J . ____ _
~~
screen! ine. For the fourth alternative, 4. One procedure involved starting a the time would be recorded when the front stopwatch as the rear wheels of of the vehicle reached the intersection. the first vehicle crossed the Use of the fourth screen! ine was stop bar and stopping it as the recommended. Although all of these last vehicle in the platoon positions have been used in various crossed the stop bar with its studies, the most common screen! ine rear wheels (7J. The elapsed position is the stop line <stop barJ. time was divided by the number of
Equipment used to collect data has vehicles, less one, to determine varied. The most common procedure average headway. Dividing 3,600 involved using a stopwatch. Other devices by the average headway <in used include movie cameras (4), tape seconds) yields saturation flow recorders C5J, chart recorders (3), or <in vehicles per hour of greenJ. automatic recorders (5J. An automatic 5. In another procedure, a stopwatch recorder may be coupled to a detector for was started as the third each lane and to a light sensitive vehicle's rear bumper cleared the resistance in front of the green signal stop bar and stopped as the rear that records the start and finish of bumper of the last vehicle in the phass.ee.ss~-----------------------<f'!lllle&Yl!e-e---l'r'e-a-Gl>e-<1-t-Re---s-t-e-p--b-a r. T 11-a-t------
Several methods have been used to time, divided by the number of record and analyze datd. Following is a vehicles minus three, provided sample of procedures that have been used. the average headway.
1. A method presented in a 1979 6. Only cycles having 10 or more report from Australia uses the seconds of saturation flow were number of vehicles departing from counted in one procedure C8J. the queue after the first five One second was subtracted per seconds and the saturation period phase from the total time to (period until the queue is account for the time lost in cleared) to calculate saturation starting-up less the reaction flow C6J. Saturation flow for time of the observer having the several cycles is calculated by stopwatch. dividing the average number of 7. The time required, after the departures during the saturation signal turned green, for a

32
certain number of vehicles to cross the stop bar has also been used to calculate saturation flow (9, 10) .
8. Cameras have been used to obtain the headway of each vehicle.
Saturation flow is generally measured in units of vehicles Cper Janel per hour of green Cvphgl. Typical base values before adjustment are in the range of 1,500 to 1,700 vphg.
ADJUSTMENT FACTORS FOR SATURATION FLOW Several factors have been observed to
affect saturation flow. Following is a summary of factors found to affect saturation flow and methods used by various researchers to make appropriate adjustments.
Vehicle Position ln Queue (Queue length) Queue discharge headway is generally considered constant for all vehicles after some initial start-up delay that typically involves the first three to six vehicles. However, some data suggest that headways might again increase after a certain length of green time. One study concluded that maximum effectiveness can be achieved with green intervals of about 40 seconds Clll.
poor (1). Saturation flow was multi pi ied by 1. 2 when the site was designated as good and 0.85 if poor. Interpo I at ion between categories was done.
£l1y Size -- The Highway Capacity Manual contained the only adjustment factor found for city size (2). Population of metropolitan area was combined with peak-hour factor to yield an adjustment factor. The area populations given ranged from 75,000 to one million.
An Austral ian study concluded there was no evidence of a relationship between saturation flow and city size (5). Slight adjustments for saturation flow were I isted for several cities in which data were collected, but those adjustments were not related to city population.
A Canadian study indicated that saturation flows were dependent on the size of a community only when local traffic behavior was reflected C12l. local traffic behavior was concluded to be associated with other community characteristics that were not necessarily reflected in the population size.
Veh i·c I e l..l!E!t and Turning Maneuver Right-turning and left-turning vehicles have been observed to decrease saturation flow. Factors have been developed to convert turning v~hicles into an
location in City -- The 1965 Highway equivaLent number· of through vehicles. Capacity Manual listed adjustments based Those adjustments varied by type of on four area locations (2): central vehicle. In many instances, both turning business district CCBDJ, fringe area, maneuver and vehicle type were used to
_outlying business district, and determine the number of •through car residential area. Capacities Cwhich are units". Therefore, those factors were
~~~-------------chre-ct-1-y-re I a led to sa lui at-t-on-f-J-crns->--..,..re-----mms-t<llrrl'd Loge lher--tn--ttr<s--rep~rt-;-- -~--~
higheat in residential areas and lowest in Australian studies found that a left-the CBD. turning car Cthe same as a right-turn in
An Austral ian report I isted the United States> was equivalent to 1.25 saturation flows for three environmental through cars (5, 6>. The through-car classes based on location of the equivalent for a turning commercial intersection (6). The highest values were vehicle was 2.5. A commercial or heavy typically for residential areas, followed vehicle was defined as any vehicle having by industrial or shopping areas, and the more than two axles or having dual tires lowest values were in the "city centre" on the rear axle. One through commercial area. Another Australian report used four vehicle was found to be equivalent to two categories very similar to those in the through cars. For unopposed right or left Highway Capacity Manual CSl. turns having a large radius of curvature,
In a report from England, sites were a through-car equivalent of 1.0 was used classified as either good, average, or (6).

Unopposed left turns were converted to passenger-car equivalents CPCE'sl in another report <13). The PCE for unopposed left turns was 1.2 for left turns made from left-through lanes and 1.05 from left-turn-only lanes. For opposed left turns, the PCE increased to 6.0 for an opposing volume of over 1,000 vehicles per hour. The passenger-car equivalents for right turns varied from 1.0 for light pedestrian activity to 2.0 for extremely heavy pedestrian activity. The recommended PCE value for trucks and through buses was 2.0. A truck was defined as a vehicle having six or more tires. A PCE value of 5.0 was recommended for each local bus <a local bus was one that made a scheduled stop at the intersection>.
In another report, the average equivalents recommended for opposed left turns, using signal phases and opposing flow as input, were 2.9 for cars and 3.9 for trucks <14).
For unopposed right-turning vehicles <left turn in the U.S.> with exclusive lanes, Webster observed saturation flow to be related to the radius of curvature <r> measured in feet (1 >. For sing I e I anes, saturation flow was given as 1,800/(1 + 5Cr». For dual lanes, total saturation flow was given as 3,000/(1 + 5Crll. Webster converted several vehicle types to passenger car unit Cpcu> equivalents. The pcu equivalent was 1.75 for a heavy vehicle, 2.25 for a bus, 1.0 for a I ightgoods vehicle, 0.33 for a motorcycle, and 0.20 for a bicycle; For unopposed right turns Cleft in the U.S.> with no separate
---+an e , these-p c u e q u-hta-1 e 11 t v a+ue-s---.seTe to be used. The average opposed rightturning Cleft in the U.S.) vehicle was equivalent to 1.75 through vehicles. For left-turners <right in the U.S.), the guide! ine was to use a pcu value of 1.25 when left turns comprised over 10 percent of the traffic flow but no adjustment when less than 10 percent.
The Swedish Capacity Manual set base values for saturation flow at 1,700 vphg for lanes having only through traffic and 1,500 vphg for lanes having only turning traffic without conflict C15l.
Another study converted turning
33
movements and vehicle types to through car units Ctcu•s> (10). A right-turning passenger car had a tcu value of 1.20 while a right-turning truck had a tcu value of 1.81. A through truck had a tcu value of 1.63.
Passenger car equivalent <peel values of 1.0 for right turns having a right-turn bay and 1.33 with no bay have been recommended (16). Other recommended pee values were 1.7 for through buses and 2.0 for left-turning buses.
Passenger car unit Cpcu> values for several vehicle types were developed in a Canadian study <12). The pcu was 1.0 for a passenger car or sma II truck, 1. 4 for a medium truck or bus, 2.4 for a large truck or semi-trailer, 0.6 for a motorcycle, and 3.5 for a special vehicle.
Gradient -- There have been vari~·~----recommendations concerning the effect of gradient on saturation flow. Several studies I isted no factor for this variable. An Austral ian study recommended multiplying saturation flow by a factor equal to 1 + Gr/100 (6). Gr is the percent gradient, with a positive value for downhill grades and a negative value for uphill grades. This results in a one percent adjustment for each one percent change in grade. An earlier Austral ian report stated the effect of grade was to reduce saturation flow by about 1/2 percent for each one percent of uphill gradient <5>.
A much greater effect of gradient on saturation flow was observed in a British study (17). That study noted that each one percent chauge ill gradient cause-d---a--------three percent change in saturation flow. Uphill grade decreased saturation flow and downhi II grade increased it.
A Canadian study did not note any significant effects of uphill grades up to positive nine percent during summer traffic having homogeneous traffic flow and very few trucks <11). However, in winter, the effect of grade was significant. Adjustment factors were I isted for uphill grades starting at three percent where trucks were present.

34
Lane Width -- Various studies have related lane width to saturation flow. In one study, the conclusion was that, for lanes 10 or more feet in width, lane width had little influence on flow rates (18>. For lane widths between 9 and 10 feet, a reduction of 10 percent was recommended. Lane width did not include pavement used for parking.
One of the more detailed sets of adjustment factors was developed in an Austral ian report (6). A table 1 isting lane width adjustment factors was presented. The factors were as follows:
Lane Width (Feet> Adjustment Factor
8 0.88 9 0.93
10-12 l. 00 l3 l. 03 14 l. 045 15 l. 06
The width at the narrowest point within 100 feet of the stopline was used. A reduction in saturation flow of 12 percent was shown for a lane width of 8 feet, and an increase of 6 percent was given for a· lane width of 15 feet.
Adjustment factors for lane width were also given for use in the "critical movement analysis" procedure. 03). These factors are applied to increase the effective passenger car volume, rather than to decrease the capacity. The following adjustment factors are used~
factors from that report follow: Lane Width <Feet) Adjustment Factor
8 -12Y. 9 -7Y.
10 -l. 5;( 11 0 12 + 1. 5;( 13 +3Y. 14 +4.5:'.
Some studies have concluded lane width did not have a significant effect on saturation flow. One study concluded lane width had a very smal 1 effect over the range of 6.5 to 16 feet C14l.
Webster related saturation flow to approach widths rather than lane widths (l). . For approaches betw_een 10 and 13 feet wide, which would be one lane. saturation flows increased from 1,850 at 10 feet to 1,950 at 13 feet, a five percent increase.
A saturation flow manual developed in Canada contained a figure that related an adjustment factor to lane width (11). No adjustment factor was included for widths between 10 and 16.5 feet.
lane A
significant reduction in saturation flow was given for lane widths below 10 feet. For a lane width of 9 feet, about a 10 percent reduction was shown. For a width of 8 fest, an approximate 30 percent reduction was listed.
Turning Radius An Australian report give a separate 1 eve 1 for saturation flow for a turning lane having
~---------b-afte-w-i-d-tci'>-+F&e~H--Ad-itts-tme>r'l-t-Fa<>tca•.----a--;;ma-~tlN'l-i~rtg--Nt<!-i-tts-~~r-ev+atts-ty
8.0- 9.9 10.0-12.9 13.0-15.9
1.10 l. 00 0. 90
Another Austral ian report generally concluded that lane width had 1 ittle effect on saturation flow for lanes at least 10 feet wide (5). Adjustment
mentioned, Webster 1 isted equations relating saturation flow to radius of curvature for exclusive right-turning <left in the U.S.) lanes with no opposing flow (1).
Pedestrian Activity-- The effect of pedestrians is indirectly accounted for in the adjustment factor for location in city. The lowest values of saturation flow wi II be for locations in the CBD, where pedestrian activity is heaviest. Interruption of traffic flow causes lost time in the green phase, which reduces
capacity.
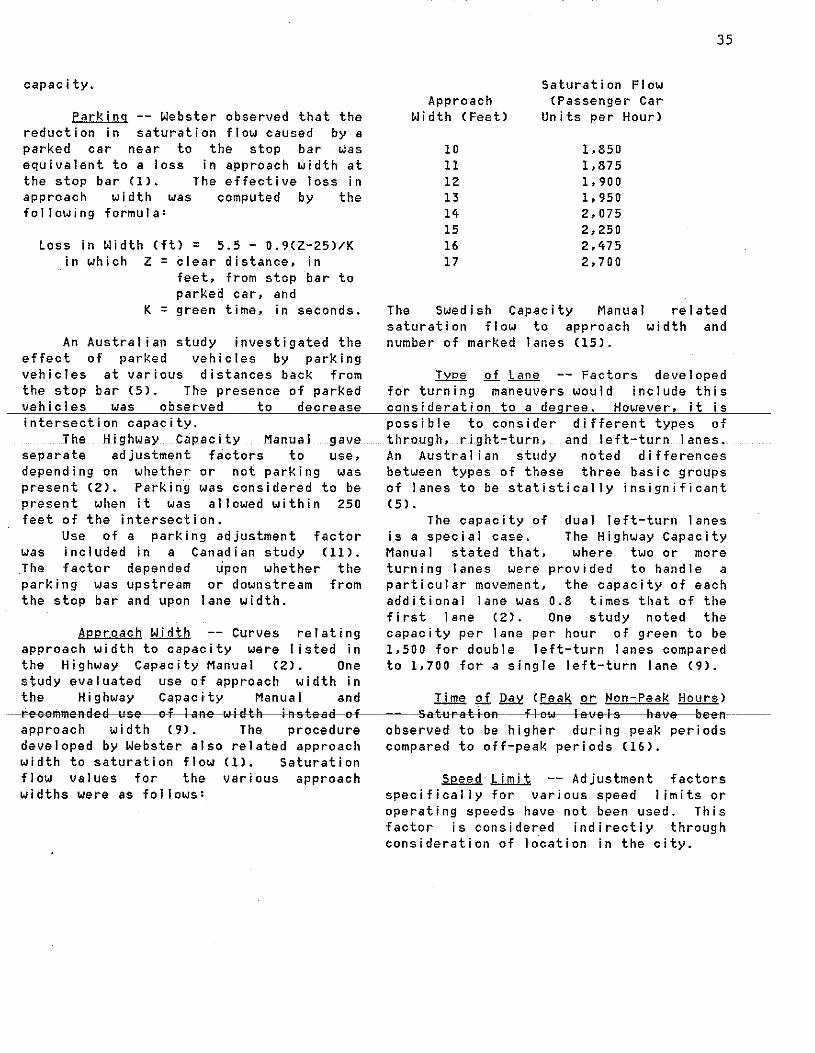
Parking -- Webster observed that the reduction in saturation flow caused by a parked car near to the stop bar was equivalent to a loss in approach width at the stop bar ( 1 J. The effective I ass in approach width was computed by the following formula:
Loss in Width Cftl = 5.5 - 0.9CZ-25l/K in which Z = clear distance, in
feet, from stop bar to parked car, and
K = green time, in seconds.
An Austral ian study investigated the effect of parked vehicles by parking vehicles at various distances back from the stop bar (5). The presence of parked vehicles was observed to decrease intersection capacity.
The Highway Capacity Manual gave separate adjustment factors to use, depending on whether or not parking was present (2). Parking was considered to be present when it was allowed within 250 feet of the intersection.
factor ( 11).
Use of a parking adjustment was included in a Canadian study The factor depended upon whether parking was upstream or downstream the stop bar and upon lane width.
the from
APProach Width --Curves relating approach width to capacity were I isted in the Highway Capacity Manu a I ( 2). One study evaluated use of approach width in
35
Saturation Flow Approach <Passenger Car
Width <Feet> Units per Hour>
10 1,850 11 1.875 12 1,900 13 1,950 14 2,075 15 2,250 16 2. 475 17 2,700
The Swedish Capacity Manual saturation flow to approach number of marked lanes (15).
reI a ted width and
TyPe Qf Lane -- Factors developed for turning maneuvers would include this consideration to a degree. However, it is possible to consider different types of through, right-turn, and left-turn lanes. An Australian study noted differences between types of these three basic groups of lanes to be statistically insignificant ( 5).
The capacity of dual left-turn lanes is a special case. The Highway Capacity Manual stated that, where two or more turning lanes were provided to handle a particular movement, the capacity of each additional lane was 0.8 times that of the first lane (2). One study noted the capacity per lane per hour of green to be 1,500 for double left-turn lanes compared to 1,700 for a single left-turn lane (9).
the Highway Capacity Manual and Time of J22.y CPeak .!l.!: ~on-Peak Hours> ----l"'e<>emmet>d e d use e-f-1-afl<>-w+d-t-h----+Ri>t.>a<l-e-f--~~--&a-~t>r-ak+E>fl--f-1-ew--f-evec I s h a ·.·e b·<H>n------
approach width (9). The procedure observed to be higher during peak periods developed by Webster also related approach compared to off-peak periods C16l. width to saturation flow Cll. Saturation flow values for the various approach widths were as follows:
Speed limit --Adjustment factors specifically for various speed I imits or operating speeds have not been used. This factor is considered indirectly through consideration of location in the city.

36
Weather Q£ Road Surface Conditions Results relating capacity to weather or
road surface conditions have varied. One study observed the effect of weather to be insignificant CSl. Another paper stated that rain reduced capacities by eight to 2~ percent C19l. A Canadian study found headways to be higher during winter conditions when compared to summer conditions C12l. Winter conditions were repre~ented by snow on the pavement.
llsh1 Conditions-- A comparison of saturation flows during daylight and night (street I ightsl conditions was made in one study C12l. Results did not indicate any difference. Another study indicated saturation flow levels during day! ight periods were slightly higher than levels during darkness (16).

37
APPENDIX B
CASE STUDIES

38

To illustrate the use of the saturation flow prediction formula given in the recommendations, a few case studies were conducted to compare mea·sured and predicted va I ues. The necessary approach data as shown in Figur~ 2 was collected at four lanes at different intersections in Lexington and Nicholasville. Saturation flow data were collected, and the measured values were compared to the value obtained with the saturation flow prediction formula. Following is a discussion of these calculations:
Case Study Number 1
Location Location in City Pedestrian Activity City Population Vehicle Distribution
Hew Circle at Palumbo, Lexington Outlying Business District
Gradient Lane Width Turning Radius Type of Lane Speed Limit Light Condition
Predicted Value
Light 204,000 Through Passenger Cars Through Single-Unit Trucks Through Combination Trucks Through Motorcycles
0 Percent 12.7 Feet DNA Left of Two Through Lanes 45 MPH Day
S = 1650CFiplCFclCFvtlCFglCFwlCFrlCFtlCFslCFdl
Flp = 1. 00 Fo = 1. 00 Fvt = 100/((97.4)(1.00) + (1.5)(1.36)
(0.4)(2.02) + (0.7)(0.85) = 0.99 Fg = 1. 00 Fw = 1. 00 Fr = DNA Ft = 1 00
Fs = 1. 00 Fd = 1. 00
s = 1650(0.99) = 1,634 vphg
Measured Value = 1,714 vphg Difference = 4.7 percent
+
97.4% 1.5Y. 0.4% 0.7Y.
100.0%
39
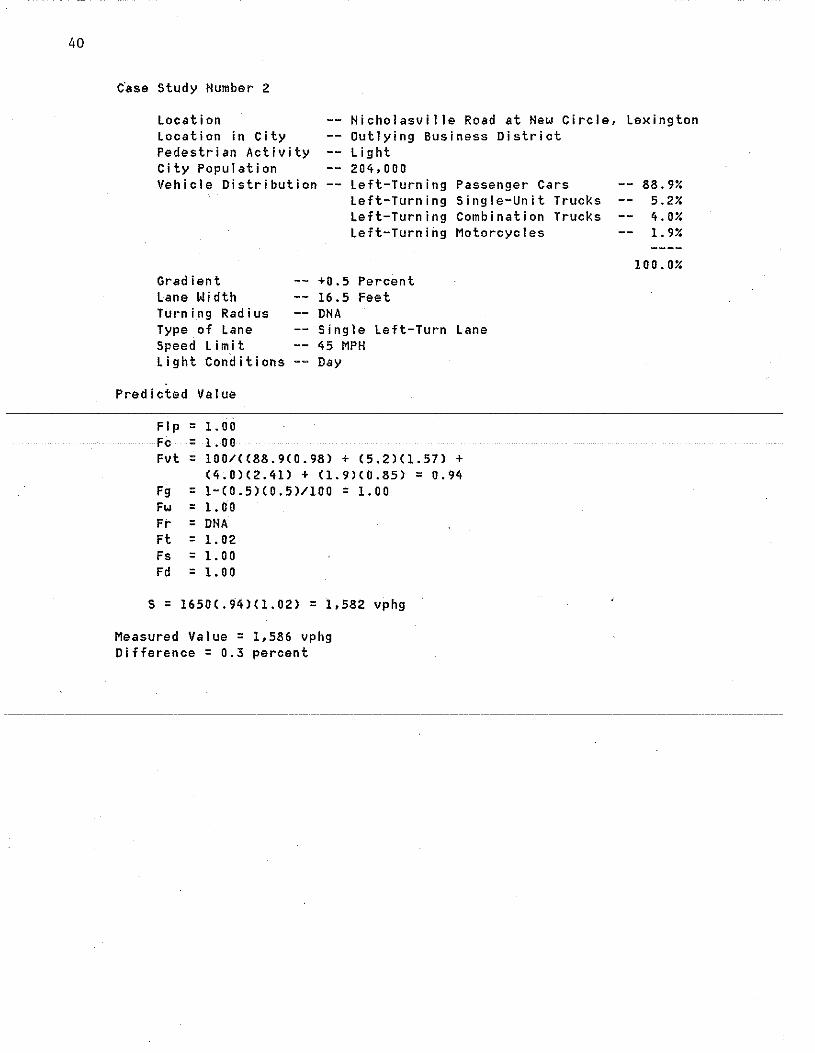
40
c·ase Study Humber 2
Location Location in City Pedestrian Activity City Population Vehicle Distribution
Gradient lane Width Turning Radius Type of Lane Speed Limit Light Conditions
Predicted Va I ue
Flp = l. 00 Fe = l. 00
Nicholasville Road at Hew Circle, Lexington Outlying Business District Light 204,000 Left-Turning Passenger Cars 88.9% Left-Turning Single-Unit Trucks 5.2% left-Turning Combination Trucks 4.0% Left-Turning Motorcycles 1.9%
100.0% +0.5 Percent 16.5 Feet DNA Single Left-Turn Lane 45 MPH Day
Fvt = 100/((88.9(0.98) + (5.2)(1.57> + (4.0)(2.41> + (1.9)(0.85)
Fg = 1-(0.5)(0.5)/100 = l. 00 Fw = l. 00 Fr = DNA Ft = l. 02 Fs = l. 00 Fd = l. 00
S = 1650C.94lC1.02l = 1,582 vphg
Measured Value = 1,586 vphg Difference = 0.3 percent
= 0.94

Case Study Number 3
Location Location in City Pedestrian Activity City Population Vehicle Distribution
Gradient Lane Width Turning Radius Type of Lane
Speed Limit Light Conqitions
Predicted Value
Flp = 0.97 Fe = 0.87
Main at Chestnut, Nicholasville Central Business District Moderate 9,800 Through Passenger Cars Right-Turning Passenger Cars Through Single-Unit Trucks Through Combination Trucks Through Motorcycles
+1.0 Percent 12.5 Feet 16 Feet Through or Right-Turn Lane (Only Through Lane on Approach) 35 MPH Day
Fvt = 100/((89.8)(1.00) + (4.8)(1.12) + (2.7)(1.36) + (1.6)(2.02) + (1.1)(0.85)) = 0.97
Fg = 1 - (0.5)(1)1100 = 1. 00 Fw = 1. 00 Fr = 95.21100 + (.93)(4.8)/100 = 1. 00 Ft = 0. 96 Fs = 1. 00 Fd = 1. 00
S = 1,650(.97((.87J(.97J(.96J = 1,297 vphg
Measured Value = 1,309 vphg Difference = 0.9 percent
8 9. 8Y. 4.8% 2.77. 1.6% 1.1%
100.0Y.
41

42
Case Study Humber 4
Location Location in City Pedestrian Activity City Population Vehicle Distribution
Gradient Lane Width Turning Radius Type of Lane
Speed l iin it ' ht Cnn-djtjons
Predicted Value
Flp = 0. 97 Fe = 0.87
Main at Oak, Nicholasville Central Business District Moderate 9,800 Through Passenger Cars Right-Turning Passenger Cars Through Single-Unit Trucks Right-Turning Single-Unit Trucks Through Combination Trucks Through Motorcycles
-0.5 Percent 14.0 Feet 13 Feet Through or Right-Turn Lane COnly Through Lane on Approachl 35 MPH na
Fvt = l00/CC79.1JC1.00l + (10.1)(1.12) + (3.0)(1.36) + C0.6Hl.7ll + (2.02)(6.0) + (1.2)(.85)) =
Fg = 1 - (1.1)(0.5)/100 = 0.99 Fw = 1. 00 Fr = 89.3/100 + ( .93)(10.7J/l00 = 0.99 Ft = 0.96 Fs = 1. 00 Fd = 1. 00
S = 1,650C.97JC.87JC.92JC.99JC.99JC.96J = 1,205 vphg
Measured Value = 1,188 Difference = 1.4 percent
0.92
79.1Y. 10.1Y. 3. OY. 0.6Y. 6.0% 1. 2Y.
lOO.OY.

l.
2.
3.
4.
5.
6.
7.
8.
9.
10.
REFERENCES
Webster, F. V.; and Cobbe, "Traffic Signals," Road Technical Paper No. 56, Road laboratory, london, England,
B. M.; Research Research 1966.
Highway Capacity Manual, Research Board Special 1965.
Highway Report 87,
Berry, D. S.; Discussion of paper entitled "Relationship of Signal Design to Discharge Headway, Approach Capacity, and Delay," Transportation Research Board Record 615, 1976. Capelle, D. G.; and Pinnell. C.; •capacity Study of Signalized Diamond Interchange," Highway Research Board Bulletin 291, 1961. Miller, A. J.; "The Capacity of Signalized Intersections in A 1 ) s t ,... a 1 i a . " "' J I 5 t r aJ---1-a-n------R-o-a-d------Ra--s-e-a~ R Board Bulletin No. 3, March 1968. Signalised Intersection Capacity Workshop-- Papers, Austr~l ian Road Research Board, December 1979. Berry, D. S.; and Ghandhi, P. K.; "Headway Approach to Intersection Capacity,• · Highway Research Board Record 453, 197 3.
Signal ised Intersection Guide, Austral ian Road Board, No. 79, Apri I 1978.
Capacity Research
Kunzman, W.; "Another look at Signalized Intersection · Capacity,• ITE Journal, August 1978. Carstens, R. l.; "Some Traffic
ll.
12.
13.
14.
15.
16.
17.
18.
19.
43
Parameters at Signalized Intersections," Traffiri Engineering, August 1971. Saturation Flow Manual, Edmonton and University of Canada, April 1980.
City of Alberta,
Teply, S.; "Saturation Flow at Signalized Intersections through Magnifying Glass," University Alberta, June 1981.
a of
Interim Materials on Highway Capacity, Transportation Research Board Circular 212, January 1980. Miller, A. J.; "On the Aust~al ian Road Capacity Guide," Highway Research Board Record 289, 1969. Peterson, B. E.; "Swedish Capacity Manual," Transportation Research Board Record 667, 1978. Branston, D.; "Some Factors Affecting the Capaeity ef Si~~~ze~-----Intersections," Traffic Engineerina and Control, August/September 1979. Dick, A. C.; "Effect of Gradients on Saturation Flow at Traffic Signals," Traffic Engineering and Control, 1963. Messer, C. "Critical
J. ; lane
and Fambro, D. B.; Analysis for
Intersection Design," Transportation Research Board Record 644, 1977. Hormann, 0. K.; "Variations in Flow. at Intersections as Related to Size of City, Type of Faci I ity, and Capacity Uti! ization," Highway Research Board Bulletin 352, 1962.