Technical Assistance Consultant’s Report · BSNL Bharat Sanchar Nigam Limited ... MDG Millennium...
82
Technical Assistance Consultant’s Report This consultant’s report does not necessarily reflect the views of ADB or the Government concerned, and ADB and the Government cannot be held liable for its contents. (For project preparatory technical assistance: All the views expressed herein may not be incorporated into the proposed project’s design. TA 7327 March 2012 India: Preparing for Kolkata Environmental Improvement Project Phase II
Transcript of Technical Assistance Consultant’s Report · BSNL Bharat Sanchar Nigam Limited ... MDG Millennium...

Technical Assistance Consultant’s Report
This consultant’s report does not necessarily reflect the views of ADB or the Government concerned, and ADB and the Government cannot be held liable for its contents. (For project preparatory technical assistance: All the views expressed herein may not be incorporated into the proposed project’s design.
TA 7327 March 2012
India: Preparing for Kolkata Environmental Improvement Project Phase II

KOLKATA URBAN SECTOR INVESTMENT PLAN (2012-2022)
VOLUME 1
THE URBAN SERVICE PLAN
SECOND KOLKATA ENVIRONMENTAL IMPROVEMENT PROJECT (KEIP PHASE 2)
FINAL REPORT
March 2012

Volume 1 The Urban Service Plan
i
KOLKATA URBAN SECTOR INVESTMENT PLAN
(2012-2022)
Volume 1: The Urban Service Plan
Table of Contents LIST OF ABBREVIATIONS ............................................................................................................. a EXECUTIVE SUMMARY .................................................................................................................. I 1 Background .................................................................................................................. 1 2 Objectives .................................................................................................................... 1 3 Scope of the project ..................................................................................................... 1 4 Kolkata Metropolitan Area ............................................................................................ 3 5 Kolkata Municipal Corporation ..................................................................................... 4 5.1 Administrative area ...................................................................................................... 4 5.2 KMC spatial development pattern ................................................................................ 6 6 Population .................................................................................................................... 6 6.1 Current population ........................................................................................................ 6 6.2 Population characteristics and trends .......................................................................... 7 6.3 Population projection.................................................................................................. 13 7 KMC Urban service provision benchmarking ............................................................. 17 7.1 KMC 2011 baseline benchmark summary status ...................................................... 17 7.2 Water supply sub-sector benchmark status ............................................................... 20 7.2.1 Water supply main system characteristics ................................................................. 20 7.2.2 Water supply baseline service levels as compared to benchmarks .......................... 21 7.3 Sewerage and drainage sub-sector benchmark status ............................................. 22 7.3.1 Sewerage and drainage main system characteristics ............................................... 22 7.3.2 Sewerage and drainage baseline service levels as compared to benchmarks ......... 26 7.4 Solid Waste Management sub-sector benchmark status .......................................... 27 7.4.1 Solid Waste Management main system characteristics ............................................ 27 7.4.2 Solid Waste Management baseline service levels as compared to benchmarks ...... 28 8. Water supply service plan .......................................................................................... 30 8.1 Water supply baseline 2011 ....................................................................................... 30 8.2 Water supply service targets and service gaps ......................................................... 32 9. Sewerage and drainage service plan ......................................................................... 37 9.1. Sewerage and drainage baseline 2011 ..................................................................... 37 9.2. Sewerage and drainage service targets and service gaps ........................................ 41 10. Solid Waste Management service plan...................................................................... 46 10.1 Solid Waste Management baseline 2011 .................................................................. 46 10.2 Solid Waste Management service targets and service gaps ..................................... 48

Volume 1 The Urban Service Plan
ii
List of Annexes Annex A. Population by ward (1-141) and borough (I-XV) ............................................................ 54 Annex B. Population densities in people per km2 by Ward (1-141) and Borough (I-XV) .............. 58 Annex C. Slum population by ward (1-141) and borough (I-XV) ................................................... 62 Annex D. Households by Ward (1-141) and Borough (I-XV) ........................................................ 66

Volume 1 The Urban Service Plan
a
LIST OF ABBREVIATIONS
ADB Asian Development Bank
AP Affected Person
BGL Below Ground Level
BM Bench Mark
BOD Biochemical Oxygen Demand
BPL Below Poverty Line
BPR Business Process Engineering
BPS Booster Pumping Stations
BSNL Bharat Sanchar Nigam Limited
BSR Basic Schedule Rates
BSUP Basic Services for Urban Poor
BUDIP Bihar Urban Development Investment Program
CaCo3 Calcium Carbonate
CAGR Compounded Annual Growth Rate
CAPEX Capital Expenditure
CBP Capacity Building Program
CC Core Calcutta
CDP City Development Plan
CF Clariflocculators
CGWB Central Ground Water Board
CH Chemical House
CI Cast Iron
CMFA Controller of Municipal Finance and Accounts, KMC
COD Chemical Oxygen Demand
CPHEEO Central Public Health and Environmental Engineering Organisation
cum/hr Cubic Meter Per Hour
cum/m3 Cubic Meter
CWPS Clear Water Pumping Station
CWR Clear Water Reservoir
DA Dearness Allowance
DCRB Death Cum Retirement Benefit
DDT Dichlorodiphenyltrichloroethane
DFID Department for International Development, Government of United Kingdom
DH Diamond Harbour
DI Ductile Iron
dia. Diameter
DO Dissolved Oxygen
DSC Design & Supervision Consultants
DWF Dry Weather Flows
EA Executing Agency
EC Empowered Committee
ECBA Economic and Cost Benefit Analysis
EIRR Economic Internal Rate of Return
EKW East Kolkata Wetlands
EPF Employees Provident Fund
ERP Enterprise Resource Planning
ESI Employees State Insurance
FDI Foreign Direct Investment
FFA Framework Financing Agreement

Volume 1 The Urban Service Plan
b
FGD Focus Group Discussions
FIRR Financial Internal Rate of Return
FM Flash Mixer
FMA Financial Management Assessment
FMAQ Financial Management Assessment Questionnaire
FST Final Settling Tank
ft. Feet
GAP Ganga Action Plan
GHG Green House Gas
GIS Geographic Information System
GOI Government of India
GoWB Government of West Bengal
GRC Grievance Redressal Committee
GRWW Garden Reach Water Works
GSDP Gross State Domestic Product
Ha. Hectare
HDI Human Development Index
HDPE High-Density Polyethylene
HH Household
HHWL Highest High Water Level
HPC High Powered Committee
HPL Haldia Petrochemicals Limited
I.C.I Industrial Commercial and Institutional
IA Implementing Agency
IBEF India Brand Equity Foundation
ICI Institutional, Commercial And Industrial
IFRCRCS International Federation of Red Cross and Red Crescent Societies
IFU Internal Finance Unit, KMC
IIMC Indian Institute of Management - Calcutta
IIT-KGP Indian Institute of Technology - Kharagpur
IND India
INR Indian National Rupee
IP Indigenous Peoples
IPEC Investment Program Empowered Committee
IPSA Initial Poverty & Social Assessment
IPSAS International Public Sector Accounting Standards
ISI Indian Statistical Institute
IT Information Technology
ITES Information Technology Enabled Services
JNNURM Jawaharlal Nehru National Urban Renewal Mission
KEIP Kolkata Environment Improvement Project
Km Kilometer
km2/sq.km Square Kilometer
KMA Kolkata Metropolitan Area
KMC Kolkata Municipal Corporation
KMDA Kolkata Metropolitan Development Authority
KMWSA Kolkata Metropolitan Water and Sanitation Authority
KODS Khidirpore Old Dock Sill
KPT Kolkata Port Trust
LA Land Acquisition

Volume 1 The Urban Service Plan
c
LAA Land Acquisition Act
LBL LIBOR Based Loan
LIBOR London Interbank Offered Rate
LLWL Lowest Low Water Level
lpcd Liter Per Capita Per Day
LS Lumpsum
LWL Lowest Water Level
M/m meter
m/yr Meter per year
MDG Millennium Development Goal(s)
mg/l Milli gram per liter
MGD/mgd Million Gallon Per Day
MGH Million Gallon Per Hour
MIS Management Information Systems
ML Million Liter
MLD/mld Million Liter Per Day
MM Man Month
Mm/mm millimeter
MOSPI Ministry of Statistics and Program Implementation
MOU Memorandum Of Understanding
MOUD Ministry of Urban Development
MS Mild Steel
MSME Micro, Small and Medium Enterprises
MSW Municipal Solid Waste
NDDP Net District Domestic Product
NDP Net Domestic Product
NGO Non-Government Organizations
NGRBA National Ganga River Basin Authority
NIPFP National Institute of Public Finance and Policy
No. Number
no.s/Ha Number Per Hectare
nos Number
NPRR National Policy on Resettlement & Rehabilitation
NRW Non Revenue Water
NSDP Net State Domestic Product
NSS National Sample Survey
O&M Operation and Maintenance
o/h Over Head
OCB Oil Circuit Breaker
ODA Overseas Development Agency, United Kingdom
OHR Overhead Reservoir
oht/OHT Overhead Tank
PFMA Public Financial Management and Accountability
PFR Periodic Financing Requests
PMC Project Management Consultants (of KEIP)
PMU Project Management Unit
Pop. Population
PPTA Project Preparatory Technical Assistance
PS Pumping Station
PSC Prestressed Concrete

Volume 1 The Urban Service Plan
d
PSEs Public Sector Enterprises
PSP Public Stand Posts
PST Pre-Settling Tanks
PWD Public Works Department
PWW Palta Water Works
QE Quarter Ending
QPR Quarterly Progress Report
R&R Resettlement & Rehabilitation
RBI Reserve Bank of India
RoR Rate of Return
RP Resettlement Plan
RPM Round Per Minutes
RSF Rapid Sand Filters
RWC Raw Water Channel
RWPS Raw Water Pumping Station
S&D Sewerage & Drainage
SAI Supreme Audit Institution
SAR Sub-Project Appraisal Reports
SC Schedule Caste
SDP State Domestic Product
Sq.mts Square Meters
SRAC Salary Records and Accounts Cell, KMC
SS South Suburban
SSE South Suburban East
ST Schedule Tribe
STP Sewage Treatment Plant
STPI Software Technology Parks of India
SWF Storm Water Flow
SWM Solid Waste Management
T&P Tools and Plants Register
TDS Total Dissolved Solids
TFS Total Fixed Solids
TKN Total Kjeldahl Nitrogen
TOR Terms of Reference
TPD Tonnes Per Day
TSS Total Suspended Solids
u/g Underground
UCS Underground Conduit Structure
UFW Unaccounted For Water
UGR Under Ground Reservoir
ULB Urban Local Bodies
USD US Dollar
VCB Vacuum Control Breaker
VSNL Videsh Sanchar Nigam Limited
WBIP West Bengal Industrial Policy
WTP Water Treatment Plant
WTP Willingness to Pay
ZM Zonal Mains

Volume 1 The Urban Service Plan
I
EXECUTIVE SUMMARY 1. Project background The ongoing Kolkata Environmental Improvement Project (KEIP Phase 1) is a multi-agency endeavor to arrest environmental degradation and improve the quality of life in Kolkata. KEIP aims to provide affordable access to basic urban services, revamp and upgrade the sewerage and drainage system, make the solid waste management system efficient, restore the city’s drainage canals, and improve outdoor recreation facilities in parks and water bodies. It also has a stakeholder consultation program and a capacity building component to raise the standards of delivery of municipal services by the Kolkata Municipal Corporation (KMC). The works under KEIP Phase 1 are in progress and will be completed by 30 June 2012, the closing date of the ADB KEIP Phase 1 loans (1813-IND and 2293-IND). Both KMC and ADB wish to continue their combined efforts to improve the urban environment and living conditions in Kolkata, building on results achieved and experience gained. Therefore, a second phase of the KEIP project is now proposed, which will be named the Second Kolkata Environmental Improvement Project (KEIP Phase 2). The ADB has expressed its willingness to support the KEIP Phase 2 by providing a new project loan in the amount of US$90 million. Continuation of ADB loan support for the third and fourth phase of the KEIP depends on achievements during KEIP Phase 2. For loan processing a number of documents must be prepared at a standard acceptable to the ADB. In order to meet the ADB requirements the KMC, assisted by its Project Management Consultants (PMC), has prepared the Kolkata Urban Sector Investment Plan 2012-2022, consisting of four volumes: Volume 1: The urban service plan (this report) Volume 2: The investment plan Volume 3: Economic and financial aspects Volume 4: Environmental and social safeguards frameworks Furthermore the KMC has prepared Sub-project Appraisal Reports (SAR) for KEIP Phase 2 sub-projects in accordance with ADB requirements for the sub-sectors: • Water supply • Sewerage and drainage 2. KEIP Objectives The overarching objective of the Kolkata Environmental Improvement Project is to achieve sustainable economic growth through improved quality of urban life and the urban environment. The immediate objectives of the project may be summarised as: • To provide affordable access to water supply, sewerage and drainage services in KMC • To enhance quality and sustainability of urban service delivery by institutional reforms and
capacity building

Volume 1 The Urban Service Plan
II
3. Scope of the KEIP Phase 2 Total KEIP Phase 2 investment envisaged is US$128.57 million, based on 70% ADB financing ($90 million) and 30% KMC and State Government financing ($38.57 million). The project will address urban service needs in the water supply sub-sector and the sewerage and drainage sub-sector. The maximum project period is 5 years (2012-2017) but considering the urgent need to improve urban service provision and infrastructure the KMC intends to speed up implementation of the project to ensure that the people of Kolkata will enjoy the benefits of the project as soon as possible. Based on experience gained during the ongoing project the KMC is confident that the entire KEIP Phase 2 can be implemented within a period of 4 years meaning that the Phase 2 project period will be from 2012 to 2016. 4. Population Kolkata is a sprawling metropolis. The larger Kolkata Metropolitan Area (KMA) covers an area of 1,851km2 and according to the Census had a total population in year 2001 of 14,720,000 people. In terms of population the Kolkata Metropolitan Area belongs to the world’s top ten megacities. The Kolkata Municipal Corporation (KMC) is the centre of the metropolis and covers a total area of 187 km2 which is just over 10% of the metropolitan area. According to the provisional 2011 Census results the KMC population stands at a total of 4,484,484 people down from 4,572,876 in 2001. This means an actual population decrease compared to 2001 of 88,392 people (-1.93%). The city centre is very densely populated. Densities between 50,000 and 60,000 people per km2 are quite common in the central wards of the KMC and in some wards the density is even higher than 100,000 people per km2. This is extremely high by all standards. Because of these cramped living conditions people have increasingly settled in the urban fringe areas where population is growing fast. Meanwhile the central city boroughs of KMC experience population decline. These trends are expected to continue in the future. For the period 2011- 2022 modest overall population increase is projected of 1.7% which brings the total KMC population at 4,560,887 people in 2022. Decreasing population densities, declining household sizes and increasing gender ratios have consistently been recorded since the 1991 Census, indicating that the living conditions in Kolkata are steadily improving. Nevertheless, approximately one third of the Kolkata population (1,485,309 people) lives in slums. 5. Overall baseline level of urban service provision The Hand Book of Service Level Benchmarking of the Ministry of Urban Development, Government of India, defines national benchmark targets for urban service provision. Overall it appears that KMC still has a long way to go to arrive at the national service level targets. However, compared to the national averages (as far as available) KMC compares in general positive. For some of the benchmarks there is a big difference in service levels within the KMC area. The water supply service level is distinctly different for the various water supply zones. The sewerage and drainage service level in the central city area is distinctly different from the service quality in some of the outer areas where a formal underground sewer system simply does not exist.

Volume 1 The Urban Service Plan
III
6. Urban service plan In the urban service plan the baseline levels of urban service provision in KMC have been determined and realistic targets for 2017 and 2022 have been set to arrive at improved service delivery, in line with national benchmark targets. The following tables summarize the plan for urban service delivery. Besides service level assessments, the urban service plan also includes an assessment of current infrastructure and equipment used for service delivery and set targets for 2017 and 2022 for improvements needed in terms of quantity and quality. Table: Service plan Kolkata water supply Indicator 2011 2017 2022 GAP 2011 – 2022
1 Population in service area 4,484,484 4,502,540 4,560,887 76,403
2 Coverage of water supply 92% 96% 100% 8%
3 Per capita water supply supply 134 lpcd 142 lpcd 150 lpcd 16 lpcd
4 Extent of Non-revenue water 40% 36% 30% 10%
5 Continuity of water supplied 8 hrs 16 hrs 24 hrs 16 hrs
6 Residual pressure 2.5m 5.0m 10.0m 7.5m
7 Complaint handling 95% 98% 100% 5%
8 Quality of water supplied 98% 99% 100% 2%
Table: Service Plan Kolkata Sewerage Indicator 2011 2017 2022 GAP 2011 – 2022
1 Population with direct sewer connection 1,976,593 2,000,000 2,100,000 123,407
2 Population in service area 4,484,484 4,502,540 4,560,887 76,403
3 Volume of wastewater collected 71% 80% 95% 19%
4 Treatment capacity available 88% 90% 95% 7%
5 Effluent samples quality 100% 100% 100% 0
6 Percentage of waste water reused 93% 93% 93% 0
7 Complaints redressed within 24 hours 65% 80% 90% 25%
Table: Service Plan Kolkata Drainage Indicator 2011 2017 2022 GAP
2011 – 22
1 Road length covered by
drainage
2,736km (65%) 2,950km(67%) 3,386km(73%) 650km
2 Total road length 4,200km 4,400km 4,620km 420km
3 Population covered 3,984,485(89%) 4,270,000(95%) 4,560,887(100%) 576,402
4 Areas covered 150km2(80%) 170km2(91%) 187 km2(100%) 37km2
5 Annual water logging
frequency
> 6 >6 max 6 Varies by
location

Volume 1 The Urban Service Plan
IV
Table: Service Plan Kolkata Solid Waste Management Indicators 2011 2017 2022 GAP
2011-2022
1 Population covered by daily doorstep collection system 75% 85% 100% 25%
2 Total waste collected vs. total waste generated 97% 98% 100% 3%
3 Percent of households and establishments that
segregate their waste
4% 20% 40% 36%
4 Extent of recovery (waste processing & recycling
facilities) of waste collected
20% 40% 60 % 36%
5 Amount of waste that is disposed in landfills that have
been designed, built, operated as per standards laid
down by central agencies
0% 100% 100% 100%
6 Total number of complaints redressed within 24 hours
as a per cent of total received complaint
54% 80% 90% 36%

Volume 1 The Urban Service Plan
1
1 Background
The ongoing Kolkata Environmental Improvement Project Phase 1 (KEIP 1) is a multi-agency endeavor to arrest environmental degradation and improve the quality of life in Kolkata. KEIP aims to provide affordable access to basic urban services, revamp and upgrade the sewerage and drainage system, make the solid waste management system efficient, restore the city’s drainage canals, and improve outdoor recreation facilities in parks and water bodies. It also has a stakeholder consultation program and a capacity building component to raise the standards of delivery of municipal services by the Kolkata Municipal Corporation (KMC). The original project was for $360 million including $250 million from an Asian Development Bank (ADB) loan. Financing is from the KMC, the Government of West Bengal (GoWB) and the ADB. In addition there is grant financing from the UK Department for International Development (DFID) for the KMC capacity building component of the Project. The Executive Agencies of the Project are KMC and GoWB Irrigation and Waterways Department (IWD). The original ADB loan (Loan 1813-IND) of US$250 million was approved on 19 December 2000. After cancellation of $72.2 million from the original loan, a supplementary loan (Loan 2293-IND) of $80 million was approved and became effective on 1 June 2007. The closing date of these two loans with a total amount of $257.8 million has been extended to 30 June 2012. The works under KEIP Phase 1 are in progress and will be completed by mid 2012. Both KMC and ADB wish to continue their combined efforts to improve the urban environment and living conditions in Kolkata, building on results achieved and experience gained. Therefore, a second phase of KEIP is now proposed, which will be named the Second Kolkata Environmental Improvement Project (KEIP Phase 2). The ADB has expressed its willingness to support the KEIP Phase 2 by providing a new project loan in the amount of US$90 million. Successful implementation of the second phase may result in co-financing of a third and fourth phase of the KEIP by ADB.
2 Objectives
The overarching objective of the Kolkata Environmental Improvement Project is to achieve sustainable economic growth through improved quality of urban life and the urban environment. The immediate objectives of the project may be summarised as: • To provide affordable access to water supply, sewerage and drainage services in KMC • To enhance quality and sustainability of urban service delivery by institutional reforms and
capacity building
3 Scope of the project
Total KEIP Phase 2 investment envisaged is US$128.57 million, based on 70% ADB financing ($90 million) and 30% KMC and State Government financing ($38.57 million). The maximum project period is 5 years but considering the urgent need to improve urban service provision and infrastructure the KMC intends to speed up implementation of the project to ensure that the people of Kolkata will enjoy the benefits of the project as soon as possible. Based on experience gained during the ongoing project the KMC is confident that the entire KEIP Phase 2 can be

Volume 1 The Urban Service Plan
2
implemented within a period of 4 years meaning that the Phase 2 project period will be from 2012 to 2016. Continuation of ADB loan support for subsequent KEIP Phases 3 and 4 depends on achievements during the second phase. Assuming successful project implementation in Phase 2, the third KEIP Phase could be implemented in the period 2015-2019 and Phase 4 in period 2018-2022, meaning that the various Phases will have some overlap. The ongoing KEIP Phase 1 is mainly focused on the sewerage and drainage sub-sector in the outer areas of the city. KEIP Phase 2 continues improving and extending sewerage and drainage systems, but will also include a substantial water supply sub-sector component. The Investment Plan 2012-2022 covering KEIP Phase 2, 3 and 4 (refer to Volume 2 of the Kolkata Urban Sector Investment Plan), even has a much wider scope and addresses urban service needs in the Water Supply, the Sewerage & Drainage, and the Solid Waste Management sub-sectors. The focus is on the 10 year plan period 2012-2022, but investment needs beyond 2022 that have been identified in these sub-sectors are included as well. The investment plan is a combination of: • Physical investment, through subprojects falling into the agreed subsectors of urban services
in the investment plan. • Non-physical investment, such as regulatory and institutional reforms to make best use of the
physical investment, and capacity building to enable the urban service policy makers and providers to achieve the reforms.
New initiatives for innovative approaches have been explored, especially: • Possible use of public-private partnership (PPP) for construction of assets, and/or operations
and maintenance of the assets created by the projects • Introduction of eco-friendly equipments, such as LED streetlights, to rationalize KMC's
expenditure on utilities as a part of financial management improvement actions of KMC. For loan processing a number of documents must be prepared at a standard acceptable to the ADB. In order to meet the ADB requirements the KMC, assisted by its Project Management Consultants (PMC), has prepared the Kolkata Urban Sector Investment Plan 2012-2022, consisting of four volumes: Volume 1: The urban service plan (this report) Volume 2: The investment plan Volume 3: Economic and financial aspects Volume 4: Environmental and social safeguards frameworks Furthermore the KMC has prepared Sub-project Appraisal Reports (SAR) for KEIP Phase 2 sub-projects in accordance with ADB requirements for the sub-sectors: • Water supply • Sewerage and drainage

Volume 1 The Urban Service Plan
3
4 Kolkata Metropolitan Area
Kolkata is a city with a history dating back to 1686, when the British East India Company set up a trading settlement on the banks of the Hooghly River. Although Kolkata soon became a thriving trading place, it remained a relatively small village for a long time. In 1710 the settlement had a population of approximately 12,000 people. Later in the 18th century the British took control over large parts of Bengal and Kolkata gained importance as the centre of power in British India. In 1772 Kolkata became the capital of British India. During the 19th century the position of Kolkata grew steadily more important. Bengali literature and culture flourished and many buildings constructed during this century reflect the wealth and importance of the city. The population increased from a mere 45,000 in the year 1757 to 187,000 in the year 1831 and by the turn of the century in 1901 the population had reached a total number of 848,000. In 1911 the British decided to relocate the capital from Kolkata to Delhi. This was an economic drawback for the development of the city and growth levels declined. Nevertheless the population reached a total of more than one million (1,030,000) in the year 1921 and continued to grow. Another major event with a high impact on the development of Kolkata was the partition of India in 1947. The city lost direct access to large parts of its natural hinterland and besides had to cope with a huge influx of refugees from East Pakistan. The war between India and Pakistan in 1971 caused another wave of refugees arriving in Kolkata. The impact in terms of housing shortages, overcrowding, poverty and overloaded infrastructure and urban services has been felt for a long time after. Nowadays, Kolkata is a sprawling metropolis. The larger Kolkata Metropolitan Area (KMA) covers an area of 1,851km2 and according to the Census had a total population in year 2001 of 14,720,000 people, which implies an average density of 7950 persons per sq.km. In terms of population the Kolkata Metropolitan Area belongs to the world’s top ten megacities. The 2008 UN-Habitat report ranks the Kolkata Metropolitan Area as the eighth largest megacity in the world. Table: The World’s Megacities in 2007 Rank City Population x 1,000 1 Tokyo 35,676 2 Mexico City 19,040 3 New York-Newark 19,028 4 Soa Paulo 18,978 5 Mumbai 18,845 6 Delhi 15,926 7 Shanghai 14,987 8 Kolkata 14,787 9 Buenos Aires 12,795 10 Dhaka 13,485 Source: “World Urbanization Prospects: The 2007 Revision” UN-Habitat, 2008

Volume 1 The Urban Service Plan
4
The Kolkata Metropolitan Area has mainly developed in a linear North-South pattern along both banks of Hooghly River. In the early days of Kolkata the Hooghly was the main transport artery and all activities focused on the river. In subsequent years the construction of two railway lines and more recently two highways on both river banks all running more or less parallel to the river have further shaped the urban growth process. The wetlands in the East have restricted the development potential in Eastern direction. The resulting urbanization pattern is a predominantly linear form extending along the Hooghly River from KMC to Kalyani on the East Bank and from Howrah to Tribeni on the West Bank of the river. The topography of the Kolkata Metropolitan Area is mainly flat and the average elevation is just 5m above sea level. On the West Bank the land slopes towards the Hooghly River. On the East Bank the land slopes in the reverse direction, away from the river and down to the low laying marshes and wetlands to the East. The Hooghly is a branch of the mighty Ganges River. From Kolkata the Hooghly winds its way to the South where it flows in to the Bay of Bengal approximately 120km from Kolkata. At high tide the flow in the Hooghly River reverses and even at 120km from the sea the current flowing North in the reverse direction can be very strong. The tidal fluctuation is approximately 4m in the monsoon season and 2.75m during the dry season. During the monsoon season, lasting from mid June to early October, the combination of high tide and high rainfall often results in water logging in large parts of the urban area. Especially the Howrah Municipal Corporation on the Hooghly West-bank suffers from flooding caused by backflow. On the East Bank, in the Kolkata Municipal Corporation (KMC) area, backflow of river water only causes problems in some low-laying places near the Hooghly and along some of the smaller rivers in the city that have an open connection with the Hooghly. In the KMC area most of the storm water drains to the East through a system of channels that carry the storm water to the vast protected East Kolkata Wetlands before it finally discharges 36km from the city into the Kulti River which flows to the Bay of Bengal.
5 Kolkata Municipal Corporation
5.1 Administrative area
Kolkata is the capital of the State of West Bengal, and is the main port of entry in North Eastern India. Kolkata is located at 22O30’ North Latitude, 88O30’ East Longitude. Administratively the urban area of the Kolkata Metropolitan Area is subdivided in 3 Municipal Corporations, 38 Municipalities, and a large number of smaller administrative units called Panchayat Samities. The Kolkata Municipal Corporation (KMC) is the centre of the metropolis and covers a total area of 187 km2 which is just over 10% of the metropolitan area (refer to figure below). The KMC area has grown over the years by annexation of suburban areas. The 1899 Calcutta Municipal Act defined the administrative domain of the municipal authority as covering 25 wards and 48.5km2. Many boundary changes followed, the latest one in January 1984 when boroughs XI, XII, XIII, XIV and XV were annexed to the KMC. These boroughs are popularly known as the “added areas”. Since these latest additions, the jurisdiction of KMC now covers 15 boroughs which are subdivided in 141 wards as shown in the figure below.

Volume 1 The Urban Service Plan
5

Volume 1 The Urban Service Plan
6
5.2 KMC spatial development pattern
The core of the KMC area is the old colonial town on the Hooghly River East-bank and its direct surroundings, which is nowadays still the central business district of the entire Metropolitan Area. The city centre is dotted with many fine old colonial buildings. A most prominent feature of central Kolkata is the huge 3 km long open area called the Maidan, which originally served as open ground around Fort William to allow the cannons of the Fort a clear line of fire. Nowadays the Maidan serves the people of Kolkata as a green belt, a central park and a sports and playground. From the early days the economy of Kolkata has always been based on industry and trade together with related commercial activities and financial services. In the central business district most government offices are located, often in heritage buildings dating back to colonial days. The old part of the city accommodates many commercial activities and services such as shops, markets, banks, hotels and offices. Important heritage buildings and cultural objects such as the Victoria Memorial, the Indian Museum, the High Court, Writer’s Building, the Town Hall, St. Paul’s Cathedral and the Marble Palace are also found in and around the core area. The construction of the Eastern Bypass Road (1982-1986) opened-up new developable land and this initiated development in the near vicinity of this major arterial road. Especially high-rise apartment blocks, shopping malls, hotels, schools and hospitals have been constructed recently and more development is expected in the near future. The Eastern wards of KMC have the highest development potential. The Southern wards come second in potential. This is mainly because of available land and access. The ongoing expansion of the metro rail transit system to the East and South will further increase the development potential of these areas. In the more central parts of the KMC vacant land is near to non-existent but redevelopment does take place and this provides opportunities for urban renewal and further intensification of land use. Often this means that residential blocks will be converted into commercial land uses, resulting in an increased focus on commercial activities and services and a shift of population from the central parts of the city to the urban fringes. It should be noted that the KMC intends to protect the old colonial core area from redevelopment that would adversely impact the heritage values. This policy limits the redevelopment potential but will also mean a tremendous increase of the economic potential of this old town area especially in terms of recreation and tourism with related activities such as hotels, restaurants, museums, shops, etc.
6 Population
6.1 Current population
Detailed population data are available from the Census that is held every ten years. The latest Census was in 2011 but only some results have so far been published. The following table shows the provisional 2011 Census data on KMC population by borough subdivided over male, female and other. The 2011 Census data on slum population, households and household size are not yet available and therefore the baseline shown in the table is from the 2001 Census. Detailed data per ward are presented in the annexes to this report.

Volume 1 The Urban Service Plan
7
Table: baseline population data Census 2001 and 2011
Bor
ough
Sur
face
Are
a km
2
2001 2011
Pop
ulat
ion
Pop
ulat
ion
Den
sity
Slu
m
popu
latio
n
Hou
seho
lds
Hou
seho
ld
size
Pop
ulat
ion
Mal
e
Fem
ale
Oth
er
Pop
ulat
ion
Den
sity
I 9,57 325649 34027 152520 67147 4,85 306407 159320 147055 32 32016
II 3,27 236767 72390 64448 47314 5,00 202567 107753 94811 3 61934
III 9,42 341876 36293 212262 71090 4,81 365008 189107 175893 8 38748
IV 3,35 278255 82957 78688 50387 5,52 243105 140043 103060 2 72478
V 5,33 262353 49256 54685 45685 5,74 222752 137291 85454 7 41821
VI 5,56 313638 56399 55179 55147 5,69 253285 138206 115070 9 45546
VII 25,89 505358 19516 403433 95389 5,30 534562 282144 252395 23 20644
VIII 9,90 296663 29976 48871 64502 4,60 252457 130982 121473 2 25509
IX 19,42 364354 18759 161696 72441 5,03 341767 183677 158067 23 17596
X 15,71 406935 25900 65833 93653 4,35 389059 194228 194827 4 24763
XI 12,41 201040 16204 0 47395 4,24 235872 118513 117357 2 19012
XII 20,93 222145 10615 2618 53128 4,18 304845 154324 150519 2 14566
XIII 12,12 247093 20379 12480 55150 4,48 244417 123262 121155 0 20159
XIV 19,10 296044 15497 4892 69374 4,27 310508 155779 154728 1 16254
XV 8,96 274.706 30672 167.704 41.784 6,57 277.873 146.753 131.119 1 31026
Total 180,95 4.572.876 25272 1.485.309 929.586 4,92 4.484.484 2.361.382 2.122.983 119 24783
Source: Census 2001 and 2011
Note that the total area of all wards adds up to almost 181 km2. The total surface area of KMC is 187km2. The difference is explained by the surface area of Fort William, the Canals, and the River Ports.
6.2 Population characteristics and trends
According to provisional 2011 Census results the West Bengal State population has grown by 13.9% in the period 2001-2011 compared to 17.8% in the period 1991-2001, indicating that overall population growth is slowing down in line with the national trend. This is also the case for each of the Districts in which the Kolkata Metropolitan Area is located. Nevertheless, in most of these Districts population continues to grow fast except the KMC as illustrated in the following table. Table: Decennial intra-Census population growth by District District Growth rate
1991-2001 2001-2011 KMC 4.28% -1.93% Hooghly 15.77% 9.49% Howrah 14.57% 13.31% Nadia 19.54% 12.24% North 24 Parganas 22.69% 12.86%

Volume 1 The Urban Service Plan
8
South 24 Parganas 20.85% 18.05% Total West Bengal 17.77% 13.93% Source: Census 2011
According to the preliminary 2011 Census results the KMC population stands at a total of 4,484,484 people down from 4,572,876 in 2001. This means an actual population decrease compared to 2001 of 88,392 people (-1.93%) in ten years time. In the previous intra-Census period (1991-2001) the KMC population was still growing, although at a low decennial rate of 4.28%. The KMC covers only 10% of the total Kolkata Metropolitan Area, but accommodates 31% of the Metropolitan population. However, the KMC share of the metropolitan population has consistently decreased over the past decades as illustrated in the following table. Table: Percentage distribution of the metropolitan population over the various districts District % of KMA surface area % of KMA population 1961 1971 1981 1991 2001KMC 10.7% 46.8% 43.2% 39.3% 34.8% 31.1%Hooghly 21.5% 10.9% 11.5% 12.1% 12.6% 12.8%Howrah 14.2% 15.7% 14.0% 14.5% 15.4% 15.3%Nadia 4.6% 0.6% 0.7% 1.0% 1.2% 1.3%North 24 Parganas 25.4% 19.7% 23.2% 25.5% 27.5% 29.9%South 24 Parganas 23.6% 6.2% 7.4% 7.6% 8.4% 9.5%Total KMA 100.0% 100.0% 100.0% 100.0% 100.0% 100.0%Source: City Development Plan Kolkata, KMDA, 2007
The outer urban areas of the metropolis grow much faster than the core. The centre of the metropolis is extremely densely populated and there is very limited vacant, developable land. As a result, over the years the growing population has increasingly settled in the urban fringe areas. The table below illustrates that the average population density (population per square km) in KMC is much higher than in the other parts of the Kolkata Metropolitan Area. Table: Kolkata Metropolitan Area (KMA) population 2001 District Population % of KMA population Density (pop./km2) KMC 4,572,876 31% 25,272 Hooghly 1,887,772 13% 4,734 Howrah 2,258,419 15% 8,604 Nadia 193,556 1% 2,256 North 24 Parganas 4,405,535 30% 9,385 South 24 Parganas 1,400,279 10% 3,201 Total KMA 14,718,437 100% 7,950 Source: City Development Plan Kolkata, KMDA, 2007
The above table presents average values. A closer analysis of the 141 wards within the KMC reveals that in some wards the density is even higher than 100,000 people per km2. This is extremely high by all standards. Densities between 50,000 and 60,000 people per km2 are quite common in the central wards of the KMC, but also occur in borough XV which is a low income area near the river port. The ten most densely populated wards, all with population densities

Volume 1 The Urban Service Plan
9
above 90.000 people per km2 in year 2011, are listed in the table below. Not surprisingly most of the high density wards are found in the city centre, especially in borough IV. Table: Top ten high density wards 2011 (density in people/km2) Borough Ward Density 2001 Density 2011
III 29 83216 95091
IV 23 132476 110495
IV 24 96940 98405
IV 28 98241 94761
IV 39 140272 105704
V 41 121493 94159
VI 54 106986 96192
IX 77 89052 92780
XV 134 96040 93299
XV 135 95168 99803
Source: Census 2001 and 2011
A shift of population pressure from the centre to the urban fringes can be observed at the metropolitan level but also at the KMC level. The central city boroughs of KMC experience population decline and the outer boroughs population increase. This is not a new phenomenon but the trend of shrinking population in the core city is accelerating over time as can be seen from the growth rates since 1991 as presented in the following table, map and graph. Table: Intercensus decennial growth rates by borough
Borough Population
1991 2001 Growth Rate 1991-2001
2011 Growth Rate 2001-2011
I 332699 325649 -2.12 306407 -5.91
II 246529 236767 -3.96 202567 -14.44
III 348945 341876 -2.03 365008 6.77
IV 297191 278255 -6.37 243105 -12.63
V 282388 262353 -7.09 222752 -15.09
VI 298573 313638 5.05 253285 -19.24
VII 481828 505358 4.88 534562 5.78
VIII 315572 296663 -5.99 252457 -14.90
IX 374894 364354 -2.81 341767 -6.20
X 399915 406935 1.76 389059 -4.39
XI 165011 201040 21.83 235872 17.33
XII 157880 222145 40.70 304845 37.23
XIII 219890 247093 12.37 244417 -1.08
XIV 237678 296044 24.56 310508 4.89
XV 226183 274706 21.45 277873 1.15
Total 4385176 4572876 4.28 4484484 -1.93

Volume 1 The Urban Service Plan
10

Volume 1 The Urban Service Plan
11
Apparently the population densities in the central city have reached a level of saturation and people are moving out to settle in the urban fringes. Decreasing household sizes further contribute to the population decline because the number of people per dwelling unit declines. In the central wards population densities also decrease because of conversion of residential land in more commercial land uses. In contrast, most of the outer KMC boroughs still experience high population growth. This shows that behind the overall trend of stagnation of population growth in KMC, the detailed picture by ward and borough reveals a much more dynamic growth pattern. The average household size in KMC decreased from 5.14 in the year 1991 to 4.92 in year 2001 in line with the national trend for urban areas. The 2011 Census data are not yet available, but it is likely that the decrease of average household sizes will continue. The largest households are found in the central parts of the KMC. The Census defines households as a group of people sharing a living space and having a common cooking place. Large households, especially in the city centre, often consist of people sharing an apartment but not necessarily forming a family. Central city boroughs II, IV, V, VI, VII and IX all have above average household sizes, indicating cramped living conditions in these already congested areas. The wards on the outskirts of the KMC still experience population growth and increasing densities. However, with the exception of the slum areas near the River Port in Borough XV most of the outer wards still have densities much lower than the central city and therefore these outer wards still have potential to accommodate more people. Typically the outer wards of KMC have average densities ranging between 15,000 and 30,000 people per km2 as illustrated in the following figure.

Volume 1 The Urban Service Plan
12
The above figure also illustrates the uneven distribution of male and female citizens over the city area. The 2011 KMC population consists of 52.7% men and 47.3% women. The overall KMC gender ratio (number of females per 1000 males) is 899 in 2011 up from 829 in 2001. However, in the centre of town the gender ratio is much lower compared to the outskirts. In the central areas many single young men, mostly migrant workers, live in shared apartments. The outer areas are typically inhabited by families with children. As a result the central city boroughs IV and V house less than 750 women per 1000 men, but most of the outer wards have gender ratios well above 900. In borough X the number of women even exceeds the number of men. Decreasing population densities, declining household sizes and increasing gender ratios as recorded since the 1991 Census, indicate that the living conditions in Kolkata are steadily improving. Nevertheless, a large number of city dwellers live in slums. A 2009 survey has identified 5,511 slums in KMC with an average population of approximately 270 people per slum. This illustrates that in KMC slums are in general not very big but there are very many small slums scattered over the urban area. Since the 1991 Census the percentage of KMC population living in slums is more or less constant at 32% of the entire population. According to the 2001 Census a total number of 1,485,309 people lived in slums, which is 32.5% of the total population. This does not mean that people are doomed to spend their entire lives in a slum. There is surely a certain degree of social mobility. Many slum dwellers climb the social ladder and move to formal housing areas, but their place in the slum is taken by migrants who come from the countryside to try their luck in the big city. The following tables summarize some of the main population characteristics and trends as described in this section. Table: KMC Baseline population characteristics 2011 Borough Population Density in
people/km2
Slum population
Households Household size
Gender Ratio
I 306407 32016 143231 68171 4.49 923
II 202567 61934 55040 44086 4.59 880
III 365008 38748 229259 80014 4.56 930
IV 243105 72478 71166 47109 5.16 736
V 222752 41821 50346 37107 6.00 622
VI 253285 45546 44384 44859 5.65 833
VII 534562 20644 428455 100005 5.35 895
VIII 252457 25509 43206 58049 4.35 927
IX 341767 17596 154716 66965 5.10 861
X 389059 24763 59042 100161 3.88 1003
XI 235872 19012 0 62660 3.76 990
XII 304845 14566 4423 83928 3.63 975
XIII 244417 20159 11397 59376 4.12 983
XIV 310508 16254 4679 79816 3.89 993
XV 277.873 31026 167.805 39.958 6.95 893
Total 4,484,484 24783 1,467,149 972,264 4.61 923

Volume 1 The Urban Service Plan
13
Table: Summary population trends KMC 2001 - 2011 2001 2011 Population 4,572,876 4,484,484Pop. growth rate previous ten years + 4.28% - 1.93%Households 929,586 972,264Household size 4.92 4.61Average density (people/km2) 25,272 24,783Highest density (in 2001 ward 39; in 2011 ward 23) 140,272 110,495Slum population 32% 32%Gender ratio 829 899
6.3 Population projection
Before the latest annexations in January 1984, KMC consisted of 10 boroughs subdivided in 100 wards. After annexation, the added areas were subdivided in 5 boroughs and 41 wards making the current total of 15 boroughs and 141 wards. This boundary change makes it difficult to compare KMC Census data before and after 1984. Therefore, the population projections are based on analysis of the 1991 and 2001 Census data and provisional 2011 Census results. The boundaries of the 141 wards have not changed since 1984. However, the boundaries of the boroughs have been changed quite frequently by shifting wards between boroughs. The latest changes in borough boundaries were made in August 2010. This makes it also difficult to analyse population data on the borough level. Therefore the population analysis and projections have been based on the ward level data and accumulated to the borough level by using the same borough boundaries throughout the years as is also done by the Census. Note that the actual current borough boundaries are somewhat different. Methods of population projection are many, such as: • Compound Growth Rate Method. • Arithmetical Projection Method. • Incremental Increase Method. • Geometrical Increase Method. • Exponential Growth Rate Method Incremental and exponential growth models are mainly used for young and fast growing cities with almost no constraints for growth which is not applicable for KMC. Arithmetical projection is mainly used for well-established old cities with limited growth potential and mostly saturated in population density which is also not true for KMC. Geometrical methods are applicable for cities with relatively large in-migration as compared to natural growth and high growth potential combined with limited constraints for development. This method might be used for KMC. However, the compound growth rate method, applied at the ward level is deemed most appropriate for KMC, because the growth pattern is very diverse within the city. Some wards show stabilization or negative growth because of saturation, and other wards still have a high growth potential with relatively limited constraints. The inter-census population growth data for 1991-2001 and 2001-2011 respectively show a relatively constant trend on the ward level. Wards that experience declining growth in the period 1991-2001 mostly continue the

Volume 1 The Urban Service Plan
14
downward growth trend in the period 2001-2011. For quite a lot of wards this trend results in negative growth during the last inter-census period. Wards with high growth potential, mostly in the outer KMC areas, continue to grow throughout the entire period 1991-2011, but growth rates are in general slowing down over the years because these wards started with very limited population in 1991 meaning that growth percentages initially were very high but now that these areas also have a substantial population base, the growth in absolute terms continues at the same high levels, but the growth percentages decline. In other wards that have grown relatively fast in the past, growth is slowing down because of physical limitations such as availability of developable land. Some of the outer wards on the other hand still have a very large growth potential because constraints that have hampered development until now are expected to be removed in the future for instance by provision of infrastructure, by draining swampy marsh land, etc. The compound growth method applied at the ward level captures this large variety in growth dynamics best. The compound growth method, applied at the ward level, results in a projected population of 4,560,887 people in KMC in year 2022, meaning a limited growth of 76,400 people (+1.70%%) as compared to the 2011 population. The projection is summarized in the table below. As might be expected, the population in the outer boroughs especially boroughs XI and XII would increase substantially over the next ten years and the population in large parts of the core city area would decrease. Table: Population projection by borough
Borough 2011 2017 2022 Growth rate 2011-2022
I 306407 296552 289216 -5,61
II 202567 185138 172143 -15,02
III 365008 380012 393210 7,73
IV 243105 225812 213218 -12,29
V 222752 204883 192477 -13,59
VI 253285 224827 204479 -19,27
VII 534562 559101 584265 9,30
VIII 252457 231213 215828 -14,51
IX 341767 330013 321143 -6,03
X 389059 382038 378286 -2,77
XI 235872 260525 283605 20,24
XII 304845 375367 450856 47,90
XIII 244417 244244 244901 0,20
XIV 310508 320841 330473 6,43
XV 277.873 281.971 286.791 3,21
Total 4.484.484 4.502.540 4.560.887 1,70
It should be noted that projections always have a degree of uncertainty. Projections are based on past trends and past development. However, the future may hold unexpected new economical, technological or social developments that may change the growth perspective. For the long term this uncertainty is bigger than for the short term. Aggregate data, such as projections for the entire KMC area or for the boroughs, will also be more accurate than disaggregated data for small areas such as wards. Therefore, the projections made for the period until 2022 are to be

Volume 1 The Urban Service Plan
15
considered as fairly realistic on the KMC level and the borough level. Disaggregate 2022 projections on the ward level will be less accurate. Projections up to year 2042 have a high degree of uncertainty and should be seen as a long term development scenario that can serve to test investment proposal. The table below presents the main population projections and characteristics for year 2017 and 2022 and for base year 2011. The annexes to this report present detailed projections per ward and for the longer term up to year 2042 in five year intervals.

Volume 1 The Urban Service Plan
16
Table: population characteristics 2011 - 2017 - 2022
Bor
ough
s
2011 2017 2022 P
opu
latio
n
Den
sity
in
peo
ple/
km2
Slu
m p
op.
Hou
seho
lds
Hou
seho
ld
size
Pop
ula
tion
Den
sity
in
peo
ple/
km2
Slu
m p
op.
Hou
seho
lds
Hou
seho
ld
size
Pop
ula
tion
Den
sity
in
peo
ple/
km2
Slu
m p
op.
Hou
seho
lds
Hou
seho
ld
size
I 306407 32016 143231 68171 4.49 296552 30987 138504 69417 4.27 289216 30220 135004 70815 4.08
II 202567 61934 55040 44086 4.59 185138 56605 50194 42929 4.31 172143 52632 46557 42374 4,06
III 365008 38748 229259 80014 4.56 380012 40341 240148 86000 4.42 393210 41742 249836 91389 4.30
IV 243105 72478 71166 47109 5.16 225812 67322 67435 45628 4.95 213218 63568 64703 44649 4.78
V 222752 41821 50346 37107 6.00 204883 38466 48433 33210 6.17 192477 36137 47152 30477 6.32
VI 253285 45546 44384 44859 5.65 224827 40429 39340 40132 5.60 204479 36770 35750 36799 5.56
VII 534562 20644 428455 100005 5.35 559101 21592 448073 104544 5.35 584265 22564 468097 109570 5.33
VIII 252457 25509 43206 58049 4.35 231213 23362 40278 55010 4.20 215828 21808 38063 52845 4.08
IX 341767 17596 154716 66965 5.10 330013 16991 151046 64066 5.15 321143 16535 148264 61847 5.19
X 389059 24763 59042 100161 3.88 382038 24316 55591 105726 3.61 378286 24077 53025 111470 3.39
XI 235872 19012 0 62660 3.76 260525 20999 0 74299 3.51 283605 22859 0 85774 3.31
XII 304845 14566 4423 83928 3.63 375367 17936 6059 112785 3.33 450856 21543 7875 145952 3.09
XIII 244417 20159 11397 59376 4.12 244244 20144 10806 62744 3.89 244901 20199 10457 66091 3.71
XIV 310508 16254 4679 79816 3.89 320841 16795 4556 87399 3.67 330473 17300 4458 94617 3.49
XV 277.873 31026 167.805 39.958 6.95 281.971 31.483 168.780 39.725 7.10 286.791 32.022 170.165 39.999 7.17
Total 4,484,484 24783 1,467,149 972,264 4.61 4,502,540 24,883 1,469,243 1,023,612 4.40 4,560,887 25,206 1,479,406 1,084,668 4.20

Volume 1 The Urban Service Plan
17
7 KMC Urban service provision benchmarking
7.1 KMC 2011 baseline benchmark summary status
The Hand Book of Service Level Benchmarking of the Ministry of Urban Development, Government of India, defines national benchmark targets for urban service provision. The 2011 status of the overall level of KMC service provision in the various sub-sectors as compared to the major national benchmarks is summarized in the tables overleaf. A detailed description of current and targeted service levels by subsector is provided in the subsequent chapters 8, 9 and 10. Overall it appears that KMC still has a long way to go to arrive at the national service level targets. However, compared to the national averages (as far as available) KMC compares in general positive. For some of the benchmarks there is a big difference in service levels within the KMC area. The water supply service level is distinctly different for the various water supply zones, respectively supplied from Palta, Garden Reach, Jorabagan and Watgaunge Water Treatment Plants or by ground water supply. The sewerage and drainage service level in the central city area is distinctly different from the service quality in the outer areas. Therefore the tables overleaf present a breakdown by service area for each of the major sub-sector service level indicators.
Volume 1 The Urban Service Plan
18
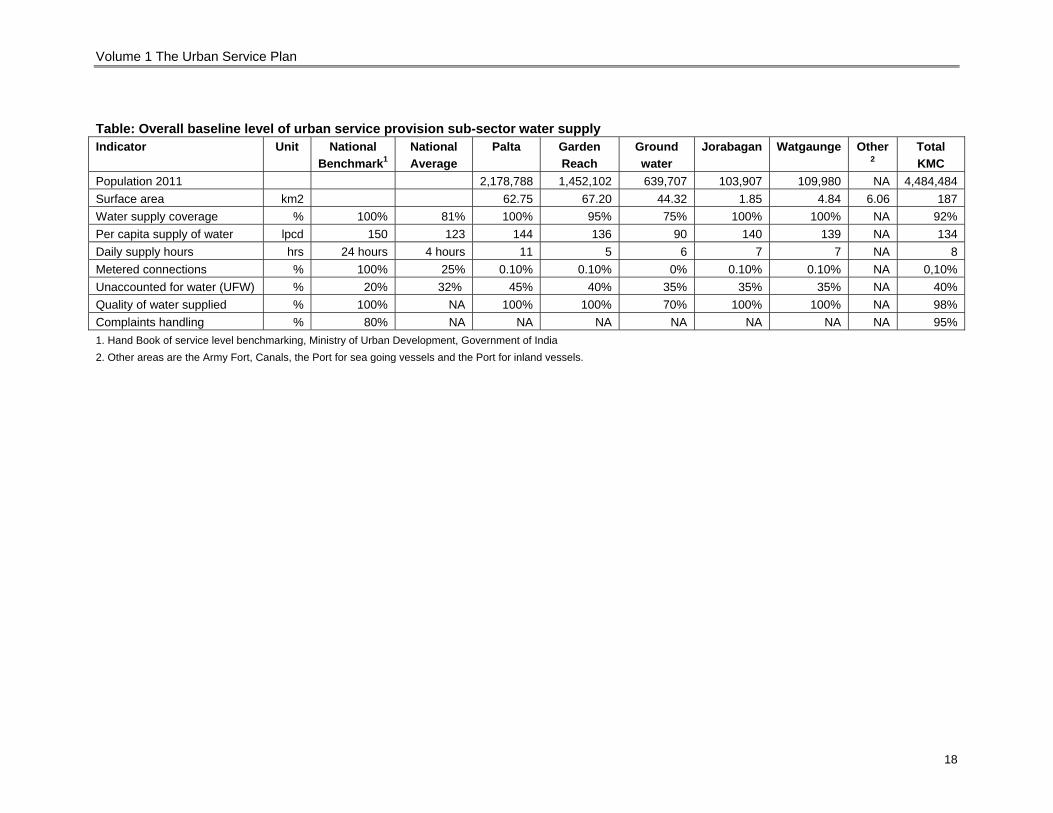
Table: Overall baseline level of urban service provision sub-sector water supply Indicator Unit National
Benchmark1
National
Average
Palta Garden
Reach
Ground
water
Jorabagan Watgaunge Other 2
Total
KMC
Population 2011 2,178,788 1,452,102 639,707 103,907 109,980 NA 4,484,484
Surface area km2 62.75 67.20 44.32 1.85 4.84 6.06 187
Water supply coverage % 100% 81% 100% 95% 75% 100% 100% NA 92%
Per capita supply of water lpcd 150 123 144 136 90 140 139 NA 134
Daily supply hours hrs 24 hours 4 hours 11 5 6 7 7 NA 8
Metered connections % 100% 25% 0.10% 0.10% 0% 0.10% 0.10% NA 0,10%
Unaccounted for water (UFW) % 20% 32% 45% 40% 35% 35% 35% NA 40%
Quality of water supplied % 100% NA 100% 100% 70% 100% 100% NA 98%
Complaints handling % 80% NA NA NA NA NA NA NA 95%
1. Hand Book of service level benchmarking, Ministry of Urban Development, Government of India
2. Other areas are the Army Fort, Canals, the Port for sea going vessels and the Port for inland vessels.

Volume 1 The Urban Service Plan
19
Table: Overall baseline level of urban service provision sub-sectors sewerage, drainage and solid waste Bench Mark Details Unit National
Benchmark1 National Average
Core City Area Outer Area under KEIP
Phase 1
Other Outer Areas
Total KMC
Population 2011 2,490,245 1,494,240 499,999 4,484,484Surface area Km2 85 65 37 187Sewerage sub-sector Sewerage Coverage % 100% 28% 75% 22% 0% 44%Population with Toilets % 100% 82% 98% 94% 90% 96%Sewage collection efficiency % 100% NA 90% 90% 0% 71%Sewage treatment capacity % 100% NA 100% 100% 0% 88%Sewage treatment quality % 100% NA 100% 100% NA 100%Extent of re-use/recycling % 20% NA 100% 95% 0% 93%Complaints handling % 80% NA NA NA NA 65%Drainage sub-sector Drainage coverage % 100% 53% 100% 100% 0% 80%Water logging/year 0 NA <12 <6 >12 >6Solid Waste sub-sector Door-to-door collection % 100% 51% 80% 70% 60% 75%Collection efficiency % 100% NA 98% 96% 95% 97%Waste segregation % 100% NA 5% 3% 1% 4%Waste recovery % 80% NA 22% 20% 15% 20%Scientific solid waste disposal % 100% 2% 0% 0% 0% 0%Complaints handling % 80% NA NA NA NA 54%1. Hand Book of service level benchmarking, Ministry of Urban Development; Government of India

Volume 1 The Urban Service Plan
20
7.2 Water supply sub-sector benchmark status
7.2.1 Water supply main system characteristics
The existing water supply system in Kolkata city is very old. It was commissioned during the British period and is under operation since 1865. Over the years, the system was extended and augmented in stages to meet the increasing urbanization and related water demand. The water supply system consists of 4 water treatment plants using surface water from the Hooghly River as raw water source, transmission, storage and distribution to different parts of the city. A part of the city is served by abstraction of ground water by several tube wells. There are 2 major water treatment plants. Palta Water Treatment Plant serves most the northern and central boroughs and Garden Reach Water Treatment Plant serves most of the southern boroughs. Two smaller plants Jorabagan and Watgaunge, both serve a limited number of wards in the western KMC area near the Hooghly River. About 10% of supply is from ground water. The table below summarizes the main features by supply zone and the figure shows the location of the various supply zones.
Figure: Existing Water Supply Service Zones Table: water supply zones main features Service area Water Works Source Area coverage Population coverage
1 Palta Indira Gandhi WTP Surface water 62.75 km2 2,178,788
2 Garden Reach Garden Reach WTP Surface water 67.20 km2 1,452,102
3 Jorabagan Jorabagan WTP Surface water 1.85 km2 103,907
4 Watgaunge Watgaunge WTP Surface water 4.84 km2 109,980
5 Groundwater Ground water 44.32 km2 639,707
TOTAL 181 km2 4,484,484

Volume 1 The Urban Service Plan
21
7.2.2 Water supply baseline service levels as compared to benchmarks
Water supply coverage The municipal piped water supply system covers almost 92% of the KMC population and has consistently been extended over the years. The current coverage is higher than the national average of 81% but 8% short of the 100% national target benchmark. The remaining 8% is currently served by groundwater supply from individual in-house tube wells or by water tanker truck supply. Most of the groundwater supply zone is near the periphery of the KMC area, and far from the surface water source and therefore relatively difficult to service by the piped supply network. Per capita supply of water Water supplied at the consumer end in KMC is currently 599 MLD per day in total. There is shortage of water at the consumer end, the main reason being lack of operational water treatment capacity, transmission capacity and inadequacies in the distribution system. Present average per capita supply for the entire KMC area is 134 liter per capita per day (lpcd), which is more than the national average of 123 lpcd and nearing to national benchmark supply level of 150 lpcd for metropolitan cities. However, the supply is very uneven, ranging from 90 lpcd in the groundwater supply zone to 144 lpcd in the Palta Supply area. But even within each of the supply areas there are big differences in distribution of water. In general areas near the main distribution reservoirs receive more water per day than supply areas further down the line. Due to this uneven distribution some areas receive a per capita supply as high as 310 lpcd and some areas receive only 40 lpcd. Daily supply hours The average daily water supply period in KMC is 8 hours and is intermittent. Supply hours are different for the various supply zones, ranging from an average of 5 hours per day in the Garden Reach supply zone to an average of 11 hours daily supply in the Palta service area. Supply hours within each of the supply zones also show huge variations. The overall average of 8 hours daily supply in KMC is above the national average of 4 hours per day but far below the national target benchmark of 24 hours uninterrupted supply. A private household reservoir (such as a rooftop tank) is compulsory as per KMC rules. Hence, the national benchmark target service level of 24 hours supply is effectively achieved by KMC rules demanding consumer to construct a private reservoir with sufficient storage capacity for 24 hours demand. Metered connections Bulk water is supplied to commercial and institutional units and also to domestic apartment blocks. Bulk water supply connections are all metered. None of the domestic connections in KMC is currently metered. This means that the total number of metered connections is less than 1% which is far below the national average of 20%. Unaccounted for water (UFW) Presently there is no monitoring system of unaccounted for water (UFW). KMC estimates that UFW is currently around 35%. In a report of UFW Study conducted by KMC in the year 2003 through French consultants, UFW was found to be 40.7%. In another study as per Water for Indian cities: Government Practices and Policy concern 2010, based on 62 wards of KMC, UFW is 42%. As per a World Bank report, system loss (as part of overall UFW) was estimated to be 35% in Kolkata. Hence, UFW is assumed to be 40% which is double the national average of 20%. Quality of water supplied The groundwater quality is a serious cause of concern because in some locations it is found to be affected by arsenic. The quality of treated surface water supplied fully complies (100%) with

Volume 1 The Urban Service Plan
22
government standards and the national benchmark. However, at the consumer end loss of quality is likely because of intrusion of contamination in the system due to limited supply hours and pressure loss in the system, combined with widespread use of private water storage (rooftop) tanks. Complaints handling Efficiency in redressing customer complaints is facilitated by the KMC e-governance initiative which is operational since 2010. Records and handling times are improving as a result. Currently it is estimated that 95% of complaints received about the water supply service are satisfactorily redressed within 24 hours, which is above the national benchmark target of 80%.
7.3 Sewerage and drainage sub-sector benchmark status
7.3.1 Sewerage and drainage main system characteristics
An organized underground sewer network was first introduced in Kolkata in 1859 covering the core city areas located to the north of Dharmatala Street (presently Lenin Sarani) and west of Upper Circular Road (today’s Acharya Prafulla Chandra Roy Road), south of Circular Canal (Maratha ditch) and east of Hooghly River. The area coverage of the underground drainage system at that time was 19 sq km. Subsequently, the areas located to the west of Upper Circular Road were also covered with an underground drainage network. Development of an underground drainage network for southerly areas was undertaken at the end of 19th century. During the second quarter of the 20th century, the eastern part of the city, known as Manicktala area was sewered. The sewers constructed then were mostly egg-shaped and of brick masonry construction. Up to the present day, sewers constructed in that period are serving as the trunk mains for the city. This underground sewer system nowadays covers the entire centre of the city (boroughs II-X) with a surface area of 85km2. With progress of time, area coverage under Kolkata Municipal Corporation has increased. The last municipal boundary change was in January 1984 when boroughs XI-XV were annexed. These large annexed areas were until recently in general devoid of an organized underground drainage network. Wherever underground sewers existed, they were mostly of inadequate carrying capacity. Areas without underground drainage facilities are normally covered by a septic tank arrangement, with effluent discharged to surface drains. The ongoing KEIP Phase 1 project has constructed a combined sewer/drainage network in a large part (65 km2) of these outer areas (boroughs I and XI-XV). However, 37km2 of the KMC outer areas has not yet been provided with proper drainage/sewerage. The figure below shows the extent of coverage of the central city system (white areas) the coverage of KEIP Phase 1 (brown areas) and the KMC areas which are still devoid of an underground sewer system (green areas).

Volume 1 The Urban Service Plan
23
The entire KMC area may broadly be divided into two river catchments: the Hooghly River system and the Kulti River system. Although the Hooghly River is flowing along the entire western boundary of the city, the natural gradient of the city is east meaning that storm runoff from only a small portion of the city discharges to the River Hooghly. Overall approximately 90% of the KMC area drains to the East Kolkata Wetlands and the Kulti River system and 10% drains to the Hoogly River.
The KMC can be subdivided into nine major drainage basins viz. Kolkata Basin, Manicktala Basin, Tolly’s Nullah basin, Topsia - Tangra Basin, Hooghly Basin, Bagjola Basin, Tollygunge - Panchannagram (TP) Basin, Monikhali Basin and Churial Basin. The major drainage basins are shown in the figure overleaf.

Volume 1 The Urban Service Plan
24
Kolkata Municipal Corporation has a combined sewerage and drainage system. Both the wastewater from residential and commercial establishments and rainwater flows into the same network of underground pipes. During the dry season the sewer network carries wastewater only. The wastewater flows to sewage pumping stations from where it is pumped to the fringes of the town. Most of the wastewater that is collected in this way (about 90%) receives no formal treatment and is pumped into dedicated channels that lead into the East Kolkata Wetlands (EKW). Here the wastewater is used as feeding material in fish farms that cover an area of approximately 4000 hectares. These fish farms effectively function as waste stabilization ponds. After passing through the EKW the water flows to outfall channels that end up in the Kulti River. The remaining 10% of the city’s wastewater is pumped into three sewage treatment plants: Bangur STP in the north, South-Suburban East STP in the south and Garden Reach STP in the west. Here the wastewater is treated before it is disposed in large drainage canals and on into the Hoogly River. During periods of rains the sewer network also carries storm water. Normally this mix of wastewater and rain water is pumped to the same fish ponds and the three treatment plants. However, at times of heavy rainfall the sewage pumping stations are too small to handle the large flows. Because, at such instances, the wastewater is very much diluted (about 90% to 95% of the mix is rainwater) it is allowed to flow into storm water canals without treatment. There are two types of provisions. Firstly, there are large storm water pumping stations at a few strategic locations, such as at Ballygunge, Palmar Bazar and Dhapa Lock. Secondly, at many locations along the banks of the drainage canals, there are gravity outfalls. During periods of heavy and prolonged rain the sewer networks fill up with water. The gravity outfalls are designed in such a manner that the water can overflow from the sewer network into the canals before the water can spill into the streets. The figure overleaf shows the main features of the Kolkata sewerage and drainage system.

Volume 1 The Urban Service Plan
25

Volume 1 The Urban Service Plan
26
7.3.2 Sewerage and drainage baseline service levels as compared to benchmarks
Sewerage coverage The Hand Book of service level benchmarking of the Ministry of Urban Development defines sewerage coverage as the total number of properties with direct connection to an underground sewer network as compared to the total number of properties. This definition excludes all people that use a communal toilet facility such as in slum areas. It also excludes all properties where sewage is discharged into surface drains that are connected to a collector sewer and a sewage treatment facility. The latter two categories are substantial in KMC. In the core city area all properties, except the slums, are directly connected to the underground sewer network, meaning a total number of 358,750 households directly connected which is equivalent to 75% of all households in the core city area. The slum areas are in general served by communal toilets connected to septic tanks. In the outer areas served by KEIP Phase 1 a total number of 70,000 house connections would be constructed once the project is finalized in June 2012. This means a coverage of 22% of the total population in the KEIP Phase 1 areas. In the outer areas not yet served house connections to underground sewers don’t exist by lack of any underground sewer system, meaning 0% coverage. This brings the average total for the entire KMC area at 44% as compared to the national target level of 100% but nevertheless it is way above the national average of 28%. Population with Toilets According to the 2001 Census 96% of the KMC population has access to individual or community toilets within walking distance in the service area. This compares favorably with the national average of 82% and is near the national benchmark of 100%. Most of the KMC slum areas are provided with communal toilet facilities within walking distance. Only 4% of the KMC population has no sanitation facilities and uses gutters, open drains, channels or vacant land for sanitation. This is mostly in the urban fringe areas where population densities are still relatively low. The 2011 Census results in this respect are not yet available but it is likely that the percentage of the population without toilets would further decrease over the years. Sewage collection efficiency The collection efficiency of sewage is 71%, which is higher than the percentage of people with direct sewer connections because it also includes sewage collected through the interceptor sewer system. The collection efficiency is around 90% in the core city area as well as in the KEIP Phase 1 areas. The remaining outer areas have no formal sewer system yet and collection is zero. Sewage treatment capacity The treatment capacity of the existing treatment plants and the East Kolkata Wetlands (EKW) is sufficient to serve the entire central city (100%) and the KEIP Phase 1 areas (100%). The total average for KMC is 88% because the outer areas not yet served by KEIP Phase 1 generate 12% of the waste water for the entire KMC. Sewage treatment quality The effluent quality at the outlets of the East Kolkata Wetlands and the existing treatment plants fully comply with national norms. Extent of re-use/recycling The extent of re-use is very high because 90% of all sewage from KMC ends up in the fisheries of the EKW where it serves as quality food for the fisheries. Effluent from other treatment facilities is partially

Volume 1 The Urban Service Plan
27
re-used for agricultural purposes before it finally discharges into the Hooghly River. On average 93% of waste water generated in KMC is re-used, comparing very favourable to the national target of 20%. Complaints handling KMC daily receives around 7-10 complaints concerning the sewer system and approximately 65% is redressed within 24 hours. Since 2010 KMC uses an e-complaint handling system as part of the e-governance drive facilitating proper recording and handling of complaints. Drainage coverage The storm water drainage network in KMC covers 100% of the central city area of 85km2 and 100% of the added areas is covered by KEIP Phase 1 (65km2). The total KMC surface area is 187km2, meaning that overall coverage of the drainage network now extends to 80% of the KMC (150km2 out of 187km2). This compares favourably to the national average coverage of 53% but is still 20% short of the national target of 100% storm water drainage coverage. Water logging incidents per year Although the sewerage and drainage system has adequate capacity to convey the dry weather flow, it does not have enough capacity to handle storm flows. A Sewerage and Drainage Master Plan for the entire Kolkata Municipal Corporation (KMC) area was prepared under KEIP Phase 1 in 2007 to identify and quantify deficiencies and develop solutions for the short, medium and long term. The S&D Master Plan provides an adequate basis for future planning and presents exhaustive background information, technical details and calculations. The Sewerage and Drainage Master Plan design rainfall intensity is a two months storm frequency interval, meaning that on average localised flooding of 6 times per year is accepted. However, in reality flooding occurs more often and is widespread during the monsoon season. According to the S&D Master Plan the actual capacity of the central city storm water drainage network is only 50% of its design capacity due to siltation of sewers and reduced operational pumping capacity because of ageing pumping equipment. As a consequence the actual number of water logging incidents is more than the design capacity of 6 times per year in flood prone locations in the city centre. The outer areas covered under KEIP Phase 1 have also been designed at a 2 months storm frequency interval. From June 2012 the system would fully operate in accordance with its design capacity, meaning that localized flooding should not occur more than 6 times per year in these areas. The outer areas not yet served experience more than 12 times localized flooding per year due to the total absence of any formal drainage system. This brings the total average for the entire KMC area at more than 6 times per year of localized flooding. This is more than the national target benchmark of zero incidents. However, this national target is unrealistically high for the KMC situation, because it would require huge investments to increase the capacity of the entire storm water drainage system, including sewer mains, pumping stations, retention basins and outfall channels to upgrade the design standard accordingly.
7.4 Solid Waste Management sub-sector benchmark status
7.4.1 Solid Waste Management main system characteristics
The solid waste management system consists of three main components: • Collection • Transportation • Disposal

Volume 1 The Urban Service Plan
28
Collection system The majority (90%) of collection is done by KMC and 10% is contracted out to private contractors. House-to-house (doorstep) collection has been introduced in 75% of the KMC area. Other areas are served by street sweepers who operate manually. Many roads are too narrow to allow access for motorized collection vehicles. Primary collection is mostly by open hand carts and delivery at secondary collection sites (vats). There are 694 such collection points – 392 open vats and 302 bulk containers or direct loading. Open vats are generally poorly managed with spillage of disposed waste from the bulk containers or from open vat boundaries creating in most cases an unhygienic environment. In 2011 source segregation has been introduced as a pilot project in 7 wards. Transportation system From secondary collection sites the waste is transported in trucks to the final disposal site. KMC transports 30% of waste, while 70% of solid waste transportation is contracted out to the private sector. Private contractors mostly use open trucks with a tarpaulin covering the waste. They make about 600 trips per day carrying an average of about 5.5 MT per trip. The remaining 30% of the total collected waste is transported by municipal vehicles making about 315 daily trips carrying on average about 3.5-4.9 MT per trip. KMC has 125 tipper trucks and 137 dumper placers, 15 tractor trailers, 17 wheel loaders and 12 mechanical sweepers, 32 street sweeping/washing vehicles and 8 wrecker vans daily in operation. KMC has eight garages where transportation vehicles are stationed. Major vat points that accommodate garbage more than 30 MT are serviced from Dhapa garage with Pay loaders and 11 m3 capacity Tipper Trucks. Other vats are serviced by manual loading vehicles and Dumper placers. The street washing vehicles clean major thoroughfares every day. Three of the refuse collector vehicles are engaged for cleaning wastes from 300 trash bins along sixteen major roads. Disposal KMC has two waste disposal sites. The Garden Reach dumping ground is a small facility with little remaining capacity. It receives currently about 10 MT/day of waste mainly from borough XV nearby. The main dumping ground is at Dhapa in the east of KMC at approximately 8 km from the city centre. This dump site is nearing its maximum capacity and has been authorized by West Bengal Pollution Control Board to operate for one more year only. It received an average of 4286 MT/day solid waste in 2011 out of which 300 MT/day was diverted to the privately operated Dhapa composting plant.
7.4.2 Solid Waste Management baseline service levels as compared to benchmarks
Door-to-door collection In 2011 75% of the KMC area is served by a door-to-door collection system and 25% by street sweeping. This compares favorably to the national average of 51% but is still far below the 100% benchmark target. In the core city area 80% of the population is served by door-to-door collection. In the outer areas this is less (60% - 70%). Collection frequency also differs. The central city and most of the surrounding outer areas are served daily, but some of the lower density fringe areas are only served once or twice per week. Collection efficiency KMC estimates that only 3% of waste generated is not collected but (illegally) disposed in channels, vacant land and used for infill, meaning that collection efficiency is close to the national benchmark target of 100%.
Volume 1 The Urban Service Plan
29
Waste segregation In 2011 source segregation has been introduced as a pilot project in 7 wards (33, 47, 64, 103, 110, 115 and 130) covering only 4.4 % of the KMC population. Waste recovery Informal segregation takes place at all stages of waste processing. Status baseline 2011 is 13% recycling and 7% composting making a total of 20%. Compared to the national target benchmark of 80% KMC still has a long way to go. In the central city area the level of waste recovery is higher (22%) than in the outer urban areas (15%). Recycling is mainly practiced informally by rag pickers. The privately operated composting plant at Dhapa processes 300 tonnes of biodegradable waste per day, mainly collected from markets. Scientific solid waste disposal The extent of scientific disposal of solid waste is currently zero and should become 100% in accordance with the national benchmark target. Both the Dhapa and the Garden Reach dump site are not operated as sanitary landfill in accordance with national standards. There is no formal leachate treatment, no proper soil cover and informal, unorganized rag pickers operate at the sites. Complaints handling Total number of complaints redressed within 24 hours as percentage of total complaints received currently is 54% as per information received from KMC. This is short of the 80% national benchmark target.

Volume 1 The Urban Service Plan
30
8. Water supply service plan
8.1 Water supply baseline 2011
Water supply baseline service level indicators status 2011 Indicator Status
2011 Remarks
Coverage of water supply
92% Currently the municipal piped water supply system covers around 4,125,000 people, which is almost 92% of the KMC population. The remaining population of approximately 360,000 (=8%) is served by groundwater supply from individual in-house tube wells or by water tanker truck supply and is mainly found in the outer fringe areas.
Per capita water supply
134 lpcd Total water supplied at the consumer end in KMC is 599MLD. Total population is 4,484,484. Per capita supply of water is 599,000,000 / 4,484,484 = 134 lpcd.
Extent of Non-revenue water
40% The extent of non-revenue water is assumed to be around 40% in 2011, but is difficult to estimate because of overall lack of monitoring data. The various supply zones have different levels of technical losses. According to KMC officials main losses are in the distribution system at the yard/house connection level and the public stand posts. Technical loss (or real loss) is estimated at 30% consisting of 12% loss at the connection, 10% loss at public stand posts, 7% loss in distribution mains and 1% loss in transmission mains. The administrative loss (or apparent loss) caused by unauthorized connections, water theft, etc is assumed at 10%.
Continuity of water supplied
8 hrs The average daily water supply period in KMC is 8 hours and is intermittent, typically 4 hours in the morning and 4 hours in the late afternoon. Supply hours are different for the various supply zones, ranging from an average of 5 hours per day in the Garden Reach supply zone to an average of 11 hours daily supply in the Palta service area. Supply hours within each of the supply zones show huge variations. Generally, the areas near the treatment plants and main distribution reservoirs receive more hours of supply, even up to 20 hours a day, and the far end may receive only 4 hours supply per day.
Residual pressure
2.5m Currently the residual pressure varies widely. The average terminal pressure at the consumer end is around 2.5m of water head. In some areas it ranges around 0.5m-1.0m of water head.
Complaint handling
95% KMC records 95% of complaints redressed within 24 hrs and 91% even resolved within 3 hrs
Quality of water supplied
98% The quality of treated surface water supplied fully complies (100%) with government standards. In some areas of KMC the groundwater

Volume 1 The Urban Service Plan
31
quality is a public health risk because sporadic occurrence of Arsenic beyond the permissible limit (0.05mg/l) has been found in ground water in a few locations in KMC. The concentration of arsenic varies from 0.054mg/l to 0.71 mg/l.
Water supply baseline physical assets status 2011 Indicator Status 2011 Remarks Number of water treatment plants
4 Water treatment
plants
There are 2 major water treatment plants. Palta Water Treatment Plant serves most the northern and central boroughs and Garden Reach Water Treatment Plant serves most of the southern boroughs. Two smaller plants Jorabagan and Watgaunge both serve a limited number of wards in the western KMC area near the Hooghly River. About 10% of supply is from ground water (without treatment).
Water production capacity
1900MLD installed and
1374MLD operational
capacity
Palta 1182 MLD installed capacity and 759 operational capacity; Garden Reach 545 resp. 442 MLD; Jorabagan 36 resp. 36; Watgaunge 23 resp. 23; groundwater 114 resp.114 MLD. Total installed capacity is 1182+545+36+23+114=1900 MLD and operational capacity is 759+442+36+23+114=1374 MLD
Tube wells 16,200 Private power driven tube wells There are 5784 power driven tube wells abstracting ground water within the KMC area. These are operated by the industries, institutions, apartment block owners and are in general under private ownership. High-rise apartment buildings for residential purpose have come up particularly in extended areas of the city where the surface water supply is either not available or inadequate. These apartment blocks make their own arrangement for water by sinking tube wells. KMC power driven tube wells In addition there are also 417 big diameter power-driven tube wells operated by KMC. Most of the tube wells are directly connected to local captive grids (that are not connected with the overall city network) of pipelines to supply water in the adjoining areas. In other instances, some of the tube wells are connected with the primary/ secondary grid of the water distribution network. Few large diameter tube wells are operated in the non-supply hours just to maintain a minimum pressure head in the pipelines. The power driven tube wells usually abstract water from the aquifer 400-425 feet below ground level. KMC shallow tubewells (with hand pump) There are about 10,000 small diameter hand operated shallow tube wells in KMC. These are provided by KMC to supplement the stand post supply and also to meet the requirement of the weaker section of the population where there is shortage of piped water

Volume 1 The Urban Service Plan
32
supply. Reservoir capacity
256ML Presently the reservoir capacity of KMC is 255.6 ML (150.6 ML for the Palta system+ 105 ML for Garden Reach).
Water supply distribution pipes
5840km Total length of the water pipe network is 5840km, consisting of 153km transmission pressure mains to reservoirs and pumping stations and 5687km distribution pipes under pressurized flow. Many of the pipes in the central city distribution system are more than 100 years old. Primary grids were laid as early as in the year 1860. The sizes of the mains in the secondary grid vary from 100mm to 200mm in diameter.
Water tanker trucks
24 KMC operates 24 water tanker trucks with an average carrying capacity of 3600 liter. On an average these tankers make about 225 trips a day and supply about 8.1 mld of water per day to various consumers. In addition tanker truck water supply is also available for meeting bulk water requirements on special occasions.
Number of piped connections
255,442 The current number of bulk water connections to commercial, institutional units and also to domestic apartment blocks is 245 plus 8,865 commercial ferrule connections. There are currently 246,332 domestic connections. These connections should be seen as yard connections typically serving many households. The total number of households served is unknown. Total number of piped connections is thus 246,332+8,865+245=255,442
Extent of metering
0.1% Bulk water supply to commercial, institutional units and also to domestic apartments is all metered. The current number of bulk water connections is 245. None of the 246,332 domestic connections in KMC is metered. This means that the total number of metered connections is far less than 1% of connections.
Public stand posts
16,000 There are approx. 16,000 public stand posts mainly serving the urban poor in the slums who cannot afford a connection. One stand post would normally serve a cluster of around 20 households and on top of that stand post are often used by hawkers, taxi drivers and other people who make a living on the road. A considerable portion of the stand post supply is wasted thus contributing to unaccounted for water. Pressure is also very low at the stand posts, ranging from 1.0m to 2.5m.
8.2 Water supply service targets and service gaps
Table: Assumptions water demand Demand category Water demand A. Residential areas 180 lpcdB. Slum areas 90 lpcd

Volume 1 The Urban Service Plan
33
C. Floating population 5 lpcdD. Institution, commerce and industry (ICI) 35% of population demand (A+B)E. Other and firefighting 5% of population demand (A+B) Table: Service plan Kolkata water supply Indicator 2011 2017 2022 GAP 2011 – 2022 1 Population in service area 4,484,484 4,502,540 4,560,887 76,4032 Coverage of water supply 92% 96% 100% 8%3 Per capita water supply supply 134 lpcd 142 lpcd 150 lpcd 16 lpcd4 Extent of Non-revenue water 40% 36% 30% 10%5 Continuity of water supplied 8 hrs 16 hrs 24 hrs 16 hrs6 Residual pressure 2.5m 5.0m 10.0m 7.5m7 Complaint handling 95% 98% 100% 5%8 Quality of water supplied 98% 99% 100% 2% Remarks 1 Population in service area
Based on projected population growth KMC 2011-2022 (refer to previous chapters on population)
2 In year 2022 the entire KMC population should be served with piped water supply as compared to 92% in 2011.
3 Per capita water supply is currently 134 lpcd. The ambitious target for year 2022 set by KMC at 150 lpcd as for large metropolitan areas is feasible and realistic.
4 Reduction of unaccounted for water is essential for system sustainability. An overall reduction of 1% per year is a realistic target for KMC. This will bring the level of UFW down from currently 40% to the national target of 20% by the year 2030. Reduction will mainly be achieved by an integrated UFW reduction program targeting all causes of water losses with sub-targets as follows:
Causes of water loss 2011 2017 2022 House connections 12% 11.5% 11% Stand posts 10% 8.5% 7% Distribution mains 7% 6.5% 6% Transmission mains 1% 1% 0% Sub-total technical (real) loss 30% 27.5% 24% Administrative (apparent) loss 10% 8.5% 6% Grand total unaccounted for water 40% 36% 30%
5 Continuity of water supplied Current supply is only 8 hours per day on average. The distribution system is under full pressure for 8 hours and for 16 hours per day the distribution mains are in unpressurised condition. There is a high chance of infiltration in the system through the leakages, which will lead to contamination. To avoid infiltration the system should be filled with water 24 hours per day with minimum pressure of 7m water column. This would not only reduce the chance of contamination, but also reduce distribution pipe sizes. The target is to achieve 24 hour supply by year 2022.
6 Residual pressure
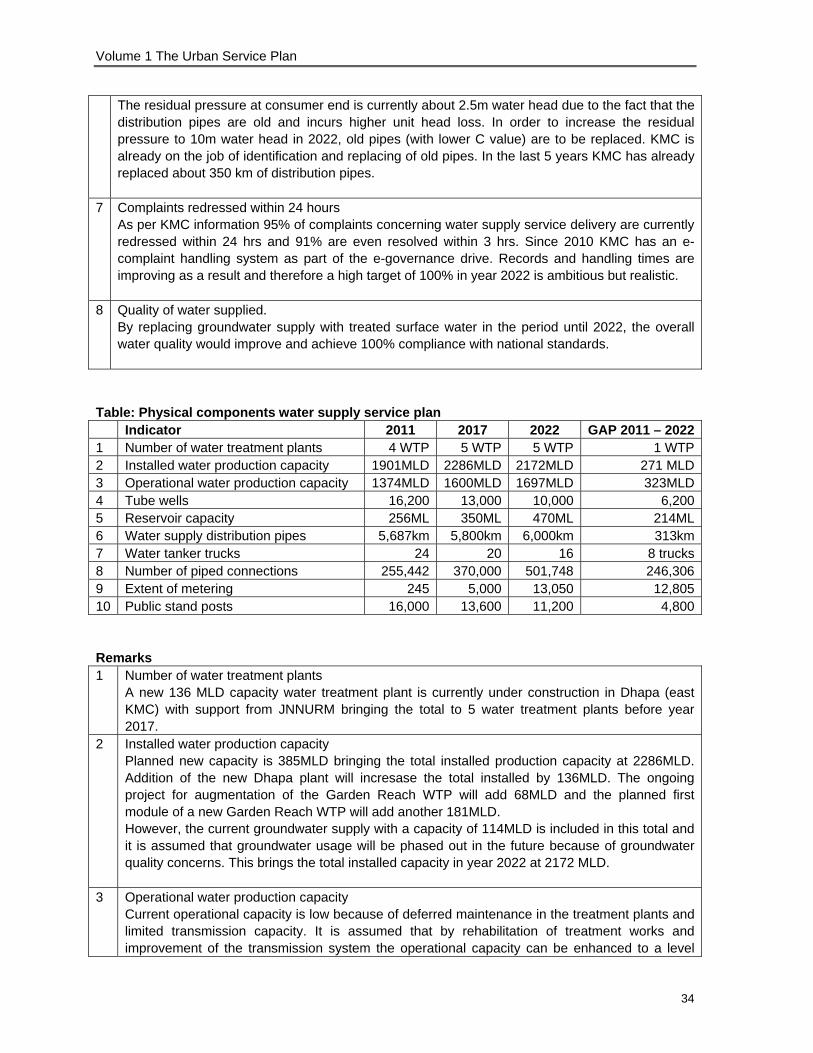
Volume 1 The Urban Service Plan
34
The residual pressure at consumer end is currently about 2.5m water head due to the fact that the distribution pipes are old and incurs higher unit head loss. In order to increase the residual pressure to 10m water head in 2022, old pipes (with lower C value) are to be replaced. KMC is already on the job of identification and replacing of old pipes. In the last 5 years KMC has already replaced about 350 km of distribution pipes.
7 Complaints redressed within 24 hours As per KMC information 95% of complaints concerning water supply service delivery are currently redressed within 24 hrs and 91% are even resolved within 3 hrs. Since 2010 KMC has an e-complaint handling system as part of the e-governance drive. Records and handling times are improving as a result and therefore a high target of 100% in year 2022 is ambitious but realistic.
8 Quality of water supplied. By replacing groundwater supply with treated surface water in the period until 2022, the overall water quality would improve and achieve 100% compliance with national standards.
Table: Physical components water supply service plan Indicator 2011 2017 2022 GAP 2011 – 20221 Number of water treatment plants 4 WTP 5 WTP 5 WTP 1 WTP2 Installed water production capacity 1901MLD 2286MLD 2172MLD 271 MLD3 Operational water production capacity 1374MLD 1600MLD 1697MLD 323MLD4 Tube wells 16,200 13,000 10,000 6,2005 Reservoir capacity 256ML 350ML 470ML 214ML6 Water supply distribution pipes 5,687km 5,800km 6,000km 313km7 Water tanker trucks 24 20 16 8 trucks8 Number of piped connections 255,442 370,000 501,748 246,3069 Extent of metering 245 5,000 13,050 12,80510 Public stand posts 16,000 13,600 11,200 4,800 Remarks 1 Number of water treatment plants
A new 136 MLD capacity water treatment plant is currently under construction in Dhapa (east KMC) with support from JNNURM bringing the total to 5 water treatment plants before year 2017.
2 Installed water production capacity Planned new capacity is 385MLD bringing the total installed production capacity at 2286MLD. Addition of the new Dhapa plant will incresase the total installed by 136MLD. The ongoing project for augmentation of the Garden Reach WTP will add 68MLD and the planned first module of a new Garden Reach WTP will add another 181MLD. However, the current groundwater supply with a capacity of 114MLD is included in this total and it is assumed that groundwater usage will be phased out in the future because of groundwater quality concerns. This brings the total installed capacity in year 2022 at 2172 MLD.
3 Operational water production capacity Current operational capacity is low because of deferred maintenance in the treatment plants and limited transmission capacity. It is assumed that by rehabilitation of treatment works and improvement of the transmission system the operational capacity can be enhanced to a level
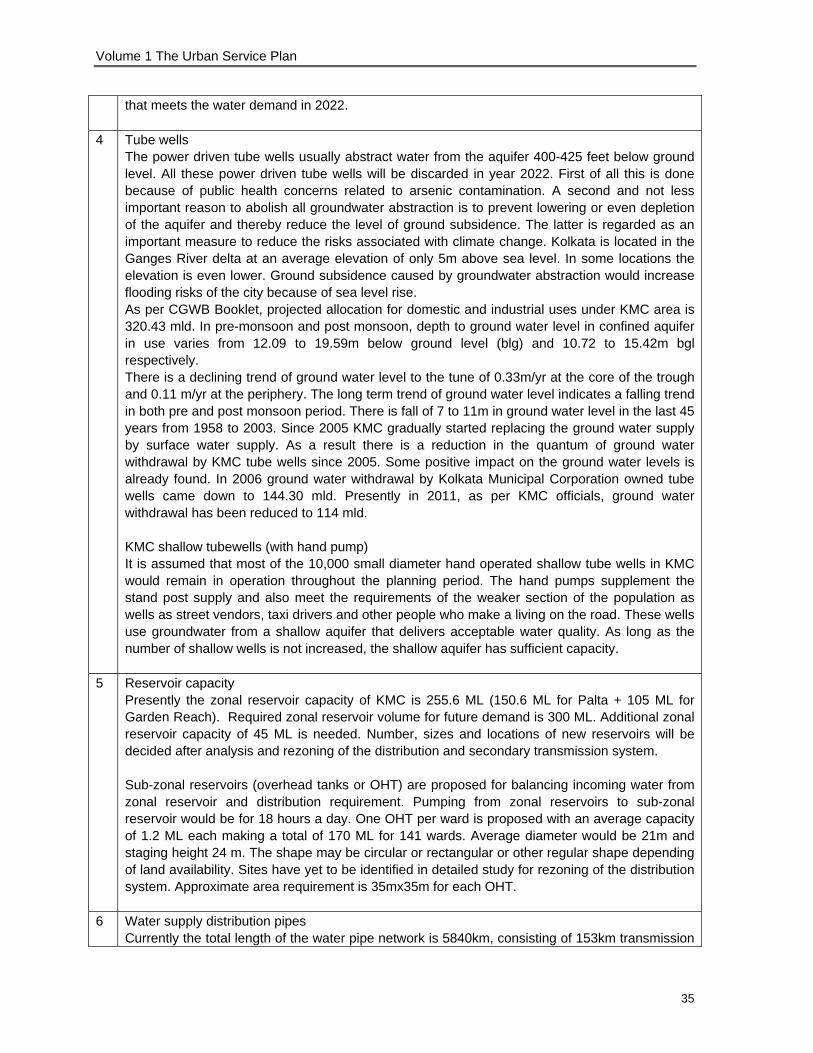
Volume 1 The Urban Service Plan
35
that meets the water demand in 2022.
4 Tube wells The power driven tube wells usually abstract water from the aquifer 400-425 feet below ground level. All these power driven tube wells will be discarded in year 2022. First of all this is done because of public health concerns related to arsenic contamination. A second and not less important reason to abolish all groundwater abstraction is to prevent lowering or even depletion of the aquifer and thereby reduce the level of ground subsidence. The latter is regarded as an important measure to reduce the risks associated with climate change. Kolkata is located in the Ganges River delta at an average elevation of only 5m above sea level. In some locations the elevation is even lower. Ground subsidence caused by groundwater abstraction would increase flooding risks of the city because of sea level rise. As per CGWB Booklet, projected allocation for domestic and industrial uses under KMC area is 320.43 mld. In pre-monsoon and post monsoon, depth to ground water level in confined aquifer in use varies from 12.09 to 19.59m below ground level (blg) and 10.72 to 15.42m bgl respectively. There is a declining trend of ground water level to the tune of 0.33m/yr at the core of the trough and 0.11 m/yr at the periphery. The long term trend of ground water level indicates a falling trend in both pre and post monsoon period. There is fall of 7 to 11m in ground water level in the last 45 years from 1958 to 2003. Since 2005 KMC gradually started replacing the ground water supply by surface water supply. As a result there is a reduction in the quantum of ground water withdrawal by KMC tube wells since 2005. Some positive impact on the ground water levels is already found. In 2006 ground water withdrawal by Kolkata Municipal Corporation owned tube wells came down to 144.30 mld. Presently in 2011, as per KMC officials, ground water withdrawal has been reduced to 114 mld. KMC shallow tubewells (with hand pump) It is assumed that most of the 10,000 small diameter hand operated shallow tube wells in KMC would remain in operation throughout the planning period. The hand pumps supplement the stand post supply and also meet the requirements of the weaker section of the population as wells as street vendors, taxi drivers and other people who make a living on the road. These wells use groundwater from a shallow aquifer that delivers acceptable water quality. As long as the number of shallow wells is not increased, the shallow aquifer has sufficient capacity.
5 Reservoir capacity Presently the zonal reservoir capacity of KMC is 255.6 ML (150.6 ML for Palta + 105 ML for Garden Reach). Required zonal reservoir volume for future demand is 300 ML. Additional zonal reservoir capacity of 45 ML is needed. Number, sizes and locations of new reservoirs will be decided after analysis and rezoning of the distribution and secondary transmission system. Sub-zonal reservoirs (overhead tanks or OHT) are proposed for balancing incoming water from zonal reservoir and distribution requirement. Pumping from zonal reservoirs to sub-zonal reservoir would be for 18 hours a day. One OHT per ward is proposed with an average capacity of 1.2 ML each making a total of 170 ML for 141 wards. Average diameter would be 21m and staging height 24 m. The shape may be circular or rectangular or other regular shape depending of land availability. Sites have yet to be identified in detailed study for rezoning of the distribution system. Approximate area requirement is 35mx35m for each OHT.
6 Water supply distribution pipes Currently the total length of the water pipe network is 5840km, consisting of 153km transmission

Volume 1 The Urban Service Plan
36
pressure mains to reservoirs and pumping stations and 5687km distribution pipes under pressurized supply. The system covers 92% of KMC. For 100% coverage roughly 6000km of distribution pipes would be needed in total in year 2022.
7 Water tanker trucks Currently KMC operates 24 water tanker trucks. It is assumed that the need for water supply by tanker truck will decrease as the coverage of the piped water supply system increases over time. However, a limited fleet of 16 tanker truck in the year 2022 remains needed to supply water for emergencies and for meeting bulk water requirements on special occasions.
8 Number of piped connections Total number of domestic connections is expected to increase from 246,332 in year 2011 to 488,660 in year 2022, meaning an increase of 242,328 house connections. In 2011 the number of bulk connections stands at 245 and this would increase to 2450 bulk connections in 2022. In 2011 there are 8,865 commercial ferrule connections and this would increase to 10,638 by year 2022. The total number of piped connection would thus increase from 246,332 + 245 + 8,865 = 255,442 in year 2011 to 488,660 + 2450 + 10,638 = 501,748 in year 2022.
9 Extent of metering Bulk water is supplied to commercial and institutional units and also to domestic apartments. Connections provided for the purpose is termed as ‘Bulk water connection’. The current number of metered bulk water connections is 245. Apart from these, there are 8,865 unmetered commercial ferrule connections. It is assumed that by 2022 the number of bulk connections with 32mm connection size will be 2450 and the number of commercial connection with 25mm connection size will be 10,600. All bulk and commercial connection are proposed to be metered. Individual house connections are to be metered after 2022.
10 Public stand posts There are 16000 public stand posts within KMC mainly serving the slum population. Water wastage at these public stand posts is high due to uncontrolled flow. In some slum areas, where space is available and people are willing to connect, individual house connections would be provided replacing public stand posts. To further reduce water wastage it is proposed to replace most of these stand posts by over ground reservoirs with multiple controlled outlets by taps. The height of water in the over-ground reservoir shall be limited to 2.5m from ground level, and the height of the outlet tap shall be not more than 1.5m from ground level. This means that with 10m (even 7m) residual pressure, there will be adequate pressure at the outlet taps. Water would be supplied to the over-ground reservoir from the sub-zone reservoir through the distribution network. It is possible to install water meters in the slum connection for measuring of UFW and Water audit. Metering is proposed after year 2022, as a general principle desired by KMC. However, public stand posts would still be needed to serve hawkers, taxi drivers and other people who make a living on the road. It is assumed that the total number of public stand post will be reduced to 11,200 in year 2022.

Volume 1 The Urban Service Plan
37
9. Sewerage and drainage service plan
9.1. Sewerage and drainage baseline 2011
Sewerage baseline service level indicators status 2011 Indicator Status
2011 Remarks
Population with direct connection to underground sewerage network
1,976,593 (= 44%)
In the core city area 358,762 households have direct sewer connections, which is 75% of all households in this area. In the added areas, after completion of KEIP Phase 1, a total number of 70,000hh will have a direct sewer connection, which is 22% of all households in the KEIP Phase 1 area. This will bring the total number of direct connections in the entire KMC area at 358,762+70,000=428,762 households. The average household size in 2011 is 4.61, meaning that the total population with direct connection to the underground sewer network in KMC in 2011 is 1,976,593 people (=428,762x4.61), which is 44% of the total KMC population.
Population in service area (regardless of connection availability)
4,484,484 As per census 2011.
Volume of wastewater collected as percentage of normative waste water generation if/when there is sewerage system
71% In KMC 428,762 households have a direct connection to the underground sewer network. Another 262,258hh have an indirect connection via interceptor sewers. This means that waste water collected from 428,762+262,258=691,020 households will ultimately be discharged through the sewer network. The total number of households in KMC is 972,264, meaning that 71% (=691,020/972,264) of domestic waste water generated is collected in the sewer system.
Treatment capacity available as percentage of normative waste water generation if/when there is sewerage system
88% Total waste water generation in year 2011 is 90% of water supplied to KMC area, which is 90%x1186=1067MLD. Total treatment capacity available is 1120MLD: 154 MLD in the three STPs and 966 MLD is collected and treated by natural treatment in the East Kolkata Wetlands. Total treatment capacity as percentage of waste water generated is thus more than 100%. However, the treatment capacity is unevenly distributed over the KMC area. Treatment capacity is not available to outer areas not yet served by a formal sewer system, especially those areas where natural flow of discharge is not to the EKW but to Hooghly River. These un-served outer areas generate approximately 12% of waste water, meaning that in reality treatment capacity is available for 88% of waste water generation.

Volume 1 The Urban Service Plan
38
Percentage of samples that pass the specified secondary treatment standards if/when there is sewerage system
100% Based on available EKW Water Analysis and STP effluent analysis reports.
Percentage of waste water received at treatment plant that that is recycled or reused if/when there is sewerage system
93% The EKW sewerage discharge (966MLD) is completely reused in the fisheries. Effluent from the other 3 STPs (154MLD) is partly (appr. 50% = 77MLD) reused for agricultural purposes during the dry season. Total percentage reused is 93% =(966 + 77) / (966+154).
Total number of complaints redressed within 24 hours of receipt of complaint as a percentage of total number of complaints if/when redressal system is already instituted
65% As per KMC information daily 7-10 complaints are received and about 5-6 complaints will be redressed (approximately 65%). Since 2010 KMC has an e-complaint handling system as part of the e-governance drive. Records and handling times are already improving as a result.
Sewerage baseline physical assets status 2011 Indicator Status 2011 Remarks Volume of sewerage treatment facilities (MLD)
154 MLD in 3 STP's
and > 966 MLD in EKW
Total treatment capacity at three existing STPs is 154 MLD, after rehabilitation and augmentation by KEIP Phase 1, consisting of Bangur STP 52 MLD (was previously 45MLD), Garden Reach STP 57MLD (was 47.5MLD) and South Suburban East STP 45 MLD (was 30 MLD). Current treatment in East Kolkata Wetlands is 966 MLD but the East Kolkata Wetlands have a large surplus capacity to treat waste water.
Underground sewer network (km)
1778 km According to the S&D Master Plan (2007) the total underground sewer length is 1,400 km. The KEIP Phase 1 has constructed 378 km new underground sewers. The total length of the underground sewer network in 2011 stands at 1,778km (=1,400 + 378).
No. of house holds connected to septic tank
452,764 hh (47%)
Total number of households connected to septic tanks is 452,764 of which final discharge is to surface drain =190,506 hh; final discharge to sewer = 262,258 hh.
No. of house holds connected to underground sewers
691,020 hh ( 71%)
Total number of households in KMC in year 2011 is 972,264. The number of households with direct connection to the underground sewerage network is 428,762 (44%). The number of households with in-direct connection to the underground sewerage network via interceptor sewers 262,258 (27%). Total number of households connected to the sewer system is 691,020 (71%) .

Volume 1 The Urban Service Plan
39
Level of commercial losses through energy audit (if applicable)
Not Applicable Not Applicable
Availability of operation and maintenance manuals
None O&M manuals for sewerage and drainage have been prepared during KEIP Phase 1, but have not yet been formally approved and adopted by KMC.
Drainage baseline service level indicators status 2011 Indicator Status
2011 Remarks
Road length covered by storm water drainage network and total road length
2,736km (=65%)
According to the S&D Master Plan (2007) the total underground sewer length is 1,400 km. The KEIP Phase 1 has constructed 378 km new underground sewers. The total length of the underground sewer network in 2011 stands at 1,778km (=1,400 + 378). In addition existing surface drains in KMC have a total length is 950 Km. The KEIP Phase 1 Slum Improvement Program includes construction of 28 km surface drains of which 20 is widening and 8 km is new drains. This brings the total length of the surface drainage network after completion of KEIP Phase 1 at 958km. The 2011 combined length of the underground and surface drainage network thus stands at 2,736km (=1,778+958). The 2011 total KMC road length is 4,200km (Source: Unit Area Assessment Cell KMC 2011). Total road length covered by the drainage network is 65% (=2,736/4,200).
Population covered under drainage
3,984,485 (= 89%)
Population covered under drainage includes all population in the core city area (=2,490,245 people) and in the KEIP Phase 1 areas (=1,494,240). Total population covered under drainage is 3,984,485 (=2,490,245+1,494,240) which is 89% of the total 2011 KMC population. Total 2011 KMC population is 4,484,484. Population not yet covered in KMC is 500,000 people (=4,484,484-3,984,485).
Areas covered under drainage
80% Total KMC area is 187km2. Area covered under drainage before KEIP Phase 1 was 85km2. KEIP Phase 1 covers 65km2 previously unsewered outer areas. Total area covered in 2011 is thus 85+65=150km2, which is 80% (=150/187) of the total KMC surface area. Remaining unsewered outer areas not yet covered is 37 km2 in total.
Number of times water logging is reported in year at flood prone points within city.
> 6 times per year.
Master Plan design rainfall intensity is taken at two months storm frequency rainfall. Actual capacity is only 50% in the central city area due to siltation and limited pumping capacity. Hence the actual number of water logging incidents is more than the design capacity of 6 times per year in flood prone locations.
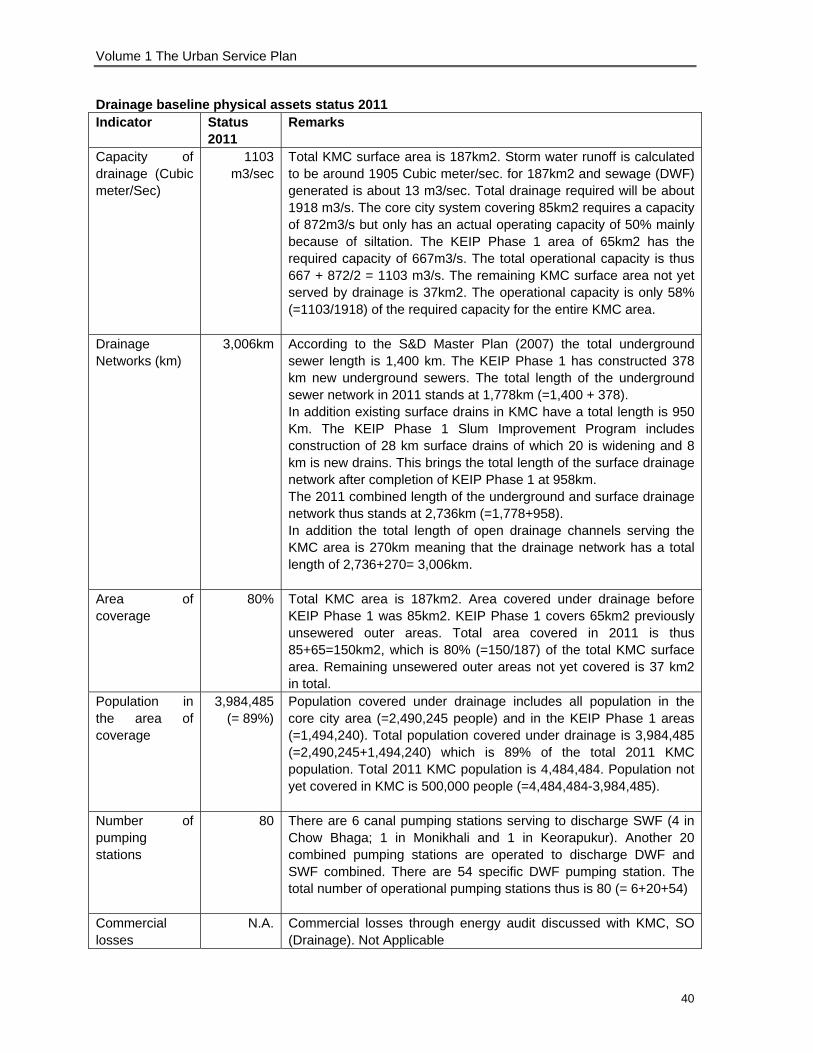
Volume 1 The Urban Service Plan
40
Drainage baseline physical assets status 2011 Indicator Status
2011 Remarks
Capacity of drainage (Cubic meter/Sec)
1103 m3/sec
Total KMC surface area is 187km2. Storm water runoff is calculated to be around 1905 Cubic meter/sec. for 187km2 and sewage (DWF) generated is about 13 m3/sec. Total drainage required will be about 1918 m3/s. The core city system covering 85km2 requires a capacity of 872m3/s but only has an actual operating capacity of 50% mainly because of siltation. The KEIP Phase 1 area of 65km2 has the required capacity of 667m3/s. The total operational capacity is thus 667 + 872/2 = 1103 m3/s. The remaining KMC surface area not yet served by drainage is 37km2. The operational capacity is only 58% (=1103/1918) of the required capacity for the entire KMC area.
Drainage Networks (km)
3,006km According to the S&D Master Plan (2007) the total underground sewer length is 1,400 km. The KEIP Phase 1 has constructed 378 km new underground sewers. The total length of the underground sewer network in 2011 stands at 1,778km (=1,400 + 378). In addition existing surface drains in KMC have a total length is 950 Km. The KEIP Phase 1 Slum Improvement Program includes construction of 28 km surface drains of which 20 is widening and 8 km is new drains. This brings the total length of the surface drainage network after completion of KEIP Phase 1 at 958km. The 2011 combined length of the underground and surface drainage network thus stands at 2,736km (=1,778+958). In addition the total length of open drainage channels serving the KMC area is 270km meaning that the drainage network has a total length of 2,736+270= 3,006km.
Area of coverage
80% Total KMC area is 187km2. Area covered under drainage before KEIP Phase 1 was 85km2. KEIP Phase 1 covers 65km2 previously unsewered outer areas. Total area covered in 2011 is thus 85+65=150km2, which is 80% (=150/187) of the total KMC surface area. Remaining unsewered outer areas not yet covered is 37 km2 in total.
Population in the area of coverage
3,984,485 (= 89%)
Population covered under drainage includes all population in the core city area (=2,490,245 people) and in the KEIP Phase 1 areas (=1,494,240). Total population covered under drainage is 3,984,485 (=2,490,245+1,494,240) which is 89% of the total 2011 KMC population. Total 2011 KMC population is 4,484,484. Population not yet covered in KMC is 500,000 people (=4,484,484-3,984,485).
Number of pumping stations
80 There are 6 canal pumping stations serving to discharge SWF (4 in Chow Bhaga; 1 in Monikhali and 1 in Keorapukur). Another 20 combined pumping stations are operated to discharge DWF and SWF combined. There are 54 specific DWF pumping station. The total number of operational pumping stations thus is 80 (= 6+20+54)
Commercial losses
N.A. Commercial losses through energy audit discussed with KMC, SO (Drainage). Not Applicable

Volume 1 The Urban Service Plan
41
9.2. Sewerage and drainage service targets and service gaps
Table: Assumptions water demand 2022 A. Residential areas 180 lpcd B. Slum areas 90 lpcd C. Floating population 5 lpcd D. Institution, commerce and industry (ICI) 35% of population demand (A+B)E. Other and firefighting 5% of population demand (A+B) Table: Assumptions sewage generation as % of water demand Core city area 90% Outer areas 85% Table: Service Plan Kolkata Sewerage Indicator 2011 2017 2022 GAP 2011 – 20221 Population with direct sewer connection 1,976,593 2,000,000 2,100,000 123,4072 Population in service area 4,484,484 4,502,540 4,560,887 76,4033 Volume of wastewater collected 71% 80% 95% 19%4 Treatment capacity available 88% 90% 95% 7%5 Effluent samples quality 100% 100% 100% 06 Percentage of waste water reused 93% 93% 93% 07 Complaints redressed within 24 hours 65% 80% 90% 25% Remarks 1 Population with direct sewer connection
In base year 2011 a total number of 428,762 households have a direct connection to the sewer network. The average household size in 2011 is 4.61, meaning that the total population with direct connection to the underground sewer network in KMC in 2011 is 1,976,593 people (=428,762x4.61). The KEIP Phase 1 has created 70,000 new sewer house connections in the outer areas. For the period up to 2022 it is assumed that connecting a similar number of houses to the sewer network is a realistic assumption. Therefore the 2022 target is to have 500,000 households directly connected to the sewer network, meaning a total of 71,238 new sewer connections. Household size is expected to decrease from 4.61 in 2011 to 4.20 in 2022. As a result the number of people directly connected to the sewer network in year 2022 is 4,20 x 500,000 = 2,100,000
2 Population in service area Based on projected population growth KMC 2011-2022 (refer to previous chapter on population)
3 Volume of wastewater collected Extension of (interceptor) trunk sewers to currently un-served areas will ensure that almost all waste water produced will be collected (95%). A small portion of the population will continue to remain un-served. According to the 2001 Census 10% of the KMC population has no sanitation (4%) or uses service latrine (6%). The 2011 Census data are not yet available, but it is likely that this percentage will decrease over time. It is assumed that by 2022 the percentage of the population using no sanitation or service latrines will be reduced to 5% only.

Volume 1 The Urban Service Plan
42
4 Treatment capacity available Treatment capacity in 2022 should be sufficient to treat all waste water collected, which is 95% of wastewater produced; 5% of waste generation remains uncollected, because 5% of the 2022 population has no sanitation or a service latrine. Additional Sewage Treatment Plants and augmentation of existing plants up to a total additional treatment capacity of 131.5MLD is required especially for areas discharging into the Hooghly River, plus additional use of the EKW potential for the eastern KMC areas.
5 Effluent samples quality Target is to sustain at current high level quality.
6 Percentage of waste water reused The current percentage of reuse, mainly by the fisheries in the EKW area is already very high and should be sustained. Further increase is deemed unrealistic.
7 Complaints redressed within 24 hours As per KMC information daily 7-10 complaints are received and about 5-6 complaints will be redressed (approximately 65%). Since 2010 KMC has an e-complaint handling system as part of the e-governance drive. Records and handling times are already improving as a result and therefore a relatively high target of 90% in year 2022 is ambitious but realistic.
Table: Physical components sewerage service plan Indicator 2011 2017 2022 GAP
2011 – 22 1 Volume sewerage treatment plants 154 MLD 200MLD 285 MLD 131 MLD2 Volume sewerage treatment EKW 966 MLD 1000MLD 1076 MLD 110MLD3 Sewer network length 1,778km 2,000km 2,428km 650km4 HH connected to septic tank 452,764hh
(=47%)500,000hh 530,668hh
(=49%) 77,904hh
5 HH connected to underground sewers 691,020hh (= 71%)
850,000hh 1,030,668hh (= 95%)
339,648hh
6 Commercial losses by energy audit NA NA NA NA7 Availability of O&M manuals None Operational Operational Operational Remarks 1 Volume sewerage treatment plants
An additional capacity of 131.5 MLD is required to treat sewage from currently un-served areas. This is to be achieved by construction of 4 additional sewerage treatment plants at 92 MLD capacity (resp. 22MLD+40MLD+10MLD+20MLD) plus augmentation of the existing SSE plant from currently 45 MLD to 72 MLD (additional 32 MLD) plus rehabilitation of an existing dis-functional STP at 7.5MLD. Total additional capacity is 92+32+7.5=131.5MLD.
2 Volume sewerage treatment EKW Currently the EKW receives only 966MLD. The eastern outer areas (boroughs VII, XI and XII) require additional treatment capacity of 110MLD, meaning a total discharge of 1076 MLD in 2022. According to Wrigley Report the EKW could easily absorb 1200MLD, probably even more.
3 Sewer network length

Volume 1 The Urban Service Plan
43
For the currently unsewered KMC area of 37km2 construction of a total network is required of 650km sewers, consisting of 168 km trunk (600mm and above) and 482km secondary sewers (below 600mm).
4 HH connected to septic tanks The total number of households in 2011 is 691,020 and in 2022 is projected at 1,084,668. Although the population growth is very limited, the number of households increases substantially because of decreasing household size. The target for direct sewer connections in 2022 is 500,000 households, which is realistic. A small portion of the population has no sanitation or uses service latrines. For 2022 this is estimated at 5% which is approximately 54,000hh. All other households (1,084,668-500,000-54,000=530,668hh) use septic tanks.
5 HH connected to underground sewers It is assumed that approximately 5% of all households (54,000hh) will have no sanitation or use service latrines in 2022. All other households (1,030,668) will be connected to the sewer system. A total of 500,000 households will have a direct connection to the sewer system and sewage from the remaining 530,668 hh will be discharged into septic tanks. The outflows of the septic tanks will be intercepted by the sewer system and directed to treatment facilities It is expected that gradually and continuing after 2022 the existing septic tanks would be by-passed and abandoned and more direct connections to the sewer network would be made.
6 Commercial losses by energy audit Not applicable.
7 Availability of O&M manuals O&M manuals for sewerage and drainage have been prepared during KEIP Phase 1, but have not yet been formally approved and adopted by KMC. After completion and formal approval the O&M manuals should be implemented and staff be trained accordingly.
Table: Service Plan Kolkata Drainage Indicator 2011 2017 2022 GAP
2011 - 2022 1 Road length covered by
drainage 2,736km
(65%)2,950km
(67%)3,386km
(73%) 650km
2 Total road length 4,200km 4,400km 4,620km 420km3 Population covered under
drainage 3,984,485
(89%)4,270,000
(95%)4,560,887
(100%) 576,402
4 Areas covered under drainage
150km2 (80%) 170km2 (91%)
187 km2 (100%)
37km2
5 Annual water logging frequency
> 6 >6 max 6 Varies by location
Remarks 1 Road length covered by drainage
In 2011 the total length of the underground and surface drainage network is 2,736km. For the currently unsewered KMC area of 37km2 construction of a total network is required of 650km sewers, consisting of 168 km trunk (600mm and above) and 482km secondary sewers (below 600mm). Hence, in 2022 the total length of sewers and surface drains will become 2736 + 650 = 3386km.

Volume 1 The Urban Service Plan
44
The total road length in 2011 is 4200km. It is assumed that because of ongoing land development, especially in the outer wards, and increasing motorized traffic volumes the total road length will be extended over the years and will increase by approximately 10% in ten years time to a total length of 4620km in year 2022.
2 Total road length Sub-sector roads not included in KEIP Phase 1. Total road length: refer to previous section.
3 Population covered under drainage Target is to cover the entire KMC population under drainage in year 2022 (4,560,887 people)
4 Areas covered under drainage After completion of KEIP Phase 1, 150km2 of KMC surface area is covered under drainage. Target is to cover the entire KMC surface area of 187km2 under drainage in year 2022. Additional coverage required is 37km2
5 Annual water logging frequency Master Plan design rainfall intensity is taken at two months storm frequency rainfall. Actual capacity is only 50% in the central city area due to siltation and limited pumping capacity. Hence the actual number of water logging incidents is more than the design capacity of 6 times per year in flood prone locations. In areas yet not served by a formal drainage system waterlogging is even more frequent. In 2022 the entire KMC area should have a proper drainage system and the drainage network should function at design capacity meaning a maximum annual flooding risk of 6 times per year.
Table: Physical components drainage service plan Indicator 2011 2017 2022 GAP
2001-2022 1 Capacity of drainage 1103m3/s 1450m3/s 1918m3/s 815m3/s2 Drainage network length 3006 km 3270km 3656km 6503 Area of coverage 150km2
(80%)170km2
(91%)187km2 (100%)
37km2
4 Population in area of coverage
3,984,485(89%)
4,270,000(95%)
4,560,887 (100%)
576,402
5 No of pumping stations 80 90 97 176 Commercial losses by energy
audit NA NA NA NA
Remarks 1 Capacity of drainage
In 2022 the target is to serve the entire KMC area with a formal drainage system designed and maintained for a 2 months rainstorm frequency. Most important interventions to achieve the targeted service level is the extension of the drainage network to un-served outer wards (37km2), the desiltation and rehabilitation of the core city drainage network, refurbishment of core city pumping stations and most of all proper and adequate routine maintenance. Rehabilitation of the core city network to its design capacity would add 50% (+436m3/s) to the current operational capacity. For the un-served outer wards (37km2) additional drainage capacity of 379m3/s is required. Total additional capacity in 2022 as compared to the baseline situation in

Volume 1 The Urban Service Plan
45
2011 would be 436 + 379 = 815m3/s
2 Drainage network length In 2011 the total length of the underground and surface drainage network is 2,736km. In addition there are 270km of drainage canals making a total drainage network of 3,006km. For the currently unsewered KMC area of 37km2 construction of a total network is required of 650km sewers, consisting of 168 km trunk (600mm and above) and 482km secondary sewers (below 600mm). Hence, in 2022 the total length of sewers, surface drains and canals will become 2736 + 650 + 270 = 3,656km.
3 Area of coverage Additional coverage of currently unsewered areas is 37km2
4 Population in area of coverage Total KMC population will be covered in 2022 (4,560,887 people)
5 No of pumping stations To achieve the target service levels pumping capacity should be increased. This would be done by augmentation of 13 existing pumping stations, construction of 13 new main pumping stations and construction of 4 small pumping stations.
6 Commercial losses by energy audit: Not applicable

Volume 1 The Urban Service Plan
46
10. Solid Waste Management service plan
10.1 Solid Waste Management baseline 2011
Solid Waste Management service level indicators status 2011 Indicators Status
2011 Remarks
Population covered by daily doorstep collection system
75% In year 2011 75% of the KMC area is covered by the doorstep collection system (serving 3,363,400 people) and 25% of the area by street sweeping and direct loading (serving 1,121,100 people). In 98% of the KMC area waste is collected daily and in the remainder it is collected once or twice a week.
Total waste collected vs. total waste generated
97% KMC estimates that of total waste generated (4430 tons/day) only approximately 3% (130 tons / day) is not collected but (illegally) disposed in channels, vacant land and used for infill.
Percent of households and establishments that segregate their waste
4% In 2011 source segregation has been introduced as a pilot project in 7 wards (33, 47, 64, 103, 110, 115 and 130) covering only 4.4% of the KMC population.
Extent of recovery (waste processing & recycling facilities) of waste collected
20% Informal segregation takes place at all stages of waste processing. Newspapers, paper board, packaging boxes, glass bottles and plastic bottles and containers are traditionally kept separately in households/business and commercials establishments and are sold periodically to vendors for such recyclable material. There is no estimate about the quantity of such recycled material. Doorstep collectors of household waste and street sweepers routinely segregate recyclable material especially plastic, paper and boards etc and remove them before they are disposed in secondary collection points (vats) in the city. Large vats are regularly rummaged by rag pickers to segregate recyclable waste. Upon arrival at the Dhapa dumping ground about 4% of waste, representing the remaining recyclable fraction is recovered by rag pickers. As a result it is estimated that 13% of waste is removed before it is finally disposed. Biodegradable waste from major markets at a total of 300 tons per day representing 7% of total waste is collected separately and transported to Dhapa compost plant. This means that currently 20% of total waste collected is recovered (13% recycling and 7% composting).
Amount of waste that is disposed in landfills that have been designed, built, operated as per standards
0% Baseline 2011 is that the existing dumping sites are not operated as sanitary landfills in accordance with national standards. Dhapa dumping ground has been authorized by WBPCB
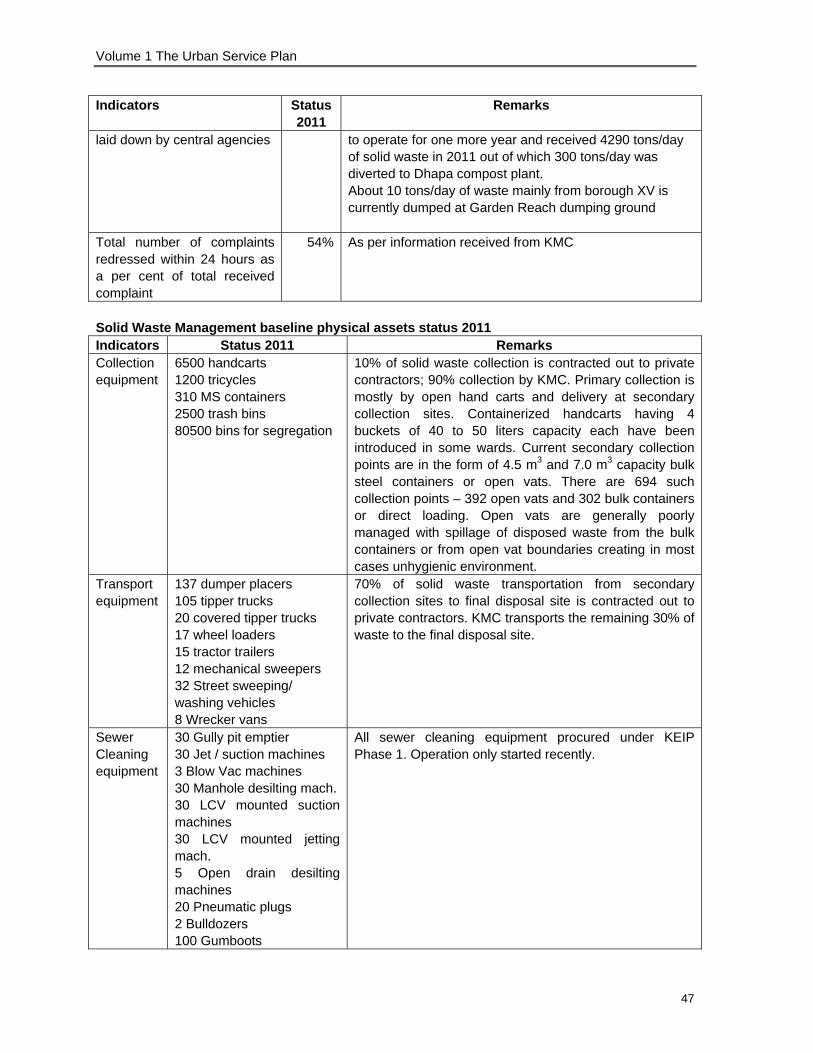
Volume 1 The Urban Service Plan
47
Indicators Status 2011
Remarks
laid down by central agencies to operate for one more year and received 4290 tons/day of solid waste in 2011 out of which 300 tons/day was diverted to Dhapa compost plant. About 10 tons/day of waste mainly from borough XV is currently dumped at Garden Reach dumping ground
Total number of complaints redressed within 24 hours as a per cent of total received complaint
54% As per information received from KMC
Solid Waste Management baseline physical assets status 2011 Indicators Status 2011 Remarks Collection equipment
6500 handcarts 1200 tricycles 310 MS containers 2500 trash bins 80500 bins for segregation
10% of solid waste collection is contracted out to private contractors; 90% collection by KMC. Primary collection is mostly by open hand carts and delivery at secondary collection sites. Containerized handcarts having 4 buckets of 40 to 50 liters capacity each have been introduced in some wards. Current secondary collection points are in the form of 4.5 m3 and 7.0 m3 capacity bulk steel containers or open vats. There are 694 such collection points – 392 open vats and 302 bulk containers or direct loading. Open vats are generally poorly managed with spillage of disposed waste from the bulk containers or from open vat boundaries creating in most cases unhygienic environment.
Transport equipment
137 dumper placers 105 tipper trucks 20 covered tipper trucks 17 wheel loaders 15 tractor trailers 12 mechanical sweepers 32 Street sweeping/ washing vehicles 8 Wrecker vans
70% of solid waste transportation from secondary collection sites to final disposal site is contracted out to private contractors. KMC transports the remaining 30% of waste to the final disposal site.
Sewer Cleaning equipment
30 Gully pit emptier 30 Jet / suction machines 3 Blow Vac machines 30 Manhole desilting mach. 30 LCV mounted suction machines 30 LCV mounted jetting mach. 5 Open drain desilting machines 20 Pneumatic plugs 2 Bulldozers 100 Gumboots
All sewer cleaning equipment procured under KEIP Phase 1. Operation only started recently.

Volume 1 The Urban Service Plan
48
Indicators Status 2011 Remarks 20 Movable compactors 20 Portable compactors 7 Prime compactor movers
Disposal sites
Dhapa landfill site with 4 weigh bridges and 4 bulldozers. Current average disposal is 4286 T/day.
Dhapa landfill is a very large site but it is nearing its capacity. Total remaining capacity at Dhapa is approximately just enough for one year at an average disposal of 4286 ton per day. Dhapa is not operated as sanitary landfill in accordance with national standards. There is no formal leachate treatment, no proper soil cover and informal rag pickers operate at the site.
Composting Plant 500 T/Day capacity
The composting plant at the Dhapa dump site is operated by a private company. Current production is only 300T/day below the operational capacity of 500T/day. Lack of supply of biodegradable wastes of sufficient quality currently reduces the operational capacity.
Garden Reach dump site. Current average disposal is 10 T/day.
The Garden Reach landfill is a small site with very limited capacity and is nearing its limit as well. Operation at Garden Reach is not in accordance with national standards for sanitary landfill.
10.2 Solid Waste Management service targets and service gaps
Table: Service Plan Kolkata Solid Waste Management Indicators 2011 2017 2022 GAP
2011-2022 1 Population covered by daily doorstep collection system 75% 85% 100% 25%2 Total waste collected vs. total waste generated 97% 98% 100% 3%3 Percent of households and establishments that
segregate their waste 4% 20% 40% 36%
4 Extent of recovery (waste processing & recycling facilities) of waste collected
20% 40% 60 % 36%
5 Amount of waste that is disposed in landfills that have been designed, built, operated as per standards laid down by central agencies
0% 100% 100% 100%
6 Total number of complaints redressed within 24 hours as a per cent of total received complaint
54% 80% 90% 36%
Remarks 1 Population covered by daily doorstep collection
Total population in 2011 is 4,484,484 of which 75% is covered by the doorstep collection system (3,363,400 people). Coverage is projected to grow to a total of 100%, meaning 4,560,887 people in year 2022.

Volume 1 The Urban Service Plan
49
2 Total waste collected vs. total waste generated In 2011 only 97% of waste is collected and this would increase to 100% in 2022.
3 Percent of households and establishments that segregate their waste In 2011 source segregation covers only 4.4 % of the KMC population. In 2022 the segregation is expected to expand considerably, covering 40% of the population and establishments. A higher percentage would be too optimistic considering the current low level of segregation.
4 Extent of recovery (waste processing & recycling facilities) of waste collected Status baseline 2011 is 13% recycling and 7% composting = 20% of total waste received at the final disposal site. Target 2022 is to increase the extent of recovery to 20% recycling and 40% composting = 60% of total waste. The national benchmark target of 80% is deemed too ambitious for Kolkata considering the current low levels of recovery.
5 Amount of waste that is disposed as per national standards Target 2022 is 100% of the generated waste to be disposed scientifically in a new sanitary land fill site at Dhapa of 17.7 Ha area with a life span of 10 years as approved by WBPCB and EKWMA.
6 Total number of complaints redressed within 24 hours Since 2010 KMC has an e-complaint handling system as part of the e-governance drive. Records and handling times are already improving as a result and therefore a relatively high target of 90% in year 2022 is ambitious but realistic.
Table: Physical components Solid Waste Management service plan Indicator 2011 2017 2022 GAP
2011-20221 Collection equipment (numbers) a) Hand cart 6500 3250 0 0 b) Tricycle 1200 600 0 0 c) M.S. container 310 155 0 0 d) Trash bin 2500 1250 0 0 e) Bins for segregation 80500 40000 0 0 f)Containerized conventional Hand cart with
bearing and solid rubber on wheel 2500 5000 5000
g)FRP bucket for containerized conventional hand cart
0 10000 20000 20000
h) Trash bin 0 10000 20000 20000 i) Containerized tricycle van 0 2500 5000 5000 j) FRP bucket for containerized tricycle van 0 15000 30000 30000 k) Raincoat 0 5500 11000 11000 l) Mask 0 10000 20000 20000 m) Gloves (pairs) 0 10000 20000 20000 n) Cap/Hard hats 0 5000 10000 100002 Transportation equipment/vehicles (number) a) Dumper placer (4.5 m3) 29 29 29 0 b) Dumper placer (7.0 m3) 108 108 108 0

Volume 1 The Urban Service Plan
50
Indicator 2011 2017 2022 GAP 2011-2022
c) Tipper truck (7.0 m3) 55 55 55 0 d) Tipper truck (11.0 m3) 50 50 50 0 e1) Wheel type loader existing 17 17 17 0 e2) Wheel type loader new 0 2 4 4 f)Tractor trailer 15 15 15 0 g) Mechanical sweeper, large 3 3 3 0 h) Mechanical sweeper, medium 9 9 9 0 i) Street sweeping/washing vehicle 32 32 32 0 j) Container 0 225 450 450 k) Covered tipper truck 20 30 30 10 l) Wrecker van 8 8 8 0 m) Movable compactor 0 35 70 70 n) Prime mover for portable compactor 0 10 20 20 o) Portable compactor 0 30 60 603 Sewer cleaning equipment (procurement under KEIP Phase 1) (numbers) a) Gully pit emptier 30 30 30 0 b) Jet cum suction machine 30 30 30 0 c) Blow Vac machine with two suction dump tank 3 3 3 0 d) Manhole desilting machine 30 30 30 0 e) LCV mounted suction machine 30 30 30 0 f) LCV mounted jetting machine 30 30 30 0 g) Open drain desilting machine (tractor mounted) 5 5 5 0 h) Pneumatic plug (24, 30, 36, 42, 48 inches) (4 of
each size) 20 20 20 0
i) Bulldozer 2 2 2 0 j) Gumboot 100 100 100 0 k) Movable compactor 20 20 20 0 l) Portable compactor 20 20 20 0 m) Prime mover of portable compactor 7 7 7 04 Disposal sites Number of existing dump sites 2 0 0 0 Number of new dump sites 0 1 2 2 Capacity of sanitary landfill in years 1 year 5 30 304A Equipment at Dhapa landfill site a) Bull dozer existing 4 0 0 0 b) Weigh bridge (3 at entry; 1 at exit) 4 4 4 0 c) Bulldozer/Compactor dozer 0 5 5 5 d) Track type loader 0 2 2 2 e) Dump site water vehicle 0 2 2 2 f) Loader with backhoe 0 2 2 2 g) Wrecker van 0 2 2 2 h) Vehicle washing bay 0 4 4 44B Number of composting plants 1 1 1 0 Capacity of composting plant (Ton/day) 300 500 500 200 Number of equipment in private composting plant Not
knownNot
knownNot
known NA

Volume 1 The Urban Service Plan
51
Remarks Intermediate targets for year 2017
In general KMC intends to replace collection equipment as and when required based on availability of funds, depreciation of existing equipment and possible opportunities for contracting out of part of the collection and transportation operations. Apart from depreciation this depends on actual operation and maintenance costs of depreciated equipment and availability of spare parts. As an overall target for year 2017 it is assumed that 50% of the existing (2011) collection equipment will be scrapped by 2017 and 50% of the 2022 target equipment will be procured and operational in year 2017. For the disposal sites the 2017 target is to have the new 17.7ha Dhapa site fully operational as a sanitary landfill and to have the existing Dhapa site as well as the existing Garden Reach dump site properly closed. The privately operated composting plant should operate at its design capacity of 500 tonnes per day in year 2017.
1 Collection equipment Presently mixed waste (bio-degradable, part recyclable and inert) is collected by open handcart from residential, institutional/commercial and market area and brought to secondary collection points. KMC envisages procurement and deployment of modernized collection equipment mainly replacing open collection carts and tricycles by containerized closed vehicles. Besides, KMC intends to gradually extend the use of private contractors for waste collection.
2 Transportation equipment/vehicles KMC envisages procurement and deployment of modernized equipment and various types of compactors at secondary collection points to reduce the volume of collected waste, reduce space requirement for vat and consequently to reduce the number of trips by transportation vehicles. Currently 70% of solid waste transportation from secondary collection sites to the final disposal site is contracted out to private contractors. KMC transports the remaining 30% of waste to the final disposal site. In the planning period up to 2022 KMC intends to gradually increase the share of the private sector in the transportation of waste and thus minimizing the need to procure new transportation vehicles for replacement of the current vehicle fleet.
3 Sewer cleaning equipment Sewer cleaning equipment has just been procured as part of KEIP Phase 1 and will continue to be operated throughout the planning period.
4 Disposal sites 4A Dhapa
Dhapa landfill is a very large site but it is nearing its capacity and development of a new site is urgently required. Total remaining capacity is approximately just enough for one more year at an average disposal of 4286 ton per day in 2011. KMC intends to close both the previous and the existing site. For closure of the previous Dhapa site the IBRD has committed financial assistance. Closure of the existing landfill and development of a new sanitary landfill, including procurement of equipment, at Dhapa would provide sufficient capacity for approximately ten years. It would cover an area of 17.75 ha as approved by WBPCB and EKWMA, with an average height of 15 m (Ref: KMC Document titled DPR on Integrated Waste Management Facilities at Dhapa for Kolkata City). For the long term KMC wants to develop a 210ha plot of land at Beonta Mouza that would provide sufficient dumping capacity for a period of 30 years.

Volume 1 The Urban Service Plan
52
4B Composting plant The existing privately operated composting pant at Dhapa handles 300 tonnes per day but has a capacity of 500 tonnes per day. Constraint is currently the lack of good quality biodegradable material supply. As more segregation at the source will take place, the quantity of segregated biodegradable waste delivered at the composting site in Dhapa will increase. Enhancement of present capacity of the existing compost plant to 1000 TPD within the present factory premises is feasible and has been envisaged by the private operator.
4C Garden Reach dump site The Garden Reach landfill is a small site with very limited capacity and is nearing its limit as well. Operation at Garden Reach is not in accordance with national standards for sanitary landfill. In the near future the KMC plans to use this site only for disposal of silt and debris until it is completely filled up and then proceed with proper closure. By 2022 the site will not be operated anymore.

Volume 1 The Urban Service Plan
53
ANNEX POPULATION DATA AND PROJECTIONS A. Population by ward and borough B. Population densities in people per km2 by ward and borough C. Slum population by ward and borough D. Households by ward and borough

Volume 1 The Urban Service Plan
54
Annex A. Population by ward (1-141) and borough (I-XV) W / B 2001 2011 2017 2022 2027 2032 2037 2042
1 49018 52604 54880 56852 58895 61011 63204 65475
2 47327 47718 47954 48152 48350 48550 48750 48951
3 53299 52736 52401 52124 51848 51573 51300 51028
4 40121 33793 30486 27979 25678 23566 21628 19849
5 26117 23042 21374 20076 18857 17712 16637 15627
6 48096 41706 38287 35653 33200 30916 28789 26809
7 20226 18992 18288 17721 17172 16640 16125 15625
8 21071 19398 18459 17711 16993 16305 15644 15010
9 20374 16418 14423 12948 11623 10434 9366 8408
I 325649 306407 296552 289216 282616 276707 271443 266782
10 33807 27753 24654 22338 20239 18338 16615 15054
11 26190 22182 20078 18478 17005 15650 14403 13255
12 28912 21536 18048 15576 13443 11602 10014 8642
15 26709 24091 22645 21507 20425 19399 18423 17497
16 26665 21636 19086 17192 15487 13950 12566 11319
17 24016 20011 17936 16372 14945 13642 12453 11367
18 25508 22650 21091 19875 18728 17648 16630 15670
19 24479 21178 19415 18059 16797 15623 14532 13517
20 20481 21530 22185 22746 23321 23911 24516 25136
II 236767 202567 185138 172143 160390 149763 140152 131457
13 31118 33010 34200 35224 36279 37366 38485 39638
14 49698 53372 55706 57728 59824 61995 64246 66579
29 46887 53578 58043 62046 66326 70900 75791 81018
30 28278 29788 30732 31542 32373 33227 34102 35001
31 36456 39101 40779 42233 43738 45297 46911 48583
32 46081 44946 44278 43730 43188 42653 42124 41602
33 44230 45972 47050 47968 48903 49857 50829 51820
34 27808 29961 31332 32522 33758 35040 36372 37753
35 31320 35280 37892 40217 42683 45302 48080 51029
III 341876 365008 380012 393210 407072 421637 436940 453023
21 24629 23774 23275 22868 22467 22074 21687 21308
22 20569 16673 14699 13234 11915 10727 9658 8696
23 21775 18162 16289 14876 13586 12408 11332 10349
24 19520 19815 19994 20145 20296 20449 20603 20758
25 39160 28518 23577 20120 17170 14652 12504 10670
26 31400 26015 23238 21152 19253 17524 15951 14519
27 23089 19220 17217 15709 14332 13076 11931 10885
28 41775 40295 39432 38727 38035 37355 36688 36032
38 28083 29341 30123 30790 31472 32169 32882 33610
39 28255 21292 17968 15597 13540 11754 10203 8857
IV 278255 243105 225812 213218 202066 192188 183439 175684
36 22851 24659 25812 26813 27854 28935 30058 31224
37 24004 23997 23993 23989 23986 23982 23979 23975
40 24384 20544 18537 17015 15618 14335 13158 12078

Volume 1 The Urban Service Plan
55
Annex A. Population by ward (1-141) and borough (I-XV) W / B 2001 2011 2017 2022 2027 2032 2037 2042
41 25486 19752 16951 14923 13137 11565 10182 8963
42 26077 21744 19498 17804 16258 14846 13557 12379
43 29647 17648 12928 9974 7696 5937 4581 3534
44 33652 28989 26507 24602 22834 21193 19670 18257
45 15360 8420 5870 4346 3218 2383 1764 1306
48 21856 20386 19552 18883 18237 17613 17010 16428
49 20671 19153 18296 17612 16953 16318 15708 15120
50 18365 17460 16939 16516 16104 15702 15310 14928
V 262353 222752 204883 192477 181895 172809 164977 158192
46 22959 12194 8342 6079 4431 3229 2353 1715
47 21218 14612 11682 9694 8045 6676 5540 4598
51 16272 13555 12148 11087 10119 9236 8430 7694
52 24672 17400 14111 11850 9952 8357 7019 5894
53 28910 25271 23311 21795 20377 19051 17812 16653
54 40299 36233 33993 32233 30563 28980 27480 26056
55 35955 32878 31160 29797 28493 27247 26055 24915
60 42585 35853 32336 29670 27224 24980 22921 21031
61 34128 30842 29024 27592 26230 24935 23704 22534
62 46640 34447 28720 24682 21212 18230 15667 13464
VI 313638 253285 224827 204479 186646 170921 156981 144554
56 43304 43781 44070 44312 44555 44800 45046 45293
57 45206 49720 52642 55208 57898 60720 63680 66784
58 86487 88524 89769 90820 91883 92959 94048 95149
59 66690 70037 72125 73913 75745 77623 79547 81518
63 32123 24577 20929 18307 16013 14006 12251 10716
64 26891 31106 33946 36509 39267 42232 45421 48852
65 80098 72368 68093 64724 61521 58478 55584 52834
66 70179 98187 120105 142064 168039 198762 235102 278086
67 54380 56262 57422 58408 59410 60429 61466 62520
VII 505358 534562 559101 584265 614331 650009 692145 741752
68 24181 20759 18943 17551 16262 15068 13961 12935
69 43358 41993 41195 40541 39898 39265 38642 38029
70 31774 18591 13478 10310 7886 6032 4614 3530
71 33199 29267 27135 25477 23921 22460 21088 19800
72 24487 19205 16600 14701 13019 11530 10211 9043
73 24416 23435 22865 22401 21947 21501 21065 20637
84 23400 19253 17126 15535 14091 12782 11594 10517
85 31231 29525 28546 27756 26987 26240 25513 24806
86 25148 19035 16106 14012 12191 10606 9227 8028
87 13324 12621 12217 11890 11573 11263 10962 10669
90 22145 18773 17002 15654 14413 13270 12218 11250
VIII 296663 252457 231213 215828 202188 190017 179095 169244
74 37119 38453 39276 39976 40688 41413 42150 42901
75 24392 22384 21259 20366 19509 18689 17903 17151
76 24248 22161 20996 20072 19189 18345 17537 16766

Volume 1 The Urban Service Plan
56
Annex A. Population by ward (1-141) and borough (I-XV) W / B 2001 2011 2017 2022 2027 2032 2037 2042
77 44071 45916 47060 48035 49030 50046 51083 52141
78 58930 53919 51119 48898 46772 44740 42795 40935
79 42229 43622 44480 45207 45947 46699 47463 48239
80 38587 30648 26692 23788 21200 18894 16838 15007
82 43347 38930 36499 34589 32780 31065 29439 27899
83 24381 22139 20894 19910 18973 18079 17228 16417
88 27050 23595 21738 20302 18961 17709 16539 15447
IX 364354 341767 330013 321143 313049 305679 298975 292903
81 47258 41281 38064 35576 33250 31076 29045 27146
89 26781 22243 19898 18134 16526 15061 13726 12509
91 36453 38398 39614 40658 41728 42827 43955 45112
92 35916 36465 36798 37079 37361 37645 37932 38221
93 56029 43985 38040 33704 29863 26459 23444 20772
94 29570 27523 26363 25435 24538 23674 22840 22035
95 28500 26709 25689 24869 24075 23306 22562 21841
96 28990 31131 32491 33669 34890 36156 37467 38826
97 37404 37231 37128 37042 36956 36870 36785 36700
98 30514 31728 32479 33119 33772 34437 35115 35807
99 19855 26817 32117 37325 43379 50413 58589 68090
100 29665 25548 23357 21676 20116 18668 17324 16077
X 406935 389059 382038 378286 376454 376592 378784 383136
101 37634 40128 41703 43063 44467 45916 47414 48959
102 20646 21758 22454 23050 23663 24292 24938 25600
110 22765 27150 30177 32955 35989 39303 42922 46873
111 32149 38658 43180 47350 51922 56936 62435 68464
112 25497 32452 37505 42313 47736 53854 60757 68545
113 30933 33762 35582 37174 38836 40573 42388 44284
114 31416 41964 49924 57700 66687 77073 89077 102950
XI 201040 235872 260525 283605 309300 337947 369931 405675
103 25528 25250 25085 24948 24811 24676 24541 24407
104 29459 33003 35331 37396 39581 41895 44343 46935
105 20980 22320 23165 23893 24644 25419 26218 27043
106 30500 40582 48167 55561 64090 73927 85275 98364
107 39730 54335 65563 76672 89664 104857 122625 143403
108 38338 64773 88726 115328 149905 194850 253269 329203
109 37610 64582 89330 117058 153393 201006 263398 345157
XII 222145 304845 375367 450856 546088 666630 819669 1014512
115 30616 31669 32318 32869 33430 34000 34579 35169
116 28473 28322 28232 28157 28082 28008 27933 27859
117 25276 22125 20426 19111 17880 16728 15651 14643
118 25922 21732 19551 17901 16390 15007 13741 12582
119 19410 16452 14898 13716 12628 11626 10703 9854
120 21900 19821 18670 17761 16897 16075 15293 14549
121 29970 29923 29895 29871 29848 29825 29801 29778
122 34957 39090 41801 44203 46743 49429 52269 55273

Volume 1 The Urban Service Plan
57
Annex A. Population by ward (1-141) and borough (I-XV) W / B 2001 2011 2017 2022 2027 2032 2037 2042
123 30569 35283 38454 41312 44383 47683 51228 55036
XIII 247093 244417 244244 244901 246281 248381 251198 254743
124 34295 38864 41893 44596 47474 50537 53799 57270
125 42245 45271 47190 48851 50570 52350 54192 56099
126 27234 31542 34447 37072 39896 42936 46207 49728
127 36584 43710 48636 53162 58109 63517 69428 75889
128 31864 30938 30395 29950 29512 29080 28654 28235
129 38967 39655 40074 40426 40781 41140 41501 41866
130 26630 23116 21234 19784 18432 17173 16000 14907
131 30136 30844 31277 31642 32012 32385 32764 33146
132 28089 26568 25695 24990 24304 23637 22988 22357
XIV 296044 310508 320841 330473 341090 352755 365533 379497
133 23881 25588 26670 27607 28577 29580 30619 31695
134 36687 35640 35026 34523 34027 33538 33056 32580
135 31743 33289 34253 35077 35921 36785 37670 38577
136 21810 21452 21240 21065 20891 20719 20548 20379
137 20036 19370 18981 18663 18350 18043 17740 17443
138 34724 28846 25808 23523 21440 19541 17810 16233
139 45006 41996 40288 38917 37593 36314 35079 33886
140 29636 30520 31063 31523 31990 32463 32944 33431
141 31183 41172 48642 55893 64224 73797 84797 97437
XV 274706 277873 281971 286791 293013 300780 310263 321661
Total 4572876 4484484 4502540 4560887 4662479 4812815 5019525 5292815

Volume 1 The Urban Service Plan
58
Annex B. Population densities in people per km2 by Ward (1-141) and Borough (I-XV)
W / B 2001 2011 2017 2022 2027 2032 2037 2042
1 35689 38300 39957 41393 42880 44421 46018 47671
2 27490 27717 27854 27969 28085 28201 28317 28434
3 39569 39151 38902 38697 38492 38288 38085 37883
4 42271 35604 32120 29478 27054 24829 22787 20913
5 19242 16976 15747 14791 13893 13049 12257 11513
6 27591 23926 21964 20453 19046 17736 16515 15380
7 48019 45089 43418 42072 40769 39506 38283 37096
8 58410 53772 51169 49096 47105 45198 43366 41608
9 68664 55332 48608 43637 39172 35165 31565 28337
I 34027 32016 30987 30220 29530 28913 28363 27876
10 77099 63292 56225 50943 46156 41821 37891 34331
11 80238 67959 61513 56611 52098 47947 44126 40609
12 54977 40951 34319 29618 25562 22061 19042 16433
15 50161 45244 42528 40391 38359 36432 34599 32860
16 86316 70037 61782 55651 50132 45157 40677 36640
17 66187 55150 49431 45121 41188 37597 34320 31327
18 107549 95499 88926 83799 78963 74409 70117 66069
19 100751 87165 79909 74328 69134 64302 59811 55634
20 69299 72849 75065 76963 78909 80905 82952 85050
II 72390 61934 56605 52632 49038 45789 42851 40192
13 39602 42010 43524 44828 46170 47554 48978 50445
14 49472 53129 55452 57465 59552 61713 63953 66276
29 83216 95091 103016 110120 117716 125834 134515 143792
30 49567 52213 53868 55288 56744 58241 59775 61351
31 26329 28239 29451 30501 31588 32714 33879 35087
32 27684 27002 26600 26271 25946 25624 25306 24993
33 24207 25160 25750 26252 26764 27286 27818 28361
34 35268 37998 39737 41246 42814 44440 46129 47881
35 37696 42463 45606 48405 51373 54525 57869 61418
III 36293 38748 40341 41742 43214 44760 46384 48092
21 72264 69756 68291 67097 65921 64768 63632 62520
22 59546 48267 42553 38312 34493 31054 27959 25174
23 132476 110495 99100 90504 82655 75489 68942 62962
24 96940 98405 99294 100044 100794 101554 102319 103089
25 96311 70138 57986 49484 42229 36036 30753 26242
26 89058 73785 65909 59992 54606 49702 45241 41179
27 54360 45251 40535 36985 33743 30786 28090 25627
28 98241 94761 92731 91073 89446 87847 86278 84736
38 57121 59680 61271 62627 64015 65432 66883 68363
39 140272 105704 89202 77431 67219 58353 50653 43970
IV 82957 72478 67322 63568 60243 57298 54689 52377
36 24564 26508 27747 28823 29942 31104 32312 33565
37 76494 76471 76459 76446 76436 76424 76414 76401

Volume 1 The Urban Service Plan
59
Annex B. Population densities in people per km2 by Ward (1-141) and Borough (I-XV)
W / B 2001 2011 2017 2022 2027 2032 2037 2042
40 66309 55867 50409 46270 42471 38982 35782 32845
41 121493 94159 80806 71138 62625 55131 48538 42727
42 81094 67620 60635 55367 50559 46168 42160 38496
43 125438 74669 54699 42200 32562 25120 19382 14952
44 64471 55537 50782 47133 43745 40602 37684 34977
45 9973 5467 3811 2822 2089 1547 1145 848
48 89972 83921 80488 77734 75074 72505 70023 67627
49 80043 74165 70846 68198 65646 63187 60825 58548
50 47894 45534 44176 43072 41998 40950 39927 38931
V 49256 41821 38466 36137 34150 32445 30974 29700
46 17558 9325 6379 4649 3389 2469 1799 1312
47 52612 36232 28967 24037 19948 16554 13737 11401
51 54467 45372 40663 37111 33871 30916 28218 25754
52 103370 72902 59122 49649 41697 35014 29408 24695
53 83855 73300 67615 63217 59104 55258 51665 48303
54 106986 96192 90245 85572 81139 76936 72954 69174
55 36735 33591 31836 30443 29111 27838 26620 25455
60 73175 61607 55564 50983 46780 42924 39386 36138
61 53109 47996 45167 42938 40819 38803 36888 35067
62 120226 88795 74033 63624 54679 46992 40385 34707
VI 56399 45546 40429 36770 33563 30735 28229 25994
56 63892 64596 65023 65380 65738 66100 66463 66827
57 16523 18173 19241 20179 21162 22194 23276 24410
58 8001 8189 8304 8401 8500 8599 8700 8802
59 34317 36039 37113 38033 38976 39942 40933 41947
63 8455 6469 5509 4819 4215 3687 3225 2821
64 31582 36532 39867 42877 46116 49598 53344 57373
65 60114 54313 51105 48576 46172 43888 41716 39652
66 36776 51454 62940 74447 88059 104159 123202 145728
67 29629 30654 31286 31824 32370 32925 33490 34064
VII 19516 20644 21592 22564 23725 25103 26730 28646
68 26053 22366 20409 18910 17521 16234 15042 13936
69 21497 20820 20425 20100 19782 19468 19159 18855
70 38170 22333 16191 12385 9473 7246 5543 4241
71 31934 28151 26101 24506 23009 21604 20284 19045
72 42400 33254 28743 25455 22543 19964 17680 15658
73 45055 43245 42193 41337 40499 39676 38871 38082
84 50326 41407 36832 33411 30305 27490 24935 22619
85 43720 41332 39961 38855 37779 36733 35715 34726
86 28322 21437 18139 15780 13730 11945 10392 9041
87 17829 16888 16347 15910 15486 15071 14668 14276
90 19330 16386 14841 13664 12581 11583 10665 9820
VIII 29976 25509 23362 21808 20430 19200 18096 17101
74 11088 11487 11733 11942 12155 12371 12591 12816
75 43331 39764 37766 36179 34657 33200 31804 30468

Volume 1 The Urban Service Plan
60
Annex B. Population densities in people per km2 by Ward (1-141) and Borough (I-XV)
W / B 2001 2011 2017 2022 2027 2032 2037 2042
76 55700 50906 48229 46107 44079 42140 40284 38513
77 89052 92780 95091 97062 99072 101125 103220 105358
78 86408 79061 74955 71699 68581 65602 62750 60023
79 14408 14883 15176 15424 15676 15933 16193 16458
80 4253 3378 2942 2622 2337 2083 1856 1654
82 46807 42037 39412 37350 35396 33544 31789 30126
83 50679 46019 43431 41385 39438 37579 35811 34125
88 55279 48219 44424 41489 38749 36190 33799 31567
IX 18759 17596 16991 16535 16118 15738 15393 15081
81 37107 32414 29888 27935 26108 24401 22806 21315
89 38337 31841 28484 25959 23657 21560 19649 17907
91 33779 35581 36708 37676 38667 39685 40731 41803
92 22805 23154 23365 23544 23723 23903 24086 24269
93 29995 23547 20365 18043 15987 14165 12551 11120
94 17693 16468 15774 15219 14682 14165 13666 13184
95 28268 26491 25480 24666 23879 23116 22378 21663
96 25727 27627 28834 29880 30963 32087 33250 34456
97 19341 19252 19199 19154 19110 19065 19021 18977
98 26276 27321 27968 28519 29082 29654 30238 30834
99 21812 29461 35283 41005 47656 55383 64365 74803
100 21103 18175 16616 15420 14310 13280 12324 11437
X 25900 24763 24316 24077 23960 23969 24109 24386
101 22450 23938 24877 25689 26526 27391 28284 29206
102 20953 22082 22788 23393 24015 24653 25309 25981
110 13002 15506 17235 18822 20555 22447 24514 26771
111 13253 15936 17800 19519 21404 23471 25738 28223
112 15848 20171 23312 26300 29671 33473 37764 42605
113 18727 20440 21541 22505 23511 24563 25662 26810
114 13613 18184 21633 25003 28897 33398 38599 44611
XI 16204 19012 20999 22859 24930 27239 29817 32698
103 26750 26459 26286 26143 25999 25857 25716 25576
104 24784 27766 29724 31462 33300 35247 37306 39487
105 31434 33442 34708 35798 36924 38085 39282 40518
106 15958 21234 25202 29071 33534 38681 44618 51467
107 14715 20124 24282 28397 33209 38836 45416 53112
108 5979 10102 13838 17987 23380 30390 39501 51344
109 5301 9102 12590 16498 21620 28330 37124 48647
XII 10615 14566 17936 21543 26093 31853 39165 48475
115 20788 21503 21944 22318 22699 23086 23479 23880
116 23301 23177 23104 23042 22981 22920 22859 22798
117 34553 30245 27923 26125 24442 22867 21395 20017
118 30565 25625 23053 21108 19326 17695 16202 14836
119 30875 26170 23698 21818 20087 18493 17025 15674
120 31519 28527 26871 25562 24319 23136 22010 20939
121 20305 20273 20254 20238 20222 20206 20190 20174

Volume 1 The Urban Service Plan
61
Annex B. Population densities in people per km2 by Ward (1-141) and Borough (I-XV)
W / B 2001 2011 2017 2022 2027 2032 2037 2042
122 11076 12386 13245 14006 14811 15662 16562 17514
123 16133 18621 20295 21803 23424 25166 27036 29046
XIII 20379 20159 20144 20199 20312 20486 20718 21010
124 13468 15262 16451 17513 18643 19846 21127 22490
125 14661 15711 16377 16954 17550 18168 18807 19469
126 9203 10659 11640 12527 13482 14509 15614 16804
127 10760 12855 14304 15635 17090 18681 20419 22320
128 17342 16838 16542 16300 16062 15827 15595 15367
129 18448 18774 18972 19139 19307 19477 19648 19821
130 25669 22282 20468 19070 17767 16553 15423 14369
131 21344 21845 22152 22411 22673 22937 23205 23476
132 30641 28982 28030 27260 26512 25785 25077 24388
XIV 15497 16254 16795 17300 17855 18466 19135 19866
133 46978 50336 52464 54307 56215 58188 60232 62349
134 96040 93299 91692 90375 89077 87797 86535 85289
135 95168 99803 102693 105163 107694 110284 112937 115656
136 41189 40512 40112 39782 39453 39128 38805 38486
137 32068 31002 30379 29870 29369 28878 28393 27917
138 42972 35698 31938 29111 26533 24183 22041 20089
139 27869 26005 24947 24098 23278 22486 21722 20983
140 19159 19731 20082 20379 20681 20987 21298 21613
141 11956 15786 18650 21430 24625 28295 32513 37359
XV 30672 31026 31483 32022 32716 33584 34642 35915
Total 25272 24783 24883 25206 25767 26598 27740 29251

Volume 1 The Urban Service Plan
62
Annex C. Slum population by ward (1-141) and borough (I-XV)
W / B 2001 2011 2017 2022 2027 2032 2037 2042
1 26788 28748 29992 31069 32186 33342 34541 35782
2 12351 12453 12515 12566 12618 12670 12722 12775
3 32875 32528 32321 32150 31980 31810 31642 31474
4 17179 14469 13053 11980 10995 10090 9261 8499
5 8487 7488 6946 6524 6128 5756 5406 5078
6 38876 33711 30947 28818 26836 24989 23270 21670
7 7281 6837 6583 6379 6182 5990 5805 5625
8 0 0 0 0 0 0 0 0
9 8683 6997 6147 5518 4953 4447 3992 3583
I 152520 143231 138504 135004 131878 129094 126639 124486
10 4874 4001 3554 3220 2918 2644 2395 2170
11 7561 6404 5796 5335 4909 4518 4158 3827
12 7602 5663 4745 4095 3535 3051 2633 2272
15 13971 12602 11845 11250 10684 10147 9637 9152
16 7728 6271 5531 4983 4488 4043 3642 3280
17 3933 3277 2937 2681 2447 2234 2039 1862
18 3479 3089 2877 2711 2554 2407 2268 2137
19 12633 10929 10020 9320 8669 8063 7500 6976
20 2667 2804 2889 2962 3037 3114 3192 3273
II 64448 55040 50194 46557 43241 40221 37464 34949
13 18852 19998 20719 21340 21979 22637 23315 24014
14 42527 45671 47668 49398 51192 53050 54976 56972
29 46320 52930 57341 61296 65524 70043 74874 80038
30 15965 16818 17350 17808 18277 18759 19253 19761
31 19723 21154 22062 22848 23663 24506 25379 26284
32 17096 16675 16427 16224 16023 15824 15628 15434
33 19107 19860 20325 20722 21126 21538 21958 22386
34 15307 16492 17247 17902 18582 19288 20021 20781
35 17365 19661 21009 22298 23665 25117 26657 28292
III 212262 229259 240148 249836 260031 270762 282061 293962
21 7334 7079 6931 6810 6690 6573 6458 6345
22 867 703 620 558 502 452 407 367
23 1165 972 871 796 727 664 606 554
24 5909 5998 6052 6098 6144 6190 6237 6284
25 3518 2562 2118 1808 1542 1316 1123 959
26 6729 5575 4980 4533 4126 3755 3418 3111
27 5649 4702 4212 3843 3506 3199 2919 2663
28 25428 24527 24002 23573 23152 22738 22332 21932
38 8249 8619 8848 9044 9244 9449 9659 9872
39 13840 10429 8801 7640 6632 5757 4998 4338
IV 78688 71166 67435 64703 62265 60093 58157 56425
36 14535 15685 16418 17055 17717 18405 19119 19861
37 8142 8140 8138 8137 8136 8135 8134 8132
40 3641 3068 2768 2541 2332 2140 1965 1803

Volume 1 The Urban Service Plan
63
Annex C. Slum population by ward (1-141) and borough (I-XV)
W / B 2001 2011 2017 2022 2027 2032 2037 2042
41 5021 3891 3340 2940 2588 2278 2006 1766
42 0 0 0 0 0 0 0 0
43 4296 2557 1873 1445 1115 860 664 512
44 10456 9007 8236 7644 7095 6585 6112 5673
45 0 0 0 0 0 0 0 0
48 5725 5340 5121 4946 4777 4614 4456 4303
49 2869 2658 2539 2444 2353 2265 2180 2099
50 0 0 0 0 0 0 0 0
V 54685 50346 48433 47152 46113 45282 44636 44149
46 5317 2824 1932 1408 1026 748 89272 397
47 0 0 0 0 0 0 0 0
51 3217 2680 2402 2192 2001 1826 1667 1521
52 6531 4606 3735 3137 2634 2212 1858 1560
53 3896 3406 3141 2937 2746 2567 2400 2244
54 984 885 830 787 746 708 671 636
55 8810 8056 7635 7301 6982 6676 6384 6105
60 10040 8453 7624 6995 6418 5889 5404 4958
61 8317 7516 7073 6724 6392 6077 5777 5492
62 8067 5958 4968 4269 3669 3153 2710 2329
VI 55179 44384 39340 35750 32614 29856 26871 25242
56 35862 36257 36496 36697 36898 37101 37305 37509
57 38898 42782 45296 47504 49819 52247 54794 57465
58 86361 88395 89638 90688 91749 92824 93911 95010
59 54952 57710 59430 60904 62413 63961 65546 67170
63 4183 3200 2725 2384 2085 1824 1595 1395
64 14796 17115 18678 20088 21606 23237 24992 26879
65 73653 66545 62614 59516 56571 53773 51111 48583
66 50604 70800 86604 102438 121168 143321 169525 200520
67 44124 45651 46592 47878 48205 49032 49874 50729
VII 403433 428455 448073 468097 490514 517320 548653 585260
68 2973 2552 2329 2158 1999 1853 1716 1590
69 5306 5139 5041 4961 4883 4805 4729 4654
70 648 379 275 210 161 123 94 72
71 5088 4485 4159 3905 3666 3442 3232 3035
72 2997 2351 2032 1799 1593 1411 1250 1107
73 6073 5829 5687 5572 5459 5348 5240 5133
84 4185 3443 3063 2778 2520 2286 2074 1881
85 10997 10396 10052 9773 9503 9240 8984 8735
86 3935 2978 2520 2193 1908 1660 1444 1256
87 0 0 0 0 0 0 0 0
90 6669 5654 5120 4714 4340 3996 3679 3388
VIII 48871 43206 40278 38063 36032 34164 32442 30851
74 18255 18911 19316 19660 20010 20367 20729 21099
75 16360 15013 14259 13660 13085 12535 12008 11503
76 10714 9792 9277 8869 8479 8106 7749 7408

Volume 1 The Urban Service Plan
64
Annex C. Slum population by ward (1-141) and borough (I-XV)
W / B 2001 2011 2017 2022 2027 2032 2037 2042
77 17413 18142 18594 18979 19372 19774 20184 20602
78 33638 30778 29179 27912 26698 25538 24428 23366
79 30120 31114 31726 32244 32772 33308 33853 34407
80 3725 2959 2577 2296 2047 1824 1625 1449
82 12443 11175 10477 9929 9410 8917 8451 8009
83 6564 5960 5625 5360 5108 4867 4638 4420
88 12464 10872 10016 9355 8737 8160 7621 7118
IX 161696 154716 151046 148264 145718 143396 141286 139381
81 18325 16007 14760 13795 12893 12050 11263 10526
89 5440 4518 4042 3684 3357 3059 2788 2541
91 7821 8238 8499 8723 8953 9189 9431 9679
92 5645 5731 5784 5828 5872 5917 5962 6007
93 15388 12080 10447 9257 8202 7267 6439 5705
94 6419 5975 5723 5521 5327 5139 4958 4783
95 0 0 0 0 0 0 0 0
96 0 0 0 0 0 0 0 0
97 3402 3386 3377 3369 3361 3353 3346 3338
98 1037 1078 1104 1126 1148 1170 1193 1217
99 0 0 0 0 0 0 0 0
100 2356 2029 1855 1722 1598 1483 1376 1277
X 65833 59042 55591 53025 50711 48627 46756 45073
101 0 0 0 0 0 0 0 0
102 0 0 0 0 0 0 0 0
110 0 0 0 0 0 0 0 0
111 0 0 0 0 0 0 0 0
112 0 0 0 0 0 0 0 0
113 0 0 0 0 0 0 0 0
114 0 0 0 0 0 0 0 0
XI 0 0 0 0 0 0 0 0
103 0 0 0 0 0 0 0 0
104 0 0 0 0 0 0 0 0
105 0 0 0 0 0 0 0 0
106 0 0 0 0 0 0 0 0
107 0 0 0 0 0 0 0 0
108 2618 4423 6059 7875 10237 13306 17295 22480
109 0 0 0 0 0 0 0 0
XII 2618 4423 6059 7875 10237 13306 17295 22480
115 0 0 0 0 0 0 0 0
116 0 0 0 0 0 0 0 0
117 2910 2547 2352 2200 2059 1926 1802 1686
118 3575 2997 2649 2469 2260 2070 1895 1735
119 0 0 0 0 0 0 0 0
120 4282 3876 3650 3473 3304 3143 2990 2845
121 0 0 0 0 0 0 0 0
122 0 0 0 0 0 0 0 0

Volume 1 The Urban Service Plan
65
Annex C. Slum population by ward (1-141) and borough (I-XV)
W / B 2001 2011 2017 2022 2027 2032 2037 2042
123 1713 1977 2155 2315 2487 2672 2871 3084
XIII 12480 11397 10806 10457 10110 9811 9558 9350
124 0 0 0 0 0 0 0 0
125 0 0 0 0 0 0 0 0
126 0 0 0 0 0 0 0 0
127 0 0 0 0 0 0 0 0
128 0 0 0 0 0 0 0 0
129 0 0 0 0 0 0 0 0
130 0 0 0 0 0 0 0 0
131 661 677 686 694 702 710 719 727
132 4231 4002 3870 3764 3661 3560 3463 3368
XIV 4892 4679 4556 4458 4363 4270 4182 4095
133 15105 16185 16869 17462 18075 18710 19367 20047
134 35887 34863 34262 33770 33285 32807 32335 31870
135 28663 30059 30929 31674 32436 33216 34015 34834
136 19480 19160 18971 18815 18659 18506 18353 18202
137 19722 19066 18684 18371 18062 17760 17462 17170
138 18795 15613 13969 12732 11605 10577 9640 8786
139 13373 12479 11971 11564 11170 10790 10423 10069
140 5652 5821 5924 6012 6101 6191 6283 6376
141 11027 14559 17201 19765 22711 26096 29986 34456
XV 167704 167805 168780 170165 172104 174653 177864 181810
Total 1485309 1467149 1469243 1479406 1495931 1520855 1553864 1597513

Volume 1 The Urban Service Plan
66
Annex D. Households by Ward (1-141) and Borough (I-XV) W / B 2001 2011 2017 2022 2027 2032 2037 2042
1 10038 10956 11546 12062 12601 13165 13753 14368
2 10486 12706 14258 15696 17277 19019 20936 23046
3 10799 11908 12627 13260 13924 14622 15354 16123
4 8642 7541 6948 6490 6063 5663 5290 4941
5 5322 5125 5011 4917 4825 4735 4647 4560
6 8750 6795 5839 5145 4534 3996 3521 3103
7 4479 4745 4912 5056 5204 5357 5514 5675
8 4366 4536 4641 4731 4822 4915 5010 5107
9 4265 3859 3634 3457 3289 3128 2976 2830
I 67147 68171 69417 70815 71205 72456 73871 79754
10 5872 4390 3687 3189 2757 2384 2061 1782
11 5260 4889 4679 4510 4348 4192 4041 3896
12 5701 4459 3848 3403 3009 2661 2354 2081
15 5803 6749 7389 7969 8593 9268 9994 10778
16 4263 3049 2493 2109 1783 1508 1275 1078
17 5062 4850 4726 4626 4528 4432 4338 4246
18 5594 4808 4391 4071 3775 3500 3245 3008
19 5488 5474 5466 5460 5453 5446 5439 5433
20 4271 5418 6249 7039 7928 8929 10057 11327
II 47314 44086 42929 42374 40123 39118 38224 43630
13 6684 7394 7856 8263 8691 9141 9615 10113
14 10986 12964 14319 15555 16897 18355 19940 21661
29 7446 8335 8919 9437 9985 10564 11177 11826
30 5932 6848 7465 8021 8618 9260 9949 10690
31 7606 8302 8749 9141 9550 9977 10423 10890
32 9996 10063 10104 10138 10172 10206 10240 10275
33 9428 10959 11994 12931 13942 15031 16205 17471
34 6266 7250 7913 8512 9156 9848 10594 11395
35 6746 7897 8680 9392 10162 10995 11896 12871
III 71090 80014 86000 91389 97198 103389 110028 117192
21 4413 3934 3671 3466 3273 3090 2917 2754
22 3218 2454 2086 1822 1591 1389 1213 1060
23 3797 3462 3275 3127 2986 2852 2723 2600
24 3558 3684 3761 3827 3894 3962 4032 4102
25 7654 6312 5622 5105 4636 4210 3823 3471
26 6023 5049 4542 4159 3808 3486 3192 2922
27 4831 4730 4671 4622 4573 4525 4478 4431
28 7286 7760 8059 8317 8584 8859 9142 9435
38 5449 6359 6977 7537 8142 8795 9501 10264
39 4158 3365 2964 2666 2399 2158 1941 1747
IV 50387 47109 45628 44649 43652 42951 42411 42786
36 3871 3126 2749 2471 2220 1995 1793 1611
37 4275 4002 3847 3722 3601 3484 3371 3262
40 4948 4217 3831 3537 3265 3014 2782 2569

Volume 1 The Urban Service Plan
67
Annex D. Households by Ward (1-141) and Borough (I-XV) W / B 2001 2011 2017 2022 2027 2032 2037 2042
41 3814 3091 2725 2453 2208 1988 1790 1611
42 4169 3331 2911 2602 2326 2079 1858 1661
43 4083 2138 1450 1050 760 550 398 288
44 5061 4214 3775 3445 3143 2868 2617 2388
45 2843 1543 1069 788 580 428 315 232
48 5159 5017 4934 4865 4798 4731 4665 4601
49 3601 2719 2297 1996 1734 1507 1309 1138
50 3861 3710 3622 3550 3480 3411 3343 3277
V 45685 37107 33210 30477 28262 26268 24534 22637
46 3849 1955 1302 928 661 471 336 239
47 3783 2559 2024 1665 1369 1126 926 762
51 3666 3415 3272 3158 3048 2941 2839 2740
52 4185 2873 2292 1899 1573 1304 1080 895
53 5509 5100 4869 4685 4507 4337 4173 4015
54 6612 6216 5990 5808 5631 5459 5293 5132
55 6946 6174 5752 5423 5113 4820 4544 4284
60 7256 6512 6103 5781 5477 5188 4915 4656
61 5857 4909 4416 4043 3702 3389 3103 2841
62 7484 5147 4112 3410 2828 2345 1945 1613
VI 55147 44859 40132 36799 33384 30673 28264 27177
56 7901 7800 7740 7690 7641 7592 7543 7494
57 9236 10035 10547 10994 11459 11945 12451 12978
58 16257 15650 15297 15008 14726 14448 14176 13909
59 12687 12876 12991 13088 13185 13284 13382 13482
63 6307 4777 4044 3520 3063 2666 2320 2019
64 4627 4834 4962 5072 5184 5298 5415 5535
65 13292 11672 10797 10118 9481 8885 8326 7802
66 13420 19883 25172 30639 37294 45395 55255 67256
67 11662 12478 12994 13441 13903 14381 14876 15387
VII 95389 100005 104544 109570 113043 119024 126120 145862
68 5702 5128 4812 4564 4328 4105 3893 3691
69 8696 8522 8420 8335 8251 8169 8086 8005
70 6575 3996 2964 2311 1802 1404 1095 854
71 7271 7239 7219 7203 7187 7171 7155 7139
72 5159 4331 3899 3573 3273 2999 2748 2518
73 5456 5767 5961 6129 6301 6478 6660 6847
84 4769 4039 3656 3365 3097 2850 2623 2414
85 6762 6449 6269 6122 5979 5839 5702 5569
86 5727 4613 4051 3635 3263 2928 2628 2358
87 3121 3337 3474 3592 3715 3841 3972 4107
90 5264 4628 4284 4017 3767 3532 3312 3105
VIII 64502 58049 55010 52845 50814 49105 47590 46608
74 7123 6940 6832 6744 6657 6571 6486 6402
75 4806 3865 3392 3042 2728 2446 2194 1967
76 5106 4601 4323 4104 3896 3698 3511 3333

Volume 1 The Urban Service Plan
68
Annex D. Households by Ward (1-141) and Borough (I-XV) W / B 2001 2011 2017 2022 2027 2032 2037 2042
77 7802 8159 8381 8570 8764 8962 9165 9372
78 10668 9199 8417 7816 7258 6740 6259 5812
79 8676 8769 8825 8872 8919 8967 9015 9063
80 7837 6593 5943 5451 4999 4585 4205 3857
82 9469 8727 8309 7977 7658 7351 7057 6775
83 4952 4726 4595 4489 4385 4283 4185 4088
88 6002 5387 5049 4784 4532 4294 4068 3854
IX 72441 66965 64066 61847 60033 58214 56544 54523
81 9897 8898 8348 7916 7506 7117 6748 6399
89 5836 5304 5009 4775 4552 4340 4138 3945
91 8389 10141 11363 12494 13737 15103 16606 18258
92 8645 10209 11280 12258 13321 14476 15731 17095
93 12386 9988 8779 7883 7079 6357 5709 5127
94 6295 5915 5699 5524 5355 5191 5032 4878
95 7123 7708 8082 8407 8745 9097 9464 9844
96 7207 9115 10494 11801 13272 14926 16785 18877
97 8771 9869 10593 11237 11920 12644 13412 14227
98 7297 8719 9702 10605 11593 12672 13852 15142
99 4448 6862 8902 11057 13734 17059 21189 26319
100 7359 7431 7475 7512 7549 7586 7623 7660
X 93653 100161 105726 111470 116293 123112 131041 147770
101 8946 10674 11868 12964 14161 15468 16897 18457
102 4854 5878 6593 7255 7983 8785 9667 10638
110 5798 8090 9879 11669 13784 16281 19232 22716
111 7556 10309 12421 14508 16946 19794 23121 27006
112 5907 8316 10210 12115 14375 17056 20237 24012
113 7316 9084 10343 11526 12843 14311 15946 17769
114 7018 10309 12984 15737 19073 23116 28017 33956
XI 47395 62660 74299 85774 99763 115777 134609 154554
103 6324 7049 7524 7943 8386 8854 9348 9869
104 7374 9716 11464 13160 15105 17339 19903 22846
105 4881 5879 6574 7215 7918 8690 9537 10467
106 7124 10909 14087 17432 21571 26693 33031 40874
107 9335 14088 18034 22155 27217 33436 41075 50460
108 9334 18930 28933 41203 58677 83562 119001 169468
109 8756 17357 26169 36845 51875 73038 102834 144785
XII 53128 83928 112785 145952 188628 247134 326128 448769
115 7074 8208 8973 9666 10411 11215 12080 13012
116 6461 7289 7835 8322 8839 9388 9971 10590
117 5081 4385 4014 3729 3465 3219 2990 2778
118 5938 5398 5099 4861 4635 4420 4214 4018
119 4074 3444 3113 2862 2632 2420 2225 2045
120 5155 5211 5245 5273 5302 5330 5359 5388
121 6156 5904 5758 5638 5522 5408 5296 5186
122 7996 10109 11637 13084 14712 16542 18600 20913

Volume 1 The Urban Service Plan
69
Annex D. Households by Ward (1-141) and Borough (I-XV) W / B 2001 2011 2017 2022 2027 2032 2037 2042
123 7215 9428 11070 12654 14465 16536 18903 21608
XIII 55150 59376 62744 66091 68360 71895 75824 85540
124 7560 8485 9093 9633 10205 10811 11453 12133
125 9984 12076 13536 14887 16373 18007 19803 21780
126 6465 8566 10142 11674 13437 15468 17805 20495
127 8706 11984 14516 17031 19981 23442 27503 32267
128 7520 8132 8522 8862 9216 9583 9965 10363
129 9087 10393 11265 12048 12885 13780 14737 15760
130 5980 5353 5008 4739 4483 4242 4013 3797
131 7301 8031 8504 8919 9355 9811 10290 10793
132 6771 6796 6812 6824 6837 6850 6863 6876
XIV 69374 79816 87399 94617 101685 110145 119543 134262
133 4360 4271 4219 4175 4133 4090 4048 4007
134 5869 4977 4508 4151 3823 3520 3242 2985
135 5019 5093 5137 5175 5213 5251 5289 5328
136 4029 3897 3821 3758 3696 3635 3575 3516
137 2974 1972 1541 1255 1022 832 677 552
138 4340 2815 2171 1749 1408 1134 913 736
139 6210 5750 5490 5282 5083 4891 4706 4528
140 3935 4253 4456 4633 4817 5008 5206 5413
141 5048 6930 8382 9821 11507 13483 15798 18510
XV 41784 39958 39725 39999 38574 38512 38638 45574
Total 929586 972264 1023612 1084668 1122107 1196509 1289077 1596638