
TECHNICAL APPENDIX A: DATABASE …dorpjr/VTRA/FINAL REPORT/083108/VTRA...Appendix A-2 Puget Sound...
126
August 31, 2008 TECHNICAL APPENDIX A: DATABASE CONSTRUCTION AND ANALYSIS Assessment of Oil Spill Risk due to Potential Increased Vessel Traffic at Cherry Point, Washington Submitted by VTRA TEAM: Johan Rene van Dorp (GWU), John R. Harrald (GWU), Jason R.. W. Merrick (VCU) and Martha Grabowski (RPI)
Transcript of TECHNICAL APPENDIX A: DATABASE …dorpjr/VTRA/FINAL REPORT/083108/VTRA...Appendix A-2 Puget Sound...
August 31, 2008
TECHNICAL APPENDIX A: DATABASE CONSTRUCTION AND ANALYSIS
Assessment of Oil Spill Risk due to Potential Increased
Vessel Traffic at Cherry Point, Washington
Submitted by VTRA TEAM:
Johan Rene van Dorp (GWU), John R. Harrald (GWU),
Jason R.. W. Merrick (VCU) and Martha Grabowski (RPI)
Vessel Traffic Risk Assessment (VTRA) - Final Report 08/31/08
Technical Appendix A: Database Construction and Analysis A-2
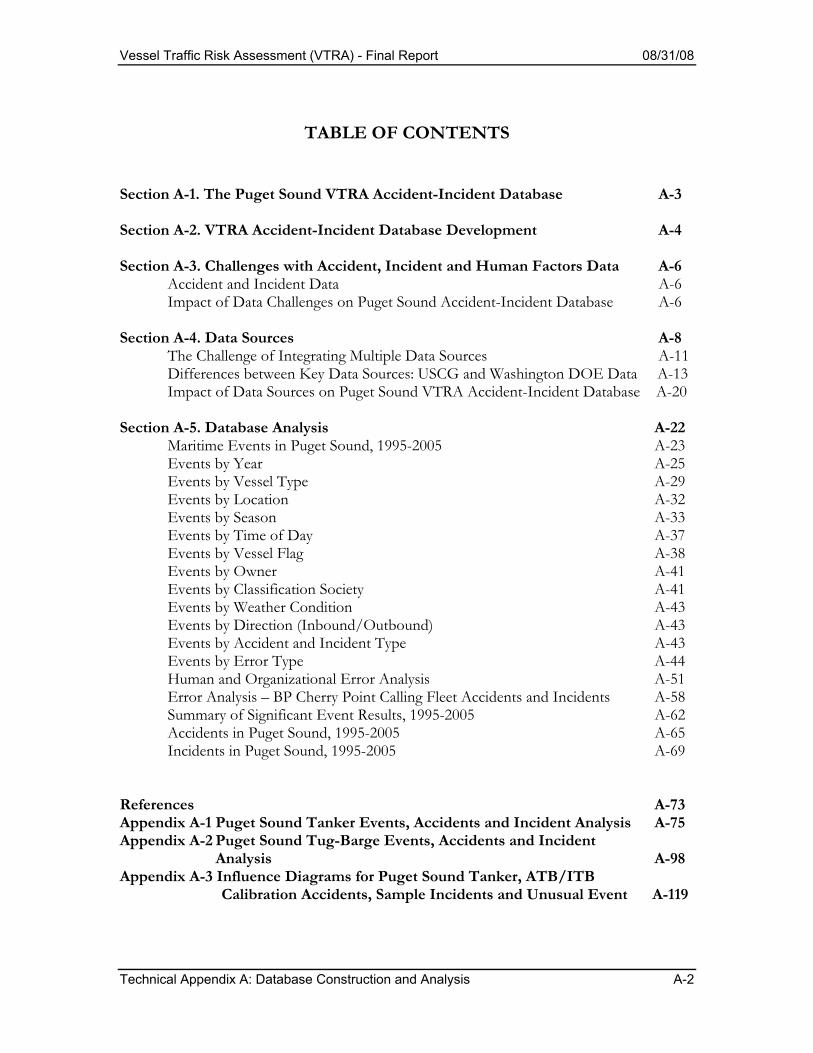
TABLE OF CONTENTS
Section A-1. The Puget Sound VTRA Accident-Incident Database A-3 Section A-2. VTRA Accident-Incident Database Development A-4 Section A-3. Challenges with Accident, Incident and Human Factors Data A-6 Accident and Incident Data A-6 Impact of Data Challenges on Puget Sound Accident-Incident Database A-6 Section A-4. Data Sources A-8 The Challenge of Integrating Multiple Data Sources A-11 Differences between Key Data Sources: USCG and Washington DOE Data A-13 Impact of Data Sources on Puget Sound VTRA Accident-Incident Database A-20 Section A-5. Database Analysis A-22 Maritime Events in Puget Sound, 1995-2005 A-23 Events by Year A-25 Events by Vessel Type A-29 Events by Location A-32 Events by Season A-33 Events by Time of Day A-37 Events by Vessel Flag A-38 Events by Owner A-41 Events by Classification Society A-41 Events by Weather Condition A-43 Events by Direction (Inbound/Outbound) A-43 Events by Accident and Incident Type A-43 Events by Error Type A-44 Human and Organizational Error Analysis A-51 Error Analysis – BP Cherry Point Calling Fleet Accidents and Incidents A-58 Summary of Significant Event Results, 1995-2005 A-62 Accidents in Puget Sound, 1995-2005 A-65 Incidents in Puget Sound, 1995-2005 A-69 References A-73 Appendix A-1 Puget Sound Tanker Events, Accidents and Incident Analysis A-75 Appendix A-2 Puget Sound Tug-Barge Events, Accidents and Incident Analysis A-98 Appendix A-3 Influence Diagrams for Puget Sound Tanker, ATB/ITB Calibration Accidents, Sample Incidents and Unusual Event A-119
Vessel Traffic Risk Assessment (VTRA) - Final Report 08/31/08
Technical Appendix A: Database Construction and Analysis A-3
Appendix A: Database Construction and Analysis
In order to develop accident and incident frequencies as input to the BP Puget Sound Vessel
Traffic Risk Assessment (VTRA) maritime simulation, an analysis of maritime accidents and
incidents in Puget Sound from 1995-2005 was undertaken. Accident and incident records for
the time period and for the geographic scope of the project were solicited, and an accident-
incident database was constructed. The data were analyzed, and the results of that analysis
are presented in this report.
A-1. The Puget Sound VTRA Accident-Incident Database The Puget Sound VTRA accident-incident database is comprised of maritime accident,
incident, and unusual event records for tank, tug-barge, cargo, ferry, and fishing vessels over
20 gross tons underway or at anchor, for the years 1995-2005 in Puget Sound, in the State of
Washington. The database takes the form of multiple Microsoft EXCEL spreadsheets
(Table A-1) with a common format describing various accidents and incidents. The database
is the compilation of all accidents, incidents, and unusual events gathered from the project’s
sources, filtered to include only those relevant records for the waterways of Puget Sound.
Table A-1. Database Files
Tanker Accidents and Incidents Tug and Barge Accidents and Incidents Cargo Accidents and Incidents (Public, Freighter, Bulk Carrier, Container, and Passenger Vessel) WSF (Washington State Ferries) Accidents and Incidents Fishing Vessel Accidents and Incidents Unusual Events Personnel Casualties
The geographic scope of the VTRA project, and of the events recorded in the database,
include those listed in Table A-2: the Strait of Georgia (Ferndale southward), Rosario Strait,
Haro Strait/Boundary Pass, Guemes Channel, Saddlebag, Puget Sound, and Strait of Juan de
Fuca (west to 8 miles west of Buoy “J”).
Vessel Traffic Risk Assessment (VTRA) - Final Report 08/31/08
Technical Appendix A: Database Construction and Analysis A-4
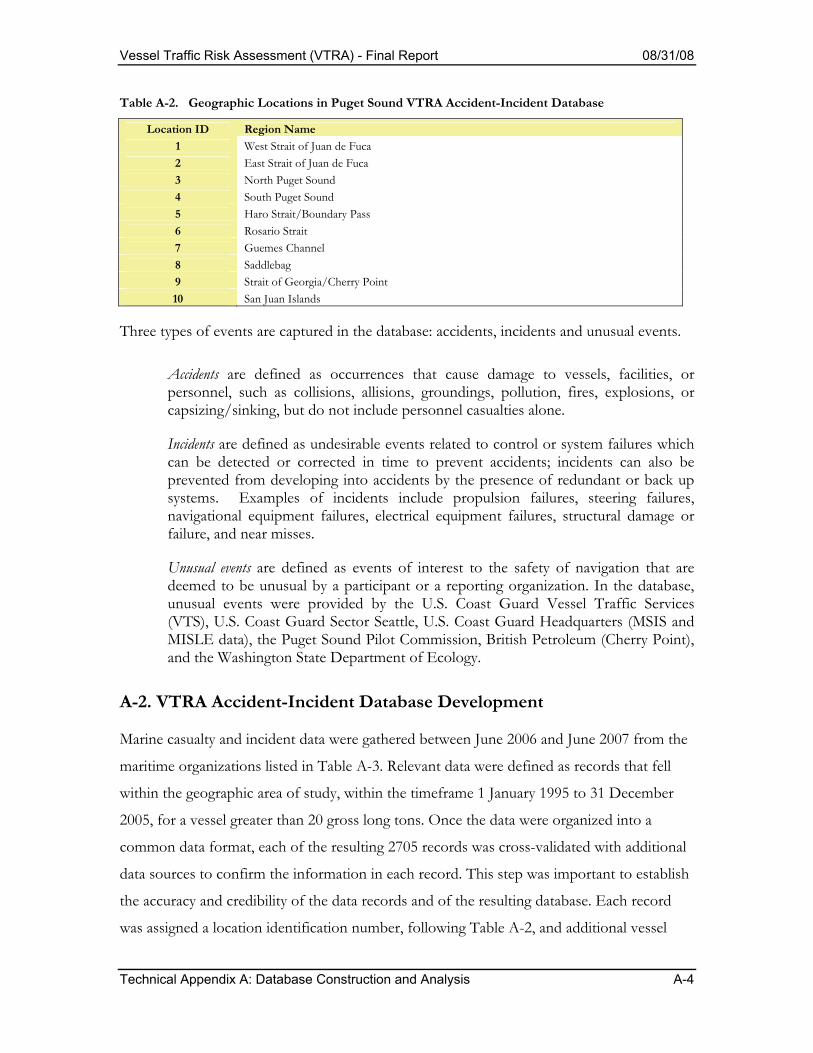
Table A-2. Geographic Locations in Puget Sound VTRA Accident-Incident Database
Location ID Region Name 1 West Strait of Juan de Fuca 2 East Strait of Juan de Fuca 3 North Puget Sound 4 South Puget Sound 5 Haro Strait/Boundary Pass 6 Rosario Strait 7 Guemes Channel 8 Saddlebag 9 Strait of Georgia/Cherry Point 10 San Juan Islands
Three types of events are captured in the database: accidents, incidents and unusual events.
Accidents are defined as occurrences that cause damage to vessels, facilities, or personnel, such as collisions, allisions, groundings, pollution, fires, explosions, or capsizing/sinking, but do not include personnel casualties alone.
Incidents are defined as undesirable events related to control or system failures which can be detected or corrected in time to prevent accidents; incidents can also be prevented from developing into accidents by the presence of redundant or back up systems. Examples of incidents include propulsion failures, steering failures, navigational equipment failures, electrical equipment failures, structural damage or failure, and near misses.
Unusual events are defined as events of interest to the safety of navigation that are deemed to be unusual by a participant or a reporting organization. In the database, unusual events were provided by the U.S. Coast Guard Vessel Traffic Services (VTS), U.S. Coast Guard Sector Seattle, U.S. Coast Guard Headquarters (MSIS and MISLE data), the Puget Sound Pilot Commission, British Petroleum (Cherry Point), and the Washington State Department of Ecology.
A-2. VTRA Accident-Incident Database Development Marine casualty and incident data were gathered between June 2006 and June 2007 from the
maritime organizations listed in Table A-3. Relevant data were defined as records that fell
within the geographic area of study, within the timeframe 1 January 1995 to 31 December
2005, for a vessel greater than 20 gross long tons. Once the data were organized into a
common data format, each of the resulting 2705 records was cross-validated with additional
data sources to confirm the information in each record. This step was important to establish
the accuracy and credibility of the data records and of the resulting database. Each record
was assigned a location identification number, following Table A-2, and additional vessel

Vessel Traffic Risk Assessment (VTRA) - Final Report 08/31/08
Technical Appendix A: Database Construction and Analysis A-5
characteristics were obtained from proprietary and open source databases. Once the records
were complete, they were analyzed, and the results reported in this document.
Table A-3. Puget Sound VTRA Accident-Incident Database Contributors (Steward, 2007)
United States Coast Guard Headquarters
United States Coast Guard Sector Seattle
United States Coast Guard Sector Portland
United States Coast Guard Vessel Traffic Service Seattle
United States Coast Guard Marine Incident Database (Online)
Washington State Department of Ecology
Lloyd’s List Marine Intelligence Unit Portal (Online)
Crowley Maritime Corporation
British Petroleum, Cherry Point Facility
Puget Sound Pilot Commission
Washington State Ferries
Seattle Post – Intelligencer
San Juan Islander
The main source for vessel characteristics in the VTRA database was Lloyd’s Marine
Intelligence Unit. For tanker vessels, the Clarkson Register was used to identify vessel
owner evolution, important because of vessel and industry changes over the time period
(1995-2005). Vessels were researched to identify the vessels’ gross tonnage (long tons), its
flag at the time of the casualty event, the owner at the time of the casualty event, the
classification society at the time of the casualty event, its hull type, and vessel type. Records
were separated into the following categories: Tanker Accidents and Incidents, Tug and Barge
Accidents and Incidents, Cargo (Public, Freighter, Bulk Carrier, Container, and Passenger
Vessel) Accidents and Incidents, WSF (Washington State Ferries) Accidents and Incidents,
and Fishing Accident and Incidents.
Vessel Traffic Risk Assessment (VTRA) - Final Report 08/31/08
Technical Appendix A: Database Construction and Analysis A-6
A-3. Challenges with Accident, Incident and Human Factors Data
Accident and Incident Data
Problems with data to support modeling and analysis in marine transportation are well-
documented (National Research Council, 1983; 1990; 1994; 2003). Data challenges in marine
transportation have grown with the proliferation of electronic data, as the data have a
varying storage requirements, exist in various formats, are gathered and collected from
various agencies and individuals, with varying degrees of compatibility (National Research
Council, 2003). As a result, data validation, compatibility, integration and harmonization are
increasingly significant challenges in maritime data and risk assessments. In addition, no
standard reliable database for near-miss reporting or exposure data has been developed in
marine transportation, although the United States General Accounting Office, Congress and
the National Academies/National Research Council have been exploring methods to
improve the collection, representation, integration and sharing of accident and incident data
(National Research Council, 1994; U.S. Department of Homeland Security, 2005;
Transportation Research Board, 2008).
Impact of Data Challenges on Puget Sound VTRA Accident-Incident Database
In marine transportation, as in other domains, event analyses are constrained by the quality
of the data gathered, the maturity of the associated reporting system, and the training and
background of the investigator and reporter (who may not be the same person). Such
constraints place limits on the adequacy and strength of analyses conducted with maritime
safety data. These limitations have been characterized and analyzed extensively in reports
prepared by the National Academies/National Research Council, the National
Transportation Safety Board, and the U.S. General Accounting Office (National Research
Council, 1990; 1994; 1999; 2003; National Transportation Safety Board, 1994).
The data records that comprised the VTRA accident-incident database required a significant
amount of reconciliation and cross-validation across data sources to ensure that the records
were accurate, that they captured the entire event of record, and to reduce redundancy in the

Vessel Traffic Risk Assessment (VTRA) - Final Report 08/31/08
Technical Appendix A: Database Construction and Analysis A-7
final database. Reconciliation and cross-validation was particularly challenging, as the data
records from one agency might capture the initial part of an event of record (e.g., an initiating
mechanical failure), while the data records from another reporting agency, describing the same
event, might capture the initiating event as well as the series of cascading and related events
(e.g., other mechanical failures, an eventual accident).
Absent a standard incident and accident coding scheme, common data storage and
transmission formats, and a common data dictionary defining accidents, incidents, unusual
events and contributory situations, database construction and data record reconciliation
encompassed several time-consuming steps: review of all available paper and electronic
sources, additional search in many cases to confirm the events, and requests for additional
information to ensure that the entire event was captured in the database. Resolution of open
items in the database required search and compilation of data sources from maritime safety
sources, as well as from vessel, traffic, transit, meteorological, charting and geographic
information, as from the sources listed in Table A-4. This required retrieval of archival records
from local (Puget Sound), state (Washington State), national (U.S. government) and
international (Lloyd’s List, Equasis, Clarkson’s Register) sources, for several thousand events.
The lack of a standard event coding scheme had impact on the quality of the data collected, as
discussed in the following section. For instance, the Coast Guard’s MISLE database uses a
pre-determined data set (a data dictionary) from which to classify events. Pre-MISLE data
dictionaries included more detailed narratives that permitted descriptive root cause analyses,
and other current classification schemes, such as that of the Pacific States-British Columbia
Task Force (Pacific States/British Columbia Oil Spill Task Force, 1995; 1997; 2007), provide
other descriptive classification schemes. Since the data collected at the time of a given event
are in large part determined by the questions posed during the evidence gathering process and
the data sets used to categorize the events, a standard and comprehensive data dictionary from
which to classify and describe events is an essential element of a well-developed safety
information system. As will be seen in the following section, the lack of a standard descriptive
data dictionary used by all data-gathering organizations to codify events, as well as the lack of
international data storage and transmission standards used by federal, state, local and private
Vessel Traffic Risk Assessment (VTRA) - Final Report 08/31/08
Technical Appendix A: Database Construction and Analysis A-8
organizations to capture maritime safety data, occasioned an enormous amount of integration,
reconciliation and verification effort during the VTRA accident-incident database construction.
A-4. Data Sources
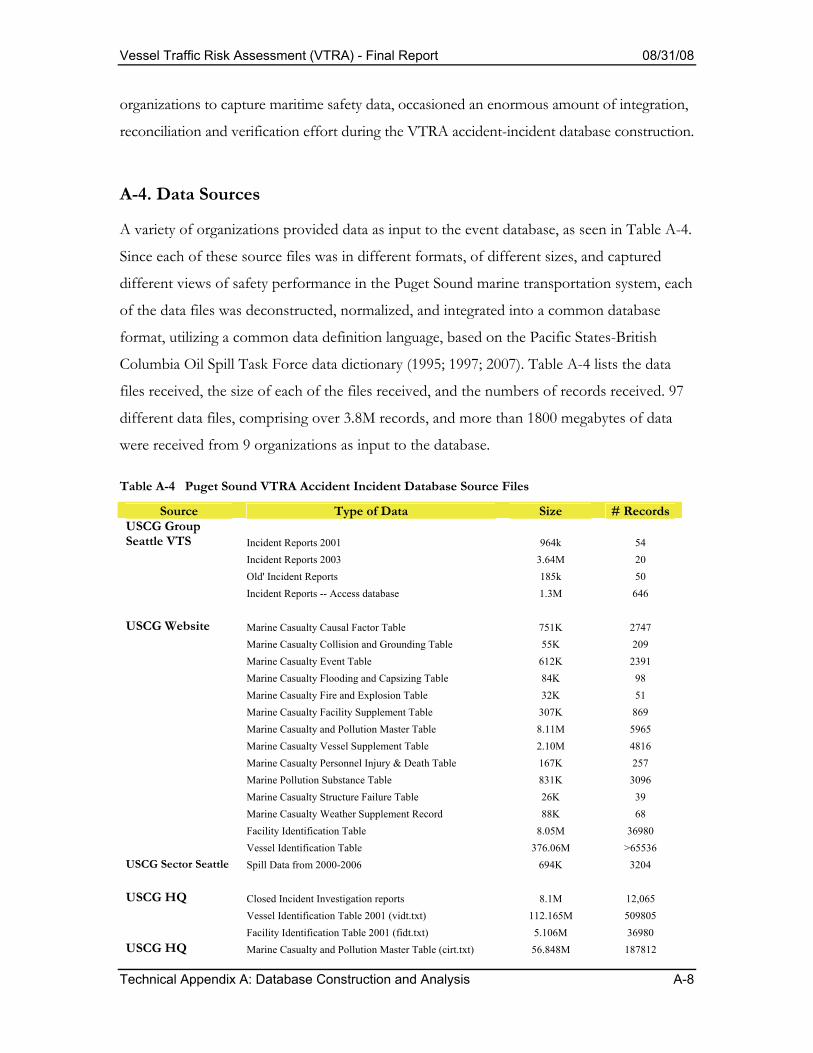
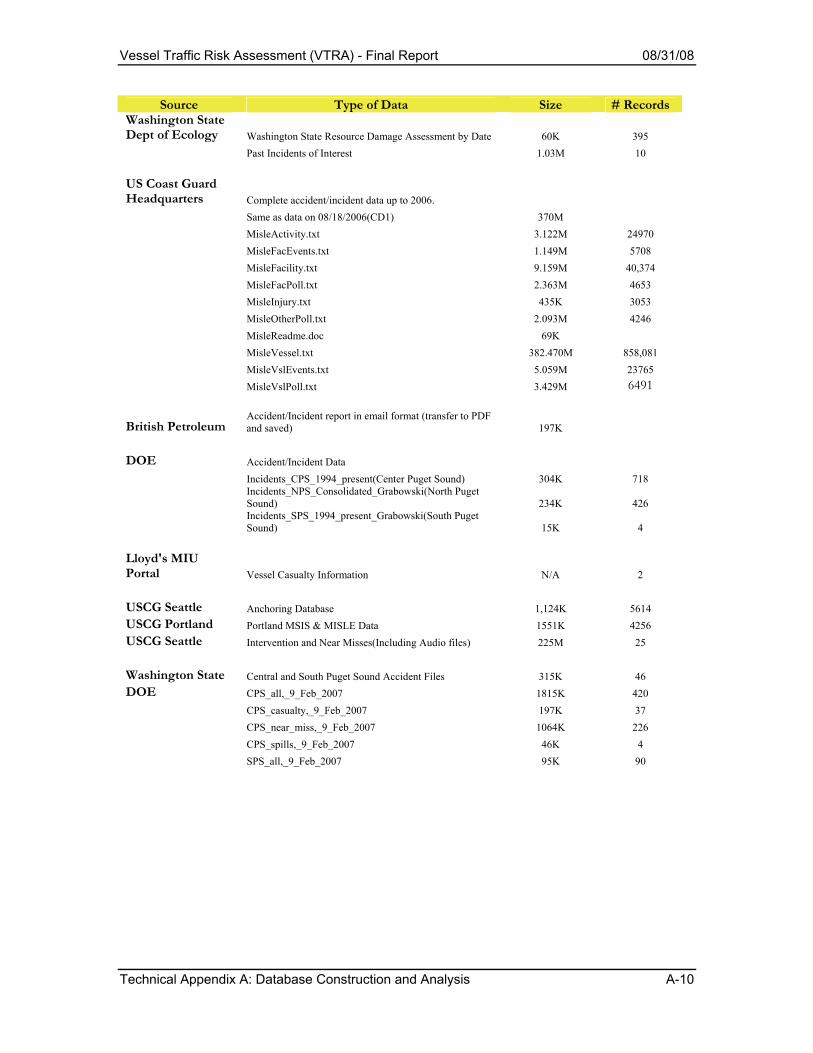
A variety of organizations provided data as input to the event database, as seen in Table A-4.
Since each of these source files was in different formats, of different sizes, and captured
different views of safety performance in the Puget Sound marine transportation system, each
of the data files was deconstructed, normalized, and integrated into a common database
format, utilizing a common data definition language, based on the Pacific States-British
Columbia Oil Spill Task Force data dictionary (1995; 1997; 2007). Table A-4 lists the data
files received, the size of each of the files received, and the numbers of records received. 97
different data files, comprising over 3.8M records, and more than 1800 megabytes of data
were received from 9 organizations as input to the database.
Table A-4 Puget Sound VTRA Accident Incident Database Source Files
Source Type of Data Size # Records USCG Group Seattle VTS Incident Reports 2001 964k 54 Incident Reports 2003 3.64M 20 Old' Incident Reports 185k 50 Incident Reports -- Access database 1.3M 646 USCG Website Marine Casualty Causal Factor Table 751K 2747 Marine Casualty Collision and Grounding Table 55K 209 Marine Casualty Event Table 612K 2391 Marine Casualty Flooding and Capsizing Table 84K 98 Marine Casualty Fire and Explosion Table 32K 51 Marine Casualty Facility Supplement Table 307K 869 Marine Casualty and Pollution Master Table 8.11M 5965 Marine Casualty Vessel Supplement Table 2.10M 4816 Marine Casualty Personnel Injury & Death Table 167K 257 Marine Pollution Substance Table 831K 3096 Marine Casualty Structure Failure Table 26K 39 Marine Casualty Weather Supplement Record 88K 68 Facility Identification Table 8.05M 36980 Vessel Identification Table 376.06M >65536 USCG Sector Seattle Spill Data from 2000-2006 694K 3204 USCG HQ Closed Incident Investigation reports 8.1M 12,065 Vessel Identification Table 2001 (vidt.txt) 112.165M 509805 Facility Identification Table 2001 (fidt.txt) 5.106M 36980 USCG HQ Marine Casualty and Pollution Master Table (cirt.txt) 56.848M 187812

Vessel Traffic Risk Assessment (VTRA) - Final Report 08/31/08
Technical Appendix A: Database Construction and Analysis A-9
Source Type of Data Size # Records Marine Casualty Vessel Supplement Table (civt.txt) 14.688M 155781 Marine Casualty Facility Supplement Table (cift.txt) 4.613M 51400 Marine Casualty Event Table (cevt.txt) 5.724M 108927 Marine Casualty Causal Factor Table (ccft.txt) 7.199M 116864 Marine Casualty Collision and Grounding Table (ccgt.txt) 1.073M 26178 Marine Casualty Structural Failure Table (csft.txt) 101K 2385 Marine Casualty Flooding and Capsizing Table (cfct.txt) 867K 7677 Marine Pollution Substance Table (cpdt.txt) 6.589M 84167 Marine Casualty Personnel Injury Table (cpct.txt) 2.907M 15961 Marine Casualty Fire and Explosion Table (cfet.txt) 272K 2339 Marine Casualty Weather Supplement Record (cwxt.txt) 968K 7133 Pollution Master Table (prit.txt) 11.699M 64421 Pollution Vessel Supplement Record (pvst.txt) 3.477M 28669 Pollution Facility Supplement Record (post.txt) 5.157M 36329 Pre-MIN Pollution Substance Table (psst.txt) 4.922M 66686 Pollution Substance Table (converta.txt) 18.219M 172683 Ticket Investigation Master Table (prittk.txt) 2.503M 23434 Ticket investigation Marine Violation Table (mvcttk.txt) 3.023M 23434 Ticket Investigation Report Table (mtkt.txt) 2.639M 23434 Ticket Investigation Casualty Event Table (tcet.txt) 1.714M 22286 Marine Pollution Substance Table (pssttk.txt) 1.523M 21761 Personnel Injuries/Deaths (pcas.txt) 3.601M 20752 Vessel Casualties (vcas.txt) 15.721M 68592 Master Pollution table (mpir70.txt) 15.79M 98447 Master Pollution Table (mpir80.txt) 22.269M 127967 Coast Guard Response Table (mprc70.txt) 667K 6970 Coast Guard Response Table (mprc80.txt 11.008M 111633 Non-Coast Guard Response Table (mprn70.txt) 636K 17589 Non-Coast Guard Response Table (mprn80.txt) 1.308M 33028 Marine Pollution Facility Table (mpsf70.txt) 3.678M 69921 Marine Pollution Facility Table (mpsf80.txt) 2.453M 83120 Marine Pollution Vessel Table (mpsv70.txt) 955K 28527 Marine Pollution Vessel Table (mpsv80.txt) 1.504M 44580 Marine Pollution Substance Table (mtl70.txt) 7.499M 98448 Marine Pollution Substance Table (mtl80.txt) 10.001M 129751 Marine Violation Table (mv70.txt) 1.664M 32761 Marine Violation Table (mv80.txt) 3.362M 52635
Washington State Ferry Project Puget_Sound_VTS_Unusual_Incident_tblUI 548K 1747 Puget_Sound_VTS_Unusual_Incident_byTypeCode 19 Puget_Sound_VTS_Unusual_Incident_byVessels 1497 washdata,_7_Aug_1998/DIM(Sarmis) 269K 30 washdata,_7_Aug_1998/Waterway 455 Washington State DOE Multi PDF files N/A 7 Puget Sound Pilot Commission Puget Sound Pilot Commission Incident Data 69K 64
Vessel Traffic Risk Assessment (VTRA) - Final Report 08/31/08
Technical Appendix A: Database Construction and Analysis A-10
Source Type of Data Size # Records Washington State Dept of Ecology Washington State Resource Damage Assessment by Date 60K 395 Past Incidents of Interest 1.03M 10 US Coast Guard Headquarters Complete accident/incident data up to 2006. Same as data on 08/18/2006(CD1) 370M MisleActivity.txt 3.122M 24970 MisleFacEvents.txt 1.149M 5708 MisleFacility.txt 9.159M 40,374 MisleFacPoll.txt 2.363M 4653 MisleInjury.txt 435K 3053 MisleOtherPoll.txt 2.093M 4246 MisleReadme.doc 69K MisleVessel.txt 382.470M 858,081 MisleVslEvents.txt 5.059M 23765 MisleVslPoll.txt 3.429M 6491
British Petroleum Accident/Incident report in email format (transfer to PDF and saved) 197K
DOE Accident/Incident Data Incidents_CPS_1994_present(Center Puget Sound) 304K 718
Incidents_NPS_Consolidated_Grabowski(North Puget Sound) 234K 426
Incidents_SPS_1994_present_Grabowski(South Puget Sound) 15K 4
Lloyd's MIU Portal Vessel Casualty Information N/A 2 USCG Seattle Anchoring Database 1,124K 5614 USCG Portland Portland MSIS & MISLE Data 1551K 4256 USCG Seattle Intervention and Near Misses(Including Audio files) 225M 25 Washington State Central and South Puget Sound Accident Files 315K 46 DOE CPS_all,_9_Feb_2007 1815K 420 CPS_casualty,_9_Feb_2007 197K 37 CPS_near_miss,_9_Feb_2007 1064K 226 CPS_spills,_9_Feb_2007 46K 4 SPS_all,_9_Feb_2007 95K 90

Vessel Traffic Risk Assessment (VTRA) - Final Report 08/31/08
Technical Appendix A: Database Construction and Analysis A-11
Because of the large number of records and their various sources, it was necessary to track
both the original source of each record and any redundant records from different sources.
This information was tracked in the field “event cross-validated” in the database as new,
incoming records were inserted and checked for repeats. Figure A-1 provides a breakdown
of the various data sources for the events in the VTRA accident-incident database.
The Challenge of Integrating Multiple Data Sources
The development of the Puget Sound VTRA accident-incident database highlighted the
complexities inherent in integrating multiple data sources into a coherent information
system. One difficulty lay in categorizing the types of events in the database, and in
determining whether a series of events that occurred together were incidents or accidents. If
an event resulted in an incident (propulsion failure, steering failure, navigation equipment
failure, etc.), it was categorized as an incident. If the event resulted in an accident, it was
categorized as an accident, and the precipitating incidents or cascading events associated
with the accident were captured in the narrative portion of the database.
Another difficulty was occasioned by the varying information contained in the different data
sources, which necessitated merging several databases into one accident-incident repository.
For instance, of the 2705 events records in the database, 1759 (65%) of the records were
unique to USCG records, 478 (17.67%) were unique to Washington DOE, with only 377
(13.94%) represented in both the USCG and DOE databases, as seen in Figure A-1 and
Table A-5. Thus, in order to build a comprehensive accident-incident database, both data
sets were required. The Coast Guard and Washington Department of Ecology are both
charged with maritime data collection, analysis and reporting responsibilities within the
Puget Sound marine transportation system; in order to determine the differences in the data
sets between two organizations, additional analysis was undertaken, as described in the next
section.

Vessel Traffic Risk Assessment (VTRA) - Final Report 08/31/08
Technical Appendix A: Database Construction and Analysis A-12
Figure A-1 Puget Sound Accident – Incident Data Sources
Table A-5 Puget Sound VTRA Accident-Incident Data Sources
Source Events % of Events Accidents Incidents
USCG only 1759 65.02% 1074 (73.46%) 631 (54.44%)
Wash DOE only 478 17.67% 148 (10.12%) 324 (27.96%)
WSF only 17 6.3% 7 5
Pilots only 31 1.15% 14 3
BP only 4 0.15% 0 3
USCG/DOE 377 13.94% 193 (13.2%) 184 (15.88%)
USCG/WSF 5 0.2% 5 0
USCG/Pilots 4 0.1% 4 0
Pilots/DOE 11 0.41% 7 2
DOE/USCG/Pilots 6 0.22% 5 1
DOE/Seattle Anchor Log
2 007% 0 2
USCG/DOE/WSF 2 0.07% 1 1
Other 9 0.33% 4 3
Total 2705 100% 1462 1159
Other data sources: Seattle P-I, San Juan Islander, Lloyd’s List, EQUASIS database, Crowley, Washington Dept of Ecology text, accident files, CG Sector Seattle anchoring log/ database; CG Sector Seattle Watch Supervisor’s Log, etc.
DATA SOURCES
USCG ONLY,
1759, 65.02%PUGET SOUND PILOT
COMMISSION, 31, 1.2%
DOE ONLY, 478,
17.7%
USCG&DOE,
377, 13.9%
ALL OTHER SOURCES, 125,
4.6%USCG ONLY
PUGET SOUND PILOT COMMISSIONDOE ONLY
USCG&DOE
ALL OTHER SOURCES
2705 TOTAL EVENTS
Vessel Traffic Risk Assessment (VTRA) - Final Report 08/31/08
Technical Appendix A: Database Construction and Analysis A-13
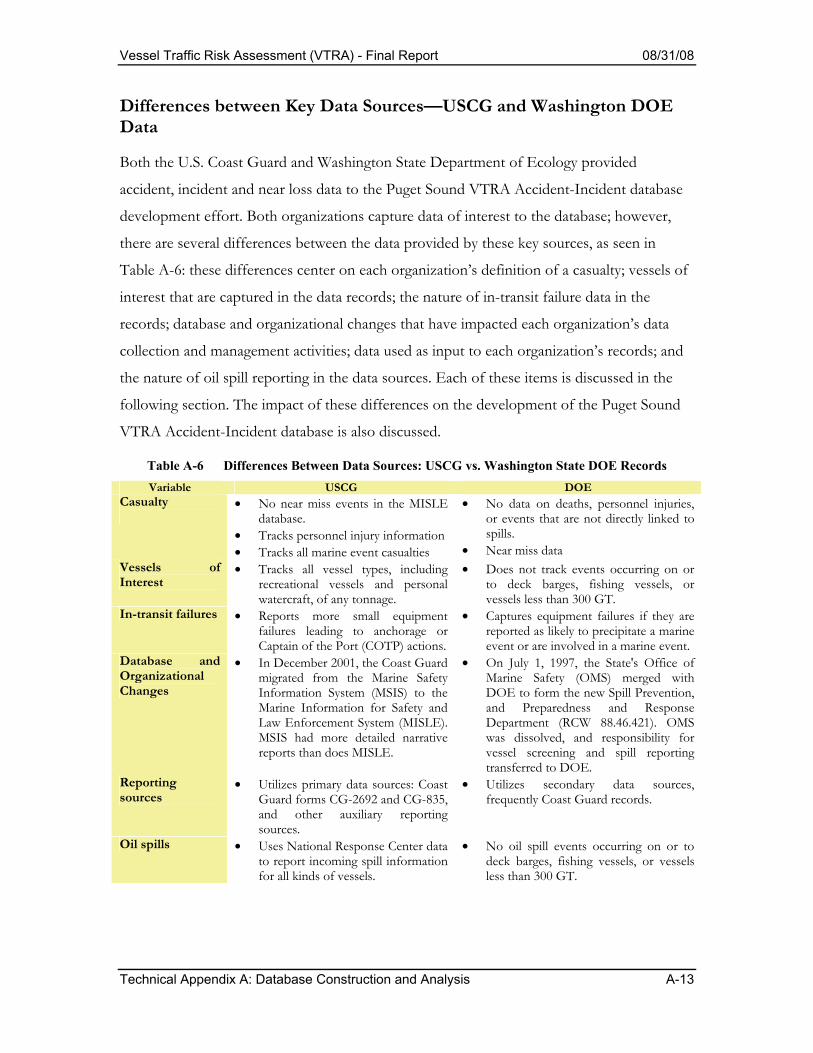
Differences between Key Data Sources—USCG and Washington DOE Data
Both the U.S. Coast Guard and Washington State Department of Ecology provided
accident, incident and near loss data to the Puget Sound VTRA Accident-Incident database
development effort. Both organizations capture data of interest to the database; however,
there are several differences between the data provided by these key sources, as seen in
Table A-6: these differences center on each organization’s definition of a casualty; vessels of
interest that are captured in the data records; the nature of in-transit failure data in the
records; database and organizational changes that have impacted each organization’s data
collection and management activities; data used as input to each organization’s records; and
the nature of oil spill reporting in the data sources. Each of these items is discussed in the
following section. The impact of these differences on the development of the Puget Sound
VTRA Accident-Incident database is also discussed.
Table A-6 Differences Between Data Sources: USCG vs. Washington State DOE Records Variable USCG DOE
Casualty
• No near miss events in the MISLE database.
• Tracks personnel injury information • Tracks all marine event casualties
• No data on deaths, personnel injuries, or events that are not directly linked to spills.
• Near miss data Vessels of Interest
• Tracks all vessel types, including recreational vessels and personal watercraft, of any tonnage.
• Does not track events occurring on or to deck barges, fishing vessels, or vessels less than 300 GT.
In-transit failures • Reports more small equipment failures leading to anchorage or Captain of the Port (COTP) actions.
• Captures equipment failures if they are reported as likely to precipitate a marine event or are involved in a marine event.
Database and Organizational Changes
• In December 2001, the Coast Guard migrated from the Marine Safety Information System (MSIS) to the Marine Information for Safety and Law Enforcement System (MISLE). MSIS had more detailed narrative reports than does MISLE.
• On July 1, 1997, the State's Office of Marine Safety (OMS) merged with DOE to form the new Spill Prevention, and Preparedness and Response Department (RCW 88.46.421). OMS was dissolved, and responsibility for vessel screening and spill reporting transferred to DOE.
Reporting sources
• Utilizes primary data sources: Coast Guard forms CG-2692 and CG-835, and other auxiliary reporting sources.
• Utilizes secondary data sources, frequently Coast Guard records.
Oil spills • Uses National Response Center data to report incoming spill information for all kinds of vessels.
• No oil spill events occurring on or to deck barges, fishing vessels, or vessels less than 300 GT.

Vessel Traffic Risk Assessment (VTRA) - Final Report 08/31/08
Technical Appendix A: Database Construction and Analysis A-14
Definition of Casualty
The first differences between the Coast Guard and DOE casualty reporting systems with
impact on the VTRA database were in each organization’s definition of a casualty. The Coast
Guard uses 46 CFR 4.05 to define a marine casualty as an “Intentional or Unintentional
Grounding, Allision, Any loss of equipment that effects a loss of maneuverability, Any
materiel deficiency or occurrence of materiality that affects seaworthiness or safety of the
vessel (i.e. fire, flooding, loss of installed fire-fighting equipment), Death, Personnel Casualty
that results in not fit for duty, Property damage of $25,000 or higher, an Oil Spill that creates
a sheen or anything more, or a "Hazardous Condition".
In contrast, DOE uses WAC 317-31-030 and RCW 88.46.100 to define a marine “event” as
a “Collision, Allision, Grounding, Near Miss Incident (through non-routine action avoided a
collision, allision, grounding, or spill), or anything in CFR 46 4.05-1 EXCEPT Death,
Personnel Injuries, and "Hazardous Conditions" not linked to a spill.”
The primary difference between these two casualty definitions is that DOE does not collect
data about deaths, personnel injuries, or events that are not directly linked to spills, following
the organization’s direction after the Washington Office of Marine Safety was abolished in
1997; examples of excluded events for DOE include personnel casualties not involved in oil
spills, collisions, allisions, and groundings. On the other hand, the Coast Guard does not
explicitly track near miss events in the MISLE database. Several reporting differences result:
the DOE tracks near miss incidents, but the Coast Guard does not; the Coast Guard
regularly tracks deaths, personnel casualties, and property damage events in excess of
$25,000, while the DOE does not. However, inspection of the records shows that the Puget
Sound VTS watchstanders may record some Near Miss Incidents for larger commercial
traffic in their Near Miss or Watch Supervisor’s Log. In terms of numbers of records,
however, the most notable incongruence is that DOE does not track personnel casualties
unrelated to oil spills, while the U.S. Coast Guard does.
Vessel Traffic Risk Assessment (VTRA) - Final Report 08/31/08
Technical Appendix A: Database Construction and Analysis A-15
Inspection of the data provides further insight. Between 1995 and 2005, 45 Near Miss
incidents were reported; 12 were unique to the Coast Guard records, and 26 were unique to
DOE records; 3 were reported by both the Coast Guard and DOE, and 4 were reported by
other sources. These numbers support the observation that DOE reports contain more near
miss events, but the scale is small enough that this explanation alone is insufficient. At the
same time, between 1995 and 2005, there were a total of 175 personnel casualties reported,
with 174 of those personnel casualties coming from USCG as the sole source. This
illustrates that DOE does not track personnel casualties, but the USCG does.
Vessels of Interest to Organizations
Another difference in casualty reporting between USCG and Washington State DOE
records lies in the nature of vessels and events of interest to each organization. USCG
databases track all vessel types, including recreational vessels and personal watercraft, of any
tonnage. However, the Spill Program of DOE uses a database called Marine Information
System (MIS), specifically designed for vessels over 300 GT, excluding fishing boats and
deck barges. As a result, DOE records do not include events occurring on or to deck barges,
fishing vessels, or vessels less than 300 GT, both of which the Coast Guard tracks.
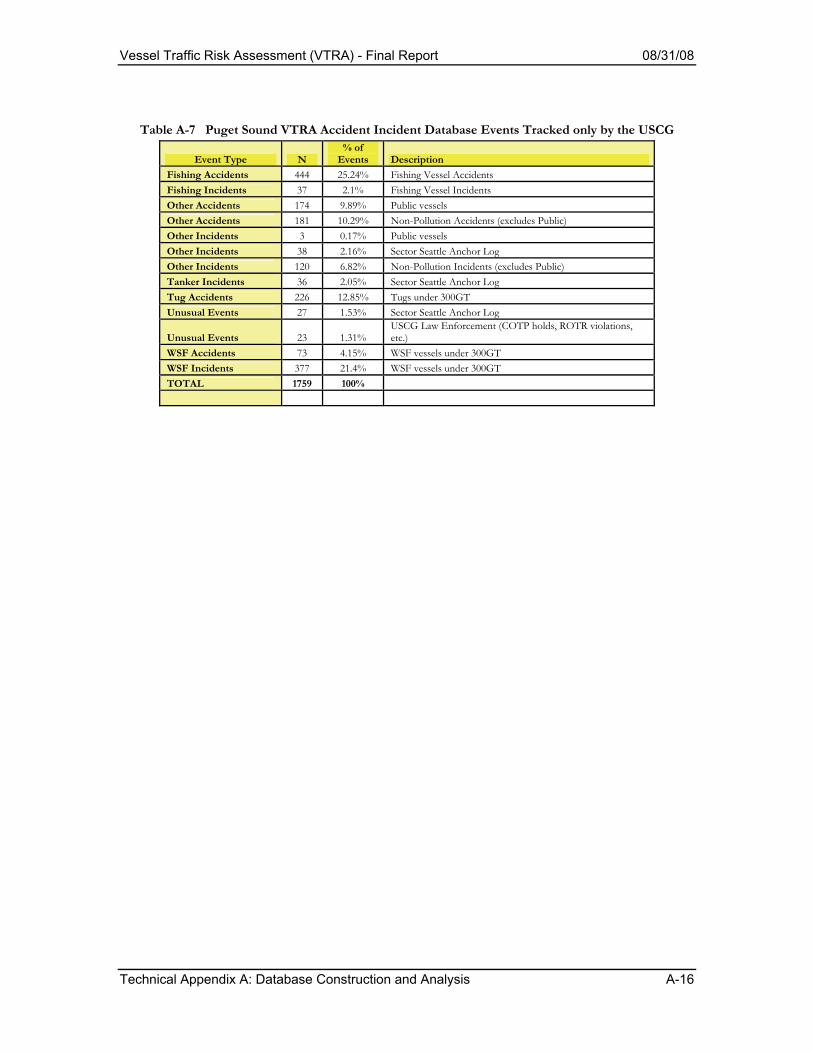
For the Puget Sound VTRA accident-incident database, events occurring to all vessels
greater than 20 gross tons were captured; hence, both USCG and DOE data sources were
important inputs to the database. Table A-7 shows the nature of the events that are tracked
only by the USCG, primarily fishing vessels, public vessels, law enforcement events, deck
barges, and vessels < 300GT. These events comprised 65% of the events in the VTRA
accident-incident database, or 1759 records.
In-Transit Failures
In-transit failures are another source of data differences between the Coast Guard and DOE
records. Coast Guard Seattle VTS captures Captain of the Port (COTP) actions and
anchorages due to equipment failures through interaction with vessels and observing their
actions at the VTS. DOE captures equipment failures if they are reported as likely to
precipitate a marine event or if they are involved in a marine event. The result is that the
Coast Guard reports more small equipment failures leading to anchorage or COTP actions,
which are logged as part of the VTS watchstander’s duties.
Vessel Traffic Risk Assessment (VTRA) - Final Report 08/31/08
Technical Appendix A: Database Construction and Analysis A-16
Table A-7 Puget Sound VTRA Accident Incident Database Events Tracked only by the USCG
Event Type N % of
Events Description Fishing Accidents 444 25.24% Fishing Vessel Accidents Fishing Incidents 37 2.1% Fishing Vessel Incidents Other Accidents 174 9.89% Public vessels Other Accidents 181 10.29% Non-Pollution Accidents (excludes Public) Other Incidents 3 0.17% Public vessels Other Incidents 38 2.16% Sector Seattle Anchor Log Other Incidents 120 6.82% Non-Pollution Incidents (excludes Public) Tanker Incidents 36 2.05% Sector Seattle Anchor Log Tug Accidents 226 12.85% Tugs under 300GT Unusual Events 27 1.53% Sector Seattle Anchor Log
Unusual Events 23 1.31% USCG Law Enforcement (COTP holds, ROTR violations, etc.)
WSF Accidents 73 4.15% WSF vessels under 300GT WSF Incidents 377 21.4% WSF vessels under 300GT TOTAL 1759 100%

Vessel Traffic Risk Assessment (VTRA) - Final Report 08/31/08
Technical Appendix A: Database Construction and Analysis A-17
Database and Organizational Changes
In addition to differences in reporting requirements, there are also differences in how each
agency’s reporting culture has evolved. Between 1995 and 2005, both agencies underwent a
significant change in their reporting and database systems. In December 2001, the Coast
Guard migrated from the Marine Safety Information System (MSIS) to the Marine
Information for Safety and Law Enforcement System (MISLE). The transition caused a few
months of data processing backlogs, but eventually all casualty records were transferred to
the new database. However, the older Coast Guard database, MSIS, had more detailed
narrative reports than does MISLE, making cross-referencing records and detailed casualty
narratives after 2001 challenging, and changing the granularity of recent (post 2001) casualty
information available through Coast Guard records.
Similarly, DOE underwent not only a database and reporting change, but also an
organizational change. On July 1, 1997, the State's Office of Marine Safety (OMS) merged
with DOE to form the new Spill Prevention, and Preparedness and Response Department
(RCW 88.46.421). OMS was dissolved, and responsibility for vessel screening and spill
reporting transferred to DOE. The DOE database, MIS, began as a vessel screening tool in
OMS, and evolved to an event reporting database in DOE.
As a result of both organizational changes, data sources for the VTRA accident-incident
database were of varying granularity and completeness, as each data collection organization
evolved and changed its reporting processes and systems during the 1995-2005 time period.
Impacts of these changes will be seen in the data analysis reported in Section A-5,
particularly in the data available for human and organizational error (HOE) analysis. These
are not uncommon challenges in large-scale systems with complex data, but the need to
integrate multiple, independent sources into a coherent and common format, and the
availability and granularity of data for HOE analysis, had impact on the VTRA accident-
incident database development effort.
Vessel Traffic Risk Assessment (VTRA) - Final Report 08/31/08
Technical Appendix A: Database Construction and Analysis A-18
Primary and Secondary Reporting Sources
A large source of variation in event reporting in Puget Sound lies in the sources used as
input by the two organizations. The Coast Guard reporting system uses primary sources as
input, mainly the Coast Guard forms CG-2692 and CG-835. The Coast Guard thus develops
an enormous repository of primary maritime accident and incident data; however, the
varying databases which comprise this rich data resource are not electronically integrated
into one common, accessible electronic format. This necessitates considerable knowledge of
the existing databases, sources and repositories of information, as well as considerable time
to gather, standardize, harmonize and integrate the disparate paper and electronic data
sources. The unsuspecting analyst who is looking for a one-stop shopping experience with
respect to U.S. maritime accident and incident data, therefore, is often disappointed and
consequently forced to examine multiple data sources in order to attain a complete picture of
maritime accidents and incidents in a system.
The Coast Guard utilizes several primary source reports. The CG-2692 form, the Report of
Marine Accident, Injury, or Death, must be filled out for every reportable marine casualty as
defined by the CFR. The CG-835 Form, the Notice of Merchant Marine Inspection
Requirements, is completed when a vessel has materiel deficiencies that must be repaired
before sailing. The Coast Guard also uses the Notice of Arrival Information managed by
the Coast Guard’s National Vessel Movement Center to track commercial vessel transits in
major U.S. ports. The Coast Guard also has auxiliary reporting sources, including the VTS
Watch Supervisor’s Log, the Sector Seattle Anchor Database (also tracked by VTS when
vessels arrange for anchoring), the VTS Intervention Log (when VTS must interact with
vessels to prevent accidents), the VTS Near Miss Log (similar to the Intervention Log), as
well as input from Coast Guard units such as Coast Guard Cutters, small boat stations, and
the Sector Prevention and Response personnel.

Vessel Traffic Risk Assessment (VTRA) - Final Report 08/31/08
Technical Appendix A: Database Construction and Analysis A-19
The data from the Coast Guard data sources, however, is not captured or stored in one
electronic integrated enterprise data warehouse, nor can data be easily shared or exchanged
between Coast Guard databases. Thus, accident and incident analysts must identify all paper
and electronic data sources available from the Coast Guard, in some cases through a
Freedom of Information Act (FOIA) request; once identified, the records must be gathered
from the archives, standardized, formatted, and integrated into a common electronic data
format using a standard data classification scheme. As will be discussed in the next section,
additional data were gathered from state, local, industry, non-profit and other sources. These
data were also gathered, classified, standardized, integrated and validated with the Coast
Guard data records. Thus, the effort to harmonize and integrate event data into a usable
electronic format consumed significant effort and time.
The Washington DOE reporting system, in contrast, relies mostly on secondary data
sources, frequently the Coast Guard, for its information. DOE uses a vessel screening tool
that feeds information to its MIS database for the purpose of monitoring high-interest
vessels (WAC 317-31-100). DOE also uses information from the Q-Line of the Coast
Guard’s Notice of Arrival Reports, and reports from actions taken by the Captain of the
Port, Coast Guard Form CG-2692, and WSF Rider Alert Reports (which are not captured in
the Coast Guard data). Prior to 2001, when the Office of Marine Safety existed, Washington
DOE collected primary data in the form of boarding and risk evaluation reports. This
primary data is contained in the pre-2001 DOE records, and in the VTRA accident-incident
database for events that occurred prior to 2001.
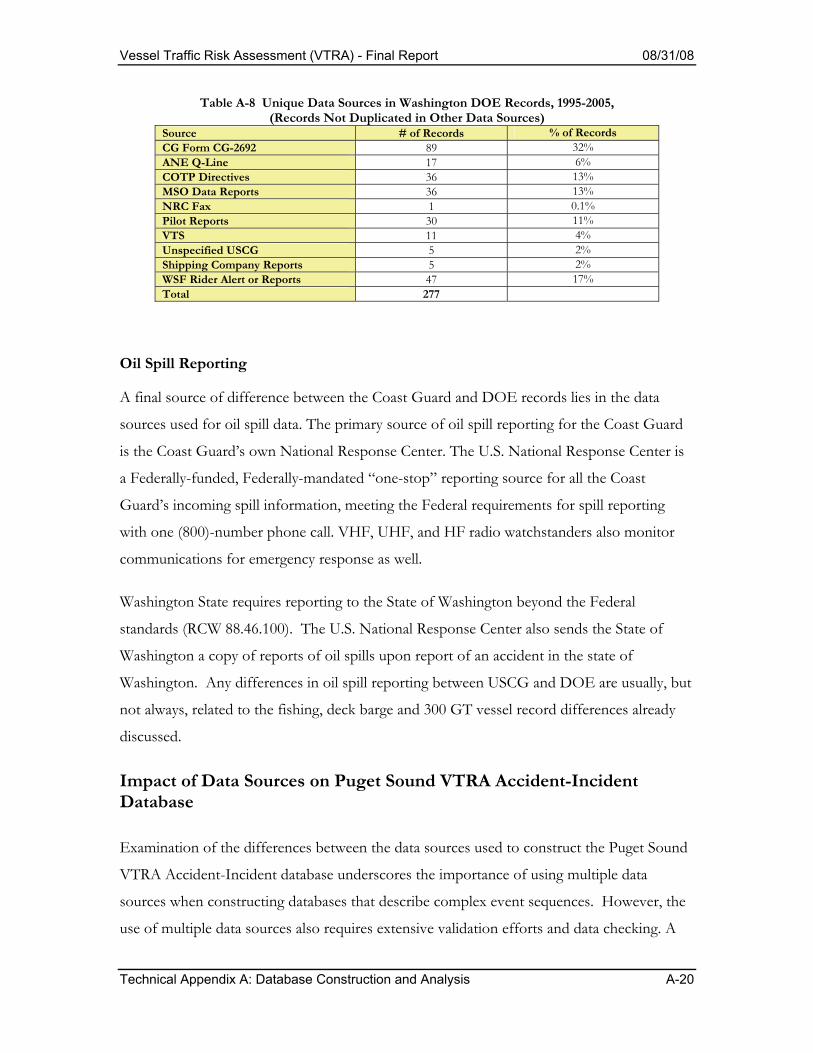
Review of the DOE data shows that DOE has electronically captured records that
specifically list the Coast Guard and WSF as sources in the written comments of the records;
however, much of the Coast Guard data used in DOE data sources is not integrated into the
primary Coast Guard marine casualty database, MISLE. Table A-8 lists the sources of the
unique DOE records. Analysis of the DOE records shows that DOE databases contain
records from the Coast Guard that the Coast Guard does not have available in the MSIS or
MISLE databases. Integration of all available maritime safety data into a standard format
electronic data warehouse would greatly enhance analysis, reporting and data maintenance
activities.
Vessel Traffic Risk Assessment (VTRA) - Final Report 08/31/08
Technical Appendix A: Database Construction and Analysis A-20
Table A-8 Unique Data Sources in Washington DOE Records, 1995-2005, (Records Not Duplicated in Other Data Sources)
Source # of Records % of Records CG Form CG-2692 89 32% ANE Q-Line 17 6% COTP Directives 36 13% MSO Data Reports 36 13% NRC Fax 1 0.1% Pilot Reports 30 11% VTS 11 4% Unspecified USCG 5 2% Shipping Company Reports 5 2% WSF Rider Alert or Reports 47 17% Total 277
Oil Spill Reporting
A final source of difference between the Coast Guard and DOE records lies in the data
sources used for oil spill data. The primary source of oil spill reporting for the Coast Guard
is the Coast Guard’s own National Response Center. The U.S. National Response Center is
a Federally-funded, Federally-mandated “one-stop” reporting source for all the Coast
Guard’s incoming spill information, meeting the Federal requirements for spill reporting
with one (800)-number phone call. VHF, UHF, and HF radio watchstanders also monitor
communications for emergency response as well.
Washington State requires reporting to the State of Washington beyond the Federal
standards (RCW 88.46.100). The U.S. National Response Center also sends the State of
Washington a copy of reports of oil spills upon report of an accident in the state of
Washington. Any differences in oil spill reporting between USCG and DOE are usually, but
not always, related to the fishing, deck barge and 300 GT vessel record differences already
discussed.
Impact of Data Sources on Puget Sound VTRA Accident-Incident Database
Examination of the differences between the data sources used to construct the Puget Sound
VTRA Accident-Incident database underscores the importance of using multiple data
sources when constructing databases that describe complex event sequences. However, the
use of multiple data sources also requires extensive validation efforts and data checking. A
Vessel Traffic Risk Assessment (VTRA) - Final Report 08/31/08
Technical Appendix A: Database Construction and Analysis A-21
common data dictionary was developed to standardize data entry and analysis, following the
British Columbia/Pacific States Task Force oil spill reporting data dictionary, and validation
activities comprised a significant work effort.
In contrast to other studies (Merrick, et al., 1992; Harrald, et al., 1998; Grabowski, et al.,
2000; van Dorp, et al., 2001), there was considerably less proprietary data provided in the
Puget Sound VTRA study. Perhaps this was the result of a study borne of litigation.
However, perhaps because of the limited proprietary data sources, incident report rates are
much lower (43%) in this study, compared to levels of 60-80% in other marine risk
assessments. Accident rates appear higher, in contrast to incident rates, although the true
reporting effect may be the lack of incident data. Computing mean time between failures
(MTBF) and mean time to repair (MTTR) by vessel types was possible in earlier studies; this
was not possible in this study because of the absence of sufficient, often proprietary, data.
Each of these items impacted the data that was available for the accident-incident database
analysis.
Vessel Traffic Risk Assessment (VTRA) - Final Report 08/31/08
Technical Appendix A: Database Construction and Analysis A-22
A-5. Database Analysis
Input to the accident-incident database was closed on June 1, 2007, in order to provide
adequate time for analysis within the scope of the project. However, when new data sources
were identified, they were incorporated into the database and the analysis, including U.S.
Coast Guard 2692 and 835 accident reports provided by U.S. Coast Guard Headquarters.
Descriptive statistics were developed using SAS version 9.0. Normalization was effected
using transit data by vessel types for 1996-2005 provided by the U.S. Coast Guard Sector
Seattle Vessel Traffic Service and the Puget Sound Marine Exchange. Transit data for the
year 1995 was not available. Event frequencies were adjusted to the differing time periods
captured in the database (1995-2005) and used for normalization (1996-2005). Although
some of the data did not fail normality tests, both normal and non-parametric methods were
used because of small sample sizes.
The Wilcoxon test, a non-parametric alternative to the paired Student’s t-test for the case of
two related samples or repeated measurements, is used to verify whether population means
were equal. The test is used when the data are not normally distributed and when there are
two levels for the factor. The Kruskal-Wallis test is also a non-parametric method used to
verify whether the population means are equal when there are three or more levels for the
factor. The test is also used when the normality test for the data fails. The Chi-square
distribution assumption for the test statistic is valid when the sample size at each level is
greater than or equal to 5. However, since the Kruskal-Wallis test was not able to give the
direction of the test results, Tukey’s HSD (Honestly Significant Differences) test was used to
infer the difference of several means and also to construct simultaneous confidence intervals
for these differences. The Tukey’s HSD assumes that the displayed variables are independent
and normally distributed with identical variance and it can rank means from different levels,
which is important for the statistical analysis. The Kruskal-Wallis test was primarily used
since it does not require the normality assumption. However, in this report, we found that
both the Kruskal-Wallis and Tukey’s HSC tests on Puget Sound VTRA data had similar
results.
Vessel Traffic Risk Assessment (VTRA) - Final Report 08/31/08
Technical Appendix A: Database Construction and Analysis A-23
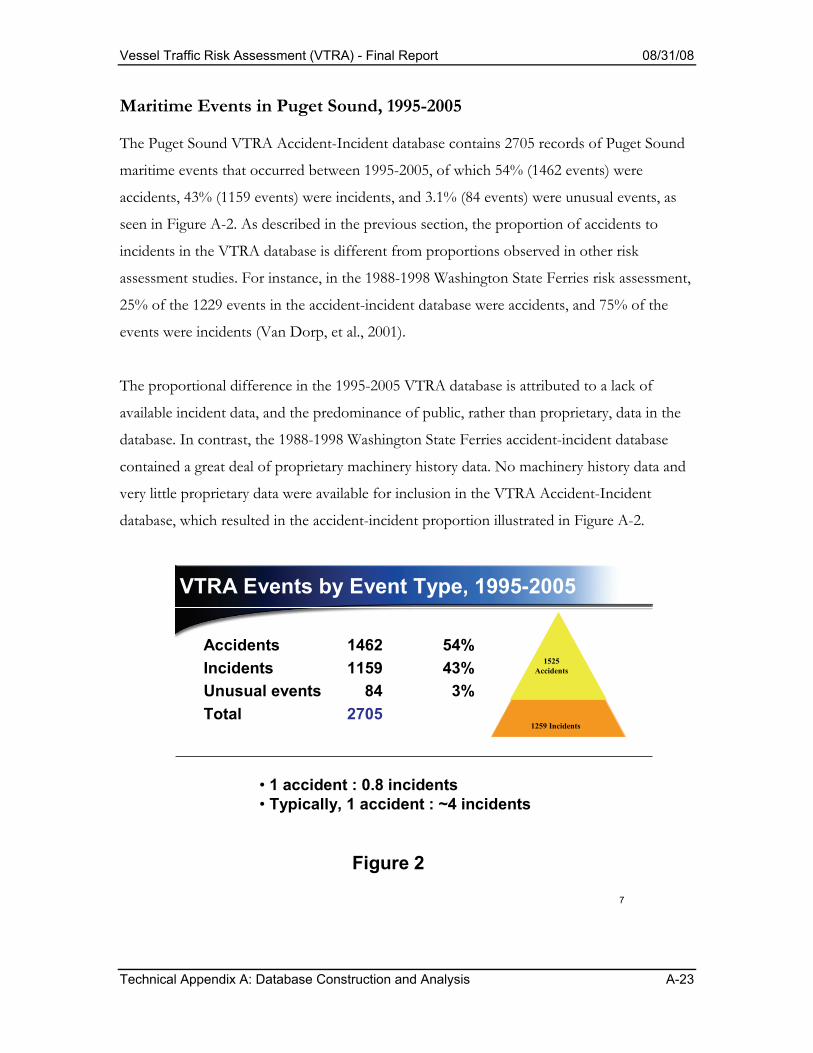
Maritime Events in Puget Sound, 1995-2005 The Puget Sound VTRA Accident-Incident database contains 2705 records of Puget Sound
maritime events that occurred between 1995-2005, of which 54% (1462 events) were
accidents, 43% (1159 events) were incidents, and 3.1% (84 events) were unusual events, as
seen in Figure A-2. As described in the previous section, the proportion of accidents to
incidents in the VTRA database is different from proportions observed in other risk
assessment studies. For instance, in the 1988-1998 Washington State Ferries risk assessment,
25% of the 1229 events in the accident-incident database were accidents, and 75% of the
events were incidents (Van Dorp, et al., 2001).
The proportional difference in the 1995-2005 VTRA database is attributed to a lack of
available incident data, and the predominance of public, rather than proprietary, data in the
database. In contrast, the 1988-1998 Washington State Ferries accident-incident database
contained a great deal of proprietary machinery history data. No machinery history data and
very little proprietary data were available for inclusion in the VTRA Accident-Incident
database, which resulted in the accident-incident proportion illustrated in Figure A-2.
7
VTRA Events by Event Type, 1995-2005
• 1 accident : 0.8 incidents • Typically, 1 accident : ~4 incidents
Figure 2
1259 Incidents
1525Accidents
Accidents 1462 54%Incidents 1159 43%Unusual events 84 3%Total 2705
Vessel Traffic Risk Assessment (VTRA) - Final Report 08/31/08
Technical Appendix A: Database Construction and Analysis A-24
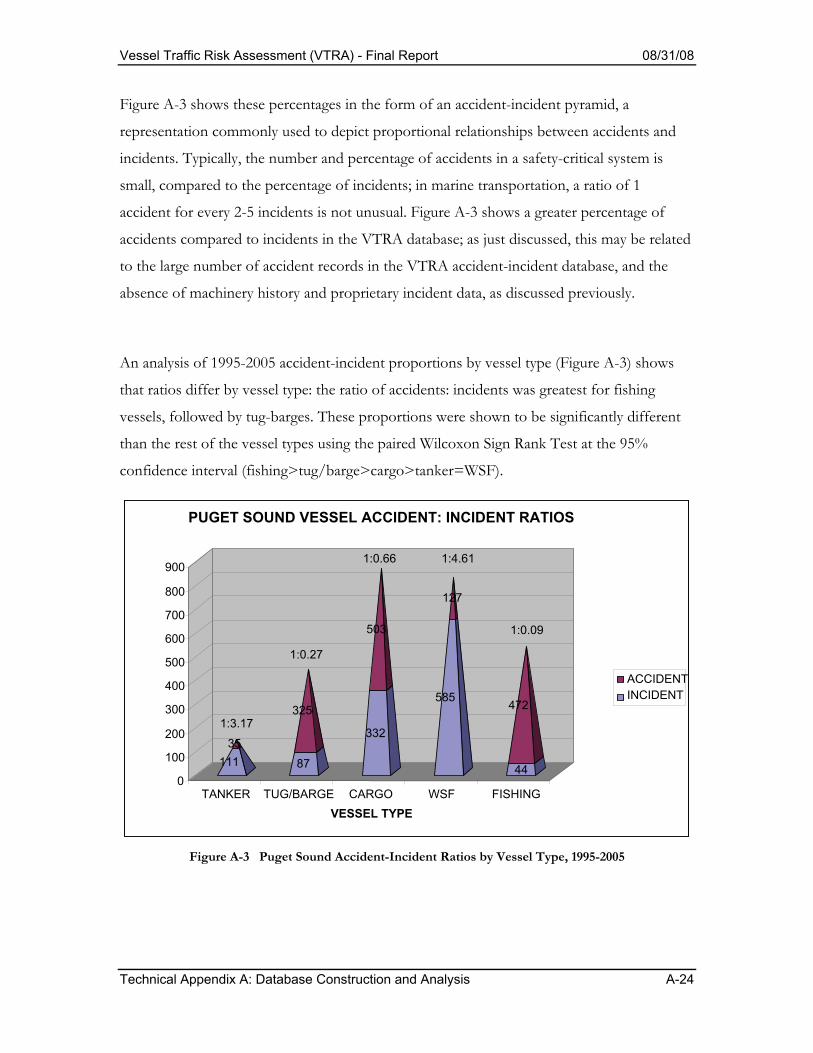
Figure A-3 shows these percentages in the form of an accident-incident pyramid, a
representation commonly used to depict proportional relationships between accidents and
incidents. Typically, the number and percentage of accidents in a safety-critical system is
small, compared to the percentage of incidents; in marine transportation, a ratio of 1
accident for every 2-5 incidents is not unusual. Figure A-3 shows a greater percentage of
accidents compared to incidents in the VTRA database; as just discussed, this may be related
to the large number of accident records in the VTRA accident-incident database, and the
absence of machinery history and proprietary incident data, as discussed previously.
An analysis of 1995-2005 accident-incident proportions by vessel type (Figure A-3) shows
that ratios differ by vessel type: the ratio of accidents: incidents was greatest for fishing
vessels, followed by tug-barges. These proportions were shown to be significantly different
than the rest of the vessel types using the paired Wilcoxon Sign Rank Test at the 95%
confidence interval (fishing>tug/barge>cargo>tanker=WSF).
Figure A-3 Puget Sound Accident-Incident Ratios by Vessel Type, 1995-2005
111 35
87
325 332
503
585
127
44
472
0 100 200 300 400 500 600 700 800 900
TANKER TUG/BARGE CARGO WSF FISHINGVESSEL TYPE
PUGET SOUND VESSEL ACCIDENT: INCIDENT RATIOS
ACCIDENTINCIDENT
1:3.17
1:0.27
1:0.66 1:4.61
1:0.09
Vessel Traffic Risk Assessment (VTRA) - Final Report 08/31/08
Technical Appendix A: Database Construction and Analysis A-25
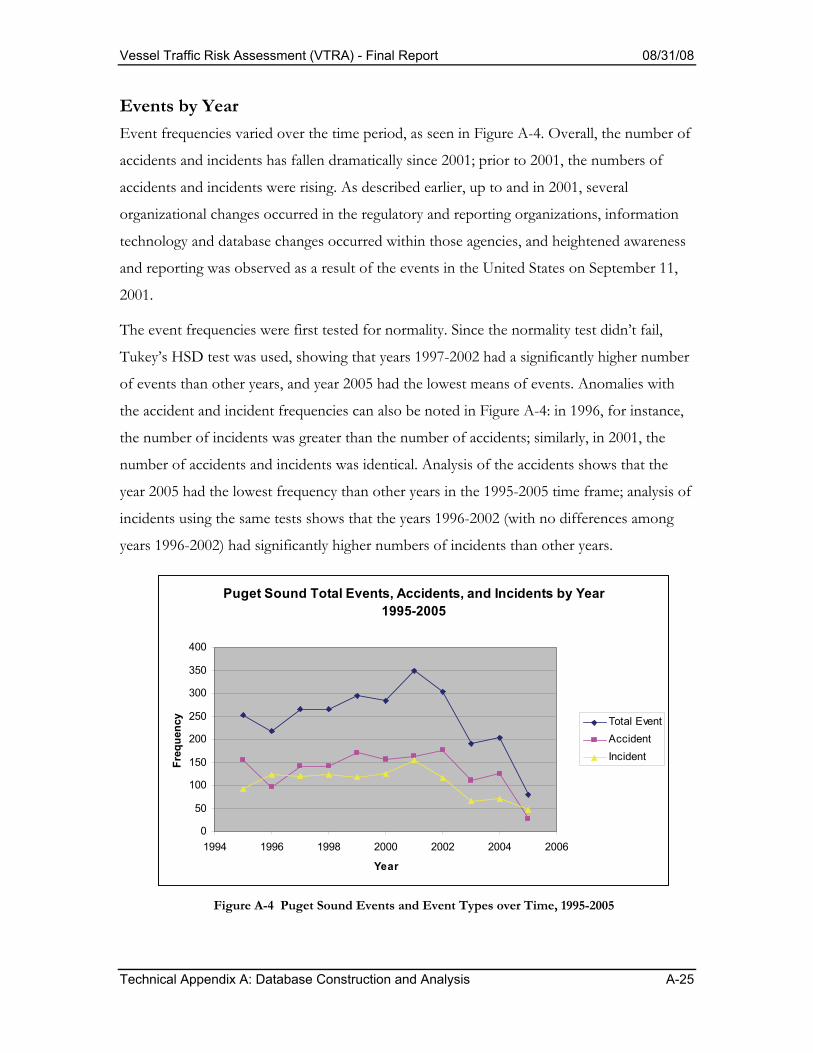
Events by Year Event frequencies varied over the time period, as seen in Figure A-4. Overall, the number of
accidents and incidents has fallen dramatically since 2001; prior to 2001, the numbers of
accidents and incidents were rising. As described earlier, up to and in 2001, several
organizational changes occurred in the regulatory and reporting organizations, information
technology and database changes occurred within those agencies, and heightened awareness
and reporting was observed as a result of the events in the United States on September 11,
2001.
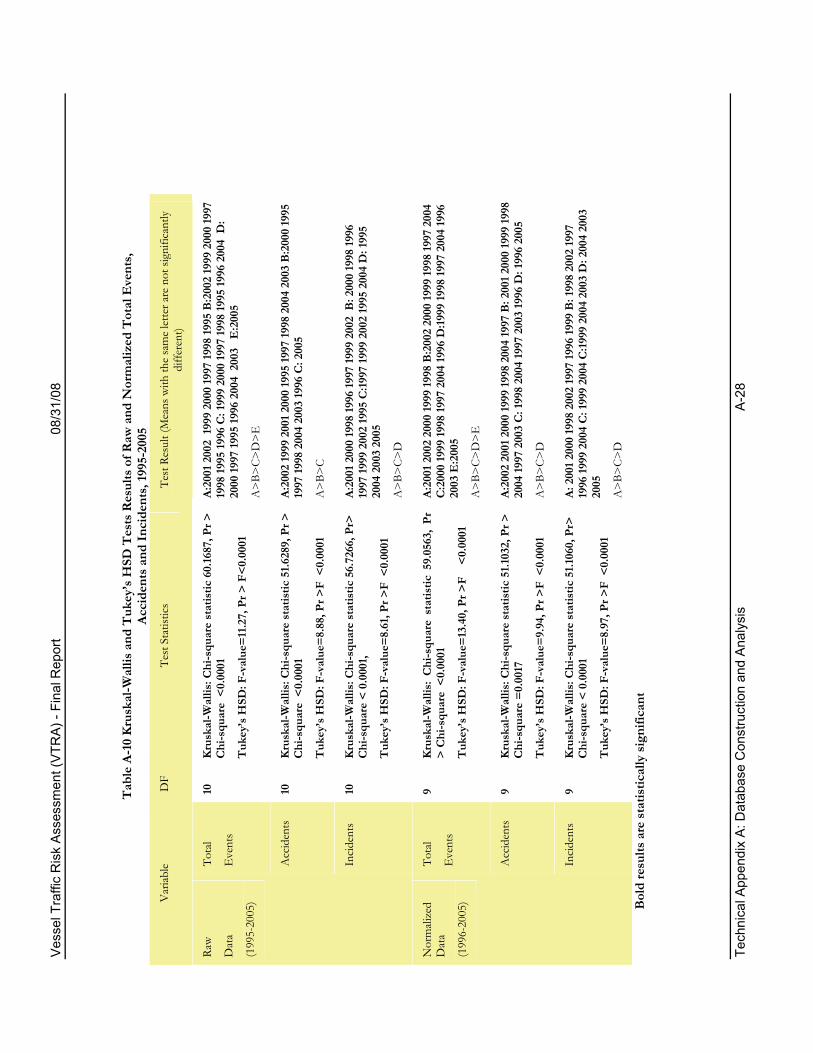
The event frequencies were first tested for normality. Since the normality test didn’t fail,
Tukey’s HSD test was used, showing that years 1997-2002 had a significantly higher number
of events than other years, and year 2005 had the lowest means of events. Anomalies with
the accident and incident frequencies can also be noted in Figure A-4: in 1996, for instance,
the number of incidents was greater than the number of accidents; similarly, in 2001, the
number of accidents and incidents was identical. Analysis of the accidents shows that the
year 2005 had the lowest frequency than other years in the 1995-2005 time frame; analysis of
incidents using the same tests shows that the years 1996-2002 (with no differences among
years 1996-2002) had significantly higher numbers of incidents than other years.
Puget Sound Total Events, Accidents, and Incidents by Year 1995-2005
0
50
100
150
200
250
300
350
400
1994 1996 1998 2000 2002 2004 2006
Year
Freq
uenc
y Total EventAccidentIncident
Figure A-4 Puget Sound Events and Event Types over Time, 1995-2005
Vessel Traffic Risk Assessment (VTRA) - Final Report 08/31/08
Technical Appendix A: Database Construction and Analysis A-26
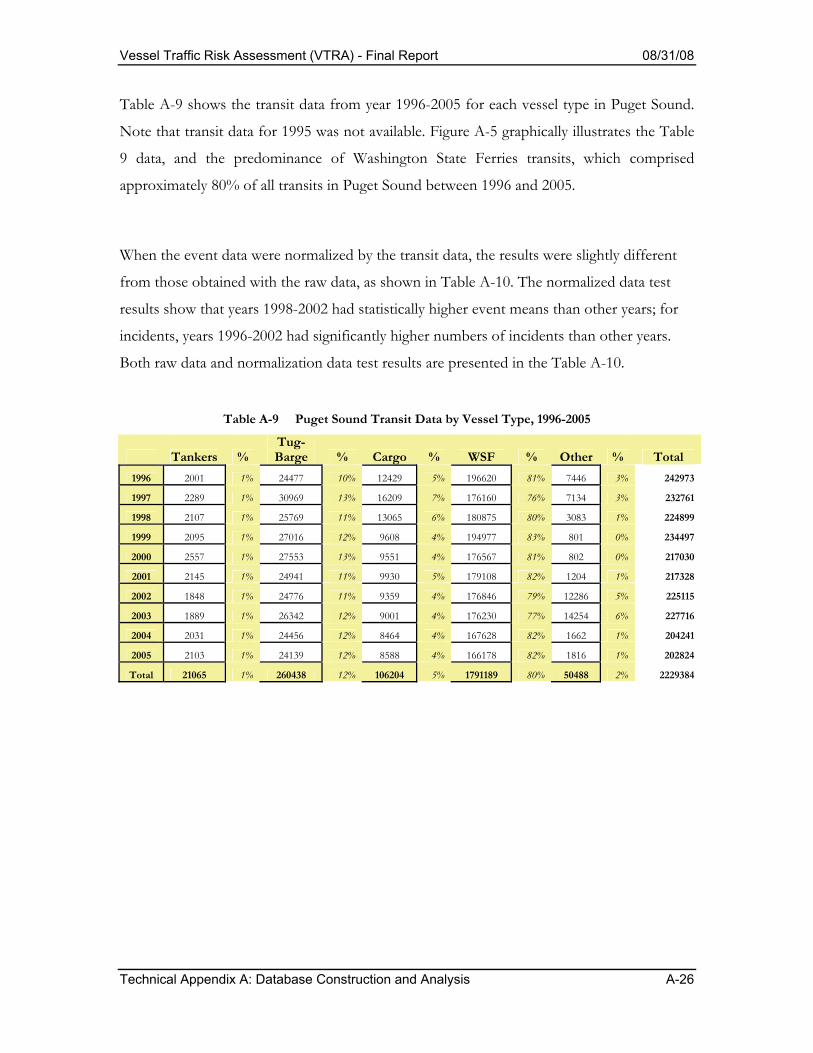
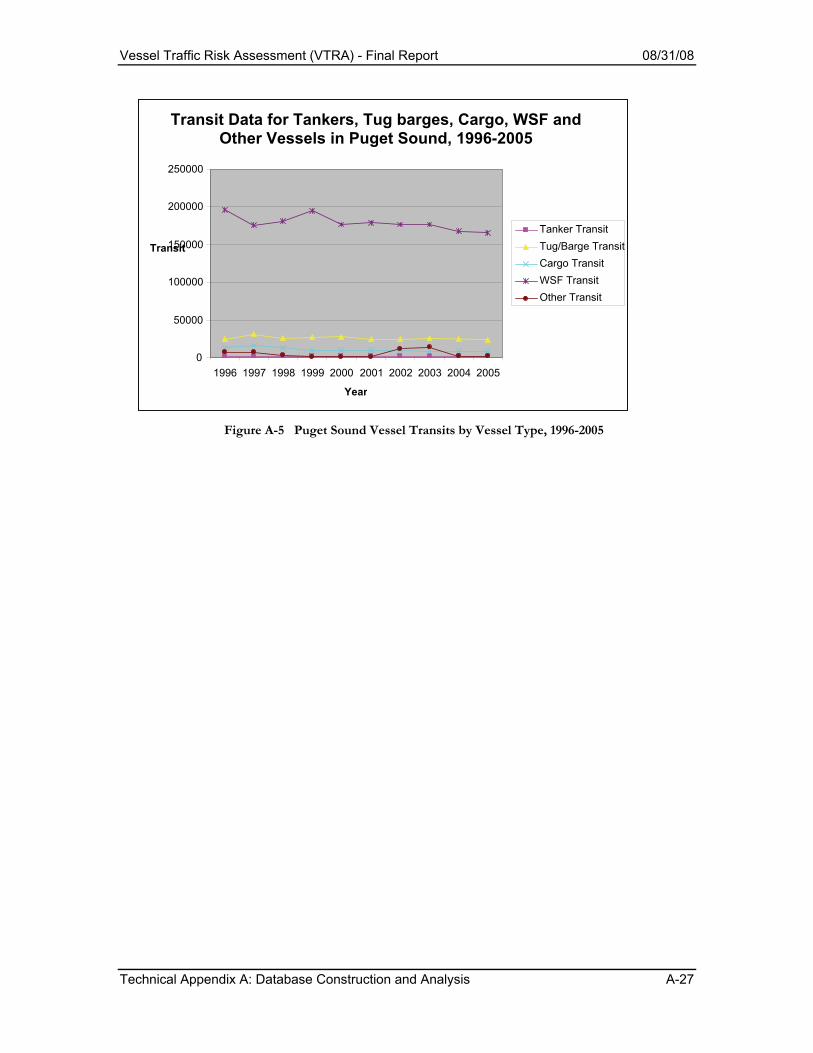
Table A-9 shows the transit data from year 1996-2005 for each vessel type in Puget Sound.
Note that transit data for 1995 was not available. Figure A-5 graphically illustrates the Table
9 data, and the predominance of Washington State Ferries transits, which comprised
approximately 80% of all transits in Puget Sound between 1996 and 2005.
When the event data were normalized by the transit data, the results were slightly different
from those obtained with the raw data, as shown in Table A-10. The normalized data test
results show that years 1998-2002 had statistically higher event means than other years; for
incidents, years 1996-2002 had significantly higher numbers of incidents than other years.
Both raw data and normalization data test results are presented in the Table A-10.
Table A-9 Puget Sound Transit Data by Vessel Type, 1996-2005
Tankers % Tug-Barge % Cargo % WSF % Other % Total
1996 2001 1% 24477 10% 12429 5% 196620 81% 7446 3% 242973
1997 2289 1% 30969 13% 16209 7% 176160 76% 7134 3% 232761
1998 2107 1% 25769 11% 13065 6% 180875 80% 3083 1% 224899
1999 2095 1% 27016 12% 9608 4% 194977 83% 801 0% 234497
2000 2557 1% 27553 13% 9551 4% 176567 81% 802 0% 217030
2001 2145 1% 24941 11% 9930 5% 179108 82% 1204 1% 217328
2002 1848 1% 24776 11% 9359 4% 176846 79% 12286 5% 225115
2003 1889 1% 26342 12% 9001 4% 176230 77% 14254 6% 227716
2004 2031 1% 24456 12% 8464 4% 167628 82% 1662 1% 204241
2005 2103 1% 24139 12% 8588 4% 166178 82% 1816 1% 202824
Total 21065 1% 260438 12% 106204 5% 1791189 80% 50488 2% 2229384
Vessel Traffic Risk Assessment (VTRA) - Final Report 08/31/08
Technical Appendix A: Database Construction and Analysis A-27
Figure A-5 Puget Sound Vessel Transits by Vessel Type, 1996-2005
Transit Data for Tankers, Tug barges, Cargo, WSF and Other Vessels in Puget Sound, 1996-2005
0
50000
100000
150000
200000
250000
1996 1997 1998 1999 2000 2001 2002 2003 2004 2005
Year
Transit Tanker Transit Tug/Barge Transit Cargo Transit WSF Transit Other Transit
Vess
el T
raffi
c R
isk
Asse
ssm
ent (
VTR
A) -
Fina
l Rep
ort
08/3
1/08
Te
chni
cal A
ppen
dix
A: D
atab
ase
Con
stru
ctio
n an
d A
naly
sis
A-2
8
Tab
le A
-10
Kru
skal
-Wal
lis a
nd T
ukey
’s H
SD T
ests
Res
ults
of R
aw a
nd N
orm
aliz
ed T
otal
Eve
nts,
Ac
cide
nts a
nd In
cide
nts,
1995
-200
5 V
ariab
le D
F Te
st S
tatis
tics
Test
Res
ult (
Mea
ns w
ith th
e sa
me
lette
r are
not
sign
ifica
ntly
diff
eren
t)
Tota
l
Eve
nts
10
Kru
skal
-Wal
lis: C
hi-s
quar
e st
atis
tic 6
0.16
87, P
r >
Chi
-squ
are
<0.
0001
Tuk
ey’s
HSD
: F-v
alue
=11.2
7, P
r > F
<0.0
001
A:20
01 2
002
1999
200
0 19
97 19
98 19
95 B
:200
2 19
99 2
000
1997
19
98 19
95 19
96 C
: 199
9 20
00 19
97 19
98 19
95 19
96 2
004
D:
2000
1997
1995
1996
200
4 2
003
E:2
005
A>
B>C>
D>
E
Acc
iden
ts
10
Kru
skal
-Wal
lis: C
hi-s
quar
e st
atis
tic 5
1.628
9, P
r >
Chi
-squ
are
<0.
0001
Tuk
ey’s
HSD
: F-v
alue
=8.8
8, P
r >F
<0.
0001
A:20
02 19
99 2
001 2
000
1995
1997
1998
200
4 20
03 B
:200
0 19
95
1997
1998
200
4 20
03 19
96 C
: 200
5
A>
B>C
Raw
Dat
a
(199
5-20
05)
Incid
ents
10
K
rusk
al-W
allis
: Chi
-squ
are
stat
istic
56.
7266
, Pr>
C
hi-s
quar
e <
0.00
01,
Tuk
ey’s
HSD
: F-v
alue
=8.6
1, Pr
>F
<0.
0001
A:20
01 2
000
1998
1996
1997
1999
200
2 B
: 200
0 19
98 19
96
1997
1999
200
2 19
95 C
:1997
1999
200
2 19
95 2
004
D: 1
995
2004
200
3 20
05
A>
B>C>
D
Tota
l
Eve
nts
9 K
rusk
al-W
allis
: C
hi-s
quar
e st
atis
tic 5
9.05
63,
Pr
> C
hi-s
quar
e <
0.00
01
Tuk
ey’s
HSD
: F-v
alue
=13.
40, P
r >F
<0
.000
1
A:20
01 2
002
2000
1999
1998
B:2
002
2000
1999
1998
1997
200
4 C
:200
0 19
99 19
98 19
97 2
004
1996
D:19
99 19
98 19
97 2
004
1996
20
03 E
:200
5
A>
B>C>
D>
E
Acc
iden
ts
9 K
rusk
al-W
allis
: Chi
-squ
are
stat
istic
51.1
032,
Pr >
C
hi-s
quar
e =0
.001
7
Tuk
ey’s
HSD
: F-v
alue
=9.9
4, P
r >F
<0.
0001
A:20
02 2
001 2
000
1999
1998
200
4 19
97 B
: 200
1 200
0 19
99 19
98
2004
1997
200
3 C
: 199
8 20
04 19
97 2
003
1996
D: 1
996
2005
A>
B>C>
D
Nor
mali
zed
Dat
a
(199
6-20
05)
Incid
ents
9
Kru
skal
-Wal
lis: C
hi-s
quar
e st
atis
tic 5
1.106
0, P
r>
Chi
-squ
are
< 0.
0001
Tuk
ey’s
HSD
: F-v
alue
=8.9
7, P
r >F
<0.
0001
A: 2
001 2
000
1998
200
2 19
97 19
96 19
99 B
: 199
8 20
02 19
97
1996
1999
200
4 C
: 199
9 20
04 C
:1999
200
4 20
03 D
: 200
4 20
03
2005
A>
B>C>
D
B
old
resu
lts a
re s
tatis
tical
ly si
gnifi
cant

Vessel Traffic Risk Assessment (VTRA) - Final Report 08/31/08
Technical Appendix A: Database Construction and Analysis A-29
Events by Vessel Type Between 1995 and 2005, events in Puget Sound occurred to different vessels, as seen in
Table A-11 and Figure A-6. The bulk of accidents between 1995 and 2005 occurred to
cargo vessels (34%) and fishing vessels (32%). A paired Wilcoxon test shows that the
proportion of accidents to total accidents occurring to cargo and fishing vessels was
statistically higher over the time period than other vessels at the 95% confidence level. In
contrast, most incidents between 1995 and 2005 occurred to Washington State Ferries
(WSF) (50%) and cargo vessels (29%). A Wilcoxon test of proportions of the WSF incident
frequencies shows the proportions to be statistically significant at the 95% confidence level,
followed by cargo vessels. Finally, cargo vessels experienced the most (56%) of the 84
unusual events recorded in the database between 1995 and 2005. Thus, proportionally, cargo
vessels experienced significantly more accidents, the 2nd-most level of incidents, and
significantly more unusual events during the reporting period. Note that some of the data in
Table A-11 are limited by small sample sizes.
Table A-11 Puget Sound Events by Vessel Type, 1995-2005
Event Type Tankers % Tug-
Barge % Cargo % WSF % Fishing % Total Accidents 35* 2% 325 22% 503 34% 127 9% 472 32% 1462 Incidents 111 10% 87 8% 332 29% 585 50% 44 4% 1159 Unusual Events 25* 30% 9* 11% 47 56% 1* 1% 2* 2% 84 Total Events 171 421 882 713 518 2705
Bold results are statistically significant * = small sample size
PUGET SOUND EVENT FREQUENCY BY VESSEL TYPE
35
325
503
127
472
111 87
332
585
4425 947
1 20
100
200
300
400
500
600
700
TANKER
TUG/BARGE
CARGOWSF
FISHING
VESSEL TYPE
FREQ
UEN
CY ACCIDENTINCIDENTUNUSUAL EVENT
Figure A-6 Puget Sound Events by Vessel Type, 1995-2005

Vessel Traffic Risk Assessment (VTRA) - Final Report 08/31/08
Technical Appendix A: Database Construction and Analysis A-30
Normalizing the Table A-11 accident and incident data with the Table A-9 transit data
provides normalized accident and incident rates by vessel types for the period 1996-2005,
shown in Tables A-12 and A-13, which allows comparison of accident and incident rates for
different vessel types using numbers of transits as a surrogate for exposure. Transit data for
the year 1995 was not available from the U.S. Coast Guard.
Table A-12 Normalized Events by Transits, 1996-2005
Tankers Tug-Barge Cargo WSF Fishing Total Accidents 0.001662* 0.001248 0.004736 7.09E-05 0.009349 0.000656 Incidents 0.005269 0.000334 0.003126 0.000327 0.000871 0.00052 Unusual Events 0.001187* 3.46E-05* 0.000443 5.58E-06* 3.96E-05* 3.77E-05 Total Events 0.008118 0.001617 0.008305 0.000398 0.01026 0.001213
* = small sample size Bold results are statistically significant
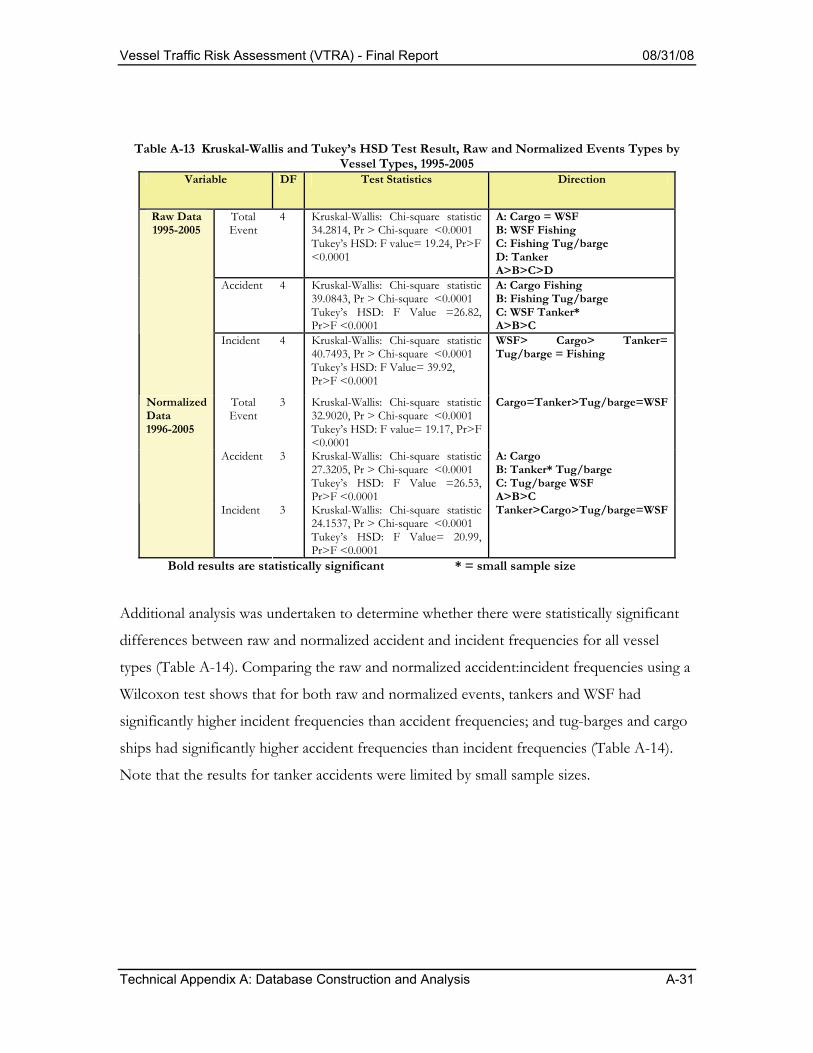
Results of the Kruskal-Wallis test showed that there were statistical differences for the
normalized events, accidents, and incidents among the different vessel types. By using both
Kruskal-Wallis and Tukey’s HSD tests, cargo and tanker vessels were found to have
significantly higher numbers of normalized events, compared to tug-barges and Washington
State Ferries, over the period 1996-2005, as shown in Table A-13. Cargo vessels were shown
to have significantly higher numbers of normalized accidents over the time period,
compared to the other vessel types. Tanker vessels were shown to have significantly higher
numbers of normalized incidents over the time period, compared to the other vessel types.
The normalized results are statistically different from the raw data results, as raw tanker
incidents and total events were not statistically significant, while the normalized incidents for
tankers are.
Vessel Traffic Risk Assessment (VTRA) - Final Report 08/31/08
Technical Appendix A: Database Construction and Analysis A-31
Table A-13 Kruskal-Wallis and Tukey’s HSD Test Result, Raw and Normalized Events Types by Vessel Types, 1995-2005
Variable DF Test Statistics Direction
Total Event
4 Kruskal-Wallis: Chi-square statistic 34.2814, Pr > Chi-square <0.0001 Tukey’s HSD: F value= 19.24, Pr>F <0.0001
A: Cargo = WSF B: WSF Fishing C: Fishing Tug/barge D: Tanker A>B>C>D
Accident 4 Kruskal-Wallis: Chi-square statistic 39.0843, Pr > Chi-square <0.0001 Tukey’s HSD: F Value =26.82, Pr>F <0.0001
A: Cargo Fishing B: Fishing Tug/barge C: WSF Tanker* A>B>C
Raw Data 1995-2005
Incident 4 Kruskal-Wallis: Chi-square statistic 40.7493, Pr > Chi-square <0.0001 Tukey’s HSD: F Value= 39.92, Pr>F <0.0001
WSF> Cargo> Tanker= Tug/barge = Fishing
Total Event
3 Kruskal-Wallis: Chi-square statistic 32.9020, Pr > Chi-square <0.0001 Tukey’s HSD: F value= 19.17, Pr>F <0.0001
Cargo=Tanker>Tug/barge=WSF
Accident 3 Kruskal-Wallis: Chi-square statistic 27.3205, Pr > Chi-square <0.0001 Tukey’s HSD: F Value =26.53, Pr>F <0.0001
A: Cargo B: Tanker* Tug/barge C: Tug/barge WSF A>B>C
Normalized Data 1996-2005
Incident 3 Kruskal-Wallis: Chi-square statistic 24.1537, Pr > Chi-square <0.0001 Tukey’s HSD: F Value= 20.99, Pr>F <0.0001
Tanker>Cargo>Tug/barge=WSF
Bold results are statistically significant * = small sample size
Additional analysis was undertaken to determine whether there were statistically significant
differences between raw and normalized accident and incident frequencies for all vessel
types (Table A-14). Comparing the raw and normalized accident:incident frequencies using a
Wilcoxon test shows that for both raw and normalized events, tankers and WSF had
significantly higher incident frequencies than accident frequencies; and tug-barges and cargo
ships had significantly higher accident frequencies than incident frequencies (Table A-14).
Note that the results for tanker accidents were limited by small sample sizes.

Vessel Traffic Risk Assessment (VTRA) - Final Report 08/31/08
Technical Appendix A: Database Construction and Analysis A-32
Table A-14 Wilcoxon Test and P-value of Normalized and Raw Accidents and Incidents, 1995-2005,
Tankers, Tug-Barges, Cargo Ships, WSF, and Fishing Vessels Variable N Test statistic Normal approximate
Z Two-sided
Pr> Z
Direction
Tanker 11 81.5000 -2.9760 0.0029 Incident>Accident* Tug/barge 11 178.5000 3.4184 0.0006 Accident>Incident Cargo 11 166.0000 2.5938 0.0095 Accident>Incident WSF 11 70.5000 -3.6856 0.0014 Incident>Accident
Raw Data (1995-2005)
Fishing 11 184.5000 3.8237 0.0001 Accident>Incident Tanker 10 70.5000 -2.6089 0.0173 Incident>Accident* Tug/barge 10 148.0000 3.2505 0.0012 Accident>Incident Cargo 10 132.0000 2.0410 0.0413 Accident>Incident
Normalized Data (1996-2005)
WSF 10 59.0000 -3.4773 0.0005 Incident>Accident * = small sample size Bold results are statistically significant
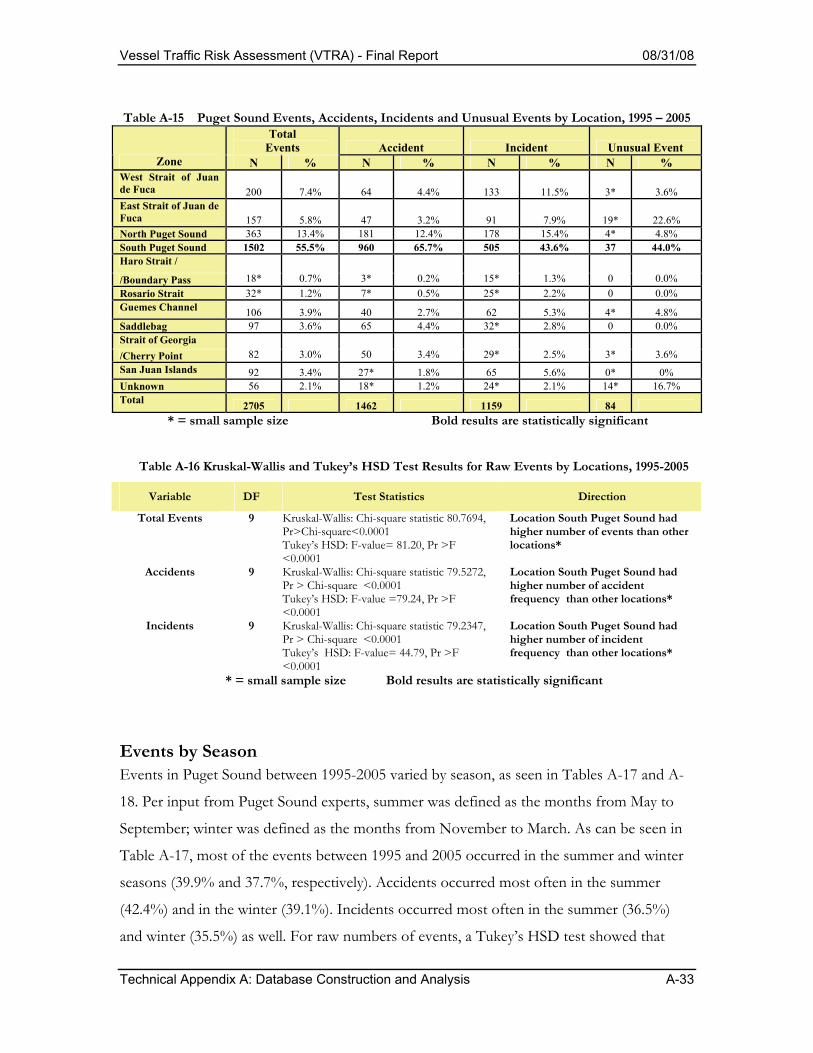
Events by Location Events in Puget Sound occurred in different geographical areas, as can be seen in Table A-15
and Figure A-7. South Puget Sound had the most events from 1995 to 2005. Kruskal-Wallis
and Tukey’s HSD tests were used to analyze the differences between the frequency of
events, accidents, and incidents in the different zones; the number of events occurring in
South Puget Sound was significantly higher than those occurring in other areas at the 95%
confidence level (Table A-16). Events by location were not able to be normalized by transits
because transit data by location was not available. Note that the data in Tables A-15 and A-
16 are limited by small sample sizes.
PUGET SOUND TOTAL EVENT, ACCIDENTS, AND INCIDENTS BY LOCATION
56
20 0 157
3 6 3
150 2
18 3 210 6 9 7 8 2 9 2
18 64 4 7
181
9 60
3 7 4 0 6 5 50 2 72 4133 9 1
178
505
15 2 5 6 2 3 2 2 9 6 5
0
2 00
4 00
6 00
8 00
10 00
12 00
14 00
16 00
LOCATION
TOTAL EVENTACCIDENTINCIDENT
Figure A-7 Puget Sound Event Types by Location, 1995-2005
Vessel Traffic Risk Assessment (VTRA) - Final Report 08/31/08
Technical Appendix A: Database Construction and Analysis A-33
Table A-15 Puget Sound Events, Accidents, Incidents and Unusual Events by Location, 1995 – 2005
Total Events Accident Incident Unusual Event
Zone N % N % N % N % West Strait of Juan de Fuca 200 7.4% 64 4.4% 133 11.5% 3* 3.6% East Strait of Juan de Fuca 157 5.8% 47 3.2% 91 7.9% 19* 22.6% North Puget Sound 363 13.4% 181 12.4% 178 15.4% 4* 4.8% South Puget Sound 1502 55.5% 960 65.7% 505 43.6% 37 44.0% Haro Strait /
/Boundary Pass 18* 0.7% 3* 0.2% 15* 1.3% 0 0.0% Rosario Strait 32* 1.2% 7* 0.5% 25* 2.2% 0 0.0% Guemes Channel 106 3.9% 40 2.7% 62 5.3% 4* 4.8% Saddlebag 97 3.6% 65 4.4% 32* 2.8% 0 0.0% Strait of Georgia /Cherry Point 82 3.0% 50 3.4% 29* 2.5% 3* 3.6% San Juan Islands 92 3.4% 27* 1.8% 65 5.6% 0* 0% Unknown 56 2.1% 18* 1.2% 24* 2.1% 14* 16.7% Total 2705 1462 1159 84 * = small sample size Bold results are statistically significant
Table A-16 Kruskal-Wallis and Tukey’s HSD Test Results for Raw Events by Locations, 1995-2005
Variable DF Test Statistics Direction
Total Events 9 Kruskal-Wallis: Chi-square statistic 80.7694, Pr>Chi-square<0.0001 Tukey’s HSD: F-value= 81.20, Pr >F <0.0001
Location South Puget Sound had higher number of events than other locations*
Accidents 9 Kruskal-Wallis: Chi-square statistic 79.5272, Pr > Chi-square <0.0001 Tukey’s HSD: F-value =79.24, Pr >F <0.0001
Location South Puget Sound had higher number of accident frequency than other locations*
Incidents 9 Kruskal-Wallis: Chi-square statistic 79.2347, Pr > Chi-square <0.0001 Tukey’s HSD: F-value= 44.79, Pr >F <0.0001
Location South Puget Sound had higher number of incident frequency than other locations*
* = small sample size Bold results are statistically significant
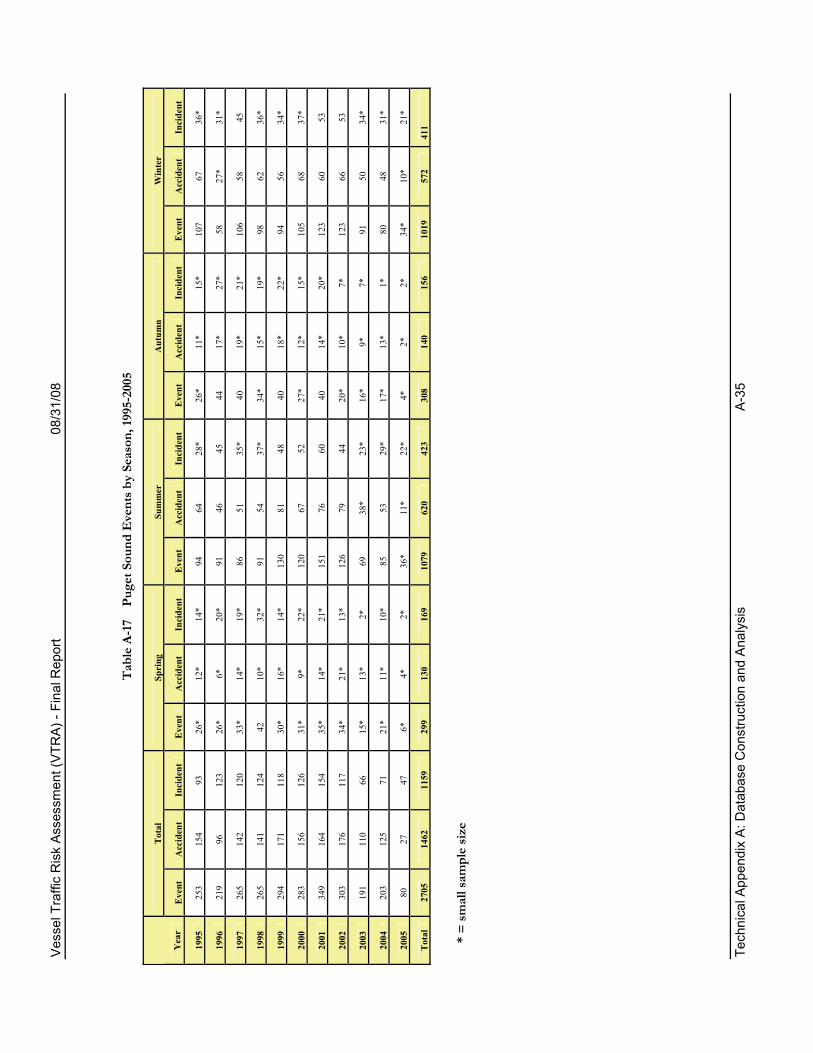
Events by Season Events in Puget Sound between 1995-2005 varied by season, as seen in Tables A-17 and A-
18. Per input from Puget Sound experts, summer was defined as the months from May to
September; winter was defined as the months from November to March. As can be seen in
Table A-17, most of the events between 1995 and 2005 occurred in the summer and winter
seasons (39.9% and 37.7%, respectively). Accidents occurred most often in the summer
(42.4%) and in the winter (39.1%). Incidents occurred most often in the summer (36.5%)
and winter (35.5%) as well. For raw numbers of events, a Tukey’s HSD test showed that
Vessel Traffic Risk Assessment (VTRA) - Final Report 08/31/08
Technical Appendix A: Database Construction and Analysis A-34
summer and winter had significantly higher number of events, accidents, and incidents than
autumn and spring did, and summer was the most significant event period for all event types
(Table A-19).
However, when the data were normalized by transits, spring and autumn had a significantly
higher number of normalized total events and incidents, compared to winter and summer,
and no differences for the normalized accidents were noted among the four seasons. This is
another example of the importance of normalizing results by transits. The differing results
for the normalized data may be because for the raw data, summer and winter have many
more events than spring and autumn since summer was assumed from May to September
and winter from November to March, while spring and autumn had just one month, April
and October separately. For the normalized data, the transits are higher because there are
five months in those seasons. Therefore, there is no statistically significant difference for
normalized total events and accidents.
Vess
el T
raffi
c R
isk
Asse
ssm
ent (
VTR
A) -
Fina
l Rep
ort
08/3
1/08
Te
chni
cal A
ppen
dix
A: D
atab
ase
Con
stru
ctio
n an
d A
naly
sis
A-3
5
Tab
le A
-17
Pu
get S
ound
Eve
nts b
y Se
ason
, 199
5-20
05
Tot
al
Spri
ng
Sum
mer
A
utum
n W
inte
r
Yea
r E
vent
A
ccid
ent
Inci
dent
E
vent
A
ccid
ent
Inci
dent
E
vent
A
ccid
ent
Inci
dent
E
vent
A
ccid
ent
Inci
dent
E
vent
A
ccid
ent
Inci
dent
1995
25
3 15
4 93
26
* 12
* 14
* 94
64
28
* 26
* 11
* 15
* 10
7 67
36
*
1996
21
9 96
12
3 26
* 6*
20
* 91
46
45
44
17
* 27
* 58
27
* 31
*
1997
26
5 14
2 12
0 33
* 14
* 19
* 86
51
35
* 40
19
* 21
* 10
6 58
45
1998
26
5 14
1 12
4 42
10
* 32
* 91
54
37
* 34
* 15
* 19
* 98
62
36
*
1999
29
4 17
1 11
8 30
* 16
* 14
* 13
0 81
48
40
18
* 22
* 94
56
34
*
2000
28
3 15
6 12
6 31
* 9*
22
* 12
0 67
52
27
* 12
* 15
* 10
5 68
37
*
2001
34
9 16
4 15
4 35
* 14
* 21
* 15
1 76
60
40
14
* 20
* 12
3 60
53
2002
30
3 17
6 11
7 34
* 21
* 13
* 12
6 79
44
20
* 10
* 7*
12
3 66
53
2003
19
1 11
0 66
15
* 13
* 2*
69
38
* 23
* 16
* 9*
7*
91
50
34
*
2004
20
3 12
5 71
21
* 11
* 10
* 85
53
29
* 17
* 13
* 1*
80
48
31
*
2005
80
27
47
6*
4*
2*
36
* 11
* 22
* 4*
2*
2*
34
* 10
* 21
*
Tot
al
2705
14
62
1159
29
9 13
0 16
9 10
79
620
423
308
140
156
1019
57
2 41
1
* =
smal
l sam
ple
size

Vess
el T
raffi
c R
isk
Asse
ssm
ent (
VTR
A) -
Fina
l Rep
ort
08/3
1/08
Te
chni
cal A
ppen
dix
A: D
atab
ase
Con
stru
ctio
n an
d A
naly
sis
A-3
6
Tab
le A
-18
Pug
et S
ound
Nor
mal
ized
Eve
nts b
y Se
ason
(Nor
mal
ized
by
Tra
nsits
), 19
96-2
005
Spri
ng
Nor
mal
ized
dat
a Su
mm
er
Nor
mal
ized
dat
a A
utum
n N
orm
aliz
ed d
ata
Win
ter
Nor
mal
ized
dat
a
Yea
r T
rans
its
Eve
nt
Acc
iden
t In
cide
nt
Tra
nsits
E
vent
A
ccid
ent
Inci
dent
T
rans
its
Eve
nt
Acc
iden
t In
cide
nt
Tra
nsits
E
vent
A
ccid
ent
Inci
dent
0.00
12
0.00
06
0.00
06
0.00
09
0.00
06
0.00
03
0.00
14
0.00
06
0.00
08
0.00
11
0.00
07
0.00
04
1996
21
776
10
7320
1794
4
9593
3
0.00
15
0.00
03
0.00
11
0.00
10
0.00
05
0.00
05
0.00
21
0.00
08
0.00
13
0.00
06
0.00
03
0.00
03
1997
17
839
92
696
21
457
10
0769
0.00
19
0.00
08
0.00
11
0.00
09
0.00
05
0.00
04
0.00
23
0.00
11
0.00
12
0.00
11
0.00
06
0.00
05
1998
17
395
96
358
17
639
93
507
0.00
24
0.00
06
0.00
18
0.00
09
0.00
05
0.00
04
0.00
17
0.00
08
0.00
10
0.00
11
0.00
07
0.00
04
1999
17
556
10
4966
1968
6
9228
9
0.00
16
0.00
09
0.00
08
0.00
14
0.00
09
0.00
05
0.00
23
0.00
11
0.00
13
0.00
11
0.00
07
0.00
04
2000
18
589
95
194
17
090
86
157
0.00
17
0.00
05
0.00
12
0.00
13
0.00
07
0.00
05
0.00
13
0.00
06
0.00
07
0.00
12
0.00
08
0.00
04
2001
17
738
95
379
20
066
84
145
0.00
19
0.00
08
0.00
11
0.00
16
0.00
08
0.00
06
0.00
22
0.00
08
0.00
11
0.00
13
0.00
06
0.00
06
2002
18
319
95
534
18
303
92
959
0.00
17
0.00
11
0.00
07
0.00
13
0.00
08
0.00
05
0.00
11
0.00
05
0.00
04
0.00
13
0.00
07
0.00
06
2003
19
458
97
023
18
303
92
932
0.00
09
0.00
08
0.00
01
0.00
08
0.00
04
0.00
03
0.00
09
0.00
05
0.00
04
0.00
11
0.00
06
0.00
04
2004
16
346
87
806
17
458
82
631
0.00
13
0.00
07
0.00
06
0.00
10
0.00
03
0.00
03
0.00
10
0.00
08
0.00
01
0.00
10
0.00
06
0.00
04
2005
16
409
87
421
16
839
82
155
B
old
resu
lts a
re s
tatis
tical
ly si
gnifi
cant
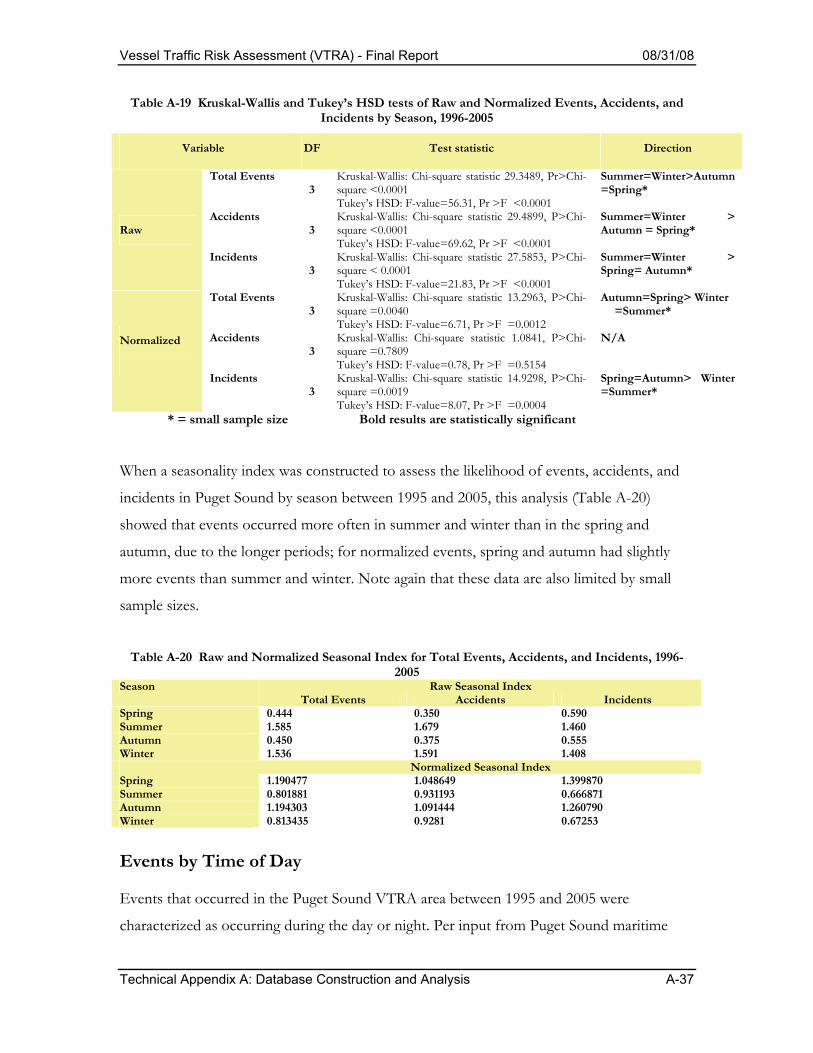
Vessel Traffic Risk Assessment (VTRA) - Final Report 08/31/08
Technical Appendix A: Database Construction and Analysis A-37
Table A-19 Kruskal-Wallis and Tukey’s HSD tests of Raw and Normalized Events, Accidents, and Incidents by Season, 1996-2005
Variable DF Test statistic Direction
Total Events 3
Kruskal-Wallis: Chi-square statistic 29.3489, Pr>Chi-square <0.0001 Tukey’s HSD: F-value=56.31, Pr >F <0.0001
Summer=Winter>Autumn =Spring*
Accidents 3
Kruskal-Wallis: Chi-square statistic 29.4899, P>Chi-square <0.0001 Tukey’s HSD: F-value=69.62, Pr >F <0.0001
Summer=Winter > Autumn = Spring* Raw
Incidents 3
Kruskal-Wallis: Chi-square statistic 27.5853, P>Chi-square < 0.0001 Tukey’s HSD: F-value=21.83, Pr >F <0.0001
Summer=Winter > Spring= Autumn*
Total Events 3
Kruskal-Wallis: Chi-square statistic 13.2963, P>Chi-square =0.0040 Tukey’s HSD: F-value=6.71, Pr >F =0.0012
Autumn=Spring> Winter =Summer*
Accidents 3
Kruskal-Wallis: Chi-square statistic 1.0841, P>Chi-square =0.7809 Tukey’s HSD: F-value=0.78, Pr >F =0.5154
N/A Normalized
Incidents
3 Kruskal-Wallis: Chi-square statistic 14.9298, P>Chi-square =0.0019 Tukey’s HSD: F-value=8.07, Pr >F =0.0004
Spring=Autumn> Winter =Summer*
* = small sample size Bold results are statistically significant
When a seasonality index was constructed to assess the likelihood of events, accidents, and
incidents in Puget Sound by season between 1995 and 2005, this analysis (Table A-20)
showed that events occurred more often in summer and winter than in the spring and
autumn, due to the longer periods; for normalized events, spring and autumn had slightly
more events than summer and winter. Note again that these data are also limited by small
sample sizes.
Table A-20 Raw and Normalized Seasonal Index for Total Events, Accidents, and Incidents, 1996-
2005 Raw Seasonal Index Season
Total Events Accidents Incidents Spring 0.444 0.350 0.590 Summer 1.585 1.679 1.460 Autumn 0.450 0.375 0.555 Winter 1.536 1.591 1.408 Normalized Seasonal Index Spring 1.190477 1.048649 1.399870 Summer 0.801881 0.931193 0.666871 Autumn 1.194303 1.091444 1.260790 Winter 0.813435 0.9281 0.67253
Events by Time of Day Events that occurred in the Puget Sound VTRA area between 1995 and 2005 were
characterized as occurring during the day or night. Per input from Puget Sound maritime

Vessel Traffic Risk Assessment (VTRA) - Final Report 08/31/08
Technical Appendix A: Database Construction and Analysis A-38
experts, day was defined from 6am to 8pm in the spring and summer and 7am to 7pm in the
autumn and winter. The data collected are shown in the Table A-21.
Table A-21 Total Events, Accidents, and Incidents by Day and Night
N: Number of Frequency; %: Percent of Frequency, 1995-2005 Total Events Accidents Incidents Time of Day N % N % N %
Day 1317 48.7 771 52.7 526 45.4 Night 510 18.9 208 14.2 293 25.3 Null 878 32.4 483 33.0 340 29.3 Total 2705 100 1462 100 1159 100
From Table A-21, it can be seen most total events, accidents, and incidents occurred during
the day. One of the obvious reasons is that there are more transits, particularly for WSF
vessels, which comprise 80% of all transits, during the day than at night. A Wilcoxon test
(Table A-22) on the raw data showed no statistical differences between total events and
accident frequencies between day and night. However, vessels had a statistically higher
number of incidents during the day than the night. Caution is noted with the results in Table
A-22, however, because of the high proportion of null values for day and night. In addition,
normalization by transit data was not available by time of day.
Table A-22 Wilcoxon Test on the Total Events, Accidents, and Incidents Frequencies by Time of Day, 1995-2005
Variable N Test statistic
Normal approximate Z Two-sided Pr> Z Direction
Total Events 11 153.5000 1.7735 0.0762 N/A Accidents 11 152.5000 1.7087 0.0875 N/A Incidents 11 156.5000 1.9739 0.0484 Day>Night Bold results are statistically significant
Events by Vessel Flag Events of interest that occurred in the Puget Sound VTRA area between 1995 and 2005
occurred aboard vessels of varying flags, as seen in Figure A-8 and in Table A-24. More
events occurred to U.S. flag vessels during the reporting period than to non-U.S. flag vessels;
these differences were significant at the 95% confidence level using the Wilcoxon test (Table
A-23).
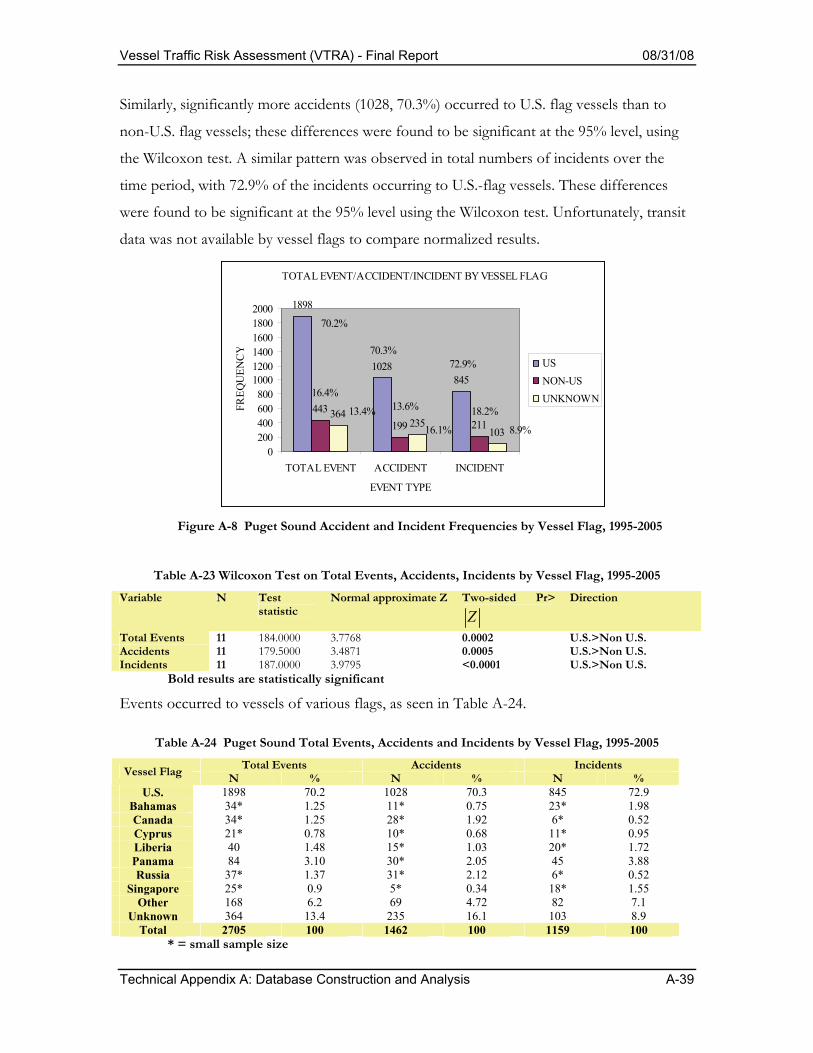
Vessel Traffic Risk Assessment (VTRA) - Final Report 08/31/08
Technical Appendix A: Database Construction and Analysis A-39
Similarly, significantly more accidents (1028, 70.3%) occurred to U.S. flag vessels than to
non-U.S. flag vessels; these differences were found to be significant at the 95% level, using
the Wilcoxon test. A similar pattern was observed in total numbers of incidents over the
time period, with 72.9% of the incidents occurring to U.S.-flag vessels. These differences
were found to be significant at the 95% level using the Wilcoxon test. Unfortunately, transit
data was not available by vessel flags to compare normalized results.
TOTAL EVENT/ACCIDENT/INCIDENT BY VESSEL FLAG
1898
1028845
443199 211
364235
103
0200400600800
100012001400160018002000
TOTAL EVENT ACCIDENT INCIDENT
EVENT TYPE
FREQ
UEN
CY
USNON-USUNKNOWN
70.2%
16.4%
13.4%
70.3%
13.6%
16.1%
72.9%
18.2%
8.9%
Figure A-8 Puget Sound Accident and Incident Frequencies by Vessel Flag, 1995-2005
Table A-23 Wilcoxon Test on Total Events, Accidents, Incidents by Vessel Flag, 1995-2005
Variable N Test statistic
Normal approximate Z Two-sided Pr>
Z
Direction
Total Events 11 184.0000 3.7768 0.0002 U.S.>Non U.S. Accidents 11 179.5000 3.4871 0.0005 U.S.>Non U.S. Incidents 11 187.0000 3.9795 <0.0001 U.S.>Non U.S. Bold results are statistically significant
Events occurred to vessels of various flags, as seen in Table A-24.
Table A-24 Puget Sound Total Events, Accidents and Incidents by Vessel Flag, 1995-2005 Total Events Accidents Incidents Vessel Flag N % N % N %
U.S. 1898 70.2 1028 70.3 845 72.9 Bahamas 34* 1.25 11* 0.75 23* 1.98 Canada 34* 1.25 28* 1.92 6* 0.52 Cyprus 21* 0.78 10* 0.68 11* 0.95 Liberia 40 1.48 15* 1.03 20* 1.72 Panama 84 3.10 30* 2.05 45 3.88 Russia 37* 1.37 31* 2.12 6* 0.52
Singapore 25* 0.9 5* 0.34 18* 1.55 Other 168 6.2 69 4.72 82 7.1
Unknown 364 13.4 235 16.1 103 8.9 Total 2705 100 1462 100 1159 100
* = small sample size

Vessel Traffic Risk Assessment (VTRA) - Final Report 08/31/08
Technical Appendix A: Database Construction and Analysis A-40
A subset of Table A-24, events that occurred to non-U.S. flag vessels between 1995 and
2005, is shown in Table A-25.
Table A-25 Puget Sound Non U.S. Flag Events, 1995-2005
Total Events Accidents Incidents Vessel Flag N % N % N %
Bahamas 34* 7.7 11* 5.5 23* 10.9
Canada 34* 7.7 28* 14.1 6* 2.8
Cyprus 21* 4.7 10* 5 11* 5.2
Liberia 40 9.0 15* 7.5 20* 9.5
Panama 84 19.0 30* 15.1 45 21.3
Russia 37* 8.4 31* 15.3 6* 2.8
Singapore 25* 5.6 5* 2.5 18* 8.5
Other 168 37.9 69 34.7 82 38.9
Total 443 100 199 100 211 100 * = small sample size Bold results are statistically significant
Table A-25 shows that, of the non-U.S. flag events that occurred between 1995 and 2005,
19% of events, 15.1% of accidents, and 21.3% of incidents occurred to Panamanian flag
vessels. A group of ‘other’ non U.S. flag vessels—other than Bahamian, Canadian, Cypriot,
Liberian, Panamanian, Russian and Singapore—comprised the largest group of non U.S.-flag
events (37.9% of events, 34.7% of accidents, and 38.9% of incidents). Using the Kruskal-
Wallis and Tukey’s HSD tests upon raw data, the results show that Panamanian flag vessels
had significantly higher total events and incident frequencies then vessels from other flags.
In addition, Canadian, Panamanian and Russian flag vessels had significantly higher accident
frequencies than vessels from other flags (Table A-26). Note that these data are limited by
small sample sizes, and transit data by flag was not available to normalize the data. Table A-26 Kruskal-Wallis and Tukey’s HSD tests of Raw Events, Accidents, and Incidents
Frequencies by Foreign Vessel Flag, 1995-2005 Variable DF Test Statistics Direction
Total Events 6 Kruskal-Wallis: Chi-square statistic 21.0342, P>Chi-square =0.0026 Tukey’s HSD: F-value= 32.65, Pr >F <0.0001
Panama> Bahamas= Canada =Cyprus =Liberia = Russia =Singapore
Accidents 6 Kruskal-Wallis: Chi-square statistic 21.5897, P>Chi-square =0.0014
Panama= Canada= Russia> Bahamas =Cyprus =Singapore
Incidents 6 Kruskal-Wallis: Chi-square statistic 23.0145, P>Chi-square =0.0011 Tukey’s HSD: F-value =17.20, Pr >F <0.0001
Panama> Bahamas= Canada =Cyprus =Liberia = Russia =Singapore
* = small sample size

Vessel Traffic Risk Assessment (VTRA) - Final Report 08/31/08
Technical Appendix A: Database Construction and Analysis A-41
Events by Owner An analysis of events by vessel owner is presented in Table A-27. Note that vessel owner
data is dynamic, as some vessel owners may no longer exist, or some vessels may have
changed their operators during the period for which the database captures information.
Table A-27 presents event information for owners that have more than 30 events between
1995 and 2005, excluding the Washington State Ferries. Table A-27 Puget Sound Events by Vessel Owners, 1995-2005
Total Events Accidents Incidents OWNER N % N % N %
Foss 68 100 54 79.4 10* 14.7 U.S. Navy 56 100 44 78.6 9* 16.1 Crowley 56 100 46 82.1 10* 17.9 U.S. Coast Guard 44 100 44 100 0 0 Clipper Navigation, Inc. 36* 100 12* 33.3 22* 61.1 Olympic Tug and Barge, Inc. 30* 100 23* 76.7 7* 23.3 N: Number of total events, accidents, incidents; %: Percent of accidents or incidents of total events
* = small sample size
In Table A-27, it can be seen that most of the vessel owners in the table have higher accident
frequencies than incident frequencies, except Clipper Navigation, Inc. There are differences
between different owners with respect to accident and incident frequencies, as seen in Table
A-28; however, a Kruskal-Wallis and Tukey’s HSD analysis on the raw data show no
significant differences for total events among the vessel owners. Transit data by owner was
not available to normalize this data. Table A-28 Kruskal-Wallis and Tukey’s HSD tests of Raw Events, Accidents, and Incidents
by Vessel Owner, 1995-2005 Variable DF Test Statistics Direction
Total Events 5 Kruskal-Wallis: Chi-square statistic 8.3655, P>Chi-square =0.1390
N/A
Accidents 5 Kruskal-Wallis: Chi-square statistic 20.9822, P>Chi-square =0.0010 Tukey’s HSD: F-value=4.60, Pr >F=0.0016
A: Foss Crowley US Navy USCG Olympic Tug and Barge B: Olympic Tug and Barge, Clipper A>B *
Incidents 5 Kruskal-Wallis: Chi-square statistic 11.6234, P>Chi-square =0.0440 Tukey’s HSD: F value 2.56, Pr>F 0.0445
A: Clipper, Crowley, Foss, US Navy, Olympic Tug and Barge B: Crowley, Foss, US Navy, Olympic Tug and Barge, USCG A>B *
* = small sample size Bold results are statistically significant
Events by Classification Society Class society information for the VTRA accident-incident records were obtained from
Lloyd’s List. Although the classification society for vessels can vary over time, the
classification society for the vessel at the time of the recorded event was captured in the

Vessel Traffic Risk Assessment (VTRA) - Final Report 08/31/08
Technical Appendix A: Database Construction and Analysis A-42
database. The major classification societies include the American Bureau of Shipping (ABS),
Det Norske Veritas Classification A/S (DNV), Nippon Kaiji Kyokai (NK), and Lloyd’s
Register (LR). Total events, accidents, incidents, and unusual events by vessel registered with
various class societies are found in the Table A-29. Note that much of the data in Table A-
29 and the results in Table A-30 are limited by small sample sizes.
Table A-29 Puget Sound Event Types by Classification Society, 1995-2005 Class Society Total Events Accidents Incidents Unusual Events ABS 318 166 131 21* Bureau Veritas (BV) 20* 12* 5* 3* China Classification Society (CS) 8* 1* 3* 4* China Corp. Register of Shipping (CR)
2* 0 1* 1*
Croatian Register of Shipping (HV) 1* 0 1* 0 Germanischer Lloyd (GL) 24* 7* 12* 5* Korean Register of Shipping (KR) 12* 4* 4* 4* Lloyd’s Register (LR) 27* 15* 10* 2* Nippon Kaiji Kyokai (NK) 70 19* 36* 15* Det Norske Veritas Classification A/S (DNV)
83 36* 40 7*
Registro Italiano Navale (RINA)(RI) 5* 2* 2* 1* Russian Maritime Register of Shipping (RS)
20* 14* 6* 1*
Null 2115 1186 908 20 Total 2705 1462 1159 84 * = small sample size
Kruskal-Wallis and Tukey’s HSD tests on the class society data showed that ABS class
vessels had a statistically higher number of total events, accidents, and incidents than those
belonging to other classification societies (Table A-30). Normalization data by vessel class
was not available for this analysis. Table A-30 Kruskal-Wallis and Tukey’s HSD tests of Raw Events, Accidents and Incidents
by Class Society Variable DF Test Statistics Direction
Total Events 3 Kruskal-Wallis: Chi-square statistic 30.4518, P>Chi-square <0.0001 Tukey’s HSD: F-value=34.16, Pr >F <0.0001
ABS>DNV=NK=LR*
Accidents 3 Kruskal-Wallis: Chi-square statistic 26.6617, P>Chi-square <0.0001 Tukey’s HSD: F-value= 54.05, Pr >F <0.0001
ABS>DNV*=NK*=LR*
Incidents 3 Kruskal-Wallis: Chi-square statistic 28.0562, P>Chi-square <0.0001 Tukey’s HSD: F-value= 20.21, Pr >F <0.0001
ABS>DNV*=NK*=LR*
* = small sample size Bold results are statistically significant
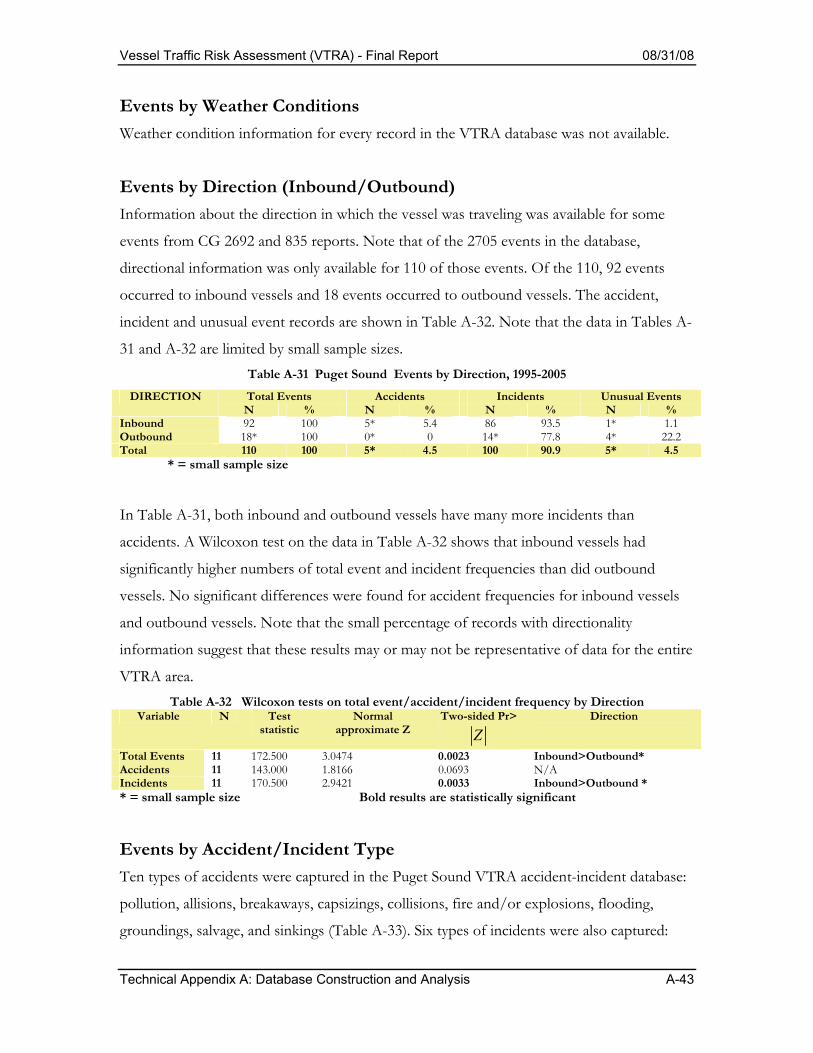
Vessel Traffic Risk Assessment (VTRA) - Final Report 08/31/08
Technical Appendix A: Database Construction and Analysis A-43
Events by Weather Conditions Weather condition information for every record in the VTRA database was not available.
Events by Direction (Inbound/Outbound) Information about the direction in which the vessel was traveling was available for some
events from CG 2692 and 835 reports. Note that of the 2705 events in the database,
directional information was only available for 110 of those events. Of the 110, 92 events
occurred to inbound vessels and 18 events occurred to outbound vessels. The accident,
incident and unusual event records are shown in Table A-32. Note that the data in Tables A-
31 and A-32 are limited by small sample sizes. Table A-31 Puget Sound Events by Direction, 1995-2005 Total Events Accidents Incidents Unusual Events DIRECTION N % N % N % N %
Inbound 92 100 5* 5.4 86 93.5 1* 1.1 Outbound 18* 100 0* 0 14* 77.8 4* 22.2 Total 110 100 5* 4.5 100 90.9 5* 4.5 * = small sample size
In Table A-31, both inbound and outbound vessels have many more incidents than
accidents. A Wilcoxon test on the data in Table A-32 shows that inbound vessels had
significantly higher numbers of total event and incident frequencies than did outbound
vessels. No significant differences were found for accident frequencies for inbound vessels
and outbound vessels. Note that the small percentage of records with directionality
information suggest that these results may or may not be representative of data for the entire
VTRA area. Table A-32 Wilcoxon tests on total event/accident/incident frequency by Direction
Variable N Test statistic
Normal approximate Z
Two-sided Pr>
Z
Direction
Total Events 11 172.500 3.0474 0.0023 Inbound>Outbound* Accidents 11 143.000 1.8166 0.0693 N/A Incidents 11 170.500 2.9421 0.0033 Inbound>Outbound * * = small sample size Bold results are statistically significant
Events by Accident/Incident Type Ten types of accidents were captured in the Puget Sound VTRA accident-incident database:
pollution, allisions, breakaways, capsizings, collisions, fire and/or explosions, flooding,
groundings, salvage, and sinkings (Table A-33). Six types of incidents were also captured:
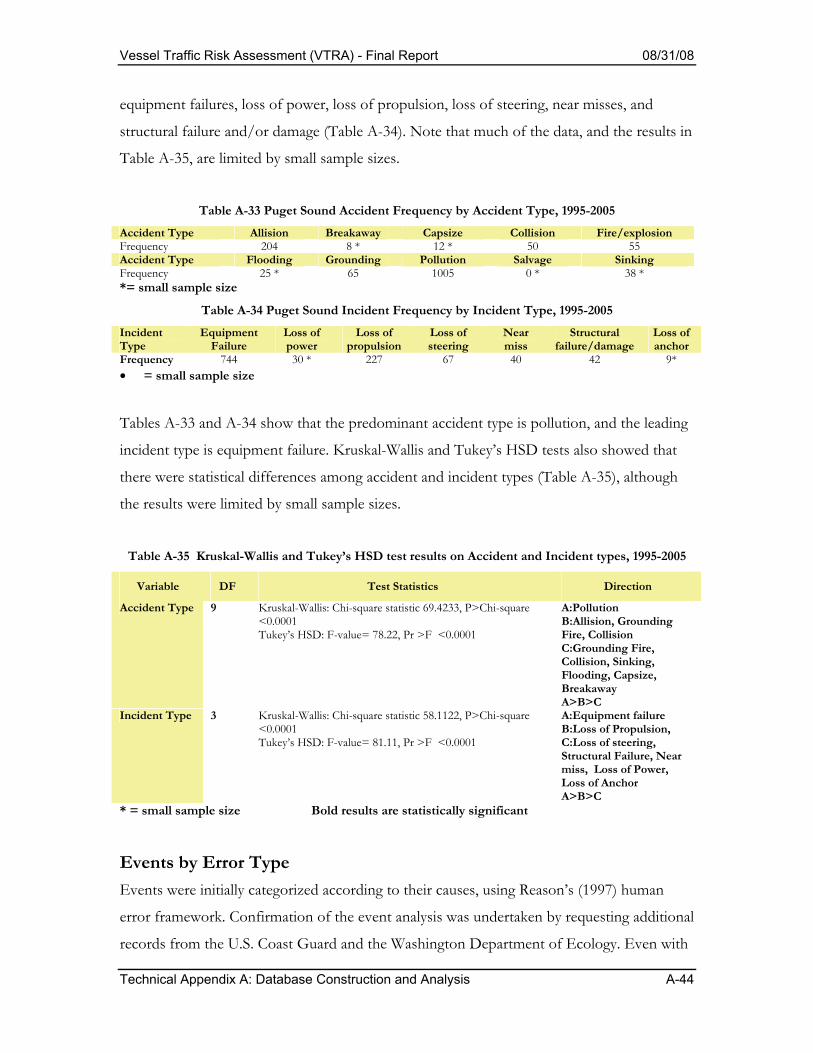
Vessel Traffic Risk Assessment (VTRA) - Final Report 08/31/08
Technical Appendix A: Database Construction and Analysis A-44
equipment failures, loss of power, loss of propulsion, loss of steering, near misses, and
structural failure and/or damage (Table A-34). Note that much of the data, and the results in
Table A-35, are limited by small sample sizes.
Table A-33 Puget Sound Accident Frequency by Accident Type, 1995-2005
Accident Type Allision Breakaway Capsize Collision Fire/explosion Frequency 204 8 * 12 * 50 55 Accident Type Flooding Grounding Pollution Salvage Sinking Frequency 25 * 65 1005 0 * 38 * *= small sample size
Table A-34 Puget Sound Incident Frequency by Incident Type, 1995-2005 Incident Type
Equipment Failure
Loss of power
Loss of propulsion
Loss of steering
Near miss
Structural failure/damage
Loss of anchor
Frequency 744 30 * 227 67 40 42 9* • = small sample size
Tables A-33 and A-34 show that the predominant accident type is pollution, and the leading
incident type is equipment failure. Kruskal-Wallis and Tukey’s HSD tests also showed that
there were statistical differences among accident and incident types (Table A-35), although
the results were limited by small sample sizes.
Table A-35 Kruskal-Wallis and Tukey’s HSD test results on Accident and Incident types, 1995-2005
Variable DF Test Statistics Direction
Accident Type 9 Kruskal-Wallis: Chi-square statistic 69.4233, P>Chi-square <0.0001 Tukey’s HSD: F-value= 78.22, Pr >F <0.0001
A:Pollution B:Allision, Grounding Fire, Collision C:Grounding Fire, Collision, Sinking, Flooding, Capsize, Breakaway A>B>C
Incident Type 3 Kruskal-Wallis: Chi-square statistic 58.1122, P>Chi-square <0.0001 Tukey’s HSD: F-value= 81.11, Pr >F <0.0001
A:Equipment failure B:Loss of Propulsion, C:Loss of steering, Structural Failure, Near miss, Loss of Power, Loss of Anchor A>B>C
* = small sample size Bold results are statistically significant
Events by Error Type Events were initially categorized according to their causes, using Reason’s (1997) human
error framework. Confirmation of the event analysis was undertaken by requesting additional
records from the U.S. Coast Guard and the Washington Department of Ecology. Even with

Vessel Traffic Risk Assessment (VTRA) - Final Report 08/31/08
Technical Appendix A: Database Construction and Analysis A-45
the additional records, however, 47% (1279 events) contained insufficient information to
make an error determination. Of the remaining 1426 events, 1181 were found to be due to
mechanical failure and 213 were attributable to human error (Figure A-9).
Accidents were found to be caused significantly by human and organizational error (HOE),
rather than mechanical failures (MF) (Table A-36); at the same time, incidents were
significantly caused by mechanical failures (MF), rather than by human and organizational
error (Table A-36).
A breakdown of the 1394 records with sufficient causal information is shown in Table A-37.
The predominance of mechanical failures is partially a reflection of the paucity of detailed
human and organizational error (HOE) and root cause data available in public data records.
Note especially the drop off in HOE events after 2003, which is again though to reflect
changes in reporting systems and requirements, as discussed in Section A-3.
Table A-37 shows the results of tests of the proportion of events caused by human and
organizational error (HOE) compared to mechanical failure (MF): for tankers, tug-barges,
cargo, WSF and fishing vessels, mechanical errors caused significantly more events than did
human error at the 95% confidence level. The data and test results are shown in the Tables
A-37 and A-38. Note that all of the vessel-type results are limited by small sample sizes, and
by the availability of confirmatory HOE information in the public data records.
Table A-36 Wilcoxon Tests on Puget Sound Total Events, Accidents and Incidents
by Error Type, 1995-2005 Variable N Test
statistic Normal
approximate Z Two-sided Pr> |Z|
Direction
Total Events 11 66.0000 -3.9410 <0.0001 MF>HOE Accidents 11 163.0000 2.3733 0.0176 HOE>MF Incidents 11 66.0000 -3.9533 <0.0001 MF>HOE * = small sample size

Vessel Traffic Risk Assessment (VTRA) - Final Report 08/31/08
Technical Appendix A: Database Construction and Analysis A-46
Puget Sound Total Events by Error Type, 1995-2005
HUMAN ERROR, 213, 8%
INSUFFICIENT INFORMATION,
1279, 47%MECHANICAL
FAILURE, 1181, 44%
OTHERS, 9, 0%WEATHER, 23, 1%
HUMAN ERROR
MECHANICAL FAILURE
WEATHER
OTHERS
INSUFFICIENT INFORMATION
Figure A-9 Puget Sound Error Types, 1995-2005
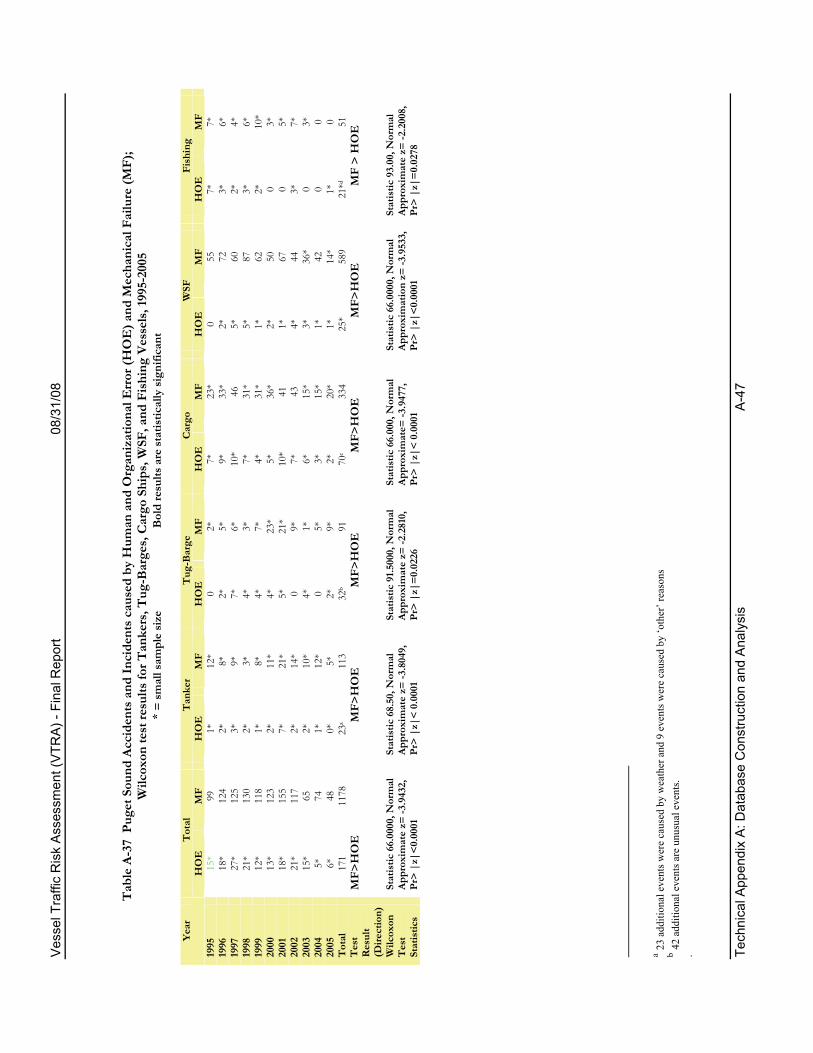
Vess
el T
raffi
c R
isk
Asse
ssm
ent (
VTR
A) -
Fina
l Rep
ort
08/3
1/08
Te
chni
cal A
ppen
dix
A: D
atab
ase
Con
stru
ctio
n an
d A
naly
sis
A-4
7
Tab
le A
-37
Pug
et S
ound
Acc
iden
ts a
nd In
cide
nts c
ause
d by
Hum
an a
nd O
rgan
izat
iona
l Err
or (H
OE
) and
Mec
hani
cal F
ailu
re (M
F);
Wilc
oxon
test
resu
lts fo
r Tan
kers
, Tug
-Bar
ges,
Car
go S
hips
, WSF
, and
Fis
hing
Ves
sels
, 199
5-20
05
* =
smal
l sam
ple
size
Bol
d re
sults
are
stat
istic
ally
sign
ifica
nt
a 23 a
dditi
onal
eve
nts w
ere
caus
ed b
y w
eath
er a
nd 9
eve
nts w
ere
caus
ed b
y ‘o
ther
’ rea
sons
b 42
add
ition
al e
vent
s are
unu
sual
eve
nts.
.
Tot
al
Tan
ker
Tug
-Bar
ge
Car
go
WSF
Fi
shin
g Ye
ar
HO
E
MF
HO
E
MF
HO
E
MF
HO
E
MF
HO
E
MF
HO
E
MF
1995
15
* 99
1*
12
* 0
2*
7*
23*
0 55
7*
7*
19
96
18*
124
2*
8*
2*
5*
9*
33*
2*
72
3*
6*
1997
27
* 12
5 3*
9*
7*
6*
10
* 46
5*
60
2*
4*
19
98
21*
130
2*
3*
4*
3*
7*
31*
5*
87
3*
6*
1999
12
* 11
8 1*
8*
4*
7*
4*
31
* 1*
62
2*
10
* 20
00
13*
123
2*
11*
4*
23*
5*
36*
2*
50
0 3*
20
01
18*
155
7*
21*
5*
21*
10*
41
1*
67
0 5*
20
02
21*
117
2*
14*
0 9*
7*
43
4*
44
3*
7*
20
03
15*
65
2*
10*
4*
1*
6*
15
* 3*
36
* 0
3*
2004
5*
74
1*
12
* 0
5*
3*
15*
1*
42
0 0
2005
6*
48
0*
5*
2*
9*
2*
20
* 1*
14
* 1*
0
Tot
al
171
1178
23
a 11
3 32
b 91
70
c 33
4 25
* 58
9 21
*d
51
Tes
t R
esul
t (D
irect
ion)
MF>
HO
E
MF>
HO
E
MF>
HO
E
MF>
HO
E
MF>
HO
E
MF
> H
OE
Wilc
oxon
T
est
Stat
istic
s
Stat
istic
66.
0000
, Nor
mal
Ap
prox
imat
e z=
-3.9
432,
Pr
> |z
|<0.
0001
Stat
istic
68.
50, N
orm
al
Appr
oxim
ate
z= -3
.804
9,
Pr>
|z|<
0.0
001
Stat
istic
91.5
000,
Nor
mal
Ap
prox
imat
e z=
-2.2
810,
Pr
> |z
|=0.
0226
Stat
istic
66.
000,
Nor
mal
Ap
prox
imat
e= -3
.947
7,
Pr>
|z|<
0.0
001
Stat
istic
66.
0000
, Nor
mal
Ap
prox
imat
ion
z= -3
.953
3,
Pr>
|z|<
0.00
01
Stat
istic
93.
00, N
orm
al
Appr
oxim
ate
z= -2
.200
8,
Pr>
|z|=
0.02
78
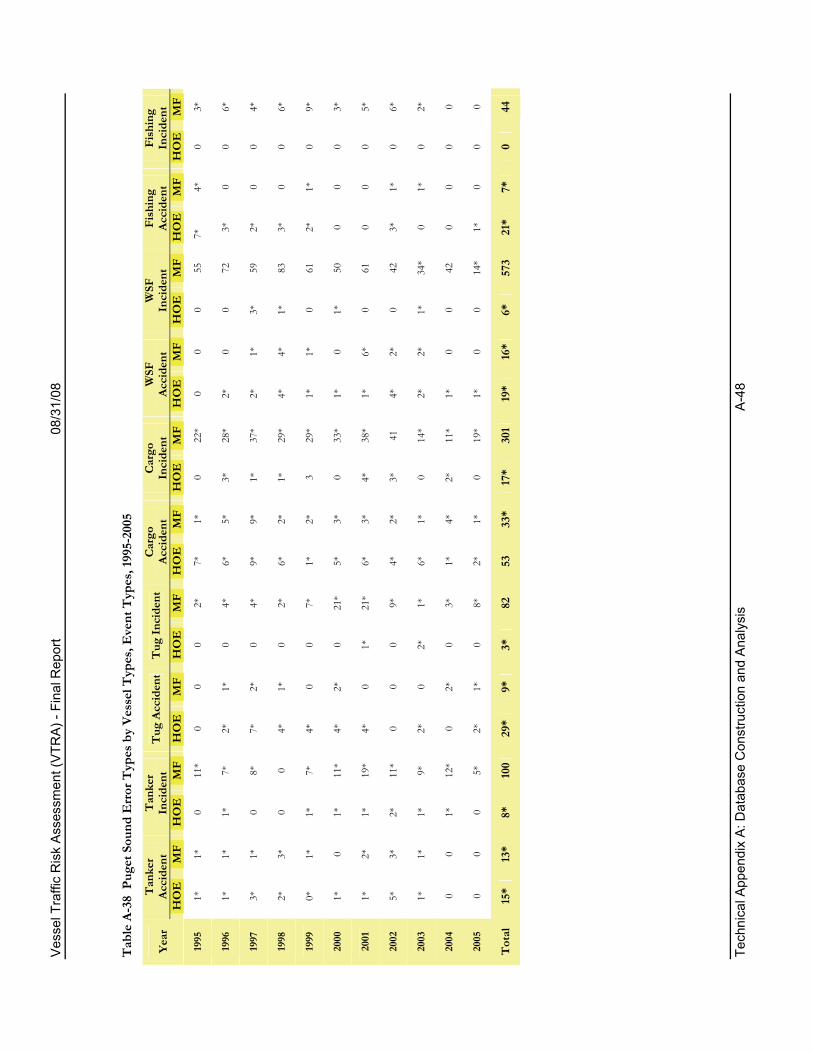
Vess
el T
raffi
c R
isk
Asse
ssm
ent (
VTR
A) -
Fina
l Rep
ort
08/3
1/08
Te
chni
cal A
ppen
dix
A: D
atab
ase
Con
stru
ctio
n an
d A
naly
sis
A-4
8 T
able
A-3
8 P
uget
Sou
nd E
rror
Typ
es b
y Ve
ssel
Typ
es, E
vent
Typ
es, 1
995-
2005
T
anke
r Ac
cide
nt
Tan
ker
Inci
dent
T
ug A
ccid
ent
Tug
Inci
dent
Car
go
Acci
dent
C
argo
In
cide
nt
WSF
Ac
cide
nt
WSF
In
cide
nt
Fish
ing
Acci
dent
Fi
shin
g In
cide
nt
Year
H
OE
M
F H
OE
M
F H
OE
MF
HO
EM
F H
OE
MF
HO
EM
F H
OE
MF
HO
EM
F H
OE
MF
HO
EM
F
1995
1*
1*
0
11*
0 0
0 2*
7*
1*
0
22*
0 0
0 55
7
* 4*
0
3*
1996
1*
1*
1*
7*
2*
1*
0
4*
6*
5*
3*
28*
2*
0 0
72
3*
0 0
6*
1997
3*
1*
0
8*
7*
2*
0 4*
9*
9*
1*
37
* 2*
1*
3*
59
2*
0
0 4*
1998
2*
3*
0
0 4*
1*
0
2*
6*
2*
1*
29*
4*
4*
1*
83
3*
0 0
6*
1999
0*
1*
1*
7*
4*
0
0 7*
1*
2*
3
29*
1*
1*
0 61
2*
1*
0
9*
2000
1*
0
1*
11*
4*
2*
0 21
* 5*
3*
0
33*
1*
0 1*
50
0
0 0
3*
2001
1*
2*
1*
19
* 4*
0
1*
21*
6*
3*
4*
38*
1*
6*
0 61
0
0 0
5*
2002
5*
3*
2*
11
* 0
0 0
9*
4*
2*
3*
41
4*
2*
0 42
3*
1*
0
6*
2003
1*
1*
1*
9*
2*
0
2*
1*
6*
1*
0 14
* 2*
2*
1*
34
* 0
1*
0 2*
2004
0
0 1*
12
* 0
2*
0 3*
1*
4*
2*
11
* 1*
0
0 42
0
0 0
0
2005
0
0 0
5*
2*
1*
0 8*
2*
1*
0
19*
1*
0 0
14*
1*
0 0
0
Tot
al
15*
13*
8*
100
29*
9*
3*
82
53
33*
17*
301
19*
16*
6*
573
21*
7*
0 44

Vessel Traffic Risk Assessment (VTRA) - Final Report 08/31/08
Technical Appendix A: Database Construction and Analysis A-49
Normalizing the data by transits provided contrasting results (Table A-39). In contrast to the
raw data, which showed cargo ships and tug-barges with the largest proportion of accidents
by HOE, the normalized data showed tankers and cargo ships, followed by tug-barges and
WSF, having the highest proportion of accidents caused by HOE. In other words, tug-barge
accidents by HOE were proportionally less frequent when the normalized data were
considered; similarly, tanker accidents by HOE were proportionally more frequent when the
normalized data were considered. It should be noted, however, that in both the raw and
normalized data, tanker accidents were characterized by small sample sizes, and because of
the limited detailed accident information available, caution is advised with these results.
In the raw data, accidents due to mechanical failure occurred most frequently to cargo ships,
tankers and WSF vessels. Normalizing the accidents caused by mechanical failure data
dropped WSF from the most frequently occurring group; tankers and cargo ships continued
to have the most frequent normalized numbers of accidents by mechanical failure over the
period 1995-2005. Again, all accident data caused by mechanical failure in this analysis were
characterized by a small sample size.
Raw data for incidents caused by HOE showed that cargo ships, tankers, and WSF vessels
showed the highest frequency; the normalized data showed different results, as tankers alone
showed the most frequency, followed by cargo vessels, tug-barges and WSF vessels. These
data were also characterized by small sample sizes.
Finally, the raw data for incidents due to mechanical failure showed that these events
happened most frequently to WSF vessels over the period 1995-2005, then cargo vessels,
then tankers and tug-barges and fishing vessels. The normalized data again showed
significant differences, with tankers and cargo ships having the highest frequency, followed
by tug-barges and WSF. Note that the incidents by mechanical failure data were not
characterized by small sample sizes, in contrast to the other data sets.
Normalizing the data, therefore, accounted not only for differences in transits between
vessel types, but also showed that tanker events occurred most frequently for all categories,
compared to the other vessel types. However, caution is advised with these results as they
are all characterized by small sample sizes. Thus, whether accident or incident, HOE or
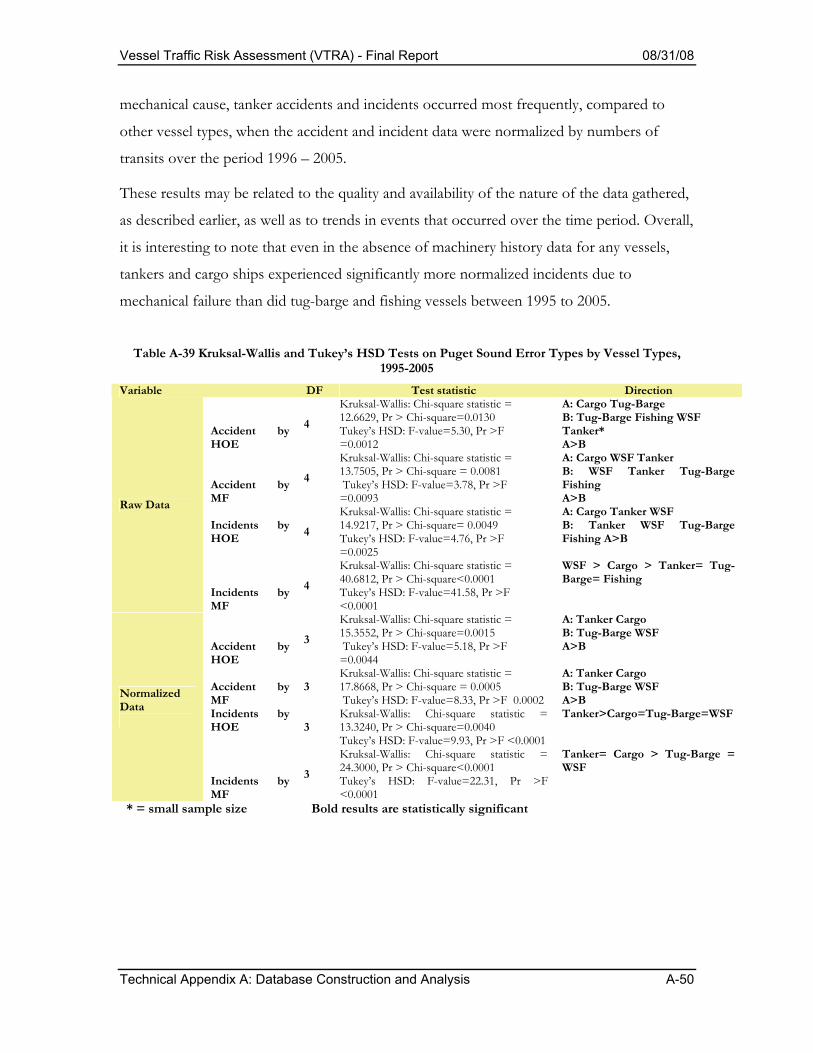
Vessel Traffic Risk Assessment (VTRA) - Final Report 08/31/08
Technical Appendix A: Database Construction and Analysis A-50
mechanical cause, tanker accidents and incidents occurred most frequently, compared to
other vessel types, when the accident and incident data were normalized by numbers of
transits over the period 1996 – 2005.
These results may be related to the quality and availability of the nature of the data gathered,
as described earlier, as well as to trends in events that occurred over the time period. Overall,
it is interesting to note that even in the absence of machinery history data for any vessels,
tankers and cargo ships experienced significantly more normalized incidents due to
mechanical failure than did tug-barge and fishing vessels between 1995 to 2005.
Table A-39 Kruksal-Wallis and Tukey’s HSD Tests on Puget Sound Error Types by Vessel Types,
1995-2005 Variable DF Test statistic Direction
Accident by HOE
4
Kruksal-Wallis: Chi-square statistic = 12.6629, Pr > Chi-square=0.0130 Tukey’s HSD: F-value=5.30, Pr >F =0.0012
A: Cargo Tug-Barge B: Tug-Barge Fishing WSF Tanker* A>B
Accident by MF
4
Kruksal-Wallis: Chi-square statistic = 13.7505, Pr > Chi-square = 0.0081 Tukey’s HSD: F-value=3.78, Pr >F =0.0093
A: Cargo WSF Tanker B: WSF Tanker Tug-Barge Fishing A>B
Incidents by HOE
4
Kruksal-Wallis: Chi-square statistic = 14.9217, Pr > Chi-square= 0.0049 Tukey’s HSD: F-value=4.76, Pr >F =0.0025
A: Cargo Tanker WSF B: Tanker WSF Tug-Barge Fishing A>B
Raw Data
Incidents by MF
4
Kruksal-Wallis: Chi-square statistic = 40.6812, Pr > Chi-square<0.0001 Tukey’s HSD: F-value=41.58, Pr >F <0.0001
WSF > Cargo > Tanker= Tug-Barge= Fishing
Accident by HOE
3
Kruksal-Wallis: Chi-square statistic = 15.3552, Pr > Chi-square=0.0015 Tukey’s HSD: F-value=5.18, Pr >F =0.0044
A: Tanker Cargo B: Tug-Barge WSF A>B
Accident by MF
3 Kruksal-Wallis: Chi-square statistic = 17.8668, Pr > Chi-square = 0.0005 Tukey’s HSD: F-value=8.33, Pr >F 0.0002
A: Tanker Cargo B: Tug-Barge WSF A>B
Incidents by HOE
3 Kruksal-Wallis: Chi-square statistic = 13.3240, Pr > Chi-square=0.0040 Tukey’s HSD: F-value=9.93, Pr >F <0.0001
Tanker>Cargo=Tug-Barge=WSF
Normalized Data
Incidents by MF
3
Kruksal-Wallis: Chi-square statistic = 24.3000, Pr > Chi-square<0.0001 Tukey’s HSD: F-value=22.31, Pr >F <0.0001
Tanker= Cargo > Tug-Barge = WSF
* = small sample size Bold results are statistically significant
Vessel Traffic Risk Assessment (VTRA) - Final Report 08/31/08
Technical Appendix A: Database Construction and Analysis A-51
Human and Organizational Error Analysis Detailed event records were requested from the Coast Guard and DOE to supplement the
public event records. These records included CG 2692 and 835 archives from Coast Guard
Headquarters and DOE accident investigation reports. Once the detailed event records were
compiled and incorporated into the accident-incident database, Reason’s human error
framework and Shappell and Weigemann’s performance shaping factors were used for
analysis, as discussed in this section. Influence diagrams to illustrate BP Cherry Point tanker
and ITB/ATB fleet collisions, allisions and groundings were developed (Appendix A-3).
Finally, calibration events for the VTRA simulation were identified: these events included
collisions, allisions and groundings for the BP Cherry Point tanker and ITB/ATB calling
fleet, as described earlier.
Reason’s (1997) cognitive framework of human error classifies unsafe acts into two types of
activities: errors, which are unintended actions; and violations, which are intended actions
(Figure A-10). Shappell and Weigemann (1997, 2001) identified errors as being of three
types: rule-based errors, skill-based errors, and knowledge-based errors, based on Rasmussen’s (1983,
1986) model of cognitive information processing. Violations can be either of two types:
routine, which are common place abrogation of policies, rules or procedures that are
condoned by management, or exceptional violations, which are not condoned by
management.
Skill-based errors are those errors associated with failures to execute well-rehearsed actions,
where there is little need for conscious decision-making (Rasmussen, 1986). Skill-based
performance relies on skills that a person acquires over time and stores in memory. Skill-
based errors, therefore, are largely errors of execution. Examples of skill-based errors include
failures to execute a task, or to apply the correct skills to complete an assignment.
Two types of decision errors were identified by Shappell and Weigemann: rule-based and
knowledge-based errors. Rule-based errors are similar to skill-based errors in that they
represent failures to follow procedures, and are generally routines in nature (Rasmussen,
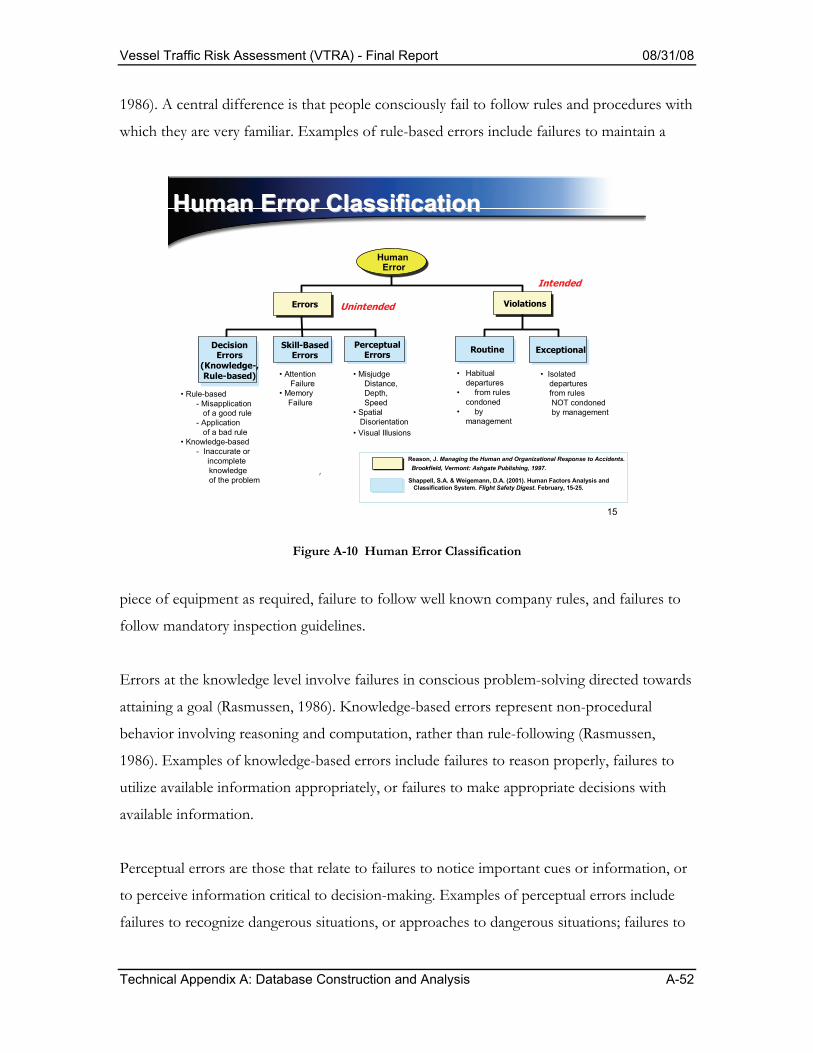
Vessel Traffic Risk Assessment (VTRA) - Final Report 08/31/08
Technical Appendix A: Database Construction and Analysis A-52
1986). A central difference is that people consciously fail to follow rules and procedures with
which they are very familiar. Examples of rule-based errors include failures to maintain a
15
Human Error ClassificationHuman Error Classification
e
UNSAFEACTS
Human Error
ViolationsErrorsErrors
ExceptionalRoutinePerceptualErrors
DecisionErrors
(Knowledge-,Rule-based)
Skill-BasedErrors
Unintended
Intended
• Habitual departures
• from rules condoned
• by management
• Rule-based- Misapplication
of a good rule- Application
of a bad rule• Knowledge-based
- Inaccurate or incomplete knowledge of the problem
• Attention Failure
• Memory Failure
• Misjudge Distance,Depth, Speed
• Spatial Disorientation
• Visual Illusions
• Isolated departures from rulesNOT condoned by management
Reason, J. Managing the Human and Organizational Response to Accidents. Brookfield, Vermont: Ashgate Publishing, 1997.
Shappell, S.A. & Weigemann, D.A. (2001). Human Factors Analysis and Classification System. Flight Safety Digest. February, 15-25.
Figure A-10 Human Error Classification
piece of equipment as required, failure to follow well known company rules, and failures to
follow mandatory inspection guidelines.
Errors at the knowledge level involve failures in conscious problem-solving directed towards
attaining a goal (Rasmussen, 1986). Knowledge-based errors represent non-procedural
behavior involving reasoning and computation, rather than rule-following (Rasmussen,
1986). Examples of knowledge-based errors include failures to reason properly, failures to
utilize available information appropriately, or failures to make appropriate decisions with
available information.
Perceptual errors are those that relate to failures to notice important cues or information, or
to perceive information critical to decision-making. Examples of perceptual errors include
failures to recognize dangerous situations, or approaches to dangerous situations; failures to

Vessel Traffic Risk Assessment (VTRA) - Final Report 08/31/08
Technical Appendix A: Database Construction and Analysis A-53
recognize patterns of events that could lead to failures; or a lack of awareness of
surroundings, situations or behavior that could led to adverse events.
As noted in the previous section, the human error analysis was limited by a lack of available
information. Of the 2705 database events, only 53% (1426) had sufficient information to
make an error determination; 47% (1279 events) had insufficient information (Figure A-9).
Of the 1426 events with sufficient information for detailed error analyses, 213 of those
events could be attributed to human error, while 1181 events were due to mechanical failure.
In addition, 23 other events were attributed to weather conditions and 9 events were
attributed to other reasons. On one hand, the proportion of human error events is a
surprising result, given the often-quoted statistic that 80% of all events are due to human
error; the proportion is a reflection of the paucity of detailed human error information in the
event records, compared to the more available mechanical error information.
Breaking down the 213 human error events further shows that 79% (168) were unintended
errors, rather than violations (32 events). Another 13 events that were characterized as due
to human error in the accident records could not be described further, due to a lack of
supporting or detailed information. These 13 events are counted in the HOE total of 213
events (Figure A-11), but are not counted in either of the 168 errors or 32 violations shown
in Figure A-11. Of the 168 unintended errors, significantly more events (87, or 52%) were
due to perceptual errors (Chi-square = 8.87, p = 0.012), compared to decision- (36 events,
21%) or skill-based errors (45 events, 27%). As can be seen in Figure A-11, none of the error
subtype data (decision error data, perceptual error data, skill-based error data) were
characterized by small sample sizes.
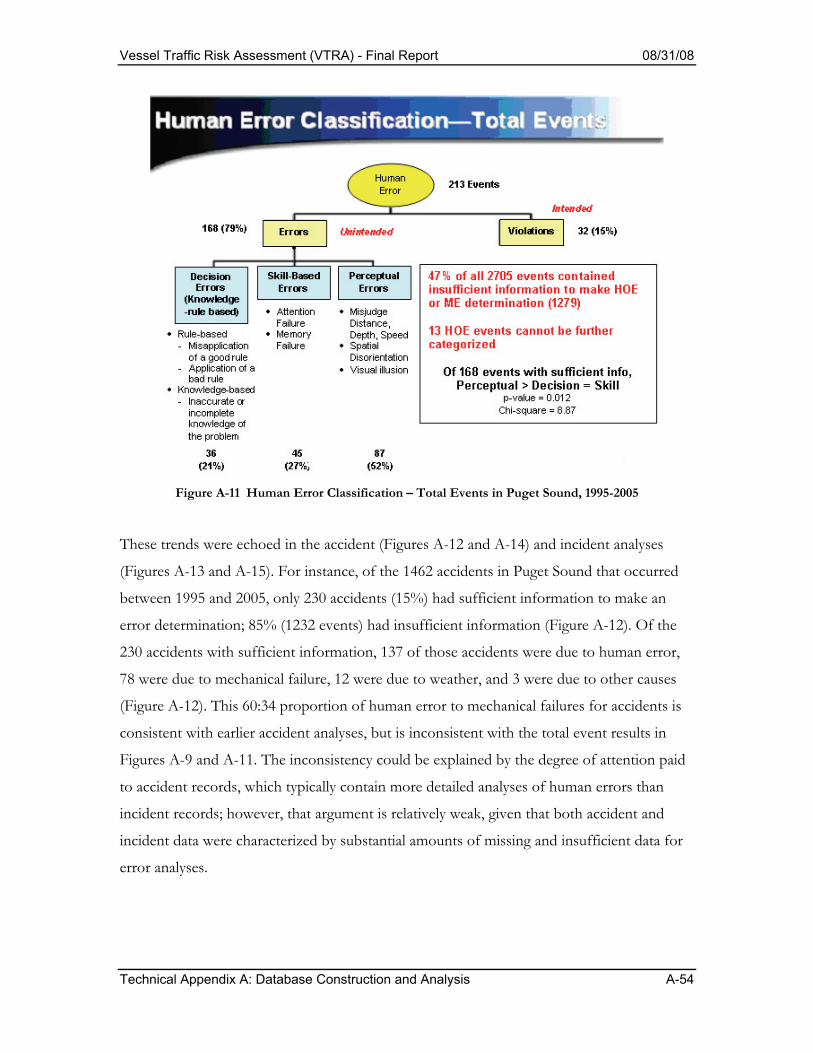
Vessel Traffic Risk Assessment (VTRA) - Final Report 08/31/08
Technical Appendix A: Database Construction and Analysis A-54
Figure A-11 Human Error Classification – Total Events in Puget Sound, 1995-2005
These trends were echoed in the accident (Figures A-12 and A-14) and incident analyses
(Figures A-13 and A-15). For instance, of the 1462 accidents in Puget Sound that occurred
between 1995 and 2005, only 230 accidents (15%) had sufficient information to make an
error determination; 85% (1232 events) had insufficient information (Figure A-12). Of the
230 accidents with sufficient information, 137 of those accidents were due to human error,
78 were due to mechanical failure, 12 were due to weather, and 3 were due to other causes
(Figure A-12). This 60:34 proportion of human error to mechanical failures for accidents is
consistent with earlier accident analyses, but is inconsistent with the total event results in
Figures A-9 and A-11. The inconsistency could be explained by the degree of attention paid
to accident records, which typically contain more detailed analyses of human errors than
incident records; however, that argument is relatively weak, given that both accident and
incident data were characterized by substantial amounts of missing and insufficient data for
error analyses.
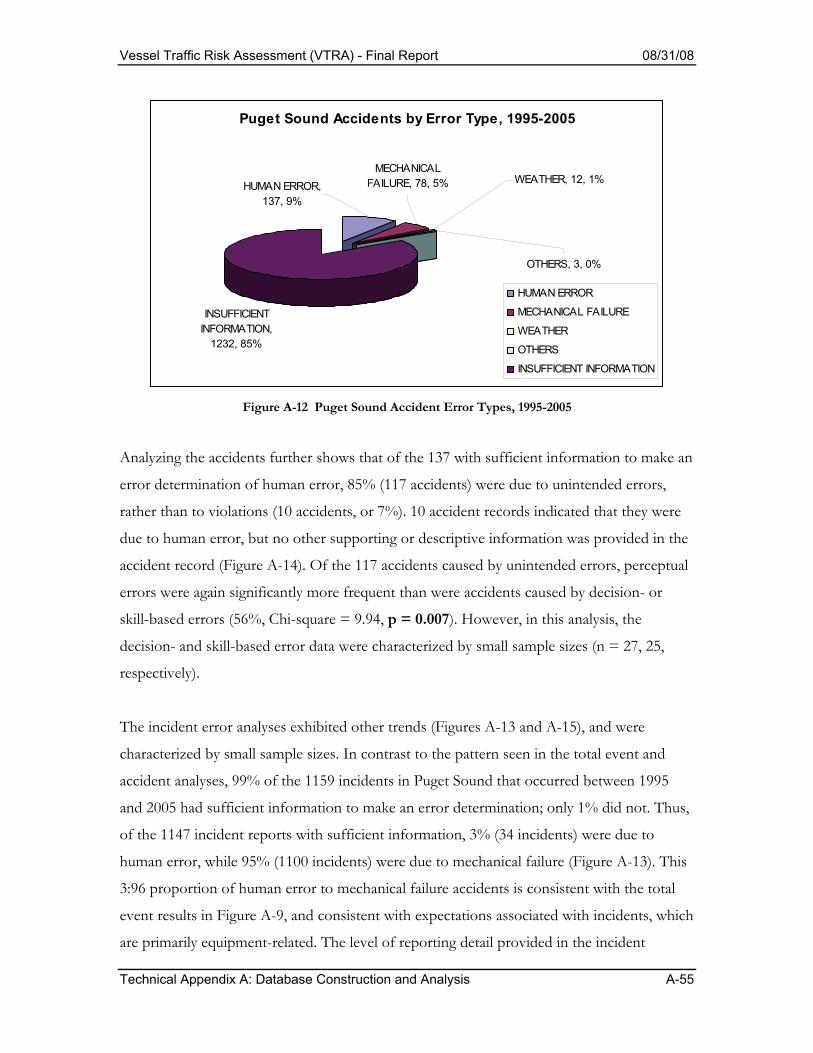
Vessel Traffic Risk Assessment (VTRA) - Final Report 08/31/08
Technical Appendix A: Database Construction and Analysis A-55
Puget Sound Accidents by Error Type, 1995-2005
INSUFFICIENT INFORMATION,
1232, 85%
WEATHER, 12, 1%
OTHERS, 3, 0%
MECHANICAL FAILURE, 78, 5%HUMAN ERROR,
137, 9%
HUMAN ERROR
MECHANICAL FAILURE
WEATHER
OTHERS
INSUFFICIENT INFORMATION
Figure A-12 Puget Sound Accident Error Types, 1995-2005
Analyzing the accidents further shows that of the 137 with sufficient information to make an
error determination of human error, 85% (117 accidents) were due to unintended errors,
rather than to violations (10 accidents, or 7%). 10 accident records indicated that they were
due to human error, but no other supporting or descriptive information was provided in the
accident record (Figure A-14). Of the 117 accidents caused by unintended errors, perceptual
errors were again significantly more frequent than were accidents caused by decision- or
skill-based errors (56%, Chi-square = 9.94, p = 0.007). However, in this analysis, the
decision- and skill-based error data were characterized by small sample sizes (n = 27, 25,
respectively).
The incident error analyses exhibited other trends (Figures A-13 and A-15), and were
characterized by small sample sizes. In contrast to the pattern seen in the total event and
accident analyses, 99% of the 1159 incidents in Puget Sound that occurred between 1995
and 2005 had sufficient information to make an error determination; only 1% did not. Thus,
of the 1147 incident reports with sufficient information, 3% (34 incidents) were due to
human error, while 95% (1100 incidents) were due to mechanical failure (Figure A-13). This
3:96 proportion of human error to mechanical failure accidents is consistent with the total
event results in Figure A-9, and consistent with expectations associated with incidents, which
are primarily equipment-related. The level of reporting detail provided in the incident
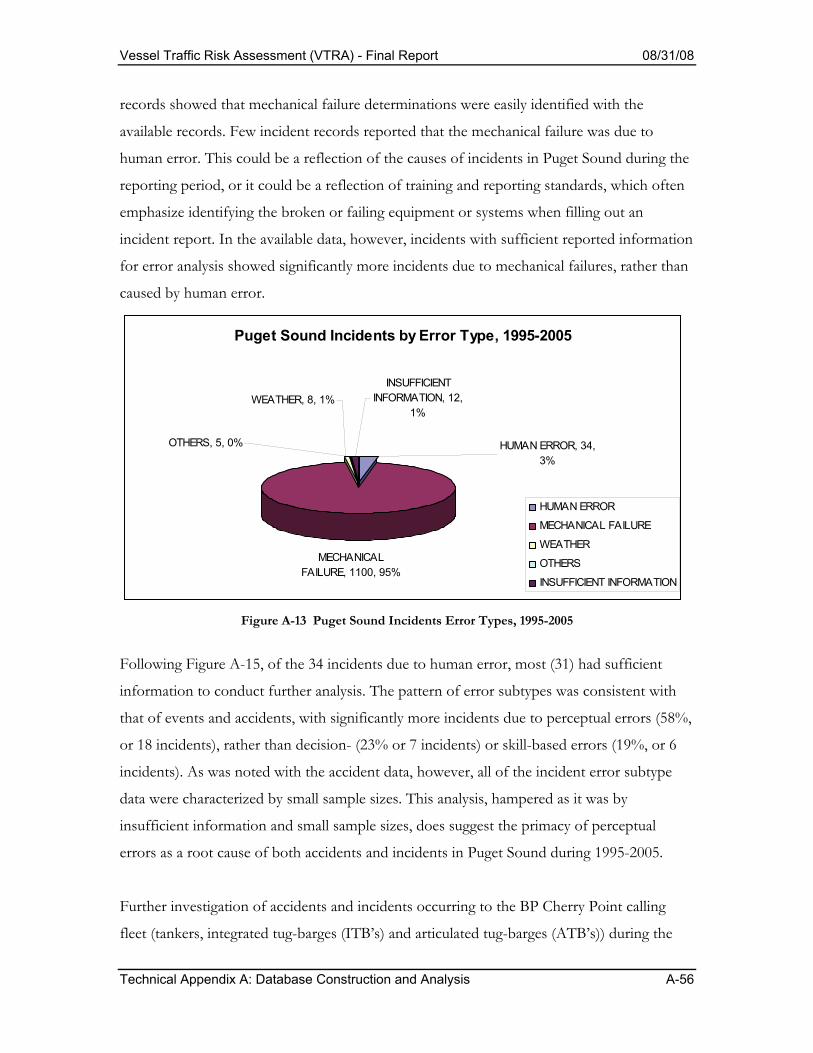
Vessel Traffic Risk Assessment (VTRA) - Final Report 08/31/08
Technical Appendix A: Database Construction and Analysis A-56
records showed that mechanical failure determinations were easily identified with the
available records. Few incident records reported that the mechanical failure was due to
human error. This could be a reflection of the causes of incidents in Puget Sound during the
reporting period, or it could be a reflection of training and reporting standards, which often
emphasize identifying the broken or failing equipment or systems when filling out an
incident report. In the available data, however, incidents with sufficient reported information
for error analysis showed significantly more incidents due to mechanical failures, rather than
caused by human error.
Puget Sound Incidents by Error Type, 1995-2005
WEATHER, 8, 1%
OTHERS, 5, 0% HUMAN ERROR, 34, 3%
MECHANICAL FAILURE, 1100, 95%
INSUFFICIENT INFORMATION, 12,
1%
HUMAN ERROR
MECHANICAL FAILURE
WEATHER
OTHERS
INSUFFICIENT INFORMATION
Figure A-13 Puget Sound Incidents Error Types, 1995-2005
Following Figure A-15, of the 34 incidents due to human error, most (31) had sufficient
information to conduct further analysis. The pattern of error subtypes was consistent with
that of events and accidents, with significantly more incidents due to perceptual errors (58%,
or 18 incidents), rather than decision- (23% or 7 incidents) or skill-based errors (19%, or 6
incidents). As was noted with the accident data, however, all of the incident error subtype
data were characterized by small sample sizes. This analysis, hampered as it was by
insufficient information and small sample sizes, does suggest the primacy of perceptual
errors as a root cause of both accidents and incidents in Puget Sound during 1995-2005.
Further investigation of accidents and incidents occurring to the BP Cherry Point calling
fleet (tankers, integrated tug-barges (ITB’s) and articulated tug-barges (ATB’s)) during the
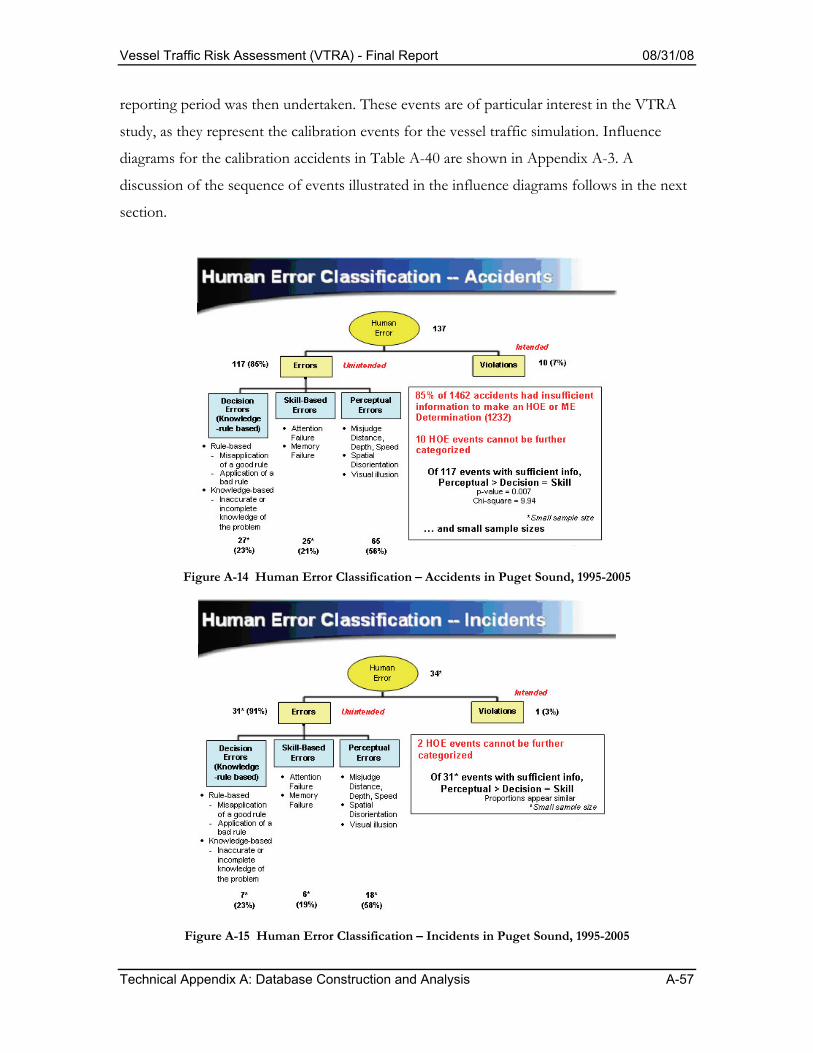
Vessel Traffic Risk Assessment (VTRA) - Final Report 08/31/08
Technical Appendix A: Database Construction and Analysis A-57
reporting period was then undertaken. These events are of particular interest in the VTRA
study, as they represent the calibration events for the vessel traffic simulation. Influence
diagrams for the calibration accidents in Table A-40 are shown in Appendix A-3. A
discussion of the sequence of events illustrated in the influence diagrams follows in the next
section.
Figure A-14 Human Error Classification – Accidents in Puget Sound, 1995-2005
Figure A-15 Human Error Classification – Incidents in Puget Sound, 1995-2005

Vessel Traffic Risk Assessment (VTRA) - Final Report 08/31/08
Technical Appendix A: Database Construction and Analysis A-58
Error Analysis – BP Cherry Point Calling Fleet Accidents and Incidents In order to calibrate the vessel traffic simulation, accidents and incidents occurring to
tankers, ITB’s and ATB’s calling on BP Cherry Point between 1995-2005 were identified
(Tables A-40, A-41). Calibration events for the simulation were a subset of events captured
in the database—collisions, allisions and groundings. Pollution events, structural failures,
capsizing, and fire and explosion accidents were not included in the calibration events or in
the error analysis. Similarly, calibration incidents for the simulation included propulsion
failures, steering failures and navigational equipment failures; other types of failures, and/or
unusual events were not included in the calibration events or in the error analysis.
Table A-40 Calibration Accidents for Puget Sound Tankers, ITB’s/ATB’s, 1995-2005
Event Date
Event Time
Vessel Type
Vessel Name
Event Type
Event Type Description
Event Summary
24 Jan 1998 Null Tanker Overseas Arctic
Accident Allision Docking US Oil, hit piling bracket
14 Dec 2001 0900 Tanker Leyte Spirit Accident Allision Heavy weather, getting off dock at Ferndale; hit dock, scrape
19 Jan 2002 2140 Tanker Allegiance Accident Collision 5 Dec 1999 2035 ITB ITB New
York Accident Grounding 55 knot wind, anchor drag off
March Point, pilot aboard Anacortes, Garth Foss respond
Table A-41 Calibration Incidents for Puget Sound Tankers, ITB’s/ATB’s, 1995-2005
Event Date Event Time
Event Year
Vessel Type
Vessel Name Event Type
Event Type Description
17 Mar 2002 2002 Tanker Allegiance Incident Propulsion failure 13 Oct 1999 1999 Tanker Angelo D’Amato Incident Propulsion failure 13 Dec 1999 1999 Tanker Antiparos Incident Propulsion failure 25 Sept 2001 2001 Tanker British Hawk Incident Propulsion failure 20 April 97 1997 Tanker Chevron Mississippi Incident Propulsion failure 29 Dec 2000 2000 Tanker Chevron Mississippi Incident Propulsion failure 17 Oct 2001 2001 Tanker Great Promise Incident Propulsion failure 18 Oct 2001 2001 Tanker Great Promise Incident Propulsion failure 18 July 2004 2004 Tanker Gulf Scandic Incident Propulsion failure 12 Nov 2004 0010 2004 Tanker Gulf Scandic/British Harrier Incident Propulsion failure 21 Jan 2001 2001 Tanker HMI Brenton Reef Incident Propulsion failure 30 April 01 2001 Tanker JoBrevik Incident Propulsion failure 11 July 1996 1996 Tanker Kenai Incident Propulsion failure 13 Sept 1995 1995 Tanker Overseas Alaska Incident Propulsion failure 24 Dec 1995 1995 Tanker Overseas Boston Incident Propulsion failure 9 June 1996 1996 Tanker Overseas Boston Incident Propulsion failure 8 July 1997 1997 Tanker Overseas Boston Incident Propulsion failure 10 Nov 2005 2005 Tanker Overseas Puget Sound Incident Propulsion failure 1 Feb 2001 2001 Tanker Overseas Washington Incident Propulsion failure 12 Dec 2001 2001 Tanker Overseas Washington Incident Propulsion failure 28 April 02 2002 Tanker Pacific Sound Incident Propulsion failure 25 Dec 1995 1995 Tanker Paul Buck Incident Propulsion failure 15 April 02 2002 Tanker Polar Endeavor Incident Propulsion failure 7 Sept 2002 2002 Tanker Polar Endeavor Incident Propulsion failure 7 May 2002 2002 Tanker Polar Trader Incident Propulsion failure
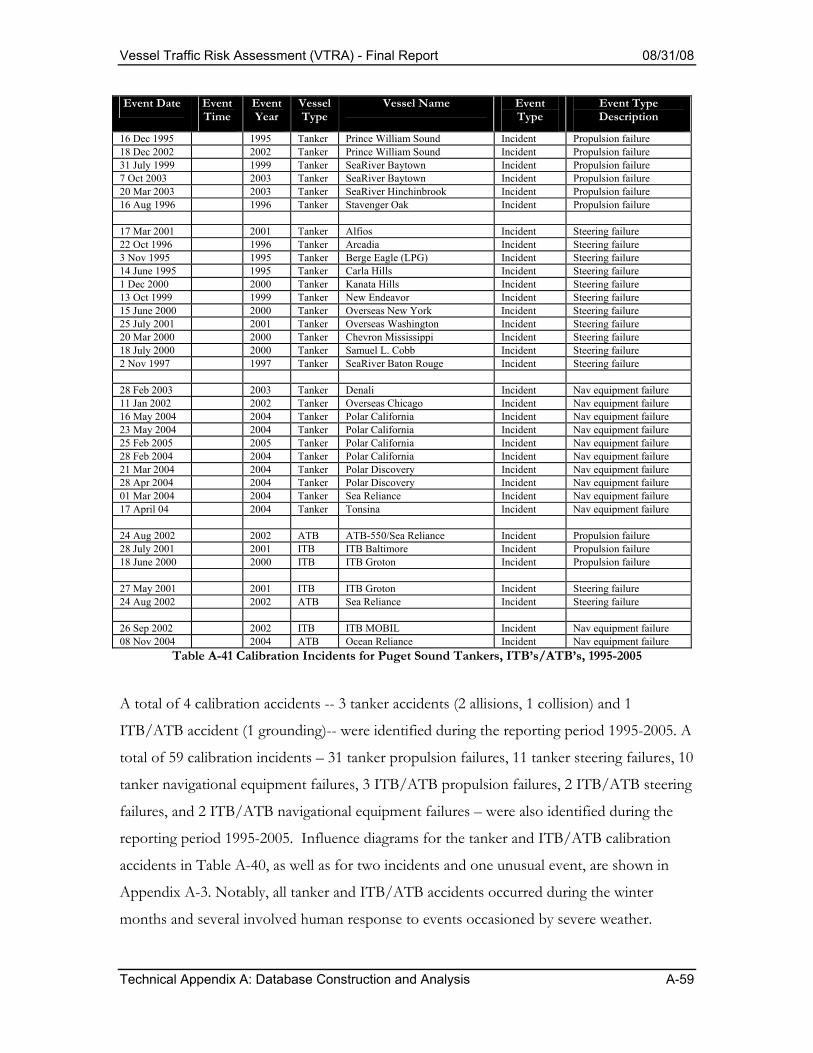
Vessel Traffic Risk Assessment (VTRA) - Final Report 08/31/08
Technical Appendix A: Database Construction and Analysis A-59
Event Date Event Time
Event Year
Vessel Type
Vessel Name Event Type
Event Type Description
16 Dec 1995 1995 Tanker Prince William Sound Incident Propulsion failure 18 Dec 2002 2002 Tanker Prince William Sound Incident Propulsion failure 31 July 1999 1999 Tanker SeaRiver Baytown Incident Propulsion failure 7 Oct 2003 2003 Tanker SeaRiver Baytown Incident Propulsion failure 20 Mar 2003 2003 Tanker SeaRiver Hinchinbrook Incident Propulsion failure 16 Aug 1996 1996 Tanker Stavenger Oak Incident Propulsion failure 17 Mar 2001 2001 Tanker Alfios Incident Steering failure 22 Oct 1996 1996 Tanker Arcadia Incident Steering failure 3 Nov 1995 1995 Tanker Berge Eagle (LPG) Incident Steering failure 14 June 1995 1995 Tanker Carla Hills Incident Steering failure 1 Dec 2000 2000 Tanker Kanata Hills Incident Steering failure 13 Oct 1999 1999 Tanker New Endeavor Incident Steering failure 15 June 2000 2000 Tanker Overseas New York Incident Steering failure 25 July 2001 2001 Tanker Overseas Washington Incident Steering failure 20 Mar 2000 2000 Tanker Chevron Mississippi Incident Steering failure 18 July 2000 2000 Tanker Samuel L. Cobb Incident Steering failure 2 Nov 1997 1997 Tanker SeaRiver Baton Rouge Incident Steering failure 28 Feb 2003 2003 Tanker Denali Incident Nav equipment failure 11 Jan 2002 2002 Tanker Overseas Chicago Incident Nav equipment failure 16 May 2004 2004 Tanker Polar California Incident Nav equipment failure 23 May 2004 2004 Tanker Polar California Incident Nav equipment failure 25 Feb 2005 2005 Tanker Polar California Incident Nav equipment failure 28 Feb 2004 2004 Tanker Polar California Incident Nav equipment failure 21 Mar 2004 2004 Tanker Polar Discovery Incident Nav equipment failure 28 Apr 2004 2004 Tanker Polar Discovery Incident Nav equipment failure 01 Mar 2004 2004 Tanker Sea Reliance Incident Nav equipment failure 17 April 04 2004 Tanker Tonsina Incident Nav equipment failure 24 Aug 2002 2002 ATB ATB-550/Sea Reliance Incident Propulsion failure 28 July 2001 2001 ITB ITB Baltimore Incident Propulsion failure 18 June 2000 2000 ITB ITB Groton Incident Propulsion failure 27 May 2001 2001 ITB ITB Groton Incident Steering failure 24 Aug 2002 2002 ATB Sea Reliance Incident Steering failure 26 Sep 2002 2002 ITB ITB MOBIL Incident Nav equipment failure 08 Nov 2004 2004 ATB Ocean Reliance Incident Nav equipment failure
Table A-41 Calibration Incidents for Puget Sound Tankers, ITB’s/ATB’s, 1995-2005
A total of 4 calibration accidents -- 3 tanker accidents (2 allisions, 1 collision) and 1
ITB/ATB accident (1 grounding)-- were identified during the reporting period 1995-2005. A
total of 59 calibration incidents – 31 tanker propulsion failures, 11 tanker steering failures, 10
tanker navigational equipment failures, 3 ITB/ATB propulsion failures, 2 ITB/ATB steering
failures, and 2 ITB/ATB navigational equipment failures – were also identified during the
reporting period 1995-2005. Influence diagrams for the tanker and ITB/ATB calibration
accidents in Table A-40, as well as for two incidents and one unusual event, are shown in
Appendix A-3. Notably, all tanker and ITB/ATB accidents occurred during the winter
months and several involved human response to events occasioned by severe weather.

Vessel Traffic Risk Assessment (VTRA) - Final Report 08/31/08
Technical Appendix A: Database Construction and Analysis A-60
Substantial information was available for two calibration events—the collision between the
612’ single hull inbound tanker Allegiance and the escort tug Sea King on 19 January 2002 and
the grounding of the ITB New York after she dragged anchor at March Point on 5 December
1999. Coast Guard 2692 and MISLE records, as well as Washington State Department of
Ecology and VTS Puget Sound incident records, were available for these events, as were
court documents from resulting litigation, articles from local newspapers, and reports from
Lloyd’s Casualty Reporting.
As can be seen in the Appendix A-3 influence diagram, the Allegiance – Sea King collision
event was characterized by communication, perception and medical history problems during
the inbound night transit to Tesoro. In subsequent litigation, the Allegiance was found not to
have provided adequate lookout and the Sea King tug was found to have lost situational
awareness. No pilot error was noted during the event. As a result of the collision, the tug Sea
King sustained significant structural damage and two crew members were injured; the vessel
was dewatered, the tug captain surrendered his license on medical grounds, and significant
economic losses were sustained.
The ITB New York grounding illustrates how situations such as a dragging anchor can
compound quickly for a light single hull ITB at anchor in winds of 40-55 knots. Timely
assistance was rendered by three nearby assist tugs that ultimately pulled the vessel afloat.
The vessel was in communication with the VTS, who provided assistance positioning and
repositioning the vessel. Vessel damage was negligible in this event, or no personnel
casualties were noted.
In both of these accidents, situational awareness played a significant role in determining the
course and outcome of the event. In one case, lack of situational awareness led to an adverse
outcome with personnel injuries, substantial economic losses and vessel structural damage;
in the other case, situational awareness enhanced by additional resources on assist vessels
and the VTS resulted in mitigated economic, personnel and structural consequences.
The allision of the double hull Bahamian Teekay Shipping tanker Leyte Spirit at the Philips
Petroleum dock in Ferndale on the morning of 14 December 2001 shows a pattern similar to
Vessel Traffic Risk Assessment (VTRA) - Final Report 08/31/08
Technical Appendix A: Database Construction and Analysis A-61
the ITB New York grounding: assist tug and pilot resources were available to the vessel,
which was attempting to leave the Ferndale dock with winds gusting from 40-50 knots. The
allision occurred when the pilot tried to get the vessel off the dock. In the first attempt to
leave the dock, a line from the Leyte Spirit to the tug Sea King parted, and the vessel allided
with the dock. In the second attempt, the Leyte Spirit was able to get away from the berth
with no further damage to the vessel or the dock. Sufficient information was available about
the allision, as the event was captured in Coast Guard 2692 and MISLE reports, as well as
Washington State Department of Ecology and Puget Sound Pilot incident reports. In this
event, as with the ITB New York grounding, the mitigated outcome occasioned by severe
weather was influenced by the human and mechanical response resources available (pilots,
assist tugs).
Unfortunately, there was less information available for the remaining calibration events. As
can be seen in Appendix A-3, there was little information in the Coast Guard MISLE and
Puget Sound Pilot Commission records to provide description of the events associated with
the allision of the single hull tanker Overseas Arctic when she was docking at U.S. Oil in
Tacoma on 24 January 1998. Similarly, the influence diagram for the tanker Overseas Boston
pollution event on 13 January 2002 at the Tosco pier in Ferndale shows that the lack of
available information extends to pollution events, although, in general, records are more
complete for pollution events than for some allisions, propulsion failures, steering failures or
navigational equipment failures.
The influence diagram for the inbound double hull tanker Gulf Scandic’s propulsion failure
on the night of 12 November 2004 shows that even when event records include data from
the Coast Guard 2692 and MISLE files, as well as from the Washington State Department of
Ecology, there may be little available information with which to undertake an error analysis.
More information was available for the unusual event that occurred on 11 February 2002, to
the double bottom tanker Blue Ridge, which was underway from Port Angeles and heaving up
anchor when the propeller became fouled, resulting in substantial propeller and tanker
damage.
Vessel Traffic Risk Assessment (VTRA) - Final Report 08/31/08
Technical Appendix A: Database Construction and Analysis A-62
In short, the influence diagram analysis echoes the descriptive statistic analysis presented in
Figures A-11 – A-15, which showed substantial missing and incomplete information with
respect to human and organizational error analyses, even when multiple sources were used to
corroborate and analyze the event. This is a recurring problem in maritime accident and
incident analyses and suggests the need for greater attention to standardized data capture,
collection, sharing and analysis across organizations with interest in improved maritime
safety.
Summary of Significant Event Results, 1995-2005 A summary of significant total event frequencies in the Puget Sound VTRA Accident-
Incident database is given in Table A-42, which shows that there are significant differences
in the normalized total events by vessel type. For normalized total events, 1995-2005, cargo
and tanker ships had a statistically higher frequency of events than did tug-barges and
Washington State Ferries (WSF). Normalizing the data by transits altered the results of the
events by vessel type analysis so as to reflect the surrogate exposure risk suggested by the
vessel type’s number of transits.
Analysis of events by year showed that 1995 and 1997-2002 had a higher event frequency
than other years. However, after normalization by transit data, slightly different test results
were observed: years 1998-2002 had a statistically higher number of total events than did
other years. Different test results between raw data and normalization data also can be found
in events by season. Tests on raw data by season showed that summer and winter had a
statistically higher number of total events than did autumn and spring. However, when the
data were normalized by transits, autumn and spring had statistically higher numbers of total
events than did winter and summer, in part because of the increase in transits during the
summer and winter seasons.
Analysis of events by location showed that South Puget Sound had the highest number of
events, compared to other locations. One of the important reasons may be that more transits
occurred in South Puget Sound than other locations because of the numerous ferry runs.
Furthermore, inbound vessels had a statistically higher number of events than did outbound
vessels. More transits for inbound vessels in Puget Sound can account for this result. Also,
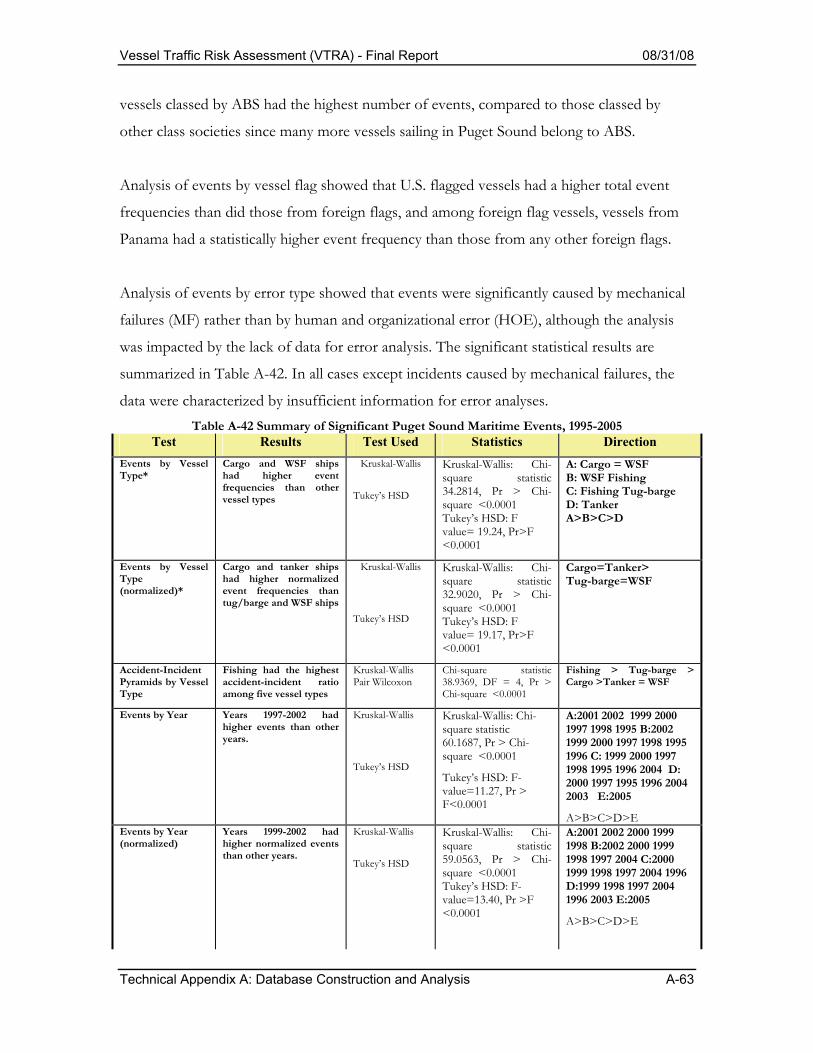
Vessel Traffic Risk Assessment (VTRA) - Final Report 08/31/08
Technical Appendix A: Database Construction and Analysis A-63
vessels classed by ABS had the highest number of events, compared to those classed by
other class societies since many more vessels sailing in Puget Sound belong to ABS.
Analysis of events by vessel flag showed that U.S. flagged vessels had a higher total event
frequencies than did those from foreign flags, and among foreign flag vessels, vessels from
Panama had a statistically higher event frequency than those from any other foreign flags.
Analysis of events by error type showed that events were significantly caused by mechanical
failures (MF) rather than by human and organizational error (HOE), although the analysis
was impacted by the lack of data for error analysis. The significant statistical results are
summarized in Table A-42. In all cases except incidents caused by mechanical failures, the
data were characterized by insufficient information for error analyses. Table A-42 Summary of Significant Puget Sound Maritime Events, 1995-2005
Test Results Test Used Statistics Direction Events by Vessel Type*
Cargo and WSF ships had higher event frequencies than other vessel types
Kruskal-Wallis
Tukey’s HSD
Kruskal-Wallis: Chi-square statistic 34.2814, Pr > Chi-square <0.0001 Tukey’s HSD: F value= 19.24, Pr>F <0.0001
A: Cargo = WSF B: WSF Fishing C: Fishing Tug-barge D: Tanker A>B>C>D
Events by Vessel Type (normalized)*
Cargo and tanker ships had higher normalized event frequencies than tug/barge and WSF ships
Kruskal-Wallis
Tukey’s HSD
Kruskal-Wallis: Chi-square statistic 32.9020, Pr > Chi-square <0.0001 Tukey’s HSD: F value= 19.17, Pr>F <0.0001
Cargo=Tanker> Tug-barge=WSF
Accident-Incident Pyramids by Vessel Type
Fishing had the highest accident-incident ratio among five vessel types
Kruskal-Wallis Pair Wilcoxon
Chi-square statistic 38.9369, DF = 4, Pr > Chi-square <0.0001
Fishing > Tug-barge > Cargo >Tanker = WSF
Events by Year Years 1997-2002 had higher events than other years.
Kruskal-Wallis
Tukey’s HSD
Kruskal-Wallis: Chi-square statistic 60.1687, Pr > Chi-square <0.0001
Tukey’s HSD: F-value=11.27, Pr > F<0.0001
A:2001 2002 1999 2000 1997 1998 1995 B:2002 1999 2000 1997 1998 1995 1996 C: 1999 2000 1997 1998 1995 1996 2004 D: 2000 1997 1995 1996 2004 2003 E:2005
A>B>C>D>E Events by Year (normalized)
Years 1999-2002 had higher normalized events than other years.
Kruskal-Wallis
Tukey’s HSD
Kruskal-Wallis: Chi-square statistic 59.0563, Pr > Chi-square <0.0001 Tukey’s HSD: F-value=13.40, Pr >F <0.0001
A:2001 2002 2000 1999 1998 B:2002 2000 1999 1998 1997 2004 C:2000 1999 1998 1997 2004 1996 D:1999 1998 1997 2004 1996 2003 E:2005
A>B>C>D>E
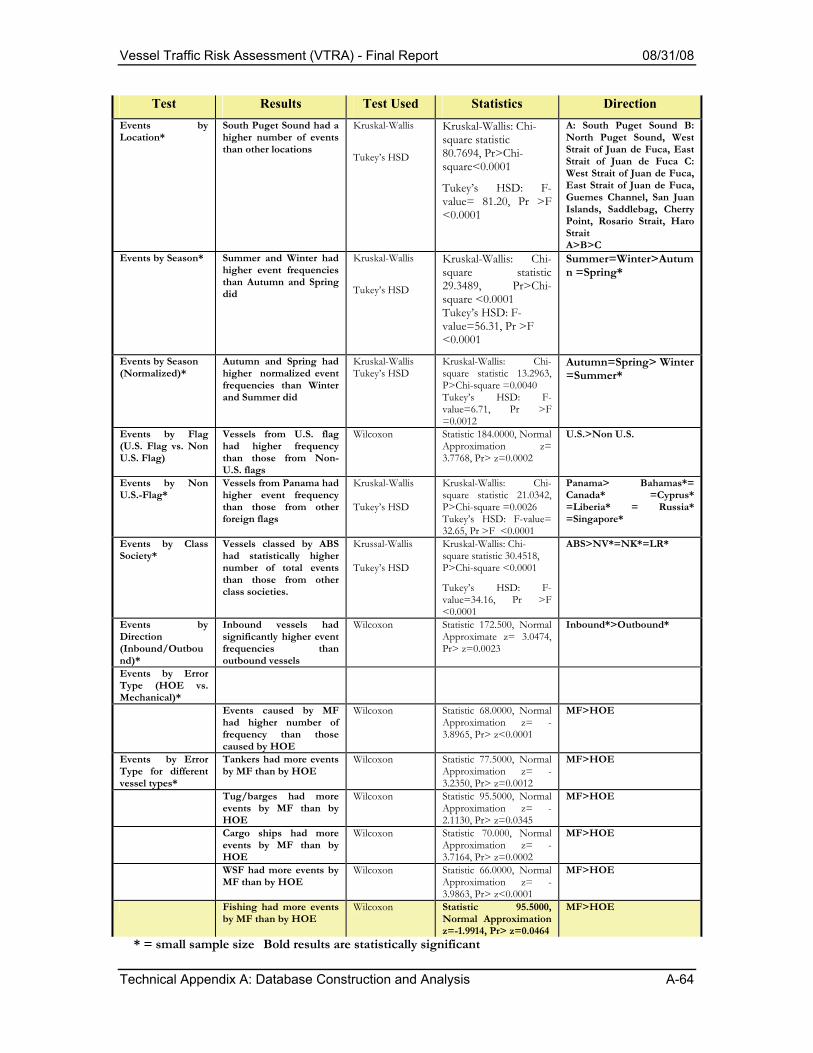
Vessel Traffic Risk Assessment (VTRA) - Final Report 08/31/08
Technical Appendix A: Database Construction and Analysis A-64
Test Results Test Used Statistics Direction Events by Location*
South Puget Sound had a higher number of events than other locations
Kruskal-Wallis
Tukey’s HSD
Kruskal-Wallis: Chi-square statistic 80.7694, Pr>Chi-square<0.0001
Tukey’s HSD: F-value= 81.20, Pr >F <0.0001
A: South Puget Sound B: North Puget Sound, West Strait of Juan de Fuca, East Strait of Juan de Fuca C: West Strait of Juan de Fuca, East Strait of Juan de Fuca, Guemes Channel, San Juan Islands, Saddlebag, Cherry Point, Rosario Strait, Haro Strait A>B>C
Events by Season* Summer and Winter had higher event frequencies than Autumn and Spring did
Kruskal-Wallis
Tukey’s HSD
Kruskal-Wallis: Chi-square statistic 29.3489, Pr>Chi-square <0.0001 Tukey’s HSD: F-value=56.31, Pr >F <0.0001
Summer=Winter>Autumn =Spring*
Events by Season (Normalized)*
Autumn and Spring had higher normalized event frequencies than Winter and Summer did
Kruskal-Wallis Tukey’s HSD
Kruskal-Wallis: Chi-square statistic 13.2963, P>Chi-square =0.0040 Tukey’s HSD: F-value=6.71, Pr >F =0.0012
Autumn=Spring> Winter =Summer*
Events by Flag (U.S. Flag vs. Non U.S. Flag)
Vessels from U.S. flag had higher frequency than those from Non-U.S. flags
Wilcoxon Statistic 184.0000, Normal Approximation z= 3.7768, Pr> z=0.0002
U.S.>Non U.S.
Events by Non U.S.-Flag*
Vessels from Panama had higher event frequency than those from other foreign flags
Kruskal-Wallis Tukey’s HSD
Kruskal-Wallis: Chi-square statistic 21.0342, P>Chi-square =0.0026 Tukey’s HSD: F-value= 32.65, Pr >F <0.0001
Panama> Bahamas*= Canada* =Cyprus* =Liberia* = Russia* =Singapore*
Events by Class Society*
Vessels classed by ABS had statistically higher number of total events than those from other class societies.
Krussal-Wallis Tukey’s HSD
Kruskal-Wallis: Chi-square statistic 30.4518, P>Chi-square <0.0001
Tukey’s HSD: F-value=34.16, Pr >F <0.0001
ABS>NV*=NK*=LR*
Events by Direction (Inbound/Outbound)*
Inbound vessels had significantly higher event frequencies than outbound vessels
Wilcoxon Statistic 172.500, Normal Approximate z= 3.0474, Pr> z=0.0023
Inbound*>Outbound*
Events by Error Type (HOE vs. Mechanical)*
Events caused by MF had higher number of frequency than those caused by HOE
Wilcoxon Statistic 68.0000, Normal Approximation z= -3.8965, Pr> z<0.0001
MF>HOE
Events by Error Type for different vessel types*
Tankers had more events by MF than by HOE
Wilcoxon Statistic 77.5000, Normal Approximation z= -3.2350, Pr> z=0.0012
MF>HOE
Tug/barges had more events by MF than by HOE
Wilcoxon Statistic 95.5000, Normal Approximation z= -2.1130, Pr> z=0.0345
MF>HOE
Cargo ships had more events by MF than by HOE
Wilcoxon Statistic 70.000, Normal Approximation z= -3.7164, Pr> z=0.0002
MF>HOE
WSF had more events by MF than by HOE
Wilcoxon Statistic 66.0000, Normal Approximation z= -3.9863, Pr> z<0.0001
MF>HOE
Fishing had more events by MF than by HOE
Wilcoxon Statistic 95.5000, Normal Approximation z=-1.9914, Pr> z=0.0464
MF>HOE
* = small sample size Bold results are statistically significant

Vessel Traffic Risk Assessment (VTRA) - Final Report 08/31/08
Technical Appendix A: Database Construction and Analysis A-65
Accidents in Puget Sound, 1995-2005 A summary of significant accident results from the Puget Sound VTRA Accident-Incident
database is given in Table A-43, which shows that the number of accidents gradually
increased in Puget Sound between 1996 and 2002; in 2002, accidents began to decline.
Explanations for why this decline might be related to reporting and organizational changes,
rather than trends in accident frequency.
Accident frequencies between 1995 and 2005 were assessed using the Kruskal-Wallis and
Tukey’s HSD tests which found that 1995 and 1997-2004 showed significant differences in
terms of the numbers of accidents which occurred. These differences were significant at the
95% confidence interval. Normalized accident frequencies showed similar patterns, with the
years 1997-2002 and 2004 significantly different than the remainder of the years; these
results were significant at the 95% confidence interval.
Analysis of accidents by season showed that summer and winter had a higher number of
accidents than spring and autumn. However, after data normalization, no statistical
difference was found among the four seasons since more transits occurred during summer
and winter seasons. This trend was different than the observed event frequency in Puget
Sound, 1995-2005, which saw more normalized events in spring and autumn.
Analysis of accidents by vessel type showed that cargo ships and fishing vessels had the
highest accident frequencies among the five vessel types; when the results were normalized,
only cargo vessels had the highest accident frequency among the five vessel types. Analysis
of accidents by location showed that South Puget Sound had a higher number of accidents
than other locations in Puget Sound, most likely because more transits occurred in South
Puget Sound than other areas.
Analysis of accidents by vessel flag showed that there were a statistically higher number of
accidents occurring to U.S. flag vessels, compared to foreign flag vessels. Among the foreign
flag vessels, those from Panama, Canada and Russia had a higher accident frequency than
any other foreign flag vessels. Accident data by vessel owner and class society was tested,
which showed that Foss, Crowley, U.S. Navy, U.S. Coast Guard, and Olympic Tug and

Vessel Traffic Risk Assessment (VTRA) - Final Report 08/31/08
Technical Appendix A: Database Construction and Analysis A-66
Barge vessels had the highest accident frequencies and vessels classed by ABS had a
statistically higher number of accidents than did those of other class societies. Neither owner
nor class data were normalized by vessel transits, as that data were not available. Previous
analyses showed significant differences between results with raw and normalized data; those
patterns may have also been observed in the vessel owner and class analysis.
Finally, accidents caused by pollution had a statistically higher frequency than those caused
by Allision, Grounding, Fire, Collision, Sinking, Flooding, Capsize, Breakaway, and Salvage.
Analysis of accidents by error type showed that accidents caused by human error had a
statistically higher number than those caused by mechanical failure.

Vessel Traffic Risk Assessment (VTRA) - Final Report 08/31/08
Technical Appendix A: Database Construction and Analysis A-67
Table A-43 Summary of Significant Statistical Test Results on Puget Sound Accident Frequency, 1995-2005
Test Results Test Used Statistics Direction Accidents by Vessel type*
There were statistical differences in accident frequency among five vessel types
Kruskal-Wallis
Tukey’s HSD
Kruskal-Wallis: Chi-square statistic 39.0843, Pr > Chi-square <0.0001 Tukey’s HSD: F Value =26.82, Pr>F <0.0001
A: Cargo Fishing B: Fishing Tug-Barge C: WSF Tanker* A>B>C
Accidents by Vessel Type (normalized)*
Cargo ships had the highest normalized accident frequency
Kruskal-Wallis
Tukey’s HSD
Kruskal-Wallis: Chi-square statistic 27.3205, Pr > Chi-square <0.0001 Tukey’s HSD: F Value =26.53, Pr>F <0.0001
A: Cargo B: Tanker* Tug-Barge C: Tug-Barge WSF A>B>C
Accidents by Year Year 2005 had significantly lower accidents than other years.
Kruskal-Wallis
Tukey’s HSD
Kruskal-Wallis: Chi-square statistic 51.6289, Pr > Chi-square <0.0001
Tukey’s HSD: F-value=8.88, Pr >F <0.0001
A:2002 1999 2001 2000 1995 1997 1998 2004 2003 B:2000 1995 1997 1998 2004 2003 1996 C: 2005
A>B>C
Accidents by Year (normalized)
Years 1996 and 2005 have lower number of normalized accidents than other years.
Kruskal-Wallis
Tukey’s HSD
Kruskal-Wallis: Chi-square statistic 51.1032, Pr > Chi-square =0.0017
Tukey’s HSD: F-value=9.94, Pr >F <0.0001
A:2002 2001 2000 1999 1998 2004 1997 B: 2001 2000 1999 1998 2004 1997 2003 C: 1998 2004 1997 2003 1996 D: 1996 2005
A>B>C>D
Accidents by Location* South Puget Sound had higher number of accident than other locations
Kruskal-Wallis
Tukey’s HSD
Kruskal-Wallis: Chi-square statistic 79.5272, Pr > Chi-square <0.0001 Tukey’s HSD: F-value =79.24, Pr >F <0.0001
A: South Puget Sound B: North Puget Sound, West Strait of Juan de Fuca, Saddlebag, Cherry Point, East Strait of Juan de Fuca, Guemes Channel C: West Strait of Juan de Fuca, Saddlebag, Cherry Point, East Strait of Juan de Fuca, Guemes Channel, San Juan Islands, Haro Strait A>B>C
Accidents by Season* Summer and Winter had higher accident frequency than Autumn and Spring did
Kruskal-Wallis
Tukey’s HSD
Kruskal-Wallis: Chi-square statistic 29.4899, P>Chi-square <0.0001 Tukey’s HSD: F-value=69.62, Pr >F <0.0001
Summer=Winter > Autumn = Spring*
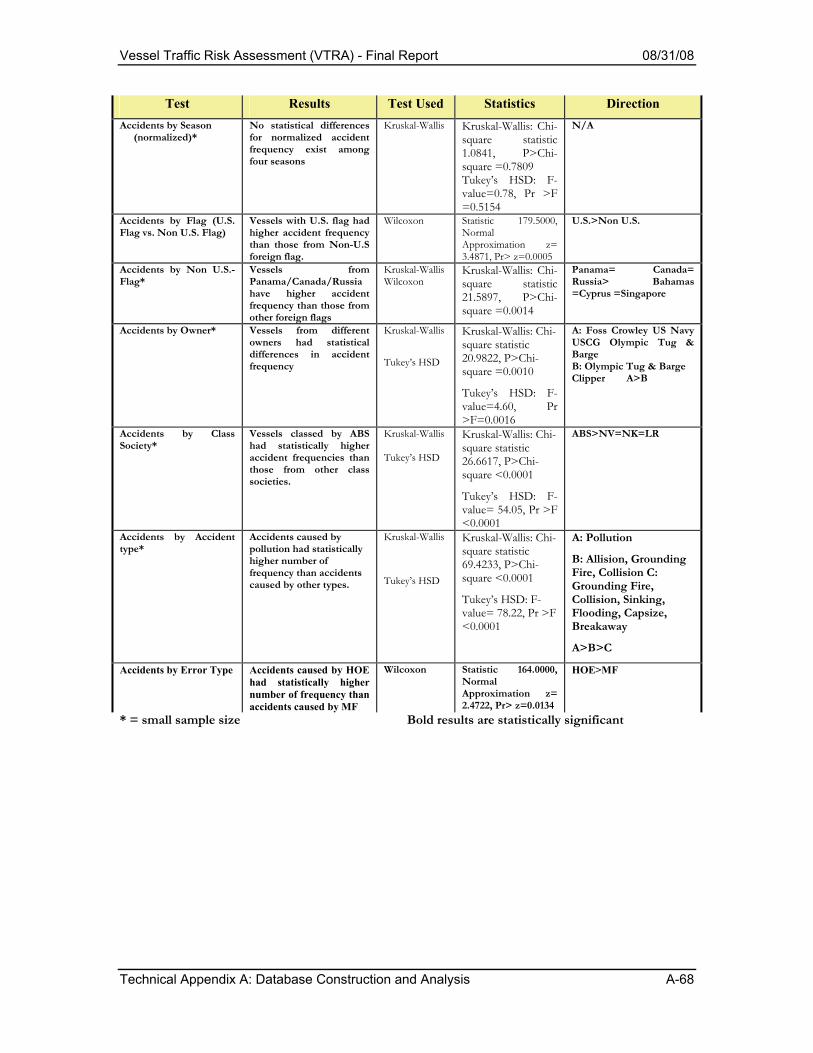
Vessel Traffic Risk Assessment (VTRA) - Final Report 08/31/08
Technical Appendix A: Database Construction and Analysis A-68
Test Results Test Used Statistics Direction Accidents by Season
(normalized)* No statistical differences for normalized accident frequency exist among four seasons
Kruskal-Wallis Kruskal-Wallis: Chi-square statistic 1.0841, P>Chi-square =0.7809 Tukey’s HSD: F-value=0.78, Pr >F =0.5154
N/A
Accidents by Flag (U.S. Flag vs. Non U.S. Flag)
Vessels with U.S. flag had higher accident frequency than those from Non-U.S foreign flag.
Wilcoxon Statistic 179.5000, Normal Approximation z= 3.4871, Pr> z=0.0005
U.S.>Non U.S.
Accidents by Non U.S.-Flag*
Vessels from Panama/Canada/Russia have higher accident frequency than those from other foreign flags
Kruskal-Wallis Wilcoxon
Kruskal-Wallis: Chi-square statistic 21.5897, P>Chi-square =0.0014
Panama= Canada= Russia> Bahamas =Cyprus =Singapore
Accidents by Owner* Vessels from different owners had statistical differences in accident frequency
Kruskal-Wallis
Tukey’s HSD
Kruskal-Wallis: Chi-square statistic 20.9822, P>Chi-square =0.0010
Tukey’s HSD: F-value=4.60, Pr >F=0.0016
A: Foss Crowley US Navy USCG Olympic Tug & Barge B: Olympic Tug & Barge Clipper A>B
Accidents by Class Society*
Vessels classed by ABS had statistically higher accident frequencies than those from other class societies.
Kruskal-Wallis Tukey’s HSD
Kruskal-Wallis: Chi-square statistic 26.6617, P>Chi-square <0.0001
Tukey’s HSD: F-value= 54.05, Pr >F <0.0001
ABS>NV=NK=LR
Accidents by Accident type*
Accidents caused by pollution had statistically higher number of frequency than accidents caused by other types.
Kruskal-Wallis
Tukey’s HSD
Kruskal-Wallis: Chi-square statistic 69.4233, P>Chi-square <0.0001
Tukey’s HSD: F-value= 78.22, Pr >F <0.0001
A: Pollution
B: Allision, Grounding Fire, Collision C: Grounding Fire, Collision, Sinking, Flooding, Capsize, Breakaway
A>B>C
Accidents by Error Type Accidents caused by HOE had statistically higher number of frequency than accidents caused by MF
Wilcoxon Statistic 164.0000, Normal Approximation z= 2.4722, Pr> z=0.0134
HOE>MF
* = small sample size Bold results are statistically significant

Vessel Traffic Risk Assessment (VTRA) - Final Report 08/31/08
Technical Appendix A: Database Construction and Analysis A-69
Incidents in Puget Sound, 1995-2005 Analysis of incidents in Puget Sound between 1995 and 2005 showed that the number of
incidents gradually increased in Puget Sound between 1996 and 2001; in 2002, incidents
began to decline. Explanations for why this decline might be related to reporting and
organizational changes, rather than trends in incident frequency, have already been
presented.
Incident frequencies between 1995 and 2005 were assessed using the Kruskal-Wallis and
Tukey’s HSD tests, which found that years from 1996 to 2002 showed significant differences
in terms of the numbers of incidents which occurred, compared to the other years. These
differences were significant at the 95% confidence interval. Normalized incident frequencies
showed similar patterns, as years 1996 to 2002 still had a higher number of normalized
incidents than other years.
Analysis of raw numbers of incidents by season showed that vessels had a higher number of
incidents in summer and winter than in spring and autumn. However, tests on normalized
incident data showed that spring and autumn had a higher number of incidents than summer
and winter, consistent with trends in the normalized accident data reported in the previous
section.
Analysis of raw numbers of incidents by vessel type showed that WSF had the highest
number of incidents, then cargo ships, and then tankers, tug-barges and fishing vessels.
Normalization of the data showed different results: tankers had higher incident frequencies
than other vessel types, then cargo vessels, then tug-barges and WSF. This is another
example of data with different results using the raw and normalized data.
Analysis of incidents by location showed that South Puget Sound had the highest incident
frequency, compared to other locations, similar to the results seen in the total event and
accident analysis. Vessels had higher incident frequencies during the day than the night, and
U.S. flag vessels had a higher number of incidents than those from foreign flags. Among the
foreign flag vessels, vessels from Panama had the highest number of incidents, compared to
those from other foreign countries. Clipper, Crowley, Foss, U.S. Navy and Olympic Tug &

Vessel Traffic Risk Assessment (VTRA) - Final Report 08/31/08
Technical Appendix A: Database Construction and Analysis A-70
Barge vessels had higher numbers of incidents compared to other vessel owners, and vessels
classed by ABS had a statistically higher incident frequency than those belonging to other
class societies. Neither the owner nor ABS data were normalized by vessel transits, as that
data were not available. Previous analysis showed significant differences between results with
raw and normalized data; those differences might have been observed in the owner and ABS
normalized data analysis, had that data been available. Analysis of incidents by direction
showed that inbound vessels had a higher incident frequency than outbound vessels.
Incidents caused by equipment failure were statistically more frequent than those caused by
loss of propulsion, loss of steering, near miss, structural failure, and loss of power. Analysis
of incidents by error type showed that incidents caused by MF occurred more frequently
than those caused by HOE. The same result was observed for all vessels types.
The summary of significant statistical test results for incidents is shown in Table A-44.
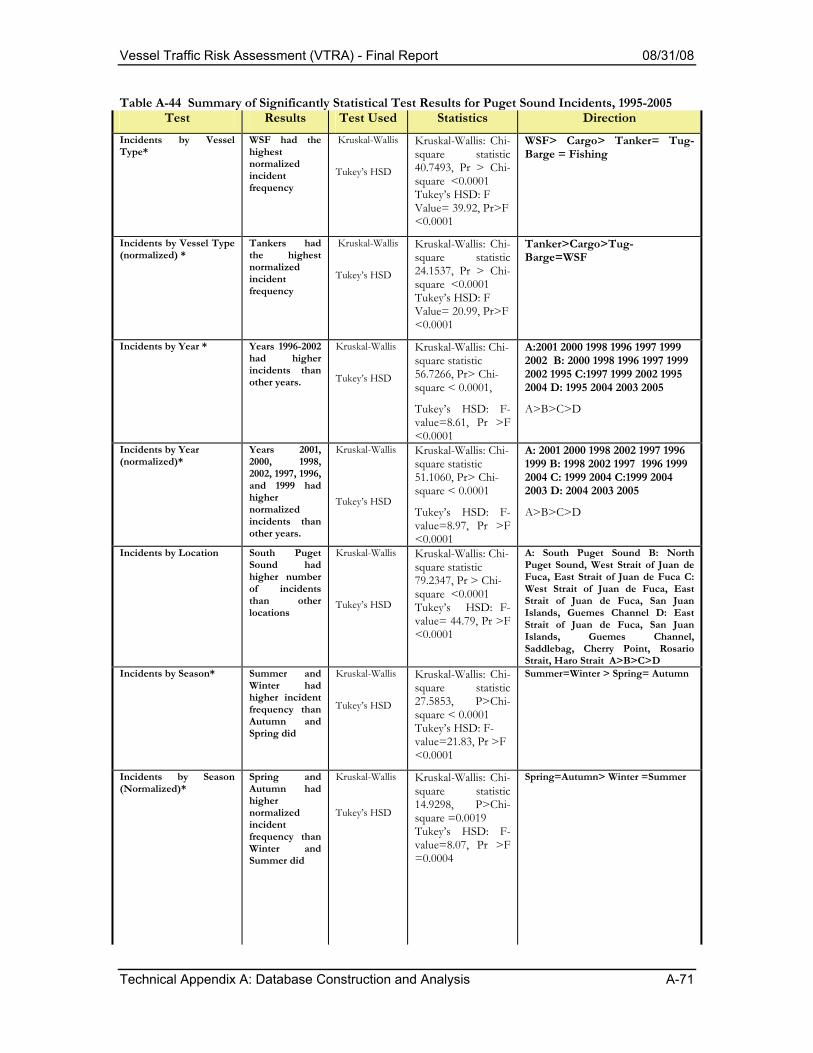
Vessel Traffic Risk Assessment (VTRA) - Final Report 08/31/08
Technical Appendix A: Database Construction and Analysis A-71
Table A-44 Summary of Significantly Statistical Test Results for Puget Sound Incidents, 1995-2005 Test Results Test Used Statistics Direction
Incidents by Vessel Type*
WSF had the highest normalized incident frequency
Kruskal-Wallis
Tukey’s HSD
Kruskal-Wallis: Chi-square statistic 40.7493, Pr > Chi-square <0.0001 Tukey’s HSD: F Value= 39.92, Pr>F <0.0001
WSF> Cargo> Tanker= Tug-Barge = Fishing
Incidents by Vessel Type (normalized) *
Tankers had the highest normalized incident frequency
Kruskal-Wallis
Tukey’s HSD
Kruskal-Wallis: Chi-square statistic 24.1537, Pr > Chi-square <0.0001 Tukey’s HSD: F Value= 20.99, Pr>F <0.0001
Tanker>Cargo>Tug-Barge=WSF
Incidents by Year * Years 1996-2002 had higher incidents than other years.
Kruskal-Wallis
Tukey’s HSD
Kruskal-Wallis: Chi-square statistic 56.7266, Pr> Chi-square < 0.0001,
Tukey’s HSD: F-value=8.61, Pr >F <0.0001
A:2001 2000 1998 1996 1997 1999 2002 B: 2000 1998 1996 1997 1999 2002 1995 C:1997 1999 2002 1995 2004 D: 1995 2004 2003 2005
A>B>C>D
Incidents by Year (normalized)*
Years 2001, 2000, 1998, 2002, 1997, 1996, and 1999 had higher normalized incidents than other years.
Kruskal-Wallis
Tukey’s HSD
Kruskal-Wallis: Chi-square statistic 51.1060, Pr> Chi-square < 0.0001
Tukey’s HSD: F-value=8.97, Pr >F <0.0001
A: 2001 2000 1998 2002 1997 1996 1999 B: 1998 2002 1997 1996 1999 2004 C: 1999 2004 C:1999 2004 2003 D: 2004 2003 2005
A>B>C>D
Incidents by Location South Puget Sound had higher number of incidents than other locations
Kruskal-Wallis
Tukey’s HSD
Kruskal-Wallis: Chi-square statistic 79.2347, Pr > Chi-square <0.0001 Tukey’s HSD: F-value= 44.79, Pr >F <0.0001
A: South Puget Sound B: North Puget Sound, West Strait of Juan de Fuca, East Strait of Juan de Fuca C: West Strait of Juan de Fuca, East Strait of Juan de Fuca, San Juan Islands, Guemes Channel D: East Strait of Juan de Fuca, San Juan Islands, Guemes Channel, Saddlebag, Cherry Point, Rosario Strait, Haro Strait A>B>C>D
Incidents by Season* Summer and Winter had higher incident frequency than Autumn and Spring did
Kruskal-Wallis
Tukey’s HSD
Kruskal-Wallis: Chi-square statistic 27.5853, P>Chi-square < 0.0001 Tukey’s HSD: F-value=21.83, Pr >F <0.0001
Summer=Winter > Spring= Autumn
Incidents by Season (Normalized)*
Spring and Autumn had higher normalized incident frequency than Winter and Summer did
Kruskal-Wallis Tukey’s HSD
Kruskal-Wallis: Chi-square statistic 14.9298, P>Chi-square =0.0019 Tukey’s HSD: F-value=8.07, Pr >F =0.0004
Spring=Autumn> Winter =Summer

Vessel Traffic Risk Assessment (VTRA) - Final Report 08/31/08
Technical Appendix A: Database Construction and Analysis A-72
Test Results Test Used Statistics Direction Incidents by Time of Day*
Incidents occurred more often during day than night
Wilcoxon Statistic 156.500, Normal Approximation z= 1.9739, Pr> z=0.0484
Day>Night
Incidents by Flag (U.S. Flag vs. Non U.S. Flag)
Vessels from U.S. flag had higher incidents frequency than those from Non-U.S. flag
Wilcoxon Statistic 187.0000, Normal Approximation z= 3.9795, Pr> z<0.0001
U.S.>Non U.S.
Incidents by Non U.S.-Flag*
Vessels from Panama had higher incident frequency than those from other foreign flags
Kruskal-Wallis Tukey’s HSD
Kruskal-Wallis: Chi-square statistic 23.0145, P>Chi-square =0.0011 Tukey’s HSD: F-value =17.20, Pr >F <0.0001
Panama> Bahamas= Canada =Cyprus =Liberia = Russia =Singapore
Incidents by Owner* Vessels from different owners had statistical different incident frequency
Kruskal-Wallis
Tukey’s HSD
Kruskal-Wallis: Chi-square statistic 11.6234, P>Chi-square =0.0440
Tukey’s HSD: F value 2.56, Pr>F 0.0445
A: Clipper, Crowley, Foss, US Navy, Olympic Tug & Barge B: Crowley, Foss, U.S. Navy, Olympic Tug & Barge, USCG A>B
Incidents by Class Society*
Vessels classed by ABS had statistically higher incident frequency than those from other class societies.
Kruskal-Wallis Tukey’s HSD
Kruskal-Wallis: Chi-square statistic 28.0562, P>Chi-square <0.0001
Tukey’s HSD: F-value= 20.21, Pr >F <0.0001
ABS>NV=NK=LR
Incidents by Direction (Inbound/Outbound)*
Inbound vessels had significant higher incidents frequency than outbound vessels
Wilcoxon Statistic 170.500, Normal Approximation z= 2.9421, Pr> z=0.0033
Inbound>Outbound
Incidents by Incident type
Incidents caused by equipment failure had statistically higher frequency than incidents caused by other types.
Kruskal-Wallis
Tukey’s HSD
Kruskal-Wallis: Chi-square statistic 58.1122, P>Chi-square <0.0001
Tukey’s HSD: F-value= 81.11, Pr >F <0.0001
A: Equipment failure B: Loss of Propulsion, C: Loss of steering, Structural Failure, Near miss, Loss of Power, Loss of Anchor
A>B>C
Incidents by Error Type Incidents caused by MF has statistically higher frequency than incidents caused by HOE
Wilcoxon Statistic 66.0000, Normal Approximation z= -3.9863, Pr> z<0.0001
MF>HOE
Vessel Traffic Risk Assessment (VTRA) - Final Report 08/31/08
Technical Appendix A: Database Construction and Analysis A-73
References
Grabowski, M.R., Merrick, J.R., Harrald, J.R, Mazzuchi, T.A. & van Dorp, J.R. (2000). Risk Modeling in Distributed, Large-Scale Systems. IEEE Transactions on Systems, Man & Cybernetics—Part A: Systems and Humans. 30:6, November, 651-660.
Harrald, J.R., Mazzuchi, T.A., Spahn, J., Van Dorp, J.R., Merrick, J., Shrestha, S. &
Grabowski, M.R. (1998). Using System Simulation to Model the Impact of Human Error in a Maritime System. Safety Science. 30, 235–247.
Merrick, J.R.W., van Dorp, J.R., Mazzuchi, T., Harrald, J.R., Spahn, J.E. & Grabowski, M.R.
The Prince William Sound Risk Assessment. Interfaces. 32:6, November-December 1992, 25-40.
National Research Council. (1983). Ship Collisions with Bridges: The Nature of the Accidents, their
Prevention and Mitigation. Washington, D.C.: National Academy Press. National Research Council (1990). Crew Size and Maritime Safety. Washington, D.C.: National
Academies Press. http://www.trb.org/news/blurb_detail.asp?id=2654, retrieved 29 June 2007.
National Research Council. (1994). Minding the Helm: Marine Navigation and Piloting.
Washington, D.C.: National Academies Press. http://www.trb.org/news/blurb_detail.asp?id=2651, retrieved 29 June 2007.
National Research Council. (1999). Applying Advanced Information Systems to Ports and Waterways
Management. Washington, D.C.: National Academies Press. http://www.trb.org/news/blurb_detail.asp?id=2641, retrieved 29 June 2007.
National Research Council. (2003). Special Report 273: Shipboard Automatic Identification System
Displays: Meeting the Needs of Mariners. Washington, D.C.: National Academies Press. http://www.trb.org/news/blurb_detail.asp?id=1425, retrieved 29 June 2007.
National Transportation Safety Board. (1994). Safety Study: A Review of Flightcrew-Involved Major
Accidents of U.S. Air Carriers, 1978 – 1990. NTSB Report No. NTSB/SS-94/01. Washington, D.C.: National Transportation Safety Board, January.
Pacific States/British Columbia Oil Spill Task Force. (1995). Recommendations to Prevent Oil
Spills Caused by Human Error: 1995 Report to the Pacific States/BC Oil Spill Task Force. Victoria, British Columbia: Pacific States/BC Oil Spill Task Force. http://www.oilspilltaskforce.org/docs/project_reports/HumanFactorRec.pdf, retrieved 28 June 2007.
Vessel Traffic Risk Assessment (VTRA) - Final Report 08/31/08
Technical Appendix A: Database Construction and Analysis A-74
Pacific States/British Columiba Oil Spill Task Force. (1997). Spill and Incident Data Collection Project Report. Victoria, British Columbia: Pacific States/British Columbia Oil Spill Task Force. July. http://www.oilspilltaskforce.org/docs/notes_reports/DataProjectReport.pdf, retrieved 29 June 2007.
Pacific States/British Columbia Oil Spill Task Force. (2007). Data Dictionary. Victoria, British
Columbia: Pacific States/British Columbia Oil Spill Task Force. July. http://www.oilspilltaskforce.org/docs/datadictionary.pdf, retrieved 29 June 2007.
Rasmussen, J. (1983). Skills, Rules and Knowledge: Signals, Signs and Symbols and Other
Distinctions in Human Performance Models. IEEE Transactions on Systems, Man & Cybernetics. 13, 257-266.
Rasmussen, J. (1986). Information Processing and Human-Machine Interaction. Amsterdam: North
Holland Publishing. Reason, J. (1997). Managing the Human and Organizational Response to Accidents. Brookfield, VT:
Ashgate Publishing. Shappell, S.A. & Weigemann, D.A. (1997). A Human Error Approach to Accident
Investigation: The Taxonomy of Unsafe Operations. International Journal of Aviation Psychology. 7, 269-292.
Shappell, S.A. & Weigemann, D.A. (2001). Human Factors Analysis and Classification
System. Flight Safety Digest. February, 15-25. Steward, M.J. (2007). Mitigating the Risk of Accidents and Incidents in Energy Transportation:
Empirical Analysis of Risk and Escort Operations in Puget Sound. Master’s Thesis. May 2007: Rensselaer Polytechnic Institute, 2007.
Transportation Research Board. (2008). Prospectus for Maritime Safety Reporting Database.
Washington, D.C. National Academies/National Research Council. Transportation Research Board, Task Force on Marine Safety and Human Factors, June 2008.
U.S. Coast Guard (1999). Regulatory Assessment: Use of Tugs to Protect Against Oil Spills
in the Puget Sound Area. Report No. 9522-002. U.S. Department of Homeland Security, United States Coast Guard. (2005). Study to
Investigate Marine Casualty Data. Prospectus prepared for U.S. General Accounting Office, House Subcommittee on the U.S. Coast Guard, 18 May 2005. http://frwebgate.access.gpo.gov/cgi-bin/getdoc.cgi?dbname=109_cong_bills&docid=f:h889ih.txt.pdf, retrieved 18 May 2005.
Van Dorp, J.R., Merrick, J.R.W., Harrald, J.R., Mazzuchi, T.A., & Grabowski, M.R. A Risk
Management Procedure for the Washington State Ferries. Risk Analysis. 21:1, 2001, 127-142.
Vessel Traffic Risk Assessment (VTRA) - Final Report 08/31/08
Technical Appendix A: Database Construction and Analysis A-75
Appendix A-1
Puget Sound Tanker Events, Accidents and Incident Analysis
1995-2005

Vessel Traffic Risk Assessment (VTRA) - Final Report 08/31/08
Technical Appendix A: Database Construction and Analysis A-76
Puget Sound Tanker Events, Accidents and Incidents, 1995-2005 In this section, an analysis of tanker events between 1995 and 2005, as recorded in the Puget
Sound VTRA Accident-Incident database, is undertaken. Tankers include crude oil tankers,
product tankers, LPG tankers, LNG tankers, combined chemical and oil tankers, chemical
tankers, and Military Sealift Command tankers. 171 tanker events are in the database: 35 are
accidents (20.47%), 111 are incidents (64.9%), and the remaining 25 records are unusual
events. The tanker accident-incident pyramids for years 1995-2005 are shown in Figure A-
16. Note that there are small sample sizes for all tanker accidents and unusual events.
11
2
8
2
8
4
05
9
2
12
122
6
13
9
10
2
13
2
50
0
5
10
15
20
25
30
Frequency
1995 1996 1997 1998 1999 2000 2001 2002 2003 2004 2005
Year
Puget Sound Tanker Accident-Incident Pyramids
ACCIDENTINCIDENT
1:5.5
1:41:2 1:4.5
1:12
1:3.7
1:1.4
1:5
1:6.5
Figure A-16 Tanker Accident-Incident Ratios, 1995-2005
Tanker Events by Year, 1995-2005 Total tanker transit data (1996-2005) and tanker events, accidents, incidents, and unusual
events (1995-2005) are given in Table A-45 and Figure A-17 below. The normalized data are
also shown in Table A-46.

Vessel Traffic Risk Assessment (VTRA) - Final Report 08/31/08
Technical Appendix A: Database Construction and Analysis A-77
Puget Sound Tanker Total Event/Accident/Incident Frequency by Year
14
1012
5
1113
36
27
16
21
6
2 24 5
2 1
69
2 20
118 8
0
912
22
1310
13
5
0
5
10
15
20
25
30
35
40
1995 1996 1997 1998 1999 2000 2001 2002 2003 2004 2005
Year
Freq
uenc
y TOTAL EVENTACCIDENTINCIDENT
Figure A-17 Tanker Total Events, Accidents, and Incidents by Year, 1995-2005
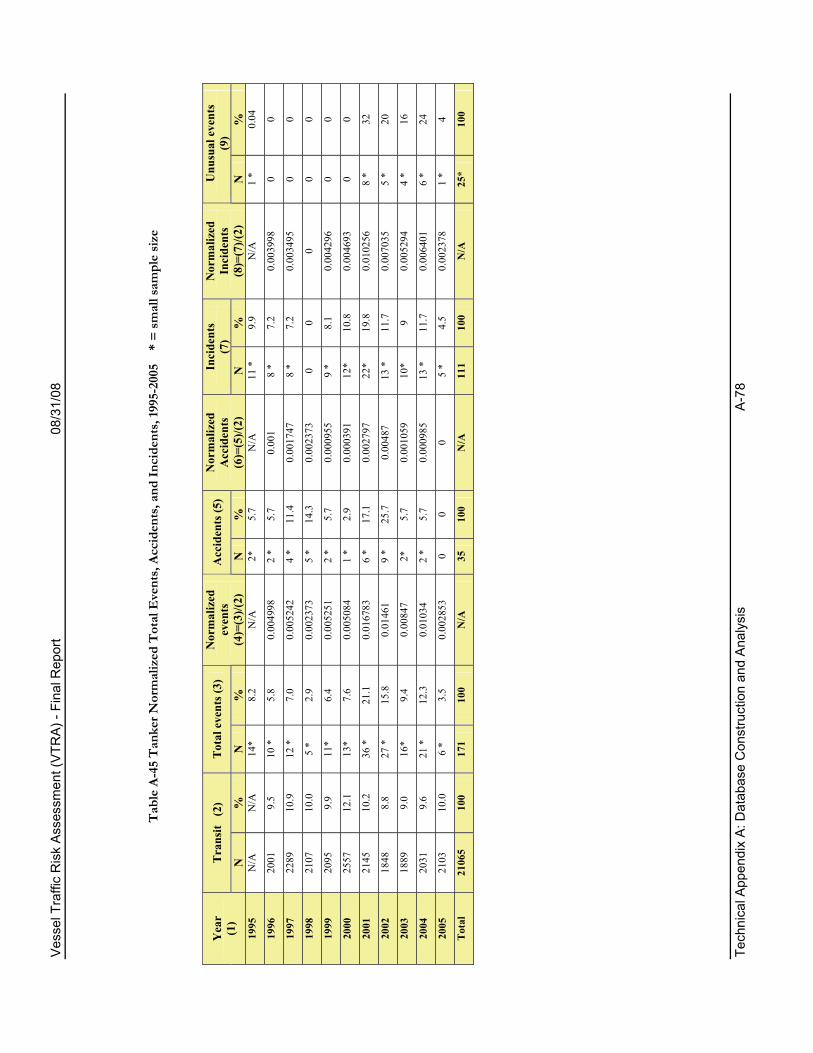
Vess
el T
raffi
c R
isk
Asse
ssm
ent (
VTR
A) -
Fina
l Rep
ort
08/3
1/08
Te
chni
cal A
ppen
dix
A: D
atab
ase
Con
stru
ctio
n an
d A
naly
sis
A-7
8
Tab
le A
-45
Tan
ker N
orm
aliz
ed T
otal
Eve
nts,
Acc
iden
ts, a
nd In
cide
nts,
1995
-200
5
* =
smal
l sam
ple
size
Tra
nsit
(2)
T
otal
eve
nts (
3)
Acc
iden
ts (5
) In
cide
nts
(7)
Unu
sual
eve
nts
(9)
Yea
r (1
) N
%
N
%
Nor
mal
ized
ev
ents
(4
)=(3
)/(2)
N
%
Nor
mal
ized
A
ccid
ents
(6
)=(5
)/(2)
N
%
Nor
mal
ized
In
cide
nts
(8)=
(7)/(
2)
N
%
1995
N
/A
N/A
14
* 8.
2 N
/A
2*
5.7
N/A
11
*
9.9
N/A
1
*
0.04
1996
20
01
9.5
10 *
5.
8 0.
0049
98
2 *
5.
7 0.
001
8 *
7.
2 0.
0039
98
0
0
1997
22
89
10.9
12
*
7.0
0.00
5242
4
*
11.4
0.
0017
47
8 *
7.
2 0.
0034
95
0
0
1998
21
07
10.0
5
*
2.9
0.00
2373
5
*
14.3
0.
0023
73
0
0 0
0
0
1999
20
95
9.9
11*
6.
4 0.
0052
51
2 *
5.7
0.00
0955
9
*
8.1
0.00
4296
0
0
2000
25
57
12.1
13
*
7.6
0.00
5084
1
*
2.9
0.00
0391
12
*
10.8
0.
0046
93
0
0
2001
21
45
10.2
36
*
21.1
0.
0167
83
6 *
17
.1
0.00
2797
22
*
19.8
0.
0102
56
8 *
32
2002
18
48
8.8
27 *
15
.8
0.01
461
9 *
25
.7
0.00
487
13 *
11
.7
0.00
7035
5
*
20
2003
18
89
9.0
16*
9.
4 0.
0084
7 2*
5.
7 0.
0010
59
10*
9
0.00
5294
4
*
16
2004
20
31
9.6
21 *
12
.3
0.01
034
2 *
5.
7 0.
0009
85
13 *
11
.7
0.00
6401
6
*
24
2005
21
03
10.0
6
*
3.5
0.00
2853
0
0
0 5
*
4.5
0.00
2378
1
*
4
Tot
al
2106
5 10
0 17
1 10
0 N
/A
35
100
N/A
11
1 10
0 N
/A
25*
10
0

Vessel Traffic Risk Assessment (VTRA) - Final Report 08/31/08
Technical Appendix A: Database Construction and Analysis A-79
From Figure A-17, it can be seen that years 2001 and 2002 had the greatest number of
tanker events in Puget Sound. Kruskal-Wallis and Tukey’s HSD tests showed that there were
statistical differences between normalized events and incidents from 1996-2005, with years
2002 and 2003 having the events and incidents (Table A-46). However, Wilcoxon tests on
the data found that no statistical differences before and after year 2000 (Table A-47). Table A-46: Kruskal-Wallis and Tukey’s HSD Tests on Total Events, Accidents, and Incidents
Frequencies by Year, 1995-2005 Variable DF Test Statistics Direction
Total Events
10 Kruskal-Wallis: Chi-square statistic 24.1119, Pr > Chi-square =0.0073 Tukey’s HSD: F-value=3.62, Pr >F =0.0003
A:2001 2002 2004 2003 1995
B: 2002 2004 2003 1995 2000 1997 1999 1996 2005 1998
A>B Accidents* 10 Kruskal-Wallis: Chi-square statistic
12.4000, Pr > Chi-square =0.2592 Tukey’s HSD: F-value=1.27, Pr >F =0.2549
N/A
Raw Data
Incidents 10 Kruskal-Wallis: Chi-square statistic 23.1115, Pr > Chi-square =0.0103 Tukey’s HSD: F-value=2.22, DF = 10, Pr >F =0.0207
A: 2001 2004 2002 2000 1995 2003 1999 1996 1997 2005
B: 2004 2002 2000 1995 2003 1999 1996 1997 2005 1998
A>B
Total Events
9 Kruskal-Wallis: Chi-square statistic 23.9004, Pr > Chi-square =0.0045 Tukey’s HSD: F-value=3.69, Pr >F =0.0005
A: 2002 2003 2005 1996 2004 B: 2003 2005 1996 2004 1998 2001 1997 2000 1999 A>B
Accidents* 9 Kruskal-Wallis: Chi-square statistic 9.2947, Pr > Chi-square=0.4105
Tukey’s HSD: F-value=1.02, Pr >F 0.4263
N/A
Normalized Data
Incidents 9 Kruskal-Wallis: Chi-square statistic 22.5624, Pr > Chi-square =0.0073 Tukey’s HSD: F-value=2.50, DF = 9, Pr >F =0.0120
A: 2002 2003 1996 2005 2001 2004 1998 1997 2000 B: 2003 1996 2005 2001 2004 1998 1997 2000 1999 A>B
* = small sample size Bold results are statistically significant
Table A-47 Wilcoxon Test Result for Tanker Raw and Normalized Events, Accidents, and Incidents before and after Year 2000
Variable N* Test statistic Normal approximate Z Two-sided Pr> Z Direction
Total events 5/6* 20.0000 -1.8257 0.0679 N/A Accidents* 5/6* 32.0000 0.3830 0.7017 N/A Raw Data Incidents 5/6* 20.0000 -1.8341 0.0666 N/A
Total events 5* 19.0000 -1.7756 0.0758 N/A Accidents* 5* 25.0000 -0.5222 0.6015 N/A Normalized
Data Incidents 5* 19.000 -1.7756 0.0758 N/A * = small sample size Bold results are statistically significant
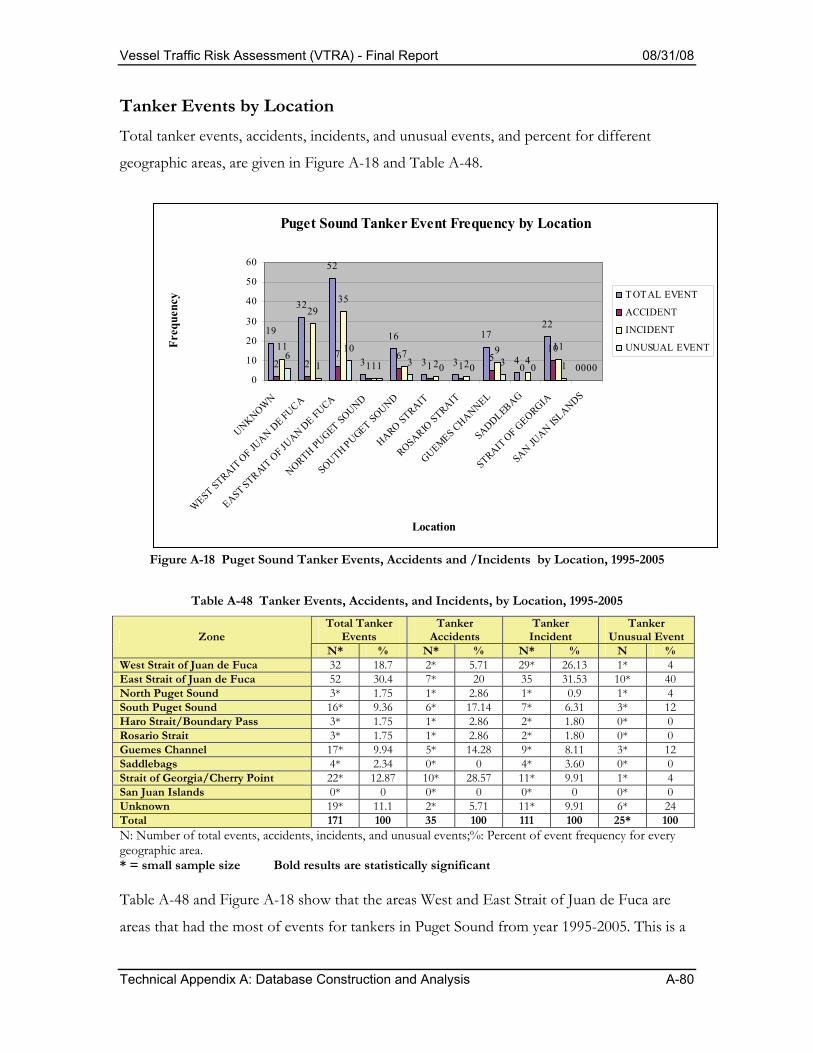
Vessel Traffic Risk Assessment (VTRA) - Final Report 08/31/08
Technical Appendix A: Database Construction and Analysis A-80
Tanker Events by Location Total tanker events, accidents, incidents, and unusual events, and percent for different
geographic areas, are given in Figure A-18 and Table A-48.
Puget Sound Tanker Event Frequency by Location
19
32
52
3
16
3 3
17
4
22
02 27
16
1 15
0
10
0
11
2935
17
2 29
411
06
1
10
1 3 0 0 3 0 1 00
10
20
30
40
50
60
UNKNOWN
WEST STRAIT OF JU
AN DE FUCA
EAST STRAIT O
F JUAN DE FUCA
NORTH PUGET SOUND
SOUTH PUGET SOUND
HARO STRAIT
ROSARIO STRAIT
GUEMES CHANNEL
SADDLEBAG
STRAIT OF G
EORGIA
SAN JUAN IS
LANDS
Location
Freq
uenc
y T OT AL EVENT
ACCIDENT
INCIDENT
UNUSUAL EVENT
Figure A-18 Puget Sound Tanker Events, Accidents and /Incidents by Location, 1995-2005
Table A-48 Tanker Events, Accidents, and Incidents, by Location, 1995-2005
Total Tanker Events
Tanker Accidents
Tanker Incident
Tanker Unusual Event Zone
N* % N* % N* % N % West Strait of Juan de Fuca 32 18.7 2* 5.71 29* 26.13 1* 4 East Strait of Juan de Fuca 52 30.4 7* 20 35 31.53 10* 40 North Puget Sound 3* 1.75 1* 2.86 1* 0.9 1* 4 South Puget Sound 16* 9.36 6* 17.14 7* 6.31 3* 12 Haro Strait/Boundary Pass 3* 1.75 1* 2.86 2* 1.80 0* 0 Rosario Strait 3* 1.75 1* 2.86 2* 1.80 0* 0 Guemes Channel 17* 9.94 5* 14.28 9* 8.11 3* 12 Saddlebags 4* 2.34 0* 0 4* 3.60 0* 0 Strait of Georgia/Cherry Point 22* 12.87 10* 28.57 11* 9.91 1* 4 San Juan Islands 0* 0 0* 0 0* 0 0* 0 Unknown 19* 11.1 2* 5.71 11* 9.91 6* 24 Total 171 100 35 100 111 100 25* 100 N: Number of total events, accidents, incidents, and unusual events;%: Percent of event frequency for every geographic area. * = small sample size Bold results are statistically significant Table A-48 and Figure A-18 show that the areas West and East Strait of Juan de Fuca are
areas that had the most of events for tankers in Puget Sound from year 1995-2005. This is a
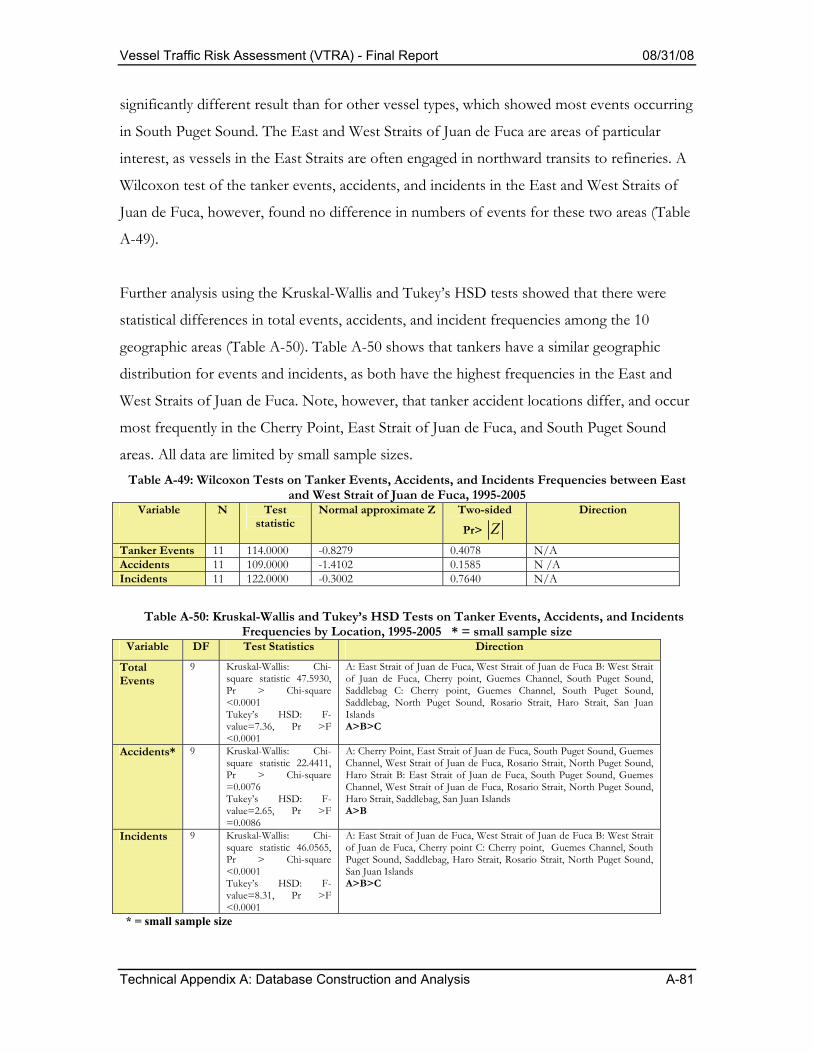
Vessel Traffic Risk Assessment (VTRA) - Final Report 08/31/08
Technical Appendix A: Database Construction and Analysis A-81
significantly different result than for other vessel types, which showed most events occurring
in South Puget Sound. The East and West Straits of Juan de Fuca are areas of particular
interest, as vessels in the East Straits are often engaged in northward transits to refineries. A
Wilcoxon test of the tanker events, accidents, and incidents in the East and West Straits of
Juan de Fuca, however, found no difference in numbers of events for these two areas (Table
A-49).
Further analysis using the Kruskal-Wallis and Tukey’s HSD tests showed that there were
statistical differences in total events, accidents, and incident frequencies among the 10
geographic areas (Table A-50). Table A-50 shows that tankers have a similar geographic
distribution for events and incidents, as both have the highest frequencies in the East and
West Straits of Juan de Fuca. Note, however, that tanker accident locations differ, and occur
most frequently in the Cherry Point, East Strait of Juan de Fuca, and South Puget Sound
areas. All data are limited by small sample sizes. Table A-49: Wilcoxon Tests on Tanker Events, Accidents, and Incidents Frequencies between East
and West Strait of Juan de Fuca, 1995-2005 Variable N Test
statistic Normal approximate Z Two-sided
Pr> Z
Direction
Tanker Events 11 114.0000 -0.8279 0.4078 N/A Accidents 11 109.0000 -1.4102 0.1585 N /A Incidents 11 122.0000 -0.3002 0.7640 N/A
Table A-50: Kruskal-Wallis and Tukey’s HSD Tests on Tanker Events, Accidents, and Incidents Frequencies by Location, 1995-2005 * = small sample size
Variable DF Test Statistics Direction
Total Events
9 Kruskal-Wallis: Chi-square statistic 47.5930, Pr > Chi-square <0.0001 Tukey’s HSD: F-value=7.36, Pr >F <0.0001
A: East Strait of Juan de Fuca, West Strait of Juan de Fuca B: West Strait of Juan de Fuca, Cherry point, Guemes Channel, South Puget Sound, Saddlebag C: Cherry point, Guemes Channel, South Puget Sound, Saddlebag, North Puget Sound, Rosario Strait, Haro Strait, San Juan Islands A>B>C
Accidents* 9 Kruskal-Wallis: Chi-square statistic 22.4411, Pr > Chi-square =0.0076 Tukey’s HSD: F-value=2.65, Pr >F =0.0086
A: Cherry Point, East Strait of Juan de Fuca, South Puget Sound, Guemes Channel, West Strait of Juan de Fuca, Rosario Strait, North Puget Sound, Haro Strait B: East Strait of Juan de Fuca, South Puget Sound, Guemes Channel, West Strait of Juan de Fuca, Rosario Strait, North Puget Sound, Haro Strait, Saddlebag, San Juan Islands A>B
Incidents 9 Kruskal-Wallis: Chi-square statistic 46.0565, Pr > Chi-square <0.0001 Tukey’s HSD: F-value=8.31, Pr >F <0.0001
A: East Strait of Juan de Fuca, West Strait of Juan de Fuca B: West Strait of Juan de Fuca, Cherry point C: Cherry point, Guemes Channel, South Puget Sound, Saddlebag, Haro Strait, Rosario Strait, North Puget Sound, San Juan Islands A>B>C
* = small sample size
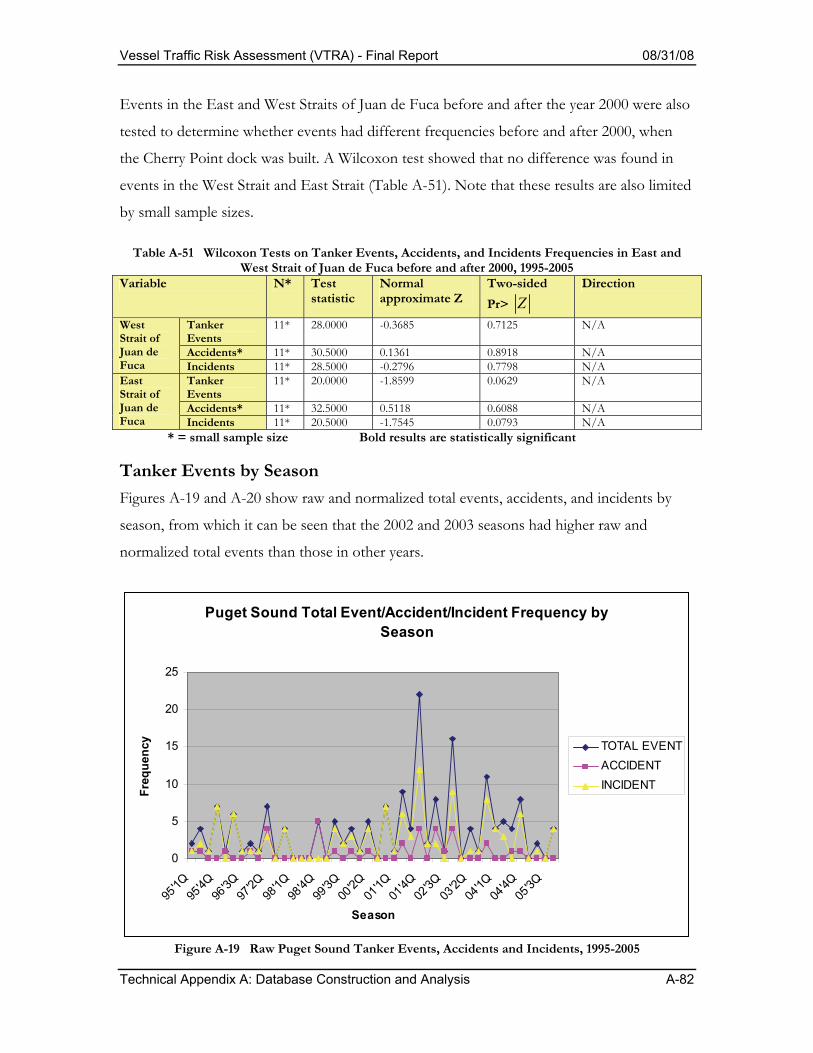
Vessel Traffic Risk Assessment (VTRA) - Final Report 08/31/08
Technical Appendix A: Database Construction and Analysis A-82
Events in the East and West Straits of Juan de Fuca before and after the year 2000 were also
tested to determine whether events had different frequencies before and after 2000, when
the Cherry Point dock was built. A Wilcoxon test showed that no difference was found in
events in the West Strait and East Strait (Table A-51). Note that these results are also limited
by small sample sizes.
Table A-51 Wilcoxon Tests on Tanker Events, Accidents, and Incidents Frequencies in East and West Strait of Juan de Fuca before and after 2000, 1995-2005
Variable N* Test statistic
Normal approximate Z
Two-sided Pr> Z
Direction
Tanker Events
11* 28.0000 -0.3685 0.7125 N/A
Accidents* 11* 30.5000 0.1361 0.8918 N/A
West Strait of Juan de Fuca Incidents 11* 28.5000 -0.2796 0.7798 N/A
Tanker Events
11* 20.0000 -1.8599 0.0629 N/A
Accidents* 11* 32.5000 0.5118 0.6088 N/A
East Strait of Juan de Fuca Incidents 11* 20.5000 -1.7545 0.0793 N/A * = small sample size Bold results are statistically significant
Tanker Events by Season Figures A-19 and A-20 show raw and normalized total events, accidents, and incidents by
season, from which it can be seen that the 2002 and 2003 seasons had higher raw and
normalized total events than those in other years.
Puget Sound Total Event/Accident/Incident Frequency by Season
0
5
10
15
20
25
95'1Q
95'4Q
96'3Q
97'2Q
98'1Q
98'4Q
99'3Q
00'2Q
01'1Q
01'4Q
02'3Q
03'2Q
04'1Q
04'4Q
05'3Q
Season
Freq
uenc
y TOTAL EVENTACCIDENTINCIDENT
Figure A-19 Raw Puget Sound Tanker Events, Accidents and Incidents, 1995-2005

Vessel Traffic Risk Assessment (VTRA) - Final Report 08/31/08
Technical Appendix A: Database Construction and Analysis A-83
Normalized Tanker Total Event/Accident/Incident Frequency from Year 1996-2005 by Season
0
0.005
0.01
0.015
0.02
0.025
0.03
96'1Q
96'4Q
97'3Q
98'2Q
99'1Q
99'4Q
00'3Q
01'2Q
02'1Q
02'4Q
03'3Q
04'2Q
05'1Q
05'4Q
Season
Norm
aliz
ed F
requ
ency
TOTAL EVENTACCIDENTINCIDENT
Figure A-20 Normalized Puget Sound Tanker Events, Accidents and Incidents, 1996-2005
Analysis using Kruskal-Wallis and Tukey’s HSD tests showed that although tankers had
different total event and incident frequencies among the four seasons in the raw data
analysis, no statistical difference for normalized tanker events, accidents, or incidents existed
among the four seasons (Table A-52). Note that the data are limited by small sample sizes. Table A-52 Kruskal-Wallis and Tukey’s HSD tests of Raw and Normalized Event, Accident, and
Incident Frequencies for Tanker by Season * =small sample size Variable DF Test statistic Direction
Total Events
3
Kruskal-Wallis: Chi-square statistic 24.8965, D Pr> Chi-square <0.0001 Tukey’s HSD: F-value=10.79, Pr >F =0.0001
A: Winter Summer B: Summer Autumn C: Autumn Spring A>B>C
Accidents* 3
Kruskal-Wallis: Chi-square statistic 9.6246, Pr> Chi-square =0.0220 Tukey’s HSD: F-value=3.84, Pr >F =0.0166
A: Winter Summer B: Summer Spring Autumn A>B
Raw Data
Incidents 3
Kruskal-Wallis: Chi-square statistic 18.9876, Pr> Chi-square =0.0003 Tukey’s HSD: F-value=11.62, Pr >F <0.0001
A: Winter B: Summer Spring Autumn A>B
Total Events 3
Kruskal-Wallis: Chi-square statistic 1.3870, P> Chi-square =0.7086 Tukey’s HSD: F-value=0.83, Pr >F =0.4859
N/A
Accidents* 3
Kruskal-Wallis: Chi-square statistic 6.1219, P> Chi-square =0.1058 Tukey’s HSD: F-value=0.71, Pr >F =0.5544
N/A Normalized Data
Incidents
3 Kruskal-Wallis: Chi-square statistic 2.8621, P> Chi-square =0.4134 Tukey’s HSD: F-value=0.78, Pr >F=0.5146
N/A
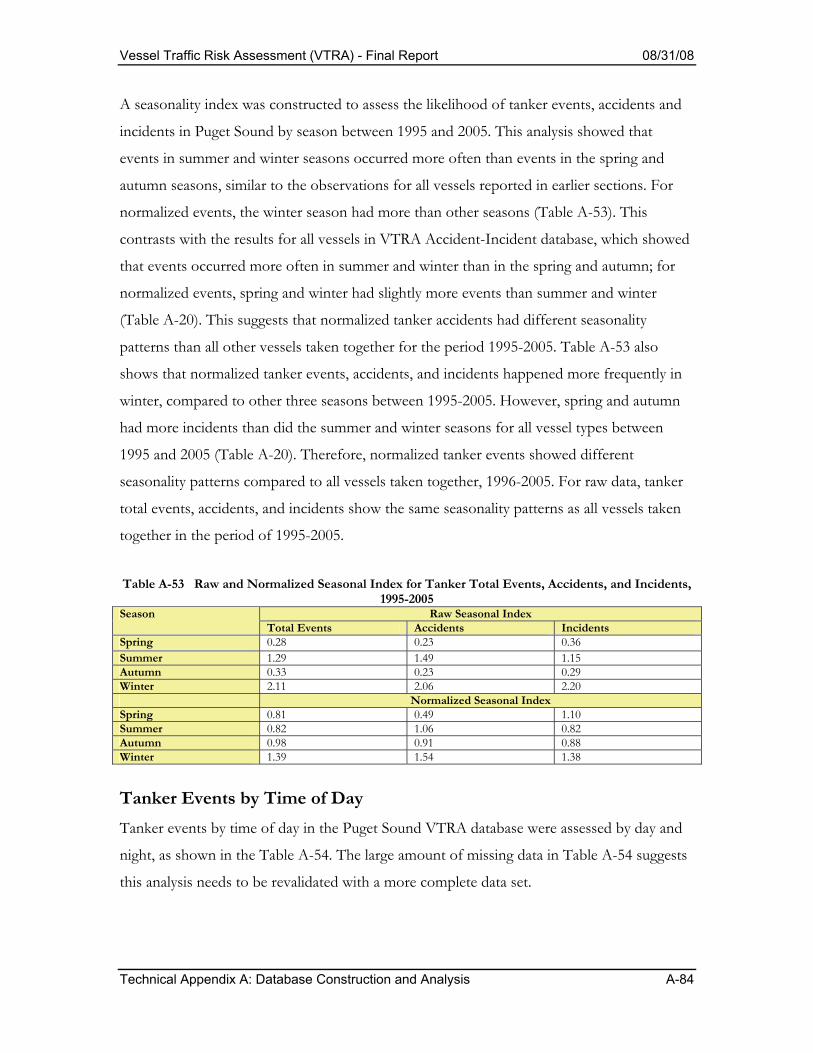
Vessel Traffic Risk Assessment (VTRA) - Final Report 08/31/08
Technical Appendix A: Database Construction and Analysis A-84
A seasonality index was constructed to assess the likelihood of tanker events, accidents and
incidents in Puget Sound by season between 1995 and 2005. This analysis showed that
events in summer and winter seasons occurred more often than events in the spring and
autumn seasons, similar to the observations for all vessels reported in earlier sections. For
normalized events, the winter season had more than other seasons (Table A-53). This
contrasts with the results for all vessels in VTRA Accident-Incident database, which showed
that events occurred more often in summer and winter than in the spring and autumn; for
normalized events, spring and winter had slightly more events than summer and winter
(Table A-20). This suggests that normalized tanker accidents had different seasonality
patterns than all other vessels taken together for the period 1995-2005. Table A-53 also
shows that normalized tanker events, accidents, and incidents happened more frequently in
winter, compared to other three seasons between 1995-2005. However, spring and autumn
had more incidents than did the summer and winter seasons for all vessel types between
1995 and 2005 (Table A-20). Therefore, normalized tanker events showed different
seasonality patterns compared to all vessels taken together, 1996-2005. For raw data, tanker
total events, accidents, and incidents show the same seasonality patterns as all vessels taken
together in the period of 1995-2005.
Table A-53 Raw and Normalized Seasonal Index for Tanker Total Events, Accidents, and Incidents, 1995-2005
Raw Seasonal Index Season Total Events Accidents Incidents
Spring 0.28 0.23 0.36 Summer 1.29 1.49 1.15 Autumn 0.33 0.23 0.29 Winter 2.11 2.06 2.20 Normalized Seasonal Index Spring 0.81 0.49 1.10 Summer 0.82 1.06 0.82 Autumn 0.98 0.91 0.88 Winter 1.39 1.54 1.38
Tanker Events by Time of Day Tanker events by time of day in the Puget Sound VTRA database were assessed by day and
night, as shown in the Table A-54. The large amount of missing data in Table A-54 suggests
this analysis needs to be revalidated with a more complete data set.
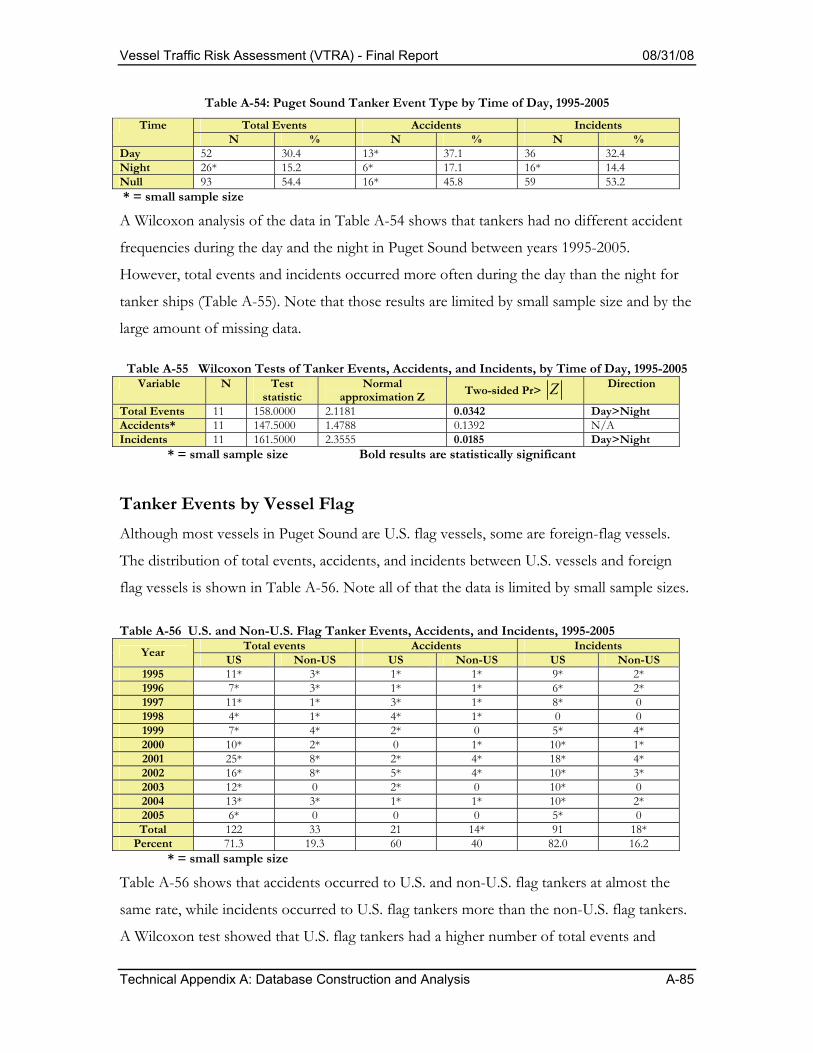
Vessel Traffic Risk Assessment (VTRA) - Final Report 08/31/08
Technical Appendix A: Database Construction and Analysis A-85
Table A-54: Puget Sound Tanker Event Type by Time of Day, 1995-2005 Total Events Accidents Incidents Time
N % N % N % Day 52 30.4 13* 37.1 36 32.4 Night 26* 15.2 6* 17.1 16* 14.4 Null 93 54.4 16* 45.8 59 53.2 * = small sample size
A Wilcoxon analysis of the data in Table A-54 shows that tankers had no different accident
frequencies during the day and the night in Puget Sound between years 1995-2005.
However, total events and incidents occurred more often during the day than the night for
tanker ships (Table A-55). Note that those results are limited by small sample size and by the
large amount of missing data.
Table A-55 Wilcoxon Tests of Tanker Events, Accidents, and Incidents, by Time of Day, 1995-2005 Variable N Test
statistic Normal
approximation Z Two-sided Pr> Z Direction
Total Events 11 158.0000 2.1181 0.0342 Day>Night Accidents* 11 147.5000 1.4788 0.1392 N/A Incidents 11 161.5000 2.3555 0.0185 Day>Night * = small sample size Bold results are statistically significant
Tanker Events by Vessel Flag Although most vessels in Puget Sound are U.S. flag vessels, some are foreign-flag vessels.
The distribution of total events, accidents, and incidents between U.S. vessels and foreign
flag vessels is shown in Table A-56. Note all of that the data is limited by small sample sizes.
Table A-56 U.S. and Non-U.S. Flag Tanker Events, Accidents, and Incidents, 1995-2005
Total events Accidents Incidents Year US Non-US US Non-US US Non-US 1995 11* 3* 1* 1* 9* 2* 1996 7* 3* 1* 1* 6* 2* 1997 11* 1* 3* 1* 8* 0 1998 4* 1* 4* 1* 0 0 1999 7* 4* 2* 0 5* 4* 2000 10* 2* 0 1* 10* 1* 2001 25* 8* 2* 4* 18* 4* 2002 16* 8* 5* 4* 10* 3* 2003 12* 0 2* 0 10* 0 2004 13* 3* 1* 1* 10* 2* 2005 6* 0 0 0 5* 0 Total 122 33 21 14* 91 18*
Percent 71.3 19.3 60 40 82.0 16.2 * = small sample size
Table A-56 shows that accidents occurred to U.S. and non-U.S. flag tankers at almost the
same rate, while incidents occurred to U.S. flag tankers more than the non-U.S. flag tankers.
A Wilcoxon test showed that U.S. flag tankers had a higher number of total events and
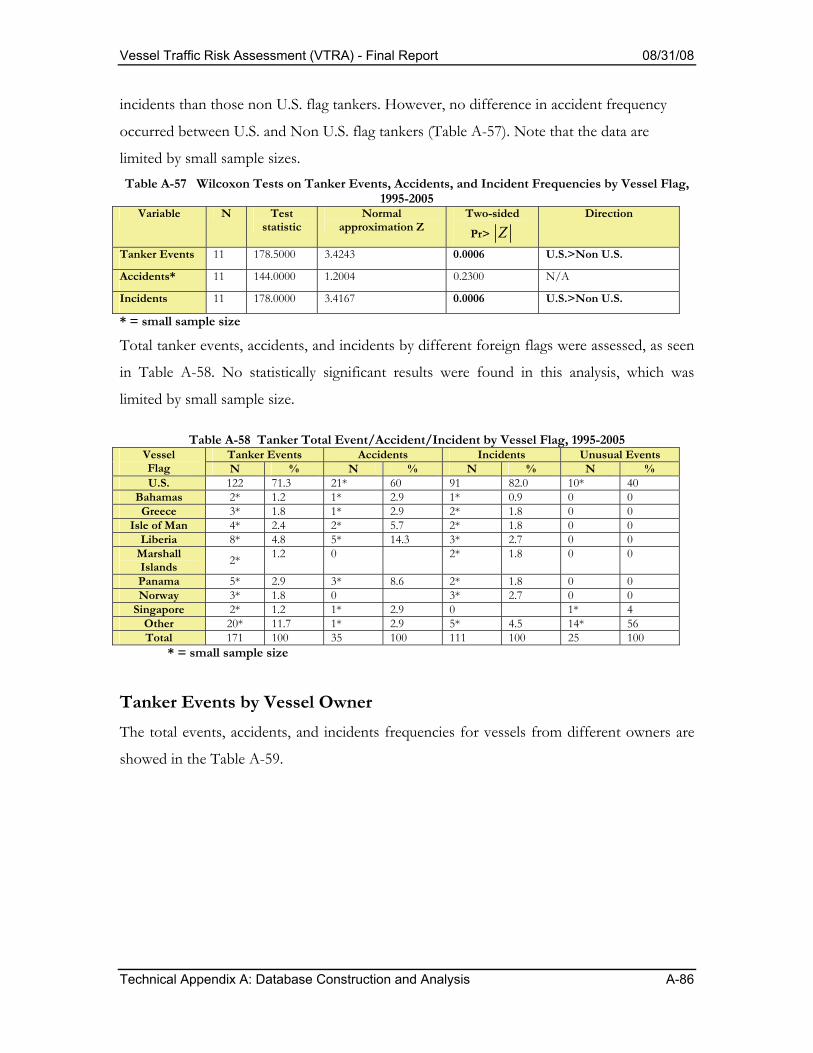
Vessel Traffic Risk Assessment (VTRA) - Final Report 08/31/08
Technical Appendix A: Database Construction and Analysis A-86
incidents than those non U.S. flag tankers. However, no difference in accident frequency
occurred between U.S. and Non U.S. flag tankers (Table A-57). Note that the data are
limited by small sample sizes. Table A-57 Wilcoxon Tests on Tanker Events, Accidents, and Incident Frequencies by Vessel Flag,
1995-2005 Variable N Test
statistic Normal
approximation Z Two-sided
Pr> Z
Direction
Tanker Events 11 178.5000 3.4243 0.0006 U.S.>Non U.S.
Accidents* 11 144.0000 1.2004 0.2300 N/A
Incidents 11 178.0000 3.4167 0.0006 U.S.>Non U.S.
* = small sample size
Total tanker events, accidents, and incidents by different foreign flags were assessed, as seen
in Table A-58. No statistically significant results were found in this analysis, which was
limited by small sample size.
Table A-58 Tanker Total Event/Accident/Incident by Vessel Flag, 1995-2005 Tanker Events Accidents Incidents Unusual Events Vessel
Flag N % N % N % N % U.S. 122 71.3 21* 60 91 82.0 10* 40
Bahamas 2* 1.2 1* 2.9 1* 0.9 0 0 Greece 3* 1.8 1* 2.9 2* 1.8 0 0
Isle of Man 4* 2.4 2* 5.7 2* 1.8 0 0 Liberia 8* 4.8 5* 14.3 3* 2.7 0 0
Marshall Islands 2* 1.2 0 2* 1.8 0 0
Panama 5* 2.9 3* 8.6 2* 1.8 0 0 Norway 3* 1.8 0 3* 2.7 0 0
Singapore 2* 1.2 1* 2.9 0 1* 4 Other 20* 11.7 1* 2.9 5* 4.5 14* 56 Total 171 100 35 100 111 100 25 100
* = small sample size
Tanker Events by Vessel Owner The total events, accidents, and incidents frequencies for vessels from different owners are
showed in the Table A-59.
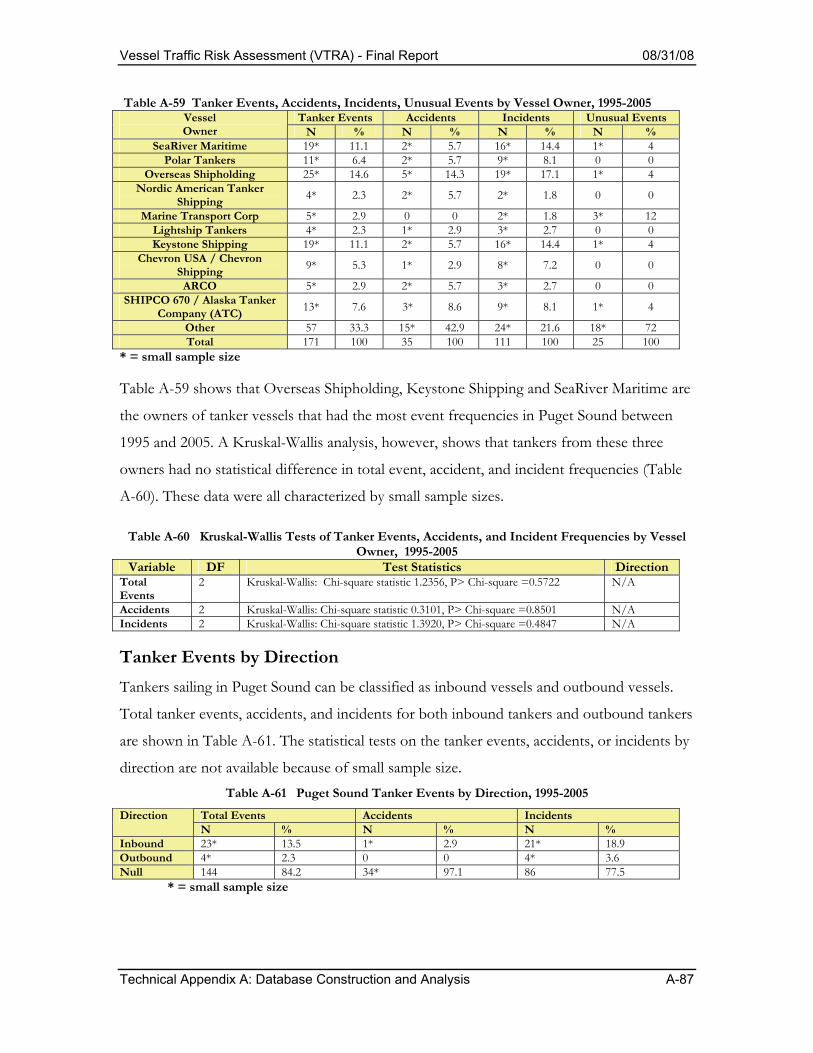
Vessel Traffic Risk Assessment (VTRA) - Final Report 08/31/08
Technical Appendix A: Database Construction and Analysis A-87
Table A-59 Tanker Events, Accidents, Incidents, Unusual Events by Vessel Owner, 1995-2005 Tanker Events Accidents Incidents Unusual Events Vessel
Owner N % N % N % N % SeaRiver Maritime 19* 11.1 2* 5.7 16* 14.4 1* 4
Polar Tankers 11* 6.4 2* 5.7 9* 8.1 0 0 Overseas Shipholding 25* 14.6 5* 14.3 19* 17.1 1* 4
Nordic American Tanker Shipping 4* 2.3 2* 5.7 2* 1.8 0 0
Marine Transport Corp 5* 2.9 0 0 2* 1.8 3* 12 Lightship Tankers 4* 2.3 1* 2.9 3* 2.7 0 0 Keystone Shipping 19* 11.1 2* 5.7 16* 14.4 1* 4
Chevron USA / Chevron Shipping 9* 5.3 1* 2.9 8* 7.2 0 0
ARCO 5* 2.9 2* 5.7 3* 2.7 0 0 SHIPCO 670 / Alaska Tanker
Company (ATC) 13* 7.6 3* 8.6 9* 8.1 1* 4
Other 57 33.3 15* 42.9 24* 21.6 18* 72 Total 171 100 35 100 111 100 25 100
* = small sample size Table A-59 shows that Overseas Shipholding, Keystone Shipping and SeaRiver Maritime are
the owners of tanker vessels that had the most event frequencies in Puget Sound between
1995 and 2005. A Kruskal-Wallis analysis, however, shows that tankers from these three
owners had no statistical difference in total event, accident, and incident frequencies (Table
A-60). These data were all characterized by small sample sizes.
Table A-60 Kruskal-Wallis Tests of Tanker Events, Accidents, and Incident Frequencies by Vessel Owner, 1995-2005
Variable DF Test Statistics Direction Total Events
2 Kruskal-Wallis: Chi-square statistic 1.2356, P> Chi-square =0.5722 N/A
Accidents 2 Kruskal-Wallis: Chi-square statistic 0.3101, P> Chi-square =0.8501 N/A Incidents 2 Kruskal-Wallis: Chi-square statistic 1.3920, P> Chi-square =0.4847 N/A
Tanker Events by Direction Tankers sailing in Puget Sound can be classified as inbound vessels and outbound vessels.
Total tanker events, accidents, and incidents for both inbound tankers and outbound tankers
are shown in Table A-61. The statistical tests on the tanker events, accidents, or incidents by
direction are not available because of small sample size. Table A-61 Puget Sound Tanker Events by Direction, 1995-2005
Total Events Accidents Incidents Direction N % N % N %
Inbound 23* 13.5 1* 2.9 21* 18.9 Outbound 4* 2.3 0 0 4* 3.6 Null 144 84.2 34* 97.1 86 77.5 * = small sample size

Vessel Traffic Risk Assessment (VTRA) - Final Report 08/31/08
Technical Appendix A: Database Construction and Analysis A-88
Tanker Events by Hull Type There are four hull types for tankers in the database: single hull, double hull, double sides,
and double bottoms, as seen in Figure A-21 and Table A-62. Missing information was
classified as “unknown”. A Wilcoxon test of the Table A-62 data shows that double hull
vessels had significantly higher numbers of total events, accidents, and incidents than single
hull tankers (Table A-63). Note that this data, too, is limited by small sample sizes.
PUGET SOUND TANKER TOTAL EVENT/ACCIDENT/INCIDENT BY HULL TYPE, 1995-2005
39
6154
4
1310 12 11
2 0
28
4036
2 5
0
10
20
30
40
50
60
70
SINGLEHULL
DOUBLEHULL
DOUBLEBOTTOM
DOUBLESIDES
UNKNOWN
HULL TYPE
FRE
QU
ENCY TOTAL EVENT
ACCIDENTINCIDENT
Figure A-21 Tanker Accidents, Incidents and Unusual Events by Hull Types, 1995-2005
Table A-62 Tanker Accident/Incident/Unusual Event Frequency by Hull Type, 1995-2005 Event Single Hull Double Hull Double Sides Double Bottom Unknown Accidents 10* 12* 2* 11* 0 Incidents 28* 40 2* 36* 5* Unusual Events 1* 9* 0 7* 8* Total 39* 61 4* 54 13* * = small sample size
Table A-63 Wilcoxon Tests of Tanker Events, Accidents, and Incidents by Hull Type, 1995-2005
Variable N Test statistic
Normal approximate Z Two-sided Pr> Z Direction
Tanker Events 11 91.0000 -2.3390 0.0193 Double Hull* >Single Hull*
Accidents 11 94.5000 -2.2226 0.0262 Double Hull* >Single Hull*
Incidents 11 93.0000 -2.2206 0.0264 Double Hull* >Single Hull*
* = small sample size
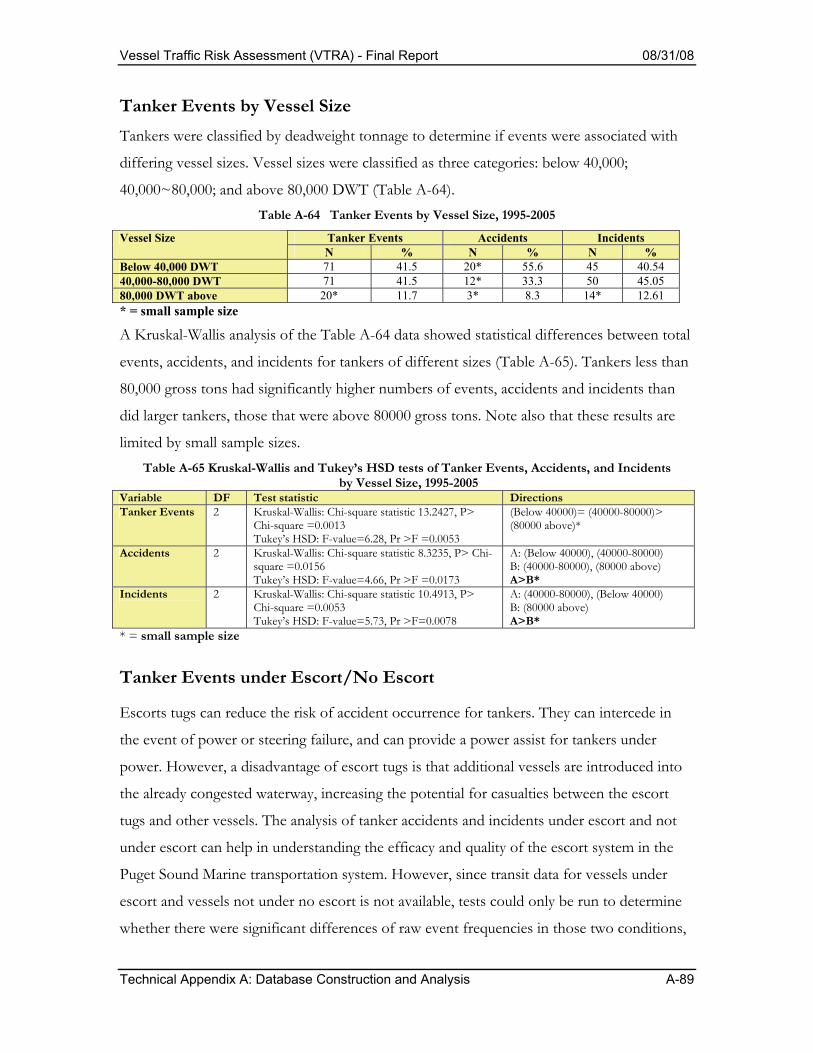
Vessel Traffic Risk Assessment (VTRA) - Final Report 08/31/08
Technical Appendix A: Database Construction and Analysis A-89
Tanker Events by Vessel Size Tankers were classified by deadweight tonnage to determine if events were associated with
differing vessel sizes. Vessel sizes were classified as three categories: below 40,000;
40,000~80,000; and above 80,000 DWT (Table A-64). Table A-64 Tanker Events by Vessel Size, 1995-2005
Tanker Events Accidents Incidents Vessel Size N % N % N %
Below 40,000 DWT 71 41.5 20* 55.6 45 40.54 40,000-80,000 DWT 71 41.5 12* 33.3 50 45.05 80,000 DWT above 20* 11.7 3* 8.3 14* 12.61 * = small sample size
A Kruskal-Wallis analysis of the Table A-64 data showed statistical differences between total
events, accidents, and incidents for tankers of different sizes (Table A-65). Tankers less than
80,000 gross tons had significantly higher numbers of events, accidents and incidents than
did larger tankers, those that were above 80000 gross tons. Note also that these results are
limited by small sample sizes. Table A-65 Kruskal-Wallis and Tukey’s HSD tests of Tanker Events, Accidents, and Incidents
by Vessel Size, 1995-2005 Variable DF Test statistic Directions Tanker Events 2 Kruskal-Wallis: Chi-square statistic 13.2427, P>
Chi-square =0.0013 Tukey’s HSD: F-value=6.28, Pr >F =0.0053
(Below 40000)= (40000-80000)> (80000 above)*
Accidents 2 Kruskal-Wallis: Chi-square statistic 8.3235, P> Chi-square =0.0156 Tukey’s HSD: F-value=4.66, Pr >F =0.0173
A: (Below 40000), (40000-80000) B: (40000-80000), (80000 above) A>B*
Incidents 2 Kruskal-Wallis: Chi-square statistic 10.4913, P> Chi-square =0.0053 Tukey’s HSD: F-value=5.73, Pr >F=0.0078
A: (40000-80000), (Below 40000) B: (80000 above) A>B*
* = small sample size
Tanker Events under Escort/No Escort
Escorts tugs can reduce the risk of accident occurrence for tankers. They can intercede in
the event of power or steering failure, and can provide a power assist for tankers under
power. However, a disadvantage of escort tugs is that additional vessels are introduced into
the already congested waterway, increasing the potential for casualties between the escort
tugs and other vessels. The analysis of tanker accidents and incidents under escort and not
under escort can help in understanding the efficacy and quality of the escort system in the
Puget Sound Marine transportation system. However, since transit data for vessels under
escort and vessels not under no escort is not available, tests could only be run to determine
whether there were significant differences of raw event frequencies in those two conditions,
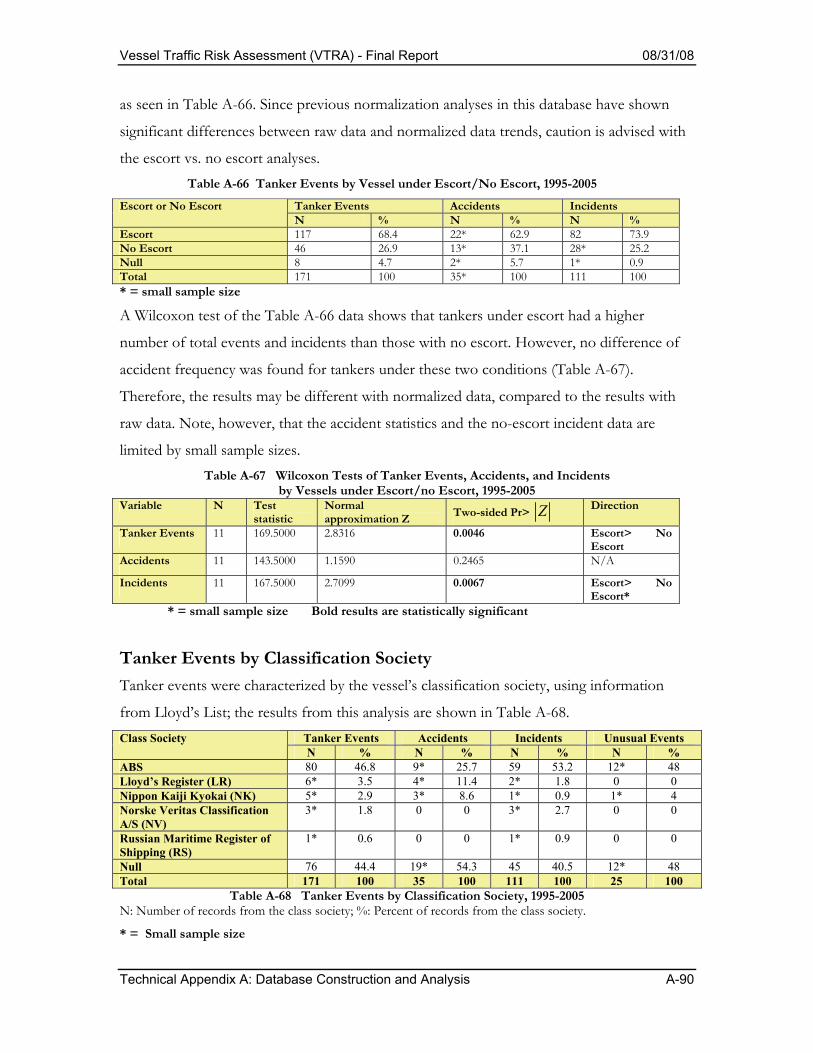
Vessel Traffic Risk Assessment (VTRA) - Final Report 08/31/08
Technical Appendix A: Database Construction and Analysis A-90
as seen in Table A-66. Since previous normalization analyses in this database have shown
significant differences between raw data and normalized data trends, caution is advised with
the escort vs. no escort analyses. Table A-66 Tanker Events by Vessel under Escort/No Escort, 1995-2005
Tanker Events Accidents Incidents Escort or No Escort N % N % N %
Escort 117 68.4 22* 62.9 82 73.9 No Escort 46 26.9 13* 37.1 28* 25.2 Null 8 4.7 2* 5.7 1* 0.9 Total 171 100 35* 100 111 100 * = small sample size
A Wilcoxon test of the Table A-66 data shows that tankers under escort had a higher
number of total events and incidents than those with no escort. However, no difference of
accident frequency was found for tankers under these two conditions (Table A-67).
Therefore, the results may be different with normalized data, compared to the results with
raw data. Note, however, that the accident statistics and the no-escort incident data are
limited by small sample sizes. Table A-67 Wilcoxon Tests of Tanker Events, Accidents, and Incidents
by Vessels under Escort/no Escort, 1995-2005 Variable N Test
statistic Normal approximation Z Two-sided Pr> Z Direction
Tanker Events 11 169.5000 2.8316 0.0046 Escort> No Escort
Accidents 11 143.5000 1.1590 0.2465 N/A
Incidents 11 167.5000 2.7099 0.0067 Escort> No Escort*
* = small sample size Bold results are statistically significant Tanker Events by Classification Society Tanker events were characterized by the vessel’s classification society, using information
from Lloyd’s List; the results from this analysis are shown in Table A-68. Tanker Events Accidents Incidents Unusual Events Class Society N % N % N % N %
ABS 80 46.8 9* 25.7 59 53.2 12* 48 Lloyd’s Register (LR) 6* 3.5 4* 11.4 2* 1.8 0 0 Nippon Kaiji Kyokai (NK) 5* 2.9 3* 8.6 1* 0.9 1* 4 Norske Veritas Classification A/S (NV)
3* 1.8 0 0 3* 2.7 0 0
Russian Maritime Register of Shipping (RS)
1* 0.6 0 0 1* 0.9 0 0
Null 76 44.4 19* 54.3 45 40.5 12* 48 Total 171 100 35 100 111 100 25 100
Table A-68 Tanker Events by Classification Society, 1995-2005 N: Number of records from the class society; %: Percent of records from the class society.
* = Small sample size
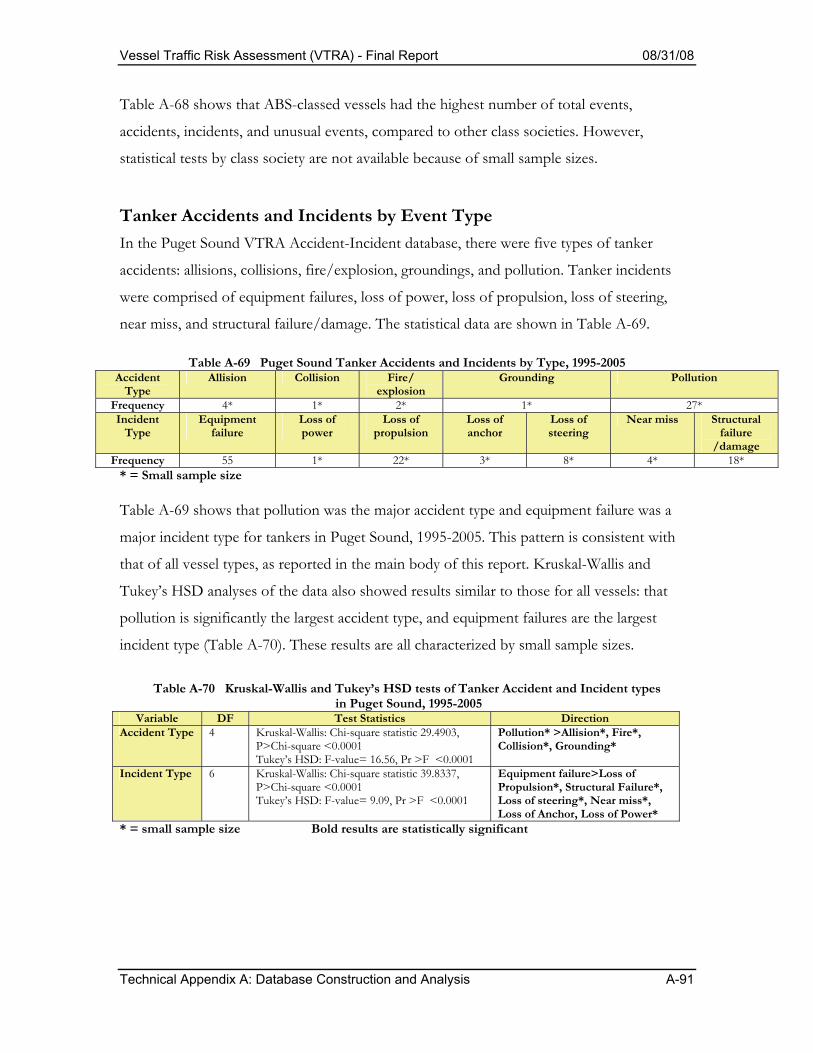
Vessel Traffic Risk Assessment (VTRA) - Final Report 08/31/08
Technical Appendix A: Database Construction and Analysis A-91
Table A-68 shows that ABS-classed vessels had the highest number of total events,
accidents, incidents, and unusual events, compared to other class societies. However,
statistical tests by class society are not available because of small sample sizes.
Tanker Accidents and Incidents by Event Type In the Puget Sound VTRA Accident-Incident database, there were five types of tanker
accidents: allisions, collisions, fire/explosion, groundings, and pollution. Tanker incidents
were comprised of equipment failures, loss of power, loss of propulsion, loss of steering,
near miss, and structural failure/damage. The statistical data are shown in Table A-69.
Table A-69 Puget Sound Tanker Accidents and Incidents by Type, 1995-2005 Accident
Type Allision Collision Fire/
explosion Grounding Pollution
Frequency 4* 1* 2* 1* 27* Incident
Type Equipment
failure Loss of power
Loss of propulsion
Loss of anchor
Loss of steering
Near miss Structural failure
/damage Frequency 55 1* 22* 3* 8* 4* 18*
* = Small sample size Table A-69 shows that pollution was the major accident type and equipment failure was a
major incident type for tankers in Puget Sound, 1995-2005. This pattern is consistent with
that of all vessel types, as reported in the main body of this report. Kruskal-Wallis and
Tukey’s HSD analyses of the data also showed results similar to those for all vessels: that
pollution is significantly the largest accident type, and equipment failures are the largest
incident type (Table A-70). These results are all characterized by small sample sizes.
Table A-70 Kruskal-Wallis and Tukey’s HSD tests of Tanker Accident and Incident types
in Puget Sound, 1995-2005 Variable DF Test Statistics Direction
Accident Type 4 Kruskal-Wallis: Chi-square statistic 29.4903, P>Chi-square <0.0001 Tukey’s HSD: F-value= 16.56, Pr >F <0.0001
Pollution* >Allision*, Fire*, Collision*, Grounding*
Incident Type 6 Kruskal-Wallis: Chi-square statistic 39.8337, P>Chi-square <0.0001 Tukey’s HSD: F-value= 9.09, Pr >F <0.0001
Equipment failure>Loss of Propulsion*, Structural Failure*, Loss of steering*, Near miss*, Loss of Anchor, Loss of Power*
* = small sample size Bold results are statistically significant

Vessel Traffic Risk Assessment (VTRA) - Final Report 08/31/08
Technical Appendix A: Database Construction and Analysis A-92
Tanker Events by Error Types The frequency of tanker total events, accidents, and incidents caused by human and
organizational error (HOE) and mechanical failure (MF) is shown in Table A-71.
Table A-71 Tanker Event Frequencies by Error Types, 1995-2005
Total Event Accident Incident Error N % N % N %
HOE 41 24.0 15* 42.9 8* 7.2 MF 113 66.1 13* 37.1 100 90.1 Weather 5* 2.9 2* 5.7 3 2.7 Insufficient Information
12* 7.0 5* 14.3 0 0
Total 171 100 35* 100 111 100 * = small sample size
Earlier, Table A-37 showed Wilcoxon test results with tankers having significantly more
events and incidents caused by mechanical failure than by human and organizational error;
there was no statistically significant difference in tanker accidents caused by human error,
compared to mechanical failure (Table A-72). With the exception of the event error types
(which showed no significant error type results), these results are consistent with those
shown for all vessels (Table A-37). However, these data are limited by small sample sizes.
Table A-72 Wilcoxon Tests of Tanker Events, Accidents, and Incidents by Error Type, 1995-2005
Variable N Test statistic
Normal approximation Z Two-sided Pr> Z Direction
Tanker Events 11 77.5000 -3.2350 0.0012 MF>HOE*
Accidents 11 127.5000 0.0698 0.9443 N/A
Incidents 11 75.0000 -3.4405 0.0006 MF>HOE*
* = small sample size
Summary of Puget Sound Tanker Events, Accidents and Incidents, 1995-2005 Analysis of tanker events, accidents, and incidents showed that 2001 had the highest number
of events and incidents, compared to other years. However, no statistical difference was
found for accident frequencies from years 1995-2005. Tests on normalized data showed that
2002 had the highest number of accidents, compared to other years. When tanker events by
season were analyzed, winter had the highest number of total events, accidents, and
incidents, compared to other seasons. No statistically significant difference was found
among the normalized data by season.

Vessel Traffic Risk Assessment (VTRA) - Final Report 08/31/08
Technical Appendix A: Database Construction and Analysis A-93
Analysis of tanker events by location showed that East and West Strait of Juan de Fuca had
the highest number of total events and incidents, compared to other locations, and Cherry
Point was found to have the highest number of accidents among locations. When analysis of
data in the East and West Straits of Juan de Fuca was undertaken, for events before and after
year 2000, Wilcoxon test results showed no statistically significant difference. These tanker
results are significantly different than the results reported for all vessels, which showed
South Puget Sound as the location with the highest number of events, accidents and
incidents.
Analysis of tanker events by time of day showed that tankers had a statistically higher
number of total events and incidents during the day than the night. In addition, U.S. flag,
double hull, and Under Escort vessels had higher numbers of total events and incidents,
compared to Non-U.S. flag, single hull, and No Escort vessels.
Analysis of tanker events by vessel size showed that small tankers (vessels below 40,000
DWT) had higher numbers of total events, accidents, and incidents, compared to vessels of
other sizes.
For tankers, pollution was the major accident type and equipment failures were the major
incident type, consistent with the results earlier reported for all vessel types. Analysis of
tanker events by accident types showed that tanker pollution accidents occurred statistically
more often than tanker accidents of other types. Similarly, analysis showed that tanker
equipment failure incidents occurred significantly more often than tanker incidents of other
types.
Analysis of tanker events by error type showed that tankers had higher number of total
events and incidents caused by mechanical failure, rather than human error. These results
were consistent with events by error type for all vessels in the Puget Sound VTRA Accident-
Incident database.The significant test results of tanker vessels events data in Puget Sound are
shown in Table A-72. Note that many of these data suffer from small sample sizes.

Vess
el T
raffi
c R
isk
Asse
ssm
ent (
VTR
A) -
Fina
l Rep
ort
08/3
1/08
Te
chni
cal A
ppen
dix
A: D
atab
ase
Con
stru
ctio
n an
d A
naly
sis
A-9
4
Tes
t R
esul
ts
Tes
t Use
d St
atis
tics
Dire
ctio
n T
anke
r E
vent
s T
here
are
sta
tistic
al d
iffer
ence
s in
ta
nker
eve
nts
by y
ear
for
year
s 19
95-2
005.
Kru
skal-
Wall
is Tu
key’s
HSD
Chi-s
quar
e st
atist
ic 2
4.11
19, D
F =
10,
Pr
>
Chi-s
quar
e =
0.00
73
F-va
lue=
3.62
, DF
= 1
0, P
r >F
<0.
0003
A:20
01 2
002
2004
200
3 19
95
B: 2
002
2004
200
3 19
95 2
000
1997
1999
1996
20
05 19
98
A>B
By
Year
Inci
dent
s T
here
are
sta
tistic
al d
iffer
ence
s in
ta
nker
inci
dent
s by
yea
r fo
r ye
ars
1995
-200
5.
Kru
skal-
Wall
is Tu
key’s
HSD
Chi-s
quar
e st
atist
ic 2
3.11
15, D
F =
10,
Pr
>
Chi-s
quar
e =
0.01
03
F-va
lue=
2.22
, DF
= 1
0, P
r >F
=0.
0207
A: 2
001 2
004
200
2 20
00 19
95 2
003
1999
19
96 19
97 2
005
B: 2
004
2002
200
0 19
95 2
003
1999
1996
1997
20
05 19
98
A>B
Tan
ker
Eve
nts
The
re a
re s
tatis
tical
diff
eren
ces
in
norm
aliz
ed
tank
er
even
ts
for
year
s 199
6-20
05.
Kru
skal-
Wall
is Tu
key’s
HSD
Chi-s
quar
e st
atist
ic 2
3.90
04,
DF
= 9
, Pr
>
Chi-s
quar
e =
0.00
45
F-va
lue=
3.69
, DF
= 9
, Pr >
F =
0.00
05
A: 2
002
2003
200
5 19
96 2
004
B
: 200
3 20
05 19
96 2
004
1998
200
1 199
7 20
00
1999
A>
B
By
Year
(n
orm
aliz
ed)
Inci
dent
s T
here
are
sta
tistic
al d
iffer
ence
s in
no
rmal
ized
tan
ker
inci
dent
s fo
r ye
ar 19
96-2
005.
Kru
skal-
Wall
is Tu
key’s
HSD
Chi-s
quar
e st
atist
ic 2
2.56
24,
DF
= 9
, Pr
>
Chi-s
quar
e =
0.00
73
F-va
lue=
2.50
, DF
= 9
, Pr >
F =
0.01
20
A: 2
002
2003
1996
200
5 20
01 2
004
1998
1997
20
00
B: 2
003
1996
200
5 20
01 2
004
1998
1997
200
0 19
99
A>B
By
Loca
tion
Tan
ker
Eve
nts
The
re a
re s
tatis
tical
diff
eren
ces
in
tank
er e
vent
s by
loca
tion
for y
ears
19
95-2
005.
Kru
skal-
Wall
is Tu
key’s
HSD
Chi-s
quar
e st
atist
ic 4
7.59
30,
DF
= 9
, Pr
>
Chi-s
quar
e <
0.00
01
F-va
lue=
7.36
, DF
= 9
, Pr >
F <
0.00
01
A: E
ast S
trait
of Ju
an d
e Fu
ca, W
est
Stra
it of
Juan
de
Fuca
B: W
est S
trait
of Ju
an d
e Fu
ca, C
herr
y po
int,
Gue
mes
Cha
nnel
, Sou
th P
uget
So
und,
Sad
dleb
ag C
: Che
rry
poin
t, G
uem
es C
hann
el, S
outh
Pug
et
Soun
d, S
addl
ebag
, Nor
th P
uget
So
und,
Ros
ario
Stra
it, H
aro
Stra
it,
San
Juan
Isla
nds
A>
B>C

Vess
el T
raffi
c R
isk
Asse
ssm
ent (
VTR
A) -
Fina
l Rep
ort
08/3
1/08
Te
chni
cal A
ppen
dix
A: D
atab
ase
Con
stru
ctio
n an
d A
naly
sis
A-9
5
Tes
t R
esul
ts
Tes
t Use
d St
atis
tics
Dire
ctio
n Ac
cide
nts
The
re a
re s
tatis
tical
diff
eren
ces
in
tank
er a
ccid
ents
by
loca
tion
for
year
s 199
5-20
05.
Kru
skal-
Wall
is Tu
key’s
HSD
Chi-s
quar
e st
atist
ic 2
2.44
11,
DF
= 9
, Pr
>
Chi-s
quar
e =
0.00
76
F-va
lue=
2.65
, DF
= 9
, Pr >
F =
0.00
86
A: C
herr
y Po
int,
Eas
t Stra
it of
Juan
de
Fuc
a, S
outh
Pug
et S
ound
, G
uem
es C
hann
el, W
est S
trait
of Ju
an
de F
uca,
Ros
ario
Stra
it, N
orth
Pug
et
Soun
d, H
aro
Stra
it B
: Eas
t Stra
it of
Ju
an d
e Fu
ca, S
outh
Pug
et S
ound
, G
uem
es C
hann
el, W
est S
trait
of Ju
an
de F
uca,
Ros
ario
Stra
it, N
orth
Pug
et
Soun
d, H
aro
Stra
it, S
addl
ebag
, San
Ju
an Is
land
s A
>B
Inci
dent
s T
here
are
sta
tistic
al d
iffer
ence
s in
ta
nker
in
cide
nts
by
loca
tion
amon
g th
e 10
geo
grap
hic
area
s fo
r yea
rs 19
95-2
005.
Kru
skal-
Wall
is Tu
key’s
HSD
Chi-s
quar
e st
atist
ic 4
6.05
65,
DF
= 9
, Pr
>
Chi-s
quar
e <
0.00
01
F-va
lue=
8.31
, DF
= 9
, Pr >
F <
0.00
01
A: E
ast S
trait
of Ju
an d
e Fu
ca, W
est
Stra
it of
Juan
de
Fuca
B: W
est S
trait
of Ju
an d
e Fu
ca, C
herr
y po
int C
: C
herr
y po
int,
Gue
mes
Cha
nnel
, So
uth
Puge
t Sou
nd, S
addl
ebag
, Har
o St
rait,
Ros
ario
Stra
it, N
orth
Pug
et
Soun
d, S
an Ju
an Is
land
s A
>B>
C T
anke
r E
vent
T
here
are
sta
tistic
al d
iffer
ence
s in
ta
nker
eve
nts
by s
easo
n fo
r ye
ars
1995
-200
5.
Kru
skal-
Wall
is Tu
key’s
HSD
Chi-s
quar
e st
atist
ic 24
.896
5,
DF
=3,
Pr
<0.
0001
F-
valu
e=10
.79,
DF
= 3
, Pr >
F =
0.00
01
A: W
inte
r Sum
mer
B
: Sum
mer
Aut
umn
C
: Aut
umn
Sprin
g
A>B
>C
Acci
dent
s T
here
are
sta
tistic
al d
iffer
ence
s in
ta
nker
ac
cide
nts
by
seas
on
for
year
s 199
5-20
05.
Kru
skal-
Wall
is Tu
key’s
HSD
Chi-s
quar
e st
atist
ic 9.
6246
, D
F =
3,
Pr=
0.02
20
F-va
lue=
3.84
, DF
= 3
, Pr >
F =
0.01
66
A: W
inte
r Sum
mer
B
: Sum
mer
Spr
ing
Autu
mn
A>B
By
Seas
on
Inci
dent
s T
here
are
sta
tistic
al d
iffer
ence
s in
ta
nker
in
cide
nts
by
seas
on
for
year
s 199
5-20
05.
Kru
skal-
Wall
is Tu
key’s
HSD
Chi-s
quar
e st
atist
ic 18
.987
6,
DF
=3,
Pr
=0.
0003
F-
valu
e=11
.62,
DF
= 3
, Pr >
F <
0.00
01
A: W
inte
r B
: Sum
mer
Spr
ing
Autu
mn
A>B
By
Tim
e of
Day
T
anke
r E
vent
s T
anke
r ev
ents
oc
curr
ed
mor
e of
ten
durin
g th
e da
y th
an
the
nigh
t for
yea
rs 19
95-2
005
Wilc
oxon
St
atist
ic 15
8.00
00,
Nor
mal
App
roxi
mat
ion
z= 2
.118
1, P
r> z
=0.
0342
D
ay>N
ight
In
cide
nts
Tan
ker
inci
dent
s oc
curr
ed m
ore
ofte
n du
ring
the
day
than
th
e ni
ght f
or y
ears
1995
-200
5.
Wilc
oxon
St
atist
ic 16
1.50
00,
Nor
mal
App
roxi
mat
ion
z= 2
.355
5, P
r> z
=0.
0185
D
ay>N
ight

Vess
el T
raffi
c R
isk
Asse
ssm
ent (
VTR
A) -
Fina
l Rep
ort
08/3
1/08
Te
chni
cal A
ppen
dix
A: D
atab
ase
Con
stru
ctio
n an
d A
naly
sis
A-9
6
Tes
t R
esul
ts
Tes
t Use
d St
atis
tics
Dire
ctio
n
T
anke
r E
vent
s U
.S.
flag
tank
ers
have
hi
gher
ev
ent
frequ
enci
es
than
ta
nker
s th
at a
re n
ot U
.S.
flag
for
year
s 19
95-2
005.
Wilc
oxon
St
atist
ic 17
8.50
00,
Nor
mal
App
roxi
mat
ion
z= 3
.424
3, P
r> z
=0.
0006
U
S.>N
on U
.S.
By
Flag
(U
.S.
Flag
vs.
N
on U
.S. F
lag)
Inci
dent
s U
.S.
flag
tank
ers
have
hi
gher
in
cide
nt f
requ
enci
es t
han
tank
ers
that
are
not
U.S
. fla
g fo
r ye
ars
1995
-200
5.
Wilc
oxon
St
atist
ic 17
8.00
00,
Nor
mal
App
roxi
mat
ion
z= 3
.416
7, P
r> z
=0.
0006
U
.S.>
Non
U.S
.
Tan
ker
Eve
nts
Tan
kers
> 8
0000
DW
T a
nd a
bove
ha
d lo
wer
num
ber
of t
otal
eve
nt
frequ
enci
es t
han
tank
er <
800
00
DW
T fo
r yea
rs 19
95-2
005.
Kru
skal-
Wall
is
Tuke
y’s H
SD
Chi-s
quar
e st
atist
ic 13
.242
7,
DF
=2,
P=
0.00
13
F-va
lue=
6.28
, DF
= 2
, Pr >
F =
0.00
53
(Bel
ow
4000
0)=
(4
0000
-800
00)>
(8
0000
ab
ove)
Acci
dent
s T
anke
rs
with
di
ffere
nt
dead
wei
ght
tonn
ages
ha
d di
ffere
nt a
ccid
ent
frequ
enci
es f
or
year
s 199
5-20
05
Kru
skal-
Wall
is
Tuke
y’s H
SD
Chi-s
quar
e st
atist
ic 8.
3235
, DF
=2,
P=
0.01
56
F-va
lue=
4.66
, DF
=2,
Pr >
F =
0.01
73
A: (B
elow
400
00),
(400
00-8
0000
) B
: (40
000-
8000
0), (
8000
0 ab
ove)
A>
B
By
Vess
el S
ize
Inci
dent
s T
anke
rs
with
di
ffere
nt
dead
wei
ght
tonn
ages
ha
d di
ffere
nt i
ncid
ent
frequ
enci
es f
or
year
s 199
5-20
05.
Kru
skal-
Wall
is
Tuke
y’s H
SD
Chi-s
quar
e st
atist
ic 10
.491
3,
DF
=2,
P=
0.00
53
F-va
lue=
5.73
, DF
=2,
Pr >
F=0.
0078
A: (4
0000
-800
00),
(Bel
ow 4
0000
) B
: (80
000
abov
e)
Tan
ker
Eve
nts
Tan
kers
w
ith
doub
le
hull
has
high
er
num
ber
of
even
ts
frequ
ency
th
an
tank
ers
with
si
ngle
hul
l
Wilc
oxon
St
atist
ic 9
1.00
00, N
orm
al A
ppro
xim
atio
n z=
-2
.339
0, P
r> z
=0.
0193
D
oubl
e H
ull*
>Sin
gle
Hul
l*
Acci
dent
s T
anke
rs
with
do
uble
hu
ll ha
s hi
gher
nu
mbe
r of
ac
cide
nts
frequ
ency
th
an
tank
ers
with
si
ngle
hul
l
Wilc
oxon
St
atist
ic 9
4.50
00, N
orm
al A
ppro
xim
atio
n z=
-2
.222
6, P
r> z
=0.
0262
D
oubl
e H
ull*
>Sin
gle
Hul
l*
By
Hul
l Typ
e
Inci
dent
s T
anke
rs
with
do
uble
hu
ll ha
s hi
gher
nu
mbe
r of
in
cide
nts
frequ
ency
th
an
tank
ers
with
si
ngle
hul
l
Wilc
oxon
St
atist
ic 9
3.00
00, N
orm
al A
ppro
xim
atio
n z=
-2
.220
6, P
r> z
=0.
0264
D
oubl
e H
ull*
>Sin
gle
Hul
l*
Tan
ker
Eve
nts
Tan
kers
und
er e
scor
t ha
d hi
gher
nu
mbe
r ev
ent
frequ
enci
es
than
di
d ta
nker
s w
ith
no
esco
rt fo
r ye
ars 1
995-
2005
.
Wilc
oxon
St
atist
ic 16
9.50
00,
Nor
mal
App
roxi
mat
ion
z= 2
.831
6, P
r> z
=0.
0046
E
scor
t> N
o E
scor
t B
y E
scor
t vs
. N
o E
scor
t
Inci
dent
s T
anke
rs u
nder
esc
ort
had
high
er
inci
dent
fre
quen
cies
th
an
did
tank
ers
with
out
esco
rt fo
r ye
ars
1995
-200
5.
Wilc
oxon
St
atist
ic 16
7.50
00,
Nor
mal
App
roxi
mat
ion
z= 2
.709
9, P
r> z
=0.
0067
E
scor
t> N
o E
scor
t

Vess
el T
raffi
c R
isk
Asse
ssm
ent (
VTR
A) -
Fina
l Rep
ort
08/3
1/08
Te
chni
cal A
ppen
dix
A: D
atab
ase
Con
stru
ctio
n an
d A
naly
sis
A-9
7
Tes
t R
esul
ts
Tes
t Use
d St
atis
tics
Dire
ctio
n B
y Ac
cide
nt/I
ncid
ent
Typ
e Ac
cide
nts
Tan
ker
acci
dent
s ca
used
by
po
llutio
n ha
d st
atis
tical
ly h
ighe
r fre
quen
cies
tha
n di
d ot
her
tank
er
acci
dent
type
s for
yea
rs 19
95-2
005.
Kru
skal-
Wall
is
Tuke
y’s H
SD
Chi-s
quar
e st
atist
ic 2
9.49
03, P
>Ch
i-squ
are
<0.
0001
F-va
lue=
16.
56, P
r >F
<0.
0001
Pollu
tion>
Allis
ion,
Fire
, Col
lisio
n,
Gro
undi
ng
In
cide
nts
Tan
ker
inci
dent
s ca
used
by
eq
uipm
ent
failu
res
had
stat
istic
ally
hi
gher
fre
quen
cies
th
an
did
othe
r ta
nker
in
cide
nt
type
s for
yea
rs 19
95-2
005.
Kru
skal-
Wall
is
Tuke
y’s H
SD
Chi-s
quar
e st
atist
ic 3
9.83
37, P
>Ch
i-squ
are
<0.
0001
F-va
lue=
9.0
9, P
r >F
<0.
0001
Equ
ipm
ent f
ailu
re>L
oss o
f Pro
puls
ion,
St
ruct
ural
Fai
lure
, Los
s of s
teer
ing,
Nea
r m
iss,
Los
s of A
ncho
r, Lo
ss o
f Pow
er
Tan
ker
Eve
nts
Tan
kers
ha
d si
gnifi
cant
ly
mor
e ev
ents
ca
used
by
M
F th
an
by
HO
E fo
r yea
rs 19
95-2
005.
Wilc
oxon
St
atist
ic 7
7.50
00, N
orm
al A
ppro
xim
atio
n z=
-3
.235
0, P
r> z
=0.
0012
M
F>H
OE
B
y E
rror
Typ
e (H
OE
vs
. Mec
hani
cal)
Inci
dent
s T
anke
rs
had
sign
ifica
ntly
m
ore
inci
dent
s ca
used
by
MF
than
by
HO
E fo
r yea
rs 19
95-2
005.
Wilc
oxon
St
atist
ic 7
5.00
00, N
orm
al A
ppro
xim
atio
n z=
-3
.440
5, P
r> z
=0.
0006
M
F>H
OE
Tab
le A
-73:
Sum
mar
y of
Sig
nific
ant P
uget
Sou
nd T
anke
r Res
ults
for E
vent
s, A
ccid
ents
and
Inci
dent
Fre
quen
cies
, 199
5-20
05
Vessel Traffic Risk Assessment (VTRA) - Final Report 08/31/08
Technical Appendix A: Database Construction and Analysis A-98
Appendix A-2 Puget Sound Tug-Barge Events, Accidents and Incident Analysis
1995-2005
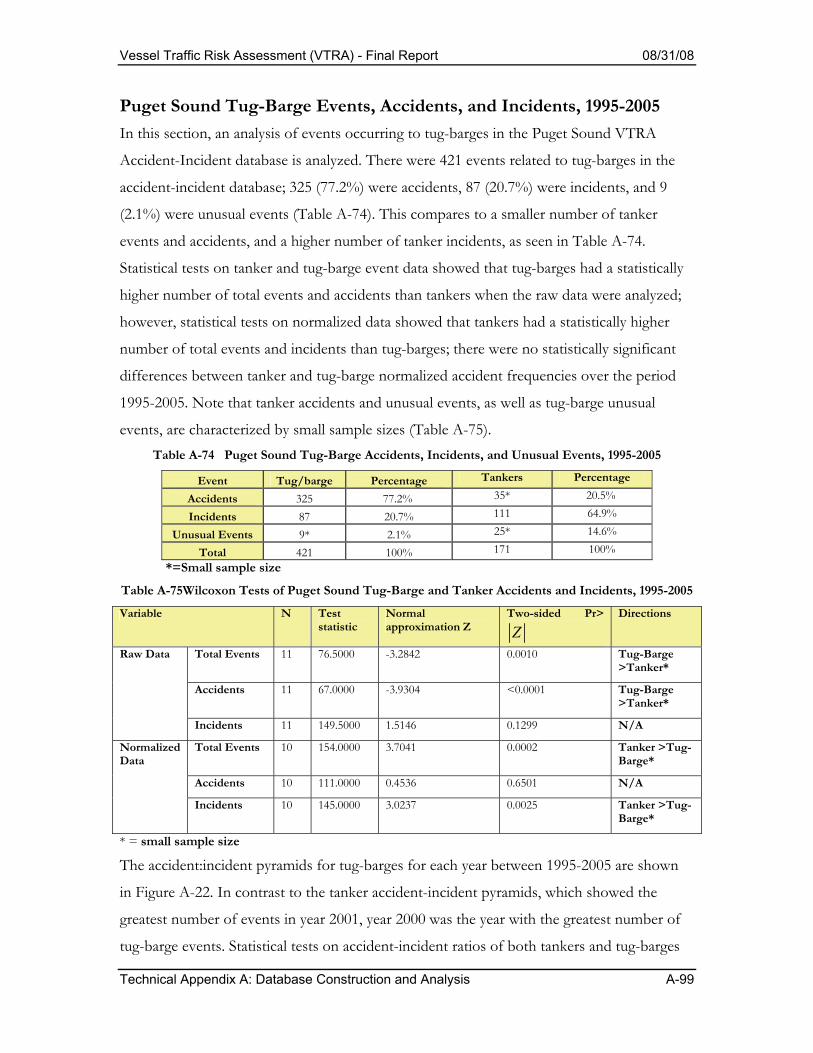
Vessel Traffic Risk Assessment (VTRA) - Final Report 08/31/08
Technical Appendix A: Database Construction and Analysis A-99
Puget Sound Tug-Barge Events, Accidents, and Incidents, 1995-2005 In this section, an analysis of events occurring to tug-barges in the Puget Sound VTRA
Accident-Incident database is analyzed. There were 421 events related to tug-barges in the
accident-incident database; 325 (77.2%) were accidents, 87 (20.7%) were incidents, and 9
(2.1%) were unusual events (Table A-74). This compares to a smaller number of tanker
events and accidents, and a higher number of tanker incidents, as seen in Table A-74.
Statistical tests on tanker and tug-barge event data showed that tug-barges had a statistically
higher number of total events and accidents than tankers when the raw data were analyzed;
however, statistical tests on normalized data showed that tankers had a statistically higher
number of total events and incidents than tug-barges; there were no statistically significant
differences between tanker and tug-barge normalized accident frequencies over the period
1995-2005. Note that tanker accidents and unusual events, as well as tug-barge unusual
events, are characterized by small sample sizes (Table A-75). Table A-74 Puget Sound Tug-Barge Accidents, Incidents, and Unusual Events, 1995-2005
Event Tug/barge Percentage Tankers Percentage
Accidents 325 77.2% 35* 20.5%
Incidents 87 20.7% 111 64.9%
Unusual Events 9* 2.1% 25* 14.6%
Total 421 100% 171 100% *=Small sample size
Table A-75Wilcoxon Tests of Puget Sound Tug-Barge and Tanker Accidents and Incidents, 1995-2005
Variable N Test statistic
Normal approximation Z
Two-sided Pr>
Z
Directions
Total Events 11 76.5000 -3.2842 0.0010 Tug-Barge >Tanker*
Accidents 11 67.0000 -3.9304 <0.0001 Tug-Barge >Tanker*
Raw Data
Incidents 11 149.5000 1.5146 0.1299 N/A
Total Events 10 154.0000 3.7041 0.0002 Tanker >Tug-Barge*
Accidents 10 111.0000 0.4536 0.6501 N/A
Normalized Data
Incidents 10 145.0000 3.0237 0.0025 Tanker >Tug-Barge*
* = small sample size
The accident:incident pyramids for tug-barges for each year between 1995-2005 are shown
in Figure A-22. In contrast to the tanker accident-incident pyramids, which showed the
greatest number of events in year 2001, year 2000 was the year with the greatest number of
tug-barge events. Statistical tests on accident-incident ratios of both tankers and tug-barges
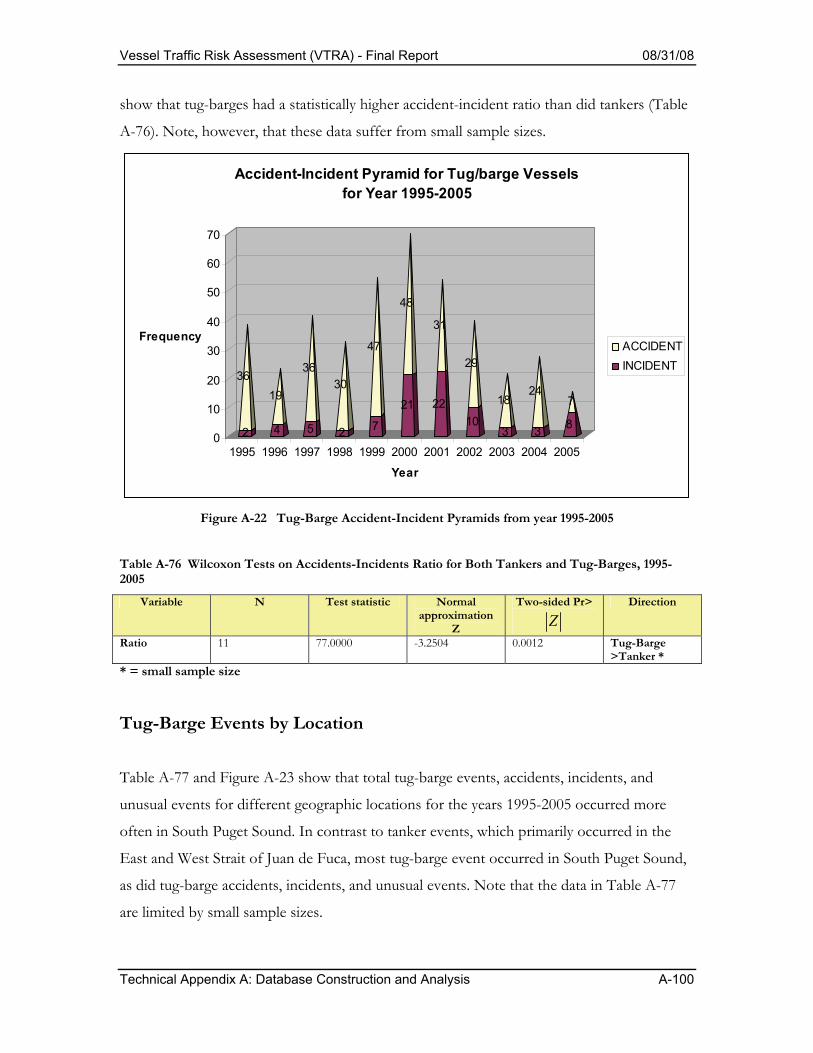
Vessel Traffic Risk Assessment (VTRA) - Final Report 08/31/08
Technical Appendix A: Database Construction and Analysis A-100
show that tug-barges had a statistically higher accident-incident ratio than did tankers (Table
A-76). Note, however, that these data suffer from small sample sizes.
2
36
4
19
5
36
2
30
7
47
21
48
22
31
10
29
3
18
3
24
8
7
0
10
20
30
40
50
60
70
Frequency
1995 1996 1997 1998 1999 2000 2001 2002 2003 2004 2005
Year
Accident-Incident Pyramid for Tug/barge Vessels for Year 1995-2005
ACCIDENTINCIDENT
Figure A-22 Tug-Barge Accident-Incident Pyramids from year 1995-2005
Table A-76 Wilcoxon Tests on Accidents-Incidents Ratio for Both Tankers and Tug-Barges, 1995-2005
Variable N Test statistic Normal approximation
Z
Two-sided Pr>
Z
Direction
Ratio 11 77.0000 -3.2504 0.0012 Tug-Barge >Tanker *
* = small sample size
Tug-Barge Events by Location
Table A-77 and Figure A-23 show that total tug-barge events, accidents, incidents, and
unusual events for different geographic locations for the years 1995-2005 occurred more
often in South Puget Sound. In contrast to tanker events, which primarily occurred in the
East and West Strait of Juan de Fuca, most tug-barge event occurred in South Puget Sound,
as did tug-barge accidents, incidents, and unusual events. Note that the data in Table A-77
are limited by small sample sizes.
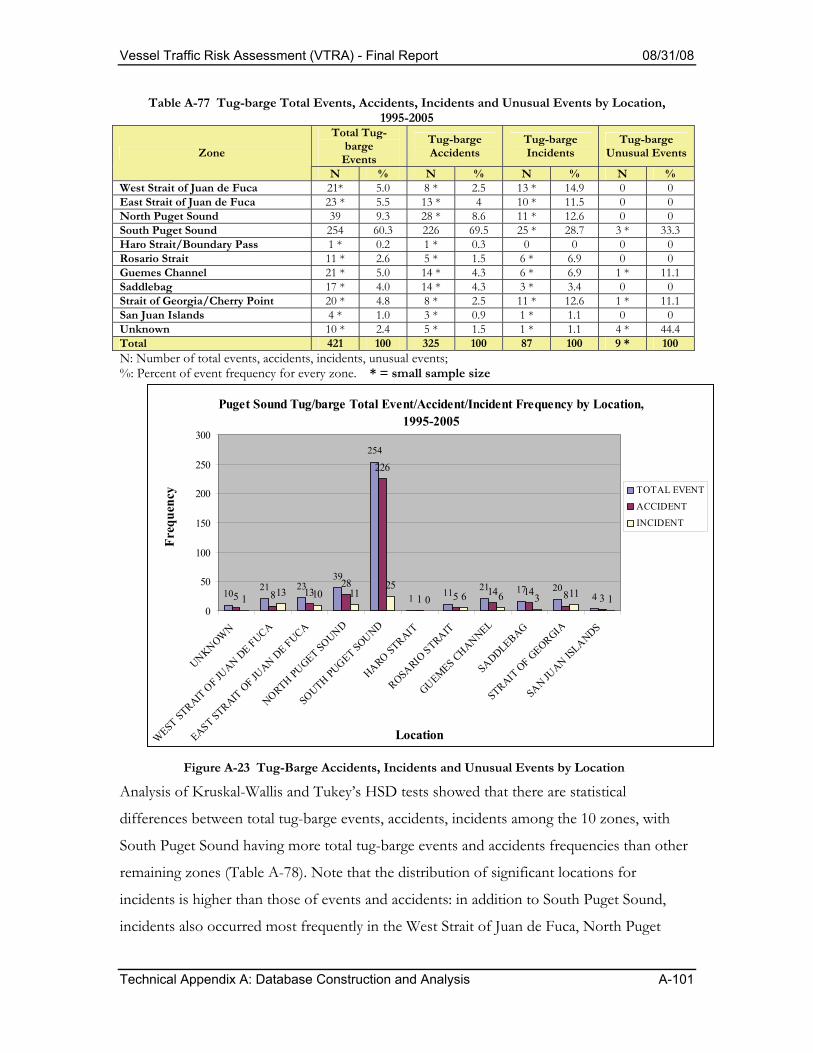
Vessel Traffic Risk Assessment (VTRA) - Final Report 08/31/08
Technical Appendix A: Database Construction and Analysis A-101
Table A-77 Tug-barge Total Events, Accidents, Incidents and Unusual Events by Location, 1995-2005
Total Tug-barge
Events
Tug-barge Accidents
Tug-barge Incidents
Tug-barge Unusual EventsZone
N % N % N % N % West Strait of Juan de Fuca 21* 5.0 8 * 2.5 13 * 14.9 0 0 East Strait of Juan de Fuca 23 * 5.5 13 * 4 10 * 11.5 0 0 North Puget Sound 39 9.3 28 * 8.6 11 * 12.6 0 0 South Puget Sound 254 60.3 226 69.5 25 * 28.7 3 * 33.3 Haro Strait/Boundary Pass 1 * 0.2 1 * 0.3 0 0 0 0 Rosario Strait 11 * 2.6 5 * 1.5 6 * 6.9 0 0 Guemes Channel 21 * 5.0 14 * 4.3 6 * 6.9 1 * 11.1 Saddlebag 17 * 4.0 14 * 4.3 3 * 3.4 0 0 Strait of Georgia/Cherry Point 20 * 4.8 8 * 2.5 11 * 12.6 1 * 11.1 San Juan Islands 4 * 1.0 3 * 0.9 1 * 1.1 0 0 Unknown 10 * 2.4 5 * 1.5 1 * 1.1 4 * 44.4 Total 421 100 325 100 87 100 9 * 100 N: Number of total events, accidents, incidents, unusual events; %: Percent of event frequency for every zone. * = small sample size
Puget Sound Tug/barge Total Event/Accident/Incident Frequency by Location, 1995-2005
1021 23
39
254
1 11 21 17 2045 8 13
28
226
1 5 14 14 8 31 13 10 1125
0 6 6 3 11 10
50
100
150
200
250
300
UNKNOWN
WEST STRAIT
OF JU
AN DE FUCA
EAST STRAIT OF JU
AN DE FUCA
NORTH PUGET SOUND
SOUTH PUGET SOUND
HARO STRAIT
ROSARIO STRAIT
GUEMES CHANNEL
SADDLEBAG
STRAIT OF G
EORGIA
SAN JUAN IS
LANDS
Location
Freq
uenc
y TOTAL EVENT
ACCIDENT
INCIDENT
Figure A-23 Tug-Barge Accidents, Incidents and Unusual Events by Location
Analysis of Kruskal-Wallis and Tukey’s HSD tests showed that there are statistical
differences between total tug-barge events, accidents, incidents among the 10 zones, with
South Puget Sound having more total tug-barge events and accidents frequencies than other
remaining zones (Table A-78). Note that the distribution of significant locations for
incidents is higher than those of events and accidents: in addition to South Puget Sound,
incidents also occurred most frequently in the West Strait of Juan de Fuca, North Puget
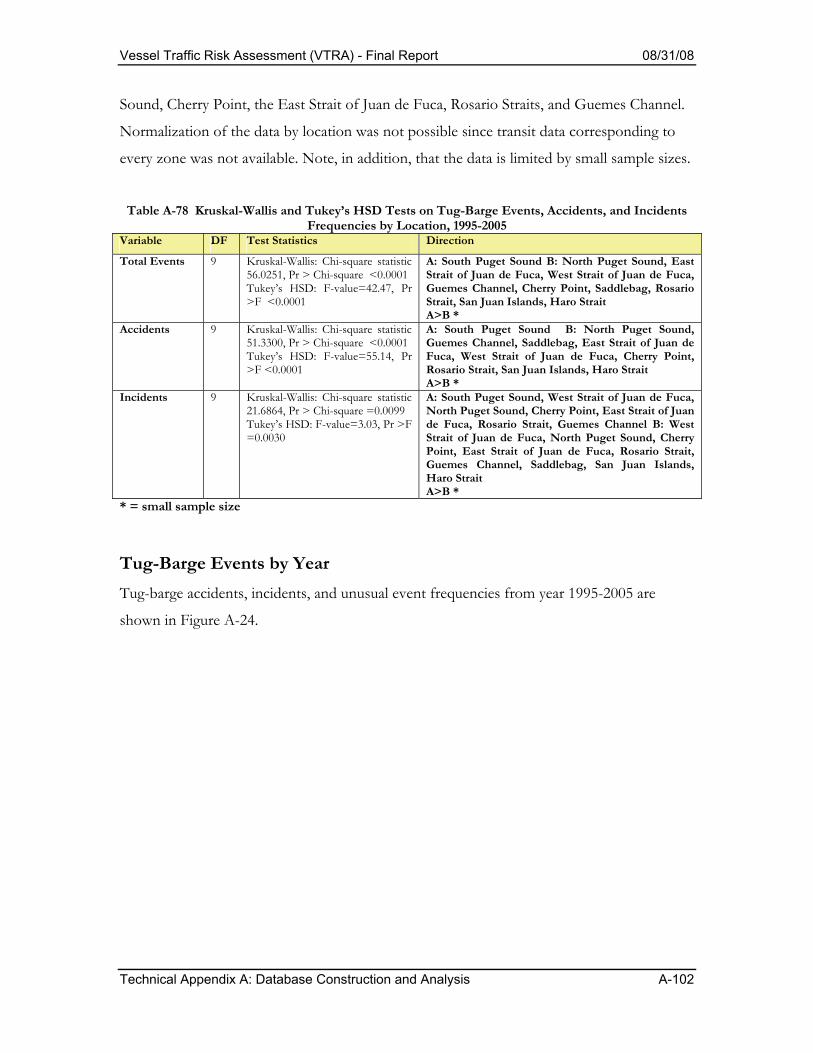
Vessel Traffic Risk Assessment (VTRA) - Final Report 08/31/08
Technical Appendix A: Database Construction and Analysis A-102
Sound, Cherry Point, the East Strait of Juan de Fuca, Rosario Straits, and Guemes Channel.
Normalization of the data by location was not possible since transit data corresponding to
every zone was not available. Note, in addition, that the data is limited by small sample sizes.
Table A-78 Kruskal-Wallis and Tukey’s HSD Tests on Tug-Barge Events, Accidents, and Incidents
Frequencies by Location, 1995-2005 Variable DF Test Statistics Direction
Total Events 9 Kruskal-Wallis: Chi-square statistic 56.0251, Pr > Chi-square <0.0001 Tukey’s HSD: F-value=42.47, Pr >F <0.0001
A: South Puget Sound B: North Puget Sound, East Strait of Juan de Fuca, West Strait of Juan de Fuca, Guemes Channel, Cherry Point, Saddlebag, Rosario Strait, San Juan Islands, Haro Strait A>B *
Accidents 9 Kruskal-Wallis: Chi-square statistic 51.3300, Pr > Chi-square <0.0001 Tukey’s HSD: F-value=55.14, Pr >F <0.0001
A: South Puget Sound B: North Puget Sound, Guemes Channel, Saddlebag, East Strait of Juan de Fuca, West Strait of Juan de Fuca, Cherry Point, Rosario Strait, San Juan Islands, Haro Strait A>B *
Incidents 9 Kruskal-Wallis: Chi-square statistic 21.6864, Pr > Chi-square =0.0099 Tukey’s HSD: F-value=3.03, Pr >F =0.0030
A: South Puget Sound, West Strait of Juan de Fuca, North Puget Sound, Cherry Point, East Strait of Juan de Fuca, Rosario Strait, Guemes Channel B: West Strait of Juan de Fuca, North Puget Sound, Cherry Point, East Strait of Juan de Fuca, Rosario Strait, Guemes Channel, Saddlebag, San Juan Islands, Haro Strait A>B *
* = small sample size
Tug-Barge Events by Year Tug-barge accidents, incidents, and unusual event frequencies from year 1995-2005 are
shown in Figure A-24.
Vessel Traffic Risk Assessment (VTRA) - Final Report 08/31/08
Technical Appendix A: Database Construction and Analysis A-103
Puget Sound Tug/barge Vessel Total Event/Accident/Incident by Year
41
23
42
32
54
69
57
39
2227
15
36
19
3630
47 48
31 29
1824
72 4 5
27
21 22
103 3
8
0
10
20
30
40
50
60
70
80
1995 1996 1997 1998 1999 2000 2001 2002 2003 2004 2005
Year
Freq
uenc
y TOTAL EVENTACCIDENTINCIDENT
Figure A-24 Tug-Barge Accidents, Incidents and Unusual Events by Year, 1995-2005
Kruskal-Wallis and Tukey’s HSD tests show that year 2000 had the highest number of
events and accidents, while year 2001 had the highest number of incidents from 1995-2005.
Tests on the normalized data showed that year 2001 had the highest number of normalized
events and accidents, while year 2002 had the highest number of normalized incidents.
These results are in contrast to the tanker results in the previous section, which showed that
years 2001 and 2002 had significantly higher number of raw and normalized events,
accidents, and incidents. Note that the results in Tables A-79 and A-80 are both limited by
small sample sizes for accidents and incidents.
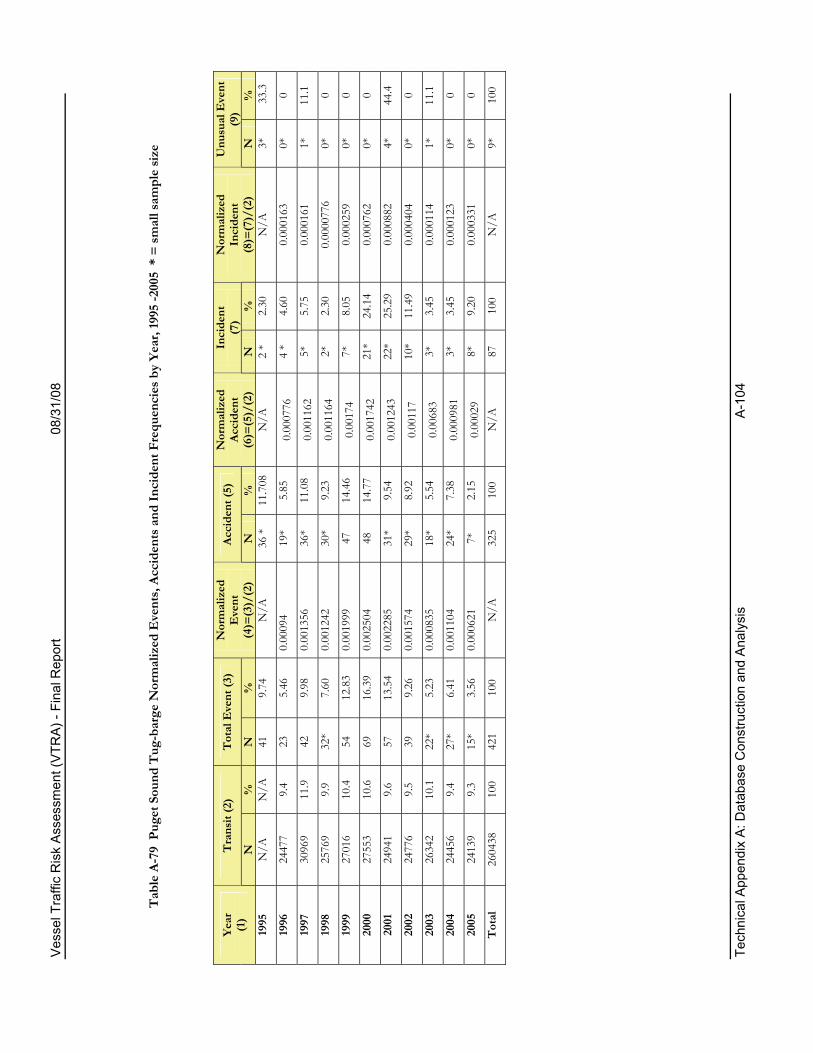
Vess
el T
raffi
c R
isk
Asse
ssm
ent (
VTR
A) -
Fina
l Rep
ort
08/3
1/08
Te
chni
cal A
ppen
dix
A: D
atab
ase
Con
stru
ctio
n an
d A
naly
sis
A-1
04
T
able
A-7
9 P
uget
Sou
nd T
ug-b
arge
Nor
mal
ized
Eve
nts,
Acc
iden
ts a
nd In
cide
nt F
requ
enci
es b
y Ye
ar, 1
995
-200
5 *
= sm
all s
ampl
e si
ze
Tra
nsit
(2)
Tot
al E
vent
(3)
Acci
dent
(5)
Inci
dent
(7
) U
nusu
al E
vent
(9
) Ye
ar
(1)
N
%
N
%
Nor
mal
ized
E
vent
(4
)=(3
)/(2
) N
%
Nor
mal
ized
Ac
cide
nt
(6)=
(5)/
(2)
N
%
Nor
mal
ized
In
cide
nt
(8)=
(7)/
(2)
N
%
1995
N
/A
N/A
41
9.
74
N/A
36
*
11.7
08
N/A
2
*
2.30
N
/A
3*
33.
3
1996
24
477
9.4
23
5.46
0.
0009
4 19
*
5.85
0.
0007
76
4 *
4.
60
0.00
0163
0*
0
1997
30
969
11.9
42
9.
98
0.00
1356
36
*
11.0
8 0.
0011
62
5*
5.75
0.
0001
61
1*
11.1
1998
25
769
9.9
32*
7.
60
0.00
1242
30
*
9.23
0.
0011
64
2*
2.30
0.
0000
776
0*
0
1999
27
016
10.4
54
12
.83
0.00
1999
47
14
.46
0.00
174
7*
8.05
0.
0002
59
0*
0
2000
27
553
10.6
69
16
.39
0.00
2504
48
14
.77
0.00
1742
21
*
24.1
4 0.
0007
62
0*
0
2001
24
941
9.6
57
13.5
4 0.
0022
85
31*
9.
54
0.00
1243
22
*
25.2
9 0.
0008
82
4*
44.4
2002
24
776
9.5
39
9.26
0.
0015
74
29*
8.
92
0.00
117
10*
11
.49
0.00
0404
0*
0
2003
26
342
10.1
22
*
5.23
0.
0008
35
18*
5.
54
0.00
683
3*
3.45
0.
0001
14
1*
11.1
2004
24
456
9.4
27*
6.41
0.
0011
04
24*
7.
38
0.00
0981
3*
3.
45
0.00
0123
0*
0
2005
24
139
9.3
15*
3.
56
0.00
0621
7*
2.
15
0.00
029
8*
9.20
0.
0003
31
0*
0
Tot
al
2604
38
100
421
100
N/A
32
5 10
0 N
/A
87
100
N/A
9*
10
0
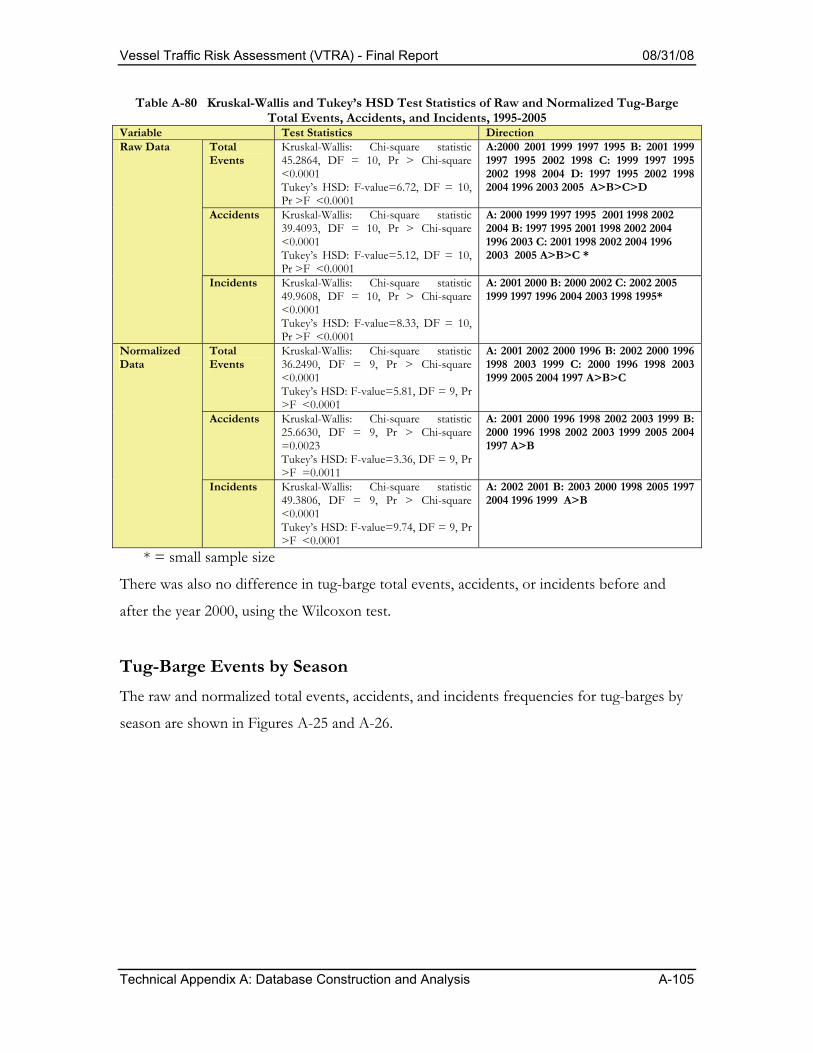
Vessel Traffic Risk Assessment (VTRA) - Final Report 08/31/08
Technical Appendix A: Database Construction and Analysis A-105
Table A-80 Kruskal-Wallis and Tukey’s HSD Test Statistics of Raw and Normalized Tug-Barge Total Events, Accidents, and Incidents, 1995-2005
Variable Test Statistics Direction Total Events
Kruskal-Wallis: Chi-square statistic 45.2864, DF = 10, Pr > Chi-square <0.0001 Tukey’s HSD: F-value=6.72, DF = 10, Pr >F <0.0001
A:2000 2001 1999 1997 1995 B: 2001 1999 1997 1995 2002 1998 C: 1999 1997 1995 2002 1998 2004 D: 1997 1995 2002 1998 2004 1996 2003 2005 A>B>C>D
Accidents Kruskal-Wallis: Chi-square statistic 39.4093, DF = 10, Pr > Chi-square <0.0001 Tukey’s HSD: F-value=5.12, DF = 10, Pr >F <0.0001
A: 2000 1999 1997 1995 2001 1998 2002 2004 B: 1997 1995 2001 1998 2002 2004 1996 2003 C: 2001 1998 2002 2004 1996 2003 2005 A>B>C *
Raw Data
Incidents Kruskal-Wallis: Chi-square statistic 49.9608, DF = 10, Pr > Chi-square <0.0001 Tukey’s HSD: F-value=8.33, DF = 10, Pr >F <0.0001
A: 2001 2000 B: 2000 2002 C: 2002 2005 1999 1997 1996 2004 2003 1998 1995*
Total Events
Kruskal-Wallis: Chi-square statistic 36.2490, DF = 9, Pr > Chi-square <0.0001 Tukey’s HSD: F-value=5.81, DF = 9, Pr >F <0.0001
A: 2001 2002 2000 1996 B: 2002 2000 1996 1998 2003 1999 C: 2000 1996 1998 2003 1999 2005 2004 1997 A>B>C
Accidents Kruskal-Wallis: Chi-square statistic 25.6630, DF = 9, Pr > Chi-square =0.0023 Tukey’s HSD: F-value=3.36, DF = 9, Pr >F =0.0011
A: 2001 2000 1996 1998 2002 2003 1999 B: 2000 1996 1998 2002 2003 1999 2005 2004 1997 A>B
Normalized Data
Incidents Kruskal-Wallis: Chi-square statistic 49.3806, DF = 9, Pr > Chi-square <0.0001 Tukey’s HSD: F-value=9.74, DF = 9, Pr >F <0.0001
A: 2002 2001 B: 2003 2000 1998 2005 1997 2004 1996 1999 A>B
* = small sample size
There was also no difference in tug-barge total events, accidents, or incidents before and
after the year 2000, using the Wilcoxon test.
Tug-Barge Events by Season The raw and normalized total events, accidents, and incidents frequencies for tug-barges by
season are shown in Figures A-25 and A-26.
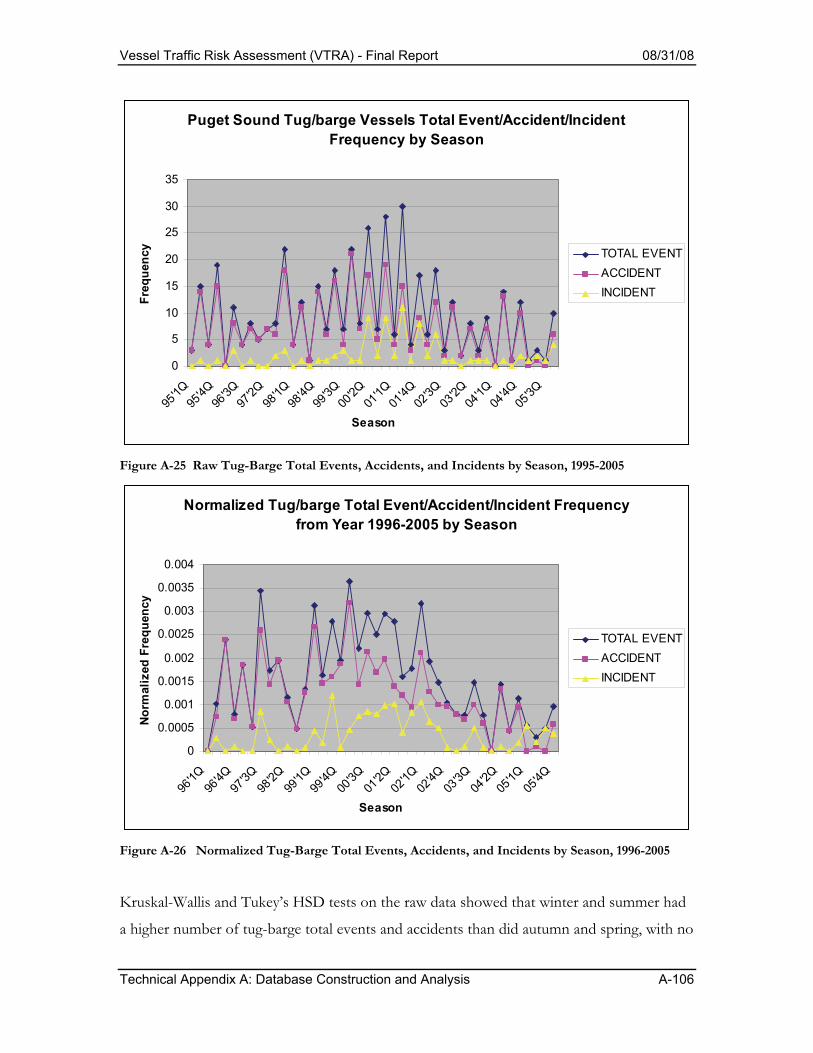
Vessel Traffic Risk Assessment (VTRA) - Final Report 08/31/08
Technical Appendix A: Database Construction and Analysis A-106
Puget Sound Tug/barge Vessels Total Event/Accident/Incident Frequency by Season
0
5
10
15
20
25
30
35
95'1Q
95'4Q
96'3Q
97'2Q
98'1Q
98'4Q
99'3Q
00'2Q
01'1Q
01'4Q
02'3Q
03'2Q
04'1Q
04'4Q
05'3Q
Season
Freq
uenc
y TOTAL EVENTACCIDENTINCIDENT
Figure A-25 Raw Tug-Barge Total Events, Accidents, and Incidents by Season, 1995-2005
Normalized Tug/barge Total Event/Accident/Incident Frequency from Year 1996-2005 by Season
0
0.0005
0.001
0.0015
0.002
0.0025
0.003
0.0035
0.004
96'1Q
96'4Q
97'3Q
98'2Q
99'1Q
99'4Q
00'3Q
01'2Q
02'1Q
02'4Q
03'3Q
04'2Q
05'1Q
05'4Q
Season
Norm
aliz
ed F
requ
ency
TOTAL EVENTACCIDENTINCIDENT
Figure A-26 Normalized Tug-Barge Total Events, Accidents, and Incidents by Season, 1996-2005
Kruskal-Wallis and Tukey’s HSD tests on the raw data showed that winter and summer had
a higher number of tug-barge total events and accidents than did autumn and spring, with no

Vessel Traffic Risk Assessment (VTRA) - Final Report 08/31/08
Technical Appendix A: Database Construction and Analysis A-107
difference of incident frequency among the four seasons. However, the same tests on the
normalized data found no differences in total events, accidents, and incidents among the
four seasons for tug-barges (Table A-81). For raw data, winter and summer had the highest
number of tug-barge total events and accidents, compared to spring and autumn, the same
results as those of tanker ships (Table A-51). However, tug-barges did not have a statistically
different number of incidents among the four seasons as tank ships did. Both tug-barges and
tank ships did not have statistically different number of normalized total events, accidents,
and incidents. Table A-81 Kruskal-Wallis and Tukey’s HSD tests of Raw and Normalized Tug-Barge Events,
Accidents and Incidents by Season Variable DF Test statistic Direction
Total Events 3
Kruskal-Wallis: Chi-square statistic 27.8035, DF =3, Pr<0.0001 Tukey’s HSD: F-value=16.03, DF = 3, Pr >F <0.0001
A: Winter Summer B: Autumn Spring A>B *
Accidents 3
Kruskal-Wallis: Chi-square statistic 27.2958, DF =3, Pr<0.0001 Tukey’s HSD: F-value=18.59, DF = 3, Pr >F <0.0001
A: Winter Summer B: Spring Autumn A>B *
Raw Data
Incidents 3
Kruskal-Wallis: Chi-square statistic 10.6972, DF =3, Pr=0.0135 Tukey’s HSD: F-value=3.42, DF = 3, Pr >F =0.0263
N/A
Total Events 3
Chi-square statistic 1.0085, DF =3, P=0.7992 Tukey’s HSD: F-value=0.50, DF = 3, Pr >F =0.6816
N/A
Accidents 3
Chi-square statistic 1.1584, DF =3, P=0.7630 Tukey’s HSD: F-value=0.63, DF = 3, Pr >F =0.6017
N/A Normalized
Incidents 3
Chi-square statistic 1.1753, DF =3, P=0.7589 Tukey’s HSD: F-value=0.48, DF = 3, Pr >F =0.6965
N/A
* = small sample size A seasonality index was also constructed to assess the likelihood of tug-barge events,
accidents and incidents in Puget Sound by season between 1995 and 2005. This analysis
showed that events in summer and winter seasons occurred more often than in the spring
and autumn seasons due to the longer periods; for normalized events, spring and autumn
had more events, accidents, and incidents than other seasons (Table A-82); The normalized
tug-barge results differ from raw tug-barge results: using a normalized seasonality index,
spring and autumn had the most tug-barge events, accidents, and incidents; these results
were contrary to the tanker seasonality index results, both raw and normalized (Table 52),
which showed normalized tanker events occurring most frequently in winter, normalized
tanker accidents occurring in summer and winter, and normalized tanker incidents occurring
most frequently in spring and winter. Note that these data are limited by small sample sizes.
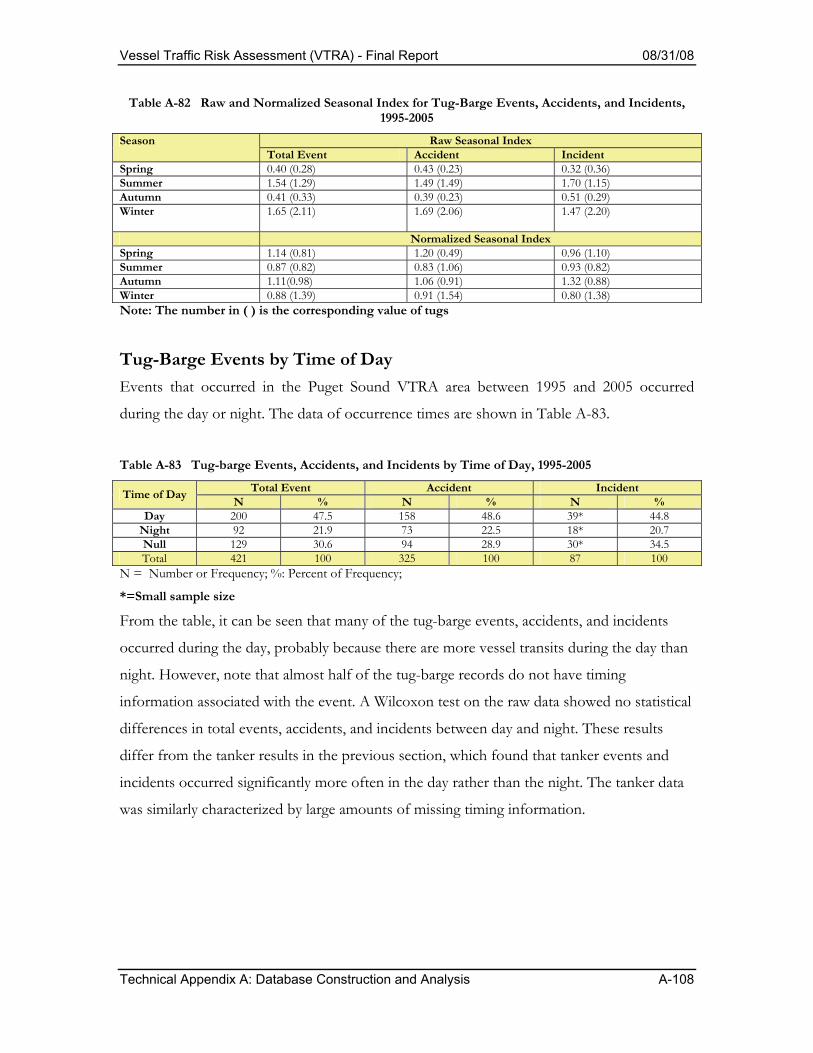
Vessel Traffic Risk Assessment (VTRA) - Final Report 08/31/08
Technical Appendix A: Database Construction and Analysis A-108
Table A-82 Raw and Normalized Seasonal Index for Tug-Barge Events, Accidents, and Incidents, 1995-2005
Raw Seasonal Index Season Total Event Accident Incident
Spring 0.40 (0.28) 0.43 (0.23) 0.32 (0.36) Summer 1.54 (1.29) 1.49 (1.49) 1.70 (1.15) Autumn 0.41 (0.33) 0.39 (0.23) 0.51 (0.29) Winter
1.65 (2.11) 1.69 (2.06) 1.47 (2.20)
Normalized Seasonal Index Spring 1.14 (0.81) 1.20 (0.49) 0.96 (1.10) Summer 0.87 (0.82) 0.83 (1.06) 0.93 (0.82) Autumn 1.11(0.98) 1.06 (0.91) 1.32 (0.88) Winter 0.88 (1.39) 0.91 (1.54) 0.80 (1.38) Note: The number in ( ) is the corresponding value of tugs
Tug-Barge Events by Time of Day Events that occurred in the Puget Sound VTRA area between 1995 and 2005 occurred
during the day or night. The data of occurrence times are shown in Table A-83.
Table A-83 Tug-barge Events, Accidents, and Incidents by Time of Day, 1995-2005
Total Event Accident Incident Time of Day N % N % N % Day 200 47.5 158 48.6 39* 44.8
Night 92 21.9 73 22.5 18* 20.7 Null 129 30.6 94 28.9 30* 34.5 Total 421 100 325 100 87 100
N = Number or Frequency; %: Percent of Frequency;
*=Small sample size
From the table, it can be seen that many of the tug-barge events, accidents, and incidents
occurred during the day, probably because there are more vessel transits during the day than
night. However, note that almost half of the tug-barge records do not have timing
information associated with the event. A Wilcoxon test on the raw data showed no statistical
differences in total events, accidents, and incidents between day and night. These results
differ from the tanker results in the previous section, which found that tanker events and
incidents occurred significantly more often in the day rather than the night. The tanker data
was similarly characterized by large amounts of missing timing information.
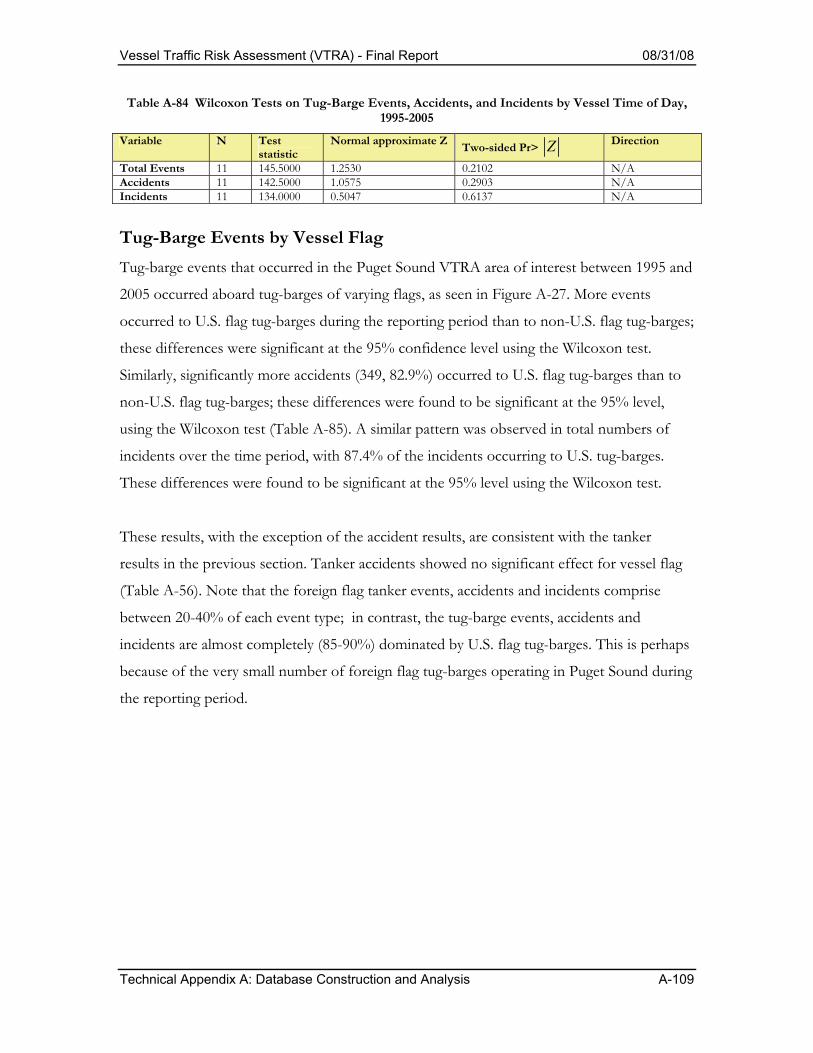
Vessel Traffic Risk Assessment (VTRA) - Final Report 08/31/08
Technical Appendix A: Database Construction and Analysis A-109
Table A-84 Wilcoxon Tests on Tug-Barge Events, Accidents, and Incidents by Vessel Time of Day, 1995-2005
Variable N Test statistic
Normal approximate Z Two-sided Pr> Z Direction
Total Events 11 145.5000 1.2530 0.2102 N/A Accidents 11 142.5000 1.0575 0.2903 N/A Incidents 11 134.0000 0.5047 0.6137 N/A
Tug-Barge Events by Vessel Flag Tug-barge events that occurred in the Puget Sound VTRA area of interest between 1995 and
2005 occurred aboard tug-barges of varying flags, as seen in Figure A-27. More events
occurred to U.S. flag tug-barges during the reporting period than to non-U.S. flag tug-barges;
these differences were significant at the 95% confidence level using the Wilcoxon test.
Similarly, significantly more accidents (349, 82.9%) occurred to U.S. flag tug-barges than to
non-U.S. flag tug-barges; these differences were found to be significant at the 95% level,
using the Wilcoxon test (Table A-85). A similar pattern was observed in total numbers of
incidents over the time period, with 87.4% of the incidents occurring to U.S. tug-barges.
These differences were found to be significant at the 95% level using the Wilcoxon test.
These results, with the exception of the accident results, are consistent with the tanker
results in the previous section. Tanker accidents showed no significant effect for vessel flag
(Table A-56). Note that the foreign flag tanker events, accidents and incidents comprise
between 20-40% of each event type; in contrast, the tug-barge events, accidents and
incidents are almost completely (85-90%) dominated by U.S. flag tug-barges. This is perhaps
because of the very small number of foreign flag tug-barges operating in Puget Sound during
the reporting period.

Vessel Traffic Risk Assessment (VTRA) - Final Report 08/31/08
Technical Appendix A: Database Construction and Analysis A-110
Puget Sound Tug/barge Vessels Total Event/Accident/Incident Frequency by Vessel Flag
349
35 37
265
31 2976
4 70
50100
150200250300
350400
US NON-US UNKNOWN
Vessel Flag
Freq
uenc
y TOTAL EVENTACCIDENTINCIDENT87.4%
82.9%
8.3%
81.5%
9.5%4.6%
8.8%8.9%
8.0%
Figure A-27 Tug-Barge Events by Vessel Flag, 1995-2005
Table A-85 Wilcoxon Tests on Tug-Barge Events, Accidents, and Incidents by Vessel Flag, 1995-2005
Variable N Test statistic
Normal Approximation Z Two-sided Pr> Z Direction
Total Events 11 187.0000 3.9874 <0.0001 U.S.>Non U.S. *
Accidents 11 185.0000 3.8822 0.0001 U.S.>Non U.S. *
Incidents 11 185.5000 3.9837 <0.0001 U.S.>Non U.S. *
* = small sample size
Total tug-barge events, accidents, and incidents for foreign flag tug-barge vessels are shown
in Table A-86. Table A-86 Puget Sound Foreign Flag Tug-barge Events, Accidents, and Incidents by Flag, 1995-2005
Total Event Accident Incident Vessel Flag N % N % N % US 349 82.9 265 81.5 76 87.4
BRAZIL 2* 0.5 2* 0.6 0 0 CANADA 27* 6.4 23* 7.1 4* 4.6 NIGERIA 1* 0.2 1* 0.3 0 0 PANAMA 2* 0.5 2* 0.6 0 0
VANUATU 1* 0.2 1* 0.3 0 0 OTHER 39 9.3 31 9.5 7* 8.0 TOTAL 421 100 325 100 87 100
*=Small sample size
Table A-86 shows that Canadian tug-barges have the highest frequency of events, accidents
and incidents, compared to other foreign flag tug-barges in Puget Sound. However, with the
exception of the U.S. flag data, all tug-barge foreign flag data is limited by small sample sizes.
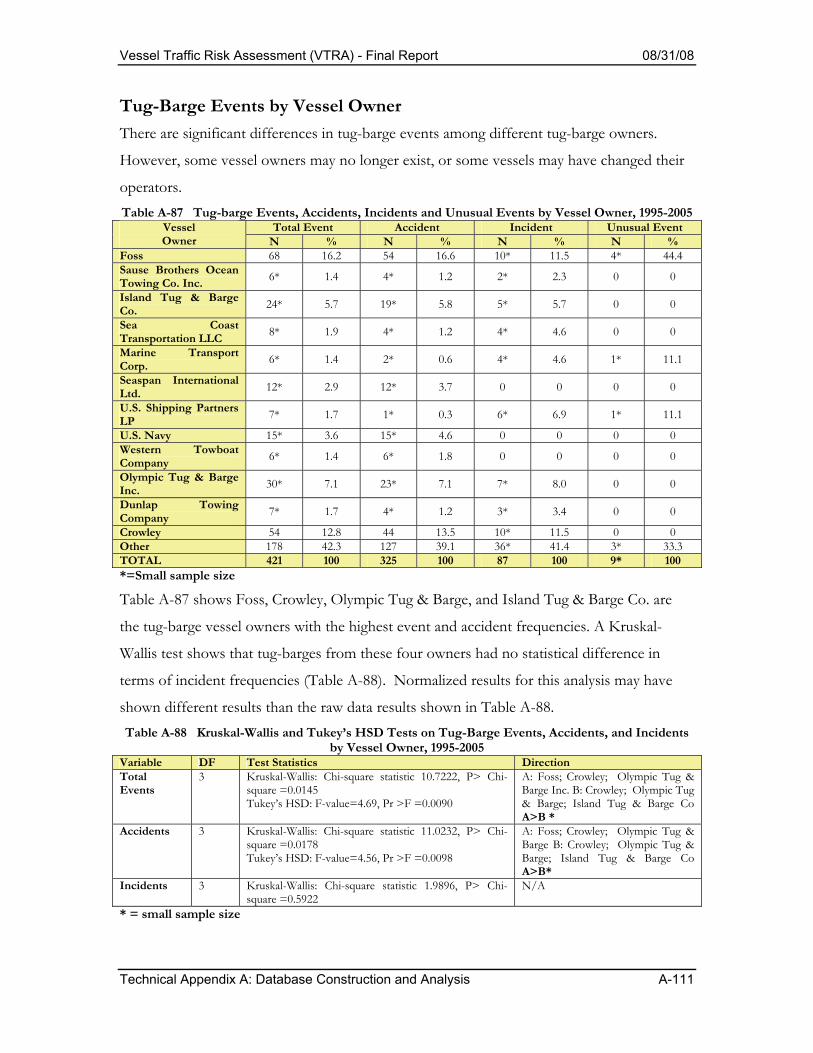
Vessel Traffic Risk Assessment (VTRA) - Final Report 08/31/08
Technical Appendix A: Database Construction and Analysis A-111
Tug-Barge Events by Vessel Owner There are significant differences in tug-barge events among different tug-barge owners.
However, some vessel owners may no longer exist, or some vessels may have changed their
operators. Table A-87 Tug-barge Events, Accidents, Incidents and Unusual Events by Vessel Owner, 1995-2005
Total Event Accident Incident Unusual Event Vessel Owner N % N % N % N %
Foss 68 16.2 54 16.6 10* 11.5 4* 44.4 Sause Brothers Ocean Towing Co. Inc. 6* 1.4 4* 1.2 2* 2.3 0 0
Island Tug & Barge Co. 24* 5.7 19* 5.8 5* 5.7 0 0
Sea Coast Transportation LLC 8* 1.9 4* 1.2 4* 4.6 0 0
Marine Transport Corp. 6* 1.4 2* 0.6 4* 4.6 1* 11.1
Seaspan International Ltd. 12* 2.9 12* 3.7 0 0 0 0
U.S. Shipping Partners LP 7* 1.7 1* 0.3 6* 6.9 1* 11.1
U.S. Navy 15* 3.6 15* 4.6 0 0 0 0 Western Towboat Company 6* 1.4 6* 1.8 0 0 0 0
Olympic Tug & Barge Inc. 30* 7.1 23* 7.1 7* 8.0 0 0
Dunlap Towing Company 7* 1.7 4* 1.2 3* 3.4 0 0
Crowley 54 12.8 44 13.5 10* 11.5 0 0 Other 178 42.3 127 39.1 36* 41.4 3* 33.3 TOTAL 421 100 325 100 87 100 9* 100 *=Small sample size
Table A-87 shows Foss, Crowley, Olympic Tug & Barge, and Island Tug & Barge Co. are
the tug-barge vessel owners with the highest event and accident frequencies. A Kruskal-
Wallis test shows that tug-barges from these four owners had no statistical difference in
terms of incident frequencies (Table A-88). Normalized results for this analysis may have
shown different results than the raw data results shown in Table A-88. Table A-88 Kruskal-Wallis and Tukey’s HSD Tests on Tug-Barge Events, Accidents, and Incidents
by Vessel Owner, 1995-2005 Variable DF Test Statistics Direction Total Events
3 Kruskal-Wallis: Chi-square statistic 10.7222, P> Chi-square =0.0145 Tukey’s HSD: F-value=4.69, Pr >F =0.0090
A: Foss; Crowley; Olympic Tug & Barge Inc. B: Crowley; Olympic Tug & Barge; Island Tug & Barge Co A>B *
Accidents 3 Kruskal-Wallis: Chi-square statistic 11.0232, P> Chi-square =0.0178 Tukey’s HSD: F-value=4.56, Pr >F =0.0098
A: Foss; Crowley; Olympic Tug & Barge B: Crowley; Olympic Tug & Barge; Island Tug & Barge Co A>B*
Incidents 3 Kruskal-Wallis: Chi-square statistic 1.9896, P> Chi-square =0.5922
N/A
* = small sample size

Vessel Traffic Risk Assessment (VTRA) - Final Report 08/31/08
Technical Appendix A: Database Construction and Analysis A-112
Tug-Barge Events by Classification Society The information about the class society for tug-barges can be found in Table A-89.
Table A-89 Tug-Barge Events, Accidents, Incidents and Unusual Events by Class Society, 1995-2005
Total Event Accident Incident Unusual Event Class Society N % N % N % N %
ABS 113 26.8 80 24.6 30 * 34.5 3 * 33.3 Bureau Veritas (BV) 1 * 0.2 0 0 1 * 1.1 0 0 Lloyd’s Register (LR) 4 * 1.0 3 * 0.9 1 * 1.1 0 0 Registro Italiano Navale (RINA) (RI)
1 * 0.2 1 * 0.3 0 0 0 0
Null 302 71.7 241 74.2 55 63.2 6 * 66.6 Total 421 100 325 100 87 100 9 * 100 * = small sample size
From Table A-89, we can find that ABS class tug-barges had the highest number of total
events, accidents, incidents, and unusual events than other class societies. Statistical tests on
tug-barge event data are not available because of small sample sizes.
Tug-Barge Events by Hull Type There are four hull types for tug-barges in the database: single hull, double hull, double sides,
and double bottoms. Table A-90 shows the numbers of tugs with different hull types. Note
in Table A-90 that some records were missing information about hull type and thus were
classified as “unknown”. A Wilcoxon test of the Table A-90 tug-barge data shows that single
hull tug-barges had a higher number of total events, accidents, and incidents than double
hull tug-barges (Table A-91). These results contrast with the tanker results, which showed
that double-hulled tankers had significantly higher numbers of events, accidents and
incidents over the reporting period. This may be because of the dominance of double-hulled
tankers in the tanker data records, and the dominance of single hull tug-barges in the tug-
barge data records. Transit data was not available to normalize the data. Given the
differences that were observed with this data set when the data were normalized, as analysis
of the differences in event frequencies by hull type for both raw and normalized data should
be undertaken.
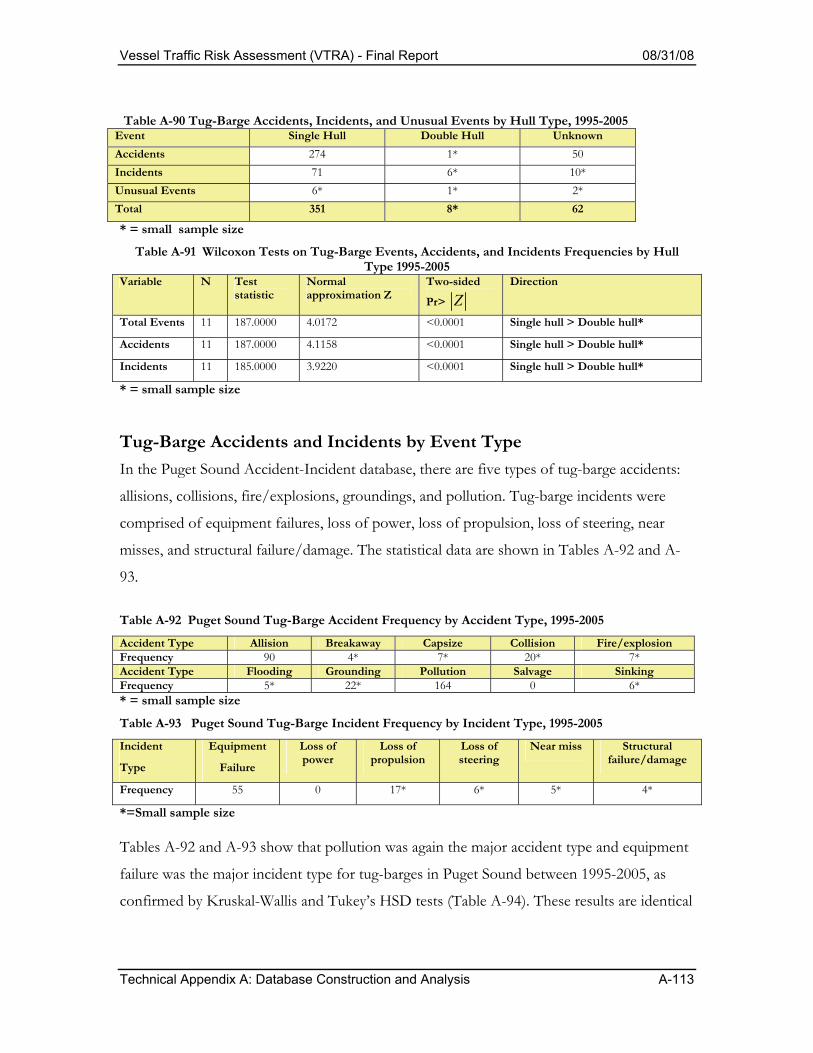
Vessel Traffic Risk Assessment (VTRA) - Final Report 08/31/08
Technical Appendix A: Database Construction and Analysis A-113
Table A-90 Tug-Barge Accidents, Incidents, and Unusual Events by Hull Type, 1995-2005
Event Single Hull Double Hull Unknown Accidents 274 1* 50 Incidents 71 6* 10* Unusual Events 6* 1* 2* Total 351 8* 62
* = small sample size
Table A-91 Wilcoxon Tests on Tug-Barge Events, Accidents, and Incidents Frequencies by Hull Type 1995-2005
Variable N Test statistic
Normal approximation Z
Two-sided
Pr> Z
Direction
Total Events 11 187.0000 4.0172 <0.0001 Single hull > Double hull*
Accidents 11 187.0000 4.1158 <0.0001 Single hull > Double hull*
Incidents 11 185.0000 3.9220 <0.0001 Single hull > Double hull*
* = small sample size
Tug-Barge Accidents and Incidents by Event Type In the Puget Sound Accident-Incident database, there are five types of tug-barge accidents:
allisions, collisions, fire/explosions, groundings, and pollution. Tug-barge incidents were
comprised of equipment failures, loss of power, loss of propulsion, loss of steering, near
misses, and structural failure/damage. The statistical data are shown in Tables A-92 and A-
93.
Table A-92 Puget Sound Tug-Barge Accident Frequency by Accident Type, 1995-2005
Accident Type Allision Breakaway Capsize Collision Fire/explosion Frequency 90 4* 7* 20* 7* Accident Type Flooding Grounding Pollution Salvage Sinking Frequency 5* 22* 164 0 6* * = small sample size
Table A-93 Puget Sound Tug-Barge Incident Frequency by Incident Type, 1995-2005
Incident
Type
Equipment
Failure
Loss of power
Loss of propulsion
Loss of steering
Near miss Structural failure/damage
Frequency 55 0 17* 6* 5* 4*
*=Small sample size Tables A-92 and A-93 show that pollution was again the major accident type and equipment
failure was the major incident type for tug-barges in Puget Sound between 1995-2005, as
confirmed by Kruskal-Wallis and Tukey’s HSD tests (Table A-94). These results are identical

Vessel Traffic Risk Assessment (VTRA) - Final Report 08/31/08
Technical Appendix A: Database Construction and Analysis A-114
to those shown for all vessels (Tables A-33 and A-34); however, the results are limited by a
small sample size.
Table A-94 Kruskal-Wallis and Tukey’s HSD tests results on Tug-Barge Accidents and Incidents by
Event Type, 1995-2005 Variable DF Test Statistics Direction
Accident Type 8 Kruskal-Wallis: Chi-square statistic 52.8120, P>Chi-square <0.0001
Tukey’s HSD: F-value= 29.29, Pr >F <0.0001
Pollution>Allision>Grounding, Collision, Fire, Capsize, Sinking, Flooding, Breakaway*
Incident Type 4 Kruskal-Wallis: Chi-square statistic 17.8887, P>Chi-square =0.0013
Tukey’s HSD: F-value= 7.76, Pr >F <0.0001
Equipment failure>Loss of Propulsion, Loss of steering, Near miss, Structural Failure *
* = small sample size
Tug-Barge Events by Error Type The frequency of tug-barge total events, accidents, and incidents caused by human error and
mechanical failure are shown in Table A-95. Table A-95 Tug-Barge Accidents and Incidents by Error Type, 1995-2005
Year Tug/barge
accident
Tug/barge accident by
HOE
Tug/barge accident by
MF
Tug/barge incident
Tug/barge incident by
HOE
Tug/barge incident by
MF 1995 36 * 0 0 2 * 0 2 * 1996 19 * 2* 1 * 4 * 0 4 * 1997 36 * 7 * 2* 5 * 0 4 * 1998 30 * 4 * 1* 2 * 0 2 * 1999 47 4* 0* 7 * 0 7 * 2000 48 4* 2* 21* 0 21* 2001 31 * 4* 0 22 * 1 * 21 * 2002 29 * 0 0 10 * 0 9 * 2003 18 * 2* 0 3 * 2 * 1* 2004 24 * 0 2* 3 * 0 3 * 2005 7 * 2* 1* 8 * 0 8 *
Wilcoxon tests show that, for tug-barges, more total events and accidents are caused by
human error than are caused by mechanical failures. However, more incidents are caused by
mechanical failure, rather than human error (Table A-96). These results are consistent with
those shown for all vessels (Table A-36). The tug-barge results are identical to the tanker
results, with the exception of accidents, which showed no significant trend in the tanker data
(Table A-72). Note, however, that the data are limited by small sample sizes.
Table A-96 Wilcoxon Tests on Tug-Barge Events, Accidents, and Incidents Frequencies by Error Type, 1995-2005
Variable N Test statistic
Normal approximation Z Two-sided Pr> Z Direction
Total Events 11 94.5000 -2.1139 0.0345 MF>HOE* Accidents 11 157.0000 2.0825 0.0373 HOE>MF* Incidents 11 68.5000 -3.9529 <0.0001 MF>HOE*
Vessel Traffic Risk Assessment (VTRA) - Final Report 08/31/08
Technical Appendix A: Database Construction and Analysis A-115
Summary of Tug-Barge Events, Accidents and Incidents, 1995-2005 Test results of tug-barge total events, accidents, and incidents by year showed that year 2000
had the highest event and accident frequencies while year 2001 had the highest incident
frequencies between 1995-2005. Tests on the normalized data showed that year 2001 had the
highest normalized event and accident frequencies while year 2002 had the highest
normalized incident frequency.
Test results of tug-barge events by season showed that winter and summer had a statistically
higher number of total events and accidents than did spring and autumn. However, no
statistical difference in accidents was found among the four seasons. Furthermore, tests on
the normalized tug-barge data showed no statistical difference in total events, accidents, and
incidents.
Tests on tug-barge total events, accidents, and incidents by location showed that South
Puget Sound had a significantly higher number of total events, accidents and incidents,
compared to other locations. This result is in contrast to the tanker events, which occurred
significantly more frequently in the East and West Straits of Juan de Fuca.
Significant test results showed that U.S. flag tug-barges had significantly more events,
accidents, and incidents frequencies than non-U.S. flag tug-barges. Tests on tug-barge data
by hull type showed that single hull tug-barges had a statistically higher number of total
events, accidents, and incidents than double hull tug/barges.
For tug-barges, as with the tankers, pollution was the major accident type, and equipment
failures were the most frequent incident type in Puget Sound between 1995 and 2005. Tests
on tug-barge data by error type showed that tug-barges had statistically higher number of
total events and accidents caused by human error than those by mechanical failure.
However, tug-barges had significantly more incidents caused by mechanical failure than
those by human error. These results were consistent with those results for all vessels. The
significant test results of tug-barge total events, accidents, incidents are shown in Table A-97.
Note, however, that many of these results are limited by small sample sizes.
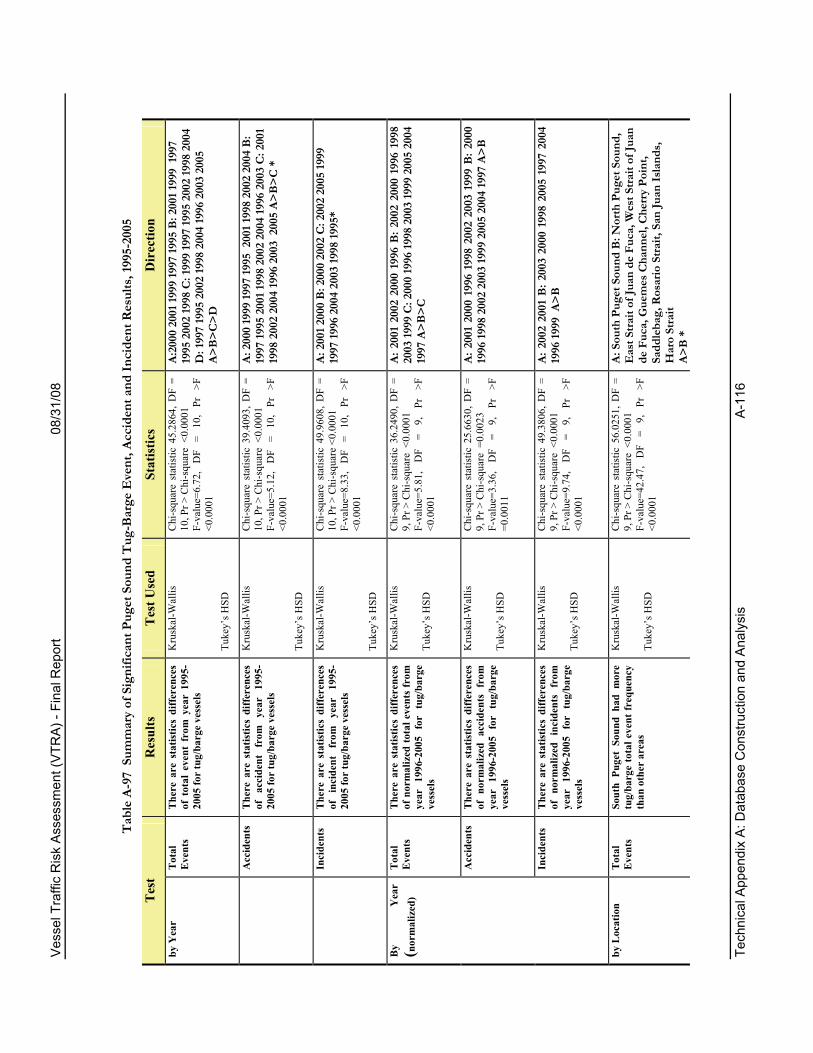
Vess
el T
raffi
c R
isk
Asse
ssm
ent (
VTR
A) -
Fina
l Rep
ort
08/3
1/08
Te
chni
cal A
ppen
dix
A: D
atab
ase
Con
stru
ctio
n an
d A
naly
sis
A-1
16
Tab
le A
-97
Sum
mar
y of
Sig
nific
ant P
uget
Sou
nd T
ug-B
arge
Eve
nt, A
ccid
ent a
nd In
cide
nt R
esul
ts, 1
995-
2005
Tes
t R
esul
ts
Tes
t Use
d St
atis
tics
Dir
ectio
n by
Yea
r
Tot
al
Eve
nts
The
re a
re s
tatis
tics
diff
eren
ces
of t
otal
eve
nt f
rom
yea
r 19
95-
2005
for
tug/
barg
e ve
ssel
s
Kru
skal
-Wal
lis
Tuke
y’s H
SD
Chi
-squ
are
stat
istic
45.
2864
, DF
= 10
, Pr >
Chi
-squ
are
<0.
0001
F-
valu
e=6.
72,
DF
= 10
, Pr
>F
<0
.000
1
A:20
00 2
001 1
999
1997
1995
B: 2
001 1
999
1997
19
95 2
002
1998
C: 1
999
1997
1995
200
2 19
98 2
004
D: 1
997
1995
200
2 19
98 2
004
1996
200
3 20
05
A>B
>C>D
A
ccid
ents
T
here
are
sta
tistic
s di
ffer
ence
s of
ac
cide
nt
from
ye
ar
1995
-20
05 fo
r tu
g/ba
rge
vess
els
Kru
skal
-Wal
lis
Tuke
y’s H
SD
Chi
-squ
are
stat
istic
39.
4093
, DF
= 10
, Pr >
Chi
-squ
are
<0.
0001
F-
valu
e=5.
12,
DF
= 10
, Pr
>F
<0
.000
1
A: 2
000
1999
1997
1995
200
1 199
8 20
02 2
004
B:
1997
1995
200
1 199
8 20
02 2
004
1996
200
3 C
: 200
1 19
98 2
002
2004
1996
200
3 2
005
A>B
>C *
In
cide
nts
The
re a
re s
tatis
tics
diff
eren
ces
of
inci
dent
fr
om
year
19
95-
2005
for
tug/
barg
e ve
ssel
s
Kru
skal
-Wal
lis
Tuke
y’s H
SD
Chi
-squ
are
stat
istic
49.
9608
, DF
= 10
, Pr >
Chi
-squ
are
<0.0
001
F-va
lue=
8.33
, D
F =
10,
Pr
>F
<0.0
001
A: 2
001 2
000
B: 2
000
2002
C: 2
002
2005
1999
19
97 19
96 2
004
2003
1998
1995
*
Tot
al
Eve
nts
The
re a
re s
tatis
tics
diff
eren
ces
of n
orm
aliz
ed to
tal e
vent
s fr
om
year
199
6-20
05 f
or t
ug/b
arge
ve
ssel
s
Kru
skal
-Wal
lis
Tuke
y’s H
SD
Chi
-squ
are
stat
istic
36.
2490
, DF
= 9,
Pr >
Chi
-squ
are
<0.
0001
F-
valu
e=5.
81,
DF
= 9,
Pr
>F
<0
.000
1
A: 2
001
2002
200
0 19
96 B
: 200
2 20
00 1
996
1998
20
03 19
99 C
: 200
0 19
96 19
98 2
003
1999
200
5 20
04
1997
A>B
>C
Acc
iden
ts
The
re a
re s
tatis
tics
diff
eren
ces
of n
orm
aliz
ed a
ccid
ents
fro
m
year
199
6-20
05 f
or t
ug/b
arge
ve
ssel
s
Kru
skal
-Wal
lis
Tuke
y’s H
SD
Chi
-squ
are
stat
istic
25.
6630
, DF
= 9,
Pr >
Chi
-squ
are
=0.
0023
F-
valu
e=3.
36,
DF
= 9,
Pr
>F
=0
.001
1
A: 2
001
2000
199
6 19
98 2
002
2003
199
9 B
: 200
0 19
96 19
98 2
002
2003
1999
200
5 20
04 19
97 A
>B
By
Yea
r ( n
orm
aliz
ed)
Inci
dent
s T
here
are
sta
tistic
s di
ffer
ence
s of
nor
mal
ized
inc
iden
ts f
rom
ye
ar 1
996-
2005
for
tug
/bar
ge
vess
els
Kru
skal
-Wal
lis
Tuke
y’s H
SD
Chi
-squ
are
stat
istic
49.
3806
, DF
= 9,
Pr >
Chi
-squ
are
<0.
0001
F-
valu
e=9.
74,
DF
= 9,
Pr
>F
<0
.000
1
A: 2
002
2001
B: 2
003
2000
199
8 20
05 1
997
2004
19
96 19
99 A
>B
by L
ocat
ion
Tot
al
Eve
nts
Sout
h Pu
get
Soun
d ha
d m
ore
tug/
barg
e to
tal e
vent
freq
uenc
y th
an o
ther
are
as
Kru
skal
-Wal
lis
Tuke
y’s H
SD
Chi
-squ
are
stat
istic
56.
0251
, DF
= 9,
Pr >
Chi
-squ
are
<0.
0001
F-
valu
e=42
.47,
D
F =
9,
Pr
>F
<0.0
001
A: S
outh
Pug
et S
ound
B: N
orth
Pug
et S
ound
, E
ast S
trait
of Ju
an d
e Fu
ca, W
est S
trait
of Ju
an
de F
uca,
Gue
mes
Cha
nnel
, Che
rry
Poin
t, Sa
ddle
bag,
Ros
ario
Stra
it, S
an Ju
an Is
land
s,
Har
o St
rait
A>
B *
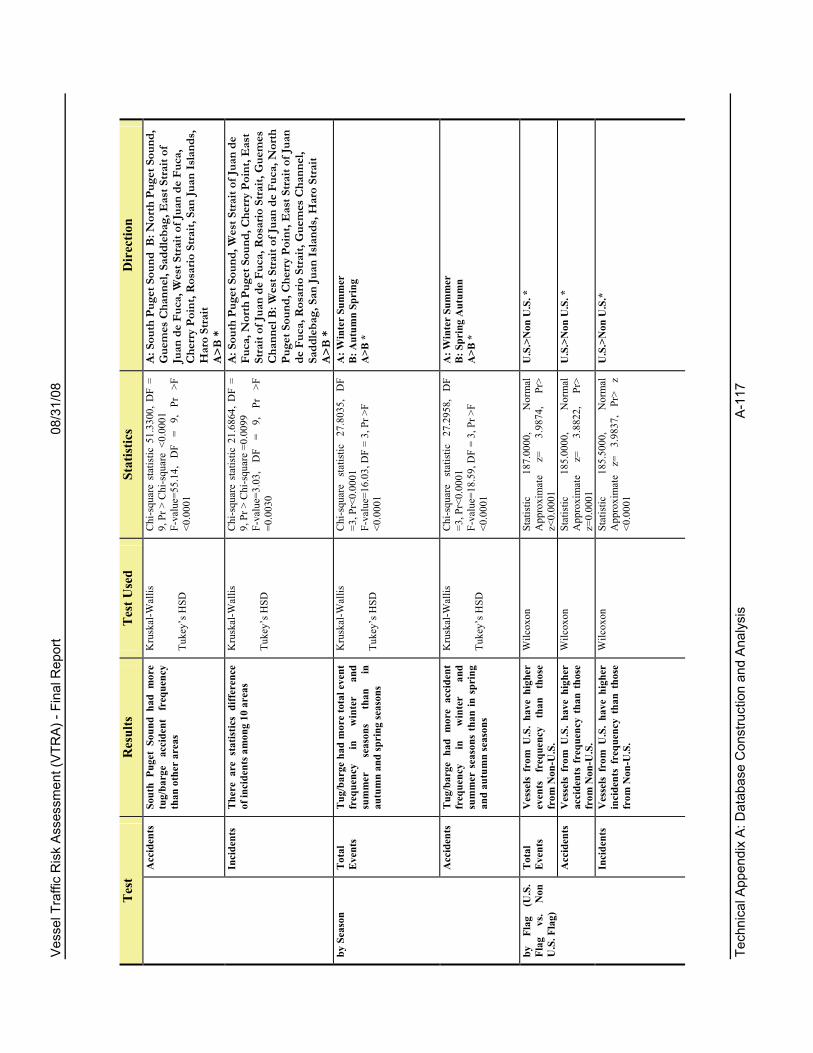
Vess
el T
raffi
c R
isk
Asse
ssm
ent (
VTR
A) -
Fina
l Rep
ort
08/3
1/08
Te
chni
cal A
ppen
dix
A: D
atab
ase
Con
stru
ctio
n an
d A
naly
sis
A-1
17
Tes
t R
esul
ts
Tes
t Use
d St
atis
tics
Dir
ectio
n A
ccid
ents
So
uth
Puge
t So
und
had
mor
e tu
g/ba
rge
acci
dent
fr
eque
ncy
than
oth
er a
reas
Kru
skal
-Wal
lis
Tuke
y’s H
SD
Chi
-squ
are
stat
istic
51.
3300
, DF
= 9,
Pr >
Chi
-squ
are
<0.
0001
F-
valu
e=55
.14,
D
F =
9,
Pr
>F
<0.0
001
A: S
outh
Pug
et S
ound
B: N
orth
Pug
et S
ound
, G
uem
es C
hann
el, S
addl
ebag
, Eas
t Stra
it of
Ju
an d
e Fu
ca, W
est S
trait
of Ju
an d
e Fu
ca,
Che
rry
Poin
t, R
osar
io S
trait,
San
Juan
Isla
nds,
H
aro
Stra
it
A>B
*
Inci
dent
s T
here
are
sta
tistic
s di
ffer
ence
of
inci
dent
s am
ong
10 a
reas
K
rusk
al-W
allis
Tu
key’
s HSD
Chi
-squ
are
stat
istic
21.
6864
, DF
= 9,
Pr >
Chi
-squ
are
=0.0
099
F-va
lue=
3.03
, D
F =
9,
Pr
>F
=0.0
030
A: S
outh
Pug
et S
ound
, Wes
t Stra
it of
Juan
de
Fuca
, Nor
th P
uget
Sou
nd, C
herr
y Po
int,
Eas
t St
rait
of Ju
an d
e Fu
ca, R
osar
io S
trait,
Gue
mes
C
hann
el B
: Wes
t Stra
it of
Juan
de
Fuca
, Nor
th
Puge
t Sou
nd, C
herr
y Po
int,
Eas
t Stra
it of
Juan
de
Fuc
a, R
osar
io S
trait,
Gue
mes
Cha
nnel
, Sa
ddle
bag,
San
Juan
Isla
nds,
Har
o St
rait
A>
B *
T
otal
E
vent
s T
ug/b
arge
had
mor
e to
tal e
vent
fr
eque
ncy
in
win
ter
and
sum
mer
se
ason
s th
an
in
autu
mn
and
spri
ng se
ason
s
Kru
skal
-Wal
lis
Tuke
y’s H
SD
Chi
-squ
are
stat
istic
27
.803
5,
DF
=3, P
r<0.
0001
F-
valu
e=16
.03,
DF
= 3,
Pr >
F <0
.000
1
A: W
inte
r Su
mm
er
B: A
utum
n Sp
ring
A
>B *
by S
easo
n
Acc
iden
ts
Tug
/bar
ge h
ad m
ore
acci
dent
fr
eque
ncy
in
win
ter
and
sum
mer
sea
sons
tha
n in
spr
ing
and
autu
mn
seas
ons
Kru
skal
-Wal
lis
Tuke
y’s H
SD
Chi
-squ
are
stat
istic
27
.295
8,
DF
=3, P
r<0.
0001
F-
valu
e=18
.59,
DF
= 3,
Pr >
F <0
.000
1
A: W
inte
r Su
mm
er
B: S
prin
g A
utum
n A
>B *
Tot
al
Eve
nts
Ves
sels
fro
m U
.S.
have
hig
her
even
ts
freq
uenc
y th
an
thos
e fr
om N
on-U
.S.
Wilc
oxon
St
atis
tic
187.
0000
, N
orm
al
App
roxi
mat
e z=
3.
9874
, Pr
> z<
0.00
01
U.S
.>N
on U
.S. *
Acc
iden
ts
Ves
sels
fro
m U
.S.
have
hig
her
acci
dent
s fr
eque
ncy
than
tho
se
from
Non
-U.S
.
Wilc
oxon
St
atis
tic
185.
0000
, N
orm
al
App
roxi
mat
e z=
3.
8822
, Pr
> z=
0.00
01
U.S
.>N
on U
.S. *
by
Flag
(U
.S.
Flag
vs
. N
on
U.S
. Fla
g)
Inci
dent
s V
esse
ls f
rom
U.S
. ha
ve h
ighe
r in
cide
nts
freq
uenc
y th
an t
hose
fr
om N
on-U
.S.
Wilc
oxon
St
atis
tic
185.
5000
, N
orm
al
App
roxi
mat
e z=
3.
9837
, Pr
> z
<0.0
001
U.S
.>N
on U
.S.*

Vess
el T
raffi
c R
isk
Asse
ssm
ent (
VTR
A) -
Fina
l Rep
ort
08/3
1/08
Te
chni
cal A
ppen
dix
A: D
atab
ase
Con
stru
ctio
n an
d A
naly
sis
A-1
18
Tes
t R
esul
ts
Tes
t Use
d St
atis
tics
Dir
ectio
n T
otal
E
vent
s V
esse
ls f
rom
diff
eren
t ow
ners
ha
d st
atis
tics
diff
eren
ce o
f tot
al
even
t fre
quen
cy
Kru
skal
-Wal
lis
Tuke
y’s H
SD
Chi
-squ
are
stat
istic
10
.722
2,
DF
=3, P
=0.0
145
F-
valu
e=4.
69,
DF
= 3,
Pr
>F
=0
.009
0
A: F
oss;
Cro
wle
y; O
lym
pic
tug/
barg
e In
c.
B:
Cro
wle
y;
O
lym
pic
tug/
barg
e In
c;
Isla
nd
tug/
barg
e C
o
A>B
*
by O
wne
r
Acc
iden
ts
Ves
sels
fro
m d
iffer
ent
owne
rs
had
stat
istic
s di
ffer
ence
of
ac
cide
nt fr
eque
ncy
Kru
skal
-Wal
lis
Tuke
y’s H
SD
Chi
-squ
are
stat
istic
11
.023
2,
DF
=3, P
=0.0
178
F-va
lue=
4.56
, DF
= 3,
Pr >
F =0
.009
8
A: F
oss;
Cro
wle
y; O
lym
pic
tug/
barg
e In
c.
B:
Cro
wle
y;
O
lym
pic
tug/
barg
e In
c;
Isla
nd
tug/
barg
e C
o
A>B
*
Tot
al
Eve
nts
Sing
le
hull
tug/
barg
e ha
d hi
gher
num
ber
of t
otal
eve
nt
freq
uenc
y th
an
thos
e ha
d do
uble
hul
l
Wilc
oxon
St
atis
tic
187.
0000
, N
orm
al
App
roxi
mat
e z=
4.
0172
, Pr
> z
<0.0
001
Sing
le h
ull >
Dou
ble
hull
*
B
y H
ull T
ype
Acc
iden
ts
Sing
le h
ull
tug/
barg
e ha
d hi
gher
nu
mbe
r of
ac
cide
nt
freq
uenc
y th
an th
ose
had
doub
le h
ull
Wilc
oxon
St
atis
tic
187.
0000
, N
orm
al
App
roxi
mat
e z=
4.
1158
, Pr
> z<
0.00
01
Sing
le h
ull >
Dou
ble
hull
*
Inci
dent
s Si
ngle
hu
ll tu
g/ba
rge
had
high
er
num
ber
of
inci
dent
fr
eque
ncy
than
th
ose
had
doub
le h
ull
Wilc
oxon
St
atis
tic
185.
0000
, N
orm
al
App
roxi
mat
e z=
3.
9220
, Pr
> z<
0.
0001
Sing
le h
ull >
Dou
ble
hull
*
By
Acc
iden
t /I
ncid
ent T
ype
Acc
iden
ts
Acc
iden
ts c
ause
d by
pol
lutio
n ha
d st
atis
tical
ly h
ighe
r nu
mbe
r of
fre
quen
cy t
han
thos
e ca
used
by
oth
er ty
pes
Kru
skal
-Wal
lis
Tuke
y’s H
SD
Chi
-squ
are
stat
istic
52
.812
0,
P>C
hi-s
quar
e <0
.000
1
F-va
lue=
29.
29, P
r >F
<0.
0001
Pollu
tion>
Alli
sion
>Gro
undi
ng,
Col
lisio
n,
Fire
, C
apsi
ze, F
lood
ing,
Sin
king
, B
reak
away
*
In
cide
nts
Inci
dent
s ca
used
by
equi
pmen
t fa
ilure
had
sta
tistic
ally
hig
her
num
ber
of
freq
uenc
y th
an
thos
e ca
used
by
othe
r ty
pes
Kru
skal
-Wal
lis
Tuke
y’s H
SD
Chi
-squ
are
stat
istic
17
.888
7,
P>C
hi-s
quar
e =0
.001
3
F-va
lue=
7.7
6, P
r >F
<0.
0001
Equ
ipm
ent
failu
re>L
oss
of
Prop
ulsi
on,
Los
s of
st
eeri
ng, N
ear
mis
s, St
ruct
ural
Fai
lure
*
by E
rror
Typ
e (H
OE
vs
. M
echa
nica
l)
Tot
al
Eve
nts
Tug
/bar
ge
vess
els
had
mor
e ev
ents
cau
sed
by H
OE
tha
n by
M
F
Wilc
oxon
St
atis
tic
94..5
000,
N
orm
al
App
roxi
mat
e z=
-2.1
139,
Pr
> z=
0.03
45
MF>
HO
E *
A
ccid
ents
T
ug/b
arge
ve
ssel
s ha
d m
ore
acci
dent
s ca
used
by
HO
E t
han
by M
F
Wilc
oxon
St
atis
tic
157.
0000
, N
orm
al
App
roxi
mat
e z=
2.08
25,
Pr>
z<0.
0373
HO
E>M
F *
In
cide
nts
Tug
/bar
ge
vess
els
had
mor
e in
cide
nts
caus
ed b
y M
F th
an
by H
OE
Wilc
oxon
St
atis
tic
68.5
000,
N
orm
al
App
roxi
mat
e z=
-3
.952
9,
Pr>
z<0.
0001
MF>
HO
E *
* =
smal
l sam
ple
size
Vessel Traffic Risk Assessment (VTRA) - Draft Final Report 08/31/08
Draft Appendix A: Accident, Incident, and Human Error Analysis, 1995-2005 A-119
Appendix A-3
Influence Diagrams for Puget Sound Tanker, ATB/ITB Calibration Accidents,
Sample Incidents and Unusual Event, 1995-2005

Vessel Traffic Risk Assessment (VTRA) - Draft Final Report 08/31/08
Draft Appendix A: Accident, Incident, and Human Error Analysis, 1995-2005 A-120
19 January 2002 Tanker Allegiance, Escort tug Sea King collision
Tug Sea King veers into path of tanker Allegiance
612’ single hull US flag Maritrans tanker Allegiance , not in BP service and built 1980, inbound Straits of Juan de Fuca for Tesoro
Tug captain Don Nekeferoff has alcohol problems, binge drinking
Crowley notes problems in medical files/records
Tug captain Don Nekeferoff has series of mini strokes/TIA’s, blocked arteries, low back pain, chest pain
Tug captain Don Nekeferoff has handicapped parking space
Heavy winds and seas on January nighttime transit
Tanker Allegiance speed 15 knots
US flag Crowley escort tugs Sea King and Chief assigned to escort inbound tanker
Puget Sound pilot Semler boards Allegiance @ Port Angeles
2050: 3 captains hold radio conference
2130 Escort tugs Sea King and Chief alongside Allegiance near Davidson Rock (entrance to Rosario)
All 3 vessels on course 058
Chief is tethered to stern of Allegiance; Sea King off port bow
Court finding: Allegiance fails to provide lookout Allegiance is
overtaking tug Sea King
Sea King tug captain loses situational awareness
Pilot queries tug captain, “Don, are you okay?”
Tug captain replies, “Okay.”
Tug and tanker collide
Tug captain tested for drugs/alcohol
No drugs/alcohol found for Sea King tug captain
References: Nalder, E. “San Juans Disaster Was Narrowly Averted.” Seattle Post-intelligencer, 24 March 2005. Mckeown, M.M. Crowley Marine Services vs. Maritrans, Inc. US Court of Appeals for 9th Circuit Opinion, 9 May 2006. U.S. Coast Guard 2692. U.S. Coast Guard MISLE record Washington State Department of Ecology incident record. Lloyd’s Casualty Reporting Service
18 January 2008
Tanker Allegiance enroute from Los Angeles to Seattle
Sea King sustains heavy structural damage
Two crew members injured
Sea King dewatered; moored off Anacortes 1040
Allegiance moored at Anacortes, 1345 Jan 20th
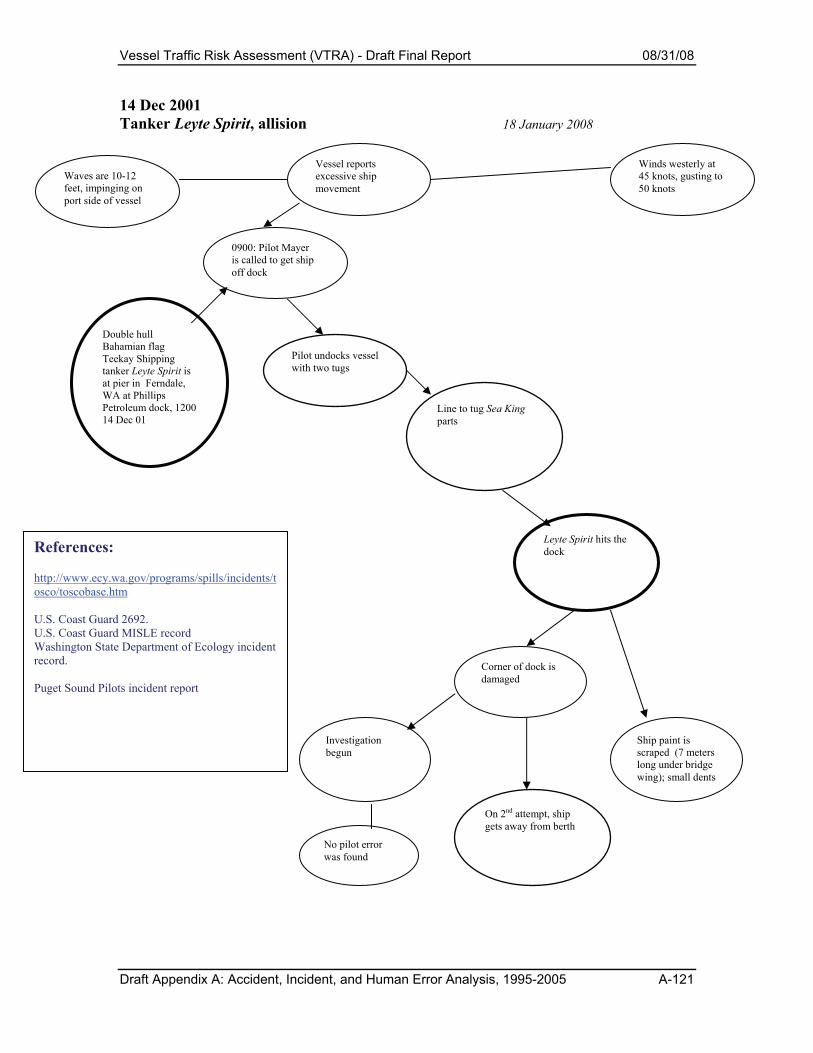
Vessel Traffic Risk Assessment (VTRA) - Draft Final Report 08/31/08
Draft Appendix A: Accident, Incident, and Human Error Analysis, 1995-2005 A-121
14 Dec 2001 Tanker Leyte Spirit, allision 18 January 2008
Double hull Bahamian flag Teekay Shipping tanker Leyte Spirit is at pier in Ferndale, WA at Phillips Petroleum dock, 1200 14 Dec 01
Pilot undocks vessel with two tugs
Line to tug Sea King parts
Investigation begun
Leyte Spirit hits the dock
On 2nd attempt, ship gets away from berth
Corner of dock is damaged
References: http://www.ecy.wa.gov/programs/spills/incidents/tosco/toscobase.htm U.S. Coast Guard 2692. U.S. Coast Guard MISLE record Washington State Department of Ecology incident record. Puget Sound Pilots incident report
Ship paint is scraped (7 meters long under bridge wing); small dents
No pilot error was found
Vessel reports excessive ship movement
0900: Pilot Mayer is called to get ship off dock
Winds westerly at 45 knots, gusting to 50 knots
Waves are 10-12 feet, impinging on port side of vessel

Vessel Traffic Risk Assessment (VTRA) - Draft Final Report 08/31/08
Draft Appendix A: Accident, Incident, and Human Error Analysis, 1995-2005 A-122
5 December 1999 ITB New York, grounding 18 January 2008
Single hull US flag US Shipping Partners L.P. ITB New York in Fidalgo Bay
ITB New York anchored off March Point in Anacortes
2025: it was observed that the anchor was dragging.
Current: ebbing
Wind: about 55 knots
2046: ITB New York reports grounding on Guemes Island at Southeast Point
References: U.S. Coast Guard 2692. U.S. Coast Guard MISLE record Washington State Department of Ecology incident record. VTS Puget Sound Incident report, IR #PS044-99, 5 December 1999 Email, BP/Craig Lee, 17 January 2008 0742 to M. Grabowski
Vessel light in ballast
Underwater survey performed
Weather overcast, 6 nautical mile visibility Wind from the
SE at 40 knots
2044: Vessel requests assistance from VTS
VTS Sector Operator identifies Garth Foss as assist tug
Garth Foss identifies Arthur and Wendell Foss as assist assets
Garth, Arthur and Wendell Foss en route
2101: Arthur Foss had line over to ITB New York
ITB New York master reports vessel aground on port quarter, no damage to propellers or rudder
VTS Watch Supervisor Booth notes that vessel position different via ITOS
Paint scraping detected
ITB New York new position noted
Garth Foss and Wendell Foss are on scene
2145: VTS Command Duty Officer tells master of ITB New York not to move vessel
ITB New York master informs VTS that vessel had been pulled afloat, with no damage
2205: Garth Foss departs
2315: ITB New York re-anchored with pilot L. Thorsen aboard at Anacores
Arthur Foss is relieved by Henry Foss
Henry and Wendell Foss tugs have lines on ITB New York
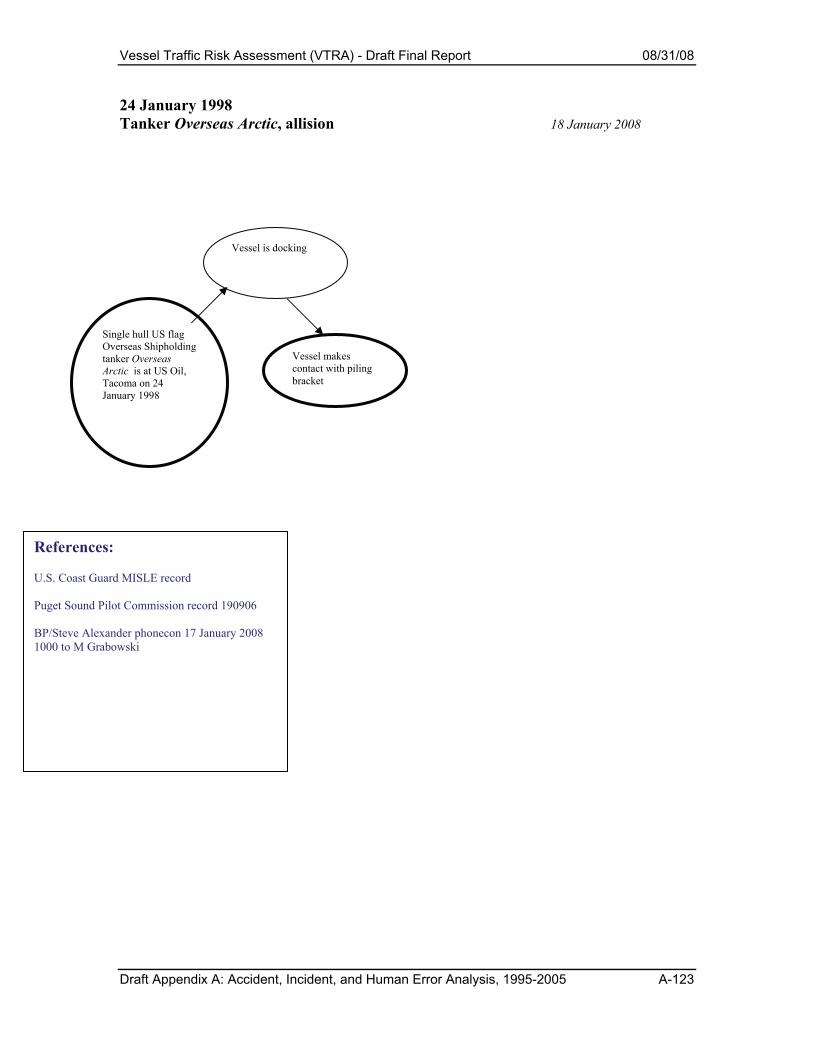
Vessel Traffic Risk Assessment (VTRA) - Draft Final Report 08/31/08
Draft Appendix A: Accident, Incident, and Human Error Analysis, 1995-2005 A-123
24 January 1998 Tanker Overseas Arctic, allision 18 January 2008
Single hull US flag Overseas Shipholding tanker Overseas Arctic is at US Oil, Tacoma on 24 January 1998
Vessel makes contact with piling bracket
References: U.S. Coast Guard MISLE record Puget Sound Pilot Commission record 190906 BP/Steve Alexander phonecon 17 January 2008 1000 to M Grabowski
Vessel is docking

Vessel Traffic Risk Assessment (VTRA) - Draft Final Report 08/31/08
Draft Appendix A: Accident, Incident, and Human Error Analysis, 1995-2005 A-124
13 January 2002 Tanker Overseas Boston, pollution
Single hull US flag Overseas Shipholding tanker Overseas Boston in TOSCO pier, Ferndale, WA
Failure of the No. 4 MLA coupler to remain locked on the ship’s flange
Vessel moored alongside Philips dock
Product was being off loaded from the Overseas Boston
The loading arm became uncoupled from Overseas Boston
Stop the flow of oil
Oil was released onto the pier, the deck of the ship, and into the water
Most of the oil was kept under the pier and most of it had been recovered by 14-Jan.
Take immediate steps
References: http://www.ecy.wa.gov/programs/spills/incidents/tosco/toscobase.htm U.S. Coast Guard 2692. U.S. Coast Guard MISLE record Washington State Department of Ecology incident record.
Contain what oil had already spilled
All persons were notified

Vessel Traffic Risk Assessment (VTRA) - Draft Final Report 08/31/08
Draft Appendix A: Accident, Incident, and Human Error Analysis, 1995-2005 A-125
12 November 2004 Tanker Gulf Scandic, Propulsion Failure 18 January 2008
Double hull Isle of Man flag Nordic American Tanker/Gulf Navigation tanker Gulf Scandic inbound Strait of Georgia on 12 Nov 2004
One cylinder not in use
Main engine speed limited
Max is slow ahead during maneuvering
Maximum speed through water is approx. 10 knots
Vessel renamed British Harrier
References: U.S. Coast Guard 2692. U.S. Coast Guard MISLE record Washington State Department of Ecology incident record. BP/Steve Alexander phonecon with M. Grabowski, 17 January 2008 1000EST
Transit takes place at night, in winter

Vessel Traffic Risk Assessment (VTRA) - Draft Final Report 08/31/08
Draft Appendix A: Accident, Incident, and Human Error Analysis, 1995-2005 A-126
11 February 2002 18 January 2008 Tanker Blue Ridge, Unusual Event Wire in propeller
Double bottom US flag Crowley Petroleum Transport Tanker Blue Ridge, built in 1981 and in BP service, sailed Martinez on Feb 7.
Tanker Blue Ridge arrived Port Angeles on Feb 10.
0300, Feb 10: Blue Ridge got underway from Port Angeles anchorage 10
Damage to the Tanker
Stern tube seal leak; sea water leaking in
Divers perform inspection
Heavy mooring line and chain become wrapped around propeller
Damage to propeller; two lengths of chain attached
Vibration on vessel
Vessel towed from Port Angeles to Vancouver, BC on Feb 13
Tanker Blue Ridge arrived Anchorage Bravo, Vancouver, 0139, Feb 14, for repairs
References: Events, Incidents & Operations, Daily Shipping Newsletter: Tuesday 19-02-2002 U.S. Coast Guard 2692. U.S. Coast Guard MISLE record Washington State Department of Ecology incident record. Lloyd’s Casualty Reporting Service, Vancouver, 14 February 2002
Tanker Blue Ridge goes to anchor, awaiting berth in Anacortes to load.
Tanker Blue Ridge heaves up anchor.
Decision made to move vessel to drydock
TAP ROOT investigation underway


![Assessing Uncertainty in Simulation Based Maritime Risk ...dorpjr/Publications/JournalPapers/RA...techniques such as bootstrap or likelihood based methods [27], the Bayesian paradigm](https://static.fdocuments.net/doc/165x107/6108c051ebc1373ab9260bb6/assessing-uncertainty-in-simulation-based-maritime-risk-dorpjrpublicationsjournalpapersra.jpg)


