Technical and Financial Analysis of Using Variable Frequency Drive … Roba... · 2014. 9. 23. ·...
115
An-Najah National University Faculty of Graduate Studies Technical and Financial Analysis of Using Variable Frequency Drive for Water Pumps Compared with Fixed Frequency By Anwer Yaser Roba Supervisor Prof. Marwan Mahmoud This thesis is submitted in Partial Fulfillment of the Requirements for the Degree of Master of Clean Energy Conservation Strategy Engineering, Faculty of Graduates Studies, An-Najah National University, Nablus, Palestine 2014
Transcript of Technical and Financial Analysis of Using Variable Frequency Drive … Roba... · 2014. 9. 23. ·...

An-Najah National University
Faculty of Graduate Studies
Technical and Financial Analysis of Using Variable
Frequency Drive for Water Pumps Compared with
Fixed Frequency
By
Anwer Yaser Roba
Supervisor
Prof. Marwan Mahmoud
This thesis is submitted in Partial Fulfillment of the Requirements for
the Degree of Master of Clean Energy Conservation Strategy
Engineering, Faculty of Graduates Studies, An-Najah National
University, Nablus, Palestine
2014


III
Dedication
I would like to dedicate my thesis work to
My father, mother, brother and sisters.
All friends and colleagues.
Every one works in this field.

IV
Acknowledgment
A special thanks to my family. Words cannot express how
grateful I am to my mother, and father for all of the sacrifices that
you‘ve made on my behalf. Your prayer for me was what
sustained me thus far.
I would also like to thank all of my friends who supported me in
writing, and incented me to strive towards my goal.
My thanks go to the staff of Clean Energy and Conservation
Strategy Engineering Master Program in An-Najah National
University.
Finally, and most importantly, my furthermost appreciation to my
supervisor, Prof. Marwan Mahmoud for his exceptional guidance
and insightful comments and observations throughout the
duration of this project.
V
الإقرار
م الرسالة التي تحمل العنوان:أدناه مقدالموقعة أنا
Technical and Financial Analysis of Using Variable
Frequency Drive for Water Pumps Compared with
Fixed Frequency
اشتممت عميو ىذه الرسالة ، إنما ىي نتاج جيدي الخاص ، باستثناء ما تمت الإشارة أقر بأن ماإليو حيثما ورد ، و أن ىذه الرسالة ككل ، و أي جزء منيا لم يقدم من قبل لنيل درجة عممية أو
بحث عممي لدى أي مؤسسة تعميمية أو بحثية أخرى.
Declaration
The work provided in this thesis, unless otherwise referenced, is the
researcher's own work, and has not been submitted elsewhere for any other
degree or qualification.
Student’s name: :اسم الطالب
Signature: :التوقيع
Date: :التاريخ

VI
Table of Contents No. Content page
Dedication III Acknowledgment IV Declaration V Table of Contents VI List of Figures VIII List of Table X Abstract XI Chapter One: Introduction 1 1.1 Introduction to Ground Water Well Pumping System 2 1.2 Water in Palestine 2 1.3 Pump 4 1.4 Variable Frequency Drive (VFD) 5 1.5 Motor 6 Chapter Two: Ground Water Wells in Palestine 8 2.1 Introduction to Ground Water Wells 9 2.2 Palestinian Water Resources 10 2.3 Usage of Ground Water 11
2.4 The Control of Occupation on the Ground Water in Palestine:
12
Chapter Three: Water Pumping System 14 3.1 Introduction to Water Pumping System 15 3.2 Types of Pumps 16 3.2.1 Centrifugal Pumps 16 3.2.2 Positive Displacement Water Pumps: 18 3.2.3 Typical Performance Curve of Centrifugal Pump 18 3.2.3.1 Head Calculation 19 3.2.3.2 Power Consumption 20 3.2.3.3 Efficiency Calculation Of Centrifugal Pump 21 3.2.3.4 NPSH Definition 22 3.3 Pump Affinity Relationships 23 3.4 Component of Pumping Systems 24 3.4.1 Pump 25 3.4.2 Motor 25 3.4.3 Control Box 25 3.4.4 Pressure Tank 26 Chapter Four: Practical Experiments On Pump Systems 27 4.1 Types of Tested Water Pumps 28 4.1.1 Abu Saleh groundwater well pump 28
4.1.2 Agricultural irrigation company Ground Water Well Pump
30
4.1.3 Waleed Ribhi groundwater well pump 32

VII
Chapter Five: Induction Motor 35 5.1 Characteristic of Induction Motors 36 5.1.1 Characteristic 38 5.1.2 Running Characteristic 39 5.1.3 Load Characteristic 40
5.1.4 Effects of Torque on the Characteristics of Induction Motor
42
5.2 Starting Method 45 5.2.1 Soft Starter (SS) 46 5.2.2 Variable Frequency Convertor Drive 49 5.2.2.1 Description of variable frequency convertor 49
5.2.2.2 Speed control method by using variable frequency convertor
50
5.3 Parameters of Used Induction Motor 51 5.3.1 Technical Data for Abu Saleh Induction Motor 51
5.3.2 Technical Data for Agriculture Company Induction Motor
53
5.3.3 Technical Data for Waleed Ribhi Induction Motor 54
Chapter Six: Control Methods of Water Pumping Systems and Field Testing Results
56
6.1 Setup of Water Pumping System (WPS) 57 6.2 Control Circuit and Protection 58 6.2.1 Description of Practical Control Methods 59 6.3 Practical Result's 61 6.3.1 Practical Result for using soft starter at Abo Saleh Well 62 6.3.1.1 First experiment at period (2-8 /10/2013) 62 6.3.1.2 Second experiment at period (13-17 /04/2014) 66
6.3.2 Practical Results for using variable frequency drive at Agriculture Irrigation Company well
69
6.3.3 Practical Results for using variable frequency drive at Waleed Ribhi Well.
78
Chapter Seven: Financial Analysis 82 7.1 Introduction 83 7.2 Financial Analysis 83 7.3 Energy Saving Using Variable Frequency Convertor 85 Chapter Eight: Conclusions and Recomendations 87 8.1 Conclusion 88 8.2 Recommendations 91 References 92 Appendix (A) Data sheet for using pump 97 Appendix (B) Electrical drawings for pump control box 99 ب الملخص

VIII
List of Figures No. Caption Page
Figure(1.1) Map of shared and non-shared groundwater aquifers
[4]. 4
Figure (1.2) Abu Salah Well information [9] 10
Figure(2.20) Agricultural Irrigation Company Well information [9]. 10
Figure (3.1) Type of pumps used in ground water well. 15
Figure (3.2) Hydraulic components of centrifugal pump [5]. 17
Figure (3.3) Typical performance curves for a centrifugal pump [5]. 19
Figure (3.4) P1 and P2 power curves. 20
Figure (3.5) Efficiency curves for the pump (η ) and complete
pump unit with motor and controller (η ). 21
Figure (3.6) Cavitations on impeller. 22
Figure (3.70) Change in pump characteristic through changing
the wheel velocity. 24
Figure (3.8) Pumping System. 24
Figure (4.1) Design Curve of Abu Saleh well pumps [21]. 29
Figure (4.2) Design curve of Agricultural Irrigation Company pump
[21] 31
Figure (4.3) Design Curve of Waleed Ribhi well pump [21]. 33
Figure (5.1) Speed – Torque curve for induction motor [27]. 37
Figure (5.2) Typical Torque-Speed curve of 3-PHASE AC
Induction motor [28]. 37
Figure (5.3) Torque-Seed Curve – Same Motor with two different
loads [28]. 42
Figure (5.4) Constant Torque, Variable Speed Loads [28]. 42
Figure (5.5) Variable Torque, Variable Speed Loads [28]. 43
Figure (5.6) Constant Power Loads[28]. 44
Figure (5.7) Constant Power& Constant Torque Loads [28] 44
Figure (5.8) Basic diagram of soft starter[30] 48
Figure (5.9) Basic block diagram of the voltage-ramp technique[30]. 49
Figure (5.10) A typical frequency converter 50
Figure (5.11) Name plate of Abu Saleh well motor. 52
Figure (5.12) Name plate of Agriculture Company well motor 53
Figure (5.13) Name plate of Waleed Ribhi Company well motor 55
Figure (6.1) Water Pumping System Component 57
Figure (6.2) Electrical control circuit for both tested wells . 60
Figure (6.3) Control method description . 61
Figure (6.4) Energy analyzer device and collecting data process 62
Figure (6.5) Average voltage ,current ,total power for Abu saleh
pump during first testing period. 64
Figure (6.6) Average reactive power for Abu saleh pump during 66

IX
first testing period
Figure (6.7) Average voltage ,current ,total power for Abu saleh
pump during second testing period 67
Figure (6.8) Average reactive power for Abu saleh pump during
second testing period 69
Figure (6.9) Average voltage ,current ,total power for Abu saleh
pump during second testing period 70
Figure (6.10) Pump Affinity Laws Applied to Agriculture irrigation
well 71
Figure (6.11) Average reactive power for irrigation company pump 73
Figure (6.12) Effect of speed variation on pump characteristics 77
Figure (6.13) flow rate versus Efficiency of pump at deferent speeds 78
Figure (6.14) Average voltage ,current ,total power for Waleed Ribhi
pump during second testing period 80
Figure (6.15) Average reactive power for Waleed Ribhi pump . 81
Figure A1 Front plate of the control panel 99
Figure A2 Power Circuit of the Control System 100
Figure A3 Control Circuit of the Control System 101
Figure A4 Control Circuit of the Control System 102

X
List of Table No. Table Page
Table (2.1) Palestinian Aquifer Recharge rates [10]. 11
Table (2.2) Estimated Municipal and Industrial (Mcm/yr) total water use in Palestine [11].
11
Table (2. 3) Estimated Total Water Supply (Mcm/yr) for Irrigation in Palestine [11].
11
Table (3.1) pump performance for a given change in pump shaft rotational speed
23
Table (4.1) Abu Saleh vertical pump, technical data [21] . 28
Table (4.2) Performance evaluation of Abu Saleh well pump test by manufacturer [21].
29
Table (4.3) Agricultural irrigation company vertical pump ,technical data [21].
30
Table (4.4) Performance evaluation of irrigation company pump [21].
32
Table (4.5) Waleed Ribhi vertical pump ,technical data [21]. 32
Table (4.6) Performance evaluation of Waleed Ribhi well pump test by manufacturer [21].
33
Table (5.1) Abu Saleh well motor ,name plate data [33]. 52 Table (5.2) Agriculture Company well motor ,name plate data [33]. 53 Table (5.3) Waleed Ribhi well motor ,name plate data [33]. 54
Table (6.1) Changes on flow rate , pressure ,power during change on frequency , when pump water for two costumers .
74
Table (6.2) Changes on flow rate , pressure ,power during change on frequency , when pump water for two costumers .
75
Table (6.3) Changes in flow rate and head through change pressure at 45 Hz frequency.
76
Table (6.4) Changes in flow rate and head through change pressure at 46.5 Hz frequency.
76
Table (6.5) Changes in flow rate and head through change pressure at 48 Hz frequency.
76
Table (6.4) Changes in flow rate and head through change pressure at 50 Hz frequency.
77
Table.(7.1) Financial Comparison between soft starter and VFD cost. 84
Table.(7.2) Additional cost for required components (manufactured Siemens ) used with soft starter.
84
Table(8.1) Major comparison between soft starters and VFDs .[42] 90

XI
Technical and Financial Analysis of Using Variable Frequency Drive
for Water Pumps Compared with Fixed Frequency
By
Anwer Yaser Roba
Supervisor
Prof. Marwan Mahmoud
Abstract
Variable speed drives in the water pumping systems are now a mature
technology, can achieve significant gains for the user to reduce costs
improve the efficiency and reliability, the right applications. However it is
dear that higher costs and lower overall system efficiency are combined
with the traditional control frequency system.
In this thesis, the performance of one water pumping system with a
constant frequency ( 50 Hz) will be theoretically and practically analyzed
and compared with another water pumping systems with variable frequency
both system types are built on three artesian wells operating in Tulkarm
area for irrigation of farms where one system operate with constant
frequency ( soft start) and remaining two systems with variable frequency
inverter .

1
Chapter One
Introduction

2
1.1 Introduction to Ground Water Well Pumping System
A water system is needed to pump the water out of the well to the surface
and deliver it under pressure to the place where you will be using it. A
typical home water system , consists of a pump, a pitiless adapter or unit,
and a pressure storage tank and control devices that allow the system to
operate automatically.
A well is the most common way to obtain groundwater for household use.
A well is basically a hole in the ground, held open by a pipe (or casing) that
extends to an aquifer. A pump draws water from the aquifer for distribution
through the plumbing system. The depth to which wells are constructed is
determined by factors such as the depth of groundwater, the groundwater
quality, and the geologic conditions at the well site [2].
1.2 Water in Palestine
The rain water is the main source of water in Palestine, but it fluctuates
from year to year. So, the ground water will be the main source.
Groundwater is water located beneath the earth's surface through geological
formations. On the other hand, the ground water is obtained through water
pumps which lift the water by a mechanical action by using different
methods.
Most of the West Bank‘s natural water resources lie beneath its soil in three
shared aquifers sometimes collectively known as the ―Mountain Aquifer‖.
All three of these aquifers derive most of their recharge from rainfall and
snowmelt on the Palestinian side of the Green Line. Two of the three
aquifers (the Western and North-Eastern) also underlie Israeli territory,

3
with a flow that follows the surface topography, from the West Bank
towards Israel. The third aquifer – the Eastern – lies almost completely
within the West Bank and discharges towards the Dead Sea. An overall
view of Israel‘s and West Bank and Gaza‘s shared and non-shared
groundwater aquifers is provided in a map shown in figure (1.1).
All three aquifers share the same predominant geology, largely karstic
limestone formations, and are hierologically characterized by great depth
(average 250 metres) and relatively rapid flow [2].
The Western Aquifer, with an estimated renewable yield of about 335-450
MCM, flows from the western slopes of the Palestinian hills towards the
coast. Water from this aquifer, typically of a very high quality, provides
about one fifth of Israel‘s fresh water, pumped from numerous wells
located just west of the Green Line. In the North-Eastern Aquifer, natural
replenishment is estimated at between 130-200 MCM. The Eastern
Aquifer, estimated recharge of 155-237 MCM, drains to the Jordan River
and the Dead Sea. The aquifer lies almost completely within the West Bank
and contains locally more saline waters [3].

4
Figure 1.2): Map of shared and non-shared groundwater aquifers [4].
1.3 Pump
The focus of this thesis is to make financial analysis for energy efficiency
for the ground water pumps controlled by a soft starter and others
controlled by a variable frequency converter. Pumps are devices used to
transfer liquids from low-pressure zones to high-pressure zones, or to move
them from a low elevation into a higher elevation. There are many types of
pumps used for many applications for ground water, wastewater
application, circulation of water in closed systems e.g. heating, cooling and
air conditioning systems. In this thesis I will introduce centrifugal pump
that specially use to left water through ground water well. An increase in
the fluid pressure from the pump inlet to its outlet is created when the
5
pump is in operation. This pressure difference drives the fluid through the
system or plant.
The centrifugal pump creates an increase in pressure by transferring
mechanical energy from the motor to the fluid through the rotating
impeller. The fluid flows from the inlet to the impeller center and out along
its blades. The centrifugal force hereby increases the fluid velocity and
consequently the kinetic energy is transformed into pressure. [5].
Pumps are used widely in industry to provide cooling and lubrication
services, to transfer fluids for processing, and to provide the motive force
in hydraulic systems. Pumping systems account for nearly 20% of the
world‘s electrical energy demand and range from 25-50% of the energy
usage in certain industrial plant operations. With raising energy costs,
process plants are increasing their focus on the amount of energy consumed
by rotating equipment. An improperly sized or poorly performing pump
consumes unnecessary money [6].
1.4 Variable Frequency Drive (VFD)
VFD is a device using power electronics to vary the frequency of input
power to the motor, thereby controlling motor speed.
There are many diverse reasons for using variable Frequency drives. Some
applications, such as paper making machines, cannot run without them
while others, such as centrifugal pumps can benefit from energy savings [7].
In general, variable speed drives are used to:
Match the speed of a drive to the process requirements.
Match the torque of a drive to the process requirements.

6
Save energy and improve efficiency [7].
The benefits of energy savings are not always fully appreciated by many
users. These savings are particularly apparent with centrifugal pumps and
fans, where load torque increases as the square of the speed and power
consumption as the cube of the speed. Substantial cost savings can be
achieved in some applications .
1.5 Motor
For industrial and mining applications, 3-phase AC induction motors are
the prime movers for the vast majority of machines. These motors can be
operated either directly from the mains or from adjustable frequency drives.
In modern industrialized countries, more than half the total electrical
energy used in those countries is converted to mechanical energy through
AC induction motors. The applications for these motors cover almost every
stage of manufacturing and processing. Applications also extend to
commercial buildings and the domestic environment. They are used to
drive pumps, fans, compressors, mixers, agitators, mills, conveyors,
crushers, machine tools, cranes, etc [7].In the last decade, it has become
increasingly common practice to use 3-phase squirrel cage AC induction
motors with variable frequency converters for variable speed drive (VSD)
applications, to clearly understand how the VSD system works, it is
necessary to understand the principles of operation of this type of motor.
The thesis consists of eight chapters:

7
Chapter 1: Provides an introduction to the water sources in Palestine, the
method for pumping ground water by using centrifugal pump and VFD for
conserving energy.
Chapter 2: Shows all ground water wells in Palestine, and the quantity of
water used in several fields for drinking, agriculture, and industry.
Chapter 3: Describes the water pumping system and the basic component
in the system.
Chapter 4: Studies types of pumps used for water application and to
choose more suitable pumps based on mechanical and electrical
characteristic.
Chapter 5: Studies the characteristic of induction motor and the possibility
to conserve energy by using VFD.
Chapter 6: Presents practical water pumping system and its control
method.
Chapter 7: Financial analysis for using variable frequency convertor drive
VFD as a driver for a pump with other pumps using a soft starter as a
driver.
Chapter 8: Presents the main conclusion of this thesis and
recommendation for future work.

8
Chapter Two
Ground Water Wells in Palestine

9
2.1 Introduction to Ground Water Wells
A water well is a hole, shaft, or excavation used for the purpose of
extracting ground water from the subsurface. Water may flow to the
surface naturally after excavation of the hole or shaft. Such a well is known
as a flowing ground water well. More commonly, water must be pumped
out of the well.
Most wells are vertical shafts, but they may also be horizontal or at an
inclined angle. Horizontal wells are commonly used in bank filtration,
where surface water is extracted via recharge through river bed sediments
into horizontal wells located underneath or next to a stream. Some wells are
used for purposes other than obtaining ground water oil and gas wells are
examples of this [8].
This thesis focuses on vertical water-production wells commonly used to
supply water for domestic, municipal, and agricultural uses. Three vertical
wells conducted to practical test Agricultural irrigation company well and
Mr. Waleed Ribhi that use VFD drive ,the other one Mr. Abu Saleh ground
water well that use soft starter to drive the pump motor. Mr. Waleed Ribhi
well neglected from analysis due to problem in mechanical structure that
caused water leakage in his network resulting high cost for pumped water
that will be shown in chapter six.
10
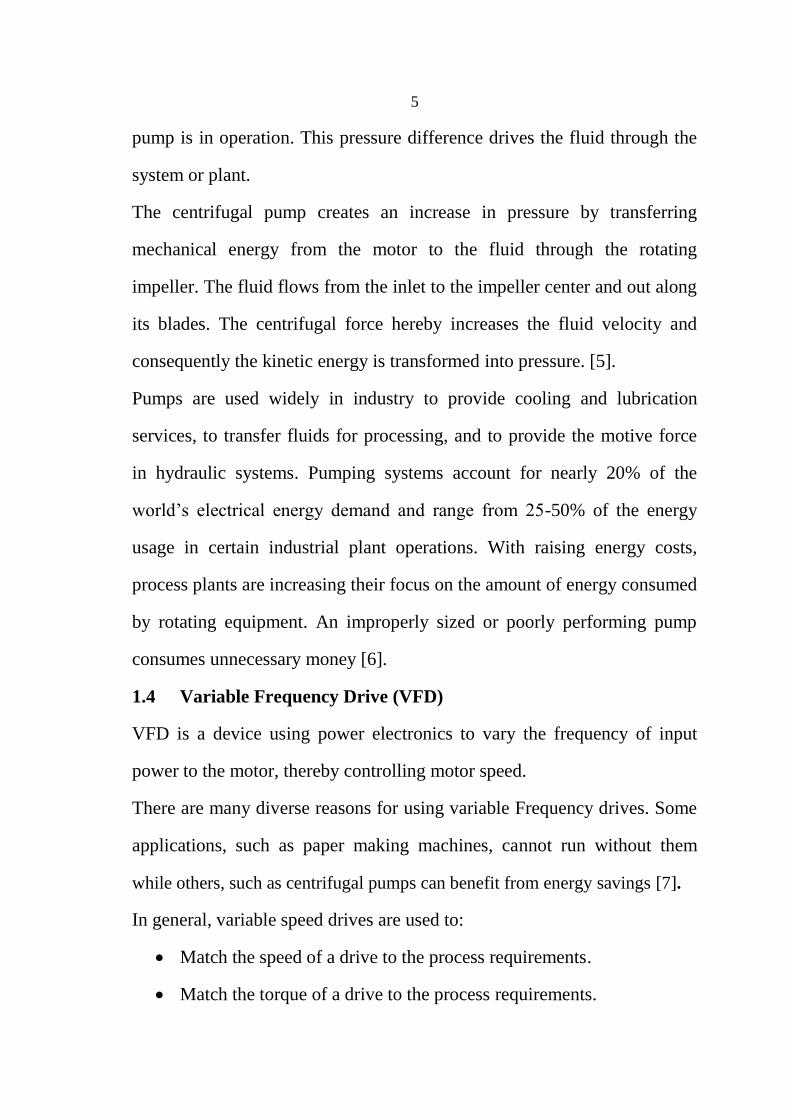
Figure(2.1): Abu Salah Well information [9].
Figure (2.2): Agricultural Irrigation Company Well information [9].
2.2 Palestinian Water Resources
The existing Palestinian water resources in the West Bank are primarily
derived from four aquifer basins Eastern, Northeastern and Western Table
(2.1) show the Palestinian Aquifer Recharge rates from this aquifer as well
as a series of springs that emanate from the groundwater. Other sources of
water are the Jordan River and wadi runoffs.

11
Table (2.1): Palestinian Aquifer Recharge rates [10].
Aquifer Basin Recharge Rates (Mcm/yr)
Eastern 100-172
Northeastern 130-200
Western 335-450
Gaza Coastal 55-65
Total 620-887
2.3 Usage of Ground Water
The quantity of the ground water used in Palestine for municipal ,industry
and irrigation Table(2.2) show Estimated Municipal and Industrial
(Mcm/yr) total water use in Palestine , Table(2.3) Estimated Total Water
Supply (Mcm/yr) for Irrigation in Palestine [11].
Table (2.2): Estimated Municipal and Industrial (Mcm/yr) total water
use in Palestine [11].
Region Wells Springs Total
West Bank 55* 4 59
Gaza Strip 53** - 53
Total 108 4 112
* 22 Mcm/yr are purchased from Israeli sources
** 48 Mcm/yr are abstracted from wells in the Gaza aquifer and 5 Mcm/yr are
supplied from the Mekorot Israeli water company.
Table (2. 3): Estimated Total Water Supply (Mcm/yr) for Irrigation in
Palestine [11].
Region Wells Brackish wells Springs Total
West Bank 40 0 49 89
Gaza Strip 43 42 0 85
Total 83 42 49 174

12
2.4 The Control of Occupation on the Ground Water in Palestine:
Israeli occupation systematically escalates its aggression against the
Palestinian population and their property across the occupied Palestinian
territories; where these attacks targeted on the sources and the elements of
life and equated development, especially water which is the main
ingredient for the survival of every human life [12].
Water resources in Palestine consist of groundwater resources, groundwater
system in the West Bank, and the coastal aquifer, in addition to the Jordan
River system. Israel controls nearly all Palestinian water resources and use
about 89 percent of the water available, leaving only 11% for the
Palestinians. Over the last decade, the Palestinians were able to pump water
from the aquifer in the West Bank but they were prohibited. This decreased
the total amount of 138 million cubic meters in 1999 to 93 million cubic
meters in 2009. The result was that the level of ground water has been
reduced beneath the surface of the sea and the salty water had begun to
enter the aquifer [12].
The Israelis use ALL of these quantities for the following purposes:
1. About 33% for drinking.
2. Irrigation purposes by rate more than Palestinian water pumping
ratio [11].
In addition, Israel's ambitions appeared in control and theft of water from
water basins and prevent the Palestinians to use it, including through the
establishment of the wall that matches the path with the path of aquifers,
confiscate water wells and prevent digging artesian wells.

13
The occupation do not take into account the growing needs of water per
year, resulting from increasing natural population, expansion of cultivated
areas and other agricultural businesses. This situation led to increasing
water problems, needs of agricultural, industrial and household increasing
but the available quantities are limited. On the other hand, Gaza suffers
from high water salinity and pollution, as a result of the lack of
groundwater recharge and increasing used quantities to cover water needs.

14
Chapter Three
Water Pumping System

15
3.1 Introduction to Water Pumping System
Pumps are devices used to transfer liquids from low-pressure zones to high-
pressure zones, or to move it from a low elevation into a higher elevation.
Pumps are also used to accelerate liquids through pipes. illustrated that
without using a pump in this system, the liquid would move in the opposite
direction because of the difference of pressure [15].
The Pumping system components is motor- pump, control system,
discharge assembly and storage tank.
Two common well construction methods as shown in figure 3.1): On the
left is an example of a vertical turbine type pump installation and on the
right is an example of a submersible type pump installation [1].
Figure(3.1): Type of pumps used in ground water well.

16
3.2 Types of Pumps
Pumps come in a variety of sizes for a wide range of applications. They can
be classified according to their basic operating principle as dynamic or
displacement pumps. Dynamic pumps can be sub-classified as centrifugal
and special effect pumps. Displacement pumps can be sub-classified as
rotary or reciprocating pumps [13].
In general, any liquid can be handled by any of the pump designs. Where
different pump designs could be used depending on Performance
evaluation, efficient system operation, flow control strategies and energy
conservation opportunities.
The centrifugal pump is generally the most economical then followed by
rotary pump and reciprocating pumps from economical performance.
Although, positive displacement pumps are generally more efficient than
centrifugal pumps, the benefit of higher efficiency tends to be offset by
increased maintenance costs [14].
3.2.1 Centrifugal Pumps
A centrifugal pump is a very simple design as shown in figure (3.2). The
two main parts of the pump are the impeller and the diffuser. Impeller,
which is the only moving part, is attached to a shaft and driven by a motor.
Impellers are generally made of bronze, polycarbonate, cast iron, stainless
steel as well as other materials. The diffuser (also called as volute) Houses
the impeller and captures and directs the water off the impeller [5].

17
Figure(3.2): Hydraulic components of centrifugal pump [5].
Water enters the center (eye) of the impeller and exits the impeller with the
help of centrifugal force. As water leaves the eye of the impeller a low-
pressure area is created, causing more water to flow into the eye.
Atmospheric pressure and centrifugal force cause this to happen. Velocity
is developed as the water flows through the impeller spinning at high
speed. The water velocity is collected by the diffuser and converted to
pressure by specially designed passageways that direct the flow to the
discharge of the pump, or to the next impeller that the pump should have a
multi-stage configuration [5].
The pressure (head) that a pump will develop is indirect relationship to the
impeller diameter, the number of impellers, the size of impeller eye and
shaft speed. Capacity is determined by the exit water width of the impeller.
The head and capacity are the main factors, which affect the horsepower
size of the motor to be used. The more quantity of water to be pumped, the
more energy is required.

18
A centrifugal pump is not positive acting; it will not always pump the same
volume. Also, when it pumps against increasing pressure, the less it will
pump. For these reasons it is important to select a centrifugal pump that is
designed to do a particular job.
3.2.2 Positive Displacement Water Pumps:
Positive displacement designs deliver a fixed amount of flow through the
mechanical contraction and expansion of a flexible diaphragm. Liquid
flows into the pump as the cavity on the suction side expands and the liquid
flows out of the discharge as the cavity collapses. The volume is constant
through each cycle of operation.
Positive displacement water pumps advantages and disadvantages:
Positive displacement water pumps or rotary pumps are very efficient, due
to the fact that they remove air from the lines, thus eliminating the need to
bleed the air from the lines. In addition these pumps are great when dealing
with high viscosity liquids.
On the other hand, these pumps require that the clearance between the
rotating pump and the outer edge must be very close. This causes that the
rotation occurs at very slow speeds; otherwise if the pump is operated at
higher speed, the liquids might erode and will eventually reduce the
efficiency of the water pump [15].
3.2.3 Typical Performance Curve of Centrifugal Pump
The standard convention of centrifugal pump is to draw the pump
performance curves showing Flow on the horizontal axis and Head
generated on the vertical axis. Efficiency, Power & NPSH" is a term

19
describing conditions related to cavitations, " are conventionally shown on
the vertical axis, plotted against Flow, as illustrated in figure (3.3) [5].
Figure(3.3): Typical performance curves for a centrifugal pump [5].
3.2.3.1 Head Calculation
A pump curve (HQ curve) shows the head (H) as a function of the flow (Q).
The flow (Q) is the rate of fluid going through the pump. The flow is
generally stated in cubic meter per hour [m3/h] but at insertion into
formulas cubic meter per Second [m3/s] is used.

20
In most cases the differential pressure across the pump is measured and the
head H is calculated by the following formula:
(3.1)
H: head of pump [m]
: Total pressure difference across the pump [Pa]
: Density of liquid, for water = 1000 kg/m3
: Standard gravity acceleration, 9.80665 m/s2
3.2.3.2 Power Consumption
The power curves shown in (3.4) show the energy transfer rate as a
function of flow, the power is given in Watt [W]. Distinction is made
between three kinds of power:
Supplied power from external electricity source to the motor and
controller (P1)
Shaft power transferred from the motor to the shaft (P2)
Hydraulic power transferred from the impeller to the fluid (Phyd).
Figure (3.4): P1 and P2 power curves.

21
The total efficiency (η ) is the ratio between hydraulic power and supplied
power. figure (3.2.3) shows the efficiency curves for the pump (η ) and
for a complete pump unit with motor and controller (η ).
. Figure (3.2.3): Efficiency curves for the pump (η ) and complete pump unit with
motor and controller (η ).
3.2.3.3 Efficiency Calculation Of Centrifugal Pump
The hydraulic efficiency refers to P2, whereas the total efficiency refers to
P1:
(3.2)
(3.3)
The efficiency is always below 100% since the supplied power is always
larger than the hydraulic power due to losses in controller, motor and pump
components. The total efficiency for the entire pump unit (controller, motor
and hydraulics) is the product of the individual efficiencies [17]:
(3.4)

22
3.2.3.4 NPSH Definition
NPSH is a term describing conditions related to cavitations, which is
undesired and harmful. Cavitations are the creation of vapor bubbles in
areas where the pressure locally drops to the fluid vapor pressure. The
extent of cavitations depends on how low the pressure is in the pump.
Cavitations generally lowers the head and causes noise and vibration.
Cavitations first occur at the point in the pump where the pressure is
lowest, which is most often at the blade edge at the impeller inlet, as shown
in figure (3.6)
Figure (3.2.3): Cavitations on impeller.
(3.5)
: The vapor pressure of the fluid at the present temperature [Pa].
: The absolute pressure at the inlet flange [Pa].

23
3.3 Pump Affinity Relationships
The pump affinity laws allow the prediction of centrifugal pump
performance give changes to the speed of the pump or the diameter of
impeller. This article presents the pump affinity laws for reference.
The pump affinity laws can be used to predict the performance of a
centrifugal pump as two variables change, the pump shaft rotational speed
and the pump impeller diameter. They are useful particularly for the
modification of existing pumps to meet a new service. These relationships
are approximate and rely on the assumption that the pump efficiency is
equal at both speeds/diameters. The prediction of performance based on
impeller diameter changes also relies on the assumption that the impellers
are geometrically similar. In all experiments in this thesis the impeller
diameter constant, but the change just happened in speed of pump
The effect on pump performance for a given change in pump shaft
rotational speed can be estimated from the relationships shown in table
(3.1):
Table (3.1): pump performance for a given change in pump shaft
rotational speed Property Relationship
Flow Rate Q2/Q1=(N2/N1) Head h2/h1=(N2/N1)2
Power P2/P1=(N2N1)3
Where:
Q: Volumetric flow rate.
N: Pump shaft rotational speed.

24
h :Pump head.
P :Hydraulic out power .
Figure (3.7): change in pump characteristic through changing the wheel velocity.
3.4 Component of Pumping Systems
The component of pumping system shown in figure
Figure (3.8): Pumping System.
25
3.4.1 Pump
A pump‘s main function is to bring water from a well or lake to an
irrigation system. Pumps can be used to increase water pressure when the
provided pressure isn't high enough. Pumps are generally used in systems
that have elevation extremes and systems that are located in areas that
provide water at low pressures [18].
3.4.2 Motor
A pump draws and expels water using its intake and discharge line. A shaft
connects the motor to the pump blades or impellor. The motor turns the
impellor creating a vacuum or low pressure zone. A vacuum is achieved
when there is zero pressure. Most pumps don't create a true vacuum, but
create a zone with pressure that is lower than air pressure.
3.4.3 Control Box
The control panel includes internal plug-in type Run and Stop Relays to
control the operation of the pump. An adjustable Timing Relay monitors
the operation of the system and automatically shuts down the pump if the
pump does not build pressure or the valve fails to open. Transformer is
used to provide safe indication. The RUN, OPEN, and CLOSE lights
indicate valve and pump operation. The STOP light indicates that an alarm
condition exists and the pump is locked out. Once the alarm condition is
resolved, the RESET button is pressed to activate the system. An
EMERGENCY STOP button provided to stop the pump at the valve
location. When the button is pressed, the valve closes at the normal rate,
and automatically shuts off the pump when the closed limit switch is
tripped [19].

26
3.4.4 Pressure Tank
The functions of a pressure tank are to protect and prolong the life of the
pump by preventing rapid cycling of the pump motor, provide water under
pressure for delivery between pump cycles; and provide additional water
storage under pressure to assist the pump in meeting the total demands of a
system if the pump or well is incapable of supplying the required capacity
[20].

27
Chapter Four
Practical Experiments on Pump Systems

28
4.1 Types of Tested Water Pumps
Two vertical wells conducted to practical test the first one Agricultural
irrigation company well that use VFD drive ,the second one Mr. Abu Saleh
ground water well that use soft starter to drive the pump motor.
4.1.1 Abu Saleh groundwater well pump
The pump of the well is a vertical turbine manufactured by National Pump
Company has a serial number " CVJ8XH4P6CY" table (4.1) show all
technical data for pump.
Table (4.1): Abu Saleh vertical pump, technical data [21] .
Property Design value Property Design value Flow rate (Q) 120 m
3 /h pressure 3262 kpa g
Head (H) 120 m Sphere size 15mm
Speed 1475 rpm Eye area 8264 mm2
Synch speed 1500 rpm Power of motor 55 kW
Diameter 6.6 in Atm pressure 101.4 kPa
Specific speed nq: 87 ,S : 122 Vapor pressure 1.773 kPa
Temperature limit 82.20
Density of fluid 997.2 kg/m³

29
Figure (4.1): Design Curve of Abu Saleh well pumps [21].
From the previous figure at maximum flow 120 m3 /h and maximum head
120 m, we can calculate Efficiency from curve about 79% , Power 49.5 kW
,NPSH r 2.92 m .
Table (4.2) : Performance evaluation of Abu Saleh well pump test by
manufacturer [21].
Flow (m3 /h) Speed (rpm) Head (m) Efficiency (%) Power(kW) NPSH
144 1475 94.7 76 48.8 3.49
120 1475 120 79 49.5 2.92
96 1475 139 78 46.6 2.54
72 1475 156 71 43 2.32
48 1475 171 49 42.6 2.23

30
Sample of calculation :
𝜂
( 4.1)
Phyd = 2.75 ( 4.2)
𝜂
( 4.3)
At flow rate = 120 m3 /h ,head= 120 m :
𝜂
4.4)
𝛈 : Efficiency of pump
Phyd :Hydraulic power( Watt)
Pin :Input power of the pump (Watt)
: density of fluid , for water 1000(kg/m3)
g :gravity (9.81 m/s2)
: convert power to w , hour = 60 s 60 m=
4.1.2 Agricultural irrigation company Ground Water Well Pump
The pump of the well is a vertical turbine manufactured by National Pump
Company has a serial number " CVE12M4P6CY" , with 9 stage's Table
(4.2) show all technical data for pump.
Table (4.3) : Agricultural irrigation company vertical pump ,technical
data [21].
Property Design value Property Design value Flow rate (Q) 213 m
3 /h pressure 2600 kpa g
Head (H) 128 m Sphere size 16mm Speed 1450 rpm Eye area 9077 mm
2
Synch speed 1500 rpm Power of motor 111 kW Diameter 9.75 in Atm pressure 101.4 kPa Specific speed nq:49
S : 46 Vapor pressure 2.339 kPa
Temperature limit 82.20 Density of fluid 997.2 kg/m³

31
Figure (4.2) : Design curve of Agricultural Irrigation Company pump [21].
From the previous figure at maximum flow 213 m3 /h and maximum head
128 m , we can calculate Efficiency from curve about 84% , Power 88kW
,NPSH r 5.19m.

32
Table (4.4) : Performance evaluation of irrigation company pump [21].
Flow (m3 /h) Speed (rpm) Head (m) Efficiency (%) Power (kW) NPSH
265 1475 95.5 74.3 92.2 8.3
221 1475 124 83.7 89 5.47
177 1475 141 80.5 84.5 42.24
133 1475 153 72 76.5 3.97
88.4 1475 161 52.7 65 3.84
Sample of calculation :
𝜂
Phyd = 2.75
𝜂
At flow rate = 221 m3 /h ,head= 124 m :
𝜂
4.1.3 Waleed Ribhi groundwater well pump
The pump of well is vertical turbine manufactured by National Pump
Company has a serial number " CVJ8XH4P6CY" table (4.5) show all
technical data for pump.
Table (4.5) :Waleed Ribhi vertical pump ,technical data [21].
Property Design value Property Design value Flow rate (Q) 120 m
3 /h pressure 3262 kpa g
Head (H) 120 m Sphere size 15mm
Speed 1475 rpm Eye area 8264 mm2
Synch speed 1500 rpm Power of motor 55 kW
Diameter 6.6 in Atm pressure 101.4 kPa
Specific speed nq: 87 ,S : 122 Vapor pressure 1.773 kPa
Temperature limit 82.20
Density of fluid 997.2 kg/m³

33
Figure (4.3) : Design Curve of Waleed Ribhi well pump [21].
From the previous figure at maximum flow 120 m3 /h and maximum head
120 m , we can calculate Efficiency from curve about 79% , Power 49.5
kW ,NPSH r 2.92 m .
Table (4.6) : Performance evaluation of Waleed Ribhi well pump test
by manufacturer [21].
Flow (m3 /h) Speed (rpm) Head (m) Efficiency (%) Power(kW) NPSH
144 1475 94.7 76 48.8 3.49
120 1475 120 79 49.5 2.92
96 1475 139 78 46.6 2.54
72 1475 156 71 43 2.32
48 1475 171 49 42.6 2.23

34
Sample of calculation :
𝜂
Phyd = 2.75
𝜂
At flow rate = 120 m3 /h ,head= 120 m :
𝜂

35
Chapter Five
Induction Motor

36
5.1 Characteristic of Induction Motors
Induction motors are the most used in industry since they are rugged,
inexpensive, and are maintenance free. It is estimated that more than 50%
of the world electric energy generated is consumed by electric machines.
Improving efficiency in electric drives is important, mainly for economic
saving and reduction of environmental pollution [23,24]. Induction motors
have a high efficiency at rated speed and torque. However, at light loads,
motor efficiency decreases dramatically due to an imbalance between the
copper and the core losses. Hence, energy saving can be achieved by
proper selection of the flux level in the motor [25,26].
The induction motor is classified into a single-phase motor and a three-
phase motor according to the using power source. This motor always uses
both auxiliary winding and condenser not only when starting but also
during operation. Generally speaking, its starting torque is not so great, but
its structure is simple and
reliable. In addition, its connection is simple. It is suitable to use in houses
and on factories. For a single-phase induction motor, be sure that the
condenser indicated in the name plate should comply with the capacity of
the motor [27].
The three-phase induction motor has simpler connection, and higher
efficiency and reliability than the single-phase motor, because it can be
driven by a three-phase power source directly. The three-phase motor is
popular as a general-purpose motor. The power source for a three-phase
motor includes (220V 50/60Hz), (380V 50/60Hz), (440V50/60Hz). Refer
to Figure (5.1) [27].

37
Figure (5.1) : Speed – Torque curve for induction motor [27].
Almost 90% of the three-phase AC Induction motors are of this type. Here,
the rotor is of the squirrel cage type and it works as explained earlier. The
power ratings range from one-third to several hundred horse-power in the
three-phase motors. Motors of this type , rated one horsepower or larger,
cost less and can start heavier loads than their single-phase counterparts [28].
Figure (5.2) :Typical Torque-Speed curve of 3-PHASE AC Induction motor [28].

38
5.1.1 Starting Characteristic
Induction motors, at rest, appear just like a short circuited transformer and
if connected to the full supply voltage, draw a very high current known as
the ―Locked Rotor Current.‖ They also produce torque which is known as
the ―Locked Rotor Torque‖. The Locked Rotor Torque (LRT) and the
Locked Rotor Current (LRC) are a function of the terminal voltage of the
motor and the motor design. As the motor accelerates, both the torque and
the current tend to alter with rotor speed if the voltage is maintained
constant.
The starting current of a motor with a fixed voltage will drop very slowly
as the motor accelerates and will only begin to fall significantly when the
motor has reached at least 80% of the full speed. The actual curves for the
induction motors can vary considerably between designs but the general
trend is for a high current until the motor has almost reached full speed.
The LRC of a motor can range from 500% of Full-Load Current (FLC) to
as high as 1400% of FLC. Typically, good motors fall in the range of 550%
to 750% of FLC.
The starting torque of an induction motor starting with a fixed voltage will
drop a little to the minimum torque, known as the pull-up torque, as the
motor accelerates and then rises to a maximum torque, known as the
breakdown or pull-out torque, at almost full speed and then drop to zero at
the synchronous speed. The curve of the start torque against the rotor speed
is dependent on the terminal voltage and the rotor design.

39
The LRT of an induction motor can vary from as low as 60% of FLT to as
high as 350% of FLT. The pull-up torque can be as low as 40% of FLT and
the breakdown torque can be as high as 350% of FLT. Typically, LRTs
for medium to large motors are in the order of 120% of FLT to 280% of
FLT. The PF of the motor at start is typically 0.1-0.25, rising to a
maximum as the motor accelerates and then falling again as the motor
approaches full speed [28].
5.1.2 Running Characteristic
Once the motor is up to speed, it operates at a low slip, at a speed
determined by the number of the stator poles. Typically, the full-load slip
for the squirrel cage induction motor is less than 5%. The actual full-load
slip of a particular motor is dependent on the motor design. The typical
base speed of the four pole induction motor varies between 1420 and 1480
RPM at 50 Hz, while the synchronous speed is 1500 RPM at 50 Hz. The
current drawn by the induction motor has two components: reactive
component (magnetizing current) and active component (working current).
The magnetizing current is independent of the load but is dependent on the
design of the stator and the stator voltage. The actual magnetizing current
of the induction motor can vary, from as low as 20% of FLC for the large
two pole machine, to as high as 60% for the small eight pole machine. The
working current of the motor is directly proportional to the load.
The tendency for the large machines and high-speed machines is to exhibit
a low magnetizing current, while for the low-speed machines and small
machines the tendency is to exhibit a high magnetizing current. A typical

40
medium sized four pole machine has a magnetizing current of about 33%
of FLC. A low magnetizing current indicates a low iron loss, while a high
magnetizing current indicates an increase in iron loss and a resultant
reduction in the operating efficiency. Typically, the operating efficiency of
the induction motor is highest at 3/4 load and varies from less than 60% for
small low-speed motors to greater than 92% for large high-speed motors.
The operating PF and efficiencies are generally quoted on the motor data
sheets.
5.1.3 Load Characteristic
In real applications, various kinds of loads exist with different torque-speed
curves. For example, Constant Torque, Variable Speed Load (screw
compressors, conveyors, feeders), Variable Torque, Variable Speed Load
(fan, pump), Constant Power Load (traction drives), Constant Power,
Constant Torque Load (coiler drive) and High Starting/Breakaway Torque
followed by Constant Torque Load (extruders, screw pumps).The motor
load system is said to be stable when the developed motor torque is equal
to the load torque requirement. The motor will operate in a steady state at a
fixed speed. The response of the motor to any disturbance gives us an idea
about the stability of the motor load system. This concept helps us in
quickly evaluating the selection of a motor for driving a particular load.
In most drives, the electrical time constant of the motor is negligible as
compared to its mechanical time constant. Therefore, during transient
operation, the motor

41
can be assumed to be in an electrical equilibrium, implying that the steady
state torque-speed curve is also applicable to the transient operation. As an
example, figure (5.3) shows torque-speed curves of the motor with two
different loads. The system can be termed as stable, when the operation
will be restored after a small departure from it, due to a disturbance in the
motor or load. For example, disturbance causes a reduction of Δωmin speed.
In the first case, at a new speed, the motor torque (T) is greater than the
load torque (Tl). Consequently, the motor will accelerate and the operation
will be restored to X. Similarly, an increase of Δωmin the speed, caused by a
disturbance, will make the load torque (Tl) greater than the motor torque
(T), resulting in a deceleration and restoration of the point of operation to
X. Hence, at point X, the system is stable. In the second case, a decrease in
the speed causes the load torque (Tl) to become greater than the motor
torque (T), the drive decelerates and the operating point moves away from
Y. Similarly, an increase in the speed will make the motor torque (T)
greater than the load torque (Tl), which will move the operating point
further away from Y. Thus, at point Y, the system is unstable.
This shows that, while in the first case, the motor selection for driving the
given load is the right one; in the second case, the selected motor is not the
right choice and requires changing for driving the given load. The typical
existing loads with their torque-speed curves are described in the following
sections.

42
Figure (5.3) :Torque-Seed Curve – Same Motor with two different loads [28].
5.1.4 Effects of Torque on the Characteristics of Induction Motor
Constant Torque with Variable Speed operation
The torque required by this type of load is constant regardless of the speed.
In contrast, the power is linearly proportional to the speed. Equipment,
such as screw compressors, conveyors and feeders, have this type of
characteristic.
Figure (5.4) :Constant Torque, Variable Speed Loads [28].
Variable Torque and Variable Speed
This is most commonly found in the industry and sometimes is known as a
quadratic torque load. The torque is the square of the speed, while the

43
power is the cube of the speed. This is the typical torque-speed
characteristic of a fan or pump.
Figure (5.5) :Variable Torque, Variable Speed Loads [28].
Constant Power Loads
This type of load is rare but is sometimes found in the industry. The power
remains constant while the torque varies. The torque is inversely
proportional to the speed, which theoretically means infinite torque at zero
speed and zero torque at infinite speed. In practice, there is always a finite
value to the breakaway torque required. This type of load is characteristic
of the traction drives, which requires high torque at low speeds for the
initial acceleration and then a much reduced torque when at running speed.

44
Figure (5.6) : Constant Power Loads[28].
Constant Power, Constant Torque Loads
This is common in the paper industry. In this type of load, as speed
increases, the torque is constant with the power linearly increasing. When
the torque starts to decrease, the power then remains constant.
Figure (5.7) : Constant Power& Constant Torque Loads [28].

45
5.2 Starting Method
It is well understood that induction motors draw higher currents during
their starting operations than is the case under full load running conditions.
Since the early days of induction motor availability, starting methods other
than Direct-on-Line have been used, and in some cases mandated by
Utilities, to reduce the effect of these high starting currents on the electrical
distribution network. What is generally not recognized is the existence of
short duration inrush currents that greatly exceed these starting currents.
Furthermore, the introduction of complex starting methods to reduce
starting currents is often compromised by other unanticipated inrush
currents introduced by the starting system itself, unless special precautions
are taken [29].
This thesis discusses the financial analysis of using variable frequency
convertor for driving electrical water pumps compared with fixed
frequency, so will focus particularly in two starting methods variable
frequency drive and soft starter.
In general, there are five basic methods of starting induction motors. These
include
i. Direct - on - Line ( DOL ) starting.
ii. Star - Delta or WYE - Delta starting.
iii. Autotransformer starting.
iv. Variable frequency converter.
v. Soft starting.

46
Except for DOL starting, the prime objective of these alternative starting
methods is to reduce the supply voltage to the motor, with the express
purpose of reducing the inrush currents that occur during the starting
operation. Reducing the supply voltage is an extremely effective way of
reducing inrush currents, since the starting currents are directly
proportional to the supply voltage. Unfortunately, as a consequence, the
starting torque is reduced by the SQUARE of the supply voltage, so that
this limitation needs serious consideration when choosing a method of
starting induction motors [29].
5.2.1 Soft Starter (SS)
Soft starters are devices that use silicon-controlled rectifiers (SCRs) for
providing a low voltage to the motor from a grid voltage and fixed
frequency. The value of the voltage applied to the motor can be varied over
a wide range, from very small values up to the value of the grid by
controlling the firing angle of the SCRs.
The consequences of this reduction in the value of the applied voltage are
the decrease in electric current drawn from the grid and the reduction of the
torque developed during the process of starting or stopping. figure (5.8)
shows a basic schematic diagram of a soft starter with anti-parallel SCRs
and the feedback from current and voltage. The interface circuit is
responsible for acquiring and processing measured voltage and current
signals, which are processed digitally by the control program. The
command signals from the digital processing are then sent by control to a

47
firing circuit, responsible for driving the SCRs and consequently, the
induction motor [30].
Soft start devices provide two major benefits in their application[31]:
Less stress on the motor mechanically coupled to the load due to the
reduced amplitude of the pulse of the starting torque motor;
Smoothing the motor acceleration and reducing the demand for
energy flow in electric power systems due to the reduction of peak
current when starting the motor.
Usually two techniques are employed to control the soft starter: voltage
ramp and current control.
The voltage-ramp technique is performed through a firing-angle ramp of
SCRs. Thus, although better than the non-electronic starter methods, it does
not guarantee a more effective control over current and acceleration during
starting process and over deceleration during stopping process [30].

48
Figure (5.8) :Basic diagram of soft starter[30]
The angle ramp, shown in figure (5.9), is called voltage-ramp, due to the
fact that the majority of commercial soft starters do not possess voltage
feedback applied to the motor, i.e., the induction motor voltage is
controlled through a firing angle ramp in an open loop. This technique is
simple, and it is used in low-cost commercial soft starters. It will always

49
produce a starting quadratic torque curve that can be applied to small
hydraulic pumps and small fans [30].
Figure (5.9) :Basic block diagram of the voltage-ramp technique[30].
5.2.2 Variable Frequency Convertor Drive
5.2.2.1 Description of variable frequency convertor
A frequency converter is a power electronic device that converts power
from a supply network to a load with a controllable amplitude and
frequency. A schematic diagram of one topology of frequency converters
used in elevator drives is shown in figure (5.10). It consists of a three-
phase, six-pulse, full-bridge diode rectifier (1), a brake chopper (2), a large
filter capacitor (3) and a three-phase pulse-width-modulated voltage-source
inverter (4). Measurements are taken from the voltage over the filter
capacitor and from the currents of two output phases[32].

50
5.2.2.2 Speed control method by using variable frequency convertor
The first part of variable speed device rectifiers supply AC voltage into DC
over the filter capacitor with the voltage given on average by :
Vdc =
√ n = 1.35 × Vn (5.1)
Vn : is the supply network phase-to-phase voltage [33].
Due to the finite interval needed by current commutation between the
conducting diodes, the DC side is reduced by :
ΔVdc=
n LkIdc= 6fnLkIdc (5.2)
Figure (5.10) :A typical frequency converter.
Where :
n = 2πfn ,is the angular frequency of the supply.
Lk : The short-circuit inductance of the supply network at the frequency
converter's input terminals.
Idc:The current Idc is the current on the DC side.
The brake chopper is used to avoid voltage increase in the filter capacitor
by dissipating the excess energy in the braking resistors when the power

51
flows from the load to the supply, i.e. when the motor is braking or acting
as a generator, and when the frequency converter is equipped with a diode-
rectifier, which is not capable of converting this energy back to the supply.
The purpose of the PWM inverter is to create voltages with controllable
magnitude and frequency. The inverter consists of three 'legs', each having
two pairs of transistors and diodes, the upper and lower ones. The
transistors in each one of these inverter-legs are controlled in a
complementary fashion, i.e. one transistor conducts at a time, to avoid
short-circuiting the filter capacitor.
The instantaneous inverter output voltages with respect to the assumed
three-phase load neutral point are:
Vsa =
vaN-
(vbN+ vcN) (5.3)
vsb =
vaN-
(vbN+ vcN) (5.4)
vsc =
vaN-
(vbN+ vcN) (5.5)
where :
viN ,i {a,b,c} , are the amplitudes of the inverter output voltages with
respect to the negative DC-bus.
5.3 Parameters of Used Induction Motor
5.3.1 Technical Data for Abu Saleh Induction Motor
Three-Phase motor of pump for Abu Saleh well manufactured by U.S
Electrical Motor Company has an identification number " T08 7533307-
002 R00 01" Table (5.1) show all technical data for used motor.

52
Table (5.1) : Abu Saleh well motor ,name plate data [33].
Property value Property value
Phase/Type
3-phase Power Factor 84.6
Type
TUC Frequency 50 HZ
Enclosure Type TE(Totally
Enclosed)
Volt 400 V
Max Temperature 48 C0
Max KVAR 30
Duty Continuous Power 100 HP
Weight 1600 LBS RPM 1480
SF 1.15 AMPS 136
Figure (5.11) :Name plate of Abu Saleh well motor.

53
5.3.2 Technical Data for Agriculture Company Induction Motor
Three-Phase motor of pump for Agriculture Company well manufactured
by U.S Electrical Motor Company has an identification number " P 10
7382793-0001 R00 04"Table (5.2) show all technical data for used motor
Table (5.2) :Agriculture Company well motor ,name plate data [33].
Property value Property value
Phase/Type
3-phase Power Factor 87.1
Type
RU Frequency 50 HZ
Enclosure Type WPI(Whether Protected) Volt 400 V
Max Temperature 40 C0
Max KVAR 35.6
Duty Continuous Power 150 HP
Weight 1600 LBS RPM 1480
SF 1.15
AMPS 196
Figure (5.12) :Name plate of Agriculture Company well motor

54
5.3.3 Technical Data for Waleed Ribhi Induction Motor
Three-Phase motor of pump for Waleed Ribhi well manufactured by U.S
Electrical Motor Company has an identification number " T 08 7533307-
002 R00 01" Table (5.2) show all technical data for used motor.
Table (5.3) :Waleed Ribhi well motor ,name plate data [33].
Property value Property value
Phase/Type
3-phase Power Factor 84.6
Type
TUC Frequency 50 HZ
Enclosure Type TE(Totally Enclosed) Volt 400 V
Max Temperature 48 C0
Max KVAR 30
Duty Continuous Power 100 HP
Weight 1600 LBS RPM 1480
SF 1.15
AMPS 136

55
Figure (5.13) :Name plate of Waleed Ribhi Company well motor

56
Chapter Six
Control methods of water pumping systems and field
testing results

57
6.1 Setup of Water Pumping System (WPS)
The correct size pump and pump motor depend on the well diameter, the
water level in the well, the number of plumbing fixtures, the amount of
water use, and the peak water demand. Pumps are rated in cubic meter per
hour (m3/h), and pump motors are rated in horse power (hp).[34]
Figure (6.1) : Water Pumping System Component
As illustrated in figure (6.1) ,setup of first component a well cap is an
approved manufactured cover of cast steel, aluminum, or PVC. It is
fastened to the well casing with a rubber compression "O" ring or gasket
between the sections. Both are incorporated to make a water tight or vector
proof seal. Well caps are also vented with a brass or stainless mesh. A
female threaded port is used to tie in and insert electrical cable. All well
caps installed must meet state regulations [34].

58
The setup of second component pressure tank, most water systems include
a water storage container called a pressure tank. The pressure tank is
usually located in the basement or a utility room, although some types of
tanks may be buried underground. It is a good idea to have a faucet placed
near the pressure tank for flushing the tank and collecting water samples
for testing [34].
The setup of third component check valves permit water flow only in one
direction, and are required on all submersible pump installations. Their
purpose is to prevent the water in the column above the pump and in the
pressure tank from draining back into the well when the pump shuts off.
They also prevent backspin, water hammer and up thrust inside the pump.
Any of these three conditions, or a combination of them, can lead to pump
or motor failure, plus shortened service life or operating problems in the
system [34].
6.2 Control Circuit and Protection
The pumping system shall be designed to operate in the following modes:
a. Automatic mode – in this mode of operation the control system shall
operate the pumping station automatically, without need for manual
intervention[35].
b. Manual mode – in this mode of operation, the control system is
overridden and the operator can operate the pump units manually via
the pushbutton switches mounted on the door of the Assembly [35].
c. Protection components must be installed in the pumping system
,first one flow switch monitoring pump input/suction lines provide

59
the most direct method of protecting pumps from costly damage due
to reduced and/or fluid loss [36], the second one ,pressure switch
used to make or break an electrical circuit (an electric motor, a gas
engine, etc.) upon sensing either ‗high‘ or ‗low‘ flow line pressure,
and temperature sensor used to turn off pump when temperature
exceed nominal temperature.
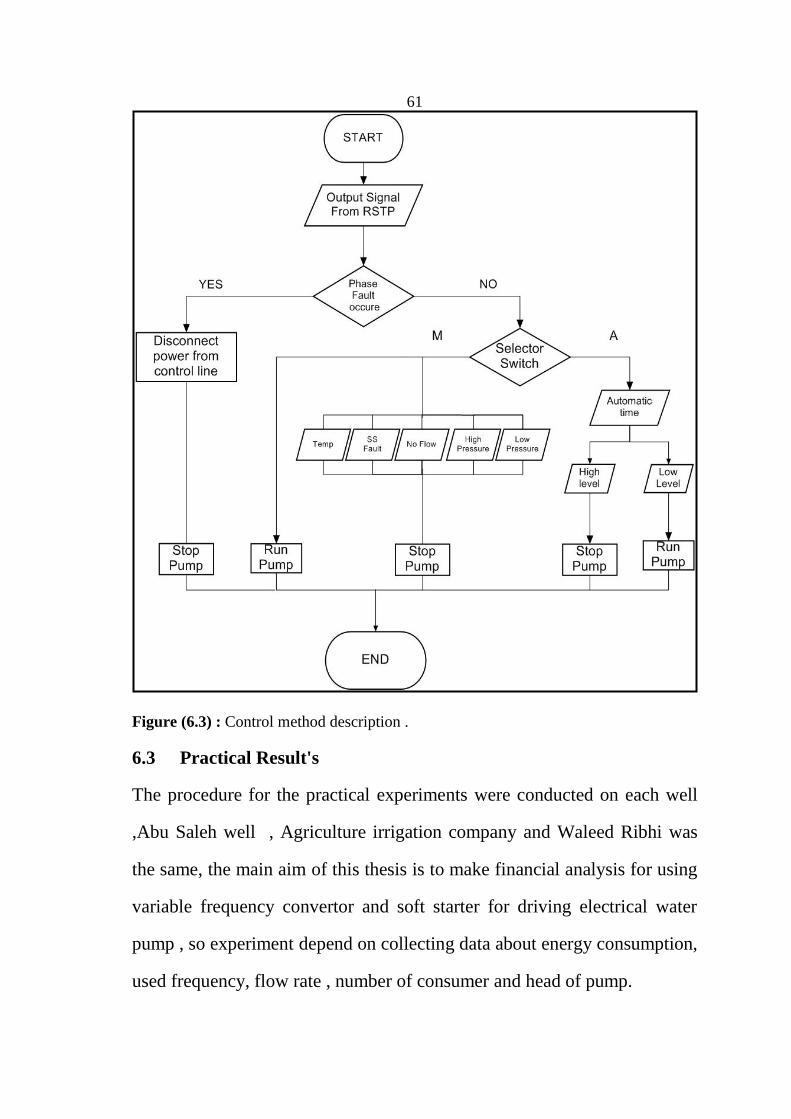
6.2.1 Description of Practical Control Methods
The following control drawing shown in figure (6.2) ,illustrates the control
method of water pump of two tested well's , control philosophy can be
described as the following procedure :
1- Operator can choose mode of operation either Automatic or Manual
mode by a selector switch .
2- In automatic mode ,the operator can adjust time to run a pump then
the pump will pump water until receive signal from high level
sensor to turn off pump , on the other hand the pump will pump
water again when receive signal from low level sensor .
3- In manual mode, the operator must turn on pump normally , in
special cases the pump will be forced to turn off ,high pressure ,
low pressure ,high temperature , soft starter or variable frequency
convertor fault and no flow case . figure (6.4) shows flow chart that
describes control process for tow tested pump .

60
Figure (6.2) : Electrical control circuit for both tested wells .
61
Figure (6.3) : Control method description .
6.3 Practical Result's
The procedure for the practical experiments were conducted on each well
,Abu Saleh well , Agriculture irrigation company and Waleed Ribhi was
the same, the main aim of this thesis is to make financial analysis for using
variable frequency convertor and soft starter for driving electrical water
pump , so experiment depend on collecting data about energy consumption,
used frequency, flow rate , number of consumer and head of pump.

62
Modern energy analyzers device was used to collect data for several tested
at several periods , energy analyzer fixed on control box wall after connect
device terminal wire three phase(red ,black, green) and neutral (blue) to the
main power cable as figure (6.4) shows .after data have been collected and
transferred to computer as Excel sheet to be analyzed and examined to get
more accurate results by checking every point at trending curve .After
getting and calculating energy consumption for each well , process will be
more easier to calculate the energy cost for each well and compared
between two driving method( SS & VFD) with take in considering the
initial cost for each one .
Figure (6.4): Energy analyzer device and collecting data process
6.3.1 Practical Result for using soft starter at Abo Saleh Well
6.3.1.1 First experiment at period (2-8 /10/2013)
To calculate the quantities of pumped water during experiment period
from 29-10-2013 to 31-10-2013, the water meter reading recorded before

63
experiment (16644m3) and the record reading at the end of the period
was(17541m3 ) .
From the above reading the amount of pumped water during experiment
period can be calculated , by finding the difference between two reading in
2-10-2013 the reading of water meter was 607870 m3 and in 8-10-2013 the
reading of water meter was 613130 m3 as equation (6.1).
(6.1)
m3
The other recorded data at the beginning of experiment by data analyzer
was the energy consumption ,and it's value at 29-10-2013 (0 Wh) ,and at
the end of experiment at 31-10-2013 was (306651.2Wh), the following
curves shown in Figure (6.5) drawn by excel after transfering collected data
from energy analyzer to PC to get exact reading .

64
Figure (6.5): Average voltage ,current ,total power for Abu saleh pump during first
testing period
As shown in previous curve we can notice that the power of the pump
increase rapidly at start ,then change to be constant at about 50 kW on
power curve , this value could be considered optimum power of pump , if
we compared this measured value with theoretical power at optimum

65
efficiency from data sheet the theoretical power (49.5 kW) at optimum
efficiency (79%) .
However, during pump water the demand increases by farmer so other
parameters will be changed head, flow rate, and pressure. These values
have effect directly on power of pump either increase or decrease from the
optimum power (49.5 kW) the performance test of the pump by
manufacturer as shown in data sheet and chapter four illustrated the change
in power and efficiency during change in head and flow rate .
.
All cost calculations for energy consumption in NIS , and the cost for each
KWh about 0.63 NIS / KWh , previous calculation show the total cost of
energy consumption for 7 m3 pumped water , so final price of each cubic
meter equals 0.215 NIS as shown in equation (6.3) .
(6.2)
Soft starter method need power factor modification by using capacitors and
power factor controller ,due to the value of average reactive power high
about 42( kVAR) as shown in figure (6.6) and the power factor value's at
first experiment changed between (0.7 -0.8) as collected data by data

66
analyzer , so the cost of the system will increase due to increase in reactive
power and decrease in power factor value .
Figure (6.6): Average reactive power for Abu saleh pump during first testing period
6.3.1.2 Second experiment at period (13-17 /04/2014)
To calculate the quantities of pumped water during experiment period
from 13-04-2014 to 17-04-2014, the water meter reading recorded before
experiment (783460 m3) and the record reading at the end of period
was(784760m3 ) .
From the above reading the amount of pumped water during experiment
period can be calculated , by finding the difference between the two
readings in 13-04-2014 the reading of water meter was 783460 m3 and in
17-04-2014 the reading of water meter was 784760m3 as equation (6.1).
m3
The other recorded data at the beginning of experiment by data analyzer
was the energy consumption ,and it's value at13-04-2013 (0 Wh) ,and at

67
the end of the experiment at 17-04-2013 was (557405.5Wh), the
following curves shown in figure (6.7) drawn by excel after transfering
collected data from energy analyzer to PC to get exact reading .
Figure (6.7): Average voltage ,current ,total power for Abu saleh pump during second
testing period

68
All cost calculations for energy consumption in NIS , and the cost for each
KWh about 0.63 NIS / KWh , previous calculation show the total cost of
energy consumption for 1300 m3 pumped water , so final price of each
cubic meter equals 0.270 NIS as shown in equation (6.3)
Note the difference in the cost per cubic meter in the second test due to the
decrease in the quantity pumped .
Decrease the amount pumped back to the water pump to more than farms
of different heights in the first test is not pumping water to high altitudes,
so the cost is less because the flow is proportional inverse proportion to the
rise.
After getting the value of power factor for Abu Saleh well at the first
experiment , well manager's decide to modify the system by adding power
factor panel contain capacitors and power factor controller to get good
after this about (0.9)and average reactive power about (20 kVAR) as
shown in Figure (6.8) .

69
Figure (6.8): Average reactive power for Abu saleh pump during second testing period
6.3.2 Practical Results for using variable frequency drive at
Agriculture Irrigation Company well
To calculate the quantities of pumped water during experiment period
from 2-10-2013 to 8-10-2013, the water meter reading recorded before the
experiment (60787m3) and the record reading at the end of the period
was(61313m3 ) .
From the above reading the amount of pumped water during experiment
period can be calculated , by finding the difference between two reading
in 2-10-2013 the reading of water meter was 607870 m3 and in 8-10-2013
the reading of water meter was 613130 m3 as equation (6.1).
m3
The other recorded data at the beginning of experiment by data analyzer
was the energy consumption ,and it's value at 2-10-2013 (0 Wh) ,and at the

70
end of the experiment at 8-10-2013 was (2581741 Wh), the following
curves shown in Figure (6.9) drawn by excel after transferring collected
data from energy analyzer to PC to get exact reading .
Figure (6.9): Average voltage ,current ,total power for Abu saleh pump during second
testing period
The effect of variable frequency drive clear on power curve during
different period of pump ,at start power increases to be about 79 KW at
frequency 50 Hz , then operator changes speed of motor by changing
frequency either increasing or decreasing as demand status from framer's

71
this change will have effect on flow rate to get balance between demand
and flow rate as equation (6.4) shows the relation between change in speed
of motor and change of flow rate .
(6.4)
Where :
Q : Flow rate of pumped water m3/h .
N : Speed of motor (rpm)

72
Figure (6.10): Pump Affinity Laws Applied to Agriculture irrigation well
All cost calculations for energy consumption in NIS , and the cost for each
KWh about 0.63 NIS / KWh , previous calculation show the total cost of
energy
consumption for m3pumped water , so final price of each cubic meter
equal 0.309 NIS as shown in equation (6.3) .

73
The power factor and average reactive power values with variable in the
irrigation company well that use variable frequency drive , were good
about 0.9 for power factor and (25 kVAR ) for average reactive power as
shown in figure (6.11) without using capacitor bank in the system .
Figure (6.11): Average reactive power for irrigation company pump
The importance of variable frequency drive clearly show on irrigation
company well through need to pump water for several farmers at different
periods ,also the number of farmers affect the flow rate ,pressure during
change in motor speed table (6.1) show the effect on parameters when the
operator pump water for two customers and table (6.2) for four costumers.

74
Table (6.1) :Changes on flow rate , pressure ,power during change on
frequency , when pump water for two costumers .
f
(Hz)
Power
(kW)
Pressure
(bar)
N
(rpm)
Flow rate
(m3/h)
Head
m
Efficiency
%
40 32 0.1 1164 95 84.01937 77.8404
42 45 1 1222.2 110 93.19368 70.9603
44 51 2 1280.4 110 103.3874 69.3445
46 61 2.3 1338.6 160 106.4455 86.7857
48 70 3.5 1396.8 170 118.6779 89.451
50 81 4 1455 180 123.7747 85.3188
52 90 4.3 1513.2 210 126.8328 91.7698
54 105 5 1571.4 210 133.9684 83.0298
56 118 6 1629.6 240 144.1621 90.7857
Sample of calculation , efficiency of pump at frequency 42 Hz , pressure 1
bar (100,000 Pa) , flow rate 110 (m3/h):
𝜼
(6.5)
Phyd = 2.725
𝜼
+ Static head (6.6)
93.19 m
𝜼
Where :
𝛈 : Efficiency of pump
Phyd :Hydraulic power( Watt)
Pin :Input power for pump (Watt)
Motor eff: efficiency of motor (0.92) [37].
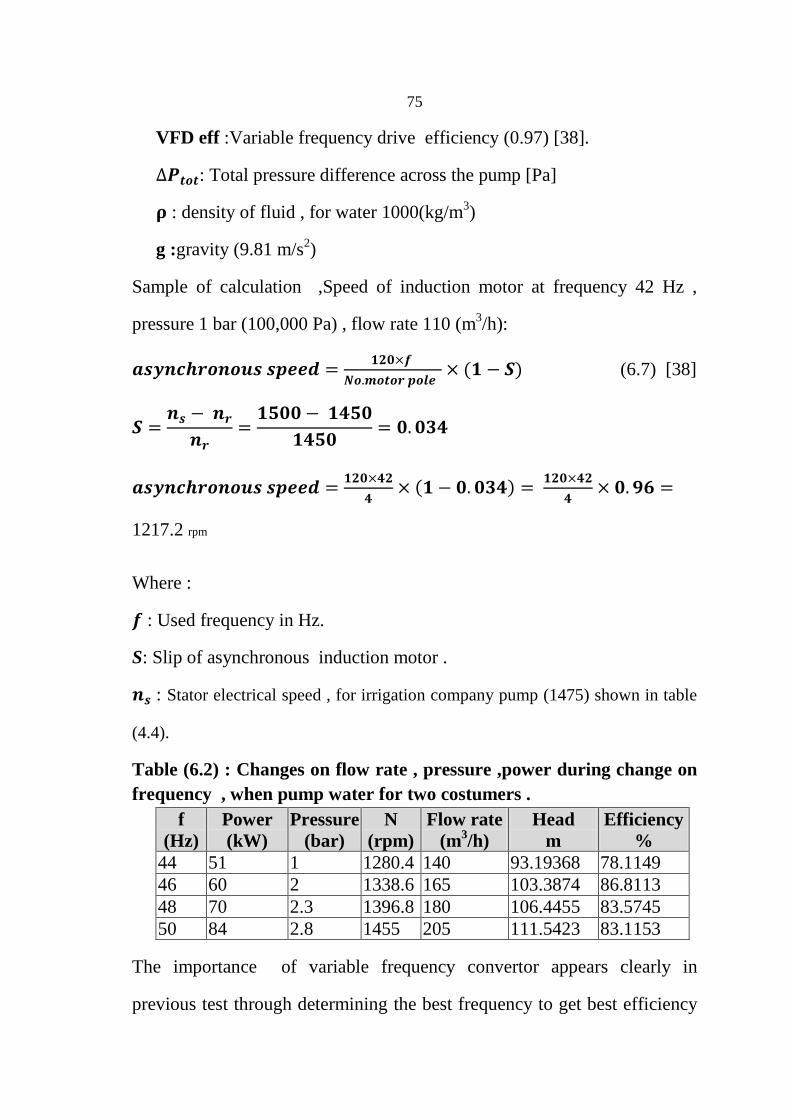
75
VFD eff :Variable frequency drive efficiency (0.97) [38].
: Total pressure difference across the pump [Pa]
: density of fluid , for water 1000(kg/m3)
g :gravity (9.81 m/s2)
Sample of calculation ,Speed of induction motor at frequency 42 Hz ,
pressure 1 bar (100,000 Pa) , flow rate 110 (m3/h):
(6.7) [38]
1217.2 rpm
Where :
: Used frequency in Hz.
S: Slip of asynchronous induction motor .
: Stator electrical speed , for irrigation company pump (1475) shown in table
(4.4).
Table (6.2) : Changes on flow rate , pressure ,power during change on
frequency , when pump water for two costumers .
f
(Hz)
Power
(kW)
Pressure
(bar)
N
(rpm)
Flow rate
(m3/h)
Head
m
Efficiency
%
44 51 1 1280.4 140 93.19368 78.1149
46 60 2 1338.6 165 103.3874 86.8113
48 70 2.3 1396.8 180 106.4455 83.5745
50 84 2.8 1455 205 111.5423 83.1153
The importance of variable frequency convertor appears clearly in
previous test through determining the best frequency to get best efficiency

76
of a pump during pump water in different two cases ,first case when pump
water for two customers and the second case pump water for four
customers , from the efficiency term in each previous table we will find
optimum efficiency for each case during change in pressure , head during
change in frequencies as shown in figure(6.12) and efficiency calculated as
following tables.
Table (6.3): Changes in flow rate and head through change pressure at
45 Hz frequency.
Efficiency
%
Head
m
Flow rate
(m3/h)
Pressure
(bar)
Power
(kW)
f
(Hz)
67.88136462 119 87.8 3.6 47 45
75.01347984 114 109.9 3.1 51 45
70.39052978 107 122.8 2.4 57 45
Table (6.4): Changes in flow rate and head through change pressure at
46.5 Hz frequency.
Efficiency
%
Head
m
Flow rate
(m3/h)
Pressure
(bar)
Power
(kW)
f
(Hz)
73.30041762 111 133 2.8 61.5 46.5
71.58038158 117 124 3.4 61.89 46.5
73.03105857 123 105 4 54 46.5
Table (6.5): Changes in flow rate and head through change pressure at
48 Hz frequency.
Efficiency
%
Head
m
Flow rate
(m3/h)
Pressure
(bar)
Power
(kW)
f
(Hz)
71.75011244 128 106.288 4.5 57.9 48
72.93026428 123 113.96 4 58.689 48
73.51965396 118 125.87 3.5 61.689 48
72.64869639 115 133.83 3.2 64.689 48

77
Table (6.4): Changes in flow rate and head through change pressure at
50 Hz frequency. +
Efficiency
%
Head
m
Flow rate
(m3/h)
Pressure
(bar)
Power
(kW)
f
(Hz)
82.71885205 111 205 2.8 84 50
83.46406694 123 180 4 81 50
72.89718567 128 149 4.5 79.89 50
Figure (6.12) : Effect of speed variation on pump characteristics

78
Figure (6.13):flow rate versus Efficiency of pump at deferent speeds.
At constant flow rate (Q) the variation of pumping head (H) is proportional
to the supply frequency squared only in the range below the flow rate value
corresponding to the peak efficiency of the pump. As previous curve show
we can note the effect of change speed of the pump characteristic flow rate,
head and power as affinity laws three frequencies was experimented,
through experiment at each selected frequency the control vales changed
step by step then record pressure cage and flow meter reading to check
changing in head , flow rate through changing frequency to choose
optimum operating point for pump for each frequency as demand required .
6.3.3 Practical Results for using variable frequency drive at Waleed
Ribhi Well.
Mr. Waleed Ribhi well neglected from analysis due to problem in
mechanical structure that caused water leakage in his network causing high
cost for pumped water shown as follows.
To calculate the quantities of pumped water during experiment period
from 17-09-2013 to 19-09-2013, the water meter reading recorded before
0
20
40
60
80
100
0 50 100 150 200 250 300
Eff
icie
ncy
%
Flow Rate Q m3/h
Performance test bycompany at 50Hz
48 Hz
45 Hz
50Hz
46.5 Hz

79
experiment ( m3) and the record reading at the end of period
was(126693m3 ) .
From the above reading the amount of pumped water during experiment
period can be calculated , by find the difference between two reading in
17-09-2013 the reading of water meter was 607870 m3 and in 19-09-2013
the reading of water meter was 613130 m3 as equation (6.1).
m3
The other recorded data at beginning of experiment by data analyzer was
the energy consumption ,and it's value at 17-19-2013 (0 Wh) ,and at the
end of experiment at 19-19-2013 was (1475612Wh), the following curves
shown in figure (6.12) drawn by excel after transferring collected data from
energy analyzer to PC to get exact reading .

80
Figure (6.14) :Average voltage ,current ,total power for Waleed Ribhi pump during
second testing period
All cost calculations for energy consumption in NIS , and the cost for each
KWh about 0.63 NIS / KWh , previous calculation show the total cost of

81
energy consumption for m3 pumped water , so final price of each
cubic meter equal 0.717NIS as shown in equation (6.3) .
The power factor and average reactive power values with variable in the
Mr.Waleed Ribhiwell that use variable frequency drive , were good about
0.9 for power factor and (25 kVAR ) for average reactive power as shown
in figure (6.15) without using capacitor bank in the system .
Figure (6.15): Average reactive power for Waleed Ribhi pump .

82
Chapter Seven
Financial Analysis

83
7.1 Introduction:
From the previous result, we can conclude that the primary purpose of VFD
is to control the speed of an AC motor. It works by electronically changing
the frequency of the power supplied to the motor. The applied voltage is
also changed so that the ratio of voltage to frequency (V/Hz) is
approximately constant. Since the operating speed of an AC motor is
mostly determined by the frequency of the applied power, adjusting the
frequency is the best means of adjusting the speed. A VFD also provides
"soft" starting. When the motor is started, a very low frequency is applied
and the motor starts and runs without drawing a high current. If the voltage
is properly controlled, the motor can produce up to 150% of rated torque
while drawing proportional current. To accelerate the motor, the frequency
is gradually increased so that the required torque is provided while
accelerating with limited current. But, soft starter electronically reduces
the voltage applied to the motor during starting. That limits the starting
current, but also limits the starting torque. Since AC motors can produce
considerably more torque than their rated continuous running torque,
starting with limited torque is usually acceptable. Once the motor reaches
full speed, the voltage is increased to the normal running voltage for
efficient operation.
7.2 Financial Analysis:
This section shows the financial analysis through comparison between soft
starters and VFD cost for different sizes of both types as table (7.1)
shows.

84
Table.(7.1): Financial Comparison between soft starter and VFD cost.
Type Soft starter VFD Ratio of VFD/SS
75 HP 1330 $ 3330 $ 2.5
100 HP 1520 $ 4166 $ 2.7
150 HP 1720 $ 5000 $ 2.9
From the above table we can notice that initial cost for soft starter is
cheaper, on the other hand VFD provides better value and can provide
energy savings of up to 50 percent, thereby producing more cost savings
over the life of the equipment[39], also the result of tests on previous
chapter shows the importance of bypass contactors with capacitors bank to
modified power factors and average reactive power values to be acceptable
, so the initial cost for soft starter will increase through these additions as
table (7.2) shows.
Table.(7.2): Additional cost for required components (manufactured
Siemens ) used with soft starter.
Component Cost
By pass contactor 75 HP 330 $
By pass contactor 100 HP 430 $
By pass contactor 150hp 600 $
Main circuit breaker 25KVAR 15 $
Contactor capacitor 25KVAR 100 $
Capacitor bank 25KVAR 70 $
At Abo Saleh well soft starter (100 HP) totally cost will be with all
additional components as equ (7.1)
(7.1)

85
VFDs can be two to three times the initial cost of Soft Starters, and
generally require a slightly higher expertise to integrate into a process .On
the other hand, VFD controller can help the farmers to get along running
hours with low cost ,through selecting low frequency for pumping low
amount of water as demand decreases by farmers , so power consumption
will be less in this case versus constant frequency at 50 Hz in soft starter .
It is worth mentioning that in Tulkarm the cost to pump 130m3/hr is
120NIS/hr and the cost in Al-Fari‘a to pump 60m3/hr is 120NIS/hr for soft
start control but the cost of running hour when using VFD between 60NIS
to 140 NIS differs about the running hours that the farmers need and it is
adjustable by the frequency to determine the running periods.
7.3 Energy Saving Using Variable Frequency Convertor
To determine energy saving when using variable frequency at irrigation
company well we need to calculate average of operation hour per day then
calculate energy consumption cost per day with VFD finally compare it
with energy consumption cost with soft starter at constant frequency and
constant power consumption .
Energy analyzer data recorded during experiment period between 2-10-
2013 to 8-10-2013 , record the operation time for the pump about 52
hours during six days . and total energy consumption exactly (2581.7404
KWh) ,also cost of kilowatt per hour equals 0.63 NIS.

86

87
Chapter Eight
Conclusions And Recomendations

88
8.1 Conclusion
The main advantage of more than VFD Soft Starter is the speed limit .
VFDs can vary the output frequency from zero to a frequency above the
main motor . Rpm constant ( revolutions per minute ) of electric motors
prevents tuning the performance of the pump
To fit with variable operating conditions , and therefore are usually reduce
output pump or smothered . Variable frequency drives electric motors have
The ability to adjust the pump performance to match the operating
conditions by reducing the speed of the motor and pump motor variable
frequency can affect the efficiency of the pumping station for irrigation ,
because both the efficiency of the engine and drive efficiency decrease with
decreasing rpm. Engine efficiency.
Here are some of the advantages of using variable frequency drives in well
pumps :
a. Increased Reliability
Adjustable speed motor-drive systems are more reliable than traditional
mechanical approaches such as using louvers, valves, gears, or turbines to
control speed and flow. Because electric drives have no moving parts they
provide very high reliability [39].
b. Energy Saving
Such energy cost savings are especially used in variable-torque centrifugal
fan and pump applications, where the load‘s torque and power vary with
the square and cube, respectively of the speed. This change gives a large
power reduction compared to fixed-speed operation for a relatively small
89
reduction in speed. Also by Using a variable frequency drive to control the
fluid flow with a fully open throttle saves a considerable amount of power.
As most of the drives operate at part load most of the time, the accumulated
energy saving or the corresponding financial benefit, may be substantial
over a prolonged period of time. Because this type of fluid flow control is
common in industry, widespread application of variable-frequency drives
with power electronics area can help in large energy conservation. The
main aim of this paper is to reduce the energy consumption by the
implementation of VFD and hence the proper control of fluid flows [40].
c. Speed Variations
In some cases in pumping system we need to vary the speed of pump to
change the amount of flow rate as demand either increases flow or
decreases it.
d. High Power Factor
Power converted to motion, heat, sound, etc. is called active power and is
measured in kilowatts (kW). Power that charges capacitors or builds
magnetic fields is called reactive power and is measured in kVAR. The
vector sum of the kW and the kVAR is the Apparent Power and is
measured in KVA. Power factor is the ratio of kW/KVA. Typical AC
motors may have a full load power factor ranging from 0.84 to 0.88. As the
motor load is reduced, the power factor becomes low. The advantage of
using VFD‘s is that it includes capacitors in the DC Bus itself which
maintains high power factor on the line side of the VFD. This eliminates
the need of additional expensive capacitor banks [41].

90
e. Soft starting of one or multiple motors:
When electric drives soft start large motors, the problem associated with
large inrush current (mechanical wiring stress, wiring overheating and
voltage dip on connected bus) is eliminated. This removes limitations on
motor frequency of starts, reduces insulation damage, and provides
extended motor life. With synchronization logic, one drive can start
multiple motors [39].
f. Extended equipment life and reduce maintenance
The VFD‘s greatly reduce wear to the motor, extend life of the equipment
and decrease maintenance costs. Due to optimal voltage and frequency
control it offers better protection to the motor from issues such as electro
thermal overloads, phase protection, under voltage, over voltage etc. When
you start a load with a VFD you will not subject the motor or driven load to
the ―instant shock‖ of across the line starting, but can start smoothly,
thereby eliminating belt, gear and bearing wear.
Table(8.1): Major comparison between soft starters and VFDs .[42]
Characteristics SS VFD
Initial cost Lower Higher
Reduces motor starting voltage Yes Yes
Reduces motor starting current Yes Yes
Reduces energy use Some More
Extends motor, equipment life Yes Yes
Varies motor speed No Yes
Efficiency ~ 99.5% ~ 95% -
97%
Operational complexity Lower Higher
Current feedback via CTs Yes Yes
Torque per amp ratio Moderate Very high
Performance parameters Few Many
Tuning functions Few Many

91
8.2 Recommendations
Based on the studies carried out in this thesis, the following
recommendations can be made:
a. A soft starter adjusts the voltage applied to the motor to control its
current and torque characteristics during startup. Silicon-controlled
rectifier arrays are configured back-to-back so that the control circuit
can gate them on both positive and negative excursions of the AC
waveform. The control circuit controls the slope of the acceleration
and deceleration ramps. The amount of the AC line voltage
waveform allowed to pass through to the motor is directly
proportional to the gate-firing ramp. This allows regulating the
voltage applied to the motor from zero up to line voltage.
b. Soft starters offer lower initial cost, limited digital and analog
diagnostic signals, simple RUN/STOP control schemes, and the
ability to reduce peak current draws and mechanical shock to equip-
ment. Soft starter applications include very large (200-500 hp)
pumps, fans, mixer, and centrifuges that generally require very few
starts and stops.
c. VFDs offer many application benefits such as energy efficiency,
reduced stress on motors and equipment, diagnostic capabilities, and
process control integration—the primary reason to use a VFD is to
control motor speed. For applications that the load varies from time
to time as demand the variable frequency convertor is a more
suitable solution , but in constant load on motor ,pump . etc, soft
starter will be a cheap solution.

92
References
[1] Well Management Section, Environmental Health Division,
Minnesota Department of Health, Well Owner’s Handbook A
Consumer’s Guide to Water Wells in Minnesota, Fourth edition
2014.
[2]Middle East and North Africa Region Sustainable Development, The
World Bank, ASSESSMENT OF RESTRICTIONS ON
PALESTINIANWATER SECTOR DEVELOPMENT, Report No.
47657-GZ, 2009.
[3] Alon Tal, Alfred Abed- Rabbo, Preparing the Groundwork for
Cooperative and Sustainable Water Management in the Middle
East, September, 2008.
[4] M. M. Mansour, D. W. Peach, A. G. Hughes & N. S. Robins ,
Tension over equitable allocation of water: estimating renewable
groundwater resources beneath the West Bank and Israel , 2012.
[5] RESEARCH AND TECHNOLOGY,‖ The Centrifugal
Pump‖,GRUNDFOS,2010.
[6] Gaudani V K, Energy Audit and Energy Management, Vol. 1,
IECC Press,2009
[7] Malcolm Barnes, Practical Variable Speed Drives and Power
Electronics ,2010
[8]THOMAS HARTER, Environmental Health Division, Water Well
Design and Construction, 2003.
[9]Palestinian Water Authority, Summary of Palestinian Hydrologic
Data, 2000

93
[10]House Water Environment (HWE), Database of HWE, 2008.
[11]AmjadAliewi, BASIC PRINCIPLES OF GROUNDWATER
HYDROLOGY,2005.
[12]Matthew Richard and JadIssac, The Water Regime in the West Bank.
[13]RaleganSiddhi ,Bureau of Energy Efficiency , General Books LLC
,2010 .
[14]K. NagabhushanRaju , Industrial Energy Conservation Techniques:
(concepts, Applications and Case study ,2007.
[15] L. Bachus, A Custodio , Elsevier , Know and Understand
Centrifugal Pumps, Jul 25, 2003 .
[16]Kimberly Fernandez, Bernadette Pyzdrowski, Drew W. Schiller and
Michael B. Smith, Understand the Basics of Centrifugal Pump
Operation.
[17] D. A. Casada ,K. L. McElhaney , Identifying Energy Savings
Opportunities in Industrial Pumping Systems.
[18] MULTIQUIP INC, Pump Selection Handbook, 2011.
[19] Val-MaticValve . Corp, Pump Control Systems, 2009
[20]Water Systems Council (WSC) ,Sizing a Pressure Tank .
[21]National Pump Company, Engineering Catalogue , 2011 .
[22] Blaine R. Hanson , Claus Weigand , Steve Orloff, "Variable-
frequency drives for electric irrigation pumping plants save
energy" , CALIFORNIA AGRICULTURE. JANUARY-
FEBRUARY 1996.

94
[23]W. Leonhard, “Controlled AC Drives, a Successful Transfer from
Ideas to Industrial Practice,” Control Engineering Practice, Vol. 4,
No. 7, 1996, pp. 897908.
[24] G. C. D. Sousa, B. K. Bose and J. G. Cleland, “Fuzzy Logic Based
on-Line Efficiency Optimization Control of an Indirect Vector-
Controlled Induction Motor Drive,” IEEE Transactions on
Industrial Electronics, Vol. 42, No. 2, 1995, pp. 192198
[25]H. R. Andersen, C. B. Rasmussen, E. Ritchie and J. K. Pedersen,
―Efficiency Comparison of Electrical Motors for Energy Optimized
Variable Speed Low Power and Low Cost Household Equipment,‖
6th European Conference on Power Electronics and Applications,
Seville, 1995.
[26] F. C. Lin and S. M. Yang, ―On-Line Tuning of an Efficiency-
Optimized Vector Controlled Induction Motor Drive,‖ Tamkang
Journal of Science and Engineering, Vol. 6, No. 2, 2003.
[27]H. Sarhan and R. Issa, ―Modeling, Simulation and Test of Inverter-
Induction Motor Drive System with Improved Performance,‖
Journal of Engineering Sciences, Assiuit University, Vol. 33, No. 5,
2005.
[28] Rakesh Parekh, Microchip Technology Inc ,"AC Induction Motor
Fundamentals" , AN887,2003.
[29] VIV COHEN , Circuit Breaker Industries," INDUCTION MOTORS
- PROTECTION and STARTING", Johannesburg 2000.
95
[30] José de Oliveira, AdemirNied,"Study on the Energy Efficiency of
Soft Starting of an Induction Motor with Torque Control" , State
University of Santa Catarina , Brazil,2011.
[31] Gritter, D. ; Wang, D. &Habetler, T. G. (2000). Soft Starter inside
Delta Motor Modeling and Its Control, Proceedings of Industry
Applications Conference, ISBN 0-7803-6401-5,Rome, Italy,
October 2000.
[32] JuhamattiNikander ," Induction Motor Parameter Identification in
Elevator Drive Modernization", Thesis submitted for examination
for the degree of Master of Science in Technology .Espoo 7.1.2009.
[33] Online Catalogue for Us. Motor Company
,http://www.usmotors.com/Online-Catalog.aspx .
[34]West Virginia Department of Health and Human Resources,
"PrivateWater Well Owners–Water Well Pumping Systems" , 2008.
[35] UK Water Industry, "Specification For Package Pumping Station
s Intended To Serve More Than One Property" , California
Agriculture ,1996 .
[36]Don Lundberg, Sr. Engineer, Technical Publication "Protect Your
Pump and Keep it Longer" , 2009.
[37] Motors and Generators, ANSI/NEMA MG1, 1998.
[38] WallbomCarlson ,"Idealized VFD Efficiency Factor (Motor Plus
VFD Controller) That Ignores Motor Duty-Point Movement " .
[39] Mrs. Nidhi Gupta ,"The application of Variable Frequency Drive
as an efficient control element in cement industry ",2013.

96
[40] Neetha John, Mohandas R, Suja C Rajappan ,"Energy Saving
Mechanism Using Variable Frequency Drives " , March , 2013.
[41] Amresh Kumar Ray, Kaushal Prasad ,Nitish Kumar , ―High Power
Factor Operation and Application of VFD Technology‖ - Carrier
Corporation, Syracuse, New York, October 2005.
[42]http://www.automation.com/resources-tools/articles-white-
papers/motor-drives-control/choosing-between-soft-starters-and-
drives .

97
Appendix (A)
Data sheet for using pump

98

99
Appendix (B)
Electrical drawings for pump control box
Figure A1: Front plate of the control panel

100
Figure A2: Power Circuit of the Control System

101
=
Figure A3: Control Circuit of the Control System

102
Figure A4: Control Circuit of the Control System

جامعة النجاح الوطنية كمية الدراسات العميا
في التحميل المالي و التقني في استخدام نظام التردد المتغير
مضخات المياه بالمقارنة مع التردد الثابت
اعداد
أنور ياسر ربع
اشراف
مروان محمود .دأ.
هندسة الطاقة قدمت هذه الاطروحة استكمالا لمتطمبات الحصول عمى درجة الماجستير في
فمسطين. -النظيفة واستراتيجية الترشيد بكمية الدراسات العميا في جامعة النجاح الوطنية, نابمس2014

ب
التحميل المالي و التقني في استخدام نظام التردد المتغير في مضخات المياه بالمقارنة مع التردد الثابت اعداد
أنور ياسر ربع اشراف
أ.د مروان محمود
الممخصتقنية تغيير السرعو لمتحكم بضخ المياه من الابار الارتوازيو اصبحت في وقتنا الحالي من التقنيات المستخدمو في ىذا المجال لما ليا من فوائد عديده تعود عمى مستخدمييا حيث انيا تقمل من
يو بالمقارنو مع استيلاك الطاقو وبالتالي تقميل التكاليف عمى المزارعين وضخ المياه بكفاءه عال التقنيات الاخرى المستخدمو.
ىذا البحث قائم عمى دراسة العديد من انواع التحكم المستخدمو لضخ المياه وكذلك دراسة ثلاثو ابار ارتوازيو دراسو عمميو ونظريو في منطقو طولكرم حيث تستخدم ىذه التقنيو في بئرين والبئر
الثالث يستخدم تقنيو التردد الثابت.ض ىذا البحث تحميل لمطالقو المستيمكو في الثلاثة ابار لمقارنو تكاليف الضخ في الابار التي يعر
تستخدم تقنيو تغيير التردد مع البئر الذي يستخدم تقنيو التردد الثابت.