Renewable Electricity in Germany – the Renewable Energy Act
Technical and economic features of renewable electricity technologies
P. Lako
ECN-E--10-034 May 2010
2 ECN-E--10-034
Acknowledgement/Preface This study provides an analysis of the potential for cost reduction for a number of key renewable energy technologies. The study was initiated to investigate the potential impact of technological learning on renewable electricity generation technologies and has been performed in the framework of an international project with a long-term view. Valuable comments have been received from Joost van Stralen (co-reader) and incorporated to the maximum extent. The study has been registered at ECN under project number 5.0368. Abstract Renewable energy technologies show a steady growth both in Europe and on a global scale. In this study, the potential for cost reduction of renewable energy technologies is investigated, based on assumed learning effects. These learning effects may involve cost reductions of 5-20% for each doubling of the cumulative installed capacity for a specific renewable energy technology. The extent to which the investment costs (and also the operation and maintenance costs) of a technology may be reduced, depend therefore on two main variables, i.e. on the one hand the learning effect that is representative for that technology and on the other hand the potential expansion of the global (or European) capacity of the technology of interest. In this way, future investment costs and operation and maintenance costs of key renewable energy technologies are estimated.
ECN-E--10-034 3
Contents
List of tables 4
List of figures 4
Summary 5
1. Introduction 8 1.1 General 8 1.2 Scenarios for deployment of renewable electricity technologies 8
2. Onshore wind 13
3. Offshore wind 17
4. Geothermal power 21
5. Concentrating Solar Power 26 5.1 Introduction 26 5.2 Mirror-based systems 26 5.3 Fresnel-lens based systems 29 5.4 Industrial activity 29 5.5 Integrated Solar (gas-fired) Combined Cycle (ISCC) plant 30 5.6 Current state of the art 30 5.7 Main technical and economic data for southern Europe 32 5.8 Main technical and economic data for North Africa 34
6. Photovoltaic power 36 6.1 Introduction 36 6.2 Types and main components 37 6.3 Markets of different PV technologies and applications 38 6.4 Main technical and economic data 39
7. Hydro power 41 7.1 Introduction 41 7.2 Environmental issues 41 7.3 Types 42 7.4 Construction and generation costs 42
8. Conclusions 44
References 45
Internet Sources 49
4 ECN-E--10-034
List of tables
Table 2.1 Realistic potential of onshore wind in the EU27 region including Norway, Switzerland, and Turkey a 15
Table 2.2 Technical and economic features of onshore wind in the EU 16 Table 3.1 Characteristics offshore wind farms in the EU 17 Table 3.2 Realistic potential of offshore wind in the EU27 region including Norway,
Switzerland, and Turkey a 19 Table 3.3 Technical and economic features of offshore wind in the EU 20 Table 4.1 Operational and projected geothermal power generation by country 21 Table 4.2 Geothermal capacity, generation, and potential by European country 23 Table 4.3 Technical and economic features of geothermal power in the EU 25 Table 5.1 Firms engaged in design, engineering, and manufacturing of solar thermal power 30 Table 5.2 Concentrating solar power (CSP) plants based on mirrors and the Fresnel lens 31 Table 5.3 Technical and economic features of Concentrating Solar Power (CSP) in the EU 33 Table 5.4 Technical and economic features of Concentrating Solar Power (CSP) in North
Africa 35 Table 6.1 Technical and economic features of photovoltaic power (PV) in the EU 40 Table 7.1 Economic characteristics of small hydro power in Europe 42 Table 7.2 Technical and economic features of small hydro power in the EU 43
List of figures
Figure 1.1 Maximum capacity of onshore wind in Europe and on a global scale 9 Figure 1.2 Maximum capacity of offshore wind in Europe and on a global scale 9 Figure 1.3 Maximum capacity of geothermal power in Europe and on a global scale 10 Figure 1.4 Maximum capacity of geothermal power in Europe and on a global scale 11 Figure 1.5 Maximum capacity of photovoltaic power (PV) in Europe and on a global scale 12 Figure 1.6 Maximum capacity of small hydro power in Europe and on a global scale 12 Figure 2.1 Approximate wind power penetration in a number of countries 13 Figure 4.1 Timescales of natural variability of renewable energies 22 Figure 4.2 Temperatures in the underground at 5 km depth 22 Figure 5.1 Operating scheme for parabolic through technology 27 Figure 5.2 Operating scheme for tower technology 28 Figure 5.3 Example for solar dish technology (25 kWe SES SunCatcher) 28 Figure 5.4 Visualisation of 177 MWe plant based on Fresnel-lens at the Carrizo Plain, CA 29 Figure 5.5 Concentrating solar power (CSP) projects under construction or planned 32 Figure 6.1 Development of the global photovoltaic market, 1980-2006 37 Figure 6.2 The global market of PV systems by country or region in 2008 38
ECN-E--10-034 5
Summary
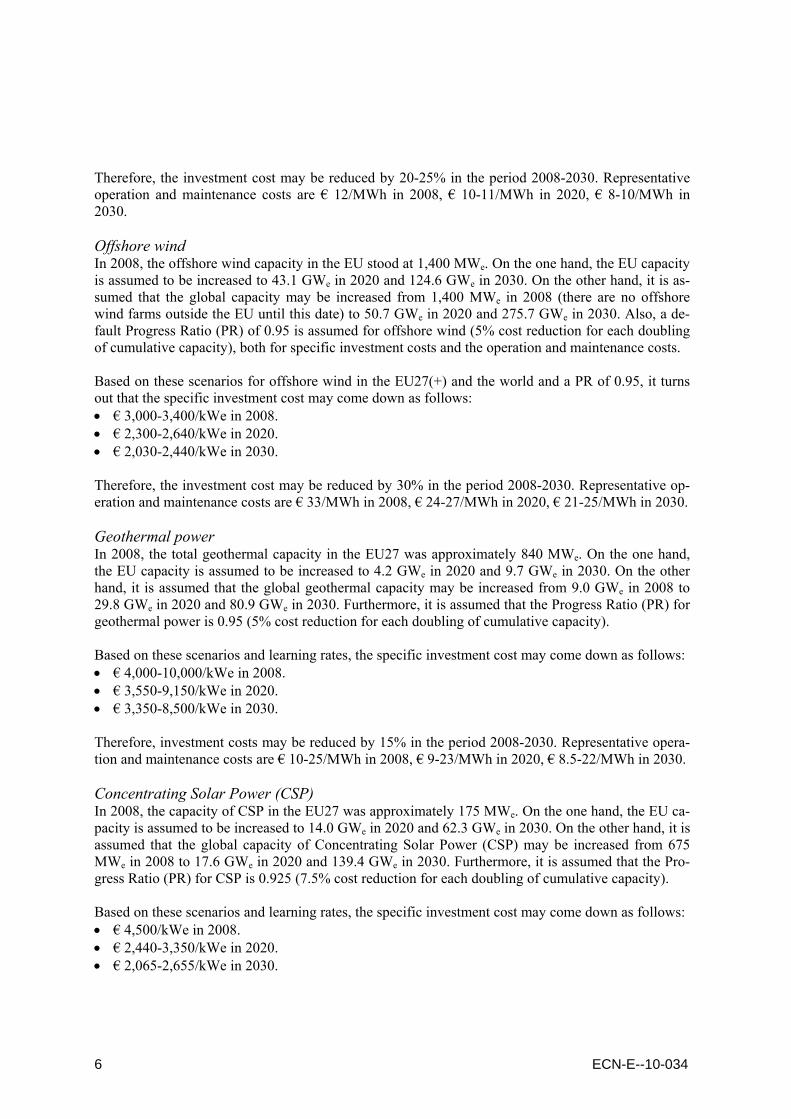
This study provides an overview of technical-economic data of renewable technologies for electricity generation from the point of view of future deployment and based on assumed learning effects. Learning effects for (renewable) energy technologies are mainly determined by two variables: • A so-called Progress Ratio (PR). The Progress Ratio is a number, e.g. 0.9, which determines that
the investment cost - specific investment cost, in €/kW installed - of a technology decreases by 10% for each doubling of the cumulative installed capacity. This PR is generally applied to the global installed capacity of a renewable energy technology. However, it may also be applied to the European capacity of, e.g. offshore wind, particularly if a technology is not (yet) applied else-where. The most realistic results, however, apply to a global context.
• The other variable is the (global) expansion to be expected for a specific renewable energy tech-nology. It has been argued that global scenarios are preferred above European scenarios. How-ever, in this study both European and global expansion scenarios are considered. It may be prefer-able to consider relatively optimistic scenarios in order to investigate the potential cost reduction for several renewable energy technologies.
Therefore, this study considers a number of renewable energy technologies and their potential for cost reduction in the timeframe 2008-2030 (and beyond). This is performed in the following way: • The technology is characterised in terms of currently installed capacity, current electricity genera-
tion, capacity factor (number of full-load hours), availability, etc. • The investment cost and the current operation and maintenance (O&M) costs are presented. • The global and European potential of the technology is presented, starting with the technical po-
tential of the technology but including constraints from environmental protection, etc. • The future investment cost (in €/kW installed) is determined based on a learning curve that may
be representative for a technology. A progress ratio (PR) is defined. The cost of operation and maintenance (O&M) is assumed to decrease proportionally with the investment cost.
The investment costs and operation and maintenance costs are expressed in € of the year 2008. Onshore wind In 2008, the onshore wind capacity in the EU, Norway, Switzerland and Turkey stood at 64.5 GWe. On the one hand, the EU capacity is assumed to be increased to 149 GWe in 2020 and 210 GWe in 2030. On the other hand, it is assumed that the global onshore wind capacity may be increased from 119.4 GWe in 2008 to 488 GWe in 2020 and 1,028 GWe in 2030. Furthermore, it is assumed that the Progress Ratio (PR) for onshore wind is 0.9, which means that the investment cost decreases by 10% for each doubling of the cumulative capacity. For the operation and maintenance costs of onshore wind a similar cost reduction is assumed. Based on these scenarios for onshore wind in the EU27(+) and the world and a PR of 0.9, it turns out that the specific investment cost may come down as follows: • € 1,350/kWe in 2008. • € 1,090-1,190/kWe in 2020. • € 970-1,130/kWe in 2030.
6 ECN-E--10-034
Therefore, the investment cost may be reduced by 20-25% in the period 2008-2030. Representative operation and maintenance costs are € 12/MWh in 2008, € 10-11/MWh in 2020, € 8-10/MWh in 2030. Offshore wind In 2008, the offshore wind capacity in the EU stood at 1,400 MWe. On the one hand, the EU capacity is assumed to be increased to 43.1 GWe in 2020 and 124.6 GWe in 2030. On the other hand, it is as-sumed that the global capacity may be increased from 1,400 MWe in 2008 (there are no offshore wind farms outside the EU until this date) to 50.7 GWe in 2020 and 275.7 GWe in 2030. Also, a de-fault Progress Ratio (PR) of 0.95 is assumed for offshore wind (5% cost reduction for each doubling of cumulative capacity), both for specific investment costs and the operation and maintenance costs. Based on these scenarios for offshore wind in the EU27(+) and the world and a PR of 0.95, it turns out that the specific investment cost may come down as follows: • € 3,000-3,400/kWe in 2008. • € 2,300-2,640/kWe in 2020. • € 2,030-2,440/kWe in 2030. Therefore, the investment cost may be reduced by 30% in the period 2008-2030. Representative op-eration and maintenance costs are € 33/MWh in 2008, € 24-27/MWh in 2020, € 21-25/MWh in 2030. Geothermal power In 2008, the total geothermal capacity in the EU27 was approximately 840 MWe. On the one hand, the EU capacity is assumed to be increased to 4.2 GWe in 2020 and 9.7 GWe in 2030. On the other hand, it is assumed that the global geothermal capacity may be increased from 9.0 GWe in 2008 to 29.8 GWe in 2020 and 80.9 GWe in 2030. Furthermore, it is assumed that the Progress Ratio (PR) for geothermal power is 0.95 (5% cost reduction for each doubling of cumulative capacity). Based on these scenarios and learning rates, the specific investment cost may come down as follows: • € 4,000-10,000/kWe in 2008. • € 3,550-9,150/kWe in 2020. • € 3,350-8,500/kWe in 2030. Therefore, investment costs may be reduced by 15% in the period 2008-2030. Representative opera-tion and maintenance costs are € 10-25/MWh in 2008, € 9-23/MWh in 2020, € 8.5-22/MWh in 2030. Concentrating Solar Power (CSP) In 2008, the capacity of CSP in the EU27 was approximately 175 MWe. On the one hand, the EU ca-pacity is assumed to be increased to 14.0 GWe in 2020 and 62.3 GWe in 2030. On the other hand, it is assumed that the global capacity of Concentrating Solar Power (CSP) may be increased from 675 MWe in 2008 to 17.6 GWe in 2020 and 139.4 GWe in 2030. Furthermore, it is assumed that the Pro-gress Ratio (PR) for CSP is 0.925 (7.5% cost reduction for each doubling of cumulative capacity). Based on these scenarios and learning rates, the specific investment cost may come down as follows: • € 4,500/kWe in 2008. • € 2,440-3,350/kWe in 2020. • € 2,065-2,655/kWe in 2030.

ECN-E--10-034 7
Therefore, investment costs may be reduced by approximately 48% in the period 2008-2030. Repre-sentative operation and maintenance costs are € 47/MWh in 2008, € 26-35/MWh in 2020, € 22-28/MWh in 2030. Photovoltaic power (PV) In 2008, the capacity of PV in the EU27 was approximately 9.4 GWe. On the one hand, the EU ca-pacity is assumed to be increased to 116 GWe in 2020 and 392 GWe in 2030. On the other hand, it is assumed that the global capacity of photovoltaic power (PV) may be increased from 14.7 GWe in 2008 to 189 GWe in 2020 and 716 GWe in 2030. Furthermore, it is assumed that the Progress Ratio (PR) for PV is 0.82 (18% cost reduction for each doubling of cumulative capacity). Based on these scenarios and learning rates, the specific investment cost may come down as follows: • € 3,600-4,500/kWe in 2008. • € 1,730-2,190/kWe in 2020. • € 1,180-1,550/kWe in 2030. Therefore, investment costs may be reduced by approximately 67% in the period 2008-2030. Repre-sentative operation and maintenance costs are € 18-19/MWh in 2008, € 8-10/MWh in 2020, € 5-7/MWh in 2030. Hydropower In 2008, the capacity of small hydropower in the EU27 was approximately 12.8 GWe. On the one hand, the EU capacity is assumed to be increased to 16.7 GWe in 2020 and 19.0 GWe in 2030. On the other hand, it is assumed that the global small hydropower capacity may be increased from 85 GWe in 2008 to 116.8 GWe in 2020 and 145.3 GWe in 2030. Furthermore, it is assumed that the Progress Ratio (PR) for small hydropower is 0.95 (5% cost reduction per doubling of the cumulative capacity). Based on these scenarios and learning rates, the specific investment cost may come down as follows: • € 2,500-4,220/kWe in 2008. • € 2,440-4,130/kWe in 2020. • € 2,400-4,100/kWe in 2030. Therefore, investment costs may be reduced by 5% in the period 2008-2030. Representative opera-tion and maintenance costs are € 13-21/MWh in 2008, € 12-21/MWh in 2020, € 12-21/MWh in 2030.
8 ECN-E--10-034
1. Introduction
1.1 General This study provides an overview of technical-economic data of a number of renewable energy tech-nologies for electricity generation that are available today and may play an increasingly important role inside and outside Europe. These renewable electricity generation technologies are covered in the following way: • The technology is characterised in terms of currently installed capacity, current electricity genera-
tion, capacity factor (number of full-load hours), availability, etc. • The investment cost and the current operation and maintenance (O&M) costs are presented. • The global and European potential of the technology is presented, starting with the technical po-
tential of the technology but including constraints from environmental protection, etc. • The future investment cost (in €/kW installed) is determined based on a learning curve that may
be representative for a technology. First, a progress ratio (PR) is defined. For instance, a PR of 0.9 means that the investment cost (in €/kW installed) decreases by 10% for each doubling of the cu-mulative capacity of the technology. Then, the potential of the technology in Europe and the world in the period 2010-2050 is tentatively determined. Finally, the future investment cost is de-termined based on these global and European scenarios and taking into account the progress ratio of the technology. Also, the cost of operation and maintenance (O&M) is generally assumed to decrease proportionally with the investment cost.
The renewable electricity generation technologies covered in this study are: • Onshore wind (Chapter 2). • Offshore wind (Chapter 3). • Geothermal power (Chapter 4). • Concentrating Solar Power, CSP (Chapter 5). • Photovoltaic power, PV (Chapter 6). • Hydro power (Chapter 7).
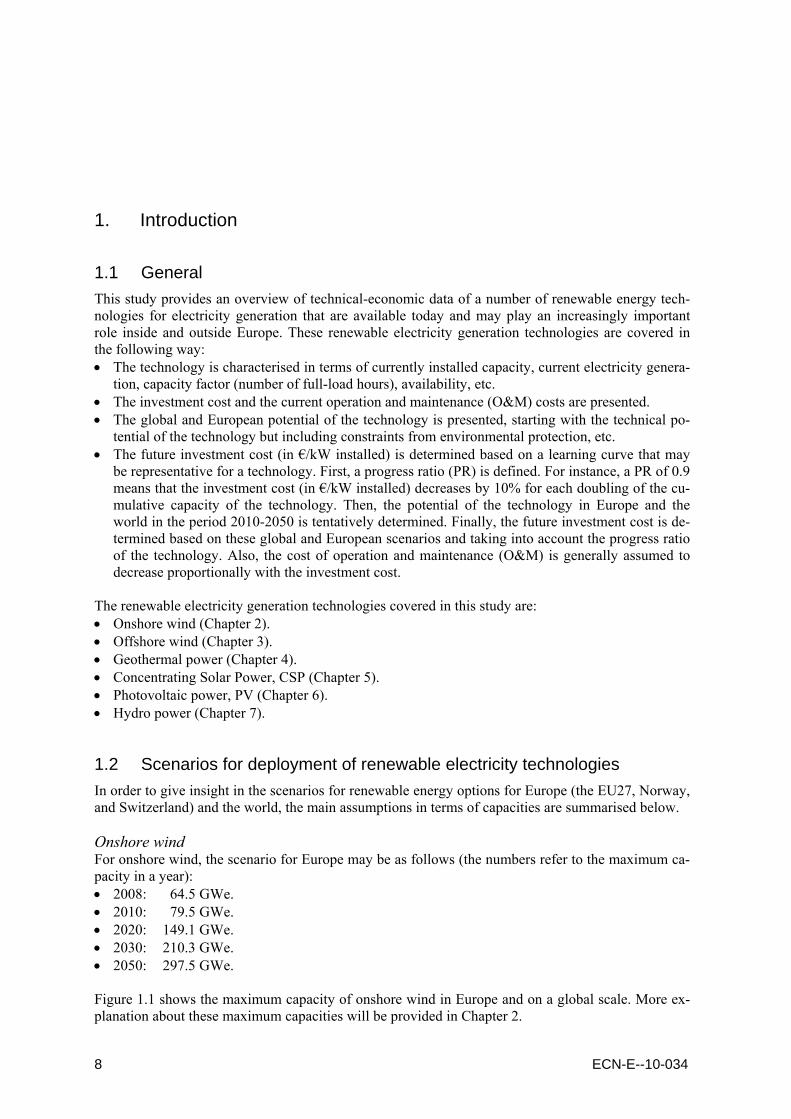
1.2 Scenarios for deployment of renewable electricity technologies In order to give insight in the scenarios for renewable energy options for Europe (the EU27, Norway, and Switzerland) and the world, the main assumptions in terms of capacities are summarised below. Onshore wind For onshore wind, the scenario for Europe may be as follows (the numbers refer to the maximum ca-pacity in a year): • 2008: 64.5 GWe. • 2010: 79.5 GWe. • 2020: 149.1 GWe. • 2030: 210.3 GWe. • 2050: 297.5 GWe. Figure 1.1 shows the maximum capacity of onshore wind in Europe and on a global scale. More ex-planation about these maximum capacities will be provided in Chapter 2.

ECN-E--10-034 9
0
500
1,000
1,500
2,000
2,500
3,000
2010 2015 2020 2025 2030 2035 2040 2045 2050
GW
e Rest of worldEurope
Figure 1.1 Maximum capacity of onshore wind in Europe and on a global scale
Offshore wind For onshore wind, the scenario for Europe may be as follows (the numbers refer to the maximum ca-pacity in a year): • 2008: 1.4 GWe. • 2010: 3.7 GWe. • 2020: 43.1 GWe. • 2030: 124.6 GWe. • 2050: 260 GWe. Figure 1.2 shows the maximum capacity of offshore wind. The offshore wind capacity of the EU in 2020-2030 is based on (Tambke and Michalowska-Knap, 2010), as will be explained in Chapter 3.
0
100
200
300
400
500
600
700
800
900
2010 2015 2020 2025 2030 2035 2040 2045 2050
Rest of worldEurope
[GWe]
Figure 1.2 Maximum capacity of offshore wind in Europe and on a global scale
10 ECN-E--10-034
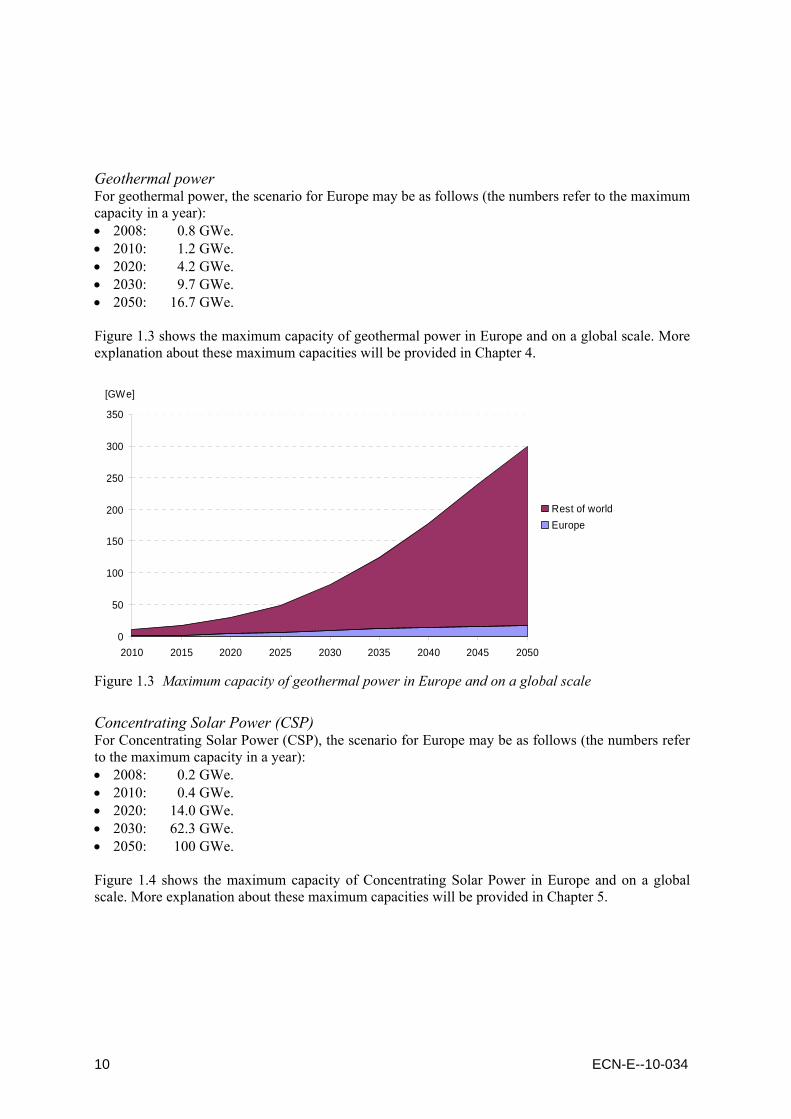
Geothermal power For geothermal power, the scenario for Europe may be as follows (the numbers refer to the maximum capacity in a year): • 2008: 0.8 GWe. • 2010: 1.2 GWe. • 2020: 4.2 GWe. • 2030: 9.7 GWe. • 2050: 16.7 GWe. Figure 1.3 shows the maximum capacity of geothermal power in Europe and on a global scale. More explanation about these maximum capacities will be provided in Chapter 4.
0
50
100
150
200
250
300
350
2010 2015 2020 2025 2030 2035 2040 2045 2050
Rest of worldEurope
[GWe]
Figure 1.3 Maximum capacity of geothermal power in Europe and on a global scale
Concentrating Solar Power (CSP) For Concentrating Solar Power (CSP), the scenario for Europe may be as follows (the numbers refer to the maximum capacity in a year): • 2008: 0.2 GWe. • 2010: 0.4 GWe. • 2020: 14.0 GWe. • 2030: 62.3 GWe. • 2050: 100 GWe. Figure 1.4 shows the maximum capacity of Concentrating Solar Power in Europe and on a global scale. More explanation about these maximum capacities will be provided in Chapter 5.

ECN-E--10-034 11
0
100
200
300
400
500
600
2010 2015 2020 2025 2030 2035 2040 2045 2050
Rest of worldEurope
[GWe]
Figure 1.4 Maximum capacity of geothermal power in Europe and on a global scale
Photovoltaic power (PV) For photovoltaic power (PV), the scenario for Europe may be as follows (the numbers refer to the maximum capacity in a year): • 2008: 9.4 GWe. • 2010: 15.9 GWe. • 2020: 115.8 GWe. • 2030: 392 GWe. • 2050: 988 GWe. Figure 1.5 shows the maximum capacity of photovoltaic power in Europe and on a global scale. More explanation about these maximum capacities will be provided in Chapter 6.
12 ECN-E--10-034
0
500
1,000
1,500
2,000
2,500
3,000
2010 2015 2020 2025 2030 2035 2040 2045 2050
Rest of worldEurope
[GWe]
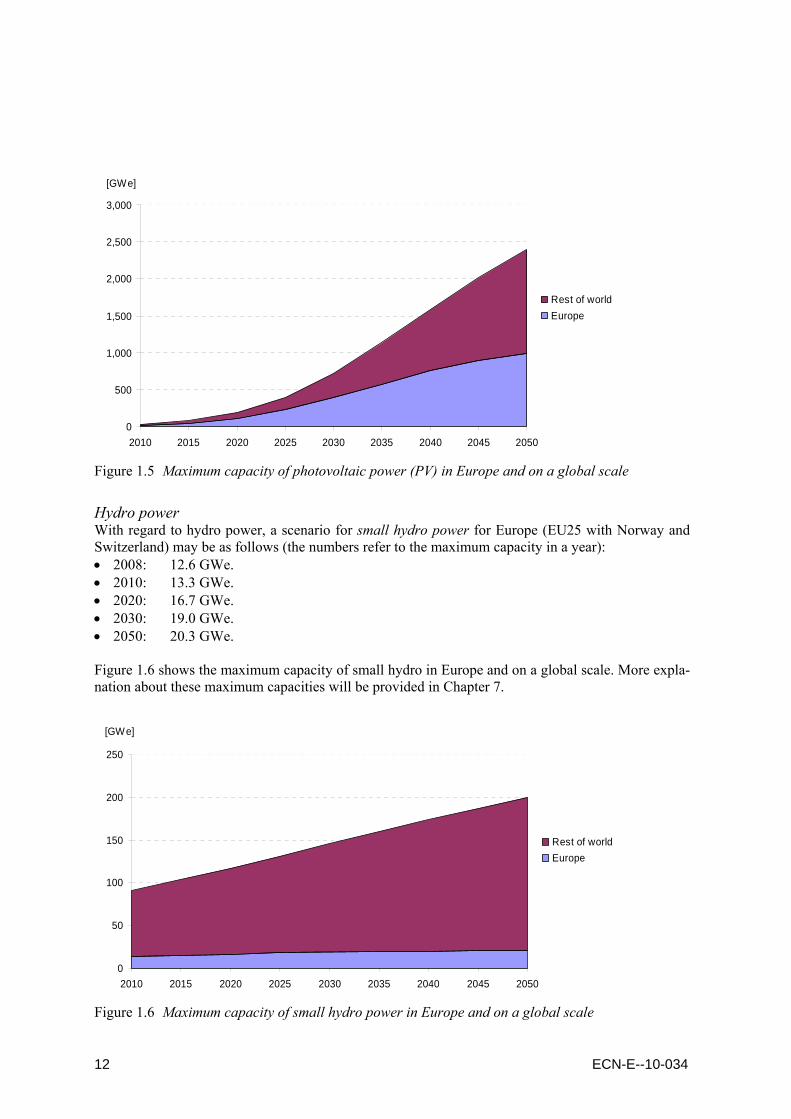
Figure 1.5 Maximum capacity of photovoltaic power (PV) in Europe and on a global scale
Hydro power With regard to hydro power, a scenario for small hydro power for Europe (EU25 with Norway and Switzerland) may be as follows (the numbers refer to the maximum capacity in a year): • 2008: 12.6 GWe. • 2010: 13.3 GWe. • 2020: 16.7 GWe. • 2030: 19.0 GWe. • 2050: 20.3 GWe. Figure 1.6 shows the maximum capacity of small hydro in Europe and on a global scale. More expla-nation about these maximum capacities will be provided in Chapter 7.
0
50
100
150
200
250
2010 2015 2020 2025 2030 2035 2040 2045 2050
Rest of worldEurope
[GWe]
Figure 1.6 Maximum capacity of small hydro power in Europe and on a global scale
ECN-E--10-034 13
2. Onshore wind
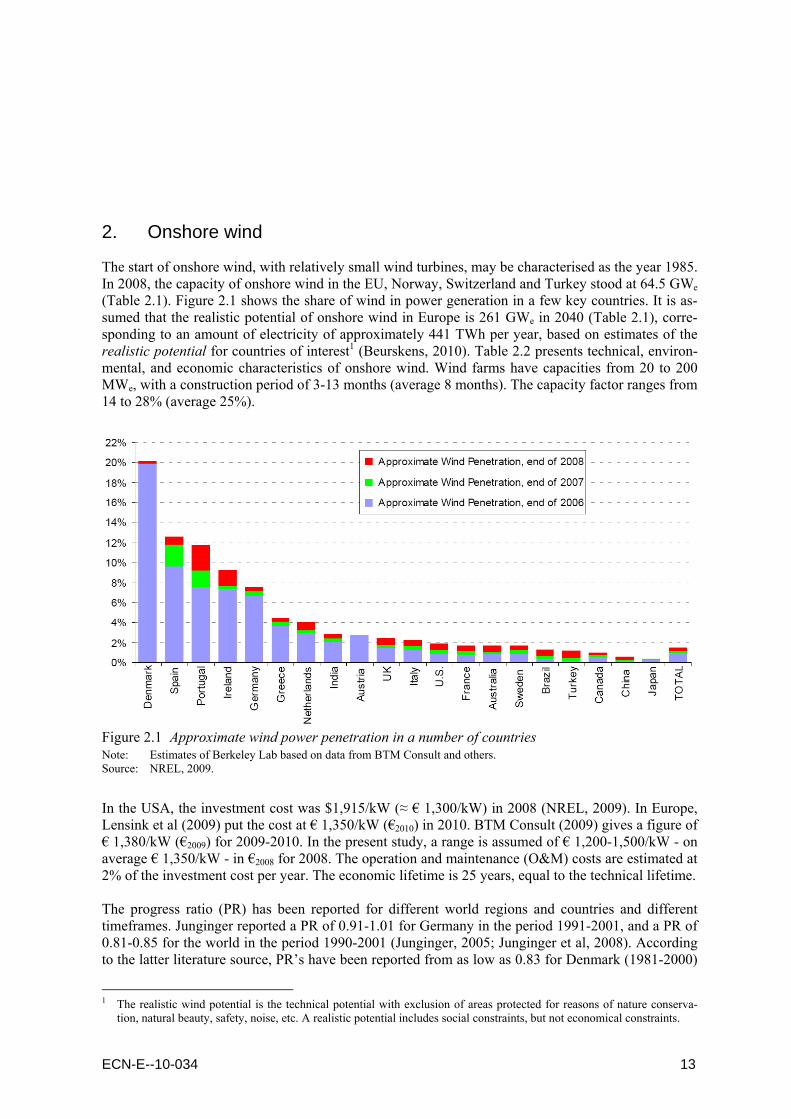
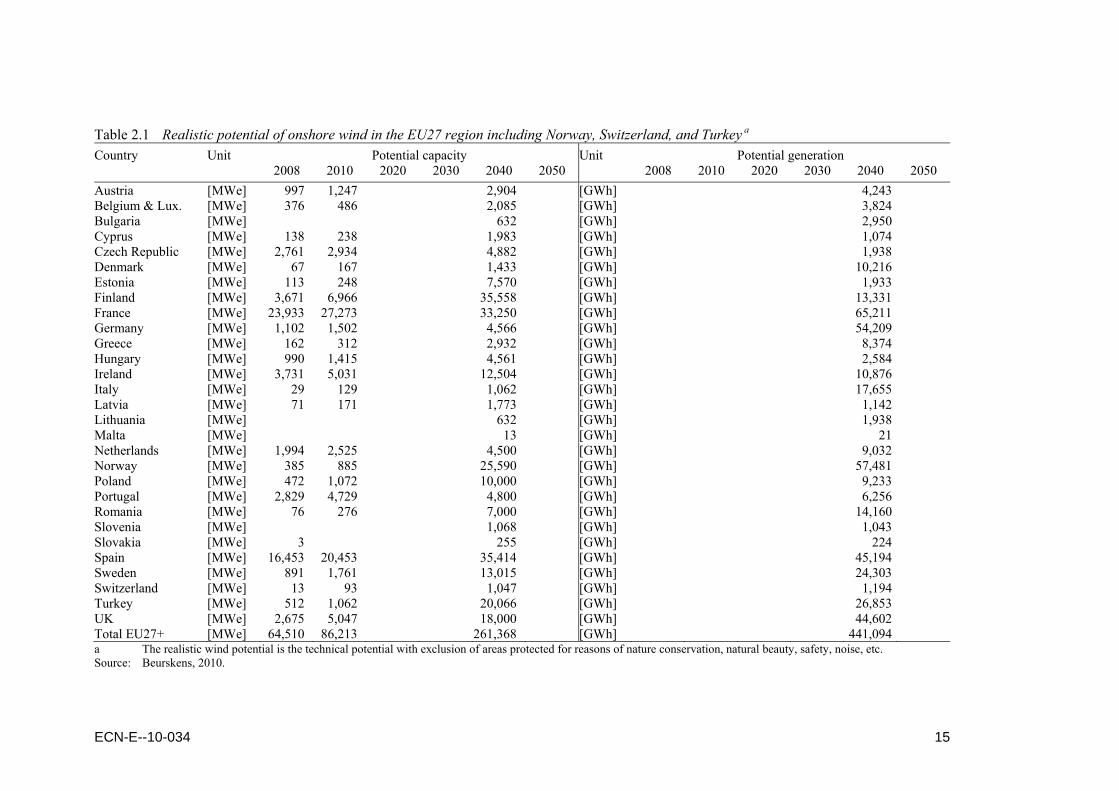
The start of onshore wind, with relatively small wind turbines, may be characterised as the year 1985. In 2008, the capacity of onshore wind in the EU, Norway, Switzerland and Turkey stood at 64.5 GWe (Table 2.1). Figure 2.1 shows the share of wind in power generation in a few key countries. It is as-sumed that the realistic potential of onshore wind in Europe is 261 GWe in 2040 (Table 2.1), corre-sponding to an amount of electricity of approximately 441 TWh per year, based on estimates of the realistic potential for countries of interest1 (Beurskens, 2010). Table 2.2 presents technical, environ-mental, and economic characteristics of onshore wind. Wind farms have capacities from 20 to 200 MWe, with a construction period of 3-13 months (average 8 months). The capacity factor ranges from 14 to 28% (average 25%).
Figure 2.1 Approximate wind power penetration in a number of countries Note: Estimates of Berkeley Lab based on data from BTM Consult and others. Source: NREL, 2009.
In the USA, the investment cost was $1,915/kW (≈ € 1,300/kW) in 2008 (NREL, 2009). In Europe, Lensink et al (2009) put the cost at € 1,350/kW (€2010) in 2010. BTM Consult (2009) gives a figure of € 1,380/kW (€2009) for 2009-2010. In the present study, a range is assumed of € 1,200-1,500/kW - on average € 1,350/kW - in €2008 for 2008. The operation and maintenance (O&M) costs are estimated at 2% of the investment cost per year. The economic lifetime is 25 years, equal to the technical lifetime. The progress ratio (PR) has been reported for different world regions and countries and different timeframes. Junginger reported a PR of 0.91-1.01 for Germany in the period 1991-2001, and a PR of 0.81-0.85 for the world in the period 1990-2001 (Junginger, 2005; Junginger et al, 2008). According to the latter literature source, PR’s have been reported from as low as 0.83 for Denmark (1981-2000)
1 The realistic wind potential is the technical potential with exclusion of areas protected for reasons of nature conserva-
tion, natural beauty, safety, noise, etc. A realistic potential includes social constraints, but not economical constraints.

14 ECN-E--10-034
to as high as 0.92-0.94 for wind turbines produced in Denmark and Germany (until about 2003). Therefore, the PR of onshore wind is put at 0.9, which means that the investment cost decreases by 10% for each doubling of the cumulative capacity. The investment costs depend on future capacities. There are two scenarios: a global scenario ending up at 2,390 GWe in 2050, and a European scenario ending up at approximately 300 GWe in 2050 (Beurskens, 2010). Table 2.2 shows the development of the specific investment costs. The investment cost may come down to € 860/kW or € 1,070/kW in 2050, depending on the scenario.
ECN-E--10-034 15
Table 2.1 Realistic potential of onshore wind in the EU27 region including Norway, Switzerland, and Turkey a Country Unit Potential capacity Unit Potential generation 2008 2010 2020 2030 2040 2050 2008 2010 2020 2030 2040 2050 Austria [MWe] 997 1,247 2,904 [GWh] 4,243 Belgium & Lux. [MWe] 376 486 2,085 [GWh] 3,824 Bulgaria [MWe] 632 [GWh] 2,950 Cyprus [MWe] 138 238 1,983 [GWh] 1,074 Czech Republic [MWe] 2,761 2,934 4,882 [GWh] 1,938 Denmark [MWe] 67 167 1,433 [GWh] 10,216 Estonia [MWe] 113 248 7,570 [GWh] 1,933 Finland [MWe] 3,671 6,966 35,558 [GWh] 13,331 France [MWe] 23,933 27,273 33,250 [GWh] 65,211 Germany [MWe] 1,102 1,502 4,566 [GWh] 54,209 Greece [MWe] 162 312 2,932 [GWh] 8,374 Hungary [MWe] 990 1,415 4,561 [GWh] 2,584 Ireland [MWe] 3,731 5,031 12,504 [GWh] 10,876 Italy [MWe] 29 129 1,062 [GWh] 17,655 Latvia [MWe] 71 171 1,773 [GWh] 1,142 Lithuania [MWe] 632 [GWh] 1,938 Malta [MWe] 13 [GWh] 21 Netherlands [MWe] 1,994 2,525 4,500 [GWh] 9,032 Norway [MWe] 385 885 25,590 [GWh] 57,481 Poland [MWe] 472 1,072 10,000 [GWh] 9,233 Portugal [MWe] 2,829 4,729 4,800 [GWh] 6,256 Romania [MWe] 76 276 7,000 [GWh] 14,160 Slovenia [MWe] 1,068 [GWh] 1,043 Slovakia [MWe] 3 255 [GWh] 224 Spain [MWe] 16,453 20,453 35,414 [GWh] 45,194 Sweden [MWe] 891 1,761 13,015 [GWh] 24,303 Switzerland [MWe] 13 93 1,047 [GWh] 1,194 Turkey [MWe] 512 1,062 20,066 [GWh] 26,853 UK [MWe] 2,675 5,047 18,000 [GWh] 44,602 Total EU27+ [MWe] 64,510 86,213 261,368 [GWh] 441,094 a The realistic wind potential is the technical potential with exclusion of areas protected for reasons of nature conservation, natural beauty, safety, noise, etc. Source: Beurskens, 2010.

16 ECN-E--10-034
Table 2.2 Technical and economic features of onshore wind in the EU Technical performance Unit Typical ranges Technology Onshore wind Efficiency [%] Not applicable Construction period [month] 3-13; average 8 Technical lifetime [year] 25 Capacity factor [%] 14-28; average 25 Maximum availability [%] 98 Environmental impact Typical ranges GHG emissions [kg/MWh] Not applicable SO2 [g/MWh] Not applicable NOx [g/MWh] Not applicable Particulates [g/MWh] Not applicable Solid waste [g/MWh] Not applicable Costs [€2008] Investment cost including IDC a (2008) [€/kW] 1,200-1,500; average 1,350 Fixed & variable O&M cost [% of inv.] 2 Fuel cost [€/MWh] Not applicable Economic lifetime [year] 25 Progress ratio [] 0.9 Data projections 2010 2020 2030 2050 Variant Low Average High Low Average High Low Average High AverageCapacity factor [%] 25 25 25 25 25 25 25 25 25 25 Investment cost including IDC a [€/kW] 1,147-
1,163 1,290-1,308
1,433-1,453
969-1,057
1,090-1,189
1,211-1,321
865-1,003
973- 1,128
1,081-1,253
856- 1,070
Operation and maintenance [€/MWh] 10.5- 10.6
11.8- 11.9
13.1- 13.3
8.8- 9.7
10.0- 10.9
11.1- 12.1
7.9- 9.2
8.0- 10.3
9.9- 11.4
7.8- 9.8
Capacity Europe (realistic potential) [GWe] 79.5 79.5 79.5 149.1 149.1 149.1 210.3 210.3 210.3 297.5 Capacity world (realistic potential) [GWe] 160.7 160.7 160.7 487.7 487.7 487.7 1,028.4 1,028.4 1,028.4 2,390 a IDC = Interest during construction.
ECN-E--10-034 17
3. Offshore wind
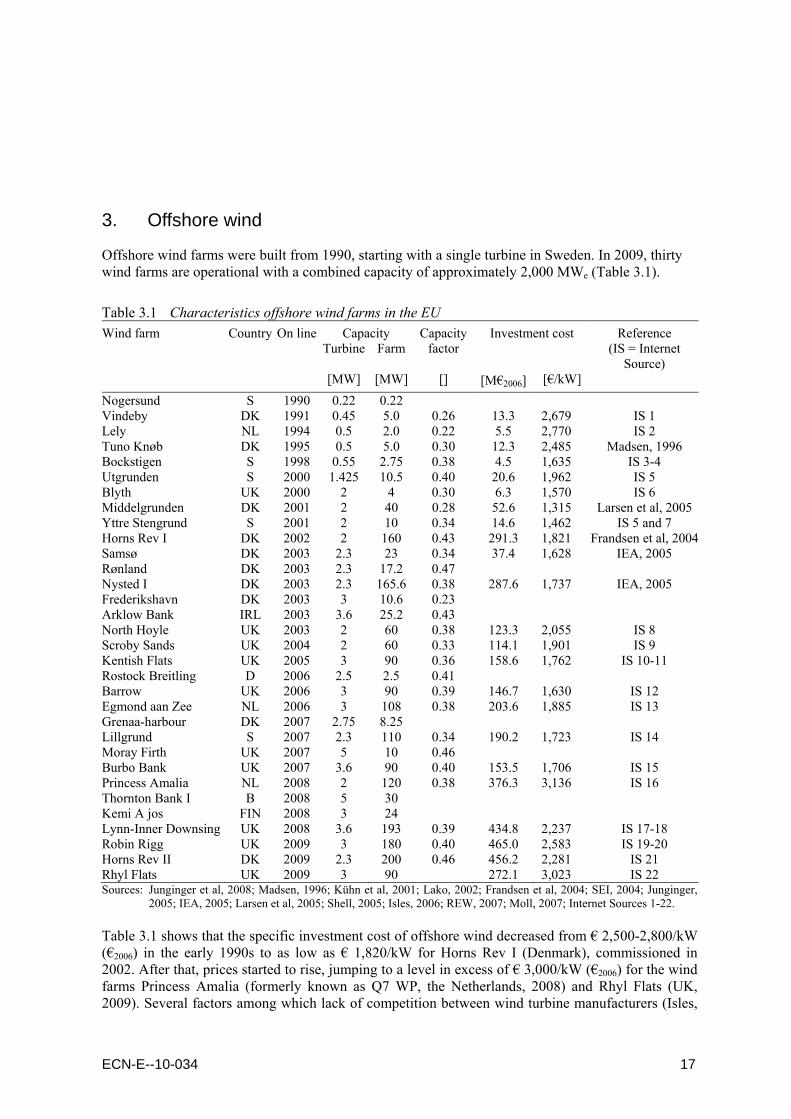
Offshore wind farms were built from 1990, starting with a single turbine in Sweden. In 2009, thirty wind farms are operational with a combined capacity of approximately 2,000 MWe (Table 3.1).
Table 3.1 Characteristics offshore wind farms in the EU Wind farm Country On line Capacity Capacity
factor Investment cost Reference
(IS = Internet Source)
Turbine Farm
[MW] [MW] [] [M€2006] [€/kW] Nogersund S 1990 0.22 0.22 Vindeby DK 1991 0.45 5.0 0.26 13.3 2,679 IS 1 Lely NL 1994 0.5 2.0 0.22 5.5 2,770 IS 2 Tuno Knøb DK 1995 0.5 5.0 0.30 12.3 2,485 Madsen, 1996 Bockstigen S 1998 0.55 2.75 0.38 4.5 1,635 IS 3-4 Utgrunden S 2000 1.425 10.5 0.40 20.6 1,962 IS 5 Blyth UK 2000 2 4 0.30 6.3 1,570 IS 6 Middelgrunden DK 2001 2 40 0.28 52.6 1,315 Larsen et al, 2005Yttre Stengrund S 2001 2 10 0.34 14.6 1,462 IS 5 and 7 Horns Rev I DK 2002 2 160 0.43 291.3 1,821 Frandsen et al, 2004Samsø DK 2003 2.3 23 0.34 37.4 1,628 IEA, 2005 Rønland DK 2003 2.3 17.2 0.47 Nysted I DK 2003 2.3 165.6 0.38 287.6 1,737 IEA, 2005 Frederikshavn DK 2003 3 10.6 0.23 Arklow Bank IRL 2003 3.6 25.2 0.43 North Hoyle UK 2003 2 60 0.38 123.3 2,055 IS 8 Scroby Sands UK 2004 2 60 0.33 114.1 1,901 IS 9 Kentish Flats UK 2005 3 90 0.36 158.6 1,762 IS 10-11 Rostock Breitling D 2006 2.5 2.5 0.41 Barrow UK 2006 3 90 0.39 146.7 1,630 IS 12 Egmond aan Zee NL 2006 3 108 0.38 203.6 1,885 IS 13 Grenaa-harbour DK 2007 2.75 8.25 Lillgrund S 2007 2.3 110 0.34 190.2 1,723 IS 14 Moray Firth UK 2007 5 10 0.46 Burbo Bank UK 2007 3.6 90 0.40 153.5 1,706 IS 15 Princess Amalia NL 2008 2 120 0.38 376.3 3,136 IS 16 Thornton Bank I B 2008 5 30 Kemi A jos FIN 2008 3 24 Lynn-Inner Downsing UK 2008 3.6 193 0.39 434.8 2,237 IS 17-18 Robin Rigg UK 2009 3 180 0.40 465.0 2,583 IS 19-20 Horns Rev II DK 2009 2.3 200 0.46 456.2 2,281 IS 21 Rhyl Flats UK 2009 3 90 272.1 3,023 IS 22 Sources: Junginger et al, 2008; Madsen, 1996; Kühn et al, 2001; Lako, 2002; Frandsen et al, 2004; SEI, 2004; Junginger,
2005; IEA, 2005; Larsen et al, 2005; Shell, 2005; Isles, 2006; REW, 2007; Moll, 2007; Internet Sources 1-22. Table 3.1 shows that the specific investment cost of offshore wind decreased from € 2,500-2,800/kW (€2006) in the early 1990s to as low as € 1,820/kW for Horns Rev I (Denmark), commissioned in 2002. After that, prices started to rise, jumping to a level in excess of € 3,000/kW (€2006) for the wind farms Princess Amalia (formerly known as Q7 WP, the Netherlands, 2008) and Rhyl Flats (UK, 2009). Several factors among which lack of competition between wind turbine manufacturers (Isles,
18 ECN-E--10-034
2006), risk aversion by manufacturers that were able to choose between supply of on- and offshore wind turbines, and fast increasing prices of steel and copper caused price increases of approximately 50%. After a period of rising prices, it is highly probable that prices of offshore wind farms will come down again. Junginger et al. (2008) argue that a number of factors cause long-term cost reduc-tion: • Increasing capacity of wind turbines, from 500 kW in the early 1990s to 2 MW in 2000, and 5
MW and more today (economies of scale of offshore wind turbines). • Increasing numbers of turbines and correspondingly increasing capacity of wind farms, which
may be up to 400 MW around 2010 (economies of scale by series production). • Fewer platforms/foundations needed as wind turbine capacities increase: for example, Thornton
Bank (Belgium) will have 60 turbines of 5 MW each, compared to 100 turbines of 3 MW for Thanet (UK). However, the anvil, the connecting piece between piling hammer and pile, reaches its limit at a diameter of six metres. The pile diameter for a 5-MW machine in water 30 metres deep would surpass that limit (Mathis, 2006; Internet Source 23).
• Economies of scale with regard to lifting equipment, reported by Söger et al. (2006). • Reduced cost of cables, transformers, and grid connection (Junginger, 2005), which may be a
function of the size of the wind farm. It is acknowledged that High Voltage Direct Current (HVDC) appears to be optimal for large, relatively far offshore wind farms (400-1,000 MW).
• Significant learning by doing occurring during turbine installation, e.g., the time to install an off-shore wind turbine was reduced from over 48 to less than 8 eight hours (Junginger, 2005).
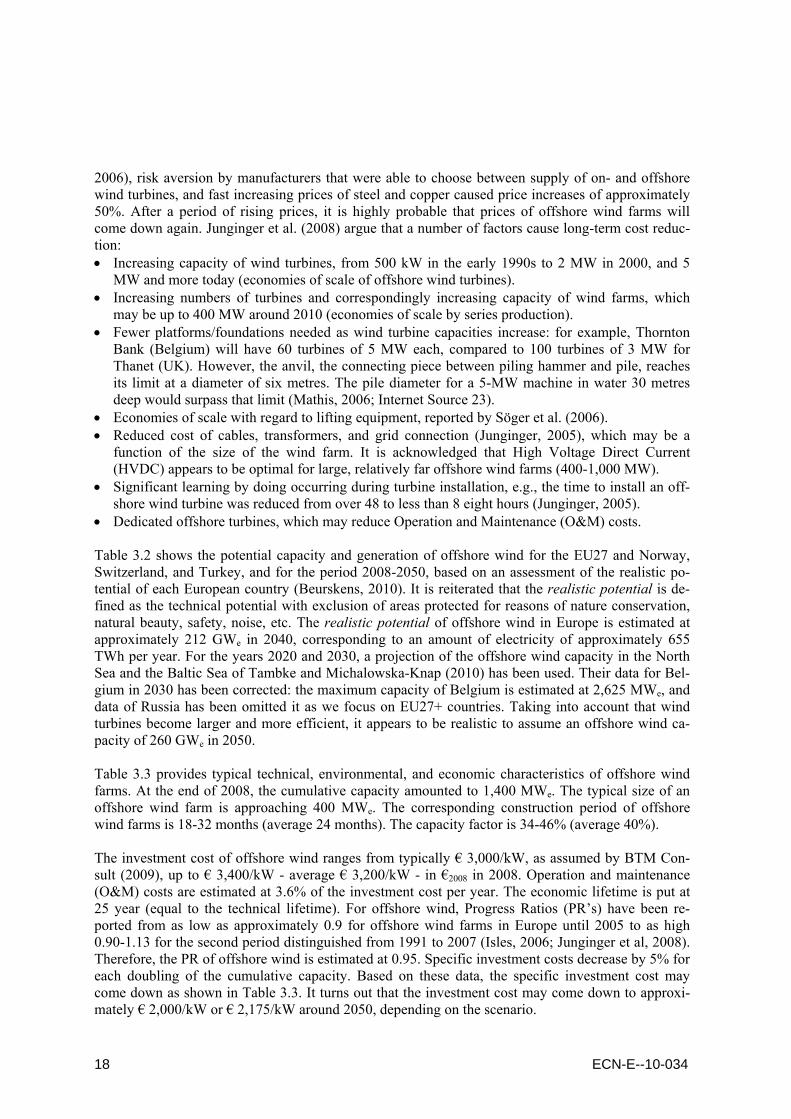
• Dedicated offshore turbines, which may reduce Operation and Maintenance (O&M) costs. Table 3.2 shows the potential capacity and generation of offshore wind for the EU27 and Norway, Switzerland, and Turkey, and for the period 2008-2050, based on an assessment of the realistic po-tential of each European country (Beurskens, 2010). It is reiterated that the realistic potential is de-fined as the technical potential with exclusion of areas protected for reasons of nature conservation, natural beauty, safety, noise, etc. The realistic potential of offshore wind in Europe is estimated at approximately 212 GWe in 2040, corresponding to an amount of electricity of approximately 655 TWh per year. For the years 2020 and 2030, a projection of the offshore wind capacity in the North Sea and the Baltic Sea of Tambke and Michalowska-Knap (2010) has been used. Their data for Bel-gium in 2030 has been corrected: the maximum capacity of Belgium is estimated at 2,625 MWe, and data of Russia has been omitted it as we focus on EU27+ countries. Taking into account that wind turbines become larger and more efficient, it appears to be realistic to assume an offshore wind ca-pacity of 260 GWe in 2050. Table 3.3 provides typical technical, environmental, and economic characteristics of offshore wind farms. At the end of 2008, the cumulative capacity amounted to 1,400 MWe. The typical size of an offshore wind farm is approaching 400 MWe. The corresponding construction period of offshore wind farms is 18-32 months (average 24 months). The capacity factor is 34-46% (average 40%). The investment cost of offshore wind ranges from typically € 3,000/kW, as assumed by BTM Con-sult (2009), up to € 3,400/kW - average € 3,200/kW - in €2008 in 2008. Operation and maintenance (O&M) costs are estimated at 3.6% of the investment cost per year. The economic lifetime is put at 25 year (equal to the technical lifetime). For offshore wind, Progress Ratios (PR’s) have been re-ported from as low as approximately 0.9 for offshore wind farms in Europe until 2005 to as high 0.90-1.13 for the second period distinguished from 1991 to 2007 (Isles, 2006; Junginger et al, 2008). Therefore, the PR of offshore wind is estimated at 0.95. Specific investment costs decrease by 5% for each doubling of the cumulative capacity. Based on these data, the specific investment cost may come down as shown in Table 3.3. It turns out that the investment cost may come down to approxi-mately € 2,000/kW or € 2,175/kW around 2050, depending on the scenario.
ECN-E--10-034 19
Table 3.2 Realistic potential of offshore wind in the EU27 region including Norway, Switzerland, and Turkey a Country Unit Potential capacity Unit Potential generation 2008 2010 2020 2030 2040 2050 2008 2010 2020 2030 2040 2050Austria [MWe] [GWh] Belgium & Lux. [MWe] 30 450 1,994 2,625 2,625 [GWh] 8,537Bulgaria [MWe] 1,998 [GWh] 4,463Cyprus [MWe] 2,916 [GWh] 8,046Czech Republic [MWe] [GWh] Denmark [MWe] 398 850 2,329 3,799 15,000 [GWh] 51,087Estonia [MWe] 1,600 1,860 [GWh] 4,839Finland [MWe] 15 590 3,190 4,500 [GWh] 11,826France [MWe] 105 2,510 4,914 30,540 [GWh] 92,255Germany [MWe] 60 10,249 26,553 34,755 [GWh] 125,831Greece [MWe] 4,740 [GWh] 11,062Hungary [MWe] [GWh] Ireland [MWe] 25 25 1,055 3,780 6,600 [GWh] 21,967Italy [MWe] 17,010 [GWh] 35,780Latvia [MWe] 900 1,860 [GWh] 3,910Lithuania [MWe] 1,000 600 [GWh] 1,261Malta [MWe] 60 [GWh] 140Netherlands [MWe] 228 228 4,622 12,122 16,000 [GWh] 58,756Norway [MWe] 957 9,667 486 [GWh] 1,488Poland [MWe] 500 5,300 9,000 [GWh] 26,351Portugal [MWe] 2,400 [GWh] 5,889Romania [MWe] 4,398 [GWh] 11,491Slovenia [MWe] [GWh] Slovakia [MWe] [GWh] Spain [MWe] 7,800 [GWh] 18,802Sweden [MWe] 133 163 2,983 10,522 7,734 [GWh] 20,782Switzerland [MWe] [GWh] Turkey [MWe] 3,000 [GWh] 7,332UK [MWe] 588 1,816 15,303 38,146 35,640 [GWh] 123,487Total EU27+ [MWe] 1,402 3,712 43,092 124,118 211,522 259,500 [GWh] 655,382a The realistic wind potential is the technical potential with exclusion of areas protected for reasons of nature conservation, natural beauty, safety, noise, etc. Source: Beurskens, 2010.

20 ECN-E--10-034
Table 3.3 Technical and economic features of offshore wind in the EU Technical performance Unit Typical ranges Technology Offshore wind Efficiency [%] Not applicable Construction period [month] 18-32; average 24 Technical lifetime [year] 25 Capacity factor [%] 34-46; average 40 Maximum availability [%] 97 Environmental impact Typical ranges GHG emissions [kg/MWh] Not applicable SO2 [g/MWh] Not applicable NOx [g/MWh] Not applicable Particulates [g/MWh] Not applicable Solid waste [g/MWh] Not applicable Costs [€2008] Investment cost including IDC a (2008) [€/kW] 3,000-3,400; average 3,200 Fixed & variable O&M cost [% of inv.] 3.6 Fuel cost [€/MWh] Not applicable Economic lifetime [year] 25 Progress ratio [] 0.95 Data projections 2010 2020 2030 2050 Variant Low Average High Low Average High Low Average High Average Capacity factor [%] 40 40 40 40 40 40 40 40 40 40 Investment cost including IDC a [€/kW] 2,793 2,979 3,165 2,301-
2,328 2,454-2,483
2,607- 2,638
2,030-2,153
2,165-2,296
2,300- 2,440
2,006-2,174
Operation and maintenance [€/MWh] 28.7 30.6 32.5 23.6-23.9
25.2-25.5
26.8- 27.1
20.8-22.1
22.2-23.6
23.6- 25.1
20.6- 22.3
Capacity Europe [GWe] 3.7 3.7 3.7 43.1 43.1 43.1 124.6 124.6 124.6 260.1 Capacity world [GWe] 3.7 3.7 3.7 50.7 50.7 50.7 275.7 275.7 275.7 770 a IDC = Interest during construction.
ECN-E--10-034 21
4. Geothermal power
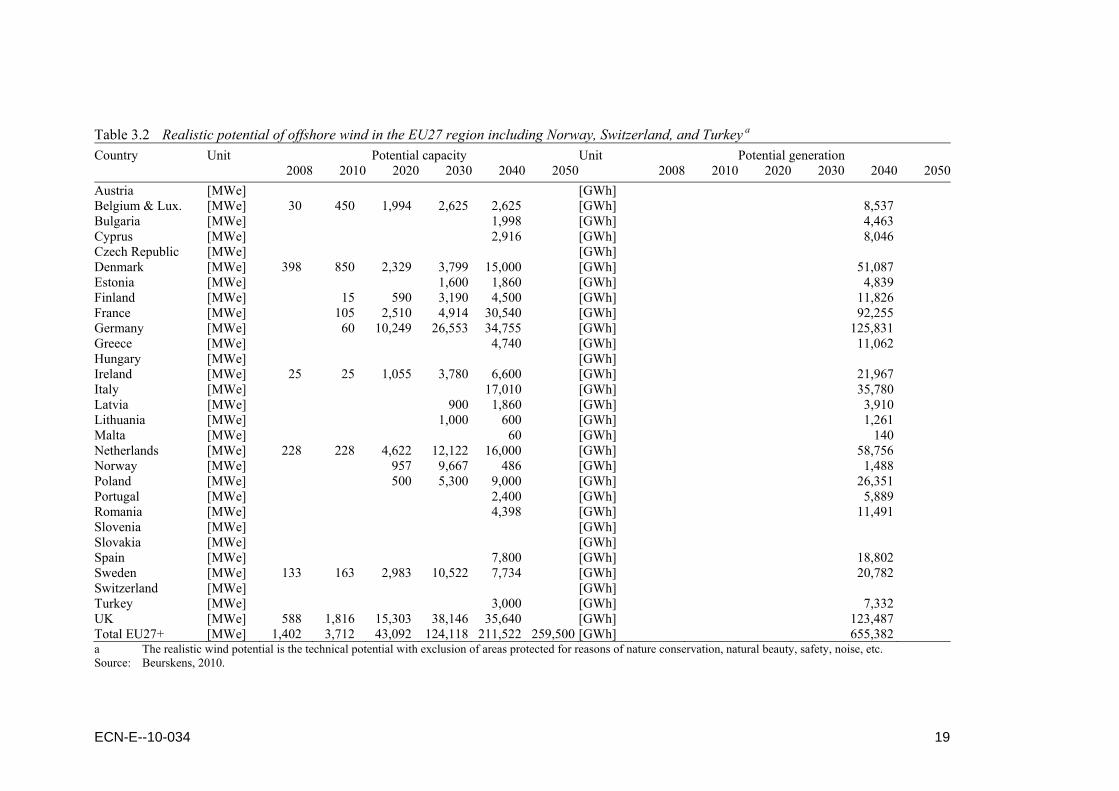
Table 4.1 shows the geothermal capacity in countries around the globe. In 2007, a few EU countries had operational geothermal power plants2: Italy (711 MWe), Austria (0.7 MWe), and Germany (8.4 MWe). In 2007, Iceland had an operational geothermal capacity of 421 MWe, and Turkey 29.5 MWe. However, Iceland is not included in the subset of European countries. According to (Bertani, 2007), Europe’s geothermal capacity amounts to 750 MWe in 2007, and approximately 1,000 MWe in 2010.
Table 4.1 Operational and projected geothermal power generation by country Countries with geothermal power
Operational capacity 2005
Annual energy produced
Operational capacity 2007
Projected capacity 2010
Plant types a (DiPippo, 1999)
[MWe] [GWh/year] [MWe] [MWe] Australia 0.1 0.5 0.1 0.2 B Argentina (0.7) N/A - - B Austria 1.1 3.2 0.7 1 B China 18.9 96 18.9 28 1F, 2F, B Costa Rica 162.5 1,145 162.5 197 1F El Salvador 119 967 189 204 1F, 2F Ethiopia 7.3 0 7.3 7 H Guadeloupe (F) 14.7 102 14.7 35 2F Germany 0.2 1.5 8.4 8 B Guatemala 29 212 49.0 53 2F Iceland 202 1,483 420.9 580 1F, 2F, H Indonesia 838 6,085 991.8 1,192 DS, 1F Italy 699 5,340 711.0 910 DS, 2F, H Japan 530.2 3,467 530.2 535 DS, 1F, 2F Kenya 128.8 1,088 128.8 164 1F Mexico 953.0 6,282 953.0 1,178 1F, 2F, H New Zealand 403 2,774 373.1 590 1F, 2F, H Nicaragua 38 271 52.5 143 1F Papua New Guinea 6 17 56.0 56 N/A Philippines 1,838 9,253 1,855.6 1,991 1F, 2F, H Portugal (Azores) 13 90 23.0 35 1F, H Russia 79 85 79.0 185 1F Thailand 0.3 1.8 0.3 0.3 B Turkey 18 105 29.5 83 1F United States 1,935 17,917 1,935.0 2,817 DS, 1F, 2F, B, HTotal 8,035 56,786 8,590 10,993 a DS = Dry steam, 1F = Single flash, 2F = Double flash, B = Binary, H = Hybrid. Sources: Bertani, 2006-2007; DiPippo, 1999; Lako, 2008 ; Internet Source 24.
2 The installed geothermal capacity at the Azores is not accounted for in the capacity of Europe.
22 ECN-E--10-034
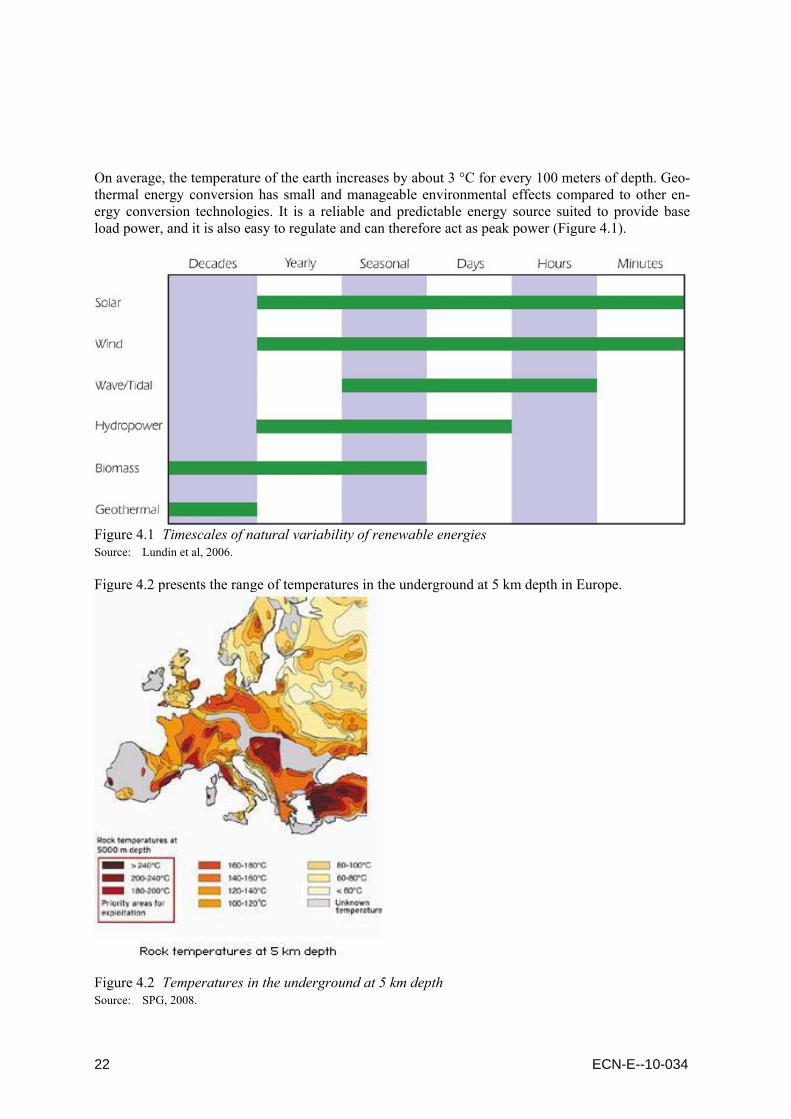
On average, the temperature of the earth increases by about 3 °C for every 100 meters of depth. Geo-thermal energy conversion has small and manageable environmental effects compared to other en-ergy conversion technologies. It is a reliable and predictable energy source suited to provide base load power, and it is also easy to regulate and can therefore act as peak power (Figure 4.1).
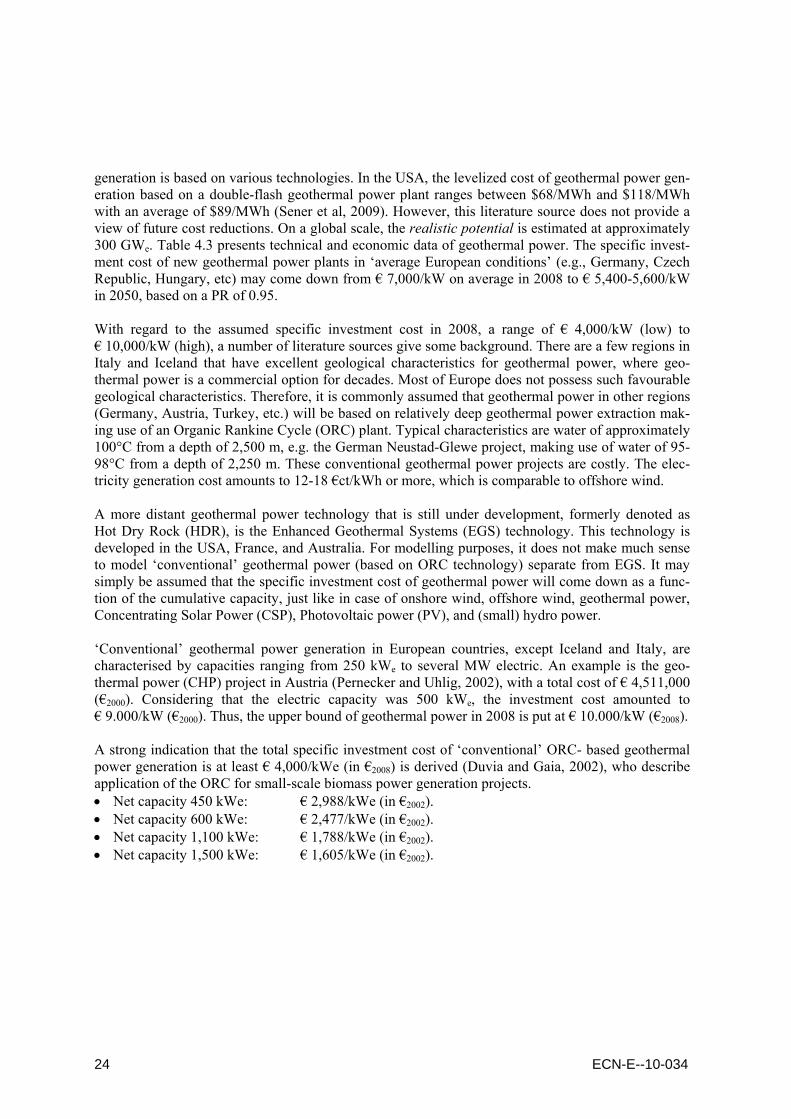
Figure 4.1 Timescales of natural variability of renewable energies Source: Lundin et al, 2006. Figure 4.2 presents the range of temperatures in the underground at 5 km depth in Europe.
Figure 4.2 Temperatures in the underground at 5 km depth Source: SPG, 2008.

ECN-E--10-034 23
Table 4.2 presents data of geothermal power and the potential thereof for European countries, based on (Gawell et al, 1999; Lundin, 2008; Bertani, 2006-2007; Gawell and Greenberg, 2007; BP, 2009). According to Lundin et al (2008), the geothermal capacity of Europe, excluding Croatia, could amount to 1,600 MWe in 2010. The difference between the potentials presented in Tables 4.1 and 4.2 for 2010 is explained by a higher growth of geothermal power in Turkey assumed by Lundin et al. With regard to the realistic potential of geothermal power, Lundin et al (2008) present only scarce data: 380 MWe for Croatia, 3,400 MWe for the Czech Republic, and 500-2,000 MWe for Turkey.
Table 4.2 Geothermal capacity, generation, and potential by European country Country Capacity Generation Capacity Generation Potential 2005 (2008) 2005 2010 (proj.) 2010 (proj.) Technical Realistic
[MWe] [GWh] [MWe] [GWh] a [MWe] [MWe] Austria 1.1 (1.2) 3.2 6 15 Belgium Bulgaria 200 Croatia 4.4 34.3 380 Czech Republic 3,400 Cyprus Denmark Estonia Finland France b 14.7 (16.0) 102 33 231 Germany 0.23 (6.6) 1.5 8.4 60 35,500 c 1,600 Greece 20 140 900 Hungary 80 600 800 Italy 699 (711) 5,340 910 6,190 2,000 Latvia Lithuania Luxembourg Malta Netherlands Portugal b 13 (23) 90 35 275 Poland 300 Romania 200 Slovakia 6 40 200 Slovenia Spain Sweden Switzerland Turkey 18 (83) 105 500 3,500 31,500 1,400 UK Total d 746 (841) 5,642 ~ 1,600 ~ 11,000 a Figures in italics have been calculated by assuming 7,000 full load hours. b France includes Guadeloupe, and Portugal refers to the Azores. c Based on a technical potential of 280 TWh/a (TAB, 2003). d Excluding Croatia. Sources: Gawell et al, 1999; TAB, 2003; Lundin, 2008; Bertani, 2006-2007; Gawell and Greenberg, 2007; BP, 2009. In Europe, geothermal power is assumed to have a realistic potential of 16,700 MWe in 2050, which is 13 times the current installed capacity and 50% more than the realistic potential of the European countries of which potentials have been estimated in Table 4.2. Today, there are hardly any studies that give clues about the experience curve for geothermal power. This is because geothermal power
24 ECN-E--10-034
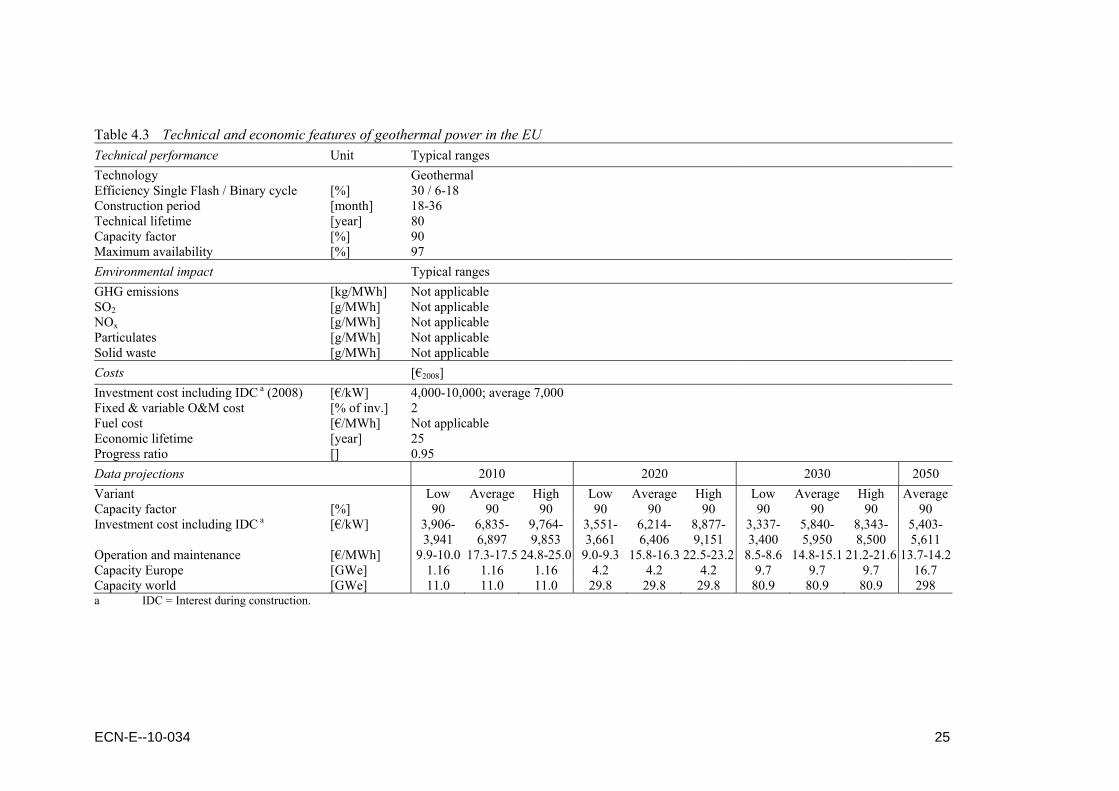
generation is based on various technologies. In the USA, the levelized cost of geothermal power gen-eration based on a double-flash geothermal power plant ranges between $68/MWh and $118/MWh with an average of $89/MWh (Sener et al, 2009). However, this literature source does not provide a view of future cost reductions. On a global scale, the realistic potential is estimated at approximately 300 GWe. Table 4.3 presents technical and economic data of geothermal power. The specific invest-ment cost of new geothermal power plants in ‘average European conditions’ (e.g., Germany, Czech Republic, Hungary, etc) may come down from € 7,000/kW on average in 2008 to € 5,400-5,600/kW in 2050, based on a PR of 0.95. With regard to the assumed specific investment cost in 2008, a range of € 4,000/kW (low) to € 10,000/kW (high), a number of literature sources give some background. There are a few regions in Italy and Iceland that have excellent geological characteristics for geothermal power, where geo-thermal power is a commercial option for decades. Most of Europe does not possess such favourable geological characteristics. Therefore, it is commonly assumed that geothermal power in other regions (Germany, Austria, Turkey, etc.) will be based on relatively deep geothermal power extraction mak-ing use of an Organic Rankine Cycle (ORC) plant. Typical characteristics are water of approximately 100°C from a depth of 2,500 m, e.g. the German Neustad-Glewe project, making use of water of 95-98°C from a depth of 2,250 m. These conventional geothermal power projects are costly. The elec-tricity generation cost amounts to 12-18 €ct/kWh or more, which is comparable to offshore wind. A more distant geothermal power technology that is still under development, formerly denoted as Hot Dry Rock (HDR), is the Enhanced Geothermal Systems (EGS) technology. This technology is developed in the USA, France, and Australia. For modelling purposes, it does not make much sense to model ‘conventional’ geothermal power (based on ORC technology) separate from EGS. It may simply be assumed that the specific investment cost of geothermal power will come down as a func-tion of the cumulative capacity, just like in case of onshore wind, offshore wind, geothermal power, Concentrating Solar Power (CSP), Photovoltaic power (PV), and (small) hydro power. ‘Conventional’ geothermal power generation in European countries, except Iceland and Italy, are characterised by capacities ranging from 250 kWe to several MW electric. An example is the geo-thermal power (CHP) project in Austria (Pernecker and Uhlig, 2002), with a total cost of € 4,511,000 (€2000). Considering that the electric capacity was 500 kWe, the investment cost amounted to € 9.000/kW (€2000). Thus, the upper bound of geothermal power in 2008 is put at € 10.000/kW (€2008). A strong indication that the total specific investment cost of ‘conventional’ ORC- based geothermal power generation is at least € 4,000/kWe (in €2008) is derived (Duvia and Gaia, 2002), who describe application of the ORC for small-scale biomass power generation projects. • Net capacity 450 kWe: € 2,988/kWe (in €2002). • Net capacity 600 kWe: € 2,477/kWe (in €2002). • Net capacity 1,100 kWe: € 1,788/kWe (in €2002). • Net capacity 1,500 kWe: € 1,605/kWe (in €2002).
ECN-E--10-034 25
Table 4.3 Technical and economic features of geothermal power in the EU Technical performance Unit Typical ranges Technology Geothermal Efficiency Single Flash / Binary cycle [%] 30 / 6-18 Construction period [month] 18-36 Technical lifetime [year] 80 Capacity factor [%] 90 Maximum availability [%] 97 Environmental impact Typical ranges GHG emissions [kg/MWh] Not applicable SO2 [g/MWh] Not applicable NOx [g/MWh] Not applicable Particulates [g/MWh] Not applicable Solid waste [g/MWh] Not applicable Costs [€2008] Investment cost including IDC a (2008) [€/kW] 4,000-10,000; average 7,000 Fixed & variable O&M cost [% of inv.] 2 Fuel cost [€/MWh] Not applicable Economic lifetime [year] 25 Progress ratio [] 0.95 Data projections 2010 2020 2030 2050 Variant Low Average High Low Average High Low Average High AverageCapacity factor [%] 90 90 90 90 90 90 90 90 90 90 Investment cost including IDC a [€/kW] 3,906-
3,941 6,835-6,897
9,764-9,853
3,551-3,661
6,214-6,406
8,877-9,151
3,337-3,400
5,840-5,950
8,343-8,500
5,403-5,611
Operation and maintenance [€/MWh] 9.9-10.0 17.3-17.5 24.8-25.0 9.0-9.3 15.8-16.3 22.5-23.2 8.5-8.6 14.8-15.1 21.2-21.6 13.7-14.2Capacity Europe [GWe] 1.16 1.16 1.16 4.2 4.2 4.2 9.7 9.7 9.7 16.7 Capacity world [GWe] 11.0 11.0 11.0 29.8 29.8 29.8 80.9 80.9 80.9 298 a IDC = Interest during construction.
26 ECN-E--10-034
5. Concentrating Solar Power
5.1 Introduction Concentrating solar power (CSP) plants are categorised according to whether the solar flux is con-centrated by parabolic trough-shaped mirror reflectors (30-100 suns concentration3), central tower receivers requiring numerous heliostats (500-1000 suns), or parabolic dish-shaped reflectors (1000-10,000 suns). The receivers transfer the solar heat to a working fluid, which, in turn, transfers it to a thermal power-conversion system based on Rankine, Brayton, combined or Stirling cycles. To give a secure and reliable supply with capacity factors at around 50% rising to 70% by 20204, solar inter-mittency problems can be overcome by using supplementary energy from, e.g. natural gas based Combined Cycle systems as well as by storing surplus heat (IPCC, 2007). Solar thermal power-generating plants are best sited at lower latitudes in areas receiving high levels of direct insolation. In these areas, 1 km2 of land is enough to generate around 125 GWh/year from a 50 MWe plant at 10% conversion of solar energy to electricity. Thus about 1% of the world’s desert areas (240,000 km2), if linked to demand centres by High Voltage Direct Current (HVDC) cables, could, in theory, be sufficient to meet total global electricity demand as forecast out to 2030. By 2008, the global capacity of CSP stood at approximately 0.5 GWe (REN21, 2009).The technical po-tential of CSP appears to range from 630 GWe by 2040 up to 4,700 GWe by 2030 (IPCC, 2007). In the following an estimate will be presented of the realistic potential of Europe and North Africa5. The most mature of CSP technologies is solar troughs with a maximum (peak) efficiency of 21% (conversion of direct solar radiation into electricity). CSP tower technology has been successfully demonstrated by two 10 MWe systems in the USA. Advanced technologies include troughs with di-rect steam generation, Fresnel collectors that may reduce costs by 20%, energy storage including molten salt, integrated combined-cycle systems and advanced Stirling dishes. CSP is usually based on mirrors. Alternatively, Fresnel lenses are used for power generation. Also, mirror-based systems or Fresnel-lens systems may be integrated into a natural gas-fired combined cycle (CC) power plant, resulting in a hybrid solar/natural gas-based power plant.
5.2 Mirror-based systems There are three types of mirror-based concentrated solar power plants: • Parabolic trough. • Solar tower. • Solar dish. Parabolic trough technology is a proven type of mirror-based systems. A parabolic trough is a solar concentrator that follows or tracks the sun around a single rotational axis. Sunlight is reflected from
3 The term ‘suns concentration’ refers to the concentration factor compared to normal sunlight. 4 Integration of CSP in, e.g., a combined cycle (CC) based on natural gas may increase the capacity factor to 70% in 2020,
which is equivalent to approximately 6,100 full-load hours. 5 The realistic potential is the technical potential with exclusion of areas protected for reasons of nature conservation,
natural beauty, safety, noise, etc.
ECN-E--10-034 27
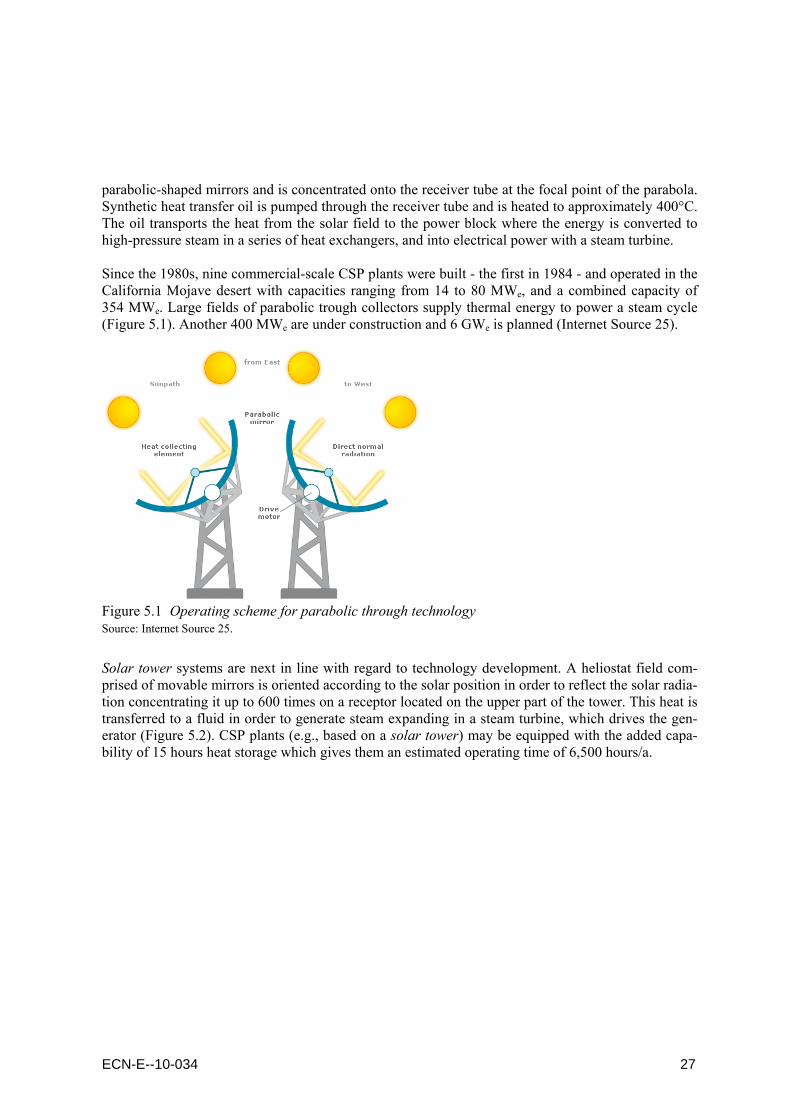
parabolic-shaped mirrors and is concentrated onto the receiver tube at the focal point of the parabola. Synthetic heat transfer oil is pumped through the receiver tube and is heated to approximately 400°C. The oil transports the heat from the solar field to the power block where the energy is converted to high-pressure steam in a series of heat exchangers, and into electrical power with a steam turbine. Since the 1980s, nine commercial-scale CSP plants were built - the first in 1984 - and operated in the California Mojave desert with capacities ranging from 14 to 80 MWe, and a combined capacity of 354 MWe. Large fields of parabolic trough collectors supply thermal energy to power a steam cycle (Figure 5.1). Another 400 MWe are under construction and 6 GWe is planned (Internet Source 25).
Figure 5.1 Operating scheme for parabolic through technology Source: Internet Source 25.
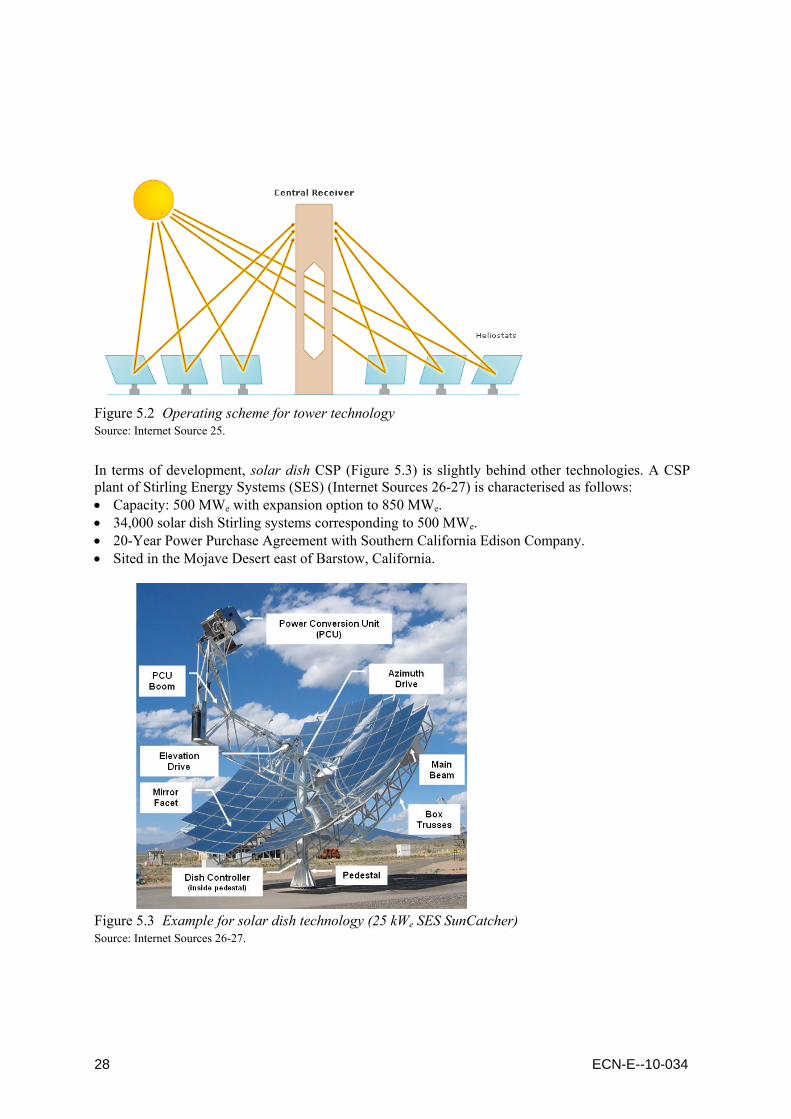
Solar tower systems are next in line with regard to technology development. A heliostat field com-prised of movable mirrors is oriented according to the solar position in order to reflect the solar radia-tion concentrating it up to 600 times on a receptor located on the upper part of the tower. This heat is transferred to a fluid in order to generate steam expanding in a steam turbine, which drives the gen-erator (Figure 5.2). CSP plants (e.g., based on a solar tower) may be equipped with the added capa-bility of 15 hours heat storage which gives them an estimated operating time of 6,500 hours/a.
28 ECN-E--10-034
Figure 5.2 Operating scheme for tower technology Source: Internet Source 25.
In terms of development, solar dish CSP (Figure 5.3) is slightly behind other technologies. A CSP plant of Stirling Energy Systems (SES) (Internet Sources 26-27) is characterised as follows: • Capacity: 500 MWe with expansion option to 850 MWe. • 34,000 solar dish Stirling systems corresponding to 500 MWe. • 20-Year Power Purchase Agreement with Southern California Edison Company. • Sited in the Mojave Desert east of Barstow, California.
Figure 5.3 Example for solar dish technology (25 kWe SES SunCatcher) Source: Internet Sources 26-27.
ECN-E--10-034 29
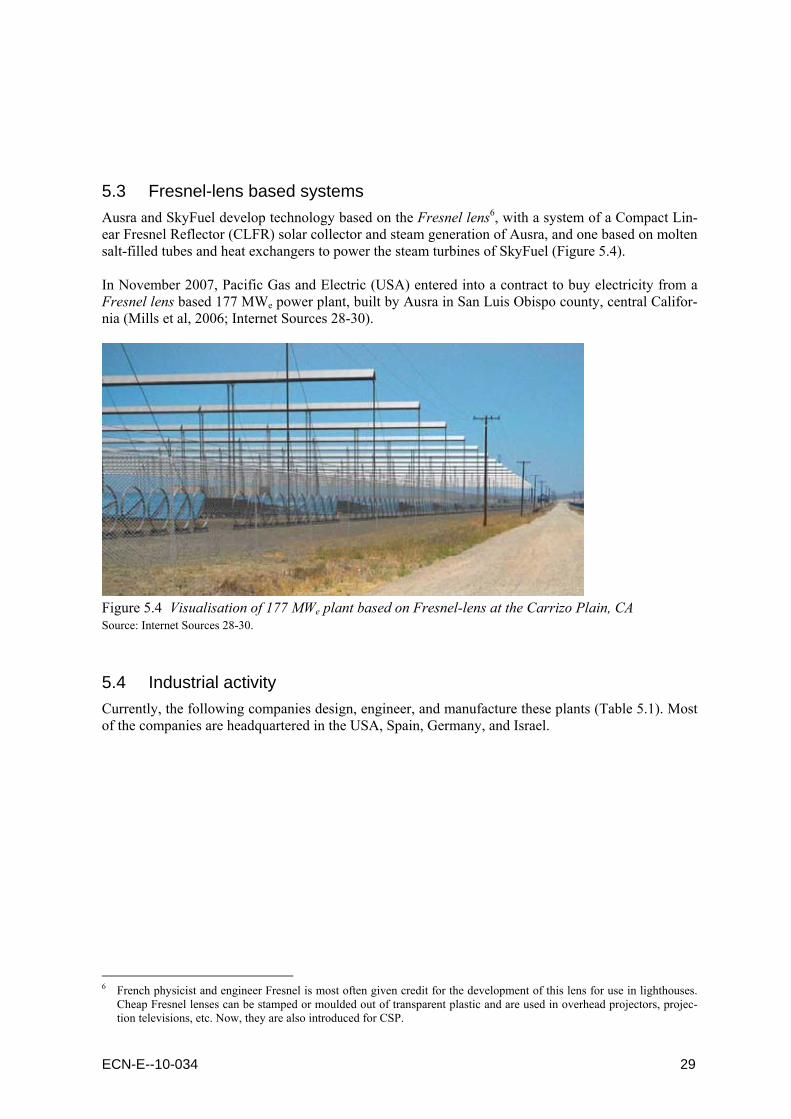
5.3 Fresnel-lens based systems Ausra and SkyFuel develop technology based on the Fresnel lens6, with a system of a Compact Lin-ear Fresnel Reflector (CLFR) solar collector and steam generation of Ausra, and one based on molten salt-filled tubes and heat exchangers to power the steam turbines of SkyFuel (Figure 5.4). In November 2007, Pacific Gas and Electric (USA) entered into a contract to buy electricity from a Fresnel lens based 177 MWe power plant, built by Ausra in San Luis Obispo county, central Califor-nia (Mills et al, 2006; Internet Sources 28-30).
Figure 5.4 Visualisation of 177 MWe plant based on Fresnel-lens at the Carrizo Plain, CA Source: Internet Sources 28-30.
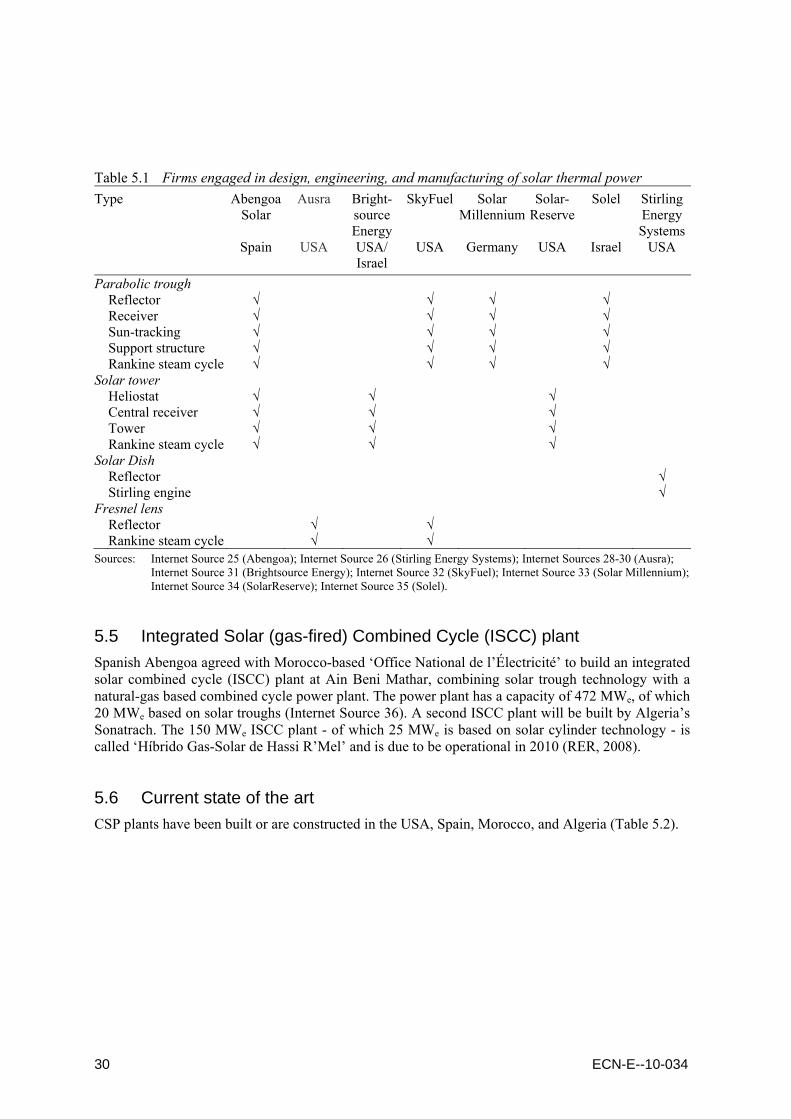
5.4 Industrial activity Currently, the following companies design, engineer, and manufacture these plants (Table 5.1). Most of the companies are headquartered in the USA, Spain, Germany, and Israel.
6 French physicist and engineer Fresnel is most often given credit for the development of this lens for use in lighthouses.
Cheap Fresnel lenses can be stamped or moulded out of transparent plastic and are used in overhead projectors, projec-tion televisions, etc. Now, they are also introduced for CSP.
30 ECN-E--10-034
Table 5.1 Firms engaged in design, engineering, and manufacturing of solar thermal power Type Abengoa
Solar Ausra Bright-
source Energy
SkyFuel Solar Millennium
Solar-Reserve
Solel Stirling Energy Systems
Spain USA USA/ Israel
USA Germany USA Israel USA
Parabolic trough Reflector √ √ √ √ Receiver √ √ √ √ Sun-tracking √ √ √ √ Support structure √ √ √ √ Rankine steam cycle √ √ √ √ Solar tower Heliostat √ √ √ Central receiver √ √ √ Tower √ √ √ Rankine steam cycle √ √ √ Solar Dish Reflector √ Stirling engine √ Fresnel lens Reflector √ √ Rankine steam cycle √ √ Sources: Internet Source 25 (Abengoa); Internet Source 26 (Stirling Energy Systems); Internet Sources 28-30 (Ausra);
Internet Source 31 (Brightsource Energy); Internet Source 32 (SkyFuel); Internet Source 33 (Solar Millennium); Internet Source 34 (SolarReserve); Internet Source 35 (Solel).
5.5 Integrated Solar (gas-fired) Combined Cycle (ISCC) plant Spanish Abengoa agreed with Morocco-based ‘Office National de l’Électricité’ to build an integrated solar combined cycle (ISCC) plant at Ain Beni Mathar, combining solar trough technology with a natural-gas based combined cycle power plant. The power plant has a capacity of 472 MWe, of which 20 MWe based on solar troughs (Internet Source 36). A second ISCC plant will be built by Algeria’s Sonatrach. The 150 MWe ISCC plant - of which 25 MWe is based on solar cylinder technology - is called ‘Híbrido Gas-Solar de Hassi R’Mel’ and is due to be operational in 2010 (RER, 2008).
5.6 Current state of the art CSP plants have been built or are constructed in the USA, Spain, Morocco, and Algeria (Table 5.2).
ECN-E--10-034 31
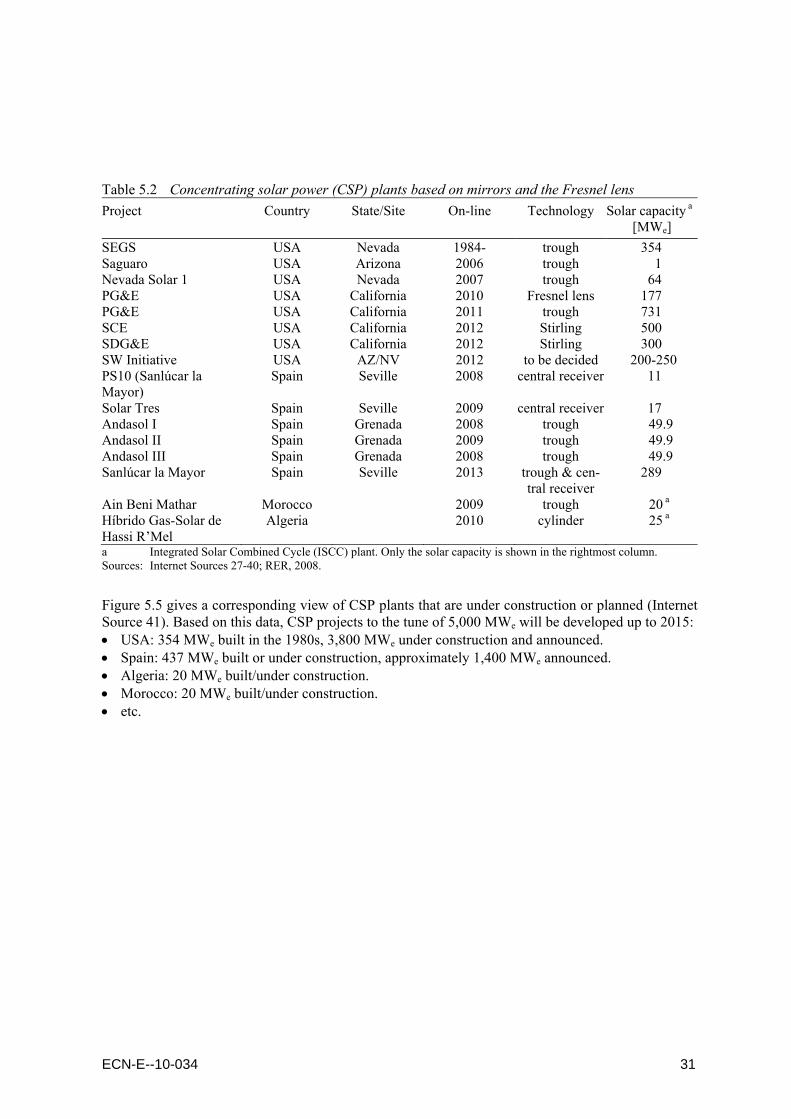
Table 5.2 Concentrating solar power (CSP) plants based on mirrors and the Fresnel lens Project Country State/Site On-line Technology Solar capacity a
[MWe] SEGS USA Nevada 1984- trough 354 Saguaro USA Arizona 2006 trough 1 Nevada Solar 1 USA Nevada 2007 trough 64 PG&E USA California 2010 Fresnel lens 177 PG&E USA California 2011 trough 731 SCE USA California 2012 Stirling 500 SDG&E USA California 2012 Stirling 300 SW Initiative USA AZ/NV 2012 to be decided 200-250 PS10 (Sanlúcar la Mayor)
Spain Seville 2008 central receiver 11
Solar Tres Spain Seville 2009 central receiver 17 Andasol I Spain Grenada 2008 trough 49.9 Andasol II Spain Grenada 2009 trough 49.9 Andasol III Spain Grenada 2008 trough 49.9 Sanlúcar la Mayor Spain Seville 2013 trough & cen-
tral receiver 289
Ain Beni Mathar Morocco 2009 trough 20 a Híbrido Gas-Solar de Hassi R’Mel
Algeria 2010 cylinder 25 a
a Integrated Solar Combined Cycle (ISCC) plant. Only the solar capacity is shown in the rightmost column. Sources: Internet Sources 27-40; RER, 2008.
Figure 5.5 gives a corresponding view of CSP plants that are under construction or planned (Internet Source 41). Based on this data, CSP projects to the tune of 5,000 MWe will be developed up to 2015: • USA: 354 MWe built in the 1980s, 3,800 MWe under construction and announced. • Spain: 437 MWe built or under construction, approximately 1,400 MWe announced. • Algeria: 20 MWe built/under construction. • Morocco: 20 MWe built/under construction. • etc.

32 ECN-E--10-034
Figure 5.5 Concentrating solar power (CSP) projects under construction or planned Source: Internet Source 41.
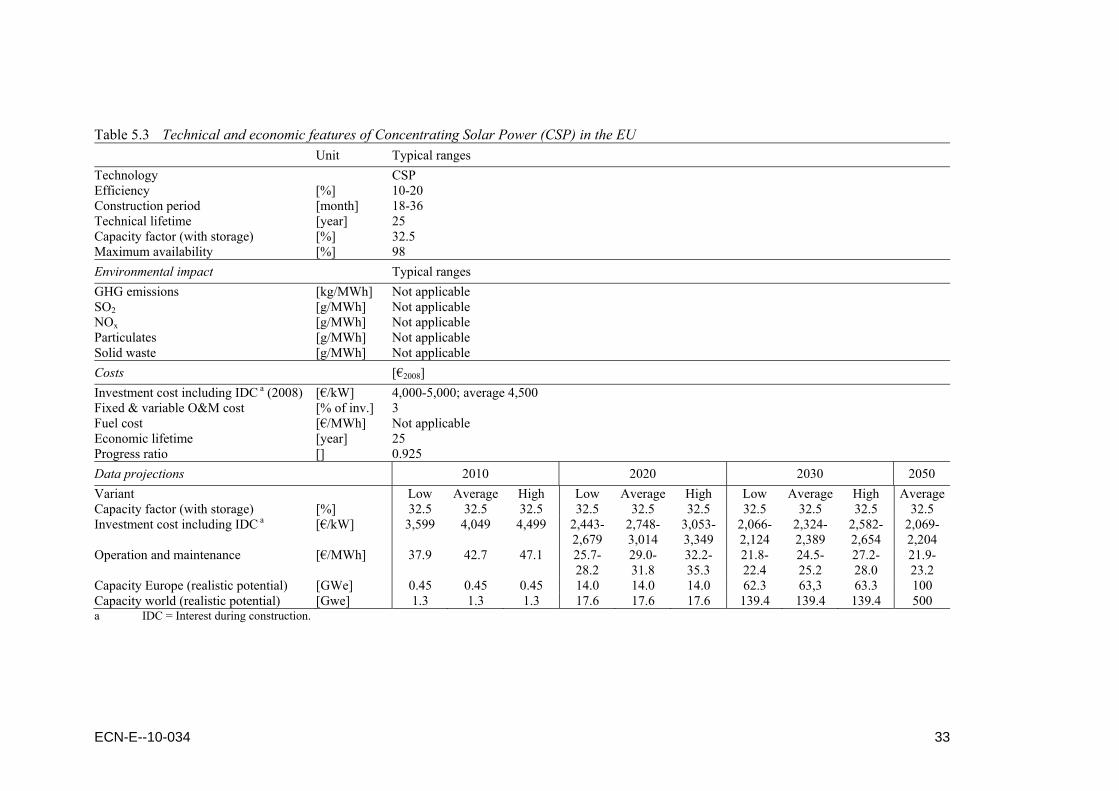
5.7 Main technical and economic data for southern Europe The specific investment cost of CSP with thermal storage (see below) is estimated at € 4,000-5,000 per kW for southern Europe (Spain, Portugal, Italy, and Greece), based on (Schott, 2009). Thermal storage based on molten salt may provide for a few hours of additional operation and a load factor of 32.5% (Kelly, 2008; Internet Source 42). Extension of the operation of a CSP plant with thermal storage comes at a price. In the following, also a CSP plant without thermal storage is described that is assumed to be representative of North Africa. The operation and maintenance (O&M) cost is put at 3% of the specific investment cost per year. Table 5.3 shows the outlook for CSP with respect to po-tential and cost. The realistic potential of CSP in southern Europe (Spain, Portugal, Italy, and Greece) is estimated at 100 GWe. This potential is based on publications on CSP in North Africa for export to Europe, viz. (Desertec, 2009; Trieb et al, 2009; Richter et al, 2008). These literature sources put the realistic global potential at 28 GWe in 2020, 140 GWe in 2030, and 500 GWe in 2050. Richter et al (2008) present the following data for the realistic potential of Europe: 4 GWe (11 TWh/a) in 2012, 30 GWe (85 TWh/a) in 2020, and 60 GWe (170 TWh/a) in 2030 (Table 5.3). For Concentrating Solar Power, Progress Ratios may vary between as low as 0.80-0.85 and as high as 0.90-0.95, based on (Junginger et al, 2008) and (Younger, 2008). However, Younger (2008) cautions for too optimistic views on cost reductions. Therefore, the investment cost is based on these scenarios and a progress ratio of 0.925. Table 5.3 shows that the investment cost of CSP with a limited thermal storage may come down from € 4,000-5,000/kW (€2008) in 2008, to € 2,070/kW or € 2,200/kW in 2050, depending on the sce-nario.
ECN-E--10-034 33
Table 5.3 Technical and economic features of Concentrating Solar Power (CSP) in the EU Unit Typical ranges Technology CSP Efficiency [%] 10-20 Construction period [month] 18-36 Technical lifetime [year] 25 Capacity factor (with storage) [%] 32.5 Maximum availability [%] 98 Environmental impact Typical ranges GHG emissions [kg/MWh] Not applicable SO2 [g/MWh] Not applicable NOx [g/MWh] Not applicable Particulates [g/MWh] Not applicable Solid waste [g/MWh] Not applicable Costs [€2008] Investment cost including IDC a (2008) [€/kW] 4,000-5,000; average 4,500 Fixed & variable O&M cost [% of inv.] 3 Fuel cost [€/MWh] Not applicable Economic lifetime [year] 25 Progress ratio [] 0.925 Data projections 2010 2020 2030 2050 Variant Low Average High Low Average High Low Average High AverageCapacity factor (with storage) [%] 32.5 32.5 32.5 32.5 32.5 32.5 32.5 32.5 32.5 32.5 Investment cost including IDC a [€/kW] 3,599 4,049 4,499 2,443-
2,679 2,748-3,014
3,053-3,349
2,066-2,124
2,324-2,389
2,582-2,654
2,069-2,204
Operation and maintenance [€/MWh] 37.9 42.7 47.1 25.7- 28.2
29.0- 31.8
32.2- 35.3
21.8- 22.4
24.5- 25.2
27.2- 28.0
21.9- 23.2
Capacity Europe (realistic potential) [GWe] 0.45 0.45 0.45 14.0 14.0 14.0 62.3 63,3 63.3 100 Capacity world (realistic potential) [Gwe] 1.3 1.3 1.3 17.6 17.6 17.6 139.4 139.4 139.4 500 a IDC = Interest during construction.
34 ECN-E--10-034
5.8 Main technical and economic data for North Africa Some assumptions with regard to the development of CSP in southern Europe (Spain, Portugal, Italy, and Greece) may also be applied to North Africa. The main difference between these regions is the more abundant solar resource of North Africa. It is assumed that the same capacity factor of 32.5% that was used for southern Europe with limited thermal storage may be used for North Africa without thermal storage. The investment cost of CSP, representative of North Africa, is assumed to vary from € 3,750/kW to € 4,250/kW - average € 4,000/kW - in 2010. The CSP potential of North Africa is conservatively estimated at 1.5 GWe in 2020, 23.1 GWe in 2030 and 100 GWe in 2050. Table 5.4 shows that the investment cost of CSP without storage may decline from € 3,750-4,250/kW (€2008) in 2010 to € 1,680/kW in 2050, but the aforementioned figure of € 2,070/kW or € 2,200/kW appears to be more representative, as the current capacity (45 MWe) in North Africa is almost negligible.

ECN-E--10-034 35
Table 5.4 Technical and economic features of Concentrating Solar Power (CSP) in North Africa Technical performance Unit Typical ranges Technology CSP Efficiency [%] 10-20 Construction period [month] 18-36 Technical lifetime [year] 25 Capacity factor (without storage) [%] 32.5 Maximum availability [%] 98 Environmental impact Typical ranges GHG emissions [kg/MWh] Not applicable SO2 [g/MWh] Not applicable NOx [g/MWh] Not applicable Particulates [g/MWh] Not applicable Solid waste [g/MWh] Not applicable Costs [€2008] Investment cost including IDC a (2010) [€/kW] 3,750-4,250; average 4,000 Fixed & variable O&M cost [% of inv.] 3 Fuel cost [€/MWh] Not applicable Economic lifetime [year] 25 Progress ratio [] 0.925 Data projections 2010 2020 2030 2050 Variant Low Average High Low Average High Low Average High AverageCapacity factor (without storage) [%] 32.5 32.5 32.5 32.5 32.5 32.5 32.5 32.5 32.5 32.5 Investment cost including IDC a [€/kW] 3,750 4,000 4,250 2,512 2,679 2,846 1,859 1,983 2,107 1,681 Operation and maintenance [€/MWh] 39.5 42.1 44.8 26.5 28.2 30.0 19.6 20.9 22.2 17.7 Capacity North Africa [Gwe] 0.05 0.05 0.05 1.5 1.5 1.5 23.1 23.1 23.1 100 Capacity world (realistic potential) [Gwe] 1.3 1.3 1.3 17.6 17.6 17.6 139.4 139.4 139.4 500 a IDC = Interest during construction.

36 ECN-E--10-034
6. Photovoltaic power
6.1 Introduction Photovoltaic (PV) systems consist of modules (based on PV cells) and the ‘Balance of System’ (BOS). The evolution of PV modules has paralleled the successes of PV cells. ‘Module’ is the term used to identify a grouping of interconnected PV cells into an enclosed, environmentally sealed package. Modules utilise a transparent front material, a cell and cell encapsulant, and a back cover material. Current PV cells, modules, and systems are considerably improved com-pared to some years ago, witnessed by increased efficiency and reduced replacement of, e.g., inverters (Internet Source 43). Photovoltaic solar energy is estimated to have a technical potential of at least 450,000 TWh/year, equivalent to 16,000 EJ/year (IPCC, 2007). However, realising this potential will be limited by land, energy-storage, and investment constraints. In 2008, global capacity of photo-voltaic power (PV) stood at 14.73 GWe (9.16 GWe in 2007) (EPIA, 2009). On a global scale, photovoltaic power exhibits a growth rate of its cumulative installed capacity of 30-50% per year. Due to the global recession, growth in 2009 will be much lower (expectedly 17%) than in 2008 (60%). DuPont anticipates that the PV market will (continue to) grow by double digits over the next several years, driving demand for existing and new materials that are more cost effective (Internet Source 44). Decentralised generation by solar PV is already economically feasible for villages with long distances to a distribution grid and where providing basic light-ing, radio, and PC is socially desirable. Annual capacity addition increased from approximately 2,400 MWe in 2007 to 5,600 MWe in 2008, and for 2009 an addition of 5,000-6,800 MWe for the cumulative PV capacity is expected (EPIA, 2009).Germany and Spain are among the world market leaders, together with Japan, the USA, South Korea and other countries (see Figure 6.2). Most commercial PV modules are based on crystalline silicon cells. Mono-crystalline modules show efficiencies of up to (nearly) 20% efficiency, and had a share of 33% in the world market in 2007. Multicrystalline modules, with efficiencies of up to 15%, are cheaper per Wp (peak Watt) and had a 56% market share in 2007. Cost reductions will continue, partly depending on the future world price for silicon; efficiency improvements for PV cells as a result of R&D; mass production; and learning through project experience - see, e.g. Lensink et al. (2009). Thinner cell materials have potential for cost reduction, including thin-film Si cells, thin-film copper indium di-selenide cells, cadmium telluride cells, photoelectrochemical cells, and poly-mer cells. Commercial modules based on thin-film cells have efficiencies up to 12%. Concen-trating PV modules based on multilayer cells have efficiencies up to 25% today, but their costs are still relatively high. Work to reduce the cost of manufacturing, using low-cost polymer ma-terials, and developing new materials such as quantum dots and nano-structures, could allow the solar resource to be more fully exploited. Combining solar thermal and PV power generation systems into one unit has good potential as using the heat produced from cooling the PV cells would make more effective use of the surface (roofs) of houses and buildings. PV technology and applications are characterised by their modularity: they can be implemented on virtually any scale and size. The overall (AC) effi-ciency of PV systems is approximately 5-15%, depending on the module type used. The ex-pected life span is 20-30 years. Solar modules are the most durable part of the system, with fail-ure rates of only once in 10,000 per year. Inverters still have a shorter lifetime (10-15 yrs), but the industry strives to equal the lifetimes of modules and inverters.
ECN-E--10-034 37
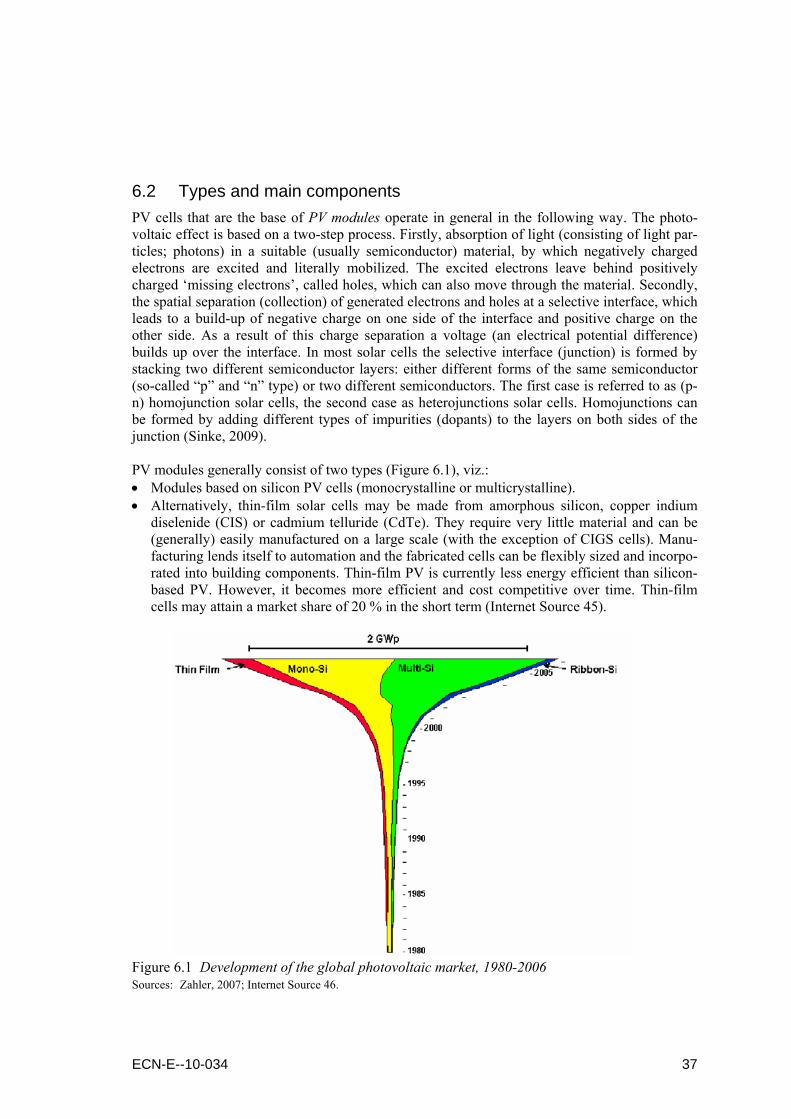
6.2 Types and main components PV cells that are the base of PV modules operate in general in the following way. The photo-voltaic effect is based on a two-step process. Firstly, absorption of light (consisting of light par-ticles; photons) in a suitable (usually semiconductor) material, by which negatively charged electrons are excited and literally mobilized. The excited electrons leave behind positively charged ‘missing electrons’, called holes, which can also move through the material. Secondly, the spatial separation (collection) of generated electrons and holes at a selective interface, which leads to a build-up of negative charge on one side of the interface and positive charge on the other side. As a result of this charge separation a voltage (an electrical potential difference) builds up over the interface. In most solar cells the selective interface (junction) is formed by stacking two different semiconductor layers: either different forms of the same semiconductor (so-called “p” and “n” type) or two different semiconductors. The first case is referred to as (p-n) homojunction solar cells, the second case as heterojunctions solar cells. Homojunctions can be formed by adding different types of impurities (dopants) to the layers on both sides of the junction (Sinke, 2009). PV modules generally consist of two types (Figure 6.1), viz.: • Modules based on silicon PV cells (monocrystalline or multicrystalline). • Alternatively, thin-film solar cells may be made from amorphous silicon, copper indium
diselenide (CIS) or cadmium telluride (CdTe). They require very little material and can be (generally) easily manufactured on a large scale (with the exception of CIGS cells). Manu-facturing lends itself to automation and the fabricated cells can be flexibly sized and incorpo-rated into building components. Thin-film PV is currently less energy efficient than silicon-based PV. However, it becomes more efficient and cost competitive over time. Thin-film cells may attain a market share of 20 % in the short term (Internet Source 45).
Figure 6.1 Development of the global photovoltaic market, 1980-2006 Sources: Zahler, 2007; Internet Source 46.
38 ECN-E--10-034
The Balance-of-System - equipment other than the actual PV modules - consists of: • Inverter (power conditioning unit). • Electrical Wiring. • Structure. • Foundation (including tracking systems, if applicable). • Electrical Interconnection & Metering. • Etc.
6.3 Markets of different PV technologies and applications Crystalline silicon is by far the most common solar cell material, because: • It is used for more than 50 years, and its manufacturing processes are well known. • The raw material silicon is very abundant - the second most abundant element in the Earth’s
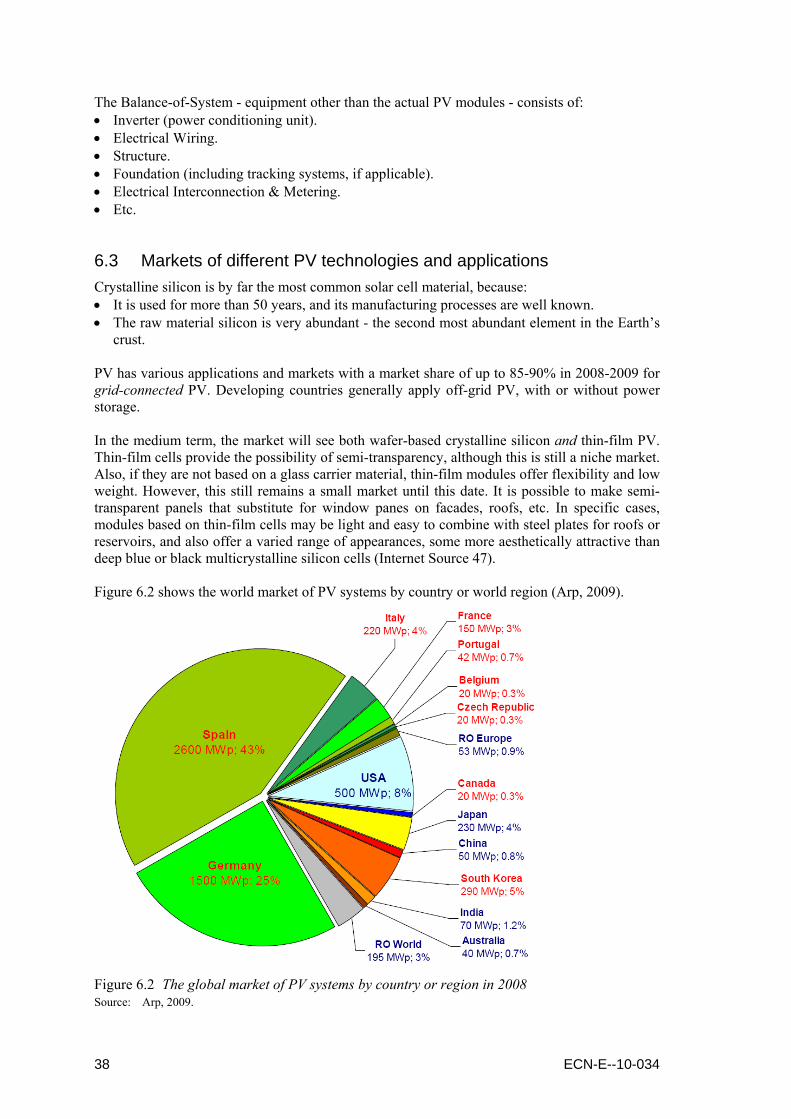
crust. PV has various applications and markets with a market share of up to 85-90% in 2008-2009 for grid-connected PV. Developing countries generally apply off-grid PV, with or without power storage. In the medium term, the market will see both wafer-based crystalline silicon and thin-film PV. Thin-film cells provide the possibility of semi-transparency, although this is still a niche market. Also, if they are not based on a glass carrier material, thin-film modules offer flexibility and low weight. However, this still remains a small market until this date. It is possible to make semi-transparent panels that substitute for window panes on facades, roofs, etc. In specific cases, modules based on thin-film cells may be light and easy to combine with steel plates for roofs or reservoirs, and also offer a varied range of appearances, some more aesthetically attractive than deep blue or black multicrystalline silicon cells (Internet Source 47). Figure 6.2 shows the world market of PV systems by country or world region (Arp, 2009).
Figure 6.2 The global market of PV systems by country or region in 2008 Source: Arp, 2009.
ECN-E--10-034 39
The WorldWatch Institute states that China is emerging as a dynamic solar manufacturing in-dustry. India shows a relatively fast transition, too. In January 2008, PV Technologies India Ltd - parent company Moser Baer India Ltd - signed a Memorandum of Understanding (MoU) with a leading global equipment supplier to secure supply of critical equipment for a phased expan-sion of its thin-film PV modules manufacturing capacity amounting to 565 MWe (Internet Source 48). Together with its current production capacity of 40 MWe, the modules production capacity will be over 600 MWe by 2010. Thin-film solar modules have large emerging applica-tions and a robust demand.
6.4 Main technical and economic data PV systems experience not only high growth rates on a global scale, but also substantial cost reductions. These are interrelated through the learning rate. The progress ratio (PR) of PV is es-timated at 82%, i.e. 18% cost reduction for each doubling of the cumulative capacity, based on (Junginger et al, 2008). Because of these characteristics, the investment cost (€/Wp or €/kW, see Table 6.1) and the generation cost (€/MWh) will come down. Table 6.1 shows the expected ca-pacity growth and the cost reduction of PV. The growth is expected to continue, both worldwide and in Europe. The specific investment cost of PV is estimated at € 3,600-4,500/kW - average € 4,050/kW - in €2008 in 2008, based on (Lensink et al, 2009). The average cost of € 3,420/kW (€2008) in 2010 corresponds to an average of € 3,600/kW (€2010) projected by Lensink et al (2009) for 2010. Op-eration and maintenance costs are estimated at 0.6% of the investment cost per year. Table 6.1 shows the potential and cost of PV. Growth in Europe is assumed to be slightly lower than on a global scale. The lowest cost level corresponds to a realistic global potential of 2,395 GWe, and the highest to a European potential of 988 GWe. The specific investment cost could come down to € 940-1,070/kW in 2050, based on an economic lifetime of 25 years and a PR of 0.82. It should be noted that such deep cost reductions depends on the extent to which costs of solar cells, modules, and balance of system may be reduced at the same rate, which is questionable.

40 ECN-E--10-034
Table 6.1 Technical and economic features of photovoltaic power (PV) in the EU Technical performance Unit Typical ranges Technology PV Efficiency [%] Not applicable Construction period [month] 0.1-12 Technical lifetime [year] 25 Capacity factor Central / South Europe [%] 10 / 15 Maximum availability [%] 99 Environmental impact Typical ranges GHG emissions [kg/MWh] Not applicable SO2 [g/MWh] Not applicable NOx [g/MWh] Not applicable Particulates [g/MWh] Not applicable Solid waste [g/MWh] Not applicable Costs [€2008] Investment cost including IDC a (2008) [€/kW] 3,600-4,500; average 4,050 Fixed & variable O&M cost [% of inv.] 0.6 Fuel cost [€/MWh] Not applicable Economic lifetime [year] 25 Progress ratio [] 0.82 Data projections 2010 2020 2030 2050 Variant Low Average High Low Average High Low Average High AverageCapacity factor southern Europe b [%] 15 15 15 15 15 15 15 15 15 15 Investment cost including IDC a [€/kW] 3,098 3,485 3,872 1,733-
1,755 1,950-1,974
2,167-2,193
1,184-1,237
1,332-1,392
1,480-1,547
943- 1,068
Operation and maintenance [€/MWh] 14.2 15.9 17.7 7.9-8.0 8.9-9.0 9.9-10,0 5.4-5.7 6.1-6.4 6.8-7.1 4.3-4.9 Capacity Europe [Gwe] 15.9 15.9 15.9 115.8 115.8 115.8 392.3 392.3 392.3 988 Capacity world [Gwe] 24.9 24.9 24.9 189.0 189.0 189.0 715.5 715.5 715.5 2,395 a IDC = Interest during construction. b For central European, the production cost has to be increased by approximately 50% based on a solar radiation of 1,100 kWh/m2 compared to up to 1,700 kWh/m2 for
southern Europe.

ECN-E--10-034 41
7. Hydro power
7.1 Introduction At present, approximately 19% of global electricity comes from hydro power. The current global generation of approximately 3,000 TWh/yr based on a hydro power capacity of 945 GWe corresponds to 37% of the economically feasible potential and 23% of the technical potential. In general, a distinction is made between large, small, mini, and micro hydro power (Internet source 49): • Micro hydro: <100 kWe. • Mini hydro: 100 - 500 kWe. • Small hydro: 500 kW - 50 MWe. • Large hydro: >50 MWe. The EU regards ‘small’ hydro power as <10 MWe, and plants ≥10 MWe as ‘large-scale’ (Inter-net Source 50). River power plants and high-pressure systems with reservoirs and dams convert the kinetic energy with turbines and generators into electrical energy. Hydro power systems are also used for flood control and irrigation. Storage systems with pumps allow storage of energy for different time horizons (daily, weekly, or seasonally). Large hydro power plants may be huge, e.g., the Three Gorges project in China, with a capacity of 22,500 MWe. In China and India, where large hydro power is expanded, major social disrup-tions, ecological impacts on existing river ecosystems and fisheries and related evaporative wa-ter losses are stimulating public opposition. Land-use and environmental concerns may mean that obtaining resource permits is a constraint. In 2008, the global capacity of large-scale hydro power was 860 GWe, and that of small-scale hydro approximately 85 GWe (REN21, 2009). Whereas hydro showed substantial growth in OECD countries in the 20th century, most of the growth of renewables in the next decades is expected to come from wind and biomass (Lako et al, 2003). In developing countries, however, hydro is expected to be the fastest-growing renew-able energy source. Untapped hydro potential is identified in South and Central Asia, Latin America, and Africa, but also in Canada, Turkey, and Russia. In Europe, additional potential is limited, inter alia due to reasons of protection of nature and landscape. However, in some re-gions, among which the USA, modernisation of hydro plants could add considerable amounts of electricity - a figure of 12-35% is found in literature - compared to the current hydro generation.
7.2 Environmental issues Small (or micro) hydro power does not raise so many environmental concerns, as many schemes are based on run-of-river power plants without (large) dams. The global technical potential of small and micro hydro is around 150-200 GWe with many unexploited resource sites available. About 75% of water reservoirs in the world were built for irrigation, flood control and urban water-supply schemes and many could have small hydro power generation retrofits added. In the past, environmental issues have surfaced at large hydro power projects (Internet source 51): • Blocking fish moving up the river to the spawning grounds. • Decreasing of wildlife in river grounds and former rain forests by flooding.

42 ECN-E--10-034
• Dislocation of people for dam projects, e.g., 1.13 million people for the Three Gorges Dam. • Oxygen reduction in the water by rotting of flooded vegetation killing fish and plants. • Methane emission after rotting. CH4 is a strong GHG gas, 21 times more effective than CO2. • Dissolving of natural metals from stones and soils (e.g. mercury) after flooding. • Water quality (oxygen reduction) and sedimentation problems (filling) by reducing the flow
speed. • Problems for fish population as a result of flushing for clearing sedimentation. • Stranding fish in shallow water areas by power plant operation. • Potential dam breaking (war, earthquakes).
7.3 Types There are basically four types of hydro power plants (Internet Source 52): • Pelton turbine. This is an impulse turbine which is normally used for more than 250 m of
water head. • Francis turbine. This is a reaction turbine which is used for a water head varying between
2.5 and 450 m. • Kaplan turbine. It is a propeller type of plant with adjustable blades which are used for water
heads varying between 1.5 m to 70 m. • Propeller turbine. This type is used for a water head between 1.5 to 30 m. • Tubular turbine, used for low and medium height projects, normally for a head of <15 m.
7.4 Construction and generation costs A key feature of investments in hydroelectric power generation is that they require long-term loans with extensive grace periods because they are capital-intensive, have a long construction phase with significant risks and have a long useful life. The specific investment costs of small hydro power vary between € 2,500/kW and € 4,220/kW - on average € 3,360/kW - (€2008) in 2008 (Table 7.1), a range which has been checked and proved to be consistent with a ‘Technical Brief’ (Beurskens and Lako, 2010). This range is used for calculations of future investment costs, based on a global scenario for small hydro power, ending up at 200 GWe, and a European scenario, ending up at 20.3 GWe in 2050. Cost reductions are based on a PR of 0.95 (Table 7.2).
Table 7.1 Economic characteristics of small hydro power in Europe Investment cost O&M Generation cost Low Medium High cost Low Medium High [€/kW] [€/kW] [€/kW] [€/MWh] [€/MWh] [€/MWh] [€/MWh] Austria 3,758 4,665 5,572 5.2 46.6 117.3 187.9 Belgium 4,794 5,611 6,427 23.3 Czech Republic 855 1,723 2,592 25.9 32.4 38.9 Finland 2,851 3,088 3,326 38.9 42.1 45.4 France 1,555 2,721 3,887 Germany 5,183 6,479 7,775 64.8 Greece 1,296 1,944 2,592 31.1 42.8 54.4 Ireland 1,944 3,401 4,859 48.6 83.3 117.9 Italy 1,944 2,916 3,887 64.8 97.2 129.6 Lithuania 2,851 3,045 3,240 32.4 35.6 38.9 Poland 648 1,101 1,555 38.9 Portugal 1,685 2,462 3,240 Spain 1,296 1,944 2,592 10.6 45.4 68.0 90.7 Sweden 2,332 2,592 2,851 16.4 51.8 58.3 64.8 UK 2,592 4,406 6,220 64.8 77.7 90.7 Average 2,495 3,357 4,218 13.9 45.0 65.4 85.9 Sources: ESHA, 2004 and 2006.

ECN-E--10-034 43
Table 7.2 Technical and economic features of small hydro power in the EU Technical performance Unit Typical ranges Technology Small hydro power Efficiency [%] Not applicable Construction period [month] 12-24 Technical lifetime [year] 80 Capacity factor [%] 45 Maximum availability [%] 99 Environmental impact Typical ranges GHG emissions [kg/MWh] Not applicable SO2 [g/MWh] Not applicable NOx [g/MWh] Not applicable Particulates [g/MWh] Not applicable Solid waste [g/MWh] Not applicable Costs [€2008] Investment cost including IDC a (2008) [€/kW] 2,500-4,220; average
3,360
Fixed & variable O&M cost [% of inv.] 2 Fuel cost [€/MWh] Not applicable Economic lifetime [year] 25 Progress ratio [] 0.95 Data projections 2010 2020 2030 2050 Variant Low Average High Low Average High Low Average High AverageCapacity factor [%] 45 45 45 45 45 45 45 45 45 45 Investment cost including IDC a [€/kW] 2,489 3,345 4,201 2,442-
2,449 3,282-3,291
4,122-4,133
2,403-2,425
3,229-3,259
4,055-4,093
3,154-3,243
Operation and maintenance [€/MWh] 12.6 17.0 21.3 12.4 16.7 20.9-21.0 12.2-12.3
16.4- 16.5
20.6-20.8
16.0- 16.5
Capacity EU25 + CH + N [Gwe] 13.3 13.3 13.3 16.7 16.7 16.7 19.0 19.0 19.0 20.3 Capacity world [Gwe] 90.2 90.2 90.2 116.8 116.8 116.8 145.3 145.3 145.3 200 a IDC = Interest during construction.
44 ECN-E--10-034
8. Conclusions
This study provides an overview of technical-economic data of a number of renewable energy technologies for electricity generation that are available today and may play an increasingly im-portant role in Europe and on a global scale. First, the study focuses on the way in which spe-cific investment costs of renewable energy technologies may come down based on a so-called Progress Ratio (PR) that is deemed to be representative of that technology. For instance, a PR of 0.9 means that the specific investment cost will be reduced by 10% for each doubling of the cumulative capacity. In this study, it is assumed that the operation and maintenance cost will come down correspondingly. For onshore wind, a PR of 0.9 is applied. In case of relatively optimistic deployment scenarios for onshore wind, the specific investment cost may come down from € 1,350/kWe (€2008) in 2008 to € 1,090-1,190/kWe in 2020, and € 970-1,130/kWe in 2030. This is tantamount to a cost reduction of 20-25% in the period 2008-2030. If the operation and maintenance would come down at the same rate, they would be reduced from € 12/MWh in 2008 to € 10-11/MWh in 2020, and € 8-10/MWh in 2030. For offshore wind, a PR of 0.95 is applied. For optimistic deployment scenarios for offshore wind, the specific investment cost may come down from € 3,000-3,400/kWe in 2008 to € 2,300-2,640/kWe in 2020, and € 2,030-2,440/kWe in 2030. This is tantamount to a cost reduction of 30% in the period 2008-2030. If the operation and maintenance would come down at the same rate, they would be reduced from € 33/MWh in 2008 to € 24-27/MWh in 2020, and € 21-25/MWh in 2030. For geothermal power, a PR of 0.95 is used, although hardly any data is available. For optimis-tic deployment scenarios for geothermal power, the specific investment cost may come down from € 4,000-10,000/kWe in 2008 to € 3,550-9,150/kWe in 2020, and € 3,350-8,500/kWe in 2030. This is tantamount to a cost reduction of 15% in the period 2008-2030. If the operation and maintenance would come down at the same rate, they would be reduced from € 10-25/MWh in 2008 to € 9-23/MWh in 2020, and € 8.5-22/MWh in 2030. For Concentrating Solar Power a PR of 0.925 is applied. For optimistic deployment scenarios for Concentrating Solar Power (CSP), the investment cost may come down from € 4,500/kWe in 2008 to € 2,440-3,350/kWe in 2020, and € 2,065-2,655/kWe in 2030. This is tantamount to a cost reduction of approximately 48% in the period 2008-2030. If the operation and maintenance would come down at the same rate, they would be reduced from € 47/MWh in 2008 to € 26-35/MWh in 2020, and € 22-28/MWh in 2030. For photovoltaic power (PV) a PR of 0.82 is applied based on experience until this date. For op-timistic deployment scenarios for PV, the investment cost may come down from € 3,600-4,500/kWe in 2008 to € 1,730-2,190/kWe in 2020, and € 1,180-1,550/kWe in 2030. This is tan-tamount to a cost reduction of approximately 67% in the period 2008-2030. If the operation and maintenance would come down at the same rate, they would be reduced from € 18-19/MWh in 2008 to € 8-10/MWh in 2020, and € 5-7/MWh in 2030. Finally, for small hydropower a PR of 0.95 is applied. In case of optimistic deployment scenar-ios for small hydropower, the investment cost may come down from € 2,500-4,220/kWe in 2008 to € 2,440-4,130/kWe in 2020, and € 2,400-4,100/kWe in 2030. This is tantamount to a cost re-duction of 5% in the period 2008-2030. If the operation and maintenance would come down at the same rate, they would be reduced from € 13-21/MWh in 2008 to € 12-21/MWh in 2020, and € 12-21/MWh in 2030.
ECN-E--10-034 45
References
Arp, J. (2009): Photovoltaic Market in Germany. German Day, May 21st, 2009, Bangkok, Thailand. Http://www.german-renewable-energy.com/Renewables/Redaktion/PDF/en/Vortraege-2009/en-Renewable-Energy-Asia-2009-Arp,property=pdf,bereich=renewables,sprache=en,rwb=true.pdf
Bertani, R. (2006a): World Geothermal Power Generation 2001 - 2005. RC Bulletin, May/June 2006, pp. 89-111. http://www.geothermal.org/articles/worldpower05.pdf
Bertani, R. (2006b): World Geothermal Power Generation 2001-2005. International Geothermal Development, May/June 2006, pp. 89-111. http://www.geothermal.org/articles/worldpower05.pdf
Bertani, R. (2007): World Geothermal Generation in 2007. GHC Bulletin, September 2007, pp. 8-19. http://geoheat.oit.edu/bulletin/bull28-3/art3.pdf
Beurskens, L.W.M. (2010): Private communication L.W.M. Beurskens and J. Van Stralen. ECN, May 2010.
Beursksen, L.W.M., and P. Lako (2010): Hydropower - Technology Brief (draft). IEA-ETSAP, Paris, March 23, 2010.
BP (2009): BP Statistical Review of World Energy - Renewables. BP, UK, June 2009.
BTM Consult (2009): International Wind Energy Development - World Market Update 2008. BTM Consult ApS, Ringkøbing, Denmark, March 2009.
Desertec (2009): Clean Power from Deserts - WhiteBook 4th Edition. Desertec Foundation, Bonn, Germany, February 2009. http://www.desertec.org/downloads/articles/trec_white_paper.pdf
DiPippo, R. (1999): Small Geothermal Power Plants: Design, Performance and Economics. GHC Bulletin, June 1999, p 1. http://geoheat.oit.edu/bulletin/bull20-2/art1.pdf
Douglas Westwood (2007): POWER: Pushing Offshore Wind Energy Regions. Trans-national Offshore Wind Supply Chain Study - Update June 2007. Douglas Westwood, UK, June 2007.
DTI (2007): Study of the costs of offshore wind generation. DTI, UK, 2007, URN 07/779.
Duvia, A., M. Gaia (2002): ORC plants for power production from biomass from 0.4 to 1.5 Mwe: Technology, efficiency, practical experiences and economy. 7th ‘Holzenergie Symposium’, ETH Zurich, Zurich, Switzerland, 18 October 2002. http://www. Econergy.ltd.uk/downloads/Turboden%20CHP%20Paper.pdf
EPIA (2009): Global market outlook for photovoltaics until 2013. European Photovoltaic Industry Association (EPIA), Brussels, Belgium, March 2009.
ESHA (2004): Current situation of small hydropower in the EU15 according to ESHA’s members. European Small Hydropower Association (ESHA), Brussels, Belgium, March 2004. http://www.esha.be/fileadmin/esha_files/documents/publications/position_papers/ESHA_contributionDGTREN.pdf
46 ECN-E--10-034
ESHA (2006): State of the art of small hydropower in EU25. ESHA, Brussels, Belgium, 2006. http://www.esha.be/fileadmin/esha_files/documents/publications/publications/State_of_the_Art.pdf
EWEA (2007): Delivering Offshore Wind Power in Europe. European Wind Energy Agency (EWEA), Brussels, Belgium, December 2007.
Frandsen, S., et al (2004): Offshore Wind Power: Easing a Renewable Technology out of Adolescence. 19th World Energy Congress, Sydney, Australia September 5-9, 2004.
Gawell, K., et al (1999): Preliminary Report: Geothermal Energy, the Potential for Clean Power from the Earth. US Geothermal Energy Association (GEA), Washington DC, USA, April 7, 1999. http://www.geo-energy.org/publications/reports/Geothermal%20Potential%20Preliminary%20Report%20April%201999.pdf
Gawell, K., and G. Greenberg (2007): 2007 Interim Report Update on World Geothermal Development. US Geothermal Energy Association (GEA), Washington DC, USA, 2007. http://www.geo-energy.org/publications/reports/GEA%20World%20Update%202007.pdf
IEA (2005): Offshore wind experiences. IEA, Paris, June 2005, p. 13.
IPCC (2007): Contribution of Working Group III to the Fourth Assessment Report of the Intergovernmental Panel on Climate Change. Intergovernmental Panel on Climate Change (IPCC), 2007.
Isles, L. (2006): Offshore Wind Farm Development - Cost Reduction Potential. Lund University, Sweden, October 2006.
Junginger, H.M. (2005): Learning in Renewable Energy Technology Development. PhD Thesis Utrecht University, the Netherlands, 13 May 2005, ISBN: 90-393-0486-6.
Junginger, M., P. Lako, S.M. Lensink, W. van Sark, and M. Weiss (2008): Climate Change Scientific Assessment and Policy Analysis: Technological learning in the energy sector. Netherlands Environmental Assessment Agency, Bilthoven, the Netherlands, 2008.
Kelly, B. (2008): Past, present, and future of solar thermal generation. Abengoa Solar, Inc., Berkeley, California, USA, June 2008. http://www.ewh.ieee.org/r6/san_francisco/pes/pes_pdf/256,1,Past, Present, and Future of Solar Thermal Generation
Kühn, M., et al. (2001): Utgrunden offshore wind farm - first results of design certification by measurements. EWEC 2001, Copenhagen, pp 545-548.
Lako, P. (2002): Learning and diffusion for wind and solar power technologies. ECN, Petten, April 2002, ECN-C-02-001.
Lako, P., et al. (2003): Hydropower Development with a focus on Asia and Western Europe. ECN and Verbundplan (Austria), ECN, Petten, July 2003, ECN-C-03-027.
Larsen, J.H.M. et al. (2005): Experiences from Middelgrunden 40 MW Offshore Wind Farm. Copenhagen Offshore Wind, 26-28 October 2005. Http://www.middelgrunden.dk/projektinfo/mg-pjece_300dpi_rgb.pdf.
Lensink, S.M., et al. (2009): Eindadvies basisbedragen 2010 voor elektriciteit en groen gas in het kader van de SDE-regeling. ECN/KEMA, Petten/Arnhem, September 2009, ECN-E-09-058. http://www.ecn.nl/docs/library/report/2009/e09058.pdf
Lundin, J., et al (2006): EUSUSTEL WP3 Report - Geothermal power production. Uppsala University, Sweden, 2006. http://eusustel.be/public/documents_publ/WP/WP3/WP3_Geothermal_energyFINAL.pdf
ECN-E--10-034 47
Madsen, P.S. (1996): Tuno Knøb offshore wind farm. EWEC 1996, Goteborg, Sweden, 20-24 May 1996, pp 4-7.
Mathis, H. (2006): Offshore-Fundamente in Beton - Neue Baumethoden für die Zukunft. DEWEK, 2006.
Mills, D.R., et al (2006): First Results from Compact Linear Fresnel Reflector Installation. 1Solar Heat and Power Pty Ltd, Sydney, Australia, 2006. http://solarheatpower.veritel.com.au/MILLS_CLFR_ANZSES_FINAL.pdf
Moll, M. (2007): The East of England hub for offshore �enewable. Pushing Offshore Wind Energy Regions (POWER). Suffolk County Council, UK, 2007. http://www.offshore-power.net/Files/Billeder/2007-03-01%20esbjerg%20event%20-%20east%20of%20england.pdf
Musial, W. (2005): Overview: Potential for Offshore Wind Energy in the Northeast. Offshore Wind Energy Collaborative Workshop, Resolve, Washington D.C., USA, February 10-11, 2005.
Normark, B., E.K. Nielsen (2005): Advanced power electronics for cable connection of offshore wind. Copenhagen Offshore Wind 2005, Copenhagen, 2005.
NREL (2009): 2008 Wind Technologies Market Report. National Renewable Energy Laboratory NREL, Colorado, USA, July 2009.
Pernecker, G., S. Uhlig (2002): Low-enthalpy power generation with ORC-turbogenerator - The Akltheim project Upper Austria. GHG Bulletin March 2002, p. 26-30. http://geoheat.oit.edu/bulletin/bull23-1/art6.pdf
REN21 (2009): Renewables Global Status Report - 2009 Update. Renewable Energy Policy Network for the 21st Century, REN21, 2008.
RER (2008): Renewable Energy Report, 155, May 12, 2208, p. 20-21.
REW (2007): Renewable Energy World, May-June, 2007, pp. 102-115.
Richter, C., et al (2008): Concentrating Solar Power - Status and Perspectives. German Renewable Energy Day, Solar Power 2008, San Diego, Califonia, USA, October 15, 2008. http://www.german-renewable-energy.com/Renewables/Redaktion/PDF/de/Vortraege-2008/de-Solar-Power-2008-Richter,property=pdf,bereich=renewables,sprache=de,rwb=true.pdf
Schott (2009): Memorandum on solar thermal power plant technology. Schott, Germany, 2009. http://www.schott.com/newsfiles/20061109160336_SCHOTT_Memorandum_E.pdf
SEI (2004): Offshore Wind Energy and Industrial Development in the Republic of Ireland. Sustainable Energy Ireland (SEI), Dublin, Ireland, October 2004. http://www.sei.ie/getFile.asp?FC_ID=1721&docID=65
Sener, A.C. et al (2009): Perspectives on the Economics of Geothermal Power. GRC Transactions, Vol. 33, 2009, pp. 29-36. http://www.icfi.com/docs/geothermal-power.pdf
Shell (2005): Shell Venster, �eptember — oktober 2005, pp. 6-9.
Sinke, W.C. (2009): PV in the urban environment. ECN Solar Energy, Petten, the Netherlands, 2009, ECN-B—09-001.
48 ECN-E--10-034
Söger, H., et al (2006): Offshore wind energy in the North Sea. Technical possibilities and ecological considerations - a study for Greenpeace. Deutsches Windenergie-Institut GmbH (DEWI), Wilhelmshaven, Germany, October 2006.
SPG (2008): The Netherlands Country Report - Legal Framework & Geothermal Policy Issues. Stichting Platform Geothermie, the Hague, the Netherlands, August 2008.
TAB (2003): Möglichkeiten geothermischer Stromerzeugung in Deutschland. Büro für Technikfolgen-Abschätzung beim Deutschen Bundestag (TAB), Germany, October 24, 2003.
Tambke, J., and K. Michalowska-Knap (2010): OffshoreGrid - D3.2b Time Series of Wind Power Output. 3E, Belgium, IEE/08/780/S12.528573, January 31, 2010.
Trieb, F., et al (2009): Global Potential of Concentrating Solar Power. SolarPaces Conference, Berlin, Germany, September 2009. http://www.trec-uk.org.uk/reports/DNI-Atlas-SP-Berlin_20090915-04-Final.pdf
Younger, D.R. (2009): Concentrating Solar Power (CSP) financing and the Clean Technology Fund. International Finance Corporation (IFC), 2009. http://siteresources.worldbank.org/INTCC/Resources/CSP_Overview_CTF.pdf
ECN-E--10-034 49
Internet Sources
1. Http://www.seas-nve.dk
2. Http://lib.kier.re.kr/cadet/retb/no61.pdf
3. Http://www.windenergy.foi.se/main.html
4. Http://www.vindkompaniet.se
5. Http://www.vindkraft.nu
6. Http://www.blyth-offshore.co.uk
7. Http://www.stem.se
8. Http://www.npower-renewables.com/northhoyle/statistics.asp
9. Http://www.berr.gov.uk/files/file34791.pdf
10. Http://www.offshore-power.net/Files/Billeder/2007-03-01%20esbjerg%20event%20-%20east%20of%20england.pdf
11. Http://www.offshore-power.net/Files/Billeder/2007-03-01%20esbjerg%20event%20-%20east%20of%20england.pdf
12. Http://www.centrica.com/index.asp?pageid=995&newsid=931
13. Http://www.seas-nve.dk
14. Http://www.vattenfall.se/www/vf_se/vf_se/518304omxva/518334vxrxv/521964aktue/522474lillg/522564vindk/index.jsp
15. Http://www.liverpooldailypost.co.uk/liverpool-news/regional-news/tm_headline=wind-farm-ready-for-harvest&method=full&objectid=19257644&siteid=50061-name_page.html
16. Http://www.q7wind.nl/en/nieuwsarchief01.htm
17. Http://www.centrica-energie.de/pdf/pr-2007-03-05-wind-farm.pdf
18. Http://www.azom.com/details.asp?newsID=7967
19. Http://www.eon-uk.com/downloads/Humber_gateway_national_PR_Aug07.pdf
20. Http://www.contractorsunlimited.co.uk/news/061207a-E.ON.shtml
21. Http://www.dongenergy.com/en/ir/releases/2007/data/DONG+Energy+to+proceed+with+Horns+Rev+2.htm
22. Http://www.rwe.com/generator.aspx/konzern/verantwortung/aktuelles/2007/0711/language=en/id=486766/page.html
23. Http://www.newenergy.info/index.php?id=874
24. Http://iga.igg.cnr.it/geoworld/geoworld.php?sub=elgen
25. Http://www.solucar.es/sites/solar/en/tec_ccp.jsp
26. Http://www.stirlingenergy.com/pdf/2009-05-06_Calico-(Solar-One)-Project-Application-Achievement.pdf
27. Http://www.stirlingenergy.com/technology/suncatcher.asp

50 ECN-E--10-034
28. Http://www.ausra.com
29. Http://www.pge.com/about/news/mediarelations/newsreleases/q4_2007/071105.shtml
30. Http://www.ausra.com/pdfs/ausra_usgridsupply.pdf
31. Http://www.brightsourceenergy.com/PGEPressReleaseApril12008.pdf
32. Http://www.skyfuel.com
33. Http://www.solarmillennium.de
34. Http://www.solar-reserve.com
35. Http://www.solel.com
36. Http://www.abengoasolar.com/sites/solar/en/sparaelectricas_iscc.jsp
37. Http://www.solarelectricpower.org/docs/Virtual%20Spain%20CSP%2012-2007%20low%20res.pdf
38. Http://renewableenergydev.com/red/solar-energy-andasol-1-2-3/
39. Http://renewableenergydev.com/red/solar-energy-solar-tres-power-tower-csp/
40. Http://earth2tech.com/2007/12/12/skyfuel-heats-up-solar-thermal
41. Http://www.renewableenergyworld.com/rea/partner/story?id=50827
42. Http://www.renewableenergyworld.com/rea/news/article/2009/05/concentrating-solar-energy-technologies-explained
43. Http://www.solarelectricpower.org/index.php?page=basics&subpage=pv&display=facts
44. Http://www.printedelectronicsnow.com/news/2009/03/18/dupont_expects_continued_revenue_growth_in_global_photovoltaic_market
45. Http://www.solarserver.de/solarmagazin/index-e.html
46. Http://web.mit.edu/mit_energy/resources/iap/MIT-IAP-Jan2007_PVin2012_Buonassisi-Lecture-2.pdf
47. Http://www.wtc-consult.com/cms/cms/upload/PDF/Press_Releases/solar_cells-DB_new.pdf
48. Http://economictimes.indiatimes.com/News_by_Industry/Moser_Baer_to_invest_15_bn_in_solar_power/articleshow/2771966.cms (11 Feb, 2008)
49. Http://www.shakti.hypermart.net/articles/re/smallhydro.htm
50. Http://www.esha.be/fileadmin/esha_files/documents/publications/publications/Doc_Strat_TNSHP_2005.pdf
51. Http://www.ucsusa/clean_energy/renewable_energy/
52. Http://powermin.nic.in/JSP_SERVLETS/jsp/Hydro_faq.htm#1