Technical Analysis. Technical analysis – technical trading rules based on past price movements...
25
Technical Analysis
-
Upload
claude-carpenter -
Category
Documents
-
view
229 -
download
1
Transcript of Technical Analysis. Technical analysis – technical trading rules based on past price movements...

Technical Analysis
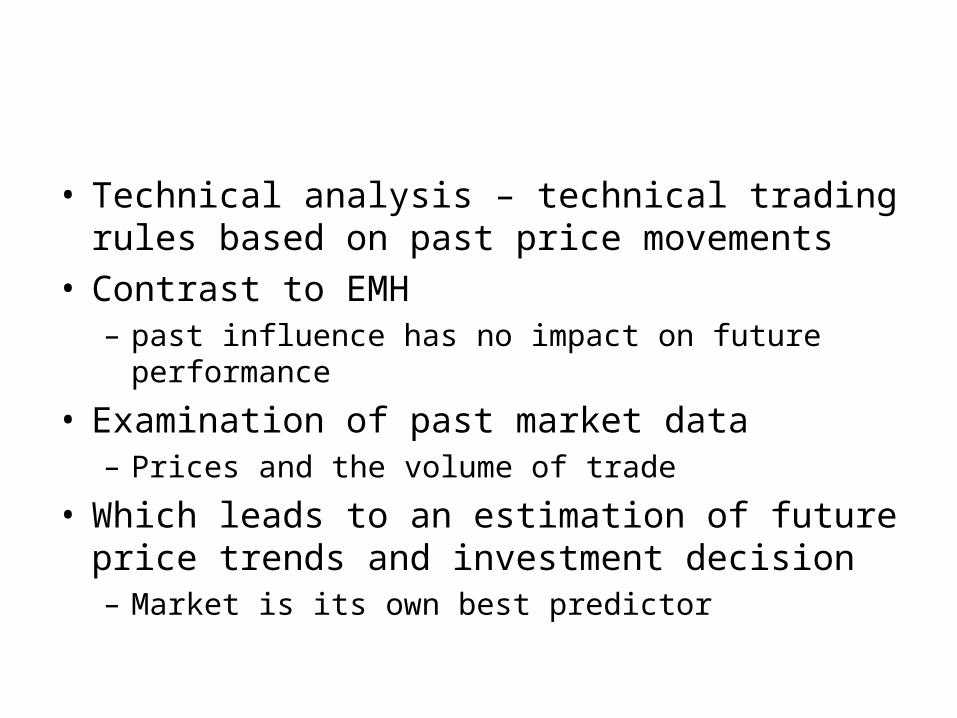
• Technical analysis – technical trading rules based on past price movements
• Contrast to EMH– past influence has no impact on future performance
• Examination of past market data – Prices and the volume of trade
• Which leads to an estimation of future price trends and investment decision– Market is its own best predictor

Underlying Assumptions of Technical Analysis
1. The market value of any good or service is determined solely by the interaction of supply and demand
2. Supply and demand are governed by numerous factors, both rational and irrational
Underlying Assumptions of Technical Analysis
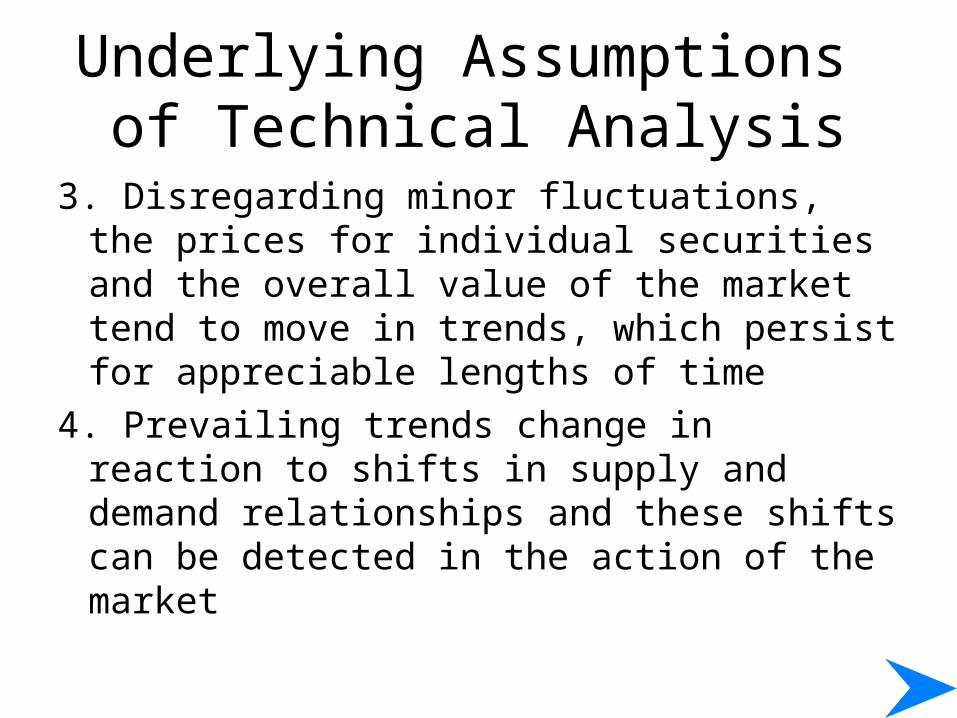
3. Disregarding minor fluctuations, the prices for individual securities and the overall value of the market tend to move in trends, which persist for appreciable lengths of time
4. Prevailing trends change in reaction to shifts in supply and demand relationships and these shifts can be detected in the action of the market


Advantages of Technical Analysis• Not heavily dependent on financial
accounting statements– Problems with accounting statements:1. Lack information needed by security analysts2. GAAP allows firms to select reporting
procedures, resulting in difficulty comparing statements from two firms
3. Non-quantifiable factors do not show up in financial statements

Advantages of Technical Analysis• Fundamental analyst must process new
information and quickly determine a new intrinsic value, but technical analyst merely has to recognize a movement to a new equilibrium
• Technicians trade when a move to a new equilibrium is underway but a fundamental analyst finds undervalued securities that may not adjust their prices as quickly

Challenges to Technical Analysis
• Assumptions of Technical Analysis– Empirical tests of Efficient Market Hypothesis (EMH)
show that prices do not move in trends• Technical Trading rules
– The past may not be repeated– Patterns may become self-fulfilling prophecies– A successful rule will gain followers and become less
successful– Rules require a great deal of subjective judgement
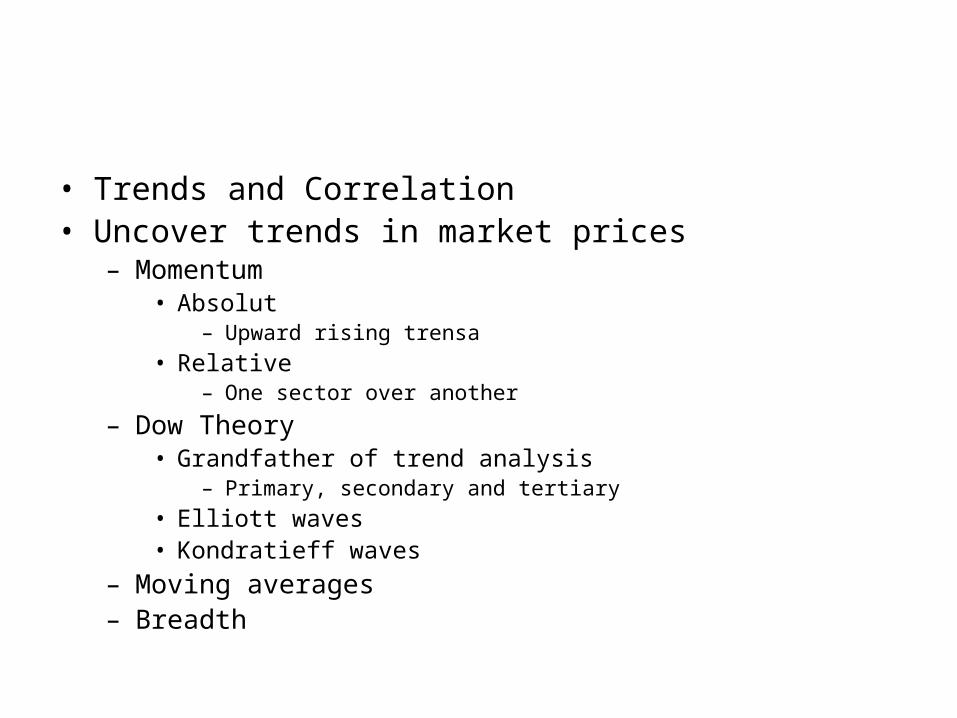
• Trends and Correlation• Uncover trends in market prices
– Momentum• Absolut
– Upward rising trensa
• Relative– One sector over another
– Dow Theory• Grandfather of trend analysis
– Primary, secondary and tertiary
• Elliott waves• Kondratieff waves
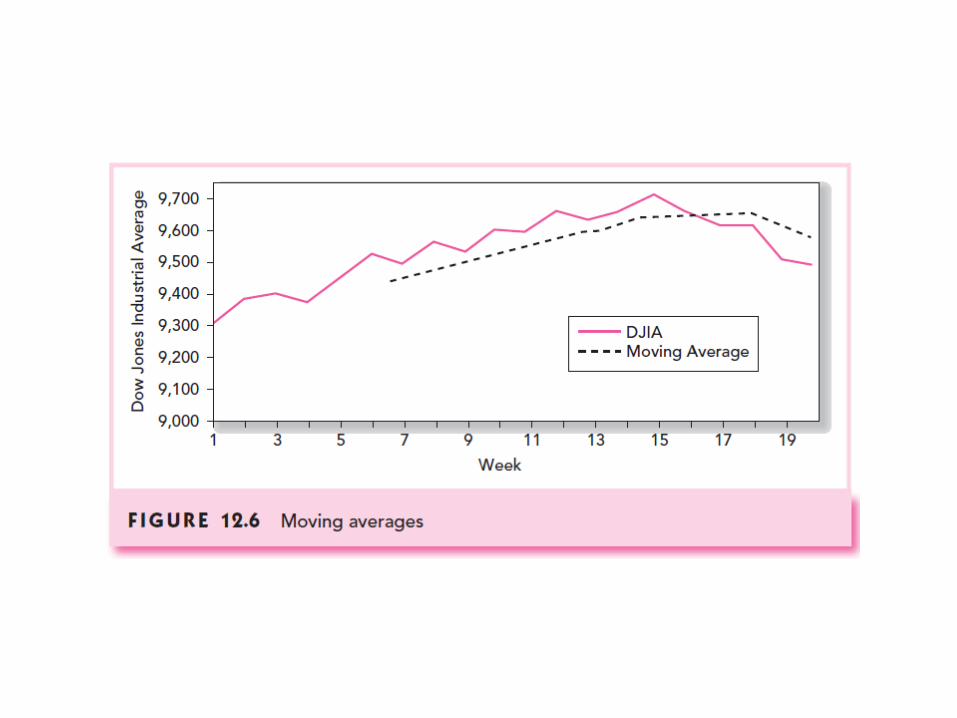
– Moving averages– Breadth


Technical Trading Rules and Indicators
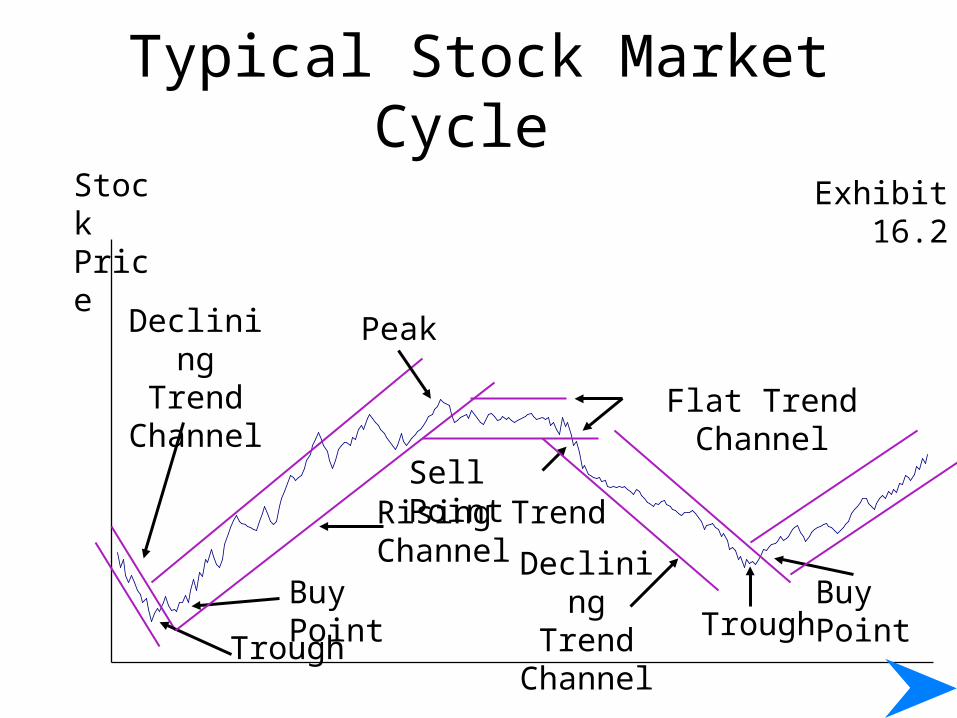
• Stock cycles typically go through a peak and trough
• Analyze the following chart of a typical stock price cycle and we will show a rising trend channel, a flat trend channel, a declining trend channel, and indications of when a technical analyst would want to trade

Typical Stock Market Cycle
Stock Price
Exhibit 16.2
Typical Stock Market Cycle
Stock Price
Exhibit 16.2
Declining Trend
Channel
Trough
Buy Point
Rising Trend Channel
Flat Trend Channel
Sell Point
Peak
Declining Trend
Channel TroughBuy Point

• Support and resistance levels
• Overbought v. oversold


Contrary-Opinion
• Many analysts rely on rules developed from the premise that the majority of investors are wrong as the market approaches peaks and troughs
• Technicians try to determine whether investors are strongly bullish or bearish and then trade in the opposite direction
• These positions have various indicators
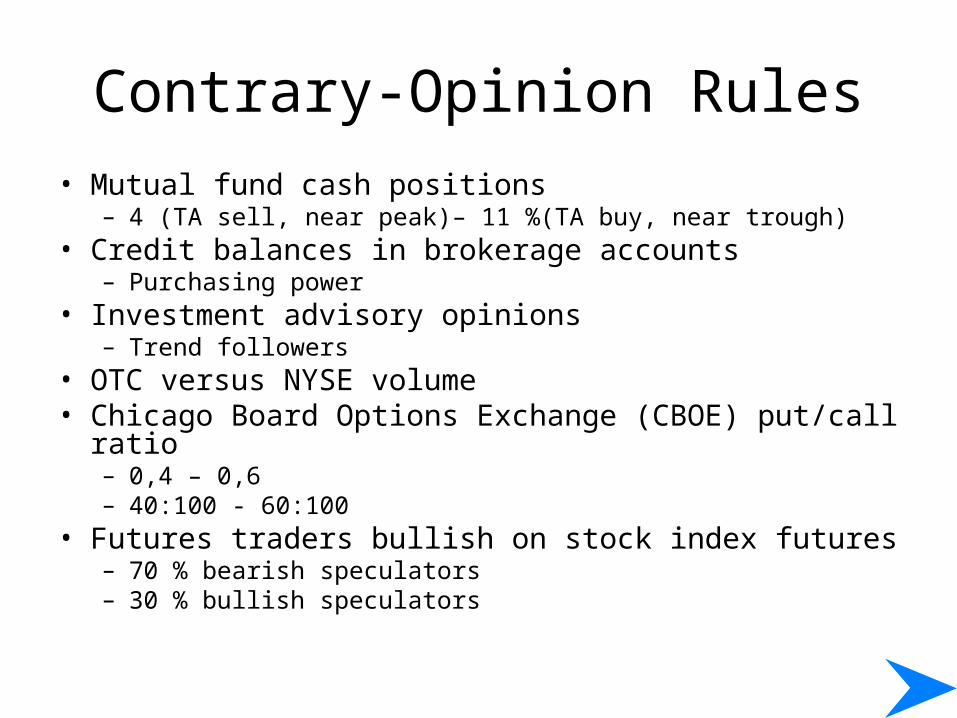
Contrary-Opinion Rules
• Mutual fund cash positions– 4 (TA sell, near peak)– 11 %(TA buy, near trough)
• Credit balances in brokerage accounts– Purchasing power
• Investment advisory opinions– Trend followers
• OTC versus NYSE volume• Chicago Board Options Exchange (CBOE) put/call ratio
– 0,4 – 0,6 – 40:100 - 60:100
• Futures traders bullish on stock index futures– 70 % bearish speculators– 30 % bullish speculators

Follow the Smart Money
• Indicators showing behavior of sophisticated investors
• The Barron’s Confidence Index
• T-Bill - Eurodollar yield spread
• Debit balances in brokerage accounts (margin debt)

Kinds of charts
• Line chart
• Bar charting
• Candle stick
• Point-and-figure charts– Ch. Dow