Technical Analysis of Indian Stock Market and Shares
42
Technical analysis of indian stock market and shares. FUNDAMENTAL ANALYSIS seeks to determine future stock price by understanding and measuring the objective "value" of an equity. Use the stock chart to identify the current trend. Trends can be classified in three ways: UP, DOWN or RANGEBOUND.
-
Upload
ajay-shekhar-sharma -
Category
Documents
-
view
60 -
download
5
Transcript of Technical Analysis of Indian Stock Market and Shares
Technical analysis of indian stock market and shares.
FUNDAMENTAL ANALYSIS seeks to determine future stock price by understanding and measuring
the objective "value" of an equity. Use the stock chart to identify the current trend.
Trends can be classified in three ways: UP, DOWN
or RANGEBOUND.
Trends:
• Up-trend: a stock rallies often with intermediate periods of
consolidation or movement against the trend.
• Down trend :a stock declines often with intermediate periods
of consolidation or movement against the trend. • Rangebound :price swings back and forth for long
periods between easily seen upper and lower limits.
Trends behaviour:
• Trends tend to persist over time.
• Trends can be measured using TRENDLINES .
• A famous quote about trends advises that "The trend is your friend.
Stock behaviour:
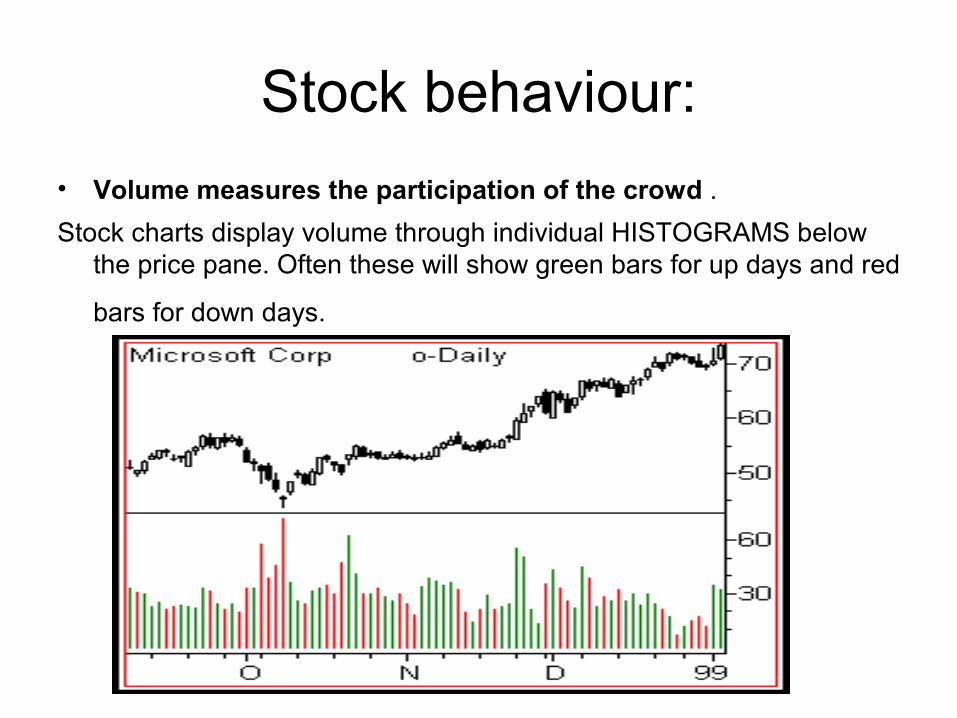
• Volume measures the participation of the crowd .
Stock charts display volume through individual HISTOGRAMS below the price pane. Often these will show green bars for up days and red
bars for down days.
Contd:
• Stocks that are bought with greater interest than sold are said to be under ACCUMULATION.
Stocks that are sold with great interest than bought are said to be under DISTRIBUTION. Accumulation and distribution often LEAD price movement &vice versa
Contd:
• Stocks trade daily with an average volume that determines their LIQUIDITY.
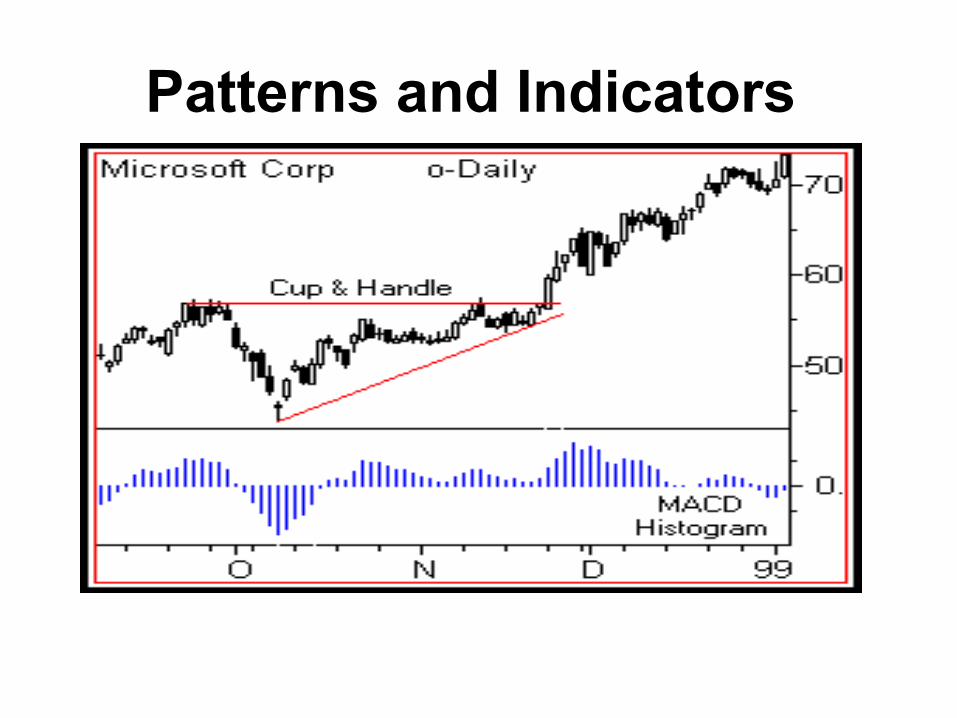
Patterns and Indicators
Contd:
• How can you organize the endless stream of stock chart data into a logical format?
The oldest form of interpreting charts is PATTERN ANALYSIS .
Pattern analysis gains its power from the tendency of charts to repeat the same bar formations over and over again.
PATTERN ANALYSIS
These patterns have been categorized over the years as having a bullish or bearish bias. Some well-known ones include HEAD and SHOULDERS, TRIANGLES, RECTANGLES, DOUBLE TOPS, DOUBLE BOTTOMS and FLAGS. Also, chart landscape features such as GAPS and TRENDLINES are said to have great significance on the future course of price action.
Indicator analysis
• Indicator analysis uses math calculations to measure the relationship of current price to past price action.
• Almost all indicators can be categorized as TREND-FOLLOWING or OSCILLATORS. Popular trend-following indicators include MOVING AVERAGES, ON BALANCE VOLUME and MACD.
Moving Averages
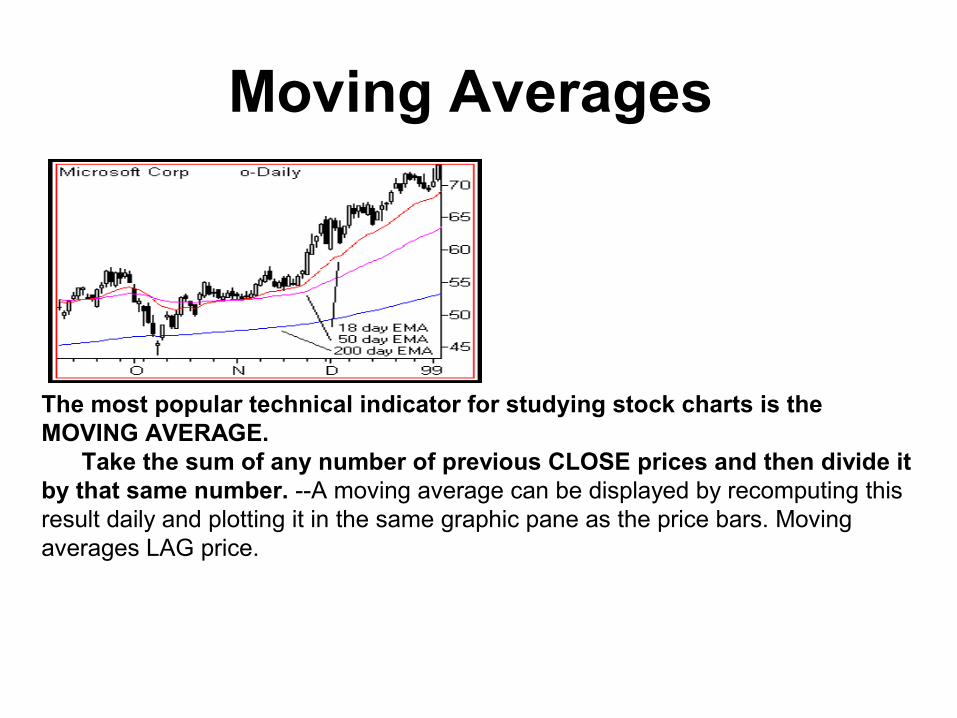
The most popular technical indicator for studying stock charts is the MOVING AVERAGE. Take the sum of any number of previous CLOSE prices and then divide it by that same number. --A moving average can be displayed by recomputing this result daily and plotting it in the same graphic pane as the price bars. Moving averages LAG price.
Contd:
• Plotting moving averages in stock charts reveals how well current price is behaving as compared to the past.
• Current price will always be above or below any moving average computation. When it is above, conditions are "bullish".
Moving averages define STOCK TRENDS .. Common moving average settings for daily stock
charts are: 20 days for short-term, 50 days for intermediate and 200 days for long-term.
Contd:
• One of the most common buy or sell signals in all chart analysis is the MOVING AVERAGE CROSSOVER.
• These occur when two moving averages representing different trends criss-cross.
For example, when a short-term average crosses BELOW a long-term one, a SELL signal is generated .
Contd:
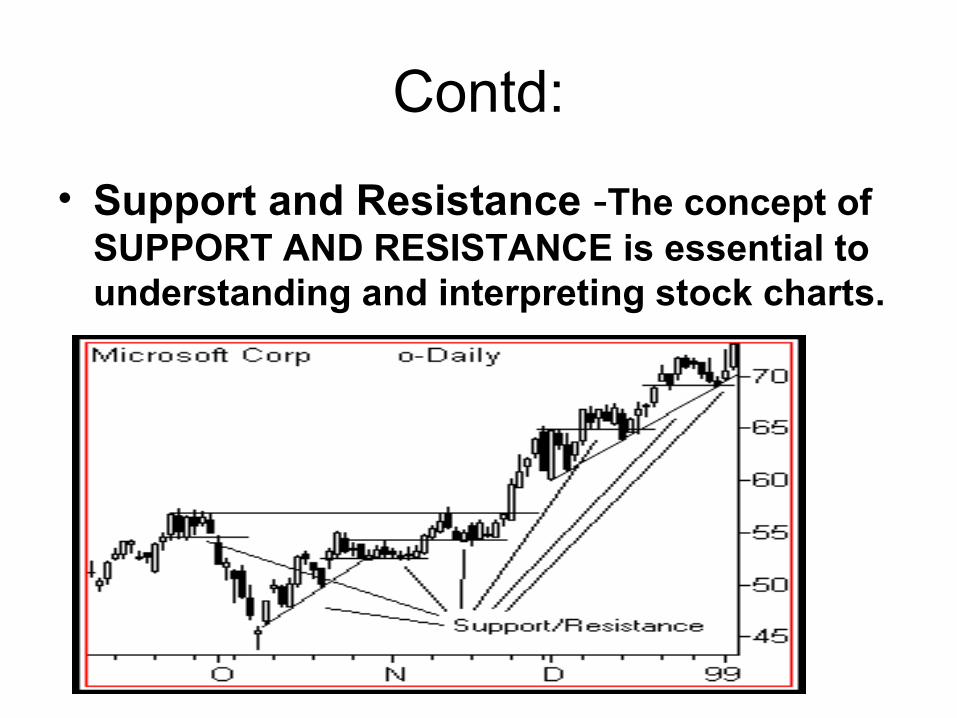
• Support and Resistance -The concept of SUPPORT AND RESISTANCE is essential to understanding and interpreting stock charts.
Contd:
• Buyers and sellers are constantly in battle mode.
Support defines that level where buyers are strong enough to keep price from falling further. Resistance defines that level where sellers are too strong to allow price to rise further
Contd:
• Support and resistance are created because price has memory -- Those prices where significant buyers or sellers entered the market in the past will tend to generate a similar mix of participants when price again returns to that level.
• When price pushes above resistance, it becomes a new support level. When price falls below support, that level becomes resistance.
Contd:
• Support and resistance come in all varieties and strengths.
• Support and resistance exist in all time frames and all markets.
Dow Theory
• Three Movements• Markets fluctuate in more than one time frame at the same time:
Nothing is more certain than that the market has three well defined movements which fit into each other.
• The first is the daily variation due to local causes and the balance of buying and selling at that particular time (Ripple).
• The secondary movement covers a period ranging from days to weeks, averaging probably between six to eight weeks (Wave).
• The third move is the great swing covering anything from months to years, averaging between 6 to 48 months. (Tide).
contd:
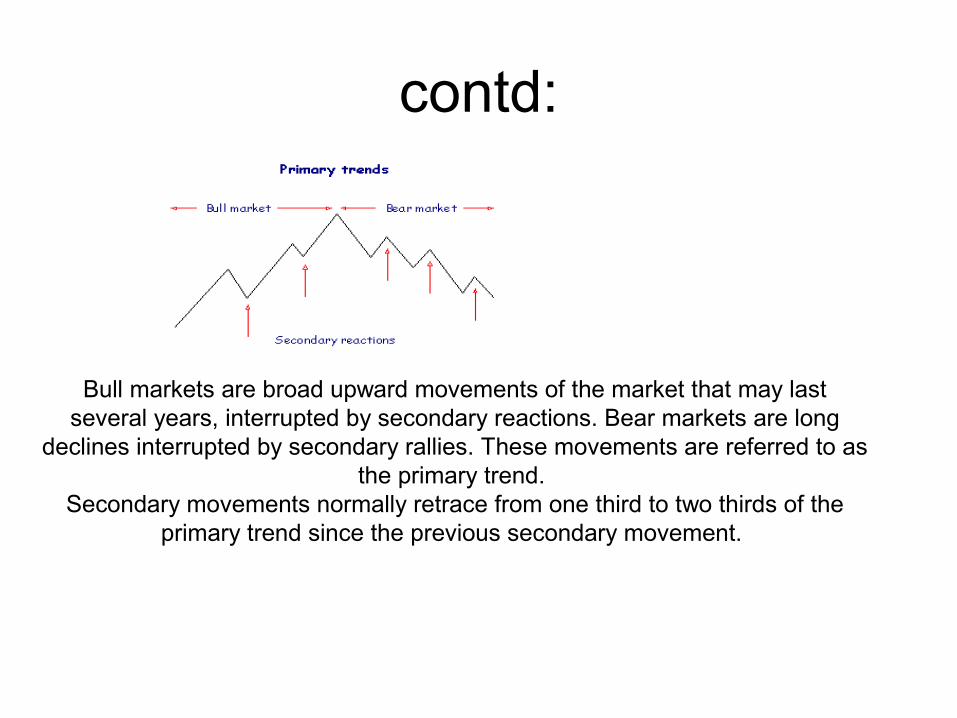
Bull markets are broad upward movements of the market that may last several years, interrupted by secondary reactions. Bear markets are long
declines interrupted by secondary rallies. These movements are referred to as the primary trend.
Secondary movements normally retrace from one third to two thirds of the primary trend since the previous secondary movement.
Primary Movements have Three Phases
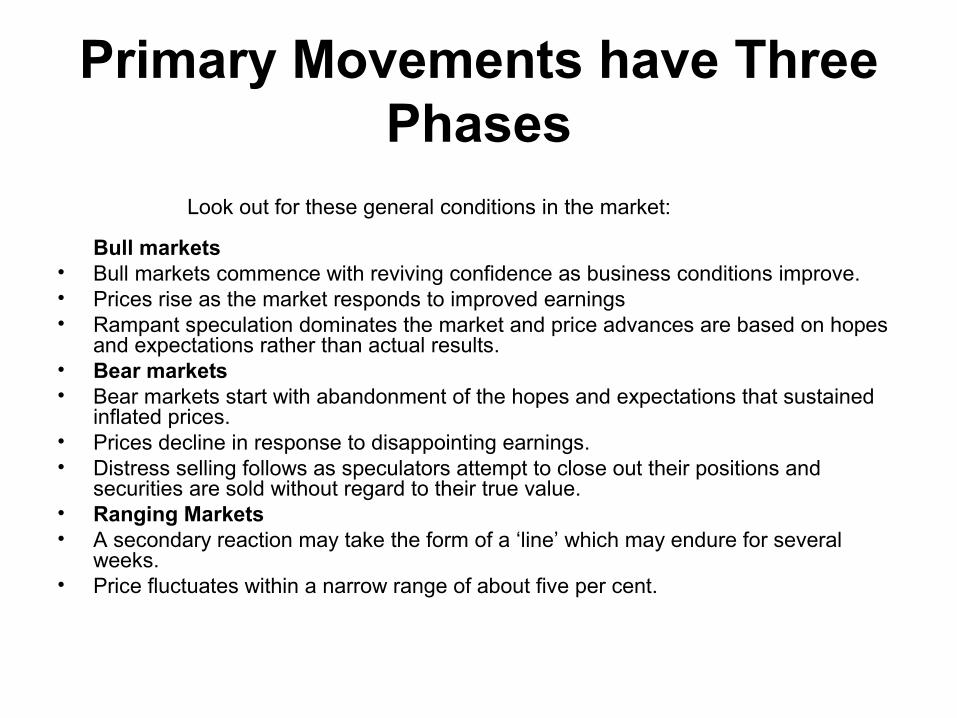
Look out for these general conditions in the market:
Bull markets• Bull markets commence with reviving confidence as business conditions improve.• Prices rise as the market responds to improved earnings• Rampant speculation dominates the market and price advances are based on hopes
and expectations rather than actual results. • Bear markets• Bear markets start with abandonment of the hopes and expectations that sustained
inflated prices.• Prices decline in response to disappointing earnings.• Distress selling follows as speculators attempt to close out their positions and
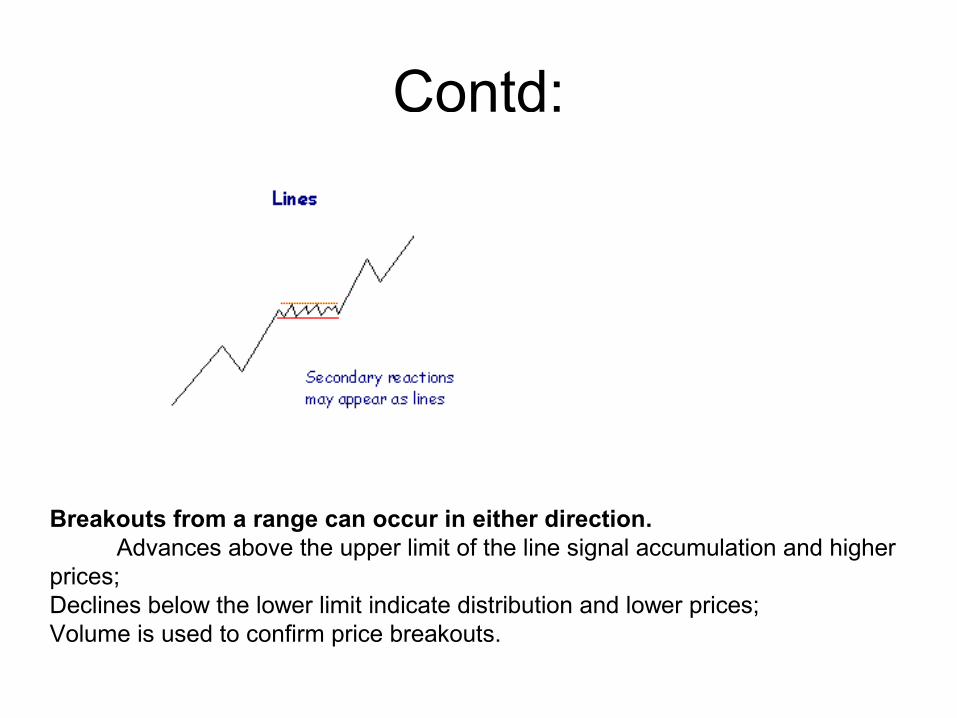
securities are sold without regard to their true value.• Ranging Markets• A secondary reaction may take the form of a ‘line’ which may endure for several
weeks.• Price fluctuates within a narrow range of about five per cent.
Contd:
Breakouts from a range can occur in either direction. Advances above the upper limit of the line signal accumulation and higher prices;Declines below the lower limit indicate distribution and lower prices;Volume is used to confirm price breakouts.
Trends
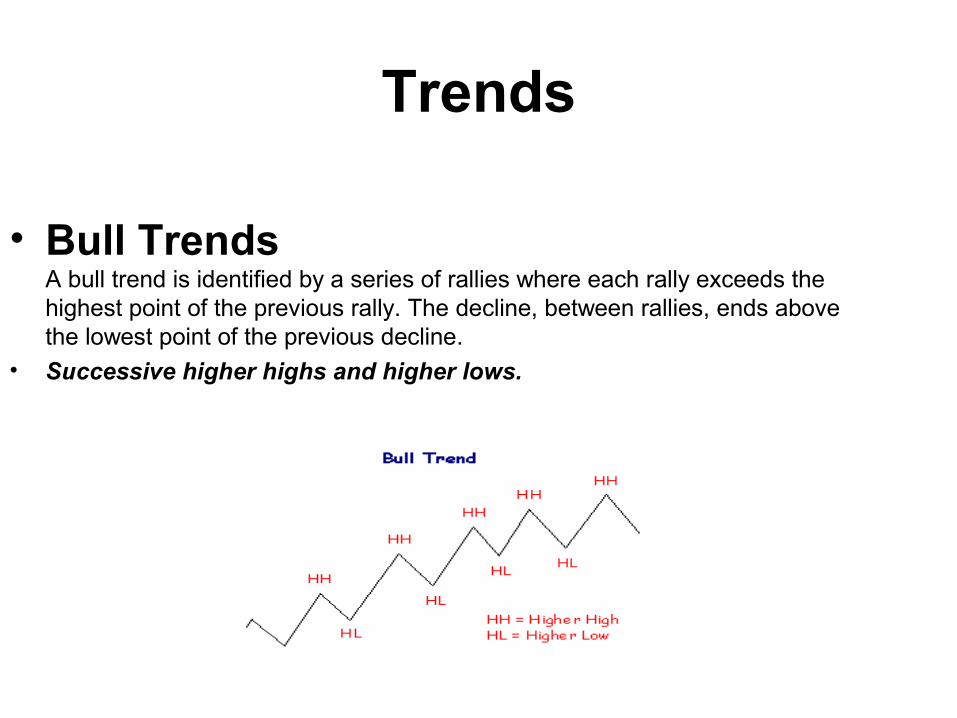
• Bull TrendsA bull trend is identified by a series of rallies where each rally exceeds the highest point of the previous rally. The decline, between rallies, ends above the lowest point of the previous decline.
• Successive higher highs and higher lows.
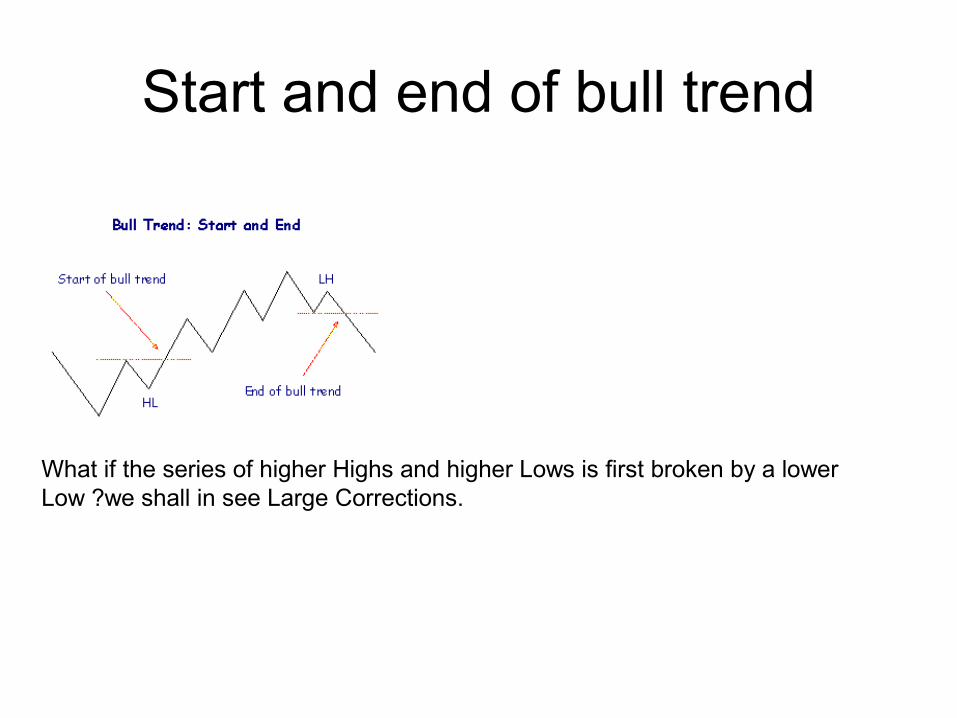
Start and end of bull trend
What if the series of higher Highs and higher Lows is first broken by a lower Low ?we shall in see Large Corrections.
Bear Trends
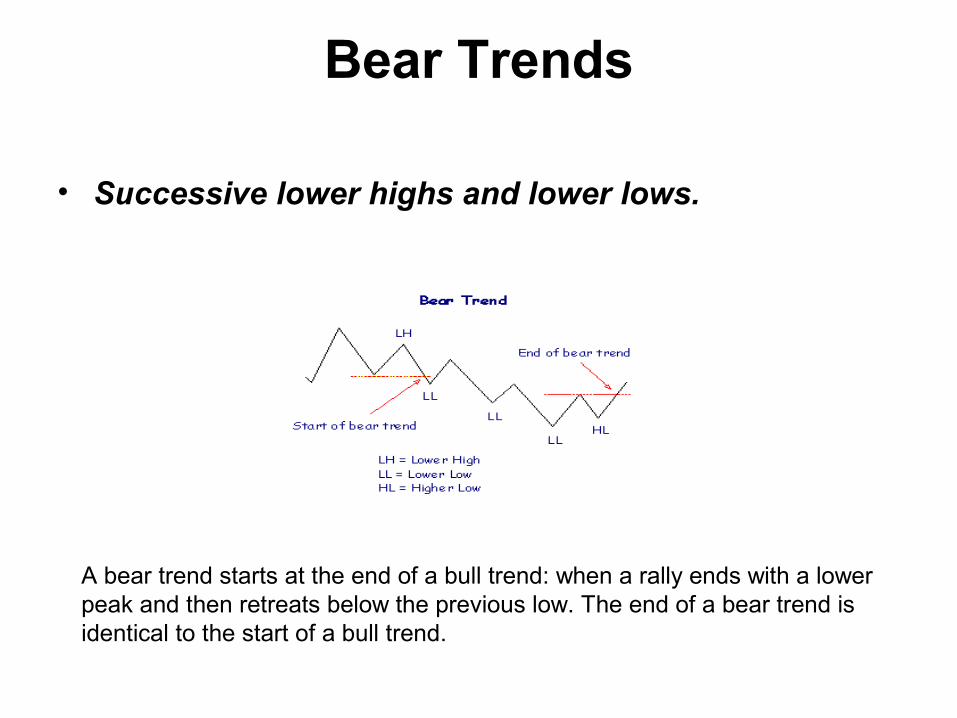
• Successive lower highs and lower lows.
A bear trend starts at the end of a bull trend: when a rally ends with a lower peak and then retreats below the previous low. The end of a bear trend is identical to the start of a bull trend.
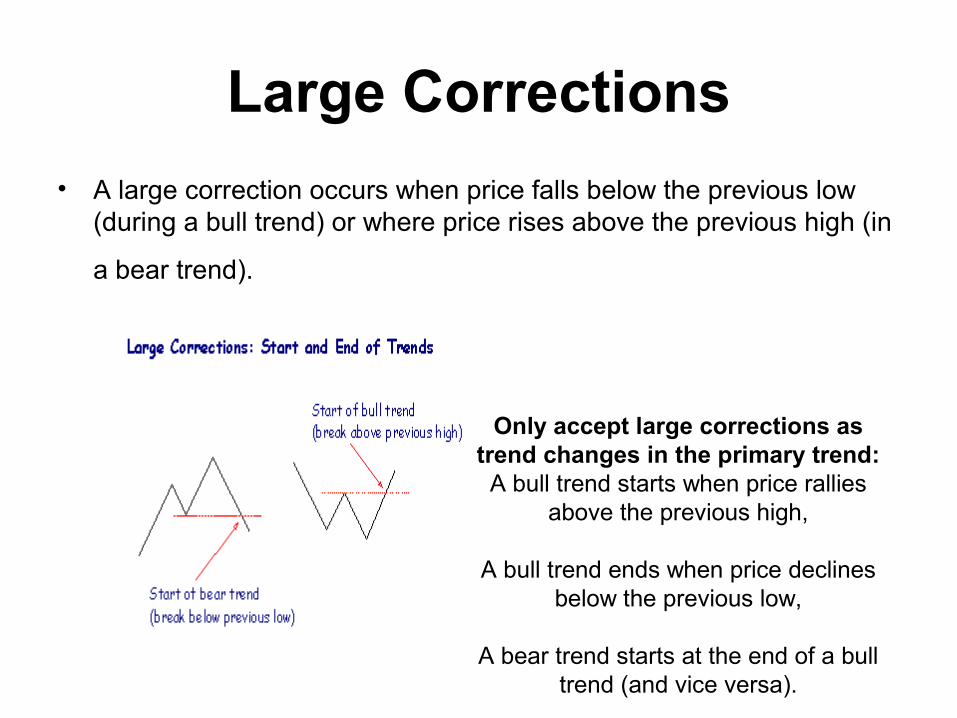
Large Corrections
• A large correction occurs when price falls below the previous low (during a bull trend) or where price rises above the previous high (in
a bear trend).
Only accept large corrections as trend changes in the primary trend:
A bull trend starts when price rallies above the previous high,
A bull trend ends when price declines
below the previous low,
A bear trend starts at the end of a bull trend (and vice versa).
Elliott Waves Theory
The Elliott Wave Theory is named after Ralph Nelson Elliott. Inspired by the Dow Theory and by observations found throughout nature, Elliott concluded that the movement of the stock market could be predicted by observing and identifying a repetitive pattern of waves.
His primary research was with stock market data for the Dow Jones Industrial Average. This research identified patterns or waves that recur in the markets. Very simply, in the direction of the trend, expect five waves. Any corrections against the trend are in three waves. Three wave corrections are lettered as "a, b, c." These patterns can be seen in long-term as well as in short-term charts.
Theory
The whole theory of Elliott Wave can be classified into two parts :
1) Impulse patterns
2) Corrective patterns
Elliott Wave — Impulse Patterns
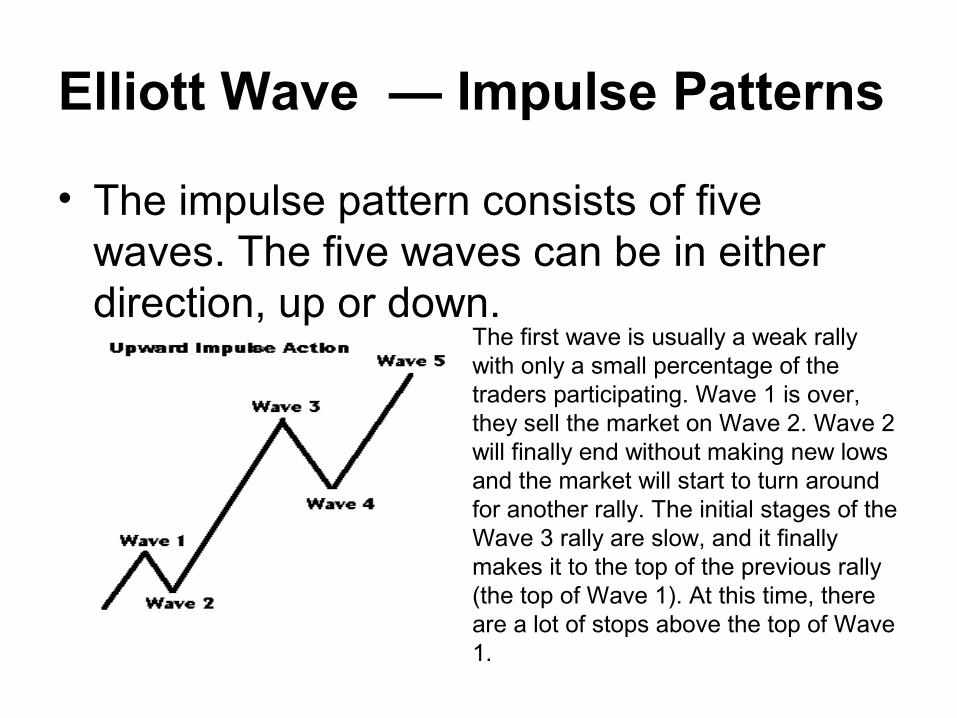
• The impulse pattern consists of five waves. The five waves can be in either direction, up or down.
The first wave is usually a weak rally with only a small percentage of the traders participating. Wave 1 is over, they sell the market on Wave 2. Wave 2 will finally end without making new lows and the market will start to turn around for another rally. The initial stages of the Wave 3 rally are slow, and it finally makes it to the top of the previous rally (the top of Wave 1). At this time, there are a lot of stops above the top of Wave 1.
Contd:
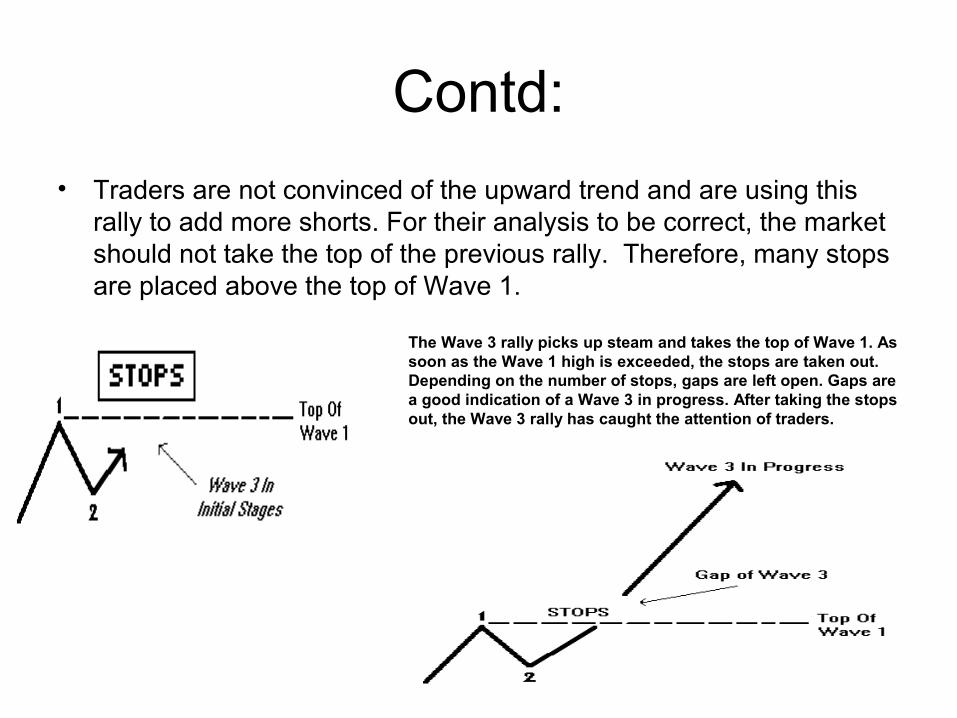
• Traders are not convinced of the upward trend and are using this rally to add more shorts. For their analysis to be correct, the market should not take the top of the previous rally. Therefore, many stops are placed above the top of Wave 1.
The Wave 3 rally picks up steam and takes the top of Wave 1. As soon as the Wave 1 high is exceeded, the stops are taken out. Depending on the number of stops, gaps are left open. Gaps are a good indication of a Wave 3 in progress. After taking the stops out, the Wave 3 rally has caught the attention of traders.
The next sequence of events are as follows :
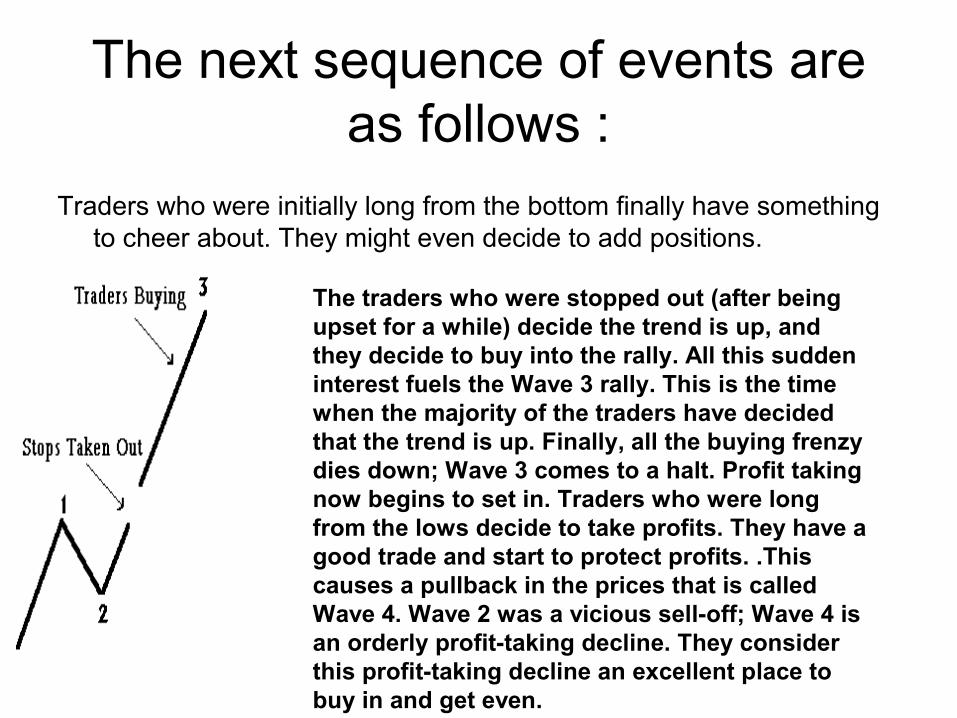
Traders who were initially long from the bottom finally have something to cheer about. They might even decide to add positions.
The traders who were stopped out (after being upset for a while) decide the trend is up, and they decide to buy into the rally. All this sudden interest fuels the Wave 3 rally. This is the time when the majority of the traders have decided that the trend is up. Finally, all the buying frenzy dies down; Wave 3 comes to a halt. Profit taking now begins to set in. Traders who were long from the lows decide to take profits. They have a good trade and start to protect profits. .This causes a pullback in the prices that is called Wave 4. Wave 2 was a vicious sell-off; Wave 4 is an orderly profit-taking decline. They consider this profit-taking decline an excellent place to buy in and get even.
Elliott Wave — Corrective Patterns
• Corrections are very hard to master. Most Elliott traders make money during an impulse pattern and then lose it back during the corrective phase.
An impulse pattern is always followed by a corrective pattern. Corrective patterns can be grouped into two different categories: 1)Simple Correction (Zig-Zag) 2) Complex Corrections (Flat, Irregular, Triangle)
Simple Correction (Zig-Zag)
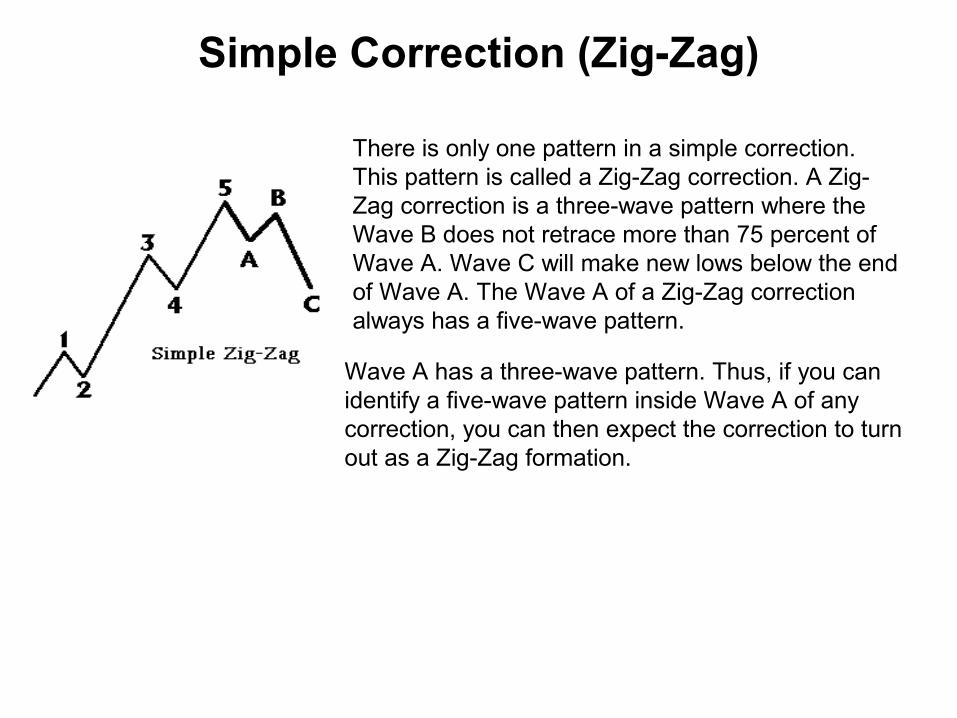
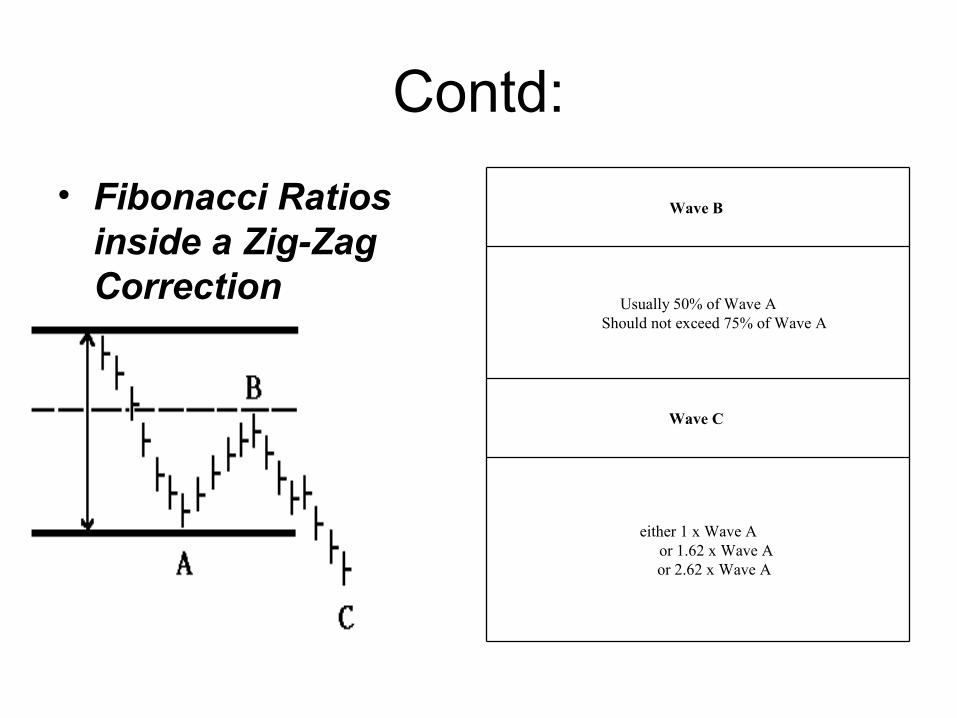
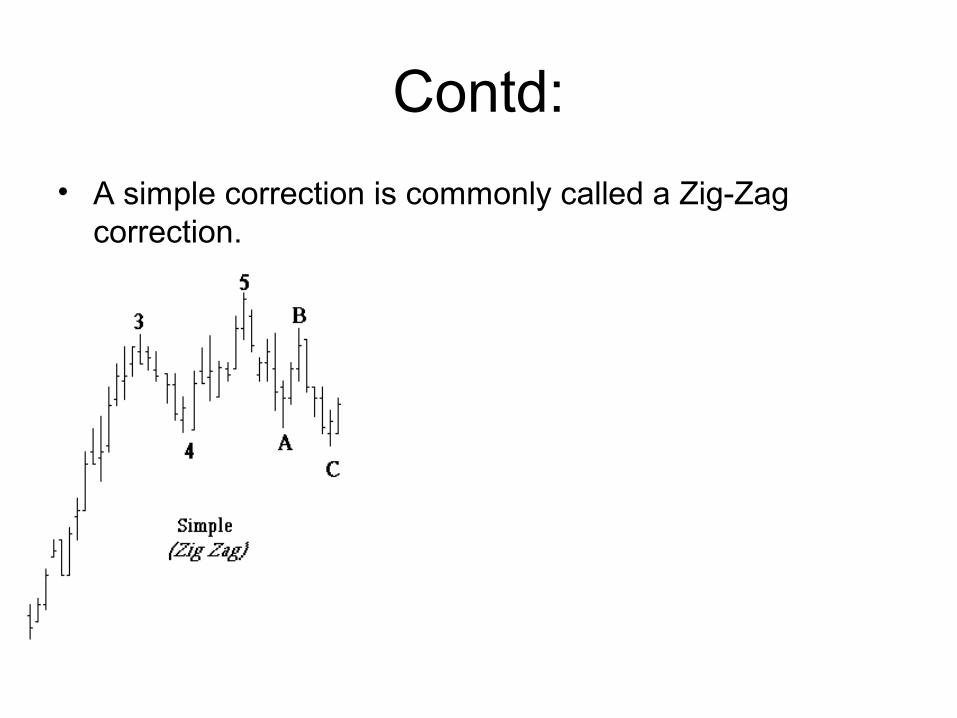
There is only one pattern in a simple correction. This pattern is called a Zig-Zag correction. A Zig-Zag correction is a three-wave pattern where the Wave B does not retrace more than 75 percent of Wave A. Wave C will make new lows below the end of Wave A. The Wave A of a Zig-Zag correction always has a five-wave pattern.
Wave A has a three-wave pattern. Thus, if you can identify a five-wave pattern inside Wave A of any correction, you can then expect the correction to turn out as a Zig-Zag formation.
Contd:
• Fibonacci Ratios inside a Zig-Zag Correction
either 1 x Wave Aor 1.62 x Wave Aor 2.62 x Wave A
Wave C
Usually 50% of Wave AShould not exceed 75% of Wave A
Wave B
Contd:
• A simple correction is commonly called a Zig-Zag correction.
Complex Corrections (Flat, Irregular, Triangle)
The complex correction group consists of 3 patterns:
1)Flat
2) Irregular
3) Triangle
Contd:
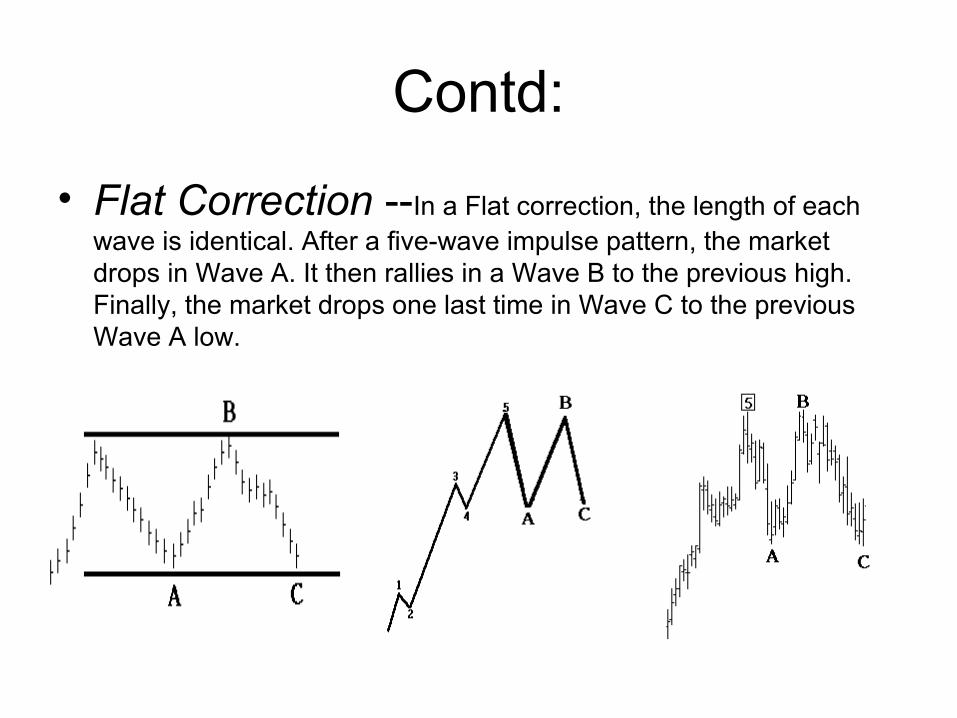
• Flat Correction --In a Flat correction, the length of each wave is identical. After a five-wave impulse pattern, the market drops in Wave A. It then rallies in a Wave B to the previous high. Finally, the market drops one last time in Wave C to the previous Wave A low.
Contd:
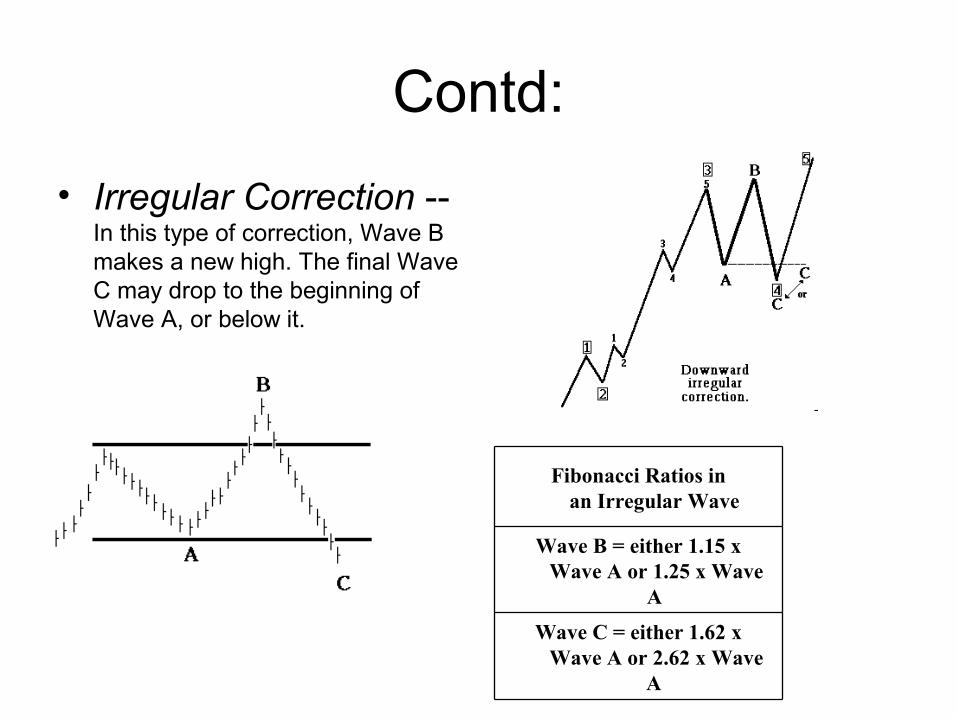
• Irregular Correction --In this type of correction, Wave B makes a new high. The final Wave C may drop to the beginning of Wave A, or below it.
Wave C = either 1.62 xWave A or 2.62 x Wave
A
Wave B = either 1.15 xWave A or 1.25 x Wave
A
Fibonacci Ratios inan Irregular Wave
Triangle Correction
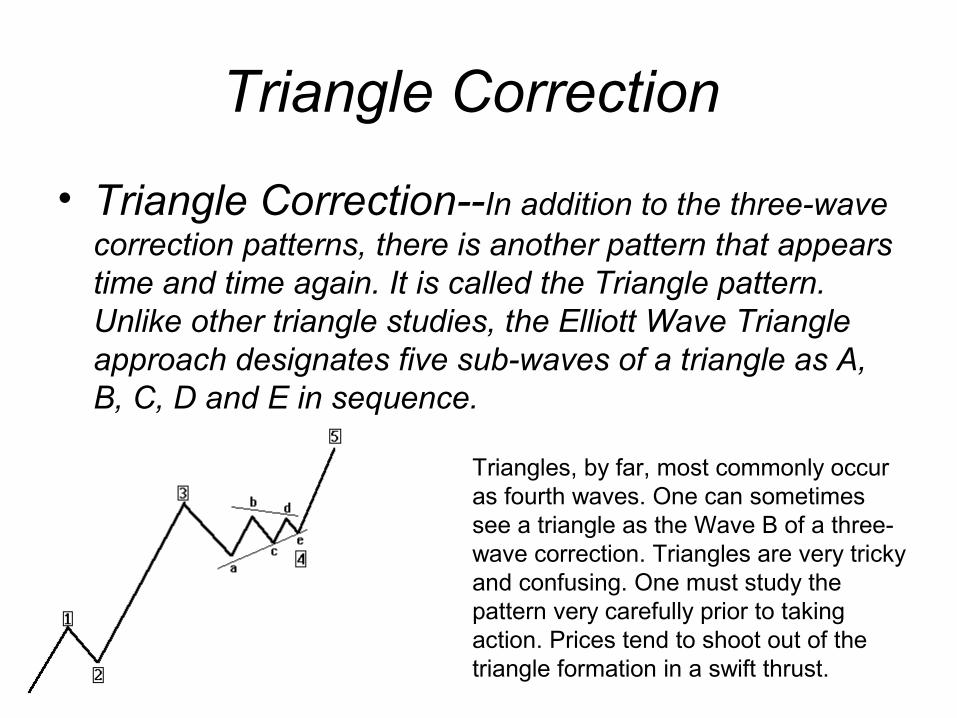
• Triangle Correction--In addition to the three-wave correction patterns, there is another pattern that appears time and time again. It is called the Triangle pattern. Unlike other triangle studies, the Elliott Wave Triangle approach designates five sub-waves of a triangle as A, B, C, D and E in sequence.
Triangles, by far, most commonly occur as fourth waves. One can sometimes see a triangle as the Wave B of a three-wave correction. Triangles are very tricky and confusing. One must study the pattern very carefully prior to taking action. Prices tend to shoot out of the triangle formation in a swift thrust.
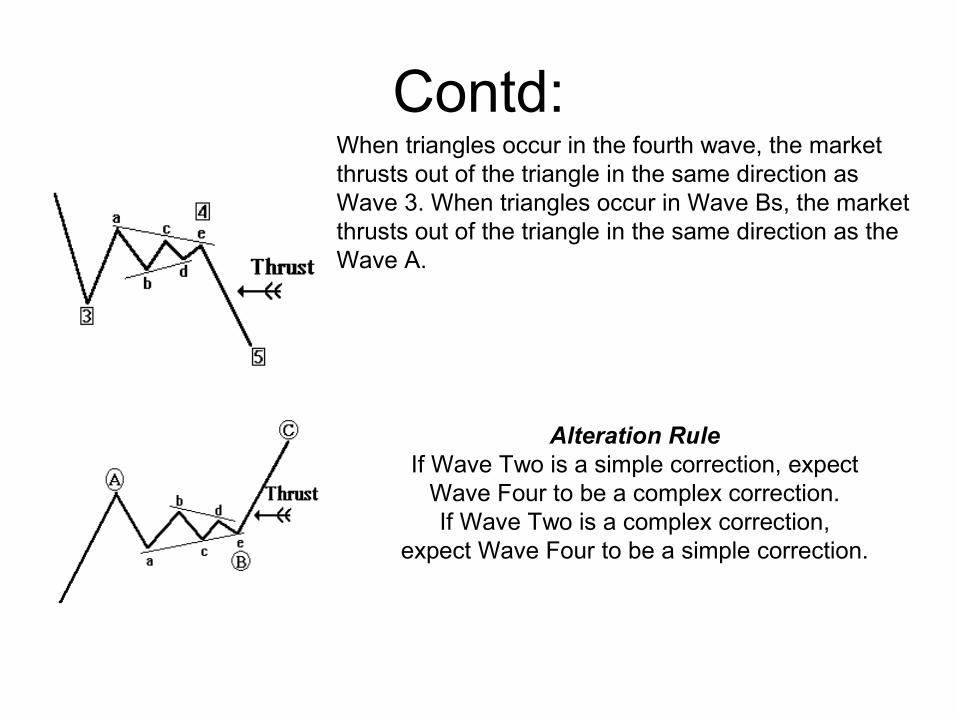
Contd:When triangles occur in the fourth wave, the market thrusts out of the triangle in the same direction as Wave 3. When triangles occur in Wave Bs, the market thrusts out of the triangle in the same direction as the Wave A.
Alteration RuleIf Wave Two is a simple correction, expect
Wave Four to be a complex correction.If Wave Two is a complex correction,
expect Wave Four to be a simple correction.
Multiple Time Frame
• Multiple time frame analysis. It sounds complicated and fancy, but it simply refers to the same chart with more than one time compression (e.g. daily or weekly). When both the weekly and the daily charts are in harmony, the chances of success can be greatly enhanced.
The essence of the strategy is easy: Use the higher time frame price activity to define the tradable trend as well as potential support and resistance levels.
•The market may look for a buy on a daily chart and a sell on the weekly chart, and vice versa. The signals in different time frames of the same market often contradict one another. Which of them will you follow? Most traders pick one time frame and close their eyes to others – until a sudden move outside of “their” time frame hits them.
Contd:• Daily charts are great, but participants can get caught up in the
move of the moment. Even though daily charts can contain random movements, they do have their strengths. Once an underlying trend is identified, daily charts can be useful to pick entry and exit points. On the other hand, weekly charts filter out the random movements and can help identify the stronger under currents that are driving the price.
The same idea applies if you are trading any security on a daily basis, in which case, the weekly bars will be the basis for the trend as well as the important support and resistance points. That is the foundation of multiple time frame trading. Besides the effectiveness of using a method based on a multiple time frame approach, another advantage is the method need not be complicated. A trader can make his or her method as simple or as complicated as desired.
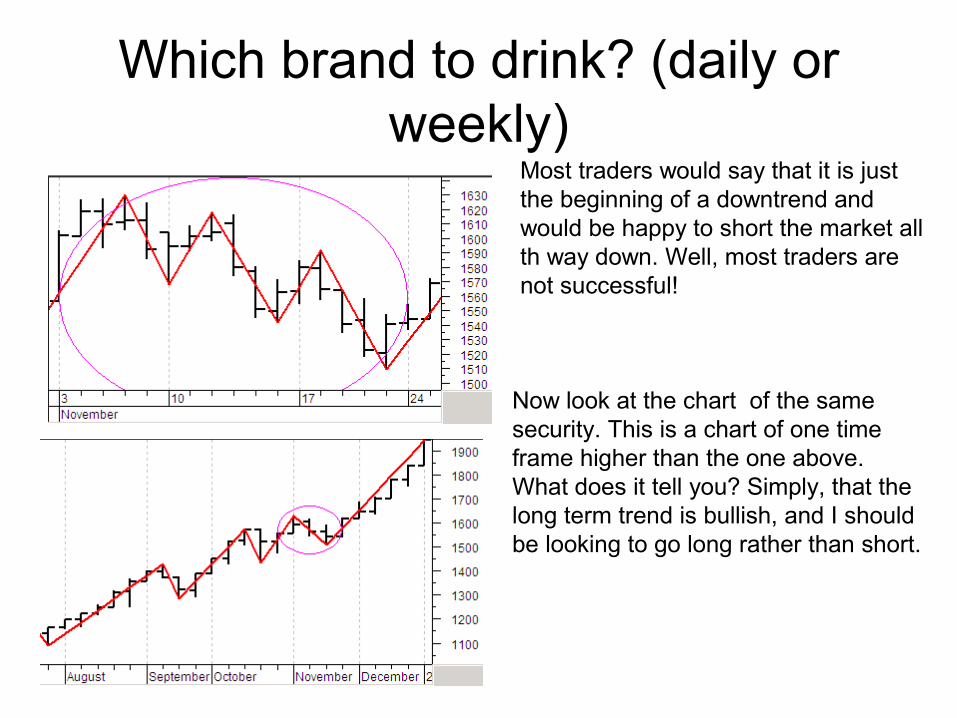
Which brand to drink? (daily or weekly)
Most traders would say that it is just the beginning of a downtrend and would be happy to short the market all th way down. Well, most traders are not successful!
Now look at the chart of the same security. This is a chart of one time frame higher than the one above. What does it tell you? Simply, that the long term trend is bullish, and I should be looking to go long rather than short.