Tech Memo REV 3-15-2010 FINAL REV2
74
Treasure Island / Yerba Buena Island Redevelopment Project Wind Evaluation 1 ESA / 209672 Technical Memorandum April 10, 2010 Technical Memorandum TO: Nancy Clark Turnstone Consulting 330 Townsend Street, Suite 216 San Francisco, CA 94107 FROM: Charles Bennett Environmental Science Associates 225 Bush Street, Suite 1700 San Francisco, CA 94104 DATE: April 10, 2010 SUBJECT: Potential Wind Conditions at Treasure Island Under the Proposed Treasure Island / Yerba Buena Redevelopment Plan Pedestrian Area Testing San Francisco, California ESA 209672 I. Introduction and Overview A series of wind tunnel tests were performed in January 2010 for the proposed Treasure Island / Yerba Buena Redevelopment Project (the Project) in the City of San Francisco. Although the Project would include development on both Islands, the changes in pedestrian level wind conditions on Yerba Buena Island due to the Project are generally expected to be both relatively small in magnitude and highly localized to individual building sites, compared to the larger scale and larger magnitude changes anticipated to occur on Treasure Island. This study therefore focused on Treasure Island; the wind tests were performed to define the pedestrian wind environment that would exist around the proposed development there. Pedestrian-level wind speeds were measured at a limited number of selected points for the Treasure Island site as it presently exists and at 200 points with the Proposed Project in place to quantify resulting pedestrian-level winds in public spaces near the Proposed Project. The north half of Treasure Island now contains primarily two-story buildings, the central part contains scattered buildings up to three and four stories in height, and the south end of the Island contains several five-story buildings and hangars that are the tallest structures on the island. For the purpose of wind testing, the existing buildings at the site that would remain after site redevelopment were considered to be part of the existing setting conditions. These include the existing elementary school in the north, the Job Corps buildings in the center, and Buildings 1, 2 and 3 in the south of the Island. In addition, the two existing four-story star-shaped structures west of the Job Corps site were also considered as part of the existing setting conditions.
Transcript of Tech Memo REV 3-15-2010 FINAL REV2

Treasure Island / Yerba Buena Island Redevelopment Project Wind Evaluation 1 ESA / 209672 Technical Memorandum April 10, 2010
Technical Memorandum
TO: Nancy Clark Turnstone Consulting 330 Townsend Street, Suite 216 San Francisco, CA 94107
FROM: Charles Bennett Environmental Science Associates 225 Bush Street, Suite 1700 San Francisco, CA 94104 DATE: April 10, 2010 SUBJECT: Potential Wind Conditions at Treasure Island Under the Proposed Treasure Island / Yerba Buena Redevelopment Plan Pedestrian Area Testing San Francisco, California ESA 209672
I. Introduction and Overview A series of wind tunnel tests were performed in January 2010 for the proposed Treasure Island / Yerba Buena Redevelopment Project (the Project) in the City of San Francisco. Although the Project would include development on both Islands, the changes in pedestrian level wind conditions on Yerba Buena Island due to the Project are generally expected to be both relatively small in magnitude and highly localized to individual building sites, compared to the larger scale and larger magnitude changes anticipated to occur on Treasure Island. This study therefore focused on Treasure Island; the wind tests were performed to define the pedestrian wind environment that would exist around the proposed development there. Pedestrian-level wind speeds were measured at a limited number of selected points for the Treasure Island site as it presently exists and at 200 points with the Proposed Project in place to quantify resulting pedestrian-level winds in public spaces near the Proposed Project.
The north half of Treasure Island now contains primarily two-story buildings, the central part contains scattered buildings up to three and four stories in height, and the south end of the Island contains several five-story buildings and hangars that are the tallest structures on the island. For the purpose of wind testing, the existing buildings at the site that would remain after site redevelopment were considered to be part of the existing setting conditions. These include the existing elementary school in the north, the Job Corps buildings in the center, and Buildings 1, 2 and 3 in the south of the Island. In addition, the two existing four-story star-shaped structures west of the Job Corps site were also considered as part of the existing setting conditions.

Treasure Island / Yerba Buena Island Redevelopment Project Wind Evaluation 2 ESA / 209672 Technical Memorandum April 10, 2010
The development of the Project at the Treasure Island site would include demolition of many of the remaining existing buildings, minor elevation changes due to grading of the building sites and streets, and the construction of the many separate building clusters with buildings ranging in height from approximately 35 to 600 feet. The Project would include construction of approximately 19 high-rise towers, among a substantial base of low- and mid-rise buildings, on Treasure Island.
Because no building designs exist at this stage of development planning, this study used a proposed representative height and massing design to represent the Project in the wind-tunnel; a bulk model of this representative design was tested to evaluate likely effects that the Project would have on the street-level wind conditions on streets and within pedestrian areas of the development, in existing facility and recreation areas, and in the proposed locations of planned parks and open spaces. The intent of the study was to determine the general wind conditions that would exist within the development and to determine whether they would be compatible with the uses proposed at the site.
The Proposed Project would allow for flexibility in the shape and precise location of the towers; tower volumes may change as specific building designs are proposed. Although different building configurations will result in different ground-level wind effects, this study provides a solid basis for understanding the general street-level wind conditions that would result in pedestrian spaces from the overall massing of Project buildings.
Summaries of the test results and the study conclusions follow. Details of the background and test methods are presented in this technical memorandum in Section II, Background. The test results and discussion are presented in Section III, Test Cases and Study Results.
Summaries of Tests Two development scenarios were modeled and tested in the wind tunnel. The scenarios were: 1) Existing Setting, and 2) Project. Five wind directions were tested for each scenario: North-Northwest, Northwest, West-Northwest, West and South-Southeast. A relatively small number of test points (29) were measured to characterize the existing setting. These were judged to be sufficient to characterize the existing wind environment over most of the Island. Many test points (200) were measured to characterize the Project, due to the need to determine the future wind environment in more detail and with some certainty.
Although the Project site is not subject to the City of San Francisco Planning Code Section 148, the Section 148 wind hazard criterion, an equivalent wind speed not to exceed 26 mph for one hour per year, is used to evaluate a significant wind impact for the purposes of the California Environmental Quality Act (CEQA) in San Francisco. The other Section 148 wind criteria, an 11 mph pedestrian-comfort criterion and a 7 mph seating-comfort criterion, are based on wind speeds not to be exceeded 10% of the time (see detail on page 8). These Section 148 comfort criteria are not CEQA significance criteria. This study’s discussions of wind hazards and of the wind speeds exceeded 10% of the time provide the reader with a basis for comparison with these familiar wind hazard and wind comfort criteria.
Existing Setting For the purpose of wind testing, the existing setting consists generally of the existing buildings on and in the vicinity of the Project site that would remain after site redevelopment. These include the existing

Treasure Island / Yerba Buena Island Redevelopment Project Wind Evaluation 3 ESA / 209672 Technical Memorandum April 10, 2010
elementary school in the north, the Job Corps buildings in the center, and Buildings 1, 2 and 3 in the south of the Island. In addition, the two existing four-story star-shaped structures west of the Job Corps site were also considered as part of the existing setting.
Treasure Island, the Project site, is located in San Francisco Bay, where conditions are typically very windy. The average of the wind speeds exceeded only 10% of the time, as measured at the 29 existing test points, is over 16 mph; existing wind speeds range from 10 to 20 mph. The highest wind speed measured in the test (20 mph) occurs at the south end of the southern-most Job Corps building. Two (2) of the 29 points meet the Section 148 pedestrian-comfort criterion of 11 mph; one of these is located at the north entrance to Building 3 and one is in the yard of the existing school.
The wind hazard criterion of Planning Code Section 148 is exceeded at 23 of the 29 existing test locations. In addition, it is certain that the wind hazard criterion is exceeded at a very large number of other existing locations all over the Island.
Project The Proposed Project scenario consists of a representative massing for the Proposed Project added to the existing buildings that would remain after site redevelopment. These include the existing elementary school in the north, the Job Corps buildings in the center, and Buildings 1, 2 and 3 in the south of the Island. Most of the other existing buildings would be demolished. The Proposed Project would involve construction of many separate building clusters with buildings ranging in height from approximately 35 to 600 feet. The proposed Redevelopment Plan would include construction of approximately 19 high-rise towers, among a substantial base of low- and mid-rise buildings, on Treasure Island. See Figures 1 and 2.
SOURCE: PERKINS + WILL, 2010
FIGURE 1 Cityside View – Representative Massing of Proposed Project

Treasure Island / Yerba Buena Island Redevelopment Project Wind Evaluation 4 ESA / 209672 Technical Memorandum April 10, 2010
Wind speeds were measured at 200 locations within the Project and vicinity. These 200 points do not include the 6 test points that were used only to measure existing wind conditions. Of these 200 Project test points, 23 were also measured for the existing scenario. The following comparisons are made between the existing and Project wind conditions for winds measured at these 23 common locations.
With the Proposed Project, wind conditions at the exterior of the built areas would remain very windy, while wind speeds at locations within the interior of the development would generally decrease. The average of the 10% exceeded wind speeds measured for the 23 common test points would be less than 12 mph, a decrease of nearly 5 mph. Wind speeds at the common test points would range from 8 to 19 mph, with 13 of the 23 points meeting the Planning Code’s pedestrian-comfort criterion. Nine existing exceedances of the pedestrian-comfort criterion would be eliminated, one new exceedance would be created, and 12 existing exceedances would remain.
With the Project, as compared to existing conditions, wind speeds would increase at two locations; remain unchanged at two locations; and decrease at 19 locations. Wind speed increases would range up to 4 mph; wind speed decreases would range up to 10 mph. The highest wind speed (19 mph) would occur at the south end of an existing Job Corps building that fronts on Avenue C.
With the Project, the Planning Code’s wind hazard criterion would be exceeded at 2 of the 23 common test locations, 16 fewer than the existing 18 exceedances at those 23 locations. In addition, as is the case for the existing wind conditions, it is certain that the wind hazard criterion would be exceeded at many other exposed locations on the Island.
SOURCE: PERKINS + WILL, 2010
FIGURE 2 Eastside View – Representative Massing of Proposed Project
Treasure Island / Yerba Buena Island Redevelopment Project Wind Evaluation 5 ESA / 209672 Technical Memorandum April 10, 2010
Study Summary and Conclusions Comparative wind tests conclusively show that the Proposed Project would reduce wind speeds and the occurrence of wind hazards throughout most of the built area of the Project. The study also shows that the Project would have no adverse effect on winds in the open spaces outside of the built area.
Wind speeds would vary widely across the Project development area. Of course, wind speeds would remain high in the shoreline parks and open spaces, which are fully exposed to the winds approaching Treasure Island over the Bay. Since the Project would face the shoreline and the approaching Bay winds would reach the Project generally unabated, wind speeds would be higher along the Project edges and generally would diminish in the interior of the developed neighborhoods of the Project. Although the wind speeds exceeded 10% of the time would be 12 mph or more at nearly 2/3 of the 200 Project test locations, 10% exceeded wind speeds at 74 test point locations would be at or less than the 11 mph pedestrian-comfort criterion of Section 148.
Wind speeds that would occur within the interior of the Project would be similar to those found in some of San Francisco’s windier areas, such as Mission Bay.
The strong existing winds and their accompanying higher incidence of wind hazards would still occur in the exposed shoreline parks and open spaces. Existing wind hazards would continue to occur in the new Project open spaces, including a number of locations along the Cityside Waterfront Park, Cultural Park and Waterfront Plaza. These strong winds and accompanying wind hazards would not be caused by the Project, but simply reflect the overall wind environment of Treasure Island.
Of all 200 locations in the Project area that were tested in the wind tunnel, wind hazard conditions were detected at 49 of these locations (see map at Figure 4, page 29). In general, the relative incidence of wind hazards within the Project would be higher along the Project edges and wind speeds and the incidence of wind hazards generally would diminish in the interior of the Project.
Examples of locations where higher wind speeds and a higher incidence of wind hazards would occur primarily because they are located at an outer edge of the developed area include:
• west: along Cityside Avenue and the north end of the Waterfront Plaza;
• north: along 10th Street;
• east: along 4th Street, Eastside Avenue and the east end of 2nd Street; and,
• south: along the west end of 1st Street.
Within the interior of the developed area, wind hazards could be caused by local wind effects of the nearby individual high-rise towers and/or by strong incident winds that channel along street canyons, between the building masses. Examples of such locations include:
• the north end of Cityside Alley;
• along Avenue C, from 10th Street to 4th Street; and,
• along 3rd Street, between Eastside Avenue and Avenue D.

Treasure Island / Yerba Buena Island Redevelopment Project Wind Evaluation 6 ESA / 209672 Technical Memorandum April 10, 2010
The relatively high incidence of wind hazards that would occur within the Project’s central area, generally bounded by the Cultural Park, 4th Street, Avenue D, and California Avenue, may be due to several contributing causes. First, that area is open to the predominant winds from the west, which can enter through the Waterfront and Cultural Parks. Second, the Project and Job Corps buildings there are generally more widely spaced, thus offering less mass to block ground-level winds. Third, this area would have several high-rise buildings, including the tallest two towers in the Proposed Project, so adverse local wind effects caused by those high-rise towers would be expected to occur.
Comparison of Project and Existing Wind Hazards Evaluation of the Project’s changes to existing wind conditions at the 23 comparable locations shows that the Project would reduce wind speeds or the occurrence of wind hazards at all but one location, a Job Corps building on Avenue C. Based on this information and further evaluation of the basic wind data, it is judged that for all of the above examples, the overall incidence and the durations of the wind hazards that would result from the Project would be similar to, or less than, those wind hazards that now occur on Treasure Island. The longer duration Project hazards, such as the approximately half-dozen hazards of 10 hours per year, or more, that would occur on Avenues C and D in the central area, are judged to be representative of the wind hazards that can be attributed to the Proposed Project, while the rest of the wind hazards identified for the Project may be considered to be equivalent to, or less than, the many unidentified existing wind hazards on Treasure Island.
Potential to Mitigate Wind Hazards Whatever the fundamental causes of the individual wind hazards, efforts should be made to reduce the wind hazards that would occur, or to limit the exposure to those hazards by residents and visitors, in the developed areas of the Proposed Project.
It may be the case that the wind hazards may be reduced, but likely not eliminated, by design measures adopted during development. Most of the short-duration wind hazards that would occur in mid-block locations could be effectively eliminated by simple design measures and a combination of street furniture and landscaping that would protect pedestrian walkways and building entrances.
Addressing the hazards at large intersections and in open spaces would be more difficult – even problematic; given the open nature of these spaces, there may be no practical way to eliminate all wind hazards in these locations without changing the character of these open areas.
Finally, wind hazards that occur at the outer edges of the Project are also problematic, since the Project must have edges where the buildings adjoin open space and are exposed to the full force of the existing winds. Considerable effort may be necessary to develop combinations of measures that would prove effective in reducing the occurrence of those particular hazards, which may prove intractable.

Treasure Island / Yerba Buena Island Redevelopment Project Wind Evaluation 7 ESA / 209672 Technical Memorandum April 10, 2010
II. Background Bui ldings and Wind Tall buildings and large structures can strongly affect the wind environment for pedestrians. In cities, groups of structures tend to slow the winds near ground level, due to the friction and drag of the structures themselves. In general, the taller and the more densely spaced the buildings in a downtown area, the more they slow the winds near the ground.
However, a building that is much taller than the surrounding buildings, or that stands alone, can intercept and redirect winds that might otherwise flow overhead, and bring them down the vertical face of the building to ground level, where they create ground-level wind and turbulence. These redirected winds can be relatively strong and also relatively turbulent, and can be incompatible with the intended residential or commercial uses of nearby ground-level spaces. Moreover, high-rise structure designs that present tall flat surfaces that intercept strong winds can create ground-level winds that can be hazardous to pedestrians in the vicinity.
On one hand, clustered buildings can improve wind conditions at street level; on the other hand, tall buildings can cause wind problems for pedestrians. The result depends upon the specifics of the situation.
For development at Treasure Island, most of the proposed buildings would be more closely spaced, taller and much larger than the existing, scattered buildings they would replace. The Project would add clustered low-rise, mid-rise and high-rise development to the Island in the middle of the Bay. Among the new buildings would be approximately 19 proposed high-rise towers, each of which would be large enough to cause ground-level wind problems for pedestrians, even if these towers were to stand alone. Because the Project Area would be so large and because winds here are known to be strong, it is expected that the Project would result in substantial changes in street-level wind conditions over the developed area of the Island. Furthermore, because the existing winds here are known to be strong, the potential exists for the Project to result in adverse or hazardous street-level winds in pedestrian areas.
Wind tunnel testing was used to determine if unsuitably strong winds would occur if the Project is built.
Wind Speed and Pedestrian Comfort 1 The comfort of pedestrians varies under different conditions of sun exposure, temperature, clothing, and wind speed. Winds up to four miles per hour (mph) have no noticeable effect on pedestrian comfort. With speeds from 4 to 8 mph, wind is felt on the face. Winds from 8 to 13 mph will disturb hair, cause clothing to flap, and extend a light flag mounted on a pole. Winds from 13 to 19 mph will raise loose paper, dust, and dry soil, and will disarrange hair. For winds from 19 to 26 mph, the force of the wind will be felt on the body. With 26 to 34 mph winds, umbrellas are used with difficulty, hair is blown straight, there is
1 Lawson, T.V. and A.D. Penwarden, “The Effects of Wind on People in the Vicinity of Buildings,” Proceedings of the Fourth
International Conference on Wind Effects on Buildings and Structures, London, 1975, Cambridge University Press, Cambridge, U.K., 605-622 1976.

Treasure Island / Yerba Buena Island Redevelopment Project Wind Evaluation 8 ESA / 209672 Technical Memorandum April 10, 2010
difficulty in walking steadily, and wind noise is unpleasant. Winds over 34 mph increase difficulty with balance and gusts can blow people over.
San Francisco Planning Code Requirements San Francisco Planning Code Section 148, Reduction of Ground-Level Wind Currents, outlines wind reduction criteria for C-3 zoning districts. Although Treasure Island is not located in a C-3 district, the Section 148 requirements are used for evaluation of wind impacts for the purposes of CEQA in San Francisco. The analysis of the Proposed Project was performed using the wind testing analysis and evaluation methods used for Section 148, a copy of which is attached to this memorandum.
The Planning Code requires buildings to be shaped so as not to cause ground-level wind currents to exceed defined comfort and hazard criteria. The comfort criteria are that wind speeds will not exceed, more than 10% of the time year-round between the hours of 7 a.m. and 6 p.m., 11 mph in substantial pedestrian use areas, and 7 mph in public seating areas. The Planning Code defines these wind speeds in terms of equivalent wind speeds2, an average wind speed (mean velocity), adjusted to include the level of gustiness and turbulence. Similarly, the hazard criterion of the Code requires that buildings not cause the equivalent wind speeds to reach or exceed the hazard level of 26 mph as averaged for a single full hour of the year. The comfort criteria are based on wind speeds that are measured and averaged for one minute; this is the same basis for the extensive wind speed data in the meteorological record for San Francisco. In contrast, the hazard criterion is based on winds that are measured and averaged for one hour; when stated on the same averaging time basis as the comfort criteria winds and the wind data in the meteorological record, the hazard criterion speed is restated as a one-minute average of 36 mph3.
Existing Climate and Wind Conditions Treasure Island and Yerba Buena Island are located in the middle of the Bay, between San Francisco and Oakland. They are fully exposed to strong storm winds from every direction, and their direct exposure to the Golden Gate, approximately 6 miles to the west, also places them in the path of the strong regular afternoon winds generated by the combination of large-scale climatic, meteorological and topographic conditions in the Bay Area.
The speed and turbulence of winds that reach Treasure Island and Yerba Buena Island are affected by topography and features of the lands and the Bay that lie upwind. Winds that move over the water or over land encounter surface roughness and take on differing wind speed profiles due to differing topography, vegetation, and structures that all act to slow the wind near the ground and create turbulence. However, when those winds reach large areas of smooth, flat surfaces, such as open land or the open waters of the Bay, wind speeds near the surface of the ground or water will increase and the level of turbulence will decrease.
2 Equivalent mean wind speed is defined as the mean wind speeds, multiplied by the quantity (one plus three times the
turbulence intensity) divided by 1.45. This amplifies the equivalent mean wind speed values when turbulence intensity is greater than 15%.
3 Arens, E. et al., “Developing the San Francisco Wind Ordinance and its Guidelines for Compliance,” Building and Environment, Vol. 24, No. 4, p. 297-303, 1989.
Treasure Island / Yerba Buena Island Redevelopment Project Wind Evaluation 9 ESA / 209672 Technical Memorandum April 10, 2010
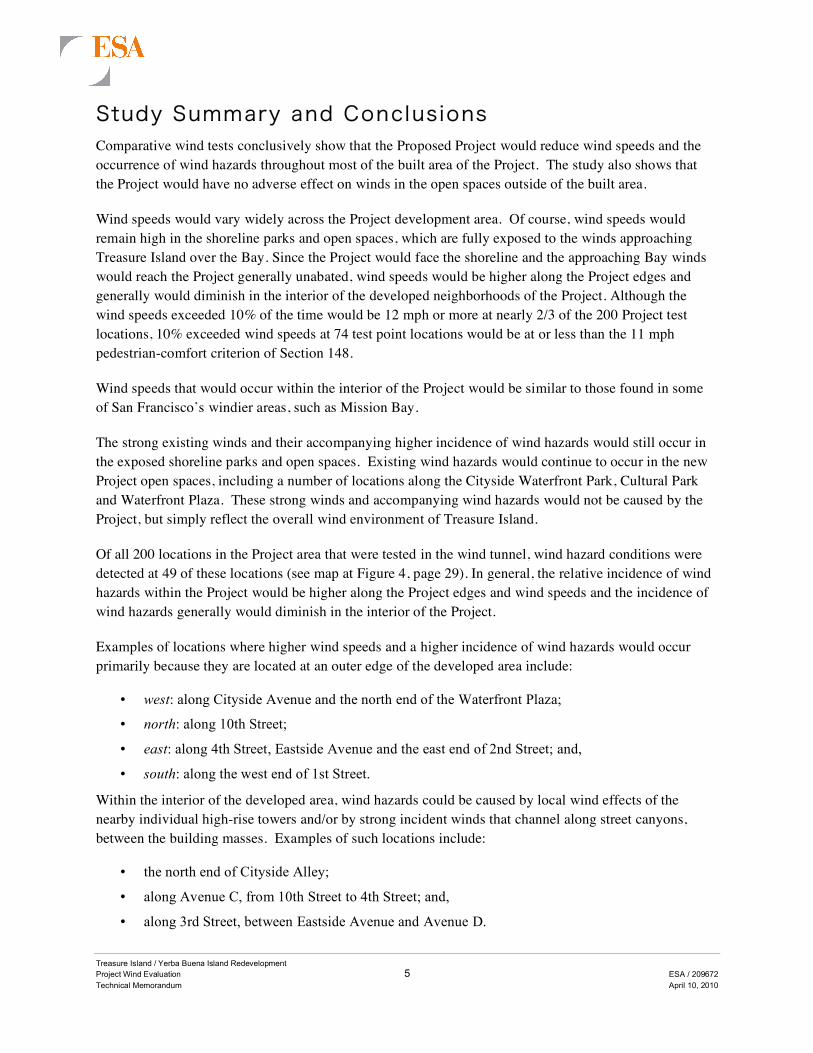
Winds that reach Treasure Island first encounter the berms, ground-surfaces, and the low-rise development that occupies much of the Treasure Island; these features slow the winds close to the surface, but leave higher-velocity winds higher above the ground surface unaffected. Thus, conditions on the Island can be characterized as very windy.
Existing wind conditions Because there is existing development and vegetation on Treasure Island, street-level wind conditions on the Island will vary by location, according to the amount of wind sheltering that is provided by the various types and densities of buildings and vegetation that now exist. As shown by the numerical results of the wind testing, the west is the predominant wind direction; therefore, this review focuses on west wind access to the island and the development along the western (upwind) edge of the island:
• From the north end of the island to 9th Street and from Perimeter Road to approximately 500 yards inland, development consists primarily of 2-story buildings – most are multi-family residential buildings. Those closest the Bay are generally grouped and aligned to face the Bay, placing the long side parallel to the shoreline. This exposes the Bay side to the prevailing winds and provides wind sheltering on the island side of the building. The pattern of development provides street-width openings for winds from the Bay. Because these buildings are 1) grouped together in sixes and eights, 2) oriented long side to the shore, 3) all of similar height, and 4) have few straight-through streets, they likely provide reasonable wind sheltering within the overall area.
There is less sheltering on the leeward of this area, with wind speeds increasing over vacant inland areas.
Scattered industrial buildings up to three stories in height occupy locations within the street grid, north of 9th Street between Avenue E and the eastern shore. These appear to provide sheltering similar to that in the residential area to the west.
• Between 9th Street and 4th Street, the area west of Avenue B is open space, while the area between Avenue B and Avenue D is occupied by large 3- and 4-story buildings, including the two four-story star-shaped structures west of the Job Corps, as well as the major Job Corps buildings. These buildings are interspersed with trees with canopies that reach above the buildings. These buildings and trees should provide good wind sheltering within the central part of this area. However, along 9th Street and 4th Street, the frontages are open parking lots that each provide a 50-yard-wide openings for winds off the Bay, which can flow freely along these street corridors.
The wind speed can increase as it passes over the baseball fields east of Avenue D.
Scattered industrial buildings up to three stories are located between 5th and 4th Streets between Avenue D and the eastern shore. These appear to provide wind sheltering similar to the industrial area to the north.
• South of 4th Street, the southern portion of the island is occupied by scattered large buildings up to 5 stories in height and substantial plantings of mature trees. Included are Building 1 and the more-massive Buildings 2 and 3, all of which are approximately 60 to 80 feet high. Together, these buildings and trees provide substantive wind sheltering, however, there are open areas that are sufficiently large that they allow wind speeds to recover and increase.
• Due to topography and dense vegetative cover, winds affect primarily the windward side of Yerba Buena Island, but the primary effect is localized by the local topography and the substantial sheltering provided by the stands of mature trees.
Currently, the speed of the incident wind at street level is materially reduced by the two-story multi-family residential development as the wind reaches into the developed areas at the north end of Treasure Island. More-substantial wind speed reductions occur in the more protected areas in the central and southern parts of the island. The diminished winds then increase again as they pass over vacant or open areas on the island. Once winds reach the east shore of the Island and move over the water, wind speeds

Treasure Island / Yerba Buena Island Redevelopment Project Wind Evaluation 10 ESA / 209672 Technical Memorandum April 10, 2010
increase, until they reach the shore and low-lying areas of the East Bay. Regardless, the wind resistance (the surface roughness) of the existing development and vegetation on the island still reduces the speed of the wind to less than its speed over the open Bay and to less than its speed over the vacant areas of the Island.
The topography and dense vegetative cover of Yerba Buena Island determine ground level wind conditions in response to winds; any given wind will affect primarily the windward side of the island, but the major effect at pedestrian level will be localized and its magnitude determined by the sheltering provided by the local topography and stands of mature trees. Due to the structure of the winds in the atmosphere, the higher elevations on Yerba Buena Island are exposed to higher-speed winds than are lower elevations. Because the individual clusters of development proposed for Yerba Buena Island are not grossly different in size and scale from the existing development, few changes in wind conditions with respect to existing wind conditions are anticipated. Any differences in wind conditions before and after development would be highly localized and exclusively due to the size, shape and orientation of the individual buildings proposed for a given site.
Available Wind Data - San Francisco Average winds speeds in San Francisco, as in most of the Bay Area, are highest in the summer and lowest in winter. However, the strongest peak winds occur in winter. The highest average wind speeds occur in mid-afternoon and the lowest in the early morning. Westerly to northwesterly winds are the most frequent and strongest winds during all seasons. Of the 16 primary wind directions, four have the greatest frequency of occurrence and subsequently make up the majority of the strong winds that occur. These winds in Downtown include the northwest, west-northwest, west, and west-southwest winds.
Data describing the speed, direction, and frequency of occurrence of winds were gathered at the old San Francisco Federal Building at 50 United Nations Plaza (at a height of 132 ft.) during the six-year period, 1945 to 1950. Measurements taken hourly and averaged over one-minute periods have been tabulated for each month (averaged over the six years) in three-hour periods using seven classes of wind speed and 16 compass directions. Analysis of these data shows that during the hours from 6:00 a.m. to 8:00 p.m., about 70% of all winds blow from five of the 16 directions as follows: Northwest (NW), 10%; West-Northwest (WNW), 14%; West (W), 35%; West-Southwest (WSW), 2%; Southwest (SW), 9%; and all other winds, 28%. Calm conditions occur 2% of the time. More than 90% of measured winds over 13 mph blow from these directions.
Available Wind Data - Naval Air Station, Alameda The Islands lie within a climatological subregion of the San Francisco Bay Area Air Basin where the marine air that travels through the Golden Gate, as well as across San Francisco and the San Bruno Gap, is a dominant weather factor. The Oakland-Berkeley Hills to the east cause the westerly flow of marine air to split off to the north and south of Oakland; this phenomenon tends to diminish winds in Oakland itself.
Wind data from the Alameda Naval Air Station (now closed) meteorological station (at a height of 22 ft.) show that the predominant wind flow for the higher speed components of the wind is generally from the west; winds from the WSW, W and WNW account for nearly 40% of winds, each with mean wind speeds

Treasure Island / Yerba Buena Island Redevelopment Project Wind Evaluation 11 ESA / 209672 Technical Memorandum April 10, 2010
between 10.0 and 10.5 mph. Average wind speeds vary from season to season with the strongest average winds occurring during summer and the lightest average winds during winter. In addition to West winds, higher velocity winds from NNW and SSE are often associated with storms. Together, the W, NNW and SSE winds are the most frequent winds that exceed 25 mph.
Application of Wind Data to Treasure Island No satisfactory long-term wind data are available from a suitable meteorological station on Treasure Island. In the absence of a satisfactory wind record, data from a suitable substitute station can be used. The speed and the direction of winds at Treasure Island are expected to differ from the speed and the direction of the winds at the Civic Center of San Francisco (Downtown station), at Ft. Funston, and the San Francisco International Airport, all stations with qualified meteorological data. The winds in the Civic Center are affected by the topography and surface roughness of the City, which substantially alter the direction and slow the speed of the winds that reach Downtown. Winds at Ft. Funston reflect an open ocean exposure, with no shaping by the topography of the sea-level gap at the Golden Gate. Winds at San Francisco International Airport are strongly focused by the topography of the San Bruno Gap, which substantially alters the direction of those winds. These local effects are substantial enough to make these wind records unsuitable to represent wind conditions at Treasure Island.
The meteorological station nearest to Treasure Island was the Alameda Naval Air Station (NAS Alameda), located on the northern end of Alameda Island, some two miles southeast of the Bay Bridge. The NAS Alameda meteorological tower was located approximately 4 miles southeast of the center of Treasure Island. Similar to Treasure Island, NAS Alameda is at the edge of the Bay and has an open water exposure to the west. The distance from the meteorological tower west to the Bay shoreline was approximately 0.8 mile, which is more than the 0.7 mile east-west width of Treasure Island. The open-water distance from the ANAS shoreline west to San Francisco is 2.7 miles, whereas Treasure Island is directly open to the Golden Gate, nearly 6 miles to the west. Thus, NAS Alameda has: 1) less fetch over open water to the west, which tends to reduce wind speed reaching the shore; and; 2) more fetch over flat land to the west, which tends to further reduce speed reaching the tower. Although the magnitude of these reductions may not be large, these two factors tend to reduce the speed of the on-shore west winds that reach the meteorological tower at NAS Alameda. In addition to the potential speed differences, wind direction differences also can result, primarily as a result of Bay Area climatic and topographic factors, as discussed below, as well as the presence of Yerba Buena Island upwind of NAS Alameda.
Given the proximity to Treasure Island and the similar exposure to the Bay, the long-term wind record from NAS Alameda is judged to be a reasonable substitute for the unavailable Treasure Island wind record. However, it also appears that the winds at Treasure Island may have a higher velocity than those measured at NAS Alameda, due to the longer fetch of open waters of the Bay to the west, and a shorter fetch over flat land to the west. Each of these two factors tends to reduce the speed of the west winds that reached the NAS Alameda meteorological tower. However, a balancing factor is that the existing buildings and vegetation on Treasure Island combine to reduce wind speed as wind passes over the island; there is no similar development or vegetation at NAS Alameda. Considering these balancing factors, it is concluded that the NAS Alameda wind record indicates wind speeds that are similar to and possibly higher than the existing speeds at the Project sites on Treasure Island. Thus, the use of the NAS Alameda data should provide a conservatively high estimate of existing wind speeds on the Island.

Treasure Island / Yerba Buena Island Redevelopment Project Wind Evaluation 12 ESA / 209672 Technical Memorandum April 10, 2010
The directional shift in west winds as the air mass flow diverges in the East Bay is likely to mean that winds that occur at Treasure Island are rotated somewhat to the north, compared to the direction of winds recorded at NAS Alameda. From an on-line review of historic wind direction data from the SF Bay Wind Archives4, the magnitude of this shift appears to vary with wind direction, but appears to range from approximately 0 degrees to 10 degrees. For this study, which focuses primarily on the higher speed winds, this directional shift is judged to be significant enough to affect these results.
Model and Wind Testing Protocols A 1-inch to 50-foot scale model of the Treasure Island, as well as a substantial upwind and downwind reach into the Bay, was constructed in order to simulate the Project and its existing and future contexts. The scale model of the Project and surrounding area was provided by ESA. The Project test model was constructed by ESA from plans provided by the Project architects. The scale models were then tested in a boundary layer wind-tunnel facility at the University of California-Davis, under the direction of Bruce White, Ph.D. These wind tests, however, were performed independent of the University.
Wind Directions Wind directions on Treasure Island differ from those at the old Weather Bureau site Downtown (where wind speed distribution data most-frequently used for analysis under Planning Code Section 148 were gathered). For tests in the Downtown, typically three wind directions (W, NW and WNW) are tested, with SW wind tested only for locations with open upwind exposures to that direction, such as south of Market, Mission Bay and Candlestick. These are usually sufficient to establish conformance to both the comfort and the hazard criteria of Section 148. However, for purposes of hazard criterion evaluation alone, Treasure Island’s exposures to strong northerly and possibly southerly winds are considered important, especially at open sites along the eastern waterfront, and site exposure to strong southerly winds could be important along the oceanfront and avenues.
Given the location and exposure of the Treasure Island site, the wind hazard evaluation requires consideration of NNW, NW, WNW, W and SSE winds. Although the island is exposed to SW winds over the Bay, the higher-speed component of the SW wind, which is important for wind tests of projects located at south of Market sites, is expected to be substantially reduced by the mass of the buildings in San Francisco’s Downtown core, so wind testing for Treasure Island omitted the SW wind. To allow maximum flexibility in this test, the Project was tested for each of five major wind directions, W, NNW, SSE, NW and WNW. This considered all directions that have high-speed components that may interact with the proposed street grid and development bulks on the island, and also will provide enough directional information to allow comparison of the results with the typical outputs from the Section 148 analysis for north of Market buildings Downtown. The wind speed profile (wind velocity as a function of height above the ground) was measured on the Island for each wind direction.
4 SF Bay Wind Archives, http://sfports.wr.usgs.gov/cgi-bin/wind/windarchive.cgi, accessed Sept. 2009

Treasure Island / Yerba Buena Island Redevelopment Project Wind Evaluation 13 ESA / 209672 Technical Memorandum April 10, 2010
Test Scenarios Two development scenarios were modeled and tested in the wind tunnel. The scenarios are: 1) Existing Setting, and 2) Proposed Project.
Due to the isolation of the Island, the only cumulative development projects that could relate to the Proposed Project are: 1) proposed replacement of existing on/off ramps from the Bay Bridge to the east side of Yerba Buena Island; 2) construction and operation of a 400-berth marina in Clipper Cove, approved in 2006, but not yet built; and, 3) completion of the new eastern span of the Bay Bridge and removal of the existing bridge. It is not likely that these projects could result in measurable pedestrian wind effects on Treasure Island because the marina would consist of relatively low structures at the south end of Treasure Island and the Bay Bridge is about two thousand feet south of Treasure Island. Therefore, neither should have an appreciable effect on winds on Treasure Island. Therefore, a cumulative scenario was not included in the test scenarios for the Proposed Project.
Test Procedure The test procedure consisted of orienting the selected configuration of the model in the atmospheric boundary layer wind-tunnel and measuring the wind speed at each of the test locations with a hot-wire anemometer. Hot-wire measurements were taken at most of the same surface points for all test configurations and wind directions.
The wind tunnel allows testing of natural atmospheric boundary layer flow past surface objects such as buildings and other structures. The tunnel has an overall length of 22 meters (m) (72 feet), a test section of 1.22 m (4 feet) wide by 1.83 m (6 feet) high, and an adjustable false ceiling. The adjustable ceiling and turbulence generators allow speeds within the tunnel to vary from 1 meter per second (m/s) to 8 m/s, or 2.2 mph to 17.9 mph.
Wind-speed measurements at each test location were made with a hot-wire anemometer, an instrument that directly relates rates of heat transfer to wind speeds by electronic signals that are proportional to the magnitude and steadiness of the wind. The hot-wire probe was calibrated to an accuracy of within 2% before the test procedure was begun. The hot-wire probe measured the analog voltage for approximately 30 seconds at each test location. When converted to digital signals, this measurement provided approximately 30,000 individual voltage samples that were averaged and the root mean square calculated for each test location. These data, when converted to velocity using the calibration curves, provided the mean velocity and turbulence5 values used to calculate the equivalent wind speed. By measuring both the mean wind speeds and corresponding turbulence intensities, high wind speeds and gustiness (changes in wind speeds over short periods of time) could be determined. The ratio of near-surface speed to reference wind speed was calculated from the hot-wire measurements. The inherent uncertainty of measurements made with the hot-wire anemometer close to the surface of the model is ±5% of the true values.
These values were compared with the free stream wind as measured in the wind tunnel. As a result, each wind-tunnel measurement resulted in a ratio (called a R-value) that relates the speed of ground-level wind
5 Turbulence Intensity = RMS/Mean Velocity

Treasure Island / Yerba Buena Island Redevelopment Project Wind Evaluation 14 ESA / 209672 Technical Memorandum April 10, 2010
to the speed at the reference elevation, in this case the height of the NAS Alameda meteorological tower (22 feet). These ratios were the output data from the wind-tunnel tests.
Wind Analysis Program These output data were reduced using a computer program that evaluated the contribution from each tested wind direction to the total wind speed output ratios to account for the differences between the boundary layer profile in the wind-tunnel and the profile as measured at the meteorological station. To better match the directional and speed frequency distribution of the wind at Treasure Island, this protocol uses the wind record data from NAS Alameda as being more representative, and a computer program based on the NAS Alameda wind speed and direction distribution data and the data for W, NNW and SSE winds to determine Project compliance with the one-hour per year wind hazard criterion. The program then computed the equivalent wind speed that conforms to the selected criterion; either the wind speed exceeded 10% of the time or the wind speed exceeded one hour or more per year. The program also computed the percentage of time that the wind would exceed the speed criterion selected, and further computed the percentage contribution of each wind direction to the equivalent wind speed and to the excess of the criterion. In addition to the computations for each tested wind direction, the program computed an average ratio and used this to compute statistics for "Other" winds, which accounted for all remaining wind directions.
Added Analysis While it was the original intent to also calculate wind speeds from the test results using the San Francisco Downtown Station data to provide a familiar basis for comparison, ultimately, it was deemed not practical to do so, because the wind speed and direction relationships between the San Francisco Downtown Station meteorological data and winds on Treasure Island could not be established with sufficient certainty. However, it is very informative to compare the R-Values for the additional NW and WNW wind directions with the R-Values from the W, NNW and SSE wind directions, in order to evaluate the sensitivity of each of the 200 locations in the development to winds from these common high-speed wind directions; this fulfills an intent of the study to clearly indicate if difficult wind problems might occur for the NW or WNW wind directions. The output of the computer program is presented in the wind-tunnel test results tables for wind speeds that would be exceeded 10% of the time and for hazardous winds. These tables, appended to this Technical Memorandum, provide the detail of the data and of the intermediate results that are described above. The wind tunnel ratios were included in the program input, and the results evaluated in the discussions that follow.
Wind Speed Profile Adjustments
The Section 148 wind test methodology implicitly assumes that the relationship between height above the ground and wind speed (referred to hereafter as the wind speed profile) is the same in the test area as at the reference weather station; for test sites in San Francisco, the reference is usually the Old Federal Building meteorological station at Civic Center. However, this test must reference the weather station at NAS Alameda, rather than the Civic Center station. The two stations are located in substantively different wind regimes.

Treasure Island / Yerba Buena Island Redevelopment Project Wind Evaluation 15 ESA / 209672 Technical Memorandum April 10, 2010
A series of detailed measurements were made in the wind tunnel to determine the wind speed profiles to be used for each wind direction - NNW, NW, WNW, W, and SSE. Wind profile adjustment factors were estimated for each of those wind directions, based on the profile measurement and upon the standard method presented in the American Society of Heating, Refrigeration and Air Conditioning Engineers (ASHRAE) Handbook, Chapter 14. The ASHRAE methodology was applied to determine the parameters and calculate the profiles for the NAS Alameda; the parameters for Treasure Island were determined using data from wind speed profiles measured in the wind tunnel above the test model for the Treasure Island site. A category was considered for each of the wind directions at the NAS Alameda meteorological station and for each of the wind directions at the Project site; due to the open nature of the site, the values were the same for all directions. They yielded the values used for alpha, the power-law exponent, and delta, the boundary-layer thickness, and ultimately the factors for normalizing that NAS Alameda meteorological data to the wind speed at Treasure Island.
For Treasure Island, a power-law exponent (alpha) of 0.14 and a boundary layer height of 750 feet were used for all wind test directions. The resulting wind speed at pedestrian level on Treasure Island is about 1.25 times the pedestrian level wind speed measured at the NAS Alameda meteorological station. The wind test cases and study results reflect the use of these adjusted values.
Wind Speed and Hazard Duration Uncertainties
Because Section 148 wind testing usually references the Old Federal Building meteorological station at Civic Center for test sites in San Francisco, the results of those many tests have much in common. The results of those wind tests for buildings in the Downtown are easily compared, and the values of wind speed and hazard duration for one building can be compared easily to those results from other building tests. A 15 mph wind speed at one Downtown building compares very well to a 15 mph wind speed at another Downtown building.
There are more uncertainties in precisely converting the testing results to wind speeds and hazard duration for this test at Treasure Island; these uncertainties may degrade the absolute accuracy of the numerical results when it comes to precisely establishing wind speed on the ground. Thus, although it may be close, a 15 mph wind speed reported in this test may not compare exactly to a 15 mph wind speed measured in a test for at a Downtown building. Whether the results match, whether they all may be slightly high, or whether they all may be slightly low, all of the values would trend the same way, and by the same percentage factor, because the uncertainty is a matter of scaling. The size of this uncertainty is expected to be of the order of ±1 mph for a reported 15 mph speed.
However for every point tested, the relative accuracy of this testing is exactly the same as for all other wind testing for San Francisco buildings. The net result is that the reported values of wind speed and hazard duration that are presented here have the same relative accuracy, one to another, as those found among the results of wind tests for buildings in the Downtown. All of the test values – wind speed and hazard duration – for the existing setting and the Proposed Project scenarios and for every point on Treasure Island are fully comparable.

Treasure Island / Yerba Buena Island Redevelopment Project Wind Evaluation 16 ESA / 209672 Technical Memorandum April 10, 2010
III. Test Cases and Study Results Introduction Pedestrian-level wind-tunnel tests were conducted for the Existing Setting and for the Proposed Project scenario. Twenty-nine (29) test point locations were measured for the Existing Setting and 200 locations were measured for the Project scenario.
Each scenario was tested for five wind directions: NNW, NW, WNW, W, and SSE. These winds are the most representative for evaluation of the Proposed Project. Wind tunnel testing results are shown here as calculated wind speeds, where those are the equivalent wind speeds6 that are exceeded 10% of the time, and these results are also shown as R-Values7, to facilitate an understanding of the directional sensitivity of the results.
Test Point Locations8 The test points on the premises of the Proposed Project site are scattered among all of the buildings and building clusters, with several points located on the perimeter of the Island (see Figures 3a and 3b). Twenty-nine (29) test point locations (points #1 - #29) were studied for the Existing Setting and 200 locations (points #7 – #206) were studied for the Project scenario. Six points (#1 - #6) were sited to indicate existing wind conditions around the existing star-shaped buildings9; since these buildings would be demolished, points #1 - #6 were not measured under the Project scenario. The remaining Existing Setting points (#7 - #29) were also measured for the Project scenario. All measurement points are color-keyed in Figures 3a and 3b as follows: 1) points #1 through #6 are in green numerals on a rectangular white fields; 2) points #7 through #29 are in white numerals on a rectangular green fields; and, 3) points #30 – 206 are black numerals on a rectangular white fields.
Special attention was paid in locating the test points to provide information about wind conditions in identified parks and open spaces, as well as along streets and pedestrian thoroughfares. For narrative purposes in identifying test point locations, Figures 3a and 3b show street names10 for the proposed development. In the narratives, some of the test points are considered more than once, since this provides useful information about wind flows along streets.
The test points were selected because they are located in areas where measurable effects caused by the Proposed Project would reasonably be anticipated. Some points are located at building corners, and on roadways and pathways that run between the buildings. Care was taken to trace turbulent winds that could originate from the 19 high-rise towers that are a part of the Project. 6 Unless otherwise noted, throughout this discussion, “wind speed” refers to an “equivalent wind speed” that is exceeded 10% of the time. An
“equivalent wind speed” is a metric defined as the mean wind speed multiplied by the quantity (1 + 3 x Turbulence Intensity) and divided by 1.45. Because high values of turbulence generally make winds much more unpleasant for people, this definition includes a factor that amplifies the calculated velocity whenever the turbulence is greater than 0.15 or 15%, a low value.
7 Each R-Value is the calculated ratio of the equivalent wind speed measured at the height of one surface point of interest (i.e., pedestrian level) to the equivalent wind speed measured at the free stream or reference height (approximately 30 inches, or a scale height of 1,500 feet) in the wind tunnel. This ratio provides a way to relate all of the surface measurements made in the wind tunnel.
8 The test point (location) numbers were arbitrarily assigned, and thus hold no significance to the analysis of wind results. 9 These existing buildings are shown as outlines between Cityside Avenue, Avenue C, 5th Street and 7th Street, on Figures 1a and 1b. 10 Street names were arbitrarily applied in this analysis for convenience in discussing wind conditions throughout the Proposed Project area.

Treasure Island/Yerba Buena Island Redevelopment . 209672
Figure 3aTest Point Locations - Proposed Project North Portion Detail
SOURCE: ESA
189
190
191
192
180
181
182
198
193
194
195
196
197
185
186
187
183
173
176
179
164
163
176
174
165
171
168
169
188
178
177
166155
162
157
158
167
150
172
184
79
80
81
76
77
78
75
74
46
4748
43
44
45
57
82
83
8491
90
56
49
59
5850
51
52
53
5460
34
29
30
85
9389
88
87
86
100
99
101
98
94
65
66
55
67
61
68
69
64
63206
97
96
109
110
102
95
103
111
108
107
73
70
72
71
40
4162
3242
31
37
36
33
35
38
39
8
10
7
9
11
104
105
106
112
113
120119
118205
116
115
130
114
121
122
15
16
12
17
92
28 1
2
3
4
5
6
9th
Stree
t
10th
Stree
t
8th
Stree
t
7th
Stree
t
6th
Stree
t
2nd
Stree
t
3rd
Stree
t
4th
Stree
t
City
sid
e A
venue
Avenue C
Avenue D
Avenue E
Avenue C
Avenue D
Avenue H
Avenue I
Avenue J
Avenue J
Avenue K
Avenue K E
asts
ide A
venue
City
sid
e A
venue
City
sid
e A
lley
Avenue C
Alle
y
Avenue D
Alle
y
X
X
X Points 1- 6 - measured for existing scenario only.
Points 7 - 29 - measured for existing and Project.
Points 30 - 206 - measured for Project only.
Job Corps Boundary

Treasure Island/Yerba Buena Island Redevelopment . 209672
Figure 3bTest Point Locations - Proposed Project South Portion Detail
SOURCE: ESA
189
190
191
192
180
181
182
198
193
194
195
196
197
185
186
187
183
173
176
179
164
163
176
174
165
171
168
169
170159
20
21
188
178
177
166155
160
161
162
201
157
23
22
199
202
156
151
158
167
150
172
184
99
101
98
9464
63206
97
96
109
110
102
95
103
111
108
107
73
72
71
40
39
8
10
7
9
11
104
105
106
112
113
120119
118205
116
115
117
129
130
114
121
122
124
14
15
16
131
128
127
126
123
132
133
134
135
147
148
13
154
12
200
153
152
17
18
19
137
139125
140 146 149
203
142
143
144
145
204
136
138
27
26
141
24
28 1
2
3
4
5
6
8th
Stree
t
7th
Stree
t
6th
Stree
t
5th
Stree
t
4th
Stree
t
2nd
Stree
t
3rd
Stree
t
3rd
Stree
t
M1 Street
1st Stre
et
California Avenue
California Avenue
B2 - B3 Alle
y
City
sid
e A
venue
Avenue C
venue E
Avenue D
Avenue C
Avenue D
Avenue D
Avenue H
Avenue I
Avenue J
Avenue J
Avenue I
Avenue K
Avenue K E
asts
ide A
venue
Avenue E
Avenue D
Alle
y
25
X
X
X Points 1- 6 - measured for existing scenario only.
Points 7 - 29 - measured for existing and Project.
Points 30 - 206 - measured for Project only.
Job Corps Boundary

Treasure Island / Yerba Buena Island Redevelopment Project Wind Evaluation 19 ESA / 209672 Technical Memorandum April 10, 2010
Wind Evaluation and Criteria Just as the wind tunnel testing was performed in accordance with the test protocols of Planning Code Section 148, as described earlier in the section Model and Wind Testing Protocols, the performance requirements of Code Section 148 were used to evaluate the results of the tests. Although compliance with the pedestrian-comfort criterion is not required, to inform the reader, the 10% exceeded wind speeds were compared to the Code’s pedestrian-comfort criterion of 11 mph for areas of substantial pedestrian use.
Separate calculations evaluated compliance with the hazard criterion. As previously noted, the wind data upon which the criterion was based were not full hour average speeds as identified by the Code, so it is necessary to adjust the wind criterion speed to obtain a valid comparison with the available data and the equivalent wind speeds based on those data. When normalized to the equivalent wind speeds used here, the hazard criterion speed is equal to 36 mph, the value used in the tables.
Throughout the text, the wind speeds reported refer to the equivalent wind speeds that would be exceeded 10% of the time when referring to the Section 148 comfort criterion, and 1 hour per year when referring to the Section 148 hazard criterion.
Test Output The basic wind-tunnel test data and the detailed outputs of the computer program were presented in tables of comfort criteria and hazard criteria evaluations for each of the two test scenarios, Existing and Project. These output tables, appended to this Memorandum, provide the detail of the data and the intermediate results described above. The wind-tunnel ratios and the wind profile adjustment factors for each wind direction were included. The results were evaluated in the discussions that follow.
Figures 3a and 3b identify the measurement point locations for the wind tunnel test.
Summary information about the wind-tunnel test results and evaluations of compliance with the comfort and hazard criteria were presented for the Existing and Project scenarios in summary Tables 1 and 2.
Table 1 presents the wind comfort analysis results, namely the measured 10% exceeded speed and the percentage of time that the comfort criterion would be exceeded for each test location and test scenario.
Table 2 presents the wind hazard analyses results, the equivalent wind speed, and the number of hours per year that the hazard criterion would be exceeded for each test location and test scenario.

Treasure Island / Yerba Buena Island Redevelopment Project Wind Evaluation 20 ESA / 209672 Technical Memorandum April 10, 2010
References Existing Proposed Project
Test
Location
Number
Wind
Comfort
Criterion
Speed,
miles/hour
Equivalent
Wind Speed
Exceeded
10% of
Time,
miles/hour
Percent of
Time Wind
Speed
Exceeds
Criterion
S
O
U
R
C
E
Equivalent
Wind Speed
Exceeded
10% of
Time,
miles/hour
Percent of
Time Wind
Speed
Exceeds
Criterion
Speed
Change
Relative to
Existing,
miles/hour
S
O
U
R
C
E
1 11 18 35 e
2 11 16 26 e
3 11 19 29 e
4 11 16 24 e
5 11 12 14 e
6 11 16 27 e
7 11 19 35 e 15 24 -4 e
8 11 16 27 e 10 8 -5 -
9 11 18 30 e 14 19 -4 e
10 11 19 34 e 15 24 -4 e
11 11 18 33 e 10 6 -8 -
12 11 16 29 e 19 32 4 e
13 11 20 32 e 9 6 -10 -
14 11 17 26 e 12 16 -4 e
15 11 16 24 e 9 3 -7 -
16 11 16 30 e 10 8 -6 -
17 11 14 21 e 8 2 -6 -
18 11 15 24 e 15 27 e
19 11 17 32 e 13 16 -4 e
20 11 11 9 10 7
21 11 19 36 e 11 11 -8 -
22 11 14 21 e 10 7 -5 -
23 11 16 25 e 11 9 -6 -
24 11 17 33 e 15 28 -2 e
25 11 18 33 e 16 27 -3 e
26 11 16 27 e 14 23 -2 e
27 11 17 33 e 12 12 -6 e
28 11 15 28 e 12 13 -3 e
29 11 10 6 13 16 3 p
Ave. of 10%Percent:
16.2 mph
27%
12.3 mph
15%
-3.9 mph
Total Exceedances: Total 27 Total 13
Subtotals by type: Existing 27 e Existing 12 e
New, due to Proposed Project 1 p
New, at new location 0 n
SOURCE: Environmental Science Associates Eliminated by Proposed Project 9 -
TABLE 1 WIND COMFORT ANALYSIS

Treasure Island / Yerba Buena Island Redevelopment Project Wind Evaluation 21 ESA / 209672 Technical Memorandum April 10, 2010
As a result, what may appear to be discrepancies in the tabular results, such as in the column sums or the differences between values for Project and existing conditions, are simply due to the rounding of results. However, the rounded values of the differences in wind speeds and the differences in hours of exceedances that are shown in Tables 1 and 2 are the best available representation of the measured changes in those quantities.
References Existing Proposed Project
Test
Location
Number
Wind
Hazard
Criterion
Speed,
miles/hour
1-hour/year
Equivalent
Wind
Speed,
miles/hour
Wind
Hazard
Criterion
Exceeded,
hours/year
S
O
U
R
C
E
1-hour/year
Equivalent
Wind
Speed,
miles/hour
Wind
Hazard
Criterion
Exceeded,
hours/year
Hazard
Hours
Change
Relative to
Existing
S
O
U
R
C
E
1 36 40 5 e
2 36 41 7 e
3 36 44 11 e
4 36 37 1 e
5 36 27
6 36 41 8 e
7 36 41 6 e 34 -6 -
8 36 41 4 e 23 -4 -
9 36 42 7 e 32 -7 -
10 36 42 7 e 34 -7 -
11 36 39 3 e 22 -3 -
12 36 34 45 15 15 p
13 36 44 12 e 33 -12 -
14 36 38 3 e 28 -3 -
15 36 37 1 e 19 -1 -
16 36 42 9 e 29 -9 -
17 36 38 3 e 17 -3 -
18 36 43 12 e 41 7 -5 e
19 36 37 1 e 29 -1 -
20 36 24 23
21 36 41 10 e 25 -10 -
22 36 37 2 e 22 -2 -
23 36 37 8 e 23 -8 -
24 36 37 2 e 36 -2 -
25 36 41 7 e 35 -7 -
26 36 34 30
27 36 38 2 e 28 -2 -
28 36 33 26
29 36 35 28
Ave. 1-hr:Total hrs:
38 mph
131 hr
29 mph
22 hr -77 hr
Total 23 Total 2
Subtotals by type: Existing 23 e Existing 1 e
. New or increased time 1 p
New, at new location 0 n
SOURCE: Environmental Science Associates Eliminated by Proposed Project 17 -
Total Exceedances:
TABLE 2 WIND HAZARD ANALYSIS

Treasure Island / Yerba Buena Island Redevelopment Project Wind Evaluation 22 ESA / 209672 Technical Memorandum April 10, 2010
Also, throughout the following discussion the wind speeds reported refer to the equivalent wind speeds that would be exceeded 10% of the time when referring to the pedestrian-comfort criterion, and winds exceeded 1 hour per year when referring to the wind hazard criterion.
Test 1: Existing Setting The north half of Treasure Island now contains primarily two-story buildings, the central part contains scattered buildings up to three and four stories in height, and the south end of the Island contains several five-story buildings and hangars that are the tallest structures on the island. Not all of these buildings were included in the test of the setting.
The existing setting consists of the existing major buildings on and in the vicinity of the Project site that would remain after site redevelopment. These include the existing elementary school in the north, the Job Corps buildings in the center, and Buildings 1, 2 and 3 in the south of the Island. In addition, the two existing four-story star-shaped structures west of the Job Corps site were also considered as part of the existing setting.
Existing Comfort Criterion Conditions Treasure Island is located in San Francisco Bay, where conditions are typically very windy. The average of the 10% exceeded wind speeds that were calculated from measurements at the 29 existing test points is over 16 mph; wind speeds range from 10 to 20 mph. The highest wind speed measured (20 mph) occurs at Test Point 13, which is at the south end of the southern-most Job Corps building. Two (2) of the 29 points meet the pedestrian-comfort criterion of 11 mph; one of these (#20) is located at the north entrance to Building 3 and one in the yard of the existing school (#29). See Table 1.
Although measurements for the existing setting were not made at many locations on the Island, it is assured that wind conditions are similar over most of the area of the island. The sparse low-rise development, flat topography, and location in the Bay all result in relatively little resistance to the movement of the wind. For these reasons, one must conclude that wind conditions sampled at the 29 test point locations well represent the relatively uniform, general wind conditions that occur over most of the area of the Island. The exceptions would be for those locations near the existing buildings, and within stands of trees and vegetation, where local wind accelerations or sheltering would occur to alter the wind speed.
Existing Hazard Conditions Under existing conditions, the Code’s wind hazard criterion is exceeded at 23 of the 29 test locations, as shown in Table 2, which indicates a total duration of hazard of 131 hours per year. However, this statistic is misleading in that it is certain that the wind hazard criterion is exceeded at a large number of other locations on the Island, so this duration is most certainly a gross underestimate of the true total duration of wind hazards under existing conditions.
Test 2: Project The Project scenario consists of a representative massing for the Proposed Project added to the existing buildings that would remain after site redevelopment. These include the existing elementary school in the north, the Job Corps buildings in the center, and Buildings 1, 2 and 3 in the south of the Island. Most of

Treasure Island / Yerba Buena Island Redevelopment Project Wind Evaluation 23 ESA / 209672 Technical Memorandum April 10, 2010
the remaining existing buildings would be demolished. The Proposed Project would involve construction of many separate building clusters with buildings ranging in height from approximately 35 to 600 feet. The proposed Redevelopment Plan would include construction of approximately 19 high-rise towers, among a substantial base of low- and mid-rise buildings, on Treasure Island.
Because no specific building designs or park designs are available at this time, this study used a proposed representative height and massing design to determine the likely effects that the development as a whole would have on the wind conditions on the streets, in the identified existing recreation areas and in the proposed locations of planned parks and open spaces. A bulk model of this representative design was constructed and tested in the wind tunnel.
The Proposed Project would allow for some flexibility in the shape and precise location of the towers; the tower volumes may shift locations within a limited range, and the shapes of the low- and mid-rise buildings could change when the development program is implemented and specific building designs are proposed. Such changes would likely alter the wind speeds that would occur at nearby locations; in some cases, the changes in towers could cause wind hazards. However, as long as the design or location changes are not large, the general wind conditions that result from the proposed representative height and massing design should reasonably represent the wind conditions that would exist within and around the Proposed Project once the specific architectural designs of the buildings have been finalized.
Comparison With Existing Setting Measurements Wind speeds were measured at 200 locations within the Project and vicinity. Of these 200 test point locations, 23 were the same as measured for the existing scenario. The following comparisons can be made between the existing and Project wind conditions for winds measured at these 23 locations.
Comfort Criterion Conditions With the Project, wind conditions at the shoreline and at the exterior of the Project would remain very windy, essentially unchanged from the existing conditions, while wind speeds at locations within the interior of the development would generally decrease. As can be seen in Table 1, the average of the 10% exceeded wind speeds measured for the 23 common test points would be less than 12 mph, a decrease of nearly 5 mph. Wind speeds at the common test points would range from 8 to 19 mph, with 13 of the 23 points meeting the Planning Code’s pedestrian-comfort criterion. Nine existing exceedances of the pedestrian-comfort criterion would be eliminated by the Project, one new one would be created, and 12 existing exceedances would remain.
Hazard Conditions Under existing conditions, the Code’s wind hazard criterion is currently exceeded at 23 of the 29 test locations, as shown in Table 2, which indicates a total duration of hazard of 131 hours per year. With the Project in place, one new wind hazard would be introduced, one existing hazard would be reduced in duration and 22 existing wind hazards would be eliminated by the Project.
Further Analysis and Comparison During wind tunnel testing, each wind tunnel measurement generates a ratio that relates the speed of surface-level wind to the speed of the free-stream wind, which is measured in the wind tunnel at a scale height in excess of 1,500 feet, near the center of the wind tunnel. These wind speed ratios (referred to here

Treasure Island / Yerba Buena Island Redevelopment Project Wind Evaluation 24 ESA / 209672 Technical Memorandum April 10, 2010
as R-values) are the primary output data of wind tunnel tests. R-values are usually substantially less than 1.0 because the speed of the lowest part of an air mass is slowed by friction as the air mass moves across buildings, vegetation, and the ground; as a result, wind speeds at pedestrian level are usually much less than the speed of the free-stream wind. In sheltered areas the R-values can be less than 0.1, indicating that wind near ground level is less than 10% of the wind high above the ground. Experience with wind testing of San Francisco buildings shows that R-values greater than 0.5 indicate very strong ground-level winds.
TABLE 3
MEASURED R-VALUES - EXISTING CONDITIONS
Existing Wind Conditions - Measured R-Values
# NNW NW WNW W SSER-Value
Average
10%
Exceed
1-hr/yr
Wind
Speed
1 0.5532 0.7168 0.7012 0.5830 0.4490 0.6125 18 40
2 0.6651 0.5287 0.4538 0.3970 0.5924 0.4930 16 41
3 0.3933 0.4246 0.4773 0.6384 0.1930 0.4333 19 44
4 0.3482 0.3949 0.5345 0.5437 0.1750 0.4120 16 37
5 0.2012 0.2324 0.2894 0.3906 0.3904 0.3257 12 27
6 0.6013 0.4873 0.3977 0.4094 0.6215 0.4790 16 41
7 0.5907 0.6676 0.6838 0.5895 0.4366 0.5944 19 41
8 0.6913 0.5948 0.4470 0.4093 0.4613 0.4781 16 41
9 0.3574 0.5262 0.5032 0.6125 0.3230 0.4912 18 42
10 0.4604 0.5128 0.6366 0.6088 0.4337 0.5480 19 42
11 0.4458 0.5203 0.5179 0.5697 0.5061 0.5285 18 39
12 0.4344 0.4671 0.6265 0.4861 0.4672 0.5117 16 34
13 0.1783 0.2829 0.4511 0.6434 0.5134 0.4727 20 44
14 0.3666 0.3951 0.4535 0.5644 0.2364 0.4124 17 38
15 0.3258 0.3231 0.5090 0.5353 0.2405 0.4020 16 37
16 0.4631 0.5188 0.4783 0.4540 0.6401 0.5228 16 42
17 0.4008 0.5454 0.3056 0.3978 0.5764 0.4563 14 38
18 0.5001 0.4609 0.2550 0.3967 0.6588 0.4429 15 43
19 0.5395 0.6192 0.5686 0.4998 0.5283 0.5540 17 37
20 0.2228 0.2484 0.3142 0.3600 0.2179 0.2851 11 24
21 0.5514 0.5739 0.6015 0.5836 0.5898 0.5872 19 41
22 0.6279 0.3535 0.2797 0.3659 0.4842 0.3708 14 37
23 0.1821 0.1786 0.3196 0.5388 0.3722 0.3523 16 37
24 0.5232 0.6966 0.6819 0.5399 0.4916 0.6025 17 37
25 0.4092 0.6619 0.6339 0.6045 0.4596 0.5900 18 41
26 0.3872 0.5534 0.5074 0.4937 0.4355 0.4975 16 34
27 0.6025 0.5997 0.5093 0.4977 0.5409 0.5369 17 38
28 0.4998 0.4846 0.4862 0.4559 0.4465 0.4683 15 33
29 0.2400 0.3539 0.3498 0.4176 0.5333 0.4137 10 35
GREEN:
BLACK:
RED:
10
37
KEYMeets 11 mph pedstrian criterion:
Exceeds Wind Hazard critrion:
Values less than 0.3
Values between 0.3 and 0.5
Values greater than 0.5
Calculated
Wind Speeds

Treasure Island / Yerba Buena Island Redevelopment Project Wind Evaluation 25 ESA / 209672 Technical Memorandum April 10, 2010
To calculate the wind speeds, the R-values are correlated to the actual wind speeds measured at the meteorological station for each wind direction, and then converted into representative values of wind speed at the Project test location, in the same way as is done to compute wind speeds that are compared with wind comfort and safety criteria under the Planning Code. However, the R-values themselves are useful for making relative comparisons of the wind speeds among directions or at any two locations in a given wind test.
TABLE 4
MEASURED R-VALUES - PROJECT CONDITIONS
Project Wind Conditions - Measured R-Values
# NNW NW WNW W SSER-Value
Average
10%
Exceed
1-hr/yr
Wind
Speed
1
2
3
4
5
6
7 0.3246 0.3726 0.5364 0.4984 0.3489 0.4391 15 34
8 0.2183 0.3483 0.3639 0.3283 0.3470 0.3469 10 23
9 0.2119 0.2527 0.3399 0.4646 0.2185 0.3189 14 32
10 0.3787 0.5528 0.4990 0.4985 0.2571 0.4519 15 34
11 0.2783 0.2578 0.3775 0.2856 0.3333 0.3136 10 22
12 0.3262 0.4915 0.4476 0.6623 0.3724 0.4935 19 45
13 0.1529 0.1818 0.4474 0.2622 0.4967 0.3470 9 33
14 0.3226 0.2923 0.2811 0.4122 0.2354 0.3053 12 28
15 0.2988 0.3432 0.2318 0.2635 0.2468 0.2713 9 19
16 0.3679 0.3897 0.3873 0.2625 0.4469 0.3716 10 29
17 0.2757 0.2541 0.2969 0.2372 0.2101 0.2496 8 17
18 0.3556 0.5648 0.4667 0.4560 0.6229 0.5276 15 41
19 0.3688 0.4472 0.3956 0.3711 0.4405 0.4136 13 29
20 0.2618 0.3126 0.2501 0.3351 0.2284 0.2816 10 23
21 0.2686 0.2430 0.2603 0.3700 0.2582 0.2829 11 25
22 0.3402 0.2636 0.2889 0.3066 0.2358 0.2737 10 22
23 0.2023 0.1645 0.2807 0.3361 0.3230 0.2761 11 23
24 0.4395 0.5242 0.5387 0.4456 0.5373 0.5115 15 36
25 0.3647 0.5628 0.5684 0.5045 0.4332 0.5172 16 35
26 0.3220 0.4755 0.3841 0.4443 0.4148 0.4297 14 30
27 0.3979 0.3753 0.2654 0.3215 0.4322 0.3486 12 28
28 0.4188 0.3192 0.3217 0.3402 0.3758 0.3392 12 26
29 0.2222 0.3711 0.3498 0.4176 0.2936 0.3580 13 28
GREEN:
BLACK:
RED:
10
37
KEY
Values less than 0.3
Values between 0.3 and 0.5
Values greater than 0.5
Meets 11 mph pedstrian criterion:
Exceeds Wind Hazard critrion:
Calculated
Wind Speeds
Existing locations covered by Project buildings.

Treasure Island / Yerba Buena Island Redevelopment Project Wind Evaluation 26 ESA / 209672 Technical Memorandum April 10, 2010
The measured R-values and the calculated wind speed statistics (from Table 1 and Table 2) are combined in Tables 3 and 4, which present the R-Values for all five wind directions (NNW, NW, WNW, W and SSE) as well as the calculated wind speeds and statistics, which are based only on three of the wind directions – NNW, W and SSE. However, the R-values for NW and WNW winds can be compared to the R-values for W wind to understand the relative wind speeds that could result from those winds. Table 3
TABLE 5
COMPARISON OF PROJECT AND EXISTING CONDITIONS
Project R-Values - as Percent of Existing
# NNW NW WNW W SSER-Value
Average
10%
Exceed
1-hr/yr
Wind
Speed
1
2
3
4
5
6
7 55% 56% 78% 85% 80% 75% 81% 83%
8 32% 59% 81% 80% 75% 74% 66% 57%
9 59% 48% 68% 76% 68% 65% 75% 76%
10 82% 108% 78% 82% 59% 82% 80% 82%
11 62% 50% 73% 50% 66% 60% 54% 56%
12 75% 105% 71% 136% 80% 98% 124% 133%
13 86% 64% 99% 41% 97% 75% 48% 74%
14 88% 74% 62% 73% 100% 77% 75% 73%
15 92% 106% 46% 49% 103% 76% 56% 52%
16 79% 75% 81% 58% 70% 71% 64% 70%
17 69% 47% 97% 60% 36% 60% 56% 46%
18 71% 123% 183% 115% 95% 129% 102% 95%
19 68% 72% 70% 74% 83% 75% 75% 80%
20 118% 126% 80% 93% 105% 101% 96% 93%
21 49% 42% 43% 63% 44% 48% 59% 61%
22 54% 75% 103% 84% 49% 78% 69% 58%
23 111% 92% 88% 62% 87% 82% 65% 63%
24 84% 75% 79% 83% 109% 87% 86% 96%
25 89% 85% 90% 83% 94% 88% 85% 84%
26 83% 86% 76% 90% 95% 87% 90% 90%
27 66% 63% 52% 65% 80% 65% 68% 74%
28 84% 66% 66% 75% 84% 73% 78% 80%
29 93% 105% 100% 100% 55% 90% 130% 81%
GREEN:
BLACK:
RED:
60%
133%
KEYLess than 70% of existing:
More than 110% of existing:
Values less than 30% of existing.
Values between 30% and 50% of existing.
Values greater than 110% of existing.
Calculated Wind
Speed, as % of
Existing
Existing locations covered by Project buildings.

Treasure Island / Yerba Buena Island Redevelopment Project Wind Evaluation 27 ESA / 209672 Technical Memorandum April 10, 2010
presents the measured R-values and the calculated wind speed information about the existing setting, while Table 4 presents the same information about the Project.
From inspection and comparison of Tables 3 and 4, it is evident that there are substantial differences in the wind conditions between the existing setting and the Project. Table 5 compares the percentage changes between measured R-values and the calculated wind speed statistics for the existing and Project scenarios. As is evident from Tables 1 through 5, general reductions in wind speed would occur at most of the 23 common wind measurement locations.
Analysis of Project Test Data For the remainder of the 200 test point locations, where there are no paired measurements of existing setting and Project data, the analysis of these data yields basic information about the general wind conditions that would occur within the proposed Redevelopment. Note that while the general wind conditions and trends discussed here result partly from the overall configuration of the massing of development under the Redevelopment Plan, the specific wind speed and/or hazard that occurs at any test location is strongly influenced by the nearby structures as part of the overall development. The details of these results come from wind-tunnel testing of a specific model design - the representative massing model of the Proposed Project, as illustrated in Figures 1 and 2. Thus, the wind test produced results that are specific to that design. However, the Proposed Project would allow for some flexibility in the shape and precise location of the towers; tower volumes may change as specific building designs are proposed. Although different building configurations will result in different ground-level wind effects, some changes in building configurations would produce minor differences in wind conditions while others could produce major differences in wind conditions. It would be necessary to evaluate the changes in building configurations carefully.
General Discussion With the Proposed Project, wind speeds would vary widely across the development area. Of course, higher wind speeds would still occur in the shoreline parks and open spaces, which are now, and would remain fully exposed to the winds approaching over the Bay. The Project buildings would face the shoreline and, although set back from the Bay itself, would intercept the approaching winds that would reach the Project generally unabated. Therefore, wind speeds would be higher along the Project edges and generally would diminish in the interior of the developed neighborhoods of the Project. Although the wind speeds exceeded 10% of the time would be 12 mph or more at nearly 2/3 of the 200 test locations, wind speeds at 74 test point locations would be at or less than the 11 mph pedestrian-comfort criterion of the Planning Code.
Wind speeds that would occur within the interior of the Project would be similar to those found in a number of San Francisco’s windier areas.
The strong existing winds and their accompanying higher incidence of wind hazards would still occur in the exposed shoreline parks and open spaces. Wind hazards would continue to occur in the new Project open spaces, including a number of locations along the Cityside Waterfront Park, Cultural Park and Waterfront Plaza. These strong winds and accompanying wind hazards would not be caused by the Project, but would simply reflect the overall wind environment of Treasure Island.

Treasure Island / Yerba Buena Island Redevelopment Project Wind Evaluation 28 ESA / 209672 Technical Memorandum April 10, 2010
Of all 200 locations that were tested in the wind tunnel, wind hazard conditions were detected at 49 of these locations. The locations of the wind hazards are shown in Figure 4. The image clearly shows the overall distribution of the wind hazards around and within the Proposed Project development area. This overall perspective is helpful in understanding the discussions that follow.
In general, the incidence of wind hazards would be higher along the Project edges and the relative frequency of wind hazards generally would diminish in the interior of the Project, except for the particular wind effects of open exposures to winds from the Bay, of the effects of tall buildings or of the effects of strong incident winds channeling between the building masses and along the street canyons.
Potential to Mitigate Wind Hazards Whatever the fundamental causes of the individual wind hazards, substantive efforts should be made to reduce the wind hazards that would occur, or to limit the exposure to those hazardous winds by residents and visitors, in the developed areas of the Proposed Project.
Wind hazards due to Project towers or to wind channeling among the building masses and street canyons may be reduced, but may not be totally eliminated, by design measures adopted during development. Many of the smaller wind hazards that occur mid-block could be effectively eliminated by simple design measures and a combination of street furniture and landscaping that would protect pedestrian walkways and building entrances.
Addressing the hazards at large intersections and in open spaces would be more difficult – even problematic; given the open nature of these spaces, there may be no practical way to eliminate all wind hazards without completely changing the character of these open spaces.
Finally, wind hazards that occur at the developed edges of the Project are also problematic, since the Project must have edges where the buildings adjoin open space. Considerable effort may be necessary to develop an effective combination of measures that would reduce the occurrence of those hazards; they may prove intractable.

15
6
7
3
1
1
10
3
2
15
13
8
4
1
2
6
7
1
26
9
2
1
10
1
9
12
56
3
2
14
20
2
2
1
17
6
2
1
4
1
4
1
1
2
29
50
4
3
1
9th
Stree
t
10th
Stree
t
8th
Stree
t
7th
Stree
t
6th
Stree
t
5th
Stree
t
4th
Stree
t
2nd
Stree
t
3rd
Stree
t
4th
Stree
t
3rd
Stree
t
M1 Street
1st Stre
et
California Avenue
California Avenue
B2 - B3 Alle
y
City
sid
e A
venue
Avenue C
Avenue D
Avenue E
Avenue C
Avenue D
Avenue C
Avenue D
Avenue D
Avenue H
Avenue I
Avenue J
Avenue J
Avenue I
Avenue K
Avenue K E
asts
ide A
venue
Avenue E
City
sid
e A
venue
City
sid
e A
lley
Avenue C
Alle
y
Avenue D
Alle
y
Treasure Island/Yerba Buena Island Redevelopment . 209672
Figure 4Wind Hazard Locations and Hours Durations for
Representative Massing of Proposed Project
SOURCE: ESA
Hours Of Wind Hazard per Year
Job Corps Boundary
1

Treasure Island / Yerba Buena Island Redevelopment Project Wind Evaluation 30 ESA / 209672 Technical Memorandum April 10, 2010
Street-by-Street and Open Space Effects The following summarizes the wind conditions that would exist within the Project, given the specific design tested. Because no building designs exist at this stage of development planning, this study used a proposed representative height and massing design to represent the Project in the wind-tunnel; a bulk model of this representative design was tested to evaluate likely effects that the Project would have on the street-level wind conditions on streets and within pedestrian areas of the development, in existing recreation areas, and in the proposed locations of planned parks and open spaces. Given this, it is not necessary to discuss all of the test points in order to understand the overall wind performance of the representative design.
Review of Project Wind Conditions - Street by Street A street-by-street summary of Project wind conditions starts with the westernmost street, Cityside Avenue, and moves eastward along the parallel avenues and alleys to Eastside Avenue, as follows:
• Cityside Avenue – (16 test points: # 78, 79, 88, 89, 90, 98, 99, 108, 109, 117, 118, 119, 127, 128, 129, 139). Along Cityside Avenue, wind speeds would range from 11 to 19 mph at these locations at the western edge of the Project and directly exposed to winds from the Bay. Winds at only one (#127) of the 16 locations would meet the Pedestrian Criterion. Winds at 4 of the 16 locations (#78, 79, 98, 99) would exceed the wind hazard criterion. Their hazard durations would range from 1 to 10 hours per year.
• Cityside Alley – (18 test points: 76, 77, 80, 81, 86, 87, 91, 92, 96, 97, 100, 101, 105, 106, 107, 110, 111, 112, 115, 116, 120, 130, 131, 135, 136, 137, 138). Along Cityside Alley, wind speeds would range from 8 to 17 mph, with wind speeds lower in mid-block sections. Wind speeds would be highest at 10th, near the north end of the development. The Cityside Neighborhood Parks at 5th Street (#115, 116), at 6th Street (#105, 106) and at 7th Street (#96, 97) would have 10% exceeded speeds ranging from 10 to 12 mph. Wind speeds would be 13 mph at the Cityside Neighborhood Park at 9th Street (#76, 77). Wind hazards would occur at 4 of the 18 locations along Cityside Alley (#80, 81, 135, 137); two wind hazards would occur at 10th Street, with durations 2 and 15 hours per year, and two would occur at the east side of Cultural Park, with durations of 1 and 10 hours per year.
• Avenue C – (38 test points: #7, 8, 10-12, 14, 18, 45, 46, 55-57, 65, 66, 72, 74, 75, 82-85, 93-95, 102-104, 113, 114, 121-124, 132-134, 145-147). Along Avenue C, wind speeds would range from 8 to 19 mph. Winds at 11 of the 38 locations (#8, 11, 45, 65, 83, 95, 122, 123, 124, 132, 133) would meet the Pedestrian Criterion. Wind speeds would be higher at 10th Street, at the north end of the development, and in the central area, near California Avenue. Wind speeds would remain higher in the Job Corps areas, where existing wind speeds are already higher. Wind hazards would occur at 12 of the 38 test points (#12, 18, 46, 82, 93, 102, 123, 132, 133, 134, 145, 147) along Avenue C. These wind hazards would occur with individual durations ranging from 1 to 56 hours per year.
• Avenue C Alley – (10 test points: #44, 47, 53, 54, 58, 63, 64, 67, 68, 69). Along Avenue C Alley, wind speeds would range from 7 to 14 mph. Winds at 6 of the 10 locations (#53, 58, 63, 64, 67, 68) would meet the Pedestrian Criterion. The two Cityside Neighborhood Parks located along this alley, one at 7th (#63, 64) and one at 8th Street (#53, 54) would have 10% exceeded

Treasure Island / Yerba Buena Island Redevelopment Project Wind Evaluation 31 ESA / 209672 Technical Memorandum April 10, 2010
speeds ranging from 8 to 12 mph. A single wind hazard, with a duration of 1 hour per year, would occur at 10th Street (#47).
• Avenue D – (23 test points: #18, 32, 33, 34, 40, 41, 43, 49, 50, 51, 52, 60, 61, 62, 70, 142, 143, 144, 149, 153, 154, 200, 203). Along Avenue D, wind speeds would range from 8 to 20 mph. Wind speeds would vary along this roadway, with the highest wind speeds occurring at the south end, between 1st to 3rd streets, and relatively lower wind speeds occurring between 3rd and 9th Streets. Winds at 10 locations (#32, 33, 40, 41, 43, 50, 51, 61, 62, 70) would meet the Pedestrian Criterion. Wind hazards would occur at 8 of 23 test points along Avenue D. One wind hazard, with a duration of 1 hours per year, would occur at 8th Street (#52), the other seven, with individual durations ranging from 2 to 50 hours per year, would occur between 1st Street and 4th Street (#18, 142, 149, 153, 154, 200, 203).
• Avenue D Alley – (4 test points: #35, 36, 39, 42). Along Avenue D Alley, wind speeds would range from 5 to 10 mph, so all locations would meet the Pedestrian Criterion. No wind hazard would occur.
• Avenue E – (13 test points: #19, 30, 31, 37, 38, 150, 151, 156, 157, 158, 160, 161, 201). Along Avenue E, wind speeds would range from 8 to 18 mph. Winds at 4 of the 13 test point locations (#31, 37, 38, 150) would meet the Pedestrian Criterion. Wind hazards would occur at two locations, one at 8th Street (#30) and one between 3rd and 4th Streets (#157), with individual durations of 6 and 2 hours per year, respectively.
• Avenue H – (8 test points: #20, 155, 159, 165, 166, 167, 170, 171). Along Avenue H, wind speeds would range from 10 to 15 mph. Winds at a total of 3 locations (#20, 167, 170) would meet the Pedestrian Criterion. Wind hazards would occur at 2 of the 8 test point locations on Avenue H, at 3rd Street, with individual durations of 1 hour per year (#165) and 17 hours per year (#171).
• Avenue I – (11 test points: #21, 22, 163, 164, 168, 169, 174, 175, 178, 179, 199). Along Avenue I, wind speeds would range from 10 to 17 mph. Winds at 7 of these locations (#21, 22, 164, 169, 174, 178, 199) would meet the Pedestrian Criterion. A wind hazard, with a duration of 2 hours per year, would occur at Avenue I and 4th Street (#163).
• Avenue J – (7 test points: #172, 173, 176, 177, 183, 184, 186, 187). Along Avenue J, wind speeds would range from 9 to 15 mph. Winds at 4 of the locations (#173, 176, 177, 186) would meet the Pedestrian Criterion. A wind hazard, with a duration of 1 hour per year, would occur on Avenue J between 3rd & 4th Streets (#184).
• Avenue K – (8 test points: #180, 181, 182, 185, 192, 196, 197, 198). Along Avenue K, wind speeds would range from 9 to 18 mph. Winds at 3 of the locations (#181, 185, 196) would meet the Pedestrian Criterion. Wind hazards would occur at 5 of the test point locations (180, 182, 192, 196, 198) along Avenue K between 2nd and 4th Streets, with individual durations of 1 to 6 hours per year.
• Eastside Avenue – (6 test points: #189, 190, 191, 193, 194, 195). Along Eastside Avenue, which is at the eastern edge of the Project and is directly exposed to winds from the north and south, wind speeds would range from 10 to 18 mph. Winds at 3 locations (#190, 191, 193) would meet

Treasure Island / Yerba Buena Island Redevelopment Project Wind Evaluation 32 ESA / 209672 Technical Memorandum April 10, 2010
the Pedestrian Criterion. Wind hazards would occur at the other 3 test point locations along Eastside Avenue, at both the north and the south ends of the street, with individual durations of 1, 4 and 4 hours per year. Specific measures should be developed to reduce or eliminate these wind hazards and to reduce wind speeds at both ends of Eastside Avenue.
Review of Project Wind Conditions - Parks and Open Spaces Since the strong existing winds and their accompanying higher incidence of wind hazards would still occur in the exposed shoreline parks and open spaces, only those parks and open spaces that are within the interior of the Project development area show any wind effect that can be attributed to the Project. The following summarizes wind conditions in some of the Parks and Open Spaces, as well as in the Job Corps area, with Project development:
• Building 1 Plaza – (3 test points: #26, 27, 141). The wind speeds exceeded 10% of the time at the 3 test points would range from 14 to 16 mph. No wind hazard would occur at these locations.
• Building 2 – (3 test points: #18, 19, 203). Wind speeds at these 3 test points would range from 13 to 15 mph. Wind hazards would occur at 2 of the 3 locations, with individual durations of 7 hours per year (#18) and 50 hours per year (#203). Specific measures should be developed to reduce or eliminate these wind hazards.
• Building 3 – (4 test points: #20, 21, 22, 23). Wind speeds at these 4 locations would range from 10 to 11 mph; winds at all of these locations would meet the Pedestrian Criterion. No wind hazards would occur.
• Cityside Neighborhood Park – (12 test points: # 53, 54, 63, 64, 76, 77, 96, 97, 105, 106, 115, 116). Wind speeds at these 12 test points would range from 8 to 13 mph. Winds at 5 of the 12 locations (#53, 63, 64, 97, 105) would meet the Pedestrian Criterion. No wind hazards would occur.
• Cultural Park – (4 test points: # 135, 136, 137, 138). Wind speeds at these 4 test points would range from 13 to 17 mph. Wind hazards would occur at 2 of the 4 locations, with durations of 1 hour per year (#135) and 10 hours per year (#137).
• Cityside Waterfront Park – (2 test points: #205, 206). The wind speeds exceeded 10% of the time would range from 16 to 17 mph. Winds at both locations would exceed the wind hazard criterion. The durations of the individual hazards would be 3 hours per year and 4 hours per year, at locations #206 and 205, respectively.
• Clipper Cove Promenade – (2 test points: #202, 204). Wind speeds would range from 11 to 15 mph. Wind at one of the two locations (#202) would meet the Pedestrian Criterion. No wind hazard would occur.
• Eastside Commons – (21 test points: #151-153, 156, 161, 162, 164-166, 168, 171, 173, 174, 176, 182, 183, 187, 191, 193, 198, 201). Wind speeds would range from 10 to 20 mph. Winds at 6 of the 21 locations would meet the Pedestrian Criterion (164, 173, 174, 176, 191, 193). Wind speeds would vary by block along the Eastside Commons – winds would be higher between Avenue D and Avenue H, lower between Avenues I and J, higher at Avenue K, and lower at Eastside Avenue.

Treasure Island / Yerba Buena Island Redevelopment Project Wind Evaluation 33 ESA / 209672 Technical Memorandum April 10, 2010
Winds at 5 of the 21 test points (#153, 165, 171, 182, 198) in the Eastside Commons would exceed the wind hazard criterion. Hazards would occur: at two locations at Avenue H and 3rd for durations of 1 hours per year (#165) and 17 hours per year (#171); at two locations at Avenue K and 3rd (#182, 198) for durations of 2 hours per year each; and, at one location at 3rd, California Avenue and Avenue D (#153) for a duration of 14 hours per year.
• Marina Plaza – (2 test points: #24, 25). Wind speeds would range from 15 to 16 mph. No wind hazard would occur.
• School Open Space – (1 test point: #29). Wind speed would be 13 mph. No wind hazard would occur.
• Waterfront Plaza – (3 test points: #125, 126, 140). Wind speeds in this exposed waterfront location would range from 13 to 19 mph. Winds at all 3 test points would exceed the wind hazard criterion. The hazard durations would range from 1 to 10 hours per year.
• Pier 1 – (1 test point: #188). Near the Pier, wind speed would be 11 mph, meeting the Pedestrian Criterion. No wind hazard would occur.
• Job Corps – (11 test points: #8, 9, 10, 11, 12, 13, 14, 15, 16, 17, 28). Wind speeds would range from 7 to 19 mph; wind speeds at 6 of the 11 test points (#8, 11, 13, 15, 16, 17) would meet the Pedestrian Criterion. One wind hazard, with a duration of 15 hours per year, would occur (#12) on the east side of Avenue C.
Compared to existing conditions, with the Project 10% exceeded wind speeds would be: reduced by 4 to 8 mph at the four test points (#8 – 11) at the two northern-most Job Corps buildings: increased by 4 mph at one test point (#12) at south end of the Job Corps building, at 5th Street and Avenue C; decreased by 4 to 10 mph at the five test points (#13 - 17) at the two southern-most Job Corps buildings; and, decreased by 3 mph at the one test point (#28) at the eastern-most Job Corps building. Overall, wind speeds would decrease by 3 to 10 mph at 10 of those 11 test points, and would increase by 4 mph at the one remaining test point.
The Project would eliminate 9 existing wind hazards, with total duration of 49 hours per year, and create one new hazard, with a duration of 15 hours per year, at Job Corps test points. The Project would: eliminate existingwind hazards at the four test points (#8 – 11) at the two northern-most Job Corps buildings: create a new hazard at one test point (#12) at south end of the Job Corps building, at 5th Street and Avenue C; and, eliminate existing hazards at the five test points (#13 - 17) at the two southern-most Job Corps buildings. An existing wind hazard does not occur at test point (#28) at the eastern-most Job Corps building, and the Project would not create one there.
Point-by-Point - Project R-values and Wind Conditions The wind test data for the 200 Project measurements are summarized in Table 6, which presents the measured R-values for all five tested wind directions (NNW, NW, WNW, W and SSE) as well as the calculated 10% exceeded wind speed and the hours per year duration of wind hazard. Note that the wind speeds and hazard durations are calculated only using three of the wind directions – NNW, W and SSE. However, the R-values for NW and WNW winds can be compared to the R-values for W wind to understand the relative wind speeds that could result from winds from those directions, as well.

Treasure Island / Yerba Buena Island Redevelopment Project Wind Evaluation 34 ESA / 209672 Technical Memorandum April 10, 2010
TABLE 6
SUMMARY OF MEASURED R-VALUES AND CALCULATED WINDS - PROJECT CONDITIONS
Project Conditions - Measured R-Values Test Point Location - Narrative Description
# NNW NW WNW W SSER-Value Average
10% Exceed
Hazard hr/yr
Avenues StreetsCalifornia Avenue
Edges Identifier or Name
1 open Existing "star"
2 open Existing "star"
3 open Existing "star"
4 Avenue C Existing "star"
5 open Existing "star"
6 open Existing "star"
7 0.32 0.37 0.54 0.50 0.35 0.42 15 0 Avenue C Existing "star"
8 0.22 0.35 0.36 0.33 0.35 0.32 10 0 Avenue C Job Corps
9 0.21 0.25 0.34 0.46 0.22 0.30 14 0 open Job Corps
10 0.38 0.55 0.50 0.50 0.26 0.44 15 0 Avenue C Job Corps
11 0.28 0.26 0.38 0.29 0.33 0.31 10 0 Avenue C Job Corps
12 0.33 0.49 0.45 0.66 0.37 0.46 19 15 Avenue C Job Corps
13 0.15 0.18 0.45 0.26 0.50 0.31 9 0 open Job Corps
14 0.32 0.29 0.28 0.41 0.24 0.31 12 0 Avenue C Job Corps
15 0.30 0.34 0.23 0.26 0.25 0.28 9 0 open Job Corps
16 0.37 0.39 0.39 0.26 0.45 0.37 10 0 open Job Corps
17 0.28 0.25 0.30 0.24 0.21 0.25 8 0 open Job Corps
18 0.36 0.56 0.47 0.46 0.62 0.49 15 7 Avenue C California Avenue Building 2
19 0.37 0.45 0.40 0.37 0.44 0.40 13 0 Avenue E California Avenue Building 2
20 0.26 0.31 0.25 0.34 0.23 0.28 10 0 Avenue H California Avenue Building 3
21 0.27 0.24 0.26 0.37 0.26 0.28 11 0 Avenue I California Avenue Building 3
22 0.34 0.26 0.29 0.31 0.24 0.29 10 0 Avenue I 02-03 alley Building 3
23 0.20 0.16 0.28 0.34 0.32 0.26 11 0 Avenue E Alley 02-03 alley Building 3
24 0.44 0.52 0.54 0.45 0.54 0.50 15 0 Shoreline Marina Plaza
25 0.36 0.56 0.57 0.50 0.43 0.49 16 0 1st Shoreline Marina Plaza
26 0.32 0.48 0.38 0.44 0.41 0.41 14 0 open Building 1 Plaza
27 0.40 0.38 0.27 0.32 0.43 0.36 12 0 open Building 1 Plaza
28 0.42 0.32 0.32 0.34 0.38 0.36 12 0 open Job Corps
29 0.22 0.37 0.35 0.42 0.29 0.33 13 0 Avenue D - E 8th - 9th School Open Space
30 0.40 0.46 0.78 0.60 0.11 0.47 18 6 Avenue E 8th
31 0.49 0.35 0.30 0.13 0.30 0.31 8 0 Avenue E 7th
32 0.14 0.15 0.25 0.28 0.30 0.22 9 0 Avenue D 7th
33 0.33 0.24 0.21 0.22 0.31 0.26 8 0 Avenue D 7th - 8th
34 0.53 0.49 0.31 0.38 0.44 0.43 14 0 Avenue D 8th
35 0.57 0.47 0.49 0.23 0.31 0.41 10 0 Avenue D Alley 7th - 8th
36 0.12 0.17 0.33 0.15 0.14 0.18 5 0 Avenue D Alley 7th - 8th
37 0.35 0.24 0.23 0.30 0.19 0.26 10 0 Avenue E 7th
38 0.54 0.30 0.24 0.16 0.40 0.33 10 0 Avenue E 6th - 7th
39 0.27 0.43 0.20 0.19 0.45 0.31 8 0 Avenue D Alley 6th - 7th
40 0.33 0.41 0.30 0.20 0.39 0.33 8 0 Avenue D 6th - 7th
41 0.31 0.24 0.30 0.28 0.42 0.31 10 0 Avenue D 7th
42 0.29 0.24 0.24 0.29 0.21 0.25 9 0 Avenue D Alley 7th
43 0.32 0.32 0.31 0.17 0.38 0.30 8 0 Avenue D 9th
44 0.48 0.43 0.39 0.33 0.28 0.38 12 0 Avenue C Alley 9th
45 0.35 0.47 0.40 0.31 0.30 0.36 10 0 Avenue C 9th
46 0.68 0.70 0.68 0.33 0.42 0.56 14 3 Avenue C 9th - 10th
47 0.62 0.58 0.61 0.36 0.33 0.50 13 1 Avenue C Alley 10th
48 0.29 0.37 0.52 0.47 0.10 0.35 14 0 Avenue C - D 10th
49 0.29 0.56 0.68 0.43 0.28 0.45 13 0 Avenue D 9th
50 0.36 0.23 0.36 0.26 0.30 0.30 9 0 Avenue D 8th - 9th
51 0.60 0.56 0.28 0.22 0.33 0.40 10 0 Avenue D 8th - 9th
52 0.62 0.51 0.25 0.35 0.33 0.41 13 1 Avenue D 8th
53 0.39 0.43 0.25 0.36 0.26 0.34 11 0 Avenue C Alley 8th Cityside Neighborhood Park
54 0.36 0.28 0.25 0.41 0.24 0.31 12 0 Avenue C Alley 8th Cityside Neighborhood Park
55 0.41 0.55 0.50 0.38 0.35 0.44 12 0 Avenue C 8th
56 0.37 0.42 0.34 0.37 0.38 0.38 12 0 Avenue C 8th - 9th
57 0.31 0.25 0.26 0.45 0.32 0.32 14 0 Avenue C 9th
58 0.25 0.32 0.41 0.16 0.38 0.30 7 0 Avenue C Alley 8th - 9th
59 0.35 0.53 0.44 0.32 0.17 0.36 10 0 Avenue C - D 9th
60 0.39 0.36 0.56 0.40 0.14 0.37 12 0 Avenue D 8th
61 0.20 0.25 0.28 0.33 0.21 0.25 10 0 Avenue D 7th - 8th
62 0.41 0.32 0.20 0.16 0.27 0.27 8 0 Avenue D 7th
63 0.24 0.23 0.31 0.22 0.30 0.26 8 0 Avenue C Alley 7th Cityside Neighborhood Park
64 0.28 0.30 0.29 0.22 0.29 0.28 8 0 Avenue C Alley 7th Cityside Neighborhood Park
65 0.29 0.31 0.37 0.22 0.39 0.31 8 0 Avenue C 7th - 8th
66 0.31 0.43 0.39 0.41 0.36 0.38 13 0 Avenue C 8th
67 0.48 0.33 0.25 0.34 0.22 0.32 11 0 Avenue C Alley 8th
68 0.33 0.45 0.34 0.33 0.39 0.37 11 0 Avenue C Alley 7th - 8th
69 0.58 0.52 0.54 0.37 0.43 0.49 14 0 Avenue C Alley 7th - 8th
70 0.25 0.20 0.23 0.29 0.12 0.22 9 0 Avenue D 7th
71 0.11 0.11 0.16 0.22 0.24 0.17 7 0 open Job Corps
72 0.26 0.41 0.20 0.43 0.23 0.31 13 0 Avenue C
73 0.25 0.24 0.26 0.28 0.13 0.23 8 0 Avenue C - D 7th
74 0.50 0.72 0.64 0.50 0.34 0.54 16 0 Avenue C 10th
75 0.57 0.46 0.28 0.41 0.29 0.40 14 0 Avenue C 9th
GREEN:
BLACK:
RED: Parks and Open Space Names reference: TIDA
10
37Hours per year that wind exceeds Wind Hazard critrion:
Values less than 0.3
Values between 0.3 and 0.5
Values greater than 0.5
Meets 11 mph pedstrian criterion:
Street name reference: Perkins + Will, Block and Street Name Map, 04 May 2009. Unmarked alleys
are referenced to the avenue located immediately to the west.
Existing locations covered by Project buildings.
Calculated
Wind Speeds

Treasure Island / Yerba Buena Island Redevelopment Project Wind Evaluation 35 ESA / 209672 Technical Memorandum April 10, 2010
TABLE 6
SUMMARY OF MEASURED R-VALUES AND CALCULATED WINDS - PROJECT CONDITIONS
Project Conditions - Measured R-Values Test Point Location - Narrative Description
# NNW NW WNW W SSER-Value Average
10% Exceed
Hazard hr/yr
Avenues StreetsCalifornia Avenue
Edges Identifier or Name
76 0.25 0.35 0.45 0.44 0.27 0.35 13 0 Cityside Alley 9th Cityside Neighborhood Park
77 0.50 0.34 0.45 0.40 0.29 0.40 13 0 Cityside Alley 9th Cityside Neighborhood Park
78 0.25 0.46 0.52 0.63 0.38 0.45 19 10 Cityside Avenue 9th
79 0.52 0.58 0.35 0.41 0.58 0.49 15 3 Cityside Avenue 10th
80 0.44 0.49 0.43 0.53 0.53 0.48 17 2 Cityside Alley 10th
81 0.78 0.71 0.59 0.43 0.59 0.62 17 15 Cityside Alley 8th - 9th
82 0.41 0.37 0.27 0.65 0.13 0.37 19 13 Avenue C 9th
83 0.51 0.54 0.18 0.21 0.30 0.35 9 0 Avenue C 8th - 9th
84 0.44 0.41 0.40 0.50 0.28 0.41 15 0 Avenue C 8th - 9th
85 0.52 0.41 0.31 0.35 0.29 0.37 12 0 Avenue C 7th - 8th
86 0.38 0.28 0.43 0.35 0.19 0.33 11 0 Cityside Alley 8th
87 0.35 0.29 0.52 0.40 0.22 0.36 12 0 Cityside Alley 8th
88 0.23 0.56 0.56 0.51 0.52 0.48 16 0 Cityside Avenue 8th
89 0.25 0.57 0.53 0.52 0.51 0.47 16 0 Cityside Avenue 8th - 9th
90 0.37 0.63 0.46 0.39 0.49 0.47 13 0 Cityside Avenue 9th
91 0.33 0.26 0.33 0.24 0.27 0.29 9 0 Cityside Alley 8th - 9th
92 0.29 0.25 0.25 0.45 0.21 0.29 13 0 Cityside Alley 9th
93 0.30 0.34 0.53 0.62 0.16 0.39 18 8 Avenue C 8th
94 0.24 0.22 0.37 0.50 0.25 0.32 14 0 Avenue C 7th - 8th
95 0.36 0.40 0.35 0.31 0.28 0.34 10 0 Avenue C 7th
96 0.22 0.53 0.44 0.39 0.26 0.37 12 0 Cityside Alley 7th Cityside Neighborhood Park
97 0.33 0.42 0.45 0.35 0.29 0.37 11 0 Cityside Alley 7th Cityside Neighborhood Park
98 0.52 0.53 0.41 0.29 0.59 0.47 13 4 Cityside Avenue 7th - 8th
99 0.40 0.52 0.42 0.33 0.56 0.44 12 1 Cityside Avenue 8th
100 0.36 0.28 0.31 0.53 0.19 0.33 15 0 Cityside Alley 8th
101 0.30 0.27 0.35 0.41 0.39 0.34 13 0 Cityside Alley 8th - 9th
102 0.28 0.36 0.28 0.54 0.23 0.34 16 1 Avenue C 7th
103 0.24 0.28 0.47 0.51 0.28 0.36 15 0 Avenue C 6th - 7th
104 0.34 0.25 0.32 0.38 0.19 0.30 12 0 Avenue C 6th
105 0.28 0.26 0.46 0.37 0.21 0.31 11 0 Cityside Alley 6th Cityside Neighborhood Park
106 0.26 0.43 0.70 0.39 0.24 0.40 12 0 Cityside Alley 6th Cityside Neighborhood Park
107 0.53 0.47 0.53 0.38 0.36 0.45 13 0 Cityside Alley 6th - 7th
108 0.30 0.49 0.52 0.45 0.52 0.46 15 0 Cityside Avenue 6th - 7th
109 0.39 0.51 0.41 0.41 0.49 0.44 14 0 Cityside Avenue 7th
110 0.27 0.31 0.36 0.47 0.21 0.32 14 0 Cityside Alley 7th
111 0.24 0.30 0.29 0.24 0.35 0.28 8 0 Cityside Alley 6th - 7th
112 0.25 0.49 0.37 0.40 0.22 0.35 12 0 Cityside Alley 6th
113 0.24 0.23 0.36 0.44 0.24 0.30 13 0 Avenue C 5th - 6th
114 0.31 0.33 0.25 0.44 0.31 0.33 13 0 Avenue C 5th
115 0.32 0.46 0.47 0.38 0.28 0.38 12 0 Cityside Alley 5th Cityside Neighborhood Park
116 0.23 0.47 0.33 0.42 0.24 0.34 12 0 Cityside Alley 5th Cityside Neighborhood Park
117 0.34 0.53 0.63 0.48 0.43 0.48 15 0 Cityside Avenue 5th
118 0.34 0.38 0.41 0.42 0.57 0.42 14 2 Cityside Avenue 5th - 6th
119 0.33 0.44 0.39 0.39 0.54 0.42 13 0 Cityside Avenue 6th
120 0.28 0.38 0.32 0.31 0.34 0.33 10 0 Cityside Alley 5th - 6th
121 0.32 0.33 0.65 0.38 0.25 0.38 12 0 Avenue C 5th
122 0.47 0.38 0.42 0.26 0.41 0.39 11 0 Avenue C 4th - 5th
123 0.41 0.33 0.32 0.22 0.62 0.38 11 6 Avenue C 4th
124 0.42 0.37 0.49 0.28 0.51 0.41 11 0 Avenue C 4th - 5th
125 0.45 0.65 0.68 0.61 0.47 0.57 19 7 4th Shoreline Waterfront Plaza
126 0.54 0.52 0.43 0.31 0.55 0.47 13 1 4th Shoreline Waterfront Plaza
127 0.31 0.32 0.31 0.37 0.23 0.31 11 0 Cityside Avenue 4th - 5th
128 0.32 0.35 0.36 0.41 0.27 0.34 12 0 Cityside Avenue 4th - 5th
129 0.33 0.48 0.41 0.35 0.49 0.41 12 0 Cityside Avenue 5th
130 0.45 0.39 0.31 0.34 0.27 0.35 12 0 Cityside Alley 5th
131 0.43 0.36 0.30 0.29 0.35 0.35 11 0 Cityside Alley 4th - 5th
132 0.38 0.37 0.23 0.13 0.72 0.37 10 26 Avenue C 4th California Avenue
133 0.41 0.30 0.21 0.13 0.64 0.34 10 9 Avenue C 4th California Avenue
134 0.43 0.34 0.24 0.33 0.56 0.38 13 2 Avenue C California Avenue
135 0.34 0.29 0.50 0.54 0.43 0.42 17 1 Cityside Alley Cultural Park
136 0.59 0.44 0.40 0.43 0.45 0.46 15 0 Cityside Alley California Avenue Cultural Park
137 0.48 0.36 0.40 0.32 0.65 0.44 13 10 Cityside Alley 4th Cultural Park
138 0.54 0.25 0.31 0.41 0.39 0.38 14 0 Cityside Alley Cultural Park
139 0.22 0.29 0.37 0.53 0.29 0.34 15 0 Cityside Avenue 4th
140 0.55 0.59 0.57 0.52 0.49 0.54 17 1 Shoreline Waterfront Plaza
141 0.38 0.50 0.61 0.51 0.40 0.48 16 0 Shoreline Building 1 Plaza
142 0.33 0.52 0.49 0.58 0.60 0.50 18 9 Avenue D California Avenue
143 0.34 0.31 0.23 0.52 0.50 0.38 16 0 Avenue D M1
144 0.59 0.46 0.26 0.31 0.47 0.42 13 0 Avenue D 1st
145 0.49 0.53 0.62 0.64 0.46 0.55 20 12 Avenue C 1st
146 0.43 0.57 0.40 0.49 0.43 0.47 16 0 Avenue C M1
147 0.49 0.40 0.31 0.42 0.80 0.48 16 56 Avenue C California Avenue
148 0.39 0.36 0.29 0.57 0.32 0.38 17 3 Avenue C - D California Avenue
149 0.44 0.57 0.41 0.31 0.56 0.46 12 2 Avenue D 1st
150 0.56 0.33 0.22 0.19 0.40 0.34 10 0 Avenue E 3rd - 4th
GREEN:
BLACK:
RED: Parks and Open Space Names reference: TIDA
10
37Hours per year that wind exceeds Wind Hazard critrion:
Values less than 0.3
Values between 0.3 and 0.5
Values greater than 0.5
Meets 11 mph pedstrian criterion:
Street name reference: Perkins + Will, Block and Street Name Map, 04 May 2009. Unmarked alleys
are referenced to the avenue located immediately to the west.
Calculated
Wind Speeds

Treasure Island / Yerba Buena Island Redevelopment Project Wind Evaluation 36 ESA / 209672 Technical Memorandum April 10, 2010
Project plus Cumulative Due to factors discussed earlier in the Model and Wind Testing Protocols, no wind interaction is anticipated between the Proposed Project and any cumulative development on Treasure Island. The Project plus cumulative scenario would result in wind conditions that could not be distinguished from those wind conditions under the Project.
TABLE 6
SUMMARY OF MEASURED R-VALUES AND CALCULATED WINDS - PROJECT CONDITIONS
Project Conditions - Measured R-Values Test Point Location - Narrative Description
# NNW NW WNW W SSER-Value Average
10% Exceed
Hazard hr/yr
Avenues StreetsCalifornia Avenue
Edges Identifier or Name
151 0.56 0.47 0.52 0.27 0.46 0.46 12 0 Avenue E 3rd Eastside Commons
152 0.30 0.31 0.36 0.43 0.37 0.35 13 0 3rd California Avenue Eastside Commons
153 0.42 0.69 0.57 0.65 0.55 0.58 20 14 Avenue D 3rd California Avenue Eastside Commons
154 0.43 0.42 0.31 0.25 0.70 0.42 12 20 Avenue D 3rd - 4th
155 0.49 0.61 0.43 0.41 0.39 0.46 14 0 Avenue H 4th
156 0.40 0.46 0.69 0.48 0.52 0.51 16 0 Avenue E 3rd Eastside Commons
157 0.57 0.37 0.37 0.23 0.56 0.42 12 2 Avenue E 3rd - 4th
158 0.40 0.27 0.40 0.37 0.43 0.37 13 0 Avenue E 4th
159 0.54 0.44 0.22 0.41 0.37 0.40 14 0 Avenue H California Avenue
160 0.16 0.46 0.58 0.41 0.48 0.42 13 0 Avenue E California Avenue
161 0.44 0.43 0.49 0.32 0.46 0.43 12 0 Avenue E 3rd Eastside Commons
162 0.40 0.28 0.33 0.49 0.25 0.35 15 0 Avenue E - H 3rd Eastside Commons
163 0.55 0.67 0.54 0.54 0.21 0.50 17 2 Avenue I 4th
164 0.53 0.48 0.37 0.23 0.47 0.42 11 0 Avenue I 3rd Eastside Commons
165 0.43 0.47 0.44 0.46 0.55 0.47 15 1 Avenue H 3rd Eastside Commons
166 0.59 0.62 0.43 0.32 0.49 0.49 13 0 Avenue H 3rd - 4th Eastside Commons
167 0.46 0.49 0.27 0.27 0.47 0.39 11 0 Avenue H 4th
168 0.47 0.29 0.25 0.42 0.34 0.35 14 0 Avenue I 3rd Eastside Commons
169 0.38 0.12 0.12 0.32 0.37 0.26 11 0 Avenue I California Avenue
170 0.37 0.52 0.29 0.35 0.31 0.37 11 0 Avenue H California Avenue
171 0.42 0.45 0.40 0.36 0.69 0.46 14 17 Avenue H 3rd Eastside Commons
172 0.43 0.52 0.54 0.47 0.14 0.42 14 0 Avenue J 4th
173 0.51 0.41 0.43 0.28 0.40 0.41 11 0 Avenue J 3rd Eastside Commons
174 0.33 0.47 0.38 0.27 0.39 0.37 10 0 Avenue I 3rd Eastside Commons
175 0.60 0.62 0.50 0.31 0.39 0.49 13 0 Avenue I 3rd - 4th
176 0.48 0.45 0.39 0.24 0.44 0.40 11 0 Avenue J 3rd Eastside Commons
177 0.44 0.34 0.33 0.19 0.39 0.34 9 0 Avenue J 2nd
178 0.21 0.21 0.31 0.18 0.52 0.29 8 0 Avenue I 2nd
179 0.54 0.28 0.34 0.39 0.51 0.41 14 0 Avenue I 3rd
180 0.53 0.63 0.62 0.59 0.19 0.51 18 6 Avenue K 4th
181 0.44 0.38 0.40 0.27 0.55 0.41 11 0 Avenue K 3rd - 4th
182 0.57 0.53 0.44 0.37 0.55 0.49 15 2 Avenue K 3rd Eastside Commons
183 0.43 0.52 0.56 0.47 0.46 0.49 15 0 Avenue J 3rd Eastside Commons
184 0.60 0.60 0.55 0.37 0.35 0.50 14 1 Avenue J 3rd - 4th
185 0.42 0.28 0.27 0.15 0.47 0.32 9 0 Avenue K 2nd
186 0.30 0.23 0.32 0.27 0.51 0.33 10 0 Avenue J 2nd
187 0.46 0.52 0.41 0.33 0.47 0.44 13 0 Avenue J 3rd Eastside Commons
188 0.51 0.34 0.27 0.23 0.54 0.38 11 0 Shoreline Pier 1
189 0.47 0.48 0.57 0.58 0.33 0.49 17 4 Eastside Avenue 4th
190 0.49 0.39 0.29 0.18 0.47 0.36 10 0 Eastside Avenue 3rd - 4th
191 0.55 0.44 0.35 0.16 0.46 0.39 11 0 Eastside Avenue 3rd Eastside Commons
192 0.62 0.62 0.65 0.44 0.40 0.54 15 1 Avenue K 3rd - 4th
193 0.48 0.54 0.44 0.23 0.52 0.44 11 0 Eastside Avenue 3rd Eastside Commons
194 0.62 0.48 0.33 0.22 0.58 0.45 13 4 Eastside Avenue 2nd - 3rd
195 0.61 0.44 0.17 0.21 0.47 0.38 12 1 Eastside Avenue 2nd
196 0.36 0.25 0.34 0.26 0.56 0.35 11 1 Avenue K 2nd
197 0.36 0.18 0.31 0.42 0.48 0.35 14 0 Avenue K 2nd - 3rd
198 0.54 0.29 0.42 0.44 0.56 0.45 16 2 Avenue K 3rd Eastside Commons
199 0.51 0.38 0.25 0.23 0.51 0.37 11 0 Avenue I 1st
200 0.50 0.49 0.28 0.30 0.73 0.46 13 29 Avenue D 3rd - 4th
201 0.36 0.31 0.24 0.45 0.33 0.34 14 0 Avenue E 3rd Eastside Commons
202 0.30 0.23 0.47 0.34 0.42 0.35 11 0 Shoreline Clipper Cove Promenade
203 0.38 0.57 0.33 0.42 0.78 0.50 15 50 Avenue D 1st - 2nd Building 2 / Bus stop
204 0.38 0.49 0.47 0.47 0.52 0.47 15 0 Shoreline Clipper Cove Promenade
205 0.50 0.56 0.51 0.46 0.58 0.52 16 4 Shoreline Cityside Waterfront Park
206 0.61 0.57 0.53 0.48 0.55 0.55 17 3 Shoreline Cityside Waterfront Park
GREEN:
BLACK:
RED: Parks and Open Space Names reference: TIDA
10
37Hours per year that wind exceeds Wind Hazard critrion:
Values less than 0.3
Values between 0.3 and 0.5
Values greater than 0.5
Meets 11 mph pedstrian criterion:
Street name reference: Perkins + Will, Block and Street Name Map, 04 May 2009. Unmarked alleys
are referenced to the avenue located immediately to the west.
Calculated Wind Speeds

Treasure Island / Yerba Buena Island Redevelopment Project Wind Evaluation 37 ESA / 209672 Technical Memorandum April 10, 2010
ATTACHMENT – PLANNING CODE SECTION 148
San Francisco Planning Code Section 148, Reduction of Ground-level Wind Currents in C-3 Districts (a) Requirement and Exception. In C-3 Districts, buildings and additions to existing buildings shall
be shaped, or other wind-baffling measures shall be adopted, so that the developments will not cause ground-level wind currents to exceed, more than 10 percent of the time year round, between 7:00 a.m. and 6:00 p.m., the comfort level of 11 m.p.h. equivalent wind speed in areas of substantial pedestrian use and seven m.p.h. equivalent wind speed in public seating areas.
When preexisting ambient wind speeds exceed the comfort level, or when a proposed building or addition may cause ambient wind speeds to exceed the comfort level, the building shall be designed to reduce the ambient wind speeds to meet the requirements. An exception may be granted, in accordance with the provisions of Section 309, allowing the building or addition to add to the amount of time that the comfort level is exceeded by the least practical amount if (1) it can be shown that a building or addition cannot be shaped and other wind-baffling measures cannot be adopted to meet the foregoing requirements without creating an unattractive and ungainly building form and without unduly restricting the development potential of the building site in question, and (2) it is concluded that, because of the limited amount by which the comfort level is exceeded, the limited location in which the comfort level is exceeded, or the limited time during which the comfort level is exceeded, the addition is insubstantial.
No exception shall be granted and no building or addition shall be permitted that causes equivalent wind speeds to reach or exceed the hazard level of 26 miles per hour for a single hour of the year.
(b) Definition. The term “equivalent wind speed” shall mean an hourly mean wind speed adjusted to
incorporate the effects of gustiness or turbulence on pedestrians. (c) Guidelines. Procedures and Methodologies for implementing this section shall be specified by the
Office of Environmental Review of the Department of City Planning. (Added by Ord. 414-85, App. 9/17/85)

Treasure Island / Yerba Buena Island Redevelopment Project Wind Evaluation 38 ESA / 209672 Technical Memorandum April 10, 2010
ATTACHMENT – LISTINGS OF WIND-TUNNEL DATA AND CALCULATED RESULTS
Pedestrian Comfort Analysis 10% Exceeded Winds In the following tables for the Comfort Criterion tests, the output for each location is presented in three-line groups. The ratios of pedestrian-level wind speeds to the 22-feet height reference wind speeds at the NAS Alameda meteorological station are shown in the first line of output for each location.
The second line of the output shows the pedestrian level wind speeds, in mph, which would be exceeded 10% of the time for each measurement location. Section 148 of the Planning Code sets comfort criteria of 11 mph for areas of substantial public pedestrian use and 7 mph for public seating areas. These criteria are not to be exceeded more than 10% of the time.
The third line of output for each location shows the criterion speed and the percentage of the time the criterion would be exceeded. The rows labeled CONTRIB tabulate the percentage contribution to the total or the exceedence from each wind direction. The SUMs are the equivalent number of events.
Wind Hazard Analysis 1 Hour per Year Exceeded Winds In the following tables for the Hazard Criterion tests, the output for each location is presented in three-line groups. The ratios of pedestrian-level wind speeds to the 22-feet height reference wind speeds at the NAS Alameda meteorological station are shown in the first line of output for each location.
The second line of the output shows the pedestrian level wind speeds, in mph, which would be exceeded one hour per year (approximately 0.01141552512% of the time) for each measurement location tested. Section 148 of the Planning Code sets a wind hazard criterion that an hourly average speed of 26 mph for a full hour (a one-minute average speed of 36 mph) not be reached or exceeded one hour per year.
The third line of output for each location shows the criterion speed and the percentage of the time the criterion would be exceeded. The rows labeled CONTRIB tabulate the percentage contribution to the total or the exceedence from each wind direction. The SUMs are the equivalent number of events.

Treasure Island SAN FRANCISCO, CALIFORNIA
Wind Comfort Analysis Existing Scenario Wind Test Date: Jan 2010 _______________________________________________________________________________________________________
The ratios of pedestrian-level wind speeds to the reference height wind speeds at the oldAlameda NAS meteorological station are shown in the first line of output for each location. The second line of the output shows the pedestrian level wind speeds, in mph, which would be exceeded 10% of the time for each measurement location. This assumes wind comfort criteriaof 11 mph for areas of substantial public pedestrian use and 7 mph for public seating areas. These criteria are not to be exceeded more than 10% of the time. The third line of output for each location shows the criterion speed and the percentage of the time the criterion would be exceeded. The rows labeled CONTRIB tabulate the percentage contribution to the total or the exceedance from each wind direction. The SUMs are the equivalent number of events._______________________________________________________________________________________________________ 10.0% Exc. ---Criterion--- Loca- Ground Speed % Time NNW W SSE OTHER SUM tion Speed Exc. Exc._______________________________________________________________________________________________________ Profile Ratios: 1.9610 1.9610 1.9610 1.9610 1 RATIOS 1.0848 1.1433 0.8805 1.0362 18.4 CONTRIB 9.93% 73.58% 9.89% 6.60% 4,380 11.0 34.63 CONTRIB 13.35% 67.23% 9.59% 9.83% 15,168 2 RATIOS 1.3043 0.7785 1.1617 1.0815 15.9 CONTRIB 33.14% 24.89% 28.00% 13.97% 4,380 11.0 26.32 CONTRIB 24.54% 44.94% 16.63% 13.89% 11,528 3 RATIOS 0.7713 1.2519 0.3785 0.8005 18.6 CONTRIB 0.95% 97.22% 0.00% 1.84% 4,380 11.0 29.29 CONTRIB 6.61% 86.86% 0.30% 6.23% 12,830 4 RATIOS 0.6828 1.0662 0.3432 0.6974 15.9 CONTRIB 1.30% 96.66% 0.00% 2.04% 4,380 11.0 24.03 CONTRIB 5.01% 90.51% 0.11% 4.37% 10,524 5 RATIOS 0.3946 0.7660 0.7656 0.6420 12.3 CONTRIB 0.09% 74.67% 20.33% 4.90% 4,380 11.0 14.45 CONTRIB 0.17% 77.08% 17.53% 5.22% 6,328 6 RATIOS 1.1791 0.8028 1.2188 1.0669 15.9 CONTRIB 24.11% 31.90% 30.81% 13.18% 4,380 11.0 26.80 CONTRIB 20.07% 49.46% 17.13% 13.34% 11,737 7 RATIOS 1.1584 1.1560 0.8562 1.0568 18.6 CONTRIB 12.18% 72.97% 8.08% 6.77% 4,380 11.0 35.44 CONTRIB 14.69% 66.41% 8.97% 9.93% 15,523 8 RATIOS 1.3556 0.8026 0.9046 1.0210 15.7 CONTRIB 36.23% 35.00% 17.20% 11.57% 4,380 11.0 26.90 CONTRIB 25.75% 49.22% 12.68% 12.34% 11,784 9 RATIOS 0.7009 1.2011 0.6334 0.8451 18.0 CONTRIB 0.54% 95.46% 1.09% 2.90% 4,380 11.0 29.76 CONTRIB 4.48% 82.12% 5.79% 7.61% 13,033 10 RATIOS 0.9028 1.1939 0.8505 0.9824 18.5 CONTRIB 3.73% 83.20% 7.95% 5.12% 4,380 11.0 33.85 CONTRIB 9.78% 71.75% 9.26% 9.20% 14,827 11 RATIOS 0.8742 1.1172 0.9925 0.9946 17.9 CONTRIB 3.82% 74.07% 15.93% 6.18% 4,380 11.0 32.81 CONTRIB 9.52% 69.38% 11.41% 9.69% 14,370 12 RATIOS 0.8519 0.9532 0.9162 0.9071 15.7 CONTRIB 7.20% 67.69% 17.79% 7.32% 4,380 11.0 28.53 CONTRIB 10.01% 68.32% 12.11% 9.55% 12,495 13 RATIOS 0.3496 1.2617 1.0068 0.8727 19.5 CONTRIB 0.00% 84.04% 13.73% 2.24% 4,380 11.0 32.00 CONTRIB 0.02% 80.13% 11.86% 7.98% 14,014 14 RATIOS 0.7189 1.1068 0.4636 0.7631 16.5 CONTRIB 1.43% 95.90% 0.03% 2.64% 4,380 11.0 26.06 CONTRIB 5.65% 86.55% 2.02% 5.78% 11,415 15 RATIOS 0.6389 1.0497 0.4716 0.7201 15.7 CONTRIB 0.83% 96.45% 0.13% 2.59% 4,380 11.0 24.11 CONTRIB 3.85% 88.82% 2.38% 4.95% 10,562
...................................................................................................................................................WIND TEST POINT DETAIL LISTING, Page 1 of 4

Treasure Island SAN FRANCISCO, CALIFORNIA
Wind Comfort Analysis Existing Scenario Wind Test Date: Jan 2010 _______________________________________________________________________________________________________
The ratios of pedestrian-level wind speeds to the reference height wind speeds at the oldAlameda NAS meteorological station are shown in the first line of output for each location. The second line of the output shows the pedestrian level wind speeds, in mph, which would be exceeded 10% of the time for each measurement location. This assumes wind comfort criteriaof 11 mph for areas of substantial public pedestrian use and 7 mph for public seating areas. These criteria are not to be exceeded more than 10% of the time. The third line of output for each location shows the criterion speed and the percentage of the time the criterion would be exceeded. The rows labeled CONTRIB tabulate the percentage contribution to the total or the exceedance from each wind direction. The SUMs are the equivalent number of events._______________________________________________________________________________________________________ 10.0% Exc. ---Criterion--- Loca- Ground Speed % Time NNW W SSE OTHER SUM tion Speed Exc. Exc._______________________________________________________________________________________________________ 16 RATIOS 0.9081 0.8903 1.2552 1.0179 16.0 CONTRIB 8.50% 48.54% 32.31% 10.65% 4,380 11.0 29.61 CONTRIB 11.30% 61.57% 15.96% 11.16% 12,969 17 RATIOS 0.7860 0.7801 1.1303 0.8988 14.1 CONTRIB 7.98% 47.86% 33.33% 10.82% 4,380 11.0 20.94 CONTRIB 9.96% 56.89% 20.34% 12.81% 9,173 18 RATIOS 0.9807 0.7779 1.2919 1.0168 15.1 CONTRIB 14.43% 36.62% 35.53% 13.43% 4,380 11.0 23.81 CONTRIB 16.17% 49.54% 20.43% 13.85% 10,427 19 RATIOS 1.0580 0.9801 1.0360 1.0247 16.8 CONTRIB 12.83% 58.22% 19.88% 9.07% 4,380 11.0 31.69 CONTRIB 13.94% 63.20% 12.32% 10.54% 13,881 20 RATIOS 0.4369 0.7060 0.4273 0.5234 10.7 CONTRIB 0.86% 92.00% 3.54% 3.59% 4,380 11.0 8.87 CONTRIB 0.73% 92.76% 3.03% 3.48% 3,887 21 RATIOS 1.0813 1.1444 1.1566 1.1274 19.1 CONTRIB 8.49% 64.38% 19.17% 7.97% 4,380 11.0 36.18 CONTRIB 12.70% 64.42% 12.04% 10.83% 15,846 22 RATIOS 1.2313 0.7175 0.9495 0.9661 14.4 CONTRIB 35.66% 28.51% 22.68% 13.16% 4,380 11.0 21.17 CONTRIB 27.48% 41.30% 16.92% 14.30% 9,272 23 RATIOS 0.3571 1.0566 0.7299 0.7145 16.1 CONTRIB 0.00% 90.19% 7.61% 2.20% 4,380 11.0 25.02 CONTRIB 0.04% 86.15% 9.19% 4.63% 10,959 24 RATIOS 1.0260 1.0587 0.9640 1.0163 17.4 CONTRIB 9.76% 66.92% 15.84% 7.49% 4,380 11.0 32.71 CONTRIB 12.77% 66.04% 11.12% 10.07% 14,325 25 RATIOS 0.8024 1.1854 0.9013 0.9630 18.4 CONTRIB 1.46% 82.85% 10.85% 4.84% 4,380 11.0 32.79 CONTRIB 6.90% 73.55% 10.37% 9.18% 14,364 26 RATIOS 0.7593 0.9681 0.8540 0.8605 15.5 CONTRIB 3.91% 74.22% 15.72% 6.16% 4,380 11.0 27.21 CONTRIB 6.70% 72.73% 11.62% 8.95% 11,918 27 RATIOS 1.1815 0.9760 1.0607 1.0727 17.2 CONTRIB 17.95% 52.34% 19.84% 9.87% 4,380 11.0 32.95 CONTRIB 16.38% 60.54% 12.13% 10.95% 14,431 28 RATIOS 0.9801 0.8940 0.8756 0.9166 15.2 CONTRIB 14.07% 59.98% 17.30% 8.66% 4,380 11.0 28.23 CONTRIB 13.62% 64.85% 11.70% 9.82% 12,363 29 RATIOS 0.4706 0.4942 1.0458 0.6702 9.6 CONTRIB 3.85% 35.92% 44.99% 15.24% 4,380 11.0 6.17 CONTRIB 2.04% 19.58% 63.86% 14.52% 2,704
...................................................................................................................................................WIND TEST POINT DETAIL LISTING, Page 2 of 4

Treasure Island SAN FRANCISCO, CALIFORNIA
Wind Hazard Analysis Existing Scenario Wind Test Date: Jan 2010 _______________________________________________________________________________________________________
The ratios of pedestrian-level wind speeds to the reference height wind speeds at the oldAlameda NAS meteorological station are shown in the first line of output for each location. The second line of the output shows the pedestrian level wind speeds, in mph, which would be exceeded one hour per year (0.01141552512% of the time) for each measurement location. This assumes that a windhazard occurs if a one-minute average speed of 36 mph is reached or exceeded a total of one hour per year. The third line of output for each location shows the criterion speed and the percentage of the time the criterion would be exceeded. The rows labeled CONTRIB tabulate the percentage contribution to the total or the exceedance from each wind direction. The SUMs are the equivalent number of events. _______________________________________________________________________________________________________ 0.011414% Exc. ---Criterion--- Loca- Ground Speed % Time NNW W SSE OTHER SUM tion Speed Exc. Exc._______________________________________________________________________________________________________ Profile Ratios: 1.9610 1.9610 1.9610 1.9610 1 RATIOS 1.0848 1.1433 0.8805 1.0362 40.0 CONTRIB 5.25% 91.05% 0.27% 3.43% 5 36.0 0.0552249 CONTRIB 5.62% 89.85% 0.41% 4.13% 24 2 RATIOS 1.3043 0.7785 1.1617 1.0815 41.3 CONTRIB 63.15% 0.13% 32.52% 4.21% 5 36.0 0.0811947 CONTRIB 33.82% 0.16% 60.12% 5.89% 36 3 RATIOS 0.7713 1.2519 0.3785 0.8005 43.6 CONTRIB 0.00% 100.00% 0.00% 0.00% 5 36.0 0.1244210 CONTRIB 0.01% 99.97% 0.00% 0.02% 54 4 RATIOS 0.6828 1.0662 0.3432 0.6974 37.1 CONTRIB 0.00% 100.00% 0.00% 0.00% 5 36.0 0.0168619 CONTRIB 0.00% 99.99% 0.00% 0.01% 7 5 RATIOS 0.3946 0.7660 0.7656 0.6420 27.1 CONTRIB 0.00% 68.31% 31.04% 0.65% 5 36.0 0.0001160 CONTRIB 0.00% 87.28% 12.72% 0.00% 0 6 RATIOS 1.1791 0.8028 1.2188 1.0669 41.3 CONTRIB 12.44% 0.24% 83.95% 3.37% 5 36.0 0.0905760 CONTRIB 11.81% 0.23% 83.79% 4.18% 40 7 RATIOS 1.1584 1.1560 0.8562 1.0568 40.7 CONTRIB 11.74% 84.49% 0.11% 3.66% 5 36.0 0.0712381 CONTRIB 12.63% 82.68% 0.18% 4.50% 31 8 RATIOS 1.3556 0.8026 0.9046 1.0210 40.9 CONTRIB 97.92% 0.24% 0.26% 1.58% 5 36.0 0.0417683 CONTRIB 94.37% 0.50% 0.91% 4.22% 18 9 RATIOS 0.7009 1.2011 0.6334 0.8451 41.8 CONTRIB 0.00% 99.95% 0.00% 0.05% 5 36.0 0.0852281 CONTRIB 0.00% 99.92% 0.00% 0.08% 37 10 RATIOS 0.9028 1.1939 0.8505 0.9824 41.6 CONTRIB 0.14% 99.09% 0.07% 0.70% 4 36.0 0.0817441 CONTRIB 0.19% 98.56% 0.14% 1.11% 36 11 RATIOS 0.8742 1.1172 0.9925 0.9946 39.0 CONTRIB 0.23% 92.69% 4.50% 2.58% 5 36.0 0.0382548 CONTRIB 0.24% 90.77% 6.06% 2.93% 17 12 RATIOS 0.8519 0.9532 0.9162 0.9071 33.7 CONTRIB 1.63% 75.74% 16.11% 6.51% 5 36.0 0.0037591 CONTRIB 1.63% 79.35% 12.98% 6.04% 2 13 RATIOS 0.3496 1.2617 1.0068 0.8727 43.9 CONTRIB 0.00% 99.36% 0.60% 0.03% 5 36.0 0.1367630 CONTRIB 0.00% 97.67% 2.24% 0.08% 60 14 RATIOS 0.7189 1.1068 0.4636 0.7631 38.4 CONTRIB 0.00% 99.97% 0.00% 0.03% 5 36.0 0.0300644 CONTRIB 0.01% 99.95% 0.00% 0.04% 13 15 RATIOS 0.6389 1.0497 0.4716 0.7201 36.5 CONTRIB 0.00% 99.97% 0.00% 0.03% 5 36.0 0.0132549 CONTRIB 0.00% 99.97% 0.00% 0.03% 6
...................................................................................................................................................WIND TEST POINT DETAIL LISTING, Page 3 of 4

Treasure Island SAN FRANCISCO, CALIFORNIA
Wind Hazard Analysis Existing Scenario Wind Test Date: Jan 2010 _______________________________________________________________________________________________________
The ratios of pedestrian-level wind speeds to the reference height wind speeds at the oldAlameda NAS meteorological station are shown in the first line of output for each location. The second line of the output shows the pedestrian level wind speeds, in mph, which would be exceeded one hour per year (0.01141552512% of the time) for each measurement location. This assumes that a windhazard occurs if a one-minute average speed of 36 mph is reached or exceeded a total of one hour per year. The third line of output for each location shows the criterion speed and the percentage of the time the criterion would be exceeded. The rows labeled CONTRIB tabulate the percentage contribution to the total or the exceedance from each wind direction. The SUMs are the equivalent number of events. _______________________________________________________________________________________________________ 0.011414% Exc. ---Criterion--- Loca- Ground Speed % Time NNW W SSE OTHER SUM tion Speed Exc. Exc._______________________________________________________________________________________________________ 16 RATIOS 0.9081 0.8903 1.2552 1.0179 42.2 CONTRIB 0.13% 0.85% 97.99% 1.03% 5 36.0 0.1024230 CONTRIB 0.17% 1.01% 97.18% 1.63% 45 17 RATIOS 0.7860 0.7801 1.1303 0.8988 37.8 CONTRIB 0.07% 0.55% 98.65% 0.73% 5 36.0 0.0295639 CONTRIB 0.06% 0.45% 98.83% 0.65% 13 18 RATIOS 0.9807 0.7779 1.2919 1.0168 43.3 CONTRIB 0.28% 0.04% 99.07% 0.61% 5 36.0 0.1321070 CONTRIB 0.46% 0.10% 98.20% 1.24% 58 19 RATIOS 1.0580 0.9801 1.0360 1.0247 36.5 CONTRIB 15.12% 33.94% 37.41% 13.54% 5 36.0 0.0138783 CONTRIB 14.88% 33.04% 38.55% 13.53% 6 20 RATIOS 0.4369 0.7060 0.4273 0.5234 24.4 CONTRIB 0.00% 99.88% 0.00% 0.12% 5 36.0 0.0000287 CONTRIB 0.00% 100.00% 0.00% 0.00% 0 21 RATIOS 1.0813 1.1444 1.1566 1.1274 41.3 CONTRIB 3.04% 57.92% 30.28% 8.76% 5 36.0 0.1089230 CONTRIB 2.70% 46.28% 41.98% 9.04% 48 22 RATIOS 1.2313 0.7175 0.9495 0.9661 37.4 CONTRIB 93.12% 0.16% 3.84% 2.89% 5 36.0 0.0177240 CONTRIB 90.45% 0.21% 5.52% 3.82% 8 23 RATIOS 0.3571 1.0566 0.7299 0.7145 36.8 CONTRIB 0.00% 99.94% 0.04% 0.02% 5 36.0 0.0146654 CONTRIB 0.00% 99.94% 0.04% 0.02% 6 24 RATIOS 1.0260 1.0587 0.9640 1.0163 37.2 CONTRIB 6.42% 79.51% 6.04% 8.03% 5 36.0 0.0193240 CONTRIB 6.49% 78.28% 6.81% 8.42% 8 25 RATIOS 0.8024 1.1854 0.9013 0.9630 41.2 CONTRIB 0.02% 99.17% 0.23% 0.57% 5 36.0 0.0765288 CONTRIB 0.03% 98.67% 0.46% 0.84% 34 26 RATIOS 0.7593 0.9681 0.8540 0.8605 33.8 CONTRIB 0.24% 93.29% 3.94% 2.52% 5 36.0 0.0040162 CONTRIB 0.24% 94.41% 3.09% 2.27% 2 27 RATIOS 1.1815 0.9760 1.0607 1.0727 38.2 CONTRIB 44.68% 16.20% 25.11% 14.02% 5 36.0 0.0278155 CONTRIB 39.17% 15.44% 30.45% 14.94% 12 28 RATIOS 0.9801 0.8940 0.8756 0.9166 32.6 CONTRIB 27.09% 46.50% 12.65% 13.76% 5 36.0 0.0021766 CONTRIB 27.42% 50.81% 9.27% 12.49% 1 29 RATIOS 0.4706 0.4942 1.0458 0.6702 35.1 CONTRIB 0.00% 0.00% 100.00% 0.00% 5 36.0 0.0064283 CONTRIB 0.00% 0.00% 100.00% 0.00% 3
...................................................................................................................................................WIND TEST POINT DETAIL LISTING, Page 4 of 4

Treasure Island SAN FRANCISCO, CALIFORNIA
Wind Comfort Analysis Existing Scenario Wind Test Date: Jan 2010 _______________________________________________________________________________________________________
The ratios of pedestrian-level wind speeds to the reference height wind speeds at the oldAlameda NAS meteorological station are shown in the first line of output for each location. The second line of the output shows the pedestrian level wind speeds, in mph, which would be exceeded 10% of the time for each measurement location. This assumes wind comfort criteriaof 11 mph for areas of substantial public pedestrian use and 7 mph for public seating areas. These criteria are not to be exceeded more than 10% of the time. The third line of output for each location shows the criterion speed and the percentage of the time the criterion would be exceeded. The rows labeled CONTRIB tabulate the percentage contribution to the total or the exceedance from each wind direction. The SUMs are the equivalent number of events._______________________________________________________________________________________________________ 10.0% Exc. ---Criterion--- Loca- Ground Speed % Time NNW W SSE OTHER SUM tion Speed Exc. Exc._______________________________________________________________________________________________________ Profile Ratios: 1.9610 1.9610 1.9610 1.9610 1 RATIOS 1.0848 1.1433 0.8805 1.0362 18.4 CONTRIB 9.93% 73.58% 9.89% 6.60% 4,380 11.0 34.63 CONTRIB 13.35% 67.23% 9.59% 9.83% 15,168 2 RATIOS 1.3043 0.7785 1.1617 1.0815 15.9 CONTRIB 33.14% 24.89% 28.00% 13.97% 4,380 11.0 26.32 CONTRIB 24.54% 44.94% 16.63% 13.89% 11,528 3 RATIOS 0.7713 1.2519 0.3785 0.8005 18.6 CONTRIB 0.95% 97.22% 0.00% 1.84% 4,380 11.0 29.29 CONTRIB 6.61% 86.86% 0.30% 6.23% 12,830 4 RATIOS 0.6828 1.0662 0.3432 0.6974 15.9 CONTRIB 1.30% 96.66% 0.00% 2.04% 4,380 11.0 24.03 CONTRIB 5.01% 90.51% 0.11% 4.37% 10,524 5 RATIOS 0.3946 0.7660 0.7656 0.6420 12.3 CONTRIB 0.09% 74.67% 20.33% 4.90% 4,380 11.0 14.45 CONTRIB 0.17% 77.08% 17.53% 5.22% 6,328 6 RATIOS 1.1791 0.8028 1.2188 1.0669 15.9 CONTRIB 24.11% 31.90% 30.81% 13.18% 4,380 11.0 26.80 CONTRIB 20.07% 49.46% 17.13% 13.34% 11,737 7 RATIOS 1.1584 1.1560 0.8562 1.0568 18.6 CONTRIB 12.18% 72.97% 8.08% 6.77% 4,380 11.0 35.44 CONTRIB 14.69% 66.41% 8.97% 9.93% 15,523 8 RATIOS 1.3556 0.8026 0.9046 1.0210 15.7 CONTRIB 36.23% 35.00% 17.20% 11.57% 4,380 11.0 26.90 CONTRIB 25.75% 49.22% 12.68% 12.34% 11,784 9 RATIOS 0.7009 1.2011 0.6334 0.8451 18.0 CONTRIB 0.54% 95.46% 1.09% 2.90% 4,380 11.0 29.76 CONTRIB 4.48% 82.12% 5.79% 7.61% 13,033 10 RATIOS 0.9028 1.1939 0.8505 0.9824 18.5 CONTRIB 3.73% 83.20% 7.95% 5.12% 4,380 11.0 33.85 CONTRIB 9.78% 71.75% 9.26% 9.20% 14,827 11 RATIOS 0.8742 1.1172 0.9925 0.9946 17.9 CONTRIB 3.82% 74.07% 15.93% 6.18% 4,380 11.0 32.81 CONTRIB 9.52% 69.38% 11.41% 9.69% 14,370 12 RATIOS 0.8519 0.9532 0.9162 0.9071 15.7 CONTRIB 7.20% 67.69% 17.79% 7.32% 4,380 11.0 28.53 CONTRIB 10.01% 68.32% 12.11% 9.55% 12,495 13 RATIOS 0.3496 1.2617 1.0068 0.8727 19.5 CONTRIB 0.00% 84.04% 13.73% 2.24% 4,380 11.0 32.00 CONTRIB 0.02% 80.13% 11.86% 7.98% 14,014 14 RATIOS 0.7189 1.1068 0.4636 0.7631 16.5 CONTRIB 1.43% 95.90% 0.03% 2.64% 4,380 11.0 26.06 CONTRIB 5.65% 86.55% 2.02% 5.78% 11,415 15 RATIOS 0.6389 1.0497 0.4716 0.7201 15.7 CONTRIB 0.83% 96.45% 0.13% 2.59% 4,380 11.0 24.11 CONTRIB 3.85% 88.82% 2.38% 4.95% 10,562
...................................................................................................................................................WIND TEST POINT DETAIL LISTING, Page 1 of 4
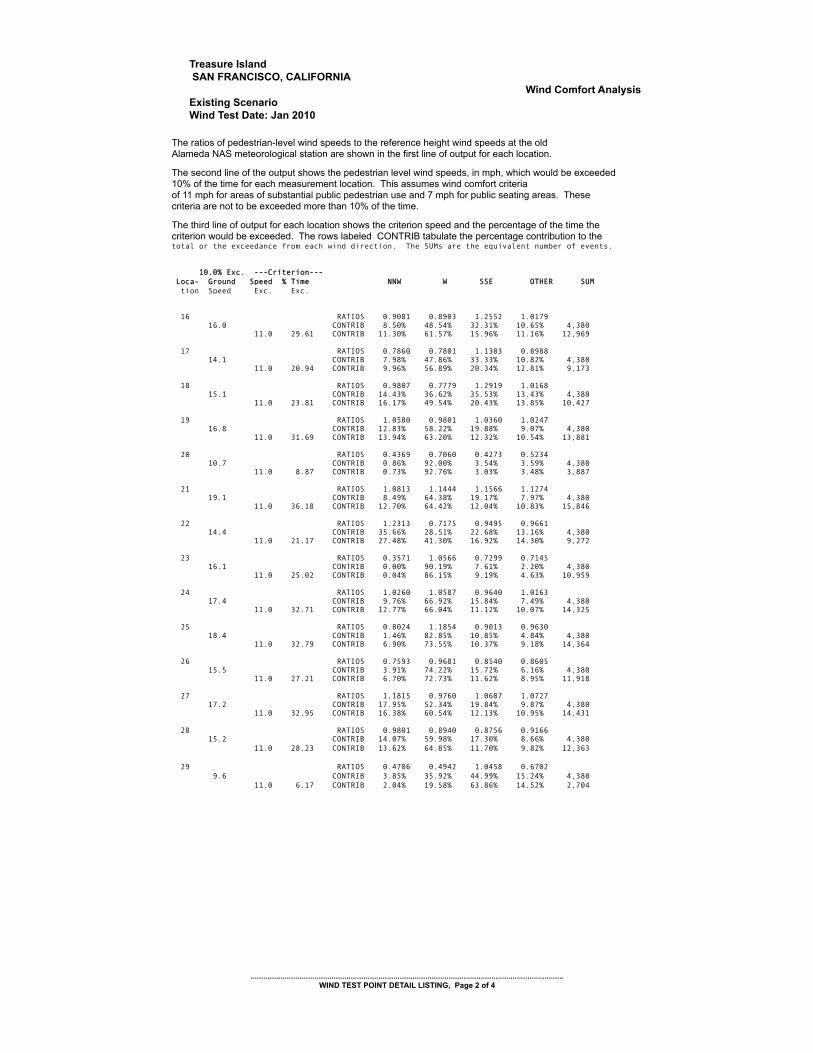
Treasure Island SAN FRANCISCO, CALIFORNIA
Wind Comfort Analysis Existing Scenario Wind Test Date: Jan 2010 _______________________________________________________________________________________________________
The ratios of pedestrian-level wind speeds to the reference height wind speeds at the oldAlameda NAS meteorological station are shown in the first line of output for each location. The second line of the output shows the pedestrian level wind speeds, in mph, which would be exceeded 10% of the time for each measurement location. This assumes wind comfort criteriaof 11 mph for areas of substantial public pedestrian use and 7 mph for public seating areas. These criteria are not to be exceeded more than 10% of the time. The third line of output for each location shows the criterion speed and the percentage of the time the criterion would be exceeded. The rows labeled CONTRIB tabulate the percentage contribution to the total or the exceedance from each wind direction. The SUMs are the equivalent number of events._______________________________________________________________________________________________________ 10.0% Exc. ---Criterion--- Loca- Ground Speed % Time NNW W SSE OTHER SUM tion Speed Exc. Exc._______________________________________________________________________________________________________ 16 RATIOS 0.9081 0.8903 1.2552 1.0179 16.0 CONTRIB 8.50% 48.54% 32.31% 10.65% 4,380 11.0 29.61 CONTRIB 11.30% 61.57% 15.96% 11.16% 12,969 17 RATIOS 0.7860 0.7801 1.1303 0.8988 14.1 CONTRIB 7.98% 47.86% 33.33% 10.82% 4,380 11.0 20.94 CONTRIB 9.96% 56.89% 20.34% 12.81% 9,173 18 RATIOS 0.9807 0.7779 1.2919 1.0168 15.1 CONTRIB 14.43% 36.62% 35.53% 13.43% 4,380 11.0 23.81 CONTRIB 16.17% 49.54% 20.43% 13.85% 10,427 19 RATIOS 1.0580 0.9801 1.0360 1.0247 16.8 CONTRIB 12.83% 58.22% 19.88% 9.07% 4,380 11.0 31.69 CONTRIB 13.94% 63.20% 12.32% 10.54% 13,881 20 RATIOS 0.4369 0.7060 0.4273 0.5234 10.7 CONTRIB 0.86% 92.00% 3.54% 3.59% 4,380 11.0 8.87 CONTRIB 0.73% 92.76% 3.03% 3.48% 3,887 21 RATIOS 1.0813 1.1444 1.1566 1.1274 19.1 CONTRIB 8.49% 64.38% 19.17% 7.97% 4,380 11.0 36.18 CONTRIB 12.70% 64.42% 12.04% 10.83% 15,846 22 RATIOS 1.2313 0.7175 0.9495 0.9661 14.4 CONTRIB 35.66% 28.51% 22.68% 13.16% 4,380 11.0 21.17 CONTRIB 27.48% 41.30% 16.92% 14.30% 9,272 23 RATIOS 0.3571 1.0566 0.7299 0.7145 16.1 CONTRIB 0.00% 90.19% 7.61% 2.20% 4,380 11.0 25.02 CONTRIB 0.04% 86.15% 9.19% 4.63% 10,959 24 RATIOS 1.0260 1.0587 0.9640 1.0163 17.4 CONTRIB 9.76% 66.92% 15.84% 7.49% 4,380 11.0 32.71 CONTRIB 12.77% 66.04% 11.12% 10.07% 14,325 25 RATIOS 0.8024 1.1854 0.9013 0.9630 18.4 CONTRIB 1.46% 82.85% 10.85% 4.84% 4,380 11.0 32.79 CONTRIB 6.90% 73.55% 10.37% 9.18% 14,364 26 RATIOS 0.7593 0.9681 0.8540 0.8605 15.5 CONTRIB 3.91% 74.22% 15.72% 6.16% 4,380 11.0 27.21 CONTRIB 6.70% 72.73% 11.62% 8.95% 11,918 27 RATIOS 1.1815 0.9760 1.0607 1.0727 17.2 CONTRIB 17.95% 52.34% 19.84% 9.87% 4,380 11.0 32.95 CONTRIB 16.38% 60.54% 12.13% 10.95% 14,431 28 RATIOS 0.9801 0.8940 0.8756 0.9166 15.2 CONTRIB 14.07% 59.98% 17.30% 8.66% 4,380 11.0 28.23 CONTRIB 13.62% 64.85% 11.70% 9.82% 12,363 29 RATIOS 0.4706 0.4942 1.0458 0.6702 9.6 CONTRIB 3.85% 35.92% 44.99% 15.24% 4,380 11.0 6.17 CONTRIB 2.04% 19.58% 63.86% 14.52% 2,704
...................................................................................................................................................WIND TEST POINT DETAIL LISTING, Page 2 of 4

Treasure Island SAN FRANCISCO, CALIFORNIA
Wind Hazard Analysis Existing Scenario Wind Test Date: Jan 2010 _______________________________________________________________________________________________________
The ratios of pedestrian-level wind speeds to the reference height wind speeds at the oldAlameda NAS meteorological station are shown in the first line of output for each location. The second line of the output shows the pedestrian level wind speeds, in mph, which would be exceeded one hour per year (0.01141552512% of the time) for each measurement location. This assumes that a windhazard occurs if a one-minute average speed of 36 mph is reached or exceeded a total of one hour per year. The third line of output for each location shows the criterion speed and the percentage of the time the criterion would be exceeded. The rows labeled CONTRIB tabulate the percentage contribution to the total or the exceedance from each wind direction. The SUMs are the equivalent number of events. _______________________________________________________________________________________________________ 0.011414% Exc. ---Criterion--- Loca- Ground Speed % Time NNW W SSE OTHER SUM tion Speed Exc. Exc._______________________________________________________________________________________________________ Profile Ratios: 1.9610 1.9610 1.9610 1.9610 1 RATIOS 1.0848 1.1433 0.8805 1.0362 40.0 CONTRIB 5.25% 91.05% 0.27% 3.43% 5 36.0 0.0552249 CONTRIB 5.62% 89.85% 0.41% 4.13% 24 2 RATIOS 1.3043 0.7785 1.1617 1.0815 41.3 CONTRIB 63.15% 0.13% 32.52% 4.21% 5 36.0 0.0811947 CONTRIB 33.82% 0.16% 60.12% 5.89% 36 3 RATIOS 0.7713 1.2519 0.3785 0.8005 43.6 CONTRIB 0.00% 100.00% 0.00% 0.00% 5 36.0 0.1244210 CONTRIB 0.01% 99.97% 0.00% 0.02% 54 4 RATIOS 0.6828 1.0662 0.3432 0.6974 37.1 CONTRIB 0.00% 100.00% 0.00% 0.00% 5 36.0 0.0168619 CONTRIB 0.00% 99.99% 0.00% 0.01% 7 5 RATIOS 0.3946 0.7660 0.7656 0.6420 27.1 CONTRIB 0.00% 68.31% 31.04% 0.65% 5 36.0 0.0001160 CONTRIB 0.00% 87.28% 12.72% 0.00% 0 6 RATIOS 1.1791 0.8028 1.2188 1.0669 41.3 CONTRIB 12.44% 0.24% 83.95% 3.37% 5 36.0 0.0905760 CONTRIB 11.81% 0.23% 83.79% 4.18% 40 7 RATIOS 1.1584 1.1560 0.8562 1.0568 40.7 CONTRIB 11.74% 84.49% 0.11% 3.66% 5 36.0 0.0712381 CONTRIB 12.63% 82.68% 0.18% 4.50% 31 8 RATIOS 1.3556 0.8026 0.9046 1.0210 40.9 CONTRIB 97.92% 0.24% 0.26% 1.58% 5 36.0 0.0417683 CONTRIB 94.37% 0.50% 0.91% 4.22% 18 9 RATIOS 0.7009 1.2011 0.6334 0.8451 41.8 CONTRIB 0.00% 99.95% 0.00% 0.05% 5 36.0 0.0852281 CONTRIB 0.00% 99.92% 0.00% 0.08% 37 10 RATIOS 0.9028 1.1939 0.8505 0.9824 41.6 CONTRIB 0.14% 99.09% 0.07% 0.70% 4 36.0 0.0817441 CONTRIB 0.19% 98.56% 0.14% 1.11% 36 11 RATIOS 0.8742 1.1172 0.9925 0.9946 39.0 CONTRIB 0.23% 92.69% 4.50% 2.58% 5 36.0 0.0382548 CONTRIB 0.24% 90.77% 6.06% 2.93% 17 12 RATIOS 0.8519 0.9532 0.9162 0.9071 33.7 CONTRIB 1.63% 75.74% 16.11% 6.51% 5 36.0 0.0037591 CONTRIB 1.63% 79.35% 12.98% 6.04% 2 13 RATIOS 0.3496 1.2617 1.0068 0.8727 43.9 CONTRIB 0.00% 99.36% 0.60% 0.03% 5 36.0 0.1367630 CONTRIB 0.00% 97.67% 2.24% 0.08% 60 14 RATIOS 0.7189 1.1068 0.4636 0.7631 38.4 CONTRIB 0.00% 99.97% 0.00% 0.03% 5 36.0 0.0300644 CONTRIB 0.01% 99.95% 0.00% 0.04% 13 15 RATIOS 0.6389 1.0497 0.4716 0.7201 36.5 CONTRIB 0.00% 99.97% 0.00% 0.03% 5 36.0 0.0132549 CONTRIB 0.00% 99.97% 0.00% 0.03% 6
...................................................................................................................................................WIND TEST POINT DETAIL LISTING, Page 3 of 4

Treasure Island SAN FRANCISCO, CALIFORNIA
Wind Hazard Analysis Existing Scenario Wind Test Date: Jan 2010 _______________________________________________________________________________________________________
The ratios of pedestrian-level wind speeds to the reference height wind speeds at the oldAlameda NAS meteorological station are shown in the first line of output for each location. The second line of the output shows the pedestrian level wind speeds, in mph, which would be exceeded one hour per year (0.01141552512% of the time) for each measurement location. This assumes that a windhazard occurs if a one-minute average speed of 36 mph is reached or exceeded a total of one hour per year. The third line of output for each location shows the criterion speed and the percentage of the time the criterion would be exceeded. The rows labeled CONTRIB tabulate the percentage contribution to the total or the exceedance from each wind direction. The SUMs are the equivalent number of events. _______________________________________________________________________________________________________ 0.011414% Exc. ---Criterion--- Loca- Ground Speed % Time NNW W SSE OTHER SUM tion Speed Exc. Exc._______________________________________________________________________________________________________ 16 RATIOS 0.9081 0.8903 1.2552 1.0179 42.2 CONTRIB 0.13% 0.85% 97.99% 1.03% 5 36.0 0.1024230 CONTRIB 0.17% 1.01% 97.18% 1.63% 45 17 RATIOS 0.7860 0.7801 1.1303 0.8988 37.8 CONTRIB 0.07% 0.55% 98.65% 0.73% 5 36.0 0.0295639 CONTRIB 0.06% 0.45% 98.83% 0.65% 13 18 RATIOS 0.9807 0.7779 1.2919 1.0168 43.3 CONTRIB 0.28% 0.04% 99.07% 0.61% 5 36.0 0.1321070 CONTRIB 0.46% 0.10% 98.20% 1.24% 58 19 RATIOS 1.0580 0.9801 1.0360 1.0247 36.5 CONTRIB 15.12% 33.94% 37.41% 13.54% 5 36.0 0.0138783 CONTRIB 14.88% 33.04% 38.55% 13.53% 6 20 RATIOS 0.4369 0.7060 0.4273 0.5234 24.4 CONTRIB 0.00% 99.88% 0.00% 0.12% 5 36.0 0.0000287 CONTRIB 0.00% 100.00% 0.00% 0.00% 0 21 RATIOS 1.0813 1.1444 1.1566 1.1274 41.3 CONTRIB 3.04% 57.92% 30.28% 8.76% 5 36.0 0.1089230 CONTRIB 2.70% 46.28% 41.98% 9.04% 48 22 RATIOS 1.2313 0.7175 0.9495 0.9661 37.4 CONTRIB 93.12% 0.16% 3.84% 2.89% 5 36.0 0.0177240 CONTRIB 90.45% 0.21% 5.52% 3.82% 8 23 RATIOS 0.3571 1.0566 0.7299 0.7145 36.8 CONTRIB 0.00% 99.94% 0.04% 0.02% 5 36.0 0.0146654 CONTRIB 0.00% 99.94% 0.04% 0.02% 6 24 RATIOS 1.0260 1.0587 0.9640 1.0163 37.2 CONTRIB 6.42% 79.51% 6.04% 8.03% 5 36.0 0.0193240 CONTRIB 6.49% 78.28% 6.81% 8.42% 8 25 RATIOS 0.8024 1.1854 0.9013 0.9630 41.2 CONTRIB 0.02% 99.17% 0.23% 0.57% 5 36.0 0.0765288 CONTRIB 0.03% 98.67% 0.46% 0.84% 34 26 RATIOS 0.7593 0.9681 0.8540 0.8605 33.8 CONTRIB 0.24% 93.29% 3.94% 2.52% 5 36.0 0.0040162 CONTRIB 0.24% 94.41% 3.09% 2.27% 2 27 RATIOS 1.1815 0.9760 1.0607 1.0727 38.2 CONTRIB 44.68% 16.20% 25.11% 14.02% 5 36.0 0.0278155 CONTRIB 39.17% 15.44% 30.45% 14.94% 12 28 RATIOS 0.9801 0.8940 0.8756 0.9166 32.6 CONTRIB 27.09% 46.50% 12.65% 13.76% 5 36.0 0.0021766 CONTRIB 27.42% 50.81% 9.27% 12.49% 1 29 RATIOS 0.4706 0.4942 1.0458 0.6702 35.1 CONTRIB 0.00% 0.00% 100.00% 0.00% 5 36.0 0.0064283 CONTRIB 0.00% 0.00% 100.00% 0.00% 3
...................................................................................................................................................WIND TEST POINT DETAIL LISTING, Page 4 of 4

Treasure Island SAN FRANCISCO, CALIFORNIA
Wind Comfort Analysis Project Scenario Wind Test Date: Jan 2010 _______________________________________________________________________________________________________
The ratios of pedestrian-level wind speeds to the reference height wind speeds at the oldAlameda NAS meteorological station are shown in the first line of output for each location. The second line of the output shows the pedestrian level wind speeds, in mph, which would be exceeded 10% of the time for each measurement location. This assumes wind comfort criteriaof 11 mph for areas of substantial public pedestrian use and 7 mph for public seating areas. These criteria are not to be exceeded more than 10% of the time. The third line of output for each location shows the criterion speed and the percentage of the time the criterion would be exceeded. The rows labeled CONTRIB tabulate the percentage contribution to the total or the exceedance from each wind direction. The SUMs are the equivalent number of events._______________________________________________________________________________________________________ 10.0% Exc. ---Criterion--- Loca- Ground Speed % Time NNW W SSE OTHER SUM tion Speed Exc. Exc._______________________________________________________________________________________________________ Profile Ratios: 1.9610 1.9610 1.9610 1.9610 7 RATIOS 0.6365 0.9774 0.6842 0.7660 15.0 CONTRIB 1.17% 86.73% 7.71% 4.39% 4,380 11.0 24.43 CONTRIB 3.75% 81.74% 8.25% 6.26% 10,702 8 RATIOS 0.4281 0.6438 0.6805 0.5841 10.5 CONTRIB 0.86% 70.69% 22.11% 6.34% 4,380 11.0 8.41 CONTRIB 0.64% 69.53% 23.68% 6.14% 3,686 9 RATIOS 0.4155 0.9111 0.4285 0.5850 13.6 CONTRIB 0.04% 97.74% 0.33% 1.89% 4,380 11.0 19.48 CONTRIB 0.21% 95.71% 1.42% 2.67% 8,534 10 RATIOS 0.7426 0.9776 0.5042 0.7415 14.8 CONTRIB 4.70% 90.57% 0.78% 3.95% 4,380 11.0 23.78 CONTRIB 7.03% 83.99% 3.34% 5.64% 10,417 11 RATIOS 0.5457 0.5601 0.6536 0.5865 9.6 CONTRIB 8.58% 58.05% 24.27% 9.10% 4,380 11.0 6.22 CONTRIB 7.04% 54.98% 29.53% 8.45% 2,724 12 RATIOS 0.6397 1.2988 0.7303 0.8896 19.4 CONTRIB 0.11% 95.39% 1.97% 2.53% 4,380 11.0 32.25 CONTRIB 2.90% 81.79% 7.13% 8.18% 14,124 13 RATIOS 0.2998 0.5142 0.9740 0.5960 9.4 CONTRIB 0.08% 46.15% 43.10% 10.66% 4,380 11.0 5.91 CONTRIB 0.01% 28.41% 62.10% 9.48% 2,591 14 RATIOS 0.6326 0.8083 0.4616 0.6342 12.4 CONTRIB 5.65% 88.00% 1.86% 4.49% 4,380 11.0 15.72 CONTRIB 5.69% 86.46% 3.29% 4.57% 6,887 15 RATIOS 0.5859 0.5167 0.4840 0.5289 8.8 CONTRIB 15.97% 59.71% 15.76% 8.56% 4,380 11.0 3.39 CONTRIB 19.56% 51.65% 19.18% 9.60% 1,485
...................................................................................................................................................WIND TEST POINT DETAIL LISTING, Page 1 of 28

Treasure Island SAN FRANCISCO, CALIFORNIA
Wind Comfort Analysis Project Scenario Wind Test Date: Jan 2010 _______________________________________________________________________________________________________
The ratios of pedestrian-level wind speeds to the reference height wind speeds at the oldAlameda NAS meteorological station are shown in the first line of output for each location. The second line of the output shows the pedestrian level wind speeds, in mph, which would be exceeded 10% of the time for each measurement location. This assumes wind comfort criteriaof 11 mph for areas of substantial public pedestrian use and 7 mph for public seating areas. These criteria are not to be exceeded more than 10% of the time. The third line of output for each location shows the criterion speed and the percentage of the time the criterion would be exceeded. The rows labeled CONTRIB tabulate the percentage contribution to the total or the exceedance from each wind direction. The SUMs are the equivalent number of events._______________________________________________________________________________________________________ 10.0% Exc. ---Criterion--- Loca- Ground Speed % Time NNW W SSE OTHER SUM tion Speed Exc. Exc._______________________________________________________________________________________________________ 16 RATIOS 0.7215 0.5148 0.8764 0.7042 10.3 CONTRIB 19.64% 30.43% 35.46% 14.47% 4,380 11.0 7.59 CONTRIB 19.68% 22.36% 43.57% 14.39% 3,324 17 RATIOS 0.5406 0.4651 0.4120 0.4726 7.9 CONTRIB 17.65% 59.91% 14.10% 8.34% 4,380 11.0 1.51 CONTRIB 26.76% 48.34% 12.71% 12.19% 662 18 RATIOS 0.6973 0.8942 1.2215 0.9377 15.4 CONTRIB 1.99% 56.32% 32.84% 8.85% 4,380 11.0 27.10 CONTRIB 4.83% 67.57% 16.98% 10.63% 11,869 19 RATIOS 0.7232 0.7277 0.8638 0.7716 12.5 CONTRIB 9.06% 56.79% 24.82% 9.34% 4,380 11.0 15.53 CONTRIB 9.71% 59.32% 20.84% 10.14% 6,803 20 RATIOS 0.5134 0.6571 0.4479 0.5395 10.2 CONTRIB 4.95% 83.52% 6.44% 5.09% 4,380 11.0 7.35 CONTRIB 3.56% 85.90% 5.64% 4.90% 3,219 21 RATIOS 0.5267 0.7256 0.5063 0.5862 11.2 CONTRIB 2.77% 84.97% 7.39% 4.86% 4,380 11.0 10.77 CONTRIB 3.02% 84.59% 7.52% 4.87% 4,718 22 RATIOS 0.6671 0.6012 0.4624 0.5769 9.9 CONTRIB 16.61% 67.17% 8.71% 7.51% 4,380 11.0 6.65 CONTRIB 16.53% 68.25% 7.83% 7.39% 2,915 23 RATIOS 0.3967 0.6591 0.6334 0.5631 10.5 CONTRIB 0.40% 75.38% 18.87% 5.34% 4,380 11.0 8.58 CONTRIB 0.31% 74.41% 20.08% 5.20% 3,757 24 RATIOS 0.8619 0.8738 1.0536 0.9298 15.1 CONTRIB 8.72% 56.36% 25.52% 9.39% 4,380 11.0 27.70 CONTRIB 10.79% 64.62% 14.34% 10.25% 12,133 25 RATIOS 0.7152 0.9893 0.8495 0.8513 15.7 CONTRIB 2.14% 77.03% 15.19% 5.63% 4,380 11.0 27.12 CONTRIB 5.32% 74.54% 11.54% 8.60% 11,877 26 RATIOS 0.6314 0.8713 0.8134 0.7720 14.0 CONTRIB 2.01% 74.25% 17.65% 6.08% 4,380 11.0 23.18 CONTRIB 3.83% 77.00% 12.36% 6.81% 10,153 27 RATIOS 0.7803 0.6305 0.8475 0.7528 11.6 CONTRIB 16.39% 44.26% 27.88% 11.47% 4,380 11.0 11.98 CONTRIB 16.92% 45.19% 25.99% 11.90% 5,248 28 RATIOS 0.8213 0.6671 0.7369 0.7418 11.8 CONTRIB 18.66% 51.05% 20.23% 10.06% 4,380 11.0 12.84 CONTRIB 19.28% 51.99% 18.25% 10.47% 5,624 29 RATIOS 0.4357 0.8189 0.5757 0.6101 12.5 CONTRIB 0.19% 88.27% 8.06% 3.48% 4,380 11.0 16.36 CONTRIB 0.39% 87.18% 8.67% 3.76% 7,167 30 RATIOS 0.7869 1.1788 0.2190 0.7282 17.6 CONTRIB 1.84% 96.63% 0.00% 1.53% 4,380 11.0 27.33 CONTRIB 7.67% 87.76% 0.00% 4.57% 11,972
...................................................................................................................................................WIND TEST POINT DETAIL LISTING, Page 2 of 28

Treasure Island SAN FRANCISCO, CALIFORNIA
Wind Comfort Analysis Project Scenario Wind Test Date: Jan 2010 _______________________________________________________________________________________________________
The ratios of pedestrian-level wind speeds to the reference height wind speeds at the oldAlameda NAS meteorological station are shown in the first line of output for each location. The second line of the output shows the pedestrian level wind speeds, in mph, which would be exceeded 10% of the time for each measurement location. This assumes wind comfort criteriaof 11 mph for areas of substantial public pedestrian use and 7 mph for public seating areas. These criteria are not to be exceeded more than 10% of the time. The third line of output for each location shows the criterion speed and the percentage of the time the criterion would be exceeded. The rows labeled CONTRIB tabulate the percentage contribution to the total or the exceedance from each wind direction. The SUMs are the equivalent number of events._______________________________________________________________________________________________________ 10.0% Exc. ---Criterion--- Loca- Ground Speed % Time NNW W SSE OTHER SUM tion Speed Exc. Exc._______________________________________________________________________________________________________ 31 RATIOS 0.9538 0.2492 0.5793 0.5941 8.4 CONTRIB 59.23% 0.16% 24.63% 15.98% 4,380 11.0 5.65 CONTRIB 64.77% 0.00% 25.43% 9.80% 2,475 32 RATIOS 0.2741 0.5420 0.5805 0.4655 8.8 CONTRIB 0.06% 71.85% 22.91% 5.18% 4,380 11.0 4.22 CONTRIB 0.00% 61.75% 34.20% 4.05% 1,848 33 RATIOS 0.6442 0.4299 0.6167 0.5636 8.5 CONTRIB 26.52% 33.05% 27.72% 12.71% 4,380 11.0 3.40 CONTRIB 28.22% 10.63% 47.98% 13.18% 1,490 34 RATIOS 1.0456 0.7507 0.8634 0.8866 13.9 CONTRIB 25.55% 43.54% 20.12% 10.79% 4,380 11.0 20.52 CONTRIB 21.08% 50.38% 15.76% 12.78% 8,986 35 RATIOS 1.1193 0.4579 0.5983 0.7252 10.3 CONTRIB 55.23% 11.16% 17.57% 16.04% 4,380 11.0 8.30 CONTRIB 58.97% 7.73% 18.49% 14.80% 3,634 36 RATIOS 0.2322 0.2883 0.2806 0.2670 4.7 CONTRIB 4.31% 70.22% 18.63% 6.84% 4,380 11.0 0.00 CONTRIB 0.30% 79.88% 16.08% 3.74% 1 37 RATIOS 0.6958 0.5952 0.3720 0.5543 9.7 CONTRIB 21.13% 69.57% 2.38% 6.92% 4,380 11.0 6.16 CONTRIB 21.05% 71.03% 1.22% 6.70% 2,697 38 RATIOS 1.0515 0.3079 0.7762 0.7118 10.0 CONTRIB 51.71% 0.30% 31.46% 16.54% 4,380 11.0 8.12 CONTRIB 53.80% 0.09% 32.07% 14.04% 3,556 39 RATIOS 0.5330 0.3675 0.8758 0.5921 7.9 CONTRIB 16.82% 16.45% 46.03% 20.70% 4,380 11.0 4.30 CONTRIB 8.36% 2.01% 76.93% 12.71% 1,881 40 RATIOS 0.6430 0.3934 0.7722 0.6029 8.4 CONTRIB 27.37% 17.17% 38.16% 17.30% 4,380 11.0 4.28 CONTRIB 22.28% 3.76% 60.25% 13.72% 1,874 41 RATIOS 0.6112 0.5440 0.8205 0.6586 10.1 CONTRIB 11.00% 43.35% 33.79% 11.86% 4,380 11.0 7.22 CONTRIB 10.84% 37.19% 40.40% 11.58% 3,161 42 RATIOS 0.5703 0.5707 0.4038 0.5149 9.1 CONTRIB 12.31% 74.48% 6.65% 6.56% 4,380 11.0 4.78 CONTRIB 12.47% 78.25% 3.34% 5.94% 2,095 43 RATIOS 0.6244 0.3324 0.7475 0.5681 7.7 CONTRIB 32.26% 8.50% 40.16% 19.08% 4,380 11.0 3.75 CONTRIB 22.67% 0.61% 64.37% 12.34% 1,642 44 RATIOS 0.9478 0.6461 0.5454 0.7131 11.6 CONTRIB 32.88% 48.81% 9.00% 9.31% 4,380 11.0 11.86 CONTRIB 30.50% 50.01% 9.81% 9.68% 5,194 45 RATIOS 0.6893 0.6028 0.5826 0.6249 10.3 CONTRIB 16.14% 58.45% 16.61% 8.80% 4,380 11.0 7.97 CONTRIB 15.69% 57.57% 18.24% 8.50% 3,489
...................................................................................................................................................WIND TEST POINT DETAIL LISTING, Page 3 of 28

Treasure Island SAN FRANCISCO, CALIFORNIA
Wind Comfort Analysis Project Scenario Wind Test Date: Jan 2010 _______________________________________________________________________________________________________
The ratios of pedestrian-level wind speeds to the reference height wind speeds at the oldAlameda NAS meteorological station are shown in the first line of output for each location. The second line of the output shows the pedestrian level wind speeds, in mph, which would be exceeded 10% of the time for each measurement location. This assumes wind comfort criteriaof 11 mph for areas of substantial public pedestrian use and 7 mph for public seating areas. These criteria are not to be exceeded more than 10% of the time. The third line of output for each location shows the criterion speed and the percentage of the time the criterion would be exceeded. The rows labeled CONTRIB tabulate the percentage contribution to the total or the exceedance from each wind direction. The SUMs are the equivalent number of events._______________________________________________________________________________________________________ 10.0% Exc. ---Criterion--- Loca- Ground Speed % Time NNW W SSE OTHER SUM tion Speed Exc. Exc._______________________________________________________________________________________________________ 46 RATIOS 1.3405 0.6438 0.8201 0.9348 13.5 CONTRIB 46.61% 19.47% 19.11% 14.81% 4,380 11.0 18.42 CONTRIB 36.86% 31.77% 15.81% 15.56% 8,067 47 RATIOS 1.2086 0.7154 0.6422 0.8554 13.5 CONTRIB 38.94% 40.85% 9.62% 10.58% 4,380 11.0 18.42 CONTRIB 30.53% 46.94% 9.62% 12.91% 8,068 48 RATIOS 0.5605 0.9148 0.1961 0.5571 13.6 CONTRIB 0.91% 97.71% 0.00% 1.38% 4,380 11.0 19.69 CONTRIB 2.78% 95.07% 0.00% 2.15% 8,626 49 RATIOS 0.5722 0.8487 0.5491 0.6567 13.0 CONTRIB 1.64% 88.70% 5.41% 4.24% 4,380 11.0 18.92 CONTRIB 3.20% 86.08% 6.35% 4.37% 8,286 50 RATIOS 0.7101 0.5157 0.5820 0.6026 9.5 CONTRIB 25.08% 44.66% 19.63% 10.62% 4,380 11.0 5.16 CONTRIB 27.18% 33.38% 28.09% 11.34% 2,261 51 RATIOS 1.1690 0.4263 0.6530 0.7494 10.5 CONTRIB 57.71% 5.17% 20.18% 16.94% 4,380 11.0 8.86 CONTRIB 59.73% 3.78% 20.68% 15.81% 3,882 52 RATIOS 1.2211 0.6771 0.6454 0.8479 13.2 CONTRIB 41.40% 36.34% 11.04% 11.21% 4,380 11.0 16.87 CONTRIB 33.97% 41.82% 10.61% 13.60% 7,389 53 RATIOS 0.7567 0.7079 0.5075 0.6574 11.5 CONTRIB 15.25% 71.09% 6.67% 7.00% 4,380 11.0 11.77 CONTRIB 15.29% 70.69% 6.96% 7.05% 5,153 54 RATIOS 0.6967 0.8073 0.4755 0.6599 12.5 CONTRIB 7.96% 84.72% 2.25% 5.08% 4,380 11.0 16.27 CONTRIB 8.01% 83.15% 3.67% 5.17% 7,128 55 RATIOS 0.8089 0.7407 0.6799 0.7432 12.5 CONTRIB 14.35% 61.98% 15.44% 8.23% 4,380 11.0 15.51 CONTRIB 15.04% 63.40% 12.83% 8.73% 6,794 56 RATIOS 0.7293 0.7342 0.7499 0.7378 12.3 CONTRIB 9.98% 62.41% 19.26% 8.34% 4,380 11.0 14.82 CONTRIB 10.51% 64.23% 16.38% 8.88% 6,492 57 RATIOS 0.6077 0.8877 0.6350 0.7101 13.7 CONTRIB 1.71% 85.24% 8.37% 4.69% 4,380 11.0 21.81 CONTRIB 3.51% 83.37% 7.94% 5.18% 9,551 58 RATIOS 0.4983 0.3153 0.7387 0.5174 6.9 CONTRIB 21.58% 13.72% 44.28% 20.41% 4,380 11.0 2.86 CONTRIB 7.13% 0.36% 82.33% 10.19% 1,253 59 RATIOS 0.6862 0.6310 0.3265 0.5479 10.0 CONTRIB 17.53% 76.18% 0.52% 5.77% 4,380 11.0 7.06 CONTRIB 17.39% 76.96% 0.14% 5.51% 3,092 60 RATIOS 0.7579 0.7868 0.2698 0.6048 12.2 CONTRIB 12.12% 84.06% 0.00% 3.82% 4,380 11.0 14.70 CONTRIB 12.31% 83.64% 0.00% 4.04% 6,440
...................................................................................................................................................WIND TEST POINT DETAIL LISTING, Page 4 of 28

Treasure Island SAN FRANCISCO, CALIFORNIA
Wind Comfort Analysis Project Scenario Wind Test Date: Jan 2010 _______________________________________________________________________________________________________
The ratios of pedestrian-level wind speeds to the reference height wind speeds at the oldAlameda NAS meteorological station are shown in the first line of output for each location. The second line of the output shows the pedestrian level wind speeds, in mph, which would be exceeded 10% of the time for each measurement location. This assumes wind comfort criteriaof 11 mph for areas of substantial public pedestrian use and 7 mph for public seating areas. These criteria are not to be exceeded more than 10% of the time. The third line of output for each location shows the criterion speed and the percentage of the time the criterion would be exceeded. The rows labeled CONTRIB tabulate the percentage contribution to the total or the exceedance from each wind direction. The SUMs are the equivalent number of events._______________________________________________________________________________________________________ 10.0% Exc. ---Criterion--- Loca- Ground Speed % Time NNW W SSE OTHER SUM tion Speed Exc. Exc._______________________________________________________________________________________________________ 61 RATIOS 0.4014 0.6467 0.4020 0.4834 9.8 CONTRIB 0.86% 91.04% 4.41% 3.69% 4,380 11.0 6.34 CONTRIB 0.46% 93.86% 2.42% 3.26% 2,777 62 RATIOS 0.8117 0.3059 0.5355 0.5510 7.7 CONTRIB 52.65% 4.40% 25.55% 17.40% 4,380 11.0 3.84 CONTRIB 61.64% 0.17% 27.75% 10.44% 1,680 63 RATIOS 0.4799 0.4349 0.5803 0.4984 7.8 CONTRIB 11.58% 48.70% 28.93% 10.79% 4,380 11.0 2.23 CONTRIB 6.65% 18.03% 64.53% 10.79% 978 64 RATIOS 0.5465 0.4302 0.5777 0.5182 8.0 CONTRIB 17.71% 43.25% 27.46% 11.58% 4,380 11.0 2.53 CONTRIB 17.52% 14.41% 56.47% 11.60% 1,108 65 RATIOS 0.5624 0.4271 0.7595 0.5830 8.4 CONTRIB 15.81% 32.18% 37.28% 14.73% 4,380 11.0 3.91 CONTRIB 14.43% 8.72% 63.73% 13.12% 1,713 66 RATIOS 0.6026 0.7979 0.7116 0.7041 12.8 CONTRIB 2.90% 74.90% 16.16% 6.04% 4,380 11.0 16.97 CONTRIB 4.36% 76.35% 12.86% 6.43% 7,434 67 RATIOS 0.9354 0.6687 0.4336 0.6792 11.5 CONTRIB 32.65% 57.34% 2.06% 7.95% 4,380 11.0 11.52 CONTRIB 30.66% 58.46% 2.67% 8.21% 5,045 68 RATIOS 0.6397 0.6463 0.7615 0.6825 11.1 CONTRIB 8.98% 57.22% 24.55% 9.26% 4,380 11.0 10.34 CONTRIB 9.03% 57.42% 24.23% 9.32% 4,529 69 RATIOS 1.1442 0.7218 0.8428 0.9030 14.0 CONTRIB 32.96% 36.80% 18.92% 11.32% 4,380 11.0 19.82 CONTRIB 25.70% 45.11% 15.54% 13.65% 8,679 70 RATIOS 0.4826 0.5601 0.2406 0.4278 8.6 CONTRIB 8.22% 87.83% 0.03% 3.92% 4,380 11.0 3.66 CONTRIB 4.25% 93.37% 0.00% 2.38% 1,604 71 RATIOS 0.2175 0.4310 0.4802 0.3763 7.0 CONTRIB 0.05% 70.07% 24.49% 5.38% 4,380 11.0 1.02 CONTRIB 0.00% 36.18% 61.14% 2.68% 449 72 RATIOS 0.5165 0.8507 0.4597 0.6090 12.8 CONTRIB 0.77% 94.75% 1.34% 3.13% 4,380 11.0 17.82 CONTRIB 1.55% 92.18% 2.84% 3.43% 7,804 73 RATIOS 0.4920 0.5518 0.2524 0.4321 8.5 CONTRIB 9.22% 86.34% 0.10% 4.34% 4,380 11.0 3.30 CONTRIB 5.55% 91.56% 0.00% 2.88% 1,446 74 RATIOS 0.9783 0.9772 0.6748 0.8768 15.6 CONTRIB 12.51% 75.06% 5.97% 6.47% 4,380 11.0 28.33 CONTRIB 13.52% 70.48% 6.91% 9.09% 12,410 75 RATIOS 1.1213 0.7962 0.5701 0.8292 13.8 CONTRIB 32.31% 54.75% 4.58% 8.36% 4,380 11.0 21.25 CONTRIB 23.10% 60.48% 6.54% 9.88% 9,307
...................................................................................................................................................WIND TEST POINT DETAIL LISTING, Page 5 of 28

Treasure Island SAN FRANCISCO, CALIFORNIA
Wind Comfort Analysis Project Scenario Wind Test Date: Jan 2010 _______________________________________________________________________________________________________
The ratios of pedestrian-level wind speeds to the reference height wind speeds at the oldAlameda NAS meteorological station are shown in the first line of output for each location. The second line of the output shows the pedestrian level wind speeds, in mph, which would be exceeded 10% of the time for each measurement location. This assumes wind comfort criteriaof 11 mph for areas of substantial public pedestrian use and 7 mph for public seating areas. These criteria are not to be exceeded more than 10% of the time. The third line of output for each location shows the criterion speed and the percentage of the time the criterion would be exceeded. The rows labeled CONTRIB tabulate the percentage contribution to the total or the exceedance from each wind direction. The SUMs are the equivalent number of events._______________________________________________________________________________________________________ 10.0% Exc. ---Criterion--- Loca- Ground Speed % Time NNW W SSE OTHER SUM tion Speed Exc. Exc._______________________________________________________________________________________________________ 76 RATIOS 0.4816 0.8707 0.5314 0.6279 13.1 CONTRIB 0.31% 92.64% 3.89% 3.16% 4,380 11.0 19.71 CONTRIB 0.78% 90.52% 5.20% 3.50% 8,632 77 RATIOS 0.9764 0.7785 0.5701 0.7750 13.1 CONTRIB 24.43% 61.54% 6.11% 7.91% 4,380 11.0 18.64 CONTRIB 20.49% 63.46% 7.46% 8.60% 8,163 78 RATIOS 0.4863 1.2427 0.7473 0.8254 18.7 CONTRIB 0.00% 94.31% 3.55% 2.13% 4,380 11.0 29.90 CONTRIB 0.56% 84.48% 8.06% 6.90% 13,096 79 RATIOS 1.0154 0.8126 1.1368 0.9883 15.1 CONTRIB 16.27% 42.41% 29.53% 11.79% 4,380 11.0 25.39 CONTRIB 16.15% 54.60% 16.87% 12.39% 11,122 80 RATIOS 0.8560 1.0434 1.0364 0.9786 17.1 CONTRIB 4.82% 68.92% 19.21% 7.04% 4,380 11.0 31.20 CONTRIB 9.32% 68.24% 12.52% 9.91% 13,667 81 RATIOS 1.5260 0.8513 1.1482 1.1752 17.3 CONTRIB 37.69% 25.56% 22.95% 13.80% 4,380 11.0 33.58 CONTRIB 25.58% 49.03% 12.88% 12.51% 14,710 82 RATIOS 0.7968 1.2713 0.2569 0.7750 18.9 CONTRIB 1.10% 97.51% 0.00% 1.39% 4,380 11.0 29.63 CONTRIB 7.42% 87.17% 0.00% 5.41% 12,978 83 RATIOS 1.0068 0.4130 0.5857 0.6685 9.4 CONTRIB 53.50% 9.87% 20.14% 16.49% 4,380 11.0 6.64 CONTRIB 60.76% 3.77% 22.12% 13.35% 2,910 84 RATIOS 0.8573 0.9736 0.5587 0.7966 15.1 CONTRIB 8.59% 84.56% 1.76% 5.09% 4,380 11.0 25.92 CONTRIB 11.29% 76.76% 5.05% 6.90% 11,354 85 RATIOS 1.0252 0.6779 0.5756 0.7596 12.3 CONTRIB 34.23% 47.32% 8.89% 9.56% 4,380 11.0 14.15 CONTRIB 29.48% 50.06% 10.02% 10.44% 6,199 86 RATIOS 0.7413 0.6909 0.3814 0.6045 11.0 CONTRIB 16.69% 76.39% 0.96% 5.97% 4,380 11.0 9.95 CONTRIB 16.69% 76.40% 0.95% 5.96% 4,356 87 RATIOS 0.6814 0.7897 0.4340 0.6350 12.2 CONTRIB 8.07% 85.87% 1.23% 4.83% 4,380 11.0 14.70 CONTRIB 8.13% 84.84% 2.11% 4.91% 6,437 88 RATIOS 0.4514 1.0017 1.0248 0.8260 16.1 CONTRIB 0.01% 74.18% 21.25% 4.56% 4,380 11.0 26.48 CONTRIB 0.33% 77.27% 14.59% 7.81% 11,597 89 RATIOS 0.4861 1.0136 1.0097 0.8365 16.2 CONTRIB 0.03% 75.08% 20.26% 4.63% 4,380 11.0 26.84 CONTRIB 0.62% 77.10% 14.18% 8.10% 11,758 90 RATIOS 0.7328 0.7620 0.9527 0.8158 13.2 CONTRIB 7.78% 55.52% 27.24% 9.47% 4,380 11.0 18.07 CONTRIB 8.78% 60.46% 19.88% 10.88% 7,917
...................................................................................................................................................WIND TEST POINT DETAIL LISTING, Page 6 of 28

Treasure Island SAN FRANCISCO, CALIFORNIA
Wind Comfort Analysis Project Scenario Wind Test Date: Jan 2010 _______________________________________________________________________________________________________
The ratios of pedestrian-level wind speeds to the reference height wind speeds at the oldAlameda NAS meteorological station are shown in the first line of output for each location. The second line of the output shows the pedestrian level wind speeds, in mph, which would be exceeded 10% of the time for each measurement location. This assumes wind comfort criteriaof 11 mph for areas of substantial public pedestrian use and 7 mph for public seating areas. These criteria are not to be exceeded more than 10% of the time. The third line of output for each location shows the criterion speed and the percentage of the time the criterion would be exceeded. The rows labeled CONTRIB tabulate the percentage contribution to the total or the exceedance from each wind direction. The SUMs are the equivalent number of events._______________________________________________________________________________________________________ 10.0% Exc. ---Criterion--- Loca- Ground Speed % Time NNW W SSE OTHER SUM tion Speed Exc. Exc._______________________________________________________________________________________________________ 91 RATIOS 0.6430 0.4797 0.5355 0.5527 8.7 CONTRIB 23.53% 46.39% 19.61% 10.47% 4,380 11.0 3.37 CONTRIB 28.29% 28.02% 31.61% 12.08% 1,475 92 RATIOS 0.5756 0.8750 0.4183 0.6229 13.1 CONTRIB 1.56% 94.99% 0.40% 3.06% 4,380 11.0 19.43 CONTRIB 3.18% 92.24% 1.14% 3.44% 8,512 93 RATIOS 0.5840 1.2086 0.3089 0.7005 17.9 CONTRIB 0.10% 98.99% 0.00% 0.91% 4,380
11.0 26.31 CONTRIB 2.49% 93.44% 0.01% 4.06% 11,523
94 RATIOS 0.4783 0.9709 0.4879 0.6457
14.5 CONTRIB 0.12% 96.93% 0.73% 2.23% 4,380
11.0 21.44 CONTRIB 0.67% 92.57% 3.16% 3.60% 9,389
95 RATIOS 0.6977 0.5991 0.5505 0.6158
10.2 CONTRIB 17.48% 58.90% 15.05% 8.58% 4,380
11.0 7.65 CONTRIB 17.14% 58.60% 15.91% 8.35% 3,350
96 RATIOS 0.4216 0.7677 0.5144 0.5679
11.7 CONTRIB 0.26% 89.78% 6.52% 3.44% 4,380
11.0 12.62 CONTRIB 0.37% 89.03% 6.93% 3.66% 5,525
97 RATIOS 0.6511 0.6850 0.5722 0.6361
11.1 CONTRIB 9.49% 70.00% 13.63% 6.89% 4,380
11.0 10.49 CONTRIB 9.54% 70.18% 13.36% 6.93% 4,595
98 RATIOS 1.0160 0.5644 1.1537 0.9113
12.6 CONTRIB 32.15% 11.93% 38.02% 17.89% 4,380
11.0 14.79 CONTRIB 27.75% 24.29% 29.39% 18.57% 6,478
99 RATIOS 0.7881 0.6403 1.0913 0.8399
12.4 CONTRIB 13.17% 36.69% 36.48% 13.65% 4,380
11.0 14.16 CONTRIB 14.88% 40.48% 29.04% 15.60% 6,204
100 RATIOS 0.7105 1.0325 0.3795 0.7075
15.5 CONTRIB 2.29% 95.18% 0.00% 2.53% 4,380
11.0 23.68 CONTRIB 5.94% 88.98% 0.38% 4.70% 10,373
101 RATIOS 0.5975 0.7981 0.7626 0.7194
12.9 CONTRIB 2.53% 72.79% 18.30% 6.38% 4,380
11.0 17.39 CONTRIB 4.12% 74.59% 14.45% 6.84% 7,616
102 RATIOS 0.5461 1.0629 0.4561 0.6884
15.8 CONTRIB 0.18% 97.79% 0.06% 1.97% 4,380
11.0 23.61 CONTRIB 1.87% 91.84% 2.06% 4.22% 10,339
103 RATIOS 0.4761 0.9958 0.5493 0.6737
14.9 CONTRIB 0.08% 95.85% 1.67% 2.39% 4,380
11.0 22.60 CONTRIB 0.62% 90.01% 5.33% 4.05% 9,899
104 RATIOS 0.6697 0.7479 0.3818 0.5998
11.5 CONTRIB 9.26% 85.38% 0.61% 4.75% 4,380
11.0 11.98 CONTRIB 9.32% 85.09% 0.80% 4.80% 5,248
105 RATIOS 0.5430 0.7193 0.4191 0.5605
11.0 CONTRIB 4.28% 89.00% 2.30% 4.42% 4,380
11.0 9.90 CONTRIB 4.24% 89.08% 2.27% 4.41% 4,338
...................................................................................................................................................
WIND TEST POINT DETAIL LISTING, Page 7 of 28
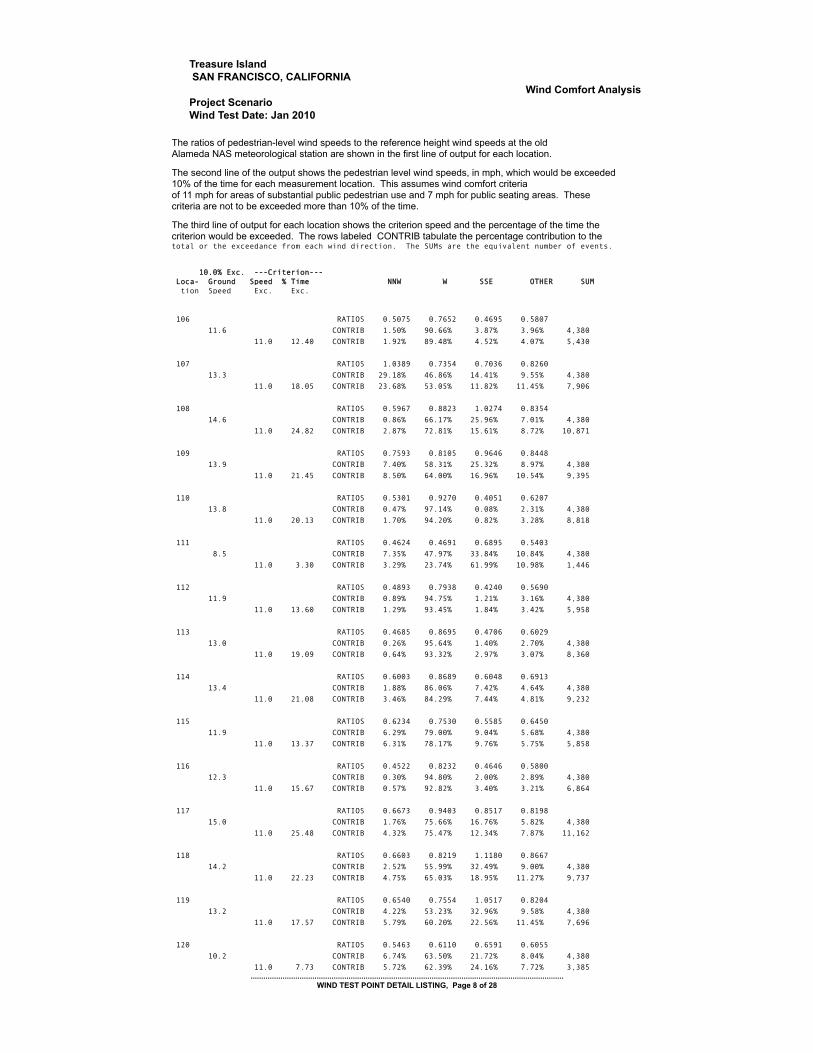
Treasure Island SAN FRANCISCO, CALIFORNIA
Wind Comfort Analysis Project Scenario Wind Test Date: Jan 2010 _______________________________________________________________________________________________________
The ratios of pedestrian-level wind speeds to the reference height wind speeds at the oldAlameda NAS meteorological station are shown in the first line of output for each location. The second line of the output shows the pedestrian level wind speeds, in mph, which would be exceeded 10% of the time for each measurement location. This assumes wind comfort criteriaof 11 mph for areas of substantial public pedestrian use and 7 mph for public seating areas. These criteria are not to be exceeded more than 10% of the time. The third line of output for each location shows the criterion speed and the percentage of the time the criterion would be exceeded. The rows labeled CONTRIB tabulate the percentage contribution to the total or the exceedance from each wind direction. The SUMs are the equivalent number of events._______________________________________________________________________________________________________ 10.0% Exc. ---Criterion--- Loca- Ground Speed % Time NNW W SSE OTHER SUM tion Speed Exc. Exc._______________________________________________________________________________________________________
106 RATIOS 0.5075 0.7652 0.4695 0.5807
11.6 CONTRIB 1.50% 90.66% 3.87% 3.96% 4,380
11.0 12.40 CONTRIB 1.92% 89.48% 4.52% 4.07% 5,430
107 RATIOS 1.0389 0.7354 0.7036 0.8260
13.3 CONTRIB 29.18% 46.86% 14.41% 9.55% 4,380
11.0 18.05 CONTRIB 23.68% 53.05% 11.82% 11.45% 7,906
108 RATIOS 0.5967 0.8823 1.0274 0.8354
14.6 CONTRIB 0.86% 66.17% 25.96% 7.01% 4,380
11.0 24.82 CONTRIB 2.87% 72.81% 15.61% 8.72% 10,871
109 RATIOS 0.7593 0.8105 0.9646 0.8448
13.9 CONTRIB 7.40% 58.31% 25.32% 8.97% 4,380
11.0 21.45 CONTRIB 8.50% 64.00% 16.96% 10.54% 9,395
110 RATIOS 0.5301 0.9270 0.4051 0.6207
13.8 CONTRIB 0.47% 97.14% 0.08% 2.31% 4,380
11.0 20.13 CONTRIB 1.70% 94.20% 0.82% 3.28% 8,818
111 RATIOS 0.4624 0.4691 0.6895 0.5403
8.5 CONTRIB 7.35% 47.97% 33.84% 10.84% 4,380
11.0 3.30 CONTRIB 3.29% 23.74% 61.99% 10.98% 1,446
112 RATIOS 0.4893 0.7938 0.4240 0.5690
11.9 CONTRIB 0.89% 94.75% 1.21% 3.16% 4,380
11.0 13.60 CONTRIB 1.29% 93.45% 1.84% 3.42% 5,958
113 RATIOS 0.4685 0.8695 0.4706 0.6029
13.0 CONTRIB 0.26% 95.64% 1.40% 2.70% 4,380
11.0 19.09 CONTRIB 0.64% 93.32% 2.97% 3.07% 8,360
114 RATIOS 0.6003 0.8689 0.6048 0.6913
13.4 CONTRIB 1.88% 86.06% 7.42% 4.64% 4,380
11.0 21.08 CONTRIB 3.46% 84.29% 7.44% 4.81% 9,232
115 RATIOS 0.6234 0.7530 0.5585 0.6450
11.9 CONTRIB 6.29% 79.00% 9.04% 5.68% 4,380
11.0 13.37 CONTRIB 6.31% 78.17% 9.76% 5.75% 5,858
116 RATIOS 0.4522 0.8232 0.4646 0.5800
12.3 CONTRIB 0.30% 94.80% 2.00% 2.89% 4,380
11.0 15.67 CONTRIB 0.57% 92.82% 3.40% 3.21% 6,864
117 RATIOS 0.6673 0.9403 0.8517 0.8198
15.0 CONTRIB 1.76% 75.66% 16.76% 5.82% 4,380
11.0 25.48 CONTRIB 4.32% 75.47% 12.34% 7.87% 11,162
118 RATIOS 0.6603 0.8219 1.1180 0.8667
14.2 CONTRIB 2.52% 55.99% 32.49% 9.00% 4,380
11.0 22.23 CONTRIB 4.75% 65.03% 18.95% 11.27% 9,737
119 RATIOS 0.6540 0.7554 1.0517 0.8204
13.2 CONTRIB 4.22% 53.23% 32.96% 9.58% 4,380
11.0 17.57 CONTRIB 5.79% 60.20% 22.56% 11.45% 7,696
120 RATIOS 0.5463 0.6110 0.6591 0.6055
10.2 CONTRIB 6.74% 63.50% 21.72% 8.04% 4,380
11.0 7.73 CONTRIB 5.72% 62.39% 24.16% 7.72% 3,385
...................................................................................................................................................WIND TEST POINT DETAIL LISTING, Page 8 of 28

Treasure Island SAN FRANCISCO, CALIFORNIA
Wind Comfort Analysis Project Scenario Wind Test Date: Jan 2010 _______________________________________________________________________________________________________
The ratios of pedestrian-level wind speeds to the reference height wind speeds at the oldAlameda NAS meteorological station are shown in the first line of output for each location. The second line of the output shows the pedestrian level wind speeds, in mph, which would be exceeded 10% of the time for each measurement location. This assumes wind comfort criteriaof 11 mph for areas of substantial public pedestrian use and 7 mph for public seating areas. These criteria are not to be exceeded more than 10% of the time. The third line of output for each location shows the criterion speed and the percentage of the time the criterion would be exceeded. The rows labeled CONTRIB tabulate the percentage contribution to the total or the exceedance from each wind direction. The SUMs are the equivalent number of events._______________________________________________________________________________________________________ 10.0% Exc. ---Criterion--- Loca- Ground Speed % Time NNW W SSE OTHER SUM tion Speed Exc. Exc._______________________________________________________________________________________________________
121 RATIOS 0.6197 0.7428 0.4806 0.6144
11.5 CONTRIB 6.82% 83.01% 4.96% 5.21% 4,380
11.0 12.03 CONTRIB 6.86% 82.65% 5.23% 5.26% 5,268
122 RATIOS 0.9268 0.5140 0.8126 0.7511
10.8 CONTRIB 35.85% 19.36% 29.63% 15.16% 4,380
11.0 9.42 CONTRIB 36.87% 17.78% 30.35% 15.01% 4,126
123 RATIOS 0.7948 0.4263 1.2152 0.8121
10.6 CONTRIB 25.25% 4.74% 47.53% 22.48% 4,379
11.0 9.02 CONTRIB 24.14% 3.72% 50.73% 21.41% 3,952
124 RATIOS 0.8303 0.5522 0.9930 0.7919
11.3 CONTRIB 23.33% 24.46% 36.48% 15.73% 4,380
11.0 11.11 CONTRIB 23.24% 27.36% 33.69% 15.71% 4,868
125 RATIOS 0.8750 1.1974 0.9236 0.9987
18.7 CONTRIB 2.62% 80.86% 11.28% 5.24% 4,380
11.0 34.17 CONTRIB 9.16% 71.28% 10.19% 9.36% 14,968
126 RATIOS 1.0497 0.6022 1.0764 0.9094
12.9 CONTRIB 32.62% 16.67% 34.63% 16.08% 4,380
11.0 15.72 CONTRIB 27.71% 29.07% 25.81% 17.41% 6,884
127 RATIOS 0.6059 0.7260 0.4463 0.5927
11.2 CONTRIB 6.98% 84.64% 3.33% 5.05% 4,379
11.0 10.84 CONTRIB 6.98% 84.26% 3.71% 5.06% 4,746
128 RATIOS 0.6214 0.8022 0.5328 0.6522
12.4 CONTRIB 4.73% 84.54% 5.77% 4.96% 4,380
11.0 15.89 CONTRIB 5.25% 83.16% 6.53% 5.05% 6,962
129 RATIOS 0.6438 0.6809 0.9656 0.7634
12.1 CONTRIB 6.55% 50.19% 33.05% 10.22% 4,380
11.0 13.31 CONTRIB 7.20% 54.10% 27.37% 11.34% 5,828
130 RATIOS 0.8907 0.6695 0.5224 0.6942
11.6 CONTRIB 27.95% 56.20% 7.40% 8.45% 4,380
11.0 11.97 CONTRIB 27.00% 56.51% 7.88% 8.62% 5,243
131 RATIOS 0.8438 0.5644 0.6901 0.6994
10.8 CONTRIB 29.31% 38.15% 21.19% 11.34% 4,380
11.0 9.46 CONTRIB 29.09% 37.99% 21.68% 11.24% 4,142
132 RATIOS 0.7495 0.2528 1.4139 0.8054
10.5 CONTRIB 21.13% 0.01% 55.97% 22.89% 4,380
11.0 8.92 CONTRIB 19.42% 0.00% 59.64% 20.94% 3,908
133 RATIOS 0.8044 0.2592 1.2554 0.7730
10.3 CONTRIB 29.22% 0.01% 50.35% 20.42% 4,380
11.0 8.60 CONTRIB 26.55% 0.01% 54.99% 18.45% 3,766
134 RATIOS 0.8381 0.6473 1.1015 0.8623
12.7 CONTRIB 15.35% 34.77% 36.01% 13.87% 4,380
11.0 15.26 CONTRIB 17.56% 39.14% 27.21% 16.09% 6,683
135 RATIOS 0.6652 1.0660 0.8501 0.8604
16.7 CONTRIB 0.68% 81.33% 13.36% 4.62% 4,380
11.0 28.40 CONTRIB 3.83% 76.57% 11.03% 8.57% 12,438
...................................................................................................................................................WIND TEST POINT DETAIL LISTING, Page 9 of 28

Treasure Island SAN FRANCISCO, CALIFORNIA
Wind Comfort Analysis Project Scenario Wind Test Date: Jan 2010 _______________________________________________________________________________________________________
The ratios of pedestrian-level wind speeds to the reference height wind speeds at the oldAlameda NAS meteorological station are shown in the first line of output for each location. The second line of the output shows the pedestrian level wind speeds, in mph, which would be exceeded 10% of the time for each measurement location. This assumes wind comfort criteriaof 11 mph for areas of substantial public pedestrian use and 7 mph for public seating areas. These criteria are not to be exceeded more than 10% of the time. The third line of output for each location shows the criterion speed and the percentage of the time the criterion would be exceeded. The rows labeled CONTRIB tabulate the percentage contribution to the total or the exceedance from each wind direction. The SUMs are the equivalent number of events._______________________________________________________________________________________________________ 10.0% Exc. ---Criterion--- Loca- Ground Speed % Time NNW W SSE OTHER SUM tion Speed Exc. Exc._______________________________________________________________________________________________________
136 RATIOS 1.1648 0.8338 0.8856 0.9614
15.3 CONTRIB 26.96% 45.32% 17.49% 10.23% 4,380
11.0 26.86 CONTRIB 19.59% 56.79% 12.44% 11.18% 11,763
137 RATIOS 0.9436 0.6293 1.2797 0.9509
13.1 CONTRIB 21.26% 20.54% 40.37% 17.82% 4,380
11.0 16.73 CONTRIB 21.45% 32.14% 28.80% 17.62% 7,329
138 RATIOS 1.0566 0.7977 0.7677 0.8740
14.2 CONTRIB 24.65% 50.71% 15.23% 9.42% 4,380
11.0 22.46 CONTRIB 19.62% 57.64% 11.34% 11.40% 9,837
139 RATIOS 0.4344 1.0366 0.5726 0.6812
15.5 CONTRIB 0.01% 96.21% 1.71% 2.08% 4,380
11.0 23.58 CONTRIB 0.26% 89.73% 5.95% 4.06% 10,327
140 RATIOS 1.0756 1.0101 0.9666 1.0174
17.0 CONTRIB 12.98% 61.89% 16.79% 8.34% 4,380
11.0 32.13 CONTRIB 14.17% 64.21% 11.35% 10.28% 14,071
141 RATIOS 0.7467 0.9968 0.7940 0.8458
15.7 CONTRIB 3.04% 78.76% 12.74% 5.45% 4,380
11.0 27.07 CONTRIB 6.31% 75.22% 10.08% 8.40% 11,856
142 RATIOS 0.6511 1.1421 1.1799 0.9910
18.4 CONTRIB 0.22% 72.84% 21.46% 5.48% 4,380
11.0 31.86 CONTRIB 3.14% 73.00% 13.95% 9.92% 13,956
143 RATIOS 0.6660 1.0242 0.9819 0.8907
16.4 CONTRIB 0.81% 74.80% 18.70% 5.69% 4,380
11.0 28.35 CONTRIB 3.85% 73.76% 13.06% 9.32% 12,416
144 RATIOS 1.1611 0.6142 0.9170 0.8974
12.9 CONTRIB 39.08% 19.39% 26.37% 15.16% 4,380
11.0 16.28 CONTRIB 32.12% 30.19% 21.25% 16.44% 7,131
145 RATIOS 0.9548 1.2609 0.8999 1.0385
19.6 CONTRIB 3.76% 83.10% 8.01% 5.13% 4,380
11.0 36.10 CONTRIB 10.16% 70.98% 9.40% 9.46% 15,812
146 RATIOS 0.8517 0.9638 0.8505 0.8887
15.6 CONTRIB 7.21% 70.70% 15.32% 6.76% 4,380
11.0 28.32 CONTRIB 10.07% 69.56% 11.07% 9.30% 12,406
147 RATIOS 0.9676 0.8175 1.5733 1.1195
16.1 CONTRIB 10.64% 33.59% 40.53% 15.23% 4,380
11.0 27.72 CONTRIB 13.55% 51.14% 21.35% 13.97% 12,143
148 RATIOS 0.7618 1.1213 0.6209 0.8347
16.9 CONTRIB 1.94% 92.76% 1.59% 3.71% 4,380
11.0 28.50 CONTRIB 6.48% 80.15% 5.80% 7.56% 12,483
149 RATIOS 0.8556 0.6012 1.1036 0.8535
12.2 CONTRIB 19.67% 26.88% 37.65% 15.80% 4,380
11.0 13.96 CONTRIB 20.80% 32.53% 29.79% 16.88% 6,115
150 RATIOS 1.0987 0.3765 0.7783 0.7512
10.5 CONTRIB 51.90% 1.71% 29.05% 17.34% 4,380
11.0 8.87 CONTRIB 53.33% 1.21% 29.52% 15.94% 3,886
...................................................................................................................................................WIND TEST POINT DETAIL LISTING, Page 10 of 28

Treasure Island SAN FRANCISCO, CALIFORNIA
Wind Comfort Analysis Project Scenario Wind Test Date: Jan 2010 _______________________________________________________________________________________________________
The ratios of pedestrian-level wind speeds to the reference height wind speeds at the oldAlameda NAS meteorological station are shown in the first line of output for each location. The second line of the output shows the pedestrian level wind speeds, in mph, which would be exceeded 10% of the time for each measurement location. This assumes wind comfort criteriaof 11 mph for areas of substantial public pedestrian use and 7 mph for public seating areas. These criteria are not to be exceeded more than 10% of the time. The third line of output for each location shows the criterion speed and the percentage of the time the criterion would be exceeded. The rows labeled CONTRIB tabulate the percentage contribution to the total or the exceedance from each wind direction. The SUMs are the equivalent number of events._______________________________________________________________________________________________________ 10.0% Exc. ---Criterion--- Loca- Ground Speed % Time NNW W SSE OTHER SUM tion Speed Exc. Exc._______________________________________________________________________________________________________
151 RATIOS 1.1036 0.5275 0.9048 0.8453
11.9 CONTRIB 41.59% 11.12% 30.52% 16.77% 4,380
11.0 12.53 CONTRIB 38.07% 16.59% 27.24% 18.10% 5,488
152 RATIOS 0.5859 0.8368 0.7238 0.7155
13.3 CONTRIB 1.66% 77.37% 15.46% 5.52% 4,380
11.0 19.54 CONTRIB 3.39% 79.08% 11.56% 5.96% 8,557
153 RATIOS 0.8262 1.2756 1.0811 1.0610
20.1 CONTRIB 0.90% 79.05% 15.00% 5.05% 4,380
11.0 36.06 CONTRIB 7.03% 71.86% 11.30% 9.82% 15,796
154 RATIOS 0.8411 0.4920 1.3737 0.9023
11.7 CONTRIB 21.37% 6.99% 48.63% 23.01% 4,380
11.0 11.75 CONTRIB 23.11% 9.92% 43.99% 22.98% 5,148
155 RATIOS 0.9536 0.7985 0.7577 0.8366
13.8 CONTRIB 18.55% 56.80% 15.75% 8.90% 4,380
11.0 21.31 CONTRIB 17.17% 60.98% 11.64% 10.21% 9,332
156 RATIOS 0.7920 0.9358 1.0221 0.9166
15.6 CONTRIB 5.37% 64.39% 22.45% 7.79% 4,380
11.0 27.92 CONTRIB 7.70% 68.57% 13.80% 9.93% 12,228
157 RATIOS 1.1158 0.4571 1.0940 0.8890
12.1 CONTRIB 40.91% 2.65% 37.50% 18.94% 4,380
11.0 12.26 CONTRIB 39.70% 5.16% 33.64% 21.50% 5,368
158 RATIOS 0.7811 0.7316 0.8371 0.7833
12.7 CONTRIB 11.77% 55.87% 22.83% 9.53% 4,380
11.0 16.14 CONTRIB 12.61% 58.22% 18.82% 10.36% 7,070
159 RATIOS 1.0544 0.7969 0.7344 0.8619
14.1 CONTRIB 25.06% 51.71% 14.09% 9.14% 4,380
11.0 22.07 CONTRIB 19.90% 58.45% 10.55% 11.11% 9,665
160 RATIOS 0.3159 0.8032 0.9483 0.6892
13.2 CONTRIB 0.00% 68.02% 27.11% 4.87% 4,380
11.0 17.86 CONTRIB 0.01% 74.35% 20.03% 5.61% 7,822
161 RATIOS 0.8632 0.6285 0.9107 0.8008
12.1 CONTRIB 20.61% 37.39% 29.60% 12.40% 4,380
11.0 13.62 CONTRIB 22.07% 39.30% 25.22% 13.41% 5,966
162 RATIOS 0.7799 0.9572 0.4879 0.7416
14.6 CONTRIB 6.65% 88.43% 0.66% 4.26% 4,380
11.0 23.61 CONTRIB 8.57% 82.88% 2.86% 5.69% 10,342
163 RATIOS 1.0699 1.0564 0.4208 0.8490
16.5 CONTRIB 14.22% 81.24% 0.00% 4.54% 4,380
11.0 28.60 CONTRIB 15.76% 75.35% 0.82% 8.07% 12,527
164 RATIOS 1.0472 0.4573 0.9248 0.8098
11.2 CONTRIB 42.16% 5.53% 34.36% 17.95% 4,380
11.0 10.37 CONTRIB 41.82% 6.12% 33.65% 18.42% 4,541
165 RATIOS 0.8487 0.8923 1.0697 0.9369
15.3 CONTRIB 7.75% 57.60% 25.53% 9.12% 4,380
11.0 27.99 CONTRIB 10.05% 65.27% 14.40% 10.27% 12,261
...................................................................................................................................................WIND TEST POINT DETAIL LISTING, Page 11 of 28

Treasure Island SAN FRANCISCO, CALIFORNIA
Wind Comfort Analysis Project Scenario Wind Test Date: Jan 2010 _______________________________________________________________________________________________________
The ratios of pedestrian-level wind speeds to the reference height wind speeds at the oldAlameda NAS meteorological station are shown in the first line of output for each location. The second line of the output shows the pedestrian level wind speeds, in mph, which would be exceeded 10% of the time for each measurement location. This assumes wind comfort criteriaof 11 mph for areas of substantial public pedestrian use and 7 mph for public seating areas. These criteria are not to be exceeded more than 10% of the time. The third line of output for each location shows the criterion speed and the percentage of the time the criterion would be exceeded. The rows labeled CONTRIB tabulate the percentage contribution to the total or the exceedance from each wind direction. The SUMs are the equivalent number of events._______________________________________________________________________________________________________ 10.0% Exc. ---Criterion--- Loca- Ground Speed % Time NNW W SSE OTHER SUM tion Speed Exc. Exc._______________________________________________________________________________________________________
166 RATIOS 1.1560 0.6309 0.9572 0.9147
13.2 CONTRIB 37.26% 20.22% 27.53% 14.99% 4,380
11.0 16.99 CONTRIB 30.54% 31.95% 21.25% 16.26% 7,441
167 RATIOS 0.8926 0.5244 0.9177 0.7783
11.1 CONTRIB 31.86% 18.21% 34.28% 15.65% 4,380
11.0 10.31 CONTRIB 31.46% 19.18% 33.57% 15.80% 4,517
168 RATIOS 0.9136 0.8281 0.6640 0.8019
13.7 CONTRIB 15.95% 65.99% 10.42% 7.64% 4,380
11.0 21.99 CONTRIB 15.39% 67.63% 8.62% 8.35% 9,630
169 RATIOS 0.7354 0.6285 0.7173 0.6937
11.1 CONTRIB 15.71% 52.33% 21.91% 10.04% 4,380
11.0 10.21 CONTRIB 15.76% 52.43% 21.73% 10.08% 4,471
170 RATIOS 0.7336 0.6775 0.6128 0.6746
11.4 CONTRIB 14.06% 62.76% 15.09% 8.09% 4,380
11.0 11.19 CONTRIB 14.24% 63.15% 14.39% 8.22% 4,903
171 RATIOS 0.8152 0.6983 1.3464 0.9533
13.7 CONTRIB 10.15% 34.04% 40.67% 15.14% 4,380
11.0 18.34 CONTRIB 13.11% 43.11% 27.63% 16.14% 8,033
172 RATIOS 0.8413 0.9313 0.2806 0.6844
14.3 CONTRIB 9.78% 87.03% 0.00% 3.19% 4,380
11.0 22.75 CONTRIB 11.95% 83.76% 0.00% 4.28% 9,963
173 RATIOS 0.9976 0.5471 0.7883 0.7777
11.3 CONTRIB 37.74% 22.33% 25.40% 14.53% 4,380
11.0 11.10 CONTRIB 35.77% 25.37% 24.22% 14.64% 4,861
174 RATIOS 0.6460 0.5293 0.7693 0.6482
9.9 CONTRIB 14.61% 41.79% 31.66% 11.93% 4,380
11.0 6.45 CONTRIB 15.04% 33.14% 39.66% 12.16% 2,825
175 RATIOS 1.1756 0.6163 0.7668 0.8529
12.6 CONTRIB 41.95% 24.93% 19.35% 13.76% 4,380
11.0 15.22 CONTRIB 35.15% 32.72% 16.69% 15.44% 6,666
176 RATIOS 0.9468 0.4708 0.8664 0.7613
10.6 CONTRIB 38.39% 10.71% 33.81% 17.08% 4,380
11.0 9.17 CONTRIB 39.38% 8.82% 35.52% 16.27% 4,015
177 RATIOS 0.8695 0.3775 0.7701 0.6724
9.3 CONTRIB 42.23% 5.28% 34.48% 18.01% 4,380
11.0 6.67 CONTRIB 46.34% 1.65% 38.40% 13.60% 2,923
178 RATIOS 0.4165 0.3559 1.0187 0.5971
7.7 CONTRIB 6.98% 15.05% 54.65% 23.31% 4,380
11.0 4.51 CONTRIB 0.92% 1.43% 85.14% 12.51% 1,976
179 RATIOS 1.0495 0.7717 0.9936 0.9383
14.5 CONTRIB 22.19% 41.59% 24.69% 11.54% 4,380
11.0 22.43 CONTRIB 19.41% 51.03% 16.70% 12.86% 9,824
180 RATIOS 1.0438 1.1666 0.3661 0.8589
17.9 CONTRIB 9.46% 87.31% 0.00% 3.23% 4,380
11.0 30.54 CONTRIB 14.11% 77.76% 0.21% 7.91% 13,376
...................................................................................................................................................WIND TEST POINT DETAIL LISTING, Page 12 of 28
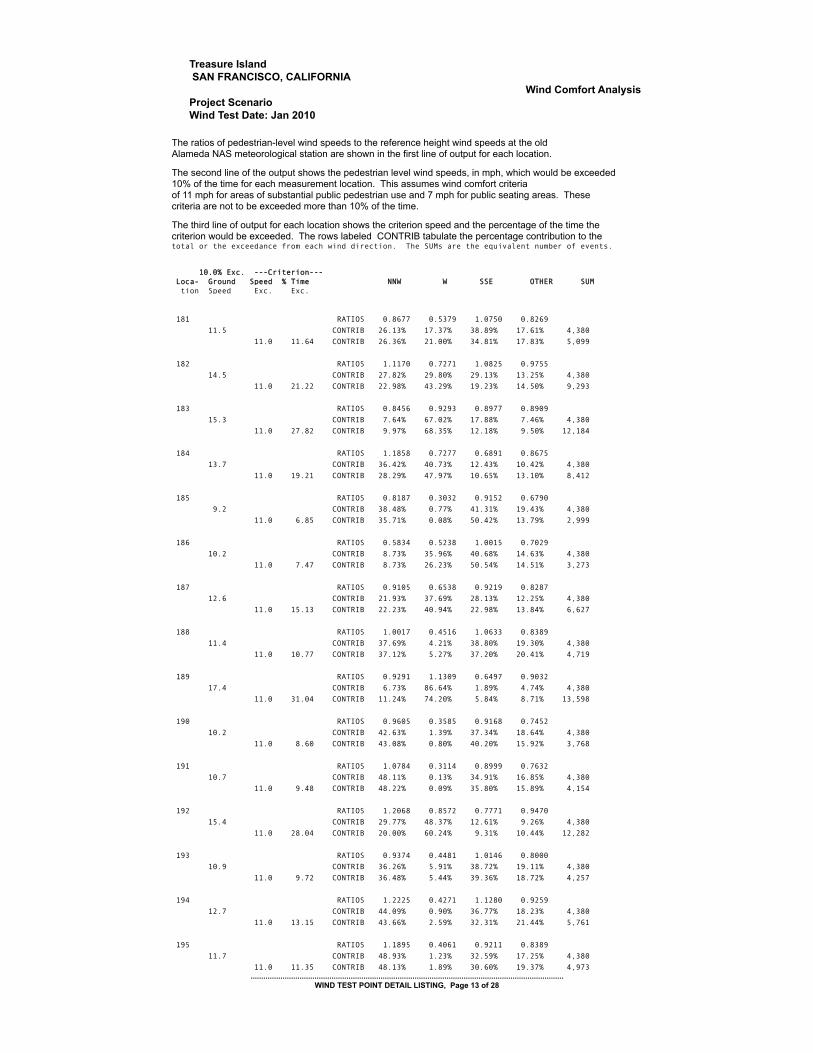
Treasure Island SAN FRANCISCO, CALIFORNIA
Wind Comfort Analysis Project Scenario Wind Test Date: Jan 2010 _______________________________________________________________________________________________________
The ratios of pedestrian-level wind speeds to the reference height wind speeds at the oldAlameda NAS meteorological station are shown in the first line of output for each location. The second line of the output shows the pedestrian level wind speeds, in mph, which would be exceeded 10% of the time for each measurement location. This assumes wind comfort criteriaof 11 mph for areas of substantial public pedestrian use and 7 mph for public seating areas. These criteria are not to be exceeded more than 10% of the time. The third line of output for each location shows the criterion speed and the percentage of the time the criterion would be exceeded. The rows labeled CONTRIB tabulate the percentage contribution to the total or the exceedance from each wind direction. The SUMs are the equivalent number of events._______________________________________________________________________________________________________ 10.0% Exc. ---Criterion--- Loca- Ground Speed % Time NNW W SSE OTHER SUM tion Speed Exc. Exc._______________________________________________________________________________________________________
181 RATIOS 0.8677 0.5379 1.0750 0.8269
11.5 CONTRIB 26.13% 17.37% 38.89% 17.61% 4,380
11.0 11.64 CONTRIB 26.36% 21.00% 34.81% 17.83% 5,099
182 RATIOS 1.1170 0.7271 1.0825 0.9755
14.5 CONTRIB 27.82% 29.80% 29.13% 13.25% 4,380
11.0 21.22 CONTRIB 22.98% 43.29% 19.23% 14.50% 9,293
183 RATIOS 0.8456 0.9293 0.8977 0.8909
15.3 CONTRIB 7.64% 67.02% 17.88% 7.46% 4,380
11.0 27.82 CONTRIB 9.97% 68.35% 12.18% 9.50% 12,184
184 RATIOS 1.1858 0.7277 0.6891 0.8675
13.7 CONTRIB 36.42% 40.73% 12.43% 10.42% 4,380
11.0 19.21 CONTRIB 28.29% 47.97% 10.65% 13.10% 8,412
185 RATIOS 0.8187 0.3032 0.9152 0.6790
9.2 CONTRIB 38.48% 0.77% 41.31% 19.43% 4,380
11.0 6.85 CONTRIB 35.71% 0.08% 50.42% 13.79% 2,999
186 RATIOS 0.5834 0.5238 1.0015 0.7029
10.2 CONTRIB 8.73% 35.96% 40.68% 14.63% 4,380
11.0 7.47 CONTRIB 8.73% 26.23% 50.54% 14.51% 3,273
187 RATIOS 0.9105 0.6538 0.9219 0.8287
12.6 CONTRIB 21.93% 37.69% 28.13% 12.25% 4,380
11.0 15.13 CONTRIB 22.23% 40.94% 22.98% 13.84% 6,627
188 RATIOS 1.0017 0.4516 1.0633 0.8389
11.4 CONTRIB 37.69% 4.21% 38.80% 19.30% 4,380
11.0 10.77 CONTRIB 37.12% 5.27% 37.20% 20.41% 4,719
189 RATIOS 0.9291 1.1309 0.6497 0.9032
17.4 CONTRIB 6.73% 86.64% 1.89% 4.74% 4,380
11.0 31.04 CONTRIB 11.24% 74.20% 5.84% 8.71% 13,598
190 RATIOS 0.9605 0.3585 0.9168 0.7452
10.2 CONTRIB 42.63% 1.39% 37.34% 18.64% 4,380
11.0 8.60 CONTRIB 43.08% 0.80% 40.20% 15.92% 3,768
191 RATIOS 1.0784 0.3114 0.8999 0.7632
10.7 CONTRIB 48.11% 0.13% 34.91% 16.85% 4,380
11.0 9.48 CONTRIB 48.22% 0.09% 35.80% 15.89% 4,154
192 RATIOS 1.2068 0.8572 0.7771 0.9470
15.4 CONTRIB 29.77% 48.37% 12.61% 9.26% 4,380
11.0 28.04 CONTRIB 20.00% 60.24% 9.31% 10.44% 12,282
193 RATIOS 0.9374 0.4481 1.0146 0.8000
10.9 CONTRIB 36.26% 5.91% 38.72% 19.11% 4,380
11.0 9.72 CONTRIB 36.48% 5.44% 39.36% 18.72% 4,257
194 RATIOS 1.2225 0.4271 1.1280 0.9259
12.7 CONTRIB 44.09% 0.90% 36.77% 18.23% 4,380
11.0 13.15 CONTRIB 43.66% 2.59% 32.31% 21.44% 5,761
195 RATIOS 1.1895 0.4061 0.9211 0.8389
11.7 CONTRIB 48.93% 1.23% 32.59% 17.25% 4,380
11.0 11.35 CONTRIB 48.13% 1.89% 30.60% 19.37% 4,973
...................................................................................................................................................WIND TEST POINT DETAIL LISTING, Page 13 of 28

Treasure Island SAN FRANCISCO, CALIFORNIA
Wind Comfort Analysis Project Scenario Wind Test Date: Jan 2010 _______________________________________________________________________________________________________
The ratios of pedestrian-level wind speeds to the reference height wind speeds at the oldAlameda NAS meteorological station are shown in the first line of output for each location. The second line of the output shows the pedestrian level wind speeds, in mph, which would be exceeded 10% of the time for each measurement location. This assumes wind comfort criteriaof 11 mph for areas of substantial public pedestrian use and 7 mph for public seating areas. These criteria are not to be exceeded more than 10% of the time. The third line of output for each location shows the criterion speed and the percentage of the time the criterion would be exceeded. The rows labeled CONTRIB tabulate the percentage contribution to the total or the exceedance from each wind direction. The SUMs are the equivalent number of events._______________________________________________________________________________________________________ 10.0% Exc. ---Criterion--- Loca- Ground Speed % Time NNW W SSE OTHER SUM tion Speed Exc. Exc._______________________________________________________________________________________________________
196 RATIOS 0.7103 0.5148 1.0986 0.7745
10.6 CONTRIB 16.10% 22.67% 42.86% 18.37% 4,380
11.0 8.84 CONTRIB 15.89% 19.19% 46.83% 18.08% 3,872
197 RATIOS 0.7001 0.8217 0.9470 0.8229
13.8 CONTRIB 5.22% 62.05% 24.54% 8.18% 4,380
11.0 21.38 CONTRIB 6.21% 67.56% 16.71% 9.53% 9,364
198 RATIOS 1.0584 0.8672 1.1029 1.0095
15.7 CONTRIB 16.47% 46.82% 25.69% 11.01% 4,380
11.0 29.47 CONTRIB 15.00% 59.84% 14.10% 11.06% 12,907
199 RATIOS 1.0042 0.4546 0.9905 0.8164
11.2 CONTRIB 39.18% 5.31% 36.84% 18.67% 4,380
11.0 10.33 CONTRIB 38.90% 5.84% 36.16% 19.10% 4,524
200 RATIOS 0.9764 0.5869 1.4274 0.9969
13.2 CONTRIB 23.60% 10.83% 44.67% 20.90% 4,380
11.0 16.53 CONTRIB 23.09% 25.12% 32.49% 19.30% 7,242
201 RATIOS 0.7124 0.8785 0.6395 0.7435
13.8 CONTRIB 5.89% 80.19% 8.41% 5.50% 4,380
11.0 22.53 CONTRIB 6.31% 79.87% 7.80% 6.02% 9,868
202 RATIOS 0.5852 0.6646 0.8248 0.6915
11.4 CONTRIB 5.77% 57.92% 27.47% 8.85% 4,380
11.0 11.20 CONTRIB 5.89% 58.75% 26.30% 9.06% 4,907
203 RATIOS 0.7540 0.8250 1.5388 1.0393
15.5 CONTRIB 3.81% 41.62% 41.27% 13.30% 4,380
11.0 25.64 CONTRIB 6.92% 57.17% 22.57% 13.34% 11,232
204 RATIOS 0.7397 0.9301 1.0172 0.8957
15.4 CONTRIB 3.39% 66.24% 22.86% 7.50% 4,380
11.0 27.18 CONTRIB 6.06% 70.02% 14.11% 9.82% 11,903
205 RATIOS 0.9854 0.9015 1.1448 1.0106
16.0 CONTRIB 11.73% 51.03% 26.85% 10.39% 4,380
11.0 29.92 CONTRIB 12.98% 61.69% 14.42% 10.91% 13,103
206 RATIOS 1.1899 0.9338 1.0854 1.0697
16.8 CONTRIB 19.94% 47.84% 21.65% 10.57% 4,380
11.0 32.25 CONTRIB 16.95% 59.23% 12.68% 11.13% 14,126
...................................................................................................................................................WIND TEST POINT DETAIL LISTING, Page 14 of 28
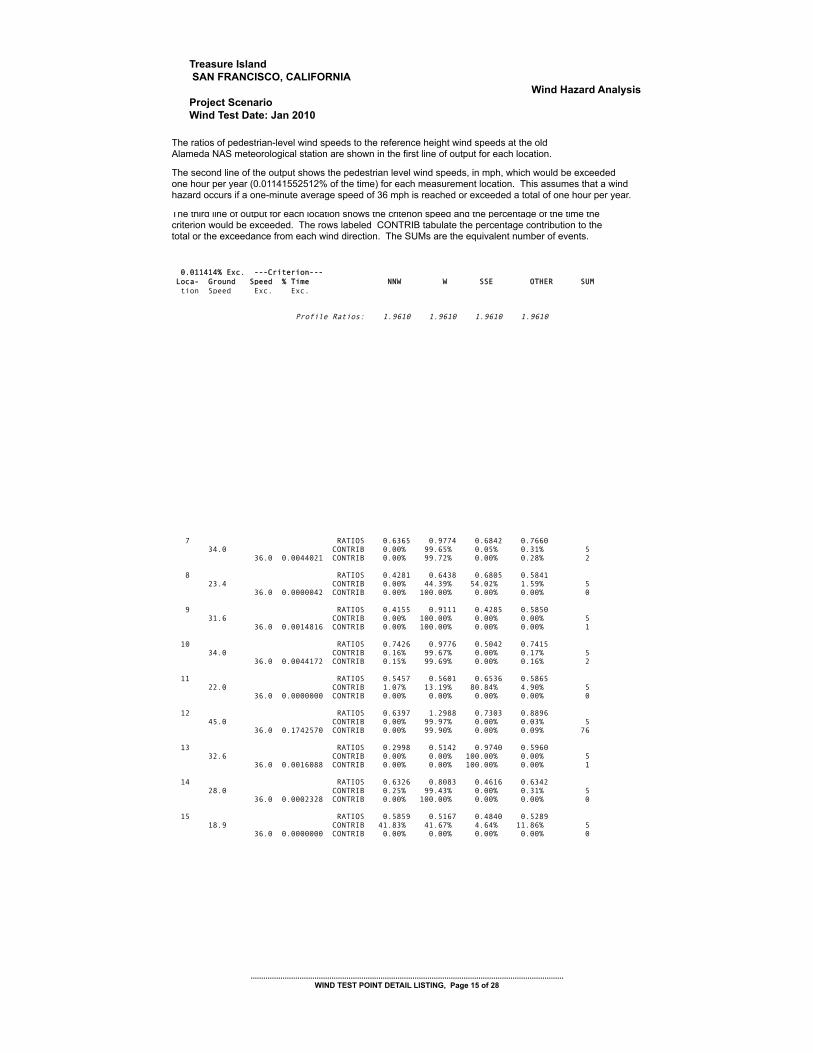
Treasure Island SAN FRANCISCO, CALIFORNIA
Wind Hazard Analysis Project Scenario Wind Test Date: Jan 2010 _______________________________________________________________________________________________________
The ratios of pedestrian-level wind speeds to the reference height wind speeds at the oldAlameda NAS meteorological station are shown in the first line of output for each location. The second line of the output shows the pedestrian level wind speeds, in mph, which would be exceeded one hour per year (0.01141552512% of the time) for each measurement location. This assumes that a windhazard occurs if a one-minute average speed of 36 mph is reached or exceeded a total of one hour per year. The third line of output for each location shows the criterion speed and the percentage of the time the criterion would be exceeded. The rows labeled CONTRIB tabulate the percentage contribution to the total or the exceedance from each wind direction. The SUMs are the equivalent number of events. _______________________________________________________________________________________________________ 0.011414% Exc. ---Criterion--- Loca- Ground Speed % Time NNW W SSE OTHER SUM tion Speed Exc. Exc._______________________________________________________________________________________________________ Profile Ratios: 1.9610 1.9610 1.9610 1.9610 7 RATIOS 0.6365 0.9774 0.6842 0.7660 34.0 CONTRIB 0.00% 99.65% 0.05% 0.31% 5 36.0 0.0044021 CONTRIB 0.00% 99.72% 0.00% 0.28% 2 8 RATIOS 0.4281 0.6438 0.6805 0.5841 23.4 CONTRIB 0.00% 44.39% 54.02% 1.59% 5 36.0 0.0000042 CONTRIB 0.00% 100.00% 0.00% 0.00% 0 9 RATIOS 0.4155 0.9111 0.4285 0.5850 31.6 CONTRIB 0.00% 100.00% 0.00% 0.00% 5 36.0 0.0014816 CONTRIB 0.00% 100.00% 0.00% 0.00% 1 10 RATIOS 0.7426 0.9776 0.5042 0.7415 34.0 CONTRIB 0.16% 99.67% 0.00% 0.17% 5 36.0 0.0044172 CONTRIB 0.15% 99.69% 0.00% 0.16% 2 11 RATIOS 0.5457 0.5601 0.6536 0.5865 22.0 CONTRIB 1.07% 13.19% 80.84% 4.90% 5 36.0 0.0000000 CONTRIB 0.00% 0.00% 0.00% 0.00% 0 12 RATIOS 0.6397 1.2988 0.7303 0.8896 45.0 CONTRIB 0.00% 99.97% 0.00% 0.03% 5 36.0 0.1742570 CONTRIB 0.00% 99.90% 0.00% 0.09% 76 13 RATIOS 0.2998 0.5142 0.9740 0.5960 32.6 CONTRIB 0.00% 0.00% 100.00% 0.00% 5 36.0 0.0016088 CONTRIB 0.00% 0.00% 100.00% 0.00% 1 14 RATIOS 0.6326 0.8083 0.4616 0.6342 28.0 CONTRIB 0.25% 99.43% 0.00% 0.31% 5 36.0 0.0002328 CONTRIB 0.00% 100.00% 0.00% 0.00% 0 15 RATIOS 0.5859 0.5167 0.4840 0.5289 18.9 CONTRIB 41.83% 41.67% 4.64% 11.86% 5 36.0 0.0000000 CONTRIB 0.00% 0.00% 0.00% 0.00% 0
...................................................................................................................................................WIND TEST POINT DETAIL LISTING, Page 15 of 28

Treasure Island SAN FRANCISCO, CALIFORNIA
Wind Hazard Analysis Project Scenario Wind Test Date: Jan 2010 _______________________________________________________________________________________________________
The ratios of pedestrian-level wind speeds to the reference height wind speeds at the oldAlameda NAS meteorological station are shown in the first line of output for each location. The second line of the output shows the pedestrian level wind speeds, in mph, which would be exceeded one hour per year (0.01141552512% of the time) for each measurement location. This assumes that a windhazard occurs if a one-minute average speed of 36 mph is reached or exceeded a total of one hour per year. The third line of output for each location shows the criterion speed and the percentage of the time the criterion would be exceeded. The rows labeled CONTRIB tabulate the percentage contribution to the total or the exceedance from each wind direction. The SUMs are the equivalent number of events. _______________________________________________________________________________________________________ 0.011414% Exc. ---Criterion--- Loca- Ground Speed % Time NNW W SSE OTHER SUM tion Speed Exc. Exc._______________________________________________________________________________________________________ 16 RATIOS 0.7215 0.5148 0.8764 0.7042 29.4 CONTRIB 1.02% 0.02% 98.09% 0.87% 5 36.0 0.0002123 CONTRIB 1.94% 0.00% 96.73% 1.33% 0 17 RATIOS 0.5406 0.4651 0.4120 0.4726 17.3 CONTRIB 53.68% 36.21% 1.28% 8.83% 5 36.0 0.0000000 CONTRIB 0.00% 0.00% 0.00% 0.00% 0 18 RATIOS 0.6973 0.8942 1.2215 0.9377 41.0 CONTRIB 0.00% 1.39% 98.22% 0.40% 5 36.0 0.0789927 CONTRIB 0.00% 1.40% 98.08% 0.51% 35 19 RATIOS 0.7232 0.7277 0.8638 0.7716 29.0 CONTRIB 1.15% 10.45% 83.72% 4.68% 5 36.0 0.0002190 CONTRIB 1.96% 20.94% 70.82% 6.28% 0 20 RATIOS 0.5134 0.6571 0.4479 0.5395 22.7 CONTRIB 0.25% 99.04% 0.03% 0.69% 5 36.0 0.0000066 CONTRIB 0.00% 100.00% 0.00% 0.00% 0 21 RATIOS 0.5267 0.7256 0.5063 0.5862 25.1 CONTRIB 0.07% 99.36% 0.05% 0.52% 5 36.0 0.0000438 CONTRIB 0.00% 100.00% 0.00% 0.00% 0 22 RATIOS 0.6671 0.6012 0.4624 0.5769 21.5 CONTRIB 39.51% 55.00% 0.14% 5.34% 5 36.0 0.0000000 CONTRIB 0.00% 0.00% 0.00% 0.00% 0 23 RATIOS 0.3967 0.6591 0.6334 0.5631 23.2 CONTRIB 0.00% 81.35% 17.56% 1.09% 5 36.0 0.0000070 CONTRIB 0.00% 100.00% 0.00% 0.00% 0 24 RATIOS 0.8619 0.8738 1.0536 0.9298 35.7 CONTRIB 0.83% 8.70% 86.50% 3.97% 5 36.0 0.0086347 CONTRIB 0.86% 9.00% 86.11% 4.04% 4 25 RATIOS 0.7152 0.9893 0.8495 0.8513 34.5 CONTRIB 0.07% 96.05% 2.40% 1.48% 5 36.0 0.0054900 CONTRIB 0.07% 96.52% 2.04% 1.38% 2 26 RATIOS 0.6314 0.8713 0.8134 0.7720 30.5 CONTRIB 0.06% 86.73% 10.99% 2.22% 5 36.0 0.0008044 CONTRIB 0.00% 92.30% 5.98% 1.73% 0 27 RATIOS 0.7803 0.6305 0.8475 0.7528 28.4 CONTRIB 5.63% 1.59% 88.33% 4.44% 5 36.0 0.0001334 CONTRIB 11.04% 1.99% 80.25% 6.72% 0 28 RATIOS 0.8213 0.6671 0.7369 0.7418 26.2 CONTRIB 46.54% 12.89% 27.04% 13.53% 5 36.0 0.0000569 CONTRIB 59.40% 16.07% 12.33% 12.20% 0 29 RATIOS 0.4357 0.8189 0.5757 0.6101 28.3 CONTRIB 0.00% 99.82% 0.05% 0.13% 5 36.0 0.0002847 CONTRIB 0.00% 100.00% 0.00% 0.00% 0 30 RATIOS 0.7869 1.1788 0.2190 0.7282 41.0 CONTRIB 0.00% 100.00% 0.00% 0.00% 5 36.0 0.0717368 CONTRIB 0.02% 99.97% 0.00% 0.01% 31
...................................................................................................................................................WIND TEST POINT DETAIL LISTING, Page 16 of 28

Treasure Island SAN FRANCISCO, CALIFORNIA
Wind Hazard Analysis Project Scenario Wind Test Date: Jan 2010 _______________________________________________________________________________________________________
The ratios of pedestrian-level wind speeds to the reference height wind speeds at the oldAlameda NAS meteorological station are shown in the first line of output for each location. The second line of the output shows the pedestrian level wind speeds, in mph, which would be exceeded one hour per year (0.01141552512% of the time) for each measurement location. This assumes that a windhazard occurs if a one-minute average speed of 36 mph is reached or exceeded a total of one hour per year. The third line of output for each location shows the criterion speed and the percentage of the time the criterion would be exceeded. The rows labeled CONTRIB tabulate the percentage contribution to the total or the exceedance from each wind direction. The SUMs are the equivalent number of events. _______________________________________________________________________________________________________ 0.011414% Exc. ---Criterion--- Loca- Ground Speed % Time NNW W SSE OTHER SUM tion Speed Exc. Exc._______________________________________________________________________________________________________ 31 RATIOS 0.9538 0.2492 0.5793 0.5941 28.7 CONTRIB 99.90% 0.00% 0.04% 0.06% 5 36.0 0.0003839 CONTRIB 100.00% 0.00% 0.00% 0.00% 0 32 RATIOS 0.2741 0.5420 0.5805 0.4655 19.8 CONTRIB 0.00% 39.42% 60.04% 0.54% 5 36.0 0.0000000 CONTRIB 0.00% 0.00% 0.00% 0.00% 0 33 RATIOS 0.6442 0.4299 0.6167 0.5636 21.3 CONTRIB 33.11% 0.45% 61.10% 5.35% 5 36.0 0.0000000 CONTRIB 0.00% 0.00% 0.00% 0.00% 0 34 RATIOS 1.0456 0.7507 0.8634 0.8866 32.6 CONTRIB 79.08% 3.18% 9.84% 7.89% 5 36.0 0.0020867 CONTRIB 81.76% 3.55% 7.37% 7.32% 1 35 RATIOS 1.1193 0.4579 0.5983 0.7252 34.3 CONTRIB 99.89% 0.00% 0.00% 0.11% 5 36.0 0.0051630 CONTRIB 99.91% 0.00% 0.00% 0.09% 2 36 RATIOS 0.2322 0.2883 0.2806 0.2670 10.1 CONTRIB 0.30% 74.70% 20.93% 4.08% 5 36.0 0.0000000 CONTRIB 0.00% 0.00% 0.00% 0.00% 0 37 RATIOS 0.6958 0.5952 0.3720 0.5543 22.0 CONTRIB 60.77% 37.20% 0.00% 2.03% 5 36.0 0.0000023 CONTRIB 100.00% 0.00% 0.00% 0.00% 0 38 RATIOS 1.0515 0.3079 0.7762 0.7118 32.2 CONTRIB 98.20% 0.00% 1.58% 0.22% 5 36.0 0.0018916 CONTRIB 98.80% 0.00% 1.02% 0.18% 1 39 RATIOS 0.5330 0.3675 0.8758 0.5921 29.1 CONTRIB 0.00% 0.00% 99.96% 0.04% 5 36.0 0.0002027 CONTRIB 0.00% 0.00% 100.00% 0.00% 0 40 RATIOS 0.6430 0.3934 0.7722 0.6029 25.8 CONTRIB 1.21% 0.00% 98.27% 0.52% 5 36.0 0.0000175 CONTRIB 0.00% 0.00% 100.00% 0.00% 0 41 RATIOS 0.6112 0.5440 0.8205 0.6586 27.4 CONTRIB 0.20% 0.29% 98.66% 0.85% 5 36.0 0.0000569 CONTRIB 0.00% 0.00% 100.00% 0.00% 0 42 RATIOS 0.5703 0.5707 0.4038 0.5149 19.8 CONTRIB 11.47% 85.46% 0.05% 3.02% 5 36.0 0.0000000 CONTRIB 0.00% 0.00% 0.00% 0.00% 0 43 RATIOS 0.6244 0.3324 0.7475 0.5681 25.0 CONTRIB 1.28% 0.00% 98.39% 0.33% 5 36.0 0.0000093 CONTRIB 0.00% 0.00% 100.00% 0.00% 0 44 RATIOS 0.9478 0.6461 0.5454 0.7131 28.7 CONTRIB 96.52% 2.01% 0.00% 1.47% 5 36.0 0.0003541 CONTRIB 97.73% 1.28% 0.00% 0.99% 0 45 RATIOS 0.6893 0.6028 0.5826 0.6249 22.3 CONTRIB 42.46% 37.22% 7.35% 12.97% 5 36.0 0.0000000 CONTRIB 0.00% 0.00% 0.00% 0.00% 0
...................................................................................................................................................WIND TEST POINT DETAIL LISTING, Page 17 of 28

Treasure Island SAN FRANCISCO, CALIFORNIA
Wind Hazard Analysis Project Scenario Wind Test Date: Jan 2010 _______________________________________________________________________________________________________
The ratios of pedestrian-level wind speeds to the reference height wind speeds at the oldAlameda NAS meteorological station are shown in the first line of output for each location. The second line of the output shows the pedestrian level wind speeds, in mph, which would be exceeded one hour per year (0.01141552512% of the time) for each measurement location. This assumes that a windhazard occurs if a one-minute average speed of 36 mph is reached or exceeded a total of one hour per year. The third line of output for each location shows the criterion speed and the percentage of the time the criterion would be exceeded. The rows labeled CONTRIB tabulate the percentage contribution to the total or the exceedance from each wind direction. The SUMs are the equivalent number of events. _______________________________________________________________________________________________________ 0.011414% Exc. ---Criterion--- Loca- Ground Speed % Time NNW W SSE OTHER SUM tion Speed Exc. Exc._______________________________________________________________________________________________________ 46 RATIOS 1.3405 0.6438 0.8201 0.9348 41.1 CONTRIB 99.59% 0.00% 0.04% 0.37% 5 36.0 0.0359381 CONTRIB 98.77% 0.01% 0.16% 1.06% 16 47 RATIOS 1.2086 0.7154 0.6422 0.8554 37.1 CONTRIB 99.30% 0.22% 0.00% 0.48% 5 36.0 0.0135821 CONTRIB 99.14% 0.26% 0.00% 0.60% 6 48 RATIOS 0.5605 0.9148 0.1961 0.5571 31.7 CONTRIB 0.00% 100.00% 0.00% 0.00% 5 36.0 0.0015781 CONTRIB 0.00% 100.00% 0.00% 0.00% 1 49 RATIOS 0.5722 0.8487 0.5491 0.6567 29.4 CONTRIB 0.02% 99.73% 0.00% 0.25% 5 36.0 0.0004948 CONTRIB 0.00% 100.00% 0.00% 0.00% 0 50 RATIOS 0.7101 0.5157 0.5820 0.6026 21.9 CONTRIB 78.51% 3.92% 9.15% 8.42% 5 36.0 0.0000032 CONTRIB 100.00% 0.00% 0.00% 0.00% 0 51 RATIOS 1.1690 0.4263 0.6530 0.7494 35.7 CONTRIB 99.91% 0.00% 0.00% 0.09% 5 36.0 0.0098676 CONTRIB 99.92% 0.00% 0.00% 0.08% 4 52 RATIOS 1.2211 0.6771 0.6454 0.8479 37.4 CONTRIB 99.60% 0.05% 0.00% 0.35% 5 36.0 0.0149143 CONTRIB 99.44% 0.08% 0.00% 0.47% 7 53 RATIOS 0.7567 0.7079 0.5075 0.6574 25.1 CONTRIB 27.23% 68.85% 0.05% 3.87% 5 36.0 0.0000389 CONTRIB 23.04% 76.96% 0.00% 0.00% 0 54 RATIOS 0.6967 0.8073 0.4755 0.6599 28.0 CONTRIB 1.22% 98.15% 0.00% 0.63% 5 36.0 0.0002308 CONTRIB 1.01% 98.98% 0.00% 0.00% 0 55 RATIOS 0.8089 0.7407 0.6799 0.7432 26.6 CONTRIB 30.03% 54.18% 4.44% 11.36% 5 36.0 0.0000938 CONTRIB 28.17% 64.18% 0.00% 7.65% 0 56 RATIOS 0.7293 0.7342 0.7499 0.7378 26.4 CONTRIB 5.99% 50.49% 32.71% 10.81% 5 36.0 0.0000737 CONTRIB 6.67% 71.36% 13.38% 8.59% 0 57 RATIOS 0.6077 0.8877 0.6350 0.7101 30.8 CONTRIB 0.03% 99.46% 0.07% 0.44% 5 36.0 0.0009951 CONTRIB 0.00% 99.67% 0.00% 0.33% 0 58 RATIOS 0.4983 0.3153 0.7387 0.5174 24.8 CONTRIB 0.04% 0.00% 99.88% 0.08% 5 36.0 0.0000074 CONTRIB 0.00% 0.00% 100.00% 0.00% 0 59 RATIOS 0.6862 0.6310 0.3265 0.5479 22.4 CONTRIB 33.87% 64.99% 0.00% 1.14% 5 36.0 0.0000027 CONTRIB 0.00% 100.00% 0.00% 0.00% 0 60 RATIOS 0.7579 0.7868 0.2698 0.6048 27.5 CONTRIB 6.85% 92.95% 0.00% 0.20% 5 36.0 0.0001624 CONTRIB 5.66% 94.34% 0.00% 0.00% 0
...................................................................................................................................................WIND TEST POINT DETAIL LISTING, Page 18 of 28

Treasure Island SAN FRANCISCO, CALIFORNIA
Wind Hazard Analysis Project Scenario Wind Test Date: Jan 2010 _______________________________________________________________________________________________________
The ratios of pedestrian-level wind speeds to the reference height wind speeds at the oldAlameda NAS meteorological station are shown in the first line of output for each location. The second line of the output shows the pedestrian level wind speeds, in mph, which would be exceeded one hour per year (0.01141552512% of the time) for each measurement location. This assumes that a windhazard occurs if a one-minute average speed of 36 mph is reached or exceeded a total of one hour per year. The third line of output for each location shows the criterion speed and the percentage of the time the criterion would be exceeded. The rows labeled CONTRIB tabulate the percentage contribution to the total or the exceedance from each wind direction. The SUMs are the equivalent number of events. _______________________________________________________________________________________________________ 0.011414% Exc. ---Criterion--- Loca- Ground Speed % Time NNW W SSE OTHER SUM tion Speed Exc. Exc._______________________________________________________________________________________________________ 61 RATIOS 0.4014 0.6467 0.4020 0.4834 22.3 CONTRIB 0.00% 99.86% 0.00% 0.14% 5 36.0 0.0000046 CONTRIB 0.00% 100.00% 0.00% 0.00% 0 62 RATIOS 0.8117 0.3059 0.5355 0.5510 24.8 CONTRIB 99.57% 0.00% 0.19% 0.24% 5 36.0 0.0000279 CONTRIB 100.00% 0.00% 0.00% 0.00% 0 63 RATIOS 0.4799 0.4349 0.5803 0.4984 19.4 CONTRIB 1.04% 1.89% 94.43% 2.64% 5 36.0 0.0000000 CONTRIB 0.00% 0.00% 0.00% 0.00% 0 64 RATIOS 0.5465 0.4302 0.5777 0.5182 19.4 CONTRIB 8.50% 1.57% 84.84% 5.09% 5 36.0 0.0000000 CONTRIB 0.00% 0.00% 0.00% 0.00% 0 65 RATIOS 0.5624 0.4271 0.7595 0.5830 25.5 CONTRIB 0.19% 0.00% 99.41% 0.40% 5 36.0 0.0000126 CONTRIB 0.00% 0.00% 100.00% 0.00% 0 66 RATIOS 0.6026 0.7979 0.7116 0.7041 27.8 CONTRIB 0.13% 92.75% 4.90% 2.22% 5 36.0 0.0001969 CONTRIB 0.00% 96.77% 1.81% 1.43% 0 67 RATIOS 0.9354 0.6687 0.4336 0.6792 28.7 CONTRIB 95.48% 3.82% 0.00% 0.71% 5 36.0 0.0002893 CONTRIB 96.67% 3.33% 0.00% 0.00% 0 68 RATIOS 0.6397 0.6463 0.7615 0.6825 25.8 CONTRIB 1.23% 11.89% 81.93% 4.95% 5 36.0 0.0000179 CONTRIB 0.00% 25.64% 74.36% 0.00% 0 69 RATIOS 1.1442 0.7218 0.8428 0.9030 35.3 CONTRIB 95.14% 0.54% 1.40% 2.92% 5 36.0 0.0077199 CONTRIB 95.51% 0.52% 1.24% 2.72% 3 70 RATIOS 0.4826 0.5601 0.2406 0.4278 19.3 CONTRIB 1.20% 98.60% 0.00% 0.20% 5 36.0 0.0000000 CONTRIB 0.00% 0.00% 0.00% 0.00% 0 71 RATIOS 0.2175 0.4310 0.4802 0.3763 16.4 CONTRIB 0.00% 25.97% 73.59% 0.44% 5 36.0 0.0000000 CONTRIB 0.00% 0.00% 0.00% 0.00% 0 72 RATIOS 0.5165 0.8507 0.4597 0.6090 29.4 CONTRIB 0.00% 99.94% 0.00% 0.06% 5 36.0 0.0005128 CONTRIB 0.00% 100.00% 0.00% 0.00% 0 73 RATIOS 0.4920 0.5518 0.2524 0.4321 19.1 CONTRIB 2.06% 97.64% 0.00% 0.30% 5 36.0 0.0000000 CONTRIB 0.00% 0.00% 0.00% 0.00% 0 74 RATIOS 0.9783 0.9772 0.6748 0.8768 34.3 CONTRIB 11.76% 85.52% 0.03% 2.69% 5 36.0 0.0050820 CONTRIB 11.41% 86.12% 0.00% 2.48% 2 75 RATIOS 1.1213 0.7962 0.5701 0.8292 34.5 CONTRIB 95.59% 3.44% 0.00% 0.97% 5 36.0 0.0055390 CONTRIB 95.81% 3.32% 0.00% 0.86% 2
...................................................................................................................................................WIND TEST POINT DETAIL LISTING, Page 19 of 28

Treasure Island SAN FRANCISCO, CALIFORNIA
Wind Hazard Analysis Project Scenario Wind Test Date: Jan 2010 _______________________________________________________________________________________________________
The ratios of pedestrian-level wind speeds to the reference height wind speeds at the oldAlameda NAS meteorological station are shown in the first line of output for each location. The second line of the output shows the pedestrian level wind speeds, in mph, which would be exceeded one hour per year (0.01141552512% of the time) for each measurement location. This assumes that a windhazard occurs if a one-minute average speed of 36 mph is reached or exceeded a total of one hour per year. The third line of output for each location shows the criterion speed and the percentage of the time the criterion would be exceeded. The rows labeled CONTRIB tabulate the percentage contribution to the total or the exceedance from each wind direction. The SUMs are the equivalent number of events. _______________________________________________________________________________________________________ 0.011414% Exc. ---Criterion--- Loca- Ground Speed % Time NNW W SSE OTHER SUM tion Speed Exc. Exc._______________________________________________________________________________________________________ 76 RATIOS 0.4816 0.8707 0.5314 0.6279 30.3 CONTRIB 0.00% 99.93% 0.00% 0.07% 5 36.0 0.0007347 CONTRIB 0.00% 100.00% 0.00% 0.00% 0 77 RATIOS 0.9764 0.7785 0.5701 0.7750 30.5 CONTRIB 80.92% 16.51% 0.00% 2.57% 5 36.0 0.0007061 CONTRIB 79.46% 18.44% 0.00% 2.10% 0 78 RATIOS 0.4863 1.2427 0.7473 0.8254 43.2 CONTRIB 0.00% 100.00% 0.00% 0.00% 5 36.0 0.1163090 CONTRIB 0.00% 99.95% 0.01% 0.04% 51 79 RATIOS 1.0154 0.8126 1.1368 0.9883 38.2 CONTRIB 3.64% 0.91% 92.23% 3.22% 5 36.0 0.0349742 CONTRIB 3.03% 0.72% 93.38% 2.87% 15 80 RATIOS 0.8560 1.0434 1.0364 0.9786 37.3 CONTRIB 0.37% 68.52% 26.61% 4.50% 5 36.0 0.0183797 CONTRIB 0.36% 65.71% 29.33% 4.60% 8 81 RATIOS 1.5260 0.8513 1.1482 1.1752 46.9 CONTRIB 95.80% 0.06% 2.18% 1.96% 5 36.0 0.1748840 CONTRIB 66.72% 0.30% 22.67% 10.32% 77 82 RATIOS 0.7968 1.2713 0.2569 0.7750 44.3 CONTRIB 0.00% 100.00% 0.00% 0.00% 5 36.0 0.1432210 CONTRIB 0.01% 99.98% 0.00% 0.01% 63 83 RATIOS 1.0068 0.4130 0.5857 0.6685 30.5 CONTRIB 99.82% 0.00% 0.00% 0.18% 5 36.0 0.0009229 CONTRIB 100.00% 0.00% 0.00% 0.00% 0 84 RATIOS 0.8573 0.9736 0.5587 0.7966 33.9 CONTRIB 1.68% 97.69% 0.00% 0.63% 5 36.0 0.0042301 CONTRIB 1.61% 97.83% 0.00% 0.56% 2 85 RATIOS 1.0252 0.6779 0.5756 0.7596 31.4 CONTRIB 97.76% 1.19% 0.00% 1.05% 5 36.0 0.0012626 CONTRIB 98.14% 1.03% 0.00% 0.83% 1 86 RATIOS 0.7413 0.6909 0.3814 0.6045 24.4 CONTRIB 29.19% 69.41% 0.00% 1.40% 5 36.0 0.0000260 CONTRIB 24.59% 75.41% 0.00% 0.00% 0 87 RATIOS 0.6814 0.7897 0.4340 0.6350 27.5 CONTRIB 1.22% 98.31% 0.00% 0.47% 5 36.0 0.0001623 CONTRIB 0.00% 100.00% 0.00% 0.00% 0 88 RATIOS 0.4514 1.0017 1.0248 0.8260 36.1 CONTRIB 0.00% 59.66% 39.92% 0.41% 5 36.0 0.0107961 CONTRIB 0.00% 59.47% 40.12% 0.41% 5 89 RATIOS 0.4861 1.0136 1.0097 0.8365 36.1 CONTRIB 0.00% 70.17% 29.32% 0.51% 5 36.0 0.0110134 CONTRIB 0.00% 70.04% 29.45% 0.51% 5 90 RATIOS 0.7328 0.7620 0.9527 0.8158 32.0 CONTRIB 0.32% 5.14% 92.06% 2.48% 5 36.0 0.0011791 CONTRIB 0.45% 7.93% 88.55% 3.07% 1
...................................................................................................................................................WIND TEST POINT DETAIL LISTING, Page 20 of 28

Treasure Island SAN FRANCISCO, CALIFORNIA
Wind Hazard Analysis Project Scenario Wind Test Date: Jan 2010 _______________________________________________________________________________________________________
The ratios of pedestrian-level wind speeds to the reference height wind speeds at the oldAlameda NAS meteorological station are shown in the first line of output for each location. The second line of the output shows the pedestrian level wind speeds, in mph, which would be exceeded one hour per year (0.01141552512% of the time) for each measurement location. This assumes that a windhazard occurs if a one-minute average speed of 36 mph is reached or exceeded a total of one hour per year. The third line of output for each location shows the criterion speed and the percentage of the time the criterion would be exceeded. The rows labeled CONTRIB tabulate the percentage contribution to the total or the exceedance from each wind direction. The SUMs are the equivalent number of events. _______________________________________________________________________________________________________ 0.011414% Exc. ---Criterion--- Loca- Ground Speed % Time NNW W SSE OTHER SUM tion Speed Exc. Exc._______________________________________________________________________________________________________ 91 RATIOS 0.6430 0.4797 0.5355 0.5527 20.1 CONTRIB 74.40% 5.43% 10.79% 9.38% 5 36.0 0.0000000 CONTRIB 0.00% 0.00% 0.00% 0.00% 0 92 RATIOS 0.5756 0.8750 0.4183 0.6229 30.3 CONTRIB 0.00% 99.94% 0.00% 0.06% 5 36.0 0.0007930 CONTRIB 0.00% 100.00% 0.00% 0.00% 0 93 RATIOS 0.5840 1.2086 0.3089 0.7005 42.1 CONTRIB 0.00% 100.00% 0.00% 0.00% 5
36.0 0.0901180 CONTRIB 0.00% 100.00% 0.00% 0.00% 39
94 RATIOS 0.4783 0.9709 0.4879 0.6457
33.8 CONTRIB 0.00% 100.00% 0.00% 0.00% 5
36.0 0.0039613 CONTRIB 0.00% 100.00% 0.00% 0.00% 2
95 RATIOS 0.6977 0.5991 0.5505 0.6158
22.3 CONTRIB 52.78% 34.47% 2.49% 10.26% 5
36.0 0.0000024 CONTRIB 100.00% 0.00% 0.00% 0.00% 0
96 RATIOS 0.4216 0.7677 0.5144 0.5679
26.5 CONTRIB 0.00% 99.86% 0.02% 0.11% 5
36.0 0.0001049 CONTRIB 0.00% 100.00% 0.00% 0.00% 0
97 RATIOS 0.6511 0.6850 0.5722 0.6361
23.9 CONTRIB 5.25% 88.33% 1.30% 5.12% 5
36.0 0.0000163 CONTRIB 0.00% 100.00% 0.00% 0.00% 0
98 RATIOS 1.0160 0.5644 1.1537 0.9113
38.7 CONTRIB 2.99% 0.00% 96.38% 0.64% 5
36.0 0.0448251 CONTRIB 2.39% 0.00% 97.06% 0.55% 20
99 RATIOS 0.7881 0.6403 1.0913 0.8399
36.6 CONTRIB 0.12% 0.02% 99.44% 0.42% 5
36.0 0.0148177 CONTRIB 0.12% 0.03% 99.45% 0.40% 6
100 RATIOS 0.7105 1.0325 0.3795 0.7075
35.9 CONTRIB 0.03% 99.94% 0.00% 0.03% 5
36.0 0.0102605 CONTRIB 0.03% 99.94% 0.00% 0.03% 4
101 RATIOS 0.5975 0.7981 0.7626 0.7194
28.0 CONTRIB 0.10% 81.11% 16.01% 2.78% 5
36.0 0.0002090 CONTRIB 0.00% 91.50% 6.55% 1.96% 0
102 RATIOS 0.5461 1.0629 0.4561 0.6884
37.0 CONTRIB 0.00% 100.00% 0.00% 0.00% 5
36.0 0.0160623 CONTRIB 0.00% 100.00% 0.00% 0.00% 7
103 RATIOS 0.4761 0.9958 0.5493 0.6737
34.7 CONTRIB 0.00% 99.98% 0.00% 0.02% 5
36.0 0.0058610 CONTRIB 0.00% 100.00% 0.00% 0.00% 3
104 RATIOS 0.6697 0.7479 0.3818 0.5998
25.9 CONTRIB 2.20% 97.35% 0.00% 0.45% 5
36.0 0.0000700 CONTRIB 0.00% 100.00% 0.00% 0.00% 0
105 RATIOS 0.5430 0.7193 0.4191 0.5605
24.9 CONTRIB 0.14% 99.58% 0.00% 0.28% 5
36.0 0.0000383 CONTRIB 0.00% 100.00% 0.00% 0.00% 0
...................................................................................................................................................
WIND TEST POINT DETAIL LISTING, Page 21 of 28

Treasure Island SAN FRANCISCO, CALIFORNIA
Wind Hazard Analysis Project Scenario Wind Test Date: Jan 2010 _______________________________________________________________________________________________________
The ratios of pedestrian-level wind speeds to the reference height wind speeds at the oldAlameda NAS meteorological station are shown in the first line of output for each location. The second line of the output shows the pedestrian level wind speeds, in mph, which would be exceeded one hour per year (0.01141552512% of the time) for each measurement location. This assumes that a windhazard occurs if a one-minute average speed of 36 mph is reached or exceeded a total of one hour per year. The third line of output for each location shows the criterion speed and the percentage of the time the criterion would be exceeded. The rows labeled CONTRIB tabulate the percentage contribution to the total or the exceedance from each wind direction. The SUMs are the equivalent number of events. _______________________________________________________________________________________________________ 0.011414% Exc. ---Criterion--- Loca- Ground Speed % Time NNW W SSE OTHER SUM tion Speed Exc. Exc._______________________________________________________________________________________________________
106 RATIOS 0.5075 0.7652 0.4695 0.5807
26.4 CONTRIB 0.00% 99.82% 0.00% 0.18% 5
36.0 0.0000996 CONTRIB 0.00% 100.00% 0.00% 0.00% 0
107 RATIOS 1.0389 0.7354 0.7036 0.8260
32.0 CONTRIB 93.27% 3.17% 0.27% 3.29% 5
36.0 0.0016393 CONTRIB 93.81% 3.29% 0.17% 2.73% 1
108 RATIOS 0.5967 0.8823 1.0274 0.8354
34.7 CONTRIB 0.00% 14.49% 84.57% 0.94% 5
36.0 0.0055015 CONTRIB 0.00% 16.38% 82.63% 0.99% 2
109 RATIOS 0.7593 0.8105 0.9646 0.8448
32.5 CONTRIB 0.44% 10.36% 85.78% 3.42% 5
36.0 0.0016497 CONTRIB 0.57% 14.70% 80.71% 4.01% 1
110 RATIOS 0.5301 0.9270 0.4051 0.6207
32.2 CONTRIB 0.00% 100.00% 0.00% 0.00% 5
36.0 0.0019357 CONTRIB 0.00% 100.00% 0.00% 0.00% 1
111 RATIOS 0.4624 0.4691 0.6895 0.5403
23.0 CONTRIB 0.04% 0.44% 98.97% 0.56% 5
36.0 0.0000000 CONTRIB 0.00% 0.00% 0.00% 0.00% 0
112 RATIOS 0.4893 0.7938 0.4240 0.5690
27.6 CONTRIB 0.00% 99.93% 0.00% 0.07% 5
36.0 0.0001759 CONTRIB 0.00% 100.00% 0.00% 0.00% 0
113 RATIOS 0.4685 0.8695 0.4706 0.6029
30.2 CONTRIB 0.00% 99.96% 0.00% 0.04% 5
36.0 0.0007195 CONTRIB 0.00% 100.00% 0.00% 0.00% 0
114 RATIOS 0.6003 0.8689 0.6048 0.6913
30.2 CONTRIB 0.03% 99.53% 0.04% 0.40% 5
36.0 0.0007120 CONTRIB 0.00% 100.00% 0.00% 0.00% 0
115 RATIOS 0.6234 0.7530 0.5585 0.6450
26.1 CONTRIB 0.62% 97.82% 0.15% 1.41% 5
36.0 0.0000778 CONTRIB 0.00% 100.00% 0.00% 0.00% 0
116 RATIOS 0.4522 0.8232 0.4646 0.5800
28.5 CONTRIB 0.00% 99.95% 0.00% 0.05% 5
36.0 0.0003088 CONTRIB 0.00% 100.00% 0.00% 0.00% 0
117 RATIOS 0.6673 0.9403 0.8517 0.8198
32.8 CONTRIB 0.05% 91.72% 6.46% 1.77% 5
36.0 0.0025712 CONTRIB 0.00% 93.90% 4.58% 1.53% 1
118 RATIOS 0.6603 0.8219 1.1180 0.8667
37.5 CONTRIB 0.00% 1.47% 98.07% 0.47% 5
36.0 0.0239925 CONTRIB 0.00% 1.25% 98.32% 0.43% 10
119 RATIOS 0.6540 0.7554 1.0517 0.8204
35.4 CONTRIB 0.00% 1.04% 98.43% 0.53% 5
36.0 0.0072919 CONTRIB 0.00% 1.12% 98.33% 0.55% 3
120 RATIOS 0.5463 0.6110 0.6591 0.6055
22.5 CONTRIB 0.73% 34.71% 58.99% 5.57% 5
36.0 0.0000000 CONTRIB 0.00% 0.00% 0.00% 0.00% 0
...................................................................................................................................................WIND TEST POINT DETAIL LISTING, Page 22 of 28

Treasure Island SAN FRANCISCO, CALIFORNIA
Wind Hazard Analysis Project Scenario Wind Test Date: Jan 2010 _______________________________________________________________________________________________________
The ratios of pedestrian-level wind speeds to the reference height wind speeds at the oldAlameda NAS meteorological station are shown in the first line of output for each location. The second line of the output shows the pedestrian level wind speeds, in mph, which would be exceeded one hour per year (0.01141552512% of the time) for each measurement location. This assumes that a windhazard occurs if a one-minute average speed of 36 mph is reached or exceeded a total of one hour per year. The third line of output for each location shows the criterion speed and the percentage of the time the criterion would be exceeded. The rows labeled CONTRIB tabulate the percentage contribution to the total or the exceedance from each wind direction. The SUMs are the equivalent number of events. _______________________________________________________________________________________________________ 0.011414% Exc. ---Criterion--- Loca- Ground Speed % Time NNW W SSE OTHER SUM tion Speed Exc. Exc._______________________________________________________________________________________________________
121 RATIOS 0.6197 0.7428 0.4806 0.6144
25.8 CONTRIB 0.71% 98.52% 0.00% 0.77% 5
36.0 0.0000630 CONTRIB 0.00% 100.00% 0.00% 0.00% 0
122 RATIOS 0.9268 0.5140 0.8126 0.7511
29.2 CONTRIB 69.71% 0.03% 27.11% 3.15% 5
36.0 0.0002964 CONTRIB 81.17% 0.00% 15.92% 2.91% 0
123 RATIOS 0.7948 0.4263 1.2152 0.8121
40.8 CONTRIB 0.02% 0.00% 99.94% 0.04% 5
36.0 0.0739457 CONTRIB 0.03% 0.00% 99.93% 0.05% 32
124 RATIOS 0.8303 0.5522 0.9930 0.7919
33.3 CONTRIB 1.30% 0.00% 97.94% 0.76% 5
36.0 0.0024070 CONTRIB 1.68% 0.00% 97.43% 0.90% 1
125 RATIOS 0.8750 1.1974 0.9236 0.9987
41.7 CONTRIB 0.08% 98.72% 0.31% 0.89% 5
36.0 0.0846418 CONTRIB 0.11% 97.79% 0.68% 1.42% 37
126 RATIOS 1.0497 0.6022 1.0764 0.9094
36.5 CONTRIB 14.13% 0.00% 84.05% 1.82% 5
36.0 0.0133293 CONTRIB 13.64% 0.00% 84.57% 1.78% 6
127 RATIOS 0.6059 0.7260 0.4463 0.5927
25.1 CONTRIB 0.72% 98.66% 0.00% 0.62% 5
36.0 0.0000442 CONTRIB 0.00% 100.00% 0.00% 0.00% 0
128 RATIOS 0.6214 0.8022 0.5328 0.6522
27.8 CONTRIB 0.21% 99.21% 0.00% 0.58% 5
36.0 0.0002071 CONTRIB 0.00% 100.00% 0.00% 0.00% 0
129 RATIOS 0.6438 0.6809 0.9656 0.7634
32.4 CONTRIB 0.03% 0.78% 98.52% 0.66% 5
36.0 0.0013838 CONTRIB 0.00% 1.03% 98.14% 0.83% 1
130 RATIOS 0.8907 0.6695 0.5224 0.6942
27.5 CONTRIB 90.26% 7.57% 0.00% 2.18% 5
36.0 0.0001361 CONTRIB 92.74% 7.26% 0.00% 0.00% 0
131 RATIOS 0.8438 0.5644 0.6901 0.6994
26.0 CONTRIB 83.48% 1.17% 9.37% 5.98% 5
36.0 0.0000550 CONTRIB 95.44% 0.00% 0.00% 4.56% 0
132 RATIOS 0.7495 0.2528 1.4139 0.8054
47.4 CONTRIB 0.00% 0.00% 100.00% 0.00% 5
36.0 0.2975500 CONTRIB 0.00% 0.00% 99.99% 0.01% 130
133 RATIOS 0.8044 0.2592 1.2554 0.7730
42.1 CONTRIB 0.00% 0.00% 100.00% 0.00% 5
36.0 0.0997212 CONTRIB 0.02% 0.00% 99.96% 0.01% 44
134 RATIOS 0.8381 0.6473 1.1015 0.8623
37.0 CONTRIB 0.29% 0.02% 99.13% 0.56% 5
36.0 0.0178100 CONTRIB 0.26% 0.03% 99.18% 0.53% 8
135 RATIOS 0.6652 1.0660 0.8501 0.8604
37.2 CONTRIB 0.00% 98.91% 0.59% 0.50% 5
36.0 0.0170160 CONTRIB 0.00% 98.80% 0.67% 0.53% 7
...................................................................................................................................................WIND TEST POINT DETAIL LISTING, Page 23 of 28

Treasure Island SAN FRANCISCO, CALIFORNIA
Wind Hazard Analysis Project Scenario Wind Test Date: Jan 2010 _______________________________________________________________________________________________________
The ratios of pedestrian-level wind speeds to the reference height wind speeds at the oldAlameda NAS meteorological station are shown in the first line of output for each location. The second line of the output shows the pedestrian level wind speeds, in mph, which would be exceeded one hour per year (0.01141552512% of the time) for each measurement location. This assumes that a windhazard occurs if a one-minute average speed of 36 mph is reached or exceeded a total of one hour per year. The third line of output for each location shows the criterion speed and the percentage of the time the criterion would be exceeded. The rows labeled CONTRIB tabulate the percentage contribution to the total or the exceedance from each wind direction. The SUMs are the equivalent number of events. _______________________________________________________________________________________________________ 0.011414% Exc. ---Criterion--- Loca- Ground Speed % Time NNW W SSE OTHER SUM tion Speed Exc. Exc._______________________________________________________________________________________________________
136 RATIOS 1.1648 0.8338 0.8856 0.9614
36.1 CONTRIB 88.61% 3.44% 2.28% 5.67% 5
36.0 0.0107895 CONTRIB 88.41% 3.49% 2.33% 5.77% 5
137 RATIOS 0.9436 0.6293 1.2797 0.9509
42.9 CONTRIB 0.17% 0.00% 99.60% 0.23% 5
36.0 0.1197630 CONTRIB 0.27% 0.00% 99.30% 0.43% 52
138 RATIOS 1.0566 0.7977 0.7677 0.8740
32.7 CONTRIB 85.60% 7.68% 0.93% 5.79% 5
36.0 0.0023462 CONTRIB 86.16% 8.09% 0.66% 5.08% 1
139 RATIOS 0.4344 1.0366 0.5726 0.6812
36.1 CONTRIB 0.00% 100.00% 0.00% 0.00% 5
36.0 0.0109051 CONTRIB 0.00% 100.00% 0.00% 0.00% 5
140 RATIOS 1.0756 1.0101 0.9666 1.0174
36.4 CONTRIB 20.70% 56.44% 10.28% 12.59% 5
36.0 0.0130559 CONTRIB 20.69% 55.98% 10.61% 12.72% 6
141 RATIOS 0.7467 0.9968 0.7940 0.8458
34.7 CONTRIB 0.12% 98.12% 0.57% 1.19% 5
36.0 0.0060560 CONTRIB 0.12% 98.27% 0.50% 1.12% 3
142 RATIOS 0.6511 1.1421 1.1799 0.9910
41.2 CONTRIB 0.00% 54.86% 44.22% 0.92% 5
36.0 0.1062270 CONTRIB 0.00% 45.97% 53.04% 0.99% 47
143 RATIOS 0.6660 1.0242 0.9819 0.8907
36.2 CONTRIB 0.00% 81.82% 16.69% 1.48% 5
36.0 0.0111061 CONTRIB 0.00% 81.57% 16.94% 1.49% 5
144 RATIOS 1.1611 0.6142 0.9170 0.8974
35.8 CONTRIB 92.84% 0.00% 5.20% 1.96% 5
36.0 0.0099425 CONTRIB 93.11% 0.00% 4.99% 1.90% 4
145 RATIOS 0.9548 1.2609 0.8999 1.0385
43.9 CONTRIB 0.15% 99.07% 0.07% 0.72% 5
36.0 0.1359320 CONTRIB 0.29% 97.72% 0.25% 1.74% 60
146 RATIOS 0.8517 0.9638 0.8505 0.8887
33.7 CONTRIB 1.63% 90.02% 3.78% 4.57% 5
36.0 0.0038732 CONTRIB 1.57% 91.36% 2.96% 4.11% 2
147 RATIOS 0.9676 0.8175 1.5733 1.1195
52.8 CONTRIB 0.00% 0.00% 99.89% 0.11% 5
36.0 0.6388400 CONTRIB 0.08% 0.04% 98.52% 1.36% 280
148 RATIOS 0.7618 1.1213 0.6209 0.8347
39.0 CONTRIB 0.03% 99.85% 0.00% 0.13% 5
36.0 0.0368192 CONTRIB 0.03% 99.83% 0.00% 0.15% 16
149 RATIOS 0.8556 0.6012 1.1036 0.8535
37.1 CONTRIB 0.39% 0.00% 99.16% 0.45% 5
36.0 0.0184955 CONTRIB 0.36% 0.00% 99.22% 0.43% 8
150 RATIOS 1.0987 0.3765 0.7783 0.7512
33.6 CONTRIB 98.98% 0.00% 0.74% 0.27% 5
36.0 0.0038448 CONTRIB 99.25% 0.00% 0.53% 0.22% 2
...................................................................................................................................................WIND TEST POINT DETAIL LISTING, Page 24 of 28

Treasure Island SAN FRANCISCO, CALIFORNIA
Wind Hazard Analysis Project Scenario Wind Test Date: Jan 2010 _______________________________________________________________________________________________________
The ratios of pedestrian-level wind speeds to the reference height wind speeds at the oldAlameda NAS meteorological station are shown in the first line of output for each location. The second line of the output shows the pedestrian level wind speeds, in mph, which would be exceeded one hour per year (0.01141552512% of the time) for each measurement location. This assumes that a windhazard occurs if a one-minute average speed of 36 mph is reached or exceeded a total of one hour per year. The third line of output for each location shows the criterion speed and the percentage of the time the criterion would be exceeded. The rows labeled CONTRIB tabulate the percentage contribution to the total or the exceedance from each wind direction. The SUMs are the equivalent number of events. _______________________________________________________________________________________________________ 0.011414% Exc. ---Criterion--- Loca- Ground Speed % Time NNW W SSE OTHER SUM tion Speed Exc. Exc._______________________________________________________________________________________________________
151 RATIOS 1.1036 0.5275 0.9048 0.8453
34.2 CONTRIB 88.42% 0.00% 10.02% 1.56% 5
36.0 0.0045514 CONTRIB 90.12% 0.00% 8.41% 1.47% 2
152 RATIOS 0.5859 0.8368 0.7238 0.7155
29.2 CONTRIB 0.04% 95.85% 2.78% 1.33% 5
36.0 0.0004060 CONTRIB 0.00% 97.87% 1.22% 0.92% 0
153 RATIOS 0.8262 1.2756 1.0811 1.0610
44.4 CONTRIB 0.00% 97.27% 1.90% 0.83% 5
36.0 0.1634310 CONTRIB 0.02% 90.37% 7.51% 2.10% 72
154 RATIOS 0.8411 0.4920 1.3737 0.9023
46.1 CONTRIB 0.00% 0.00% 99.97% 0.03% 5
36.0 0.2284340 CONTRIB 0.02% 0.00% 99.89% 0.09% 100
155 RATIOS 0.9536 0.7985 0.7577 0.8366
30.1 CONTRIB 59.77% 26.26% 3.36% 10.61% 5
36.0 0.0006433 CONTRIB 59.48% 29.96% 1.88% 8.69% 0
156 RATIOS 0.7920 0.9358 1.0221 0.9166
35.1 CONTRIB 0.27% 31.61% 64.10% 4.02% 5
36.0 0.0066430 CONTRIB 0.28% 33.74% 61.88% 4.10% 3
157 RATIOS 1.1158 0.4571 1.0940 0.8890
37.2 CONTRIB 25.86% 0.00% 73.33% 0.81% 5
36.0 0.0205371 CONTRIB 23.86% 0.00% 75.36% 0.78% 9
158 RATIOS 0.7811 0.7316 0.8371 0.7833
28.4 CONTRIB 5.74% 15.92% 69.47% 8.86% 5
36.0 0.0001668 CONTRIB 8.97% 29.87% 50.46% 10.70% 0
159 RATIOS 1.0544 0.7969 0.7344 0.8619
32.7 CONTRIB 87.07% 7.83% 0.41% 4.70% 5
36.0 0.0022427 CONTRIB 87.19% 8.34% 0.29% 4.18% 1
160 RATIOS 0.3159 0.8032 0.9483 0.6892
31.9 CONTRIB 0.00% 12.00% 87.87% 0.14% 5
36.0 0.0011668 CONTRIB 0.00% 18.09% 81.91% 0.00% 1
161 RATIOS 0.8632 0.6285 0.9107 0.8008
30.6 CONTRIB 8.97% 0.49% 86.84% 3.70% 5
36.0 0.0005387 CONTRIB 14.10% 0.46% 80.58% 4.86% 0
162 RATIOS 0.7799 0.9572 0.4879 0.7416
33.3 CONTRIB 0.48% 99.26% 0.00% 0.25% 5
36.0 0.0031997 CONTRIB 0.46% 99.33% 0.00% 0.22% 1
163 RATIOS 1.0699 1.0564 0.4208 0.8490
37.2 CONTRIB 14.13% 85.47% 0.00% 0.40% 5
36.0 0.0171642 CONTRIB 14.44% 85.14% 0.00% 0.42% 8
164 RATIOS 1.0472 0.4573 0.9248 0.8098
32.9 CONTRIB 68.15% 0.00% 30.49% 1.36% 5
36.0 0.0023657 CONTRIB 73.89% 0.00% 24.76% 1.34% 1
165 RATIOS 0.8487 0.8923 1.0697 0.9369
36.2 CONTRIB 0.51% 9.48% 86.53% 3.48% 5
36.0 0.0115158 CONTRIB 0.50% 9.31% 86.73% 3.45% 5
...................................................................................................................................................WIND TEST POINT DETAIL LISTING, Page 25 of 28

Treasure Island SAN FRANCISCO, CALIFORNIA
Wind Hazard Analysis Project Scenario Wind Test Date: Jan 2010 _______________________________________________________________________________________________________
The ratios of pedestrian-level wind speeds to the reference height wind speeds at the oldAlameda NAS meteorological station are shown in the first line of output for each location. The second line of the output shows the pedestrian level wind speeds, in mph, which would be exceeded one hour per year (0.01141552512% of the time) for each measurement location. This assumes that a windhazard occurs if a one-minute average speed of 36 mph is reached or exceeded a total of one hour per year. The third line of output for each location shows the criterion speed and the percentage of the time the criterion would be exceeded. The rows labeled CONTRIB tabulate the percentage contribution to the total or the exceedance from each wind direction. The SUMs are the equivalent number of events. _______________________________________________________________________________________________________ 0.011414% Exc. ---Criterion--- Loca- Ground Speed % Time NNW W SSE OTHER SUM tion Speed Exc. Exc._______________________________________________________________________________________________________
166 RATIOS 1.1560 0.6309 0.9572 0.9147
35.9 CONTRIB 85.97% 0.03% 11.40% 2.60% 5
36.0 0.0101160 CONTRIB 86.06% 0.03% 11.32% 2.59% 4
167 RATIOS 0.8926 0.5244 0.9177 0.7783
31.0 CONTRIB 13.48% 0.00% 84.58% 1.94% 5
36.0 0.0006514 CONTRIB 20.09% 0.00% 77.46% 2.45% 0
168 RATIOS 0.9136 0.8281 0.6640 0.8019
29.7 CONTRIB 36.85% 56.43% 0.33% 6.39% 5
36.0 0.0005561 CONTRIB 34.31% 60.86% 0.00% 4.82% 0
169 RATIOS 0.7354 0.6285 0.7173 0.6937
24.7 CONTRIB 21.17% 13.37% 53.08% 12.38% 5
36.0 0.0000123 CONTRIB 45.88% 20.26% 33.86% 0.00% 0
170 RATIOS 0.7336 0.6775 0.6128 0.6746
24.2 CONTRIB 27.93% 57.77% 3.61% 10.70% 5
36.0 0.0000182 CONTRIB 29.67% 70.33% 0.00% 0.00% 0
171 RATIOS 0.8152 0.6983 1.3464 0.9533
45.1 CONTRIB 0.00% 0.00% 99.90% 0.10% 5
36.0 0.1903420 CONTRIB 0.02% 0.01% 99.69% 0.28% 83
172 RATIOS 0.8413 0.9313 0.2806 0.6844
32.5 CONTRIB 2.53% 97.37% 0.00% 0.10% 5
36.0 0.0021298 CONTRIB 2.35% 97.65% 0.00% 0.00% 1
173 RATIOS 0.9976 0.5471 0.7883 0.7777
30.7 CONTRIB 92.30% 0.04% 5.36% 2.30% 5
36.0 0.0008368 CONTRIB 95.00% 0.00% 3.12% 1.88% 0
174 RATIOS 0.6460 0.5293 0.7693 0.6482
25.7 CONTRIB 1.36% 0.51% 96.21% 1.93% 5
36.0 0.0000162 CONTRIB 0.00% 0.00% 100.00% 0.00% 0
175 RATIOS 1.1756 0.6163 0.7668 0.8529
36.0 CONTRIB 99.10% 0.00% 0.15% 0.75% 5
36.0 0.0104913 CONTRIB 99.11% 0.00% 0.14% 0.74% 5
176 RATIOS 0.9468 0.4708 0.8664 0.7613
30.3 CONTRIB 52.98% 0.00% 44.96% 2.05% 5
36.0 0.0005154 CONTRIB 66.02% 0.00% 31.86% 2.12% 0
177 RATIOS 0.8695 0.3775 0.7701 0.6724
27.4 CONTRIB 67.10% 0.00% 31.55% 1.34% 5
36.0 0.0001020 CONTRIB 83.78% 0.00% 16.22% 0.00% 0
178 RATIOS 0.4165 0.3559 1.0187 0.5971
34.1 CONTRIB 0.00% 0.00% 100.00% 0.00% 5
36.0 0.0038570 CONTRIB 0.00% 0.00% 100.00% 0.00% 2
179 RATIOS 1.0495 0.7717 0.9936 0.9383
34.5 CONTRIB 35.67% 2.16% 53.76% 8.42% 5
36.0 0.0047069 CONTRIB 38.52% 2.41% 50.40% 8.67% 2
180 RATIOS 1.0438 1.1666 0.3661 0.8589
40.6 CONTRIB 2.18% 97.72% 0.00% 0.10% 5
36.0 0.0669737 CONTRIB 2.48% 97.39% 0.00% 0.13% 29
...................................................................................................................................................WIND TEST POINT DETAIL LISTING, Page 26 of 28

Treasure Island SAN FRANCISCO, CALIFORNIA
Wind Hazard Analysis Project Scenario Wind Test Date: Jan 2010 _______________________________________________________________________________________________________
The ratios of pedestrian-level wind speeds to the reference height wind speeds at the oldAlameda NAS meteorological station are shown in the first line of output for each location. The second line of the output shows the pedestrian level wind speeds, in mph, which would be exceeded one hour per year (0.01141552512% of the time) for each measurement location. This assumes that a windhazard occurs if a one-minute average speed of 36 mph is reached or exceeded a total of one hour per year. The third line of output for each location shows the criterion speed and the percentage of the time the criterion would be exceeded. The rows labeled CONTRIB tabulate the percentage contribution to the total or the exceedance from each wind direction. The SUMs are the equivalent number of events. _______________________________________________________________________________________________________ 0.011414% Exc. ---Criterion--- Loca- Ground Speed % Time NNW W SSE OTHER SUM tion Speed Exc. Exc._______________________________________________________________________________________________________
181 RATIOS 0.8677 0.5379 1.0750 0.8269
36.1 CONTRIB 0.75% 0.00% 98.84% 0.41% 5
36.0 0.0111250 CONTRIB 0.74% 0.00% 98.85% 0.41% 5
182 RATIOS 1.1170 0.7271 1.0825 0.9755
37.0 CONTRIB 28.80% 0.27% 66.44% 4.49% 5
36.0 0.0184119 CONTRIB 27.08% 0.25% 68.33% 4.35% 8
183 RATIOS 0.8456 0.9293 0.8977 0.8909
33.0 CONTRIB 2.12% 73.62% 17.10% 7.16% 5
36.0 0.0025620 CONTRIB 2.12% 78.58% 12.82% 6.48% 1
184 RATIOS 1.1858 0.7277 0.6891 0.8675
36.3 CONTRIB 98.75% 0.38% 0.00% 0.86% 5
36.0 0.0114236 CONTRIB 98.68% 0.40% 0.00% 0.92% 5
185 RATIOS 0.8187 0.3032 0.9152 0.6790
30.6 CONTRIB 3.81% 0.00% 95.98% 0.21% 5
36.0 0.0005101 CONTRIB 6.30% 0.00% 93.70% 0.00% 0
186 RATIOS 0.5834 0.5238 1.0015 0.7029
33.6 CONTRIB 0.00% 0.00% 99.92% 0.08% 5
36.0 0.0027677 CONTRIB 0.00% 0.00% 99.90% 0.10% 1
187 RATIOS 0.9105 0.6538 0.9219 0.8287
31.2 CONTRIB 16.13% 0.70% 78.21% 4.96% 5
36.0 0.0007843 CONTRIB 23.01% 0.75% 70.20% 6.05% 0
188 RATIOS 1.0017 0.4516 1.0633 0.8389
35.9 CONTRIB 8.62% 0.00% 90.78% 0.60% 4
36.0 0.0097826 CONTRIB 8.69% 0.00% 90.71% 0.60% 4
189 RATIOS 0.9291 1.1309 0.6497 0.9032
39.4 CONTRIB 0.55% 99.03% 0.00% 0.42% 5
36.0 0.0424027 CONTRIB 0.59% 98.91% 0.00% 0.50% 19
190 RATIOS 0.9605 0.3585 0.9168 0.7452
31.4 CONTRIB 35.47% 0.00% 63.81% 0.72% 5
36.0 0.0009316 CONTRIB 46.15% 0.00% 53.05% 0.81% 0
191 RATIOS 1.0784 0.3114 0.8999 0.7632
33.4 CONTRIB 85.82% 0.00% 13.79% 0.39% 5
36.0 0.0031705 CONTRIB 88.79% 0.00% 10.86% 0.36% 1
192 RATIOS 1.2068 0.8572 0.7771 0.9470
37.2 CONTRIB 93.94% 3.34% 0.10% 2.62% 5
36.0 0.0143581 CONTRIB 92.51% 4.02% 0.14% 3.34% 6
193 RATIOS 0.9374 0.4481 1.0146 0.8000
34.1 CONTRIB 6.36% 0.00% 93.04% 0.60% 5
36.0 0.0038794 CONTRIB 7.46% 0.00% 91.88% 0.66% 2
194 RATIOS 1.2225 0.4271 1.1280 0.9259
39.3 CONTRIB 50.14% 0.00% 49.17% 0.68% 5
36.0 0.0433696 CONTRIB 34.56% 0.00% 64.70% 0.75% 19
195 RATIOS 1.1895 0.4061 0.9211 0.8389
36.5 CONTRIB 95.71% 0.00% 3.85% 0.43% 5
36.0 0.0122087 CONTRIB 95.08% 0.00% 4.44% 0.48% 5
...................................................................................................................................................WIND TEST POINT DETAIL LISTING, Page 27 of 28

Treasure Island SAN FRANCISCO, CALIFORNIA
Wind Hazard Analysis Project Scenario Wind Test Date: Jan 2010 _______________________________________________________________________________________________________
The ratios of pedestrian-level wind speeds to the reference height wind speeds at the oldAlameda NAS meteorological station are shown in the first line of output for each location. The second line of the output shows the pedestrian level wind speeds, in mph, which would be exceeded one hour per year (0.01141552512% of the time) for each measurement location. This assumes that a windhazard occurs if a one-minute average speed of 36 mph is reached or exceeded a total of one hour per year. The third line of output for each location shows the criterion speed and the percentage of the time the criterion would be exceeded. The rows labeled CONTRIB tabulate the percentage contribution to the total or the exceedance from each wind direction. The SUMs are the equivalent number of events. _______________________________________________________________________________________________________ 0.011414% Exc. ---Criterion--- Loca- Ground Speed % Time NNW W SSE OTHER SUM tion Speed Exc. Exc._______________________________________________________________________________________________________
196 RATIOS 0.7103 0.5148 1.0986 0.7745
36.9 CONTRIB 0.00% 0.00% 99.91% 0.09% 5
36.0 0.0167850 CONTRIB 0.02% 0.00% 99.89% 0.09% 7
197 RATIOS 0.7001 0.8217 0.9470 0.8229
32.0 CONTRIB 0.15% 16.25% 80.77% 2.83% 5
36.0 0.0012735 CONTRIB 0.20% 23.54% 72.97% 3.30% 1
198 RATIOS 1.0584 0.8672 1.1029 1.0095
37.3 CONTRIB 10.23% 3.49% 79.41% 6.86% 5
36.0 0.0223139 CONTRIB 9.31% 3.09% 81.11% 6.49% 10
199 RATIOS 1.0042 0.4546 0.9905 0.8164
33.7 CONTRIB 23.94% 0.00% 75.00% 1.06% 5
36.0 0.0031529 CONTRIB 28.09% 0.00% 70.75% 1.16% 1
200 RATIOS 0.9764 0.5869 1.4274 0.9969
47.8 CONTRIB 0.05% 0.00% 99.87% 0.08% 5
36.0 0.3264910 CONTRIB 0.17% 0.00% 99.47% 0.36% 143
201 RATIOS 0.7124 0.8785 0.6395 0.7435
30.5 CONTRIB 0.45% 98.30% 0.10% 1.15% 5
36.0 0.0008546 CONTRIB 0.39% 98.76% 0.00% 0.85% 0
202 RATIOS 0.5852 0.6646 0.8248 0.6915
27.6 CONTRIB 0.08% 5.66% 92.55% 1.70% 5
36.0 0.0000714 CONTRIB 0.00% 11.78% 88.22% 0.00% 0
203 RATIOS 0.7540 0.8250 1.5388 1.0393
51.5 CONTRIB 0.00% 0.00% 99.96% 0.04% 5
36.0 0.5676740 CONTRIB 0.00% 0.06% 99.52% 0.42% 249
204 RATIOS 0.7397 0.9301 1.0172 0.8957
34.9 CONTRIB 0.10% 31.55% 65.37% 2.98% 5
36.0 0.0059710 CONTRIB 0.10% 34.16% 62.69% 3.05% 3
205 RATIOS 0.9854 0.9015 1.1448 1.0106
38.7 CONTRIB 1.97% 4.02% 89.87% 4.13% 5
36.0 0.0408507 CONTRIB 1.59% 3.08% 91.71% 3.62% 18
206 RATIOS 1.1899 0.9338 1.0854 1.0697
38.3 CONTRIB 45.32% 7.41% 35.23% 12.03% 5
36.0 0.0310361 CONTRIB 37.52% 6.99% 42.74% 12.75% 14
...................................................................................................................................................WIND TEST POINT DETAIL LISTING, Page 28 of 28