Team Lease Employment Outlook Report: Half Yearly Special · Team Lease Employment Outlook Report:...
42
Team Lease Employment Outlook Report: Half Yearly Special Quarter-23, July-September 2012 A comprehensive and in-depth analysis of Employment and Business Outlook for the forthcoming half year; includes statistics for 8 cities and 8 sectors, literature review insights and depth-survey findings. inTouch analytics http://be-in-touch.com
Transcript of Team Lease Employment Outlook Report: Half Yearly Special · Team Lease Employment Outlook Report:...

Team Lease Employment Outlook
Report: Half Yearly Special Quarter-23, July-September 2012
A comprehensive and in-depth analysis of Employment and Business Outlook for the
forthcoming half year; includes statistics for 8 cities and 8 sectors, literature review insights and
depth-survey findings.
inT
ou
ch
an
aly
tics
http
://be-in
-tou
ch
.co
m

Team
Lea
se E
mp
loym
ent
Ou
tlo
ok
Rep
ort
: Hal
f Ye
arly
Sp
ecia
l
1
Literature Research & Depth Survey insights This edition of the Team
Lease Employment
Outlook Survey report
carries: a depth survey
that compiles thoughts
related to hiring and
talent retention which
respondents have shared
with us in addition to the
outlook for business and
hiring; anda literature
research
sectionthatstudies the
intensity of blue collar
workforce
employment,with the
help of an extensive
secondary research
exercise.
Preface
The TeamLease Employment Outlook Report is a forward looking tool
for human resource policy and decision makers, reflecting business
sentiment for hiring across cities and sectors. This report carries a
snapshot of business hiring sentiment for the next six months on the
basis of the survey and analysis carried out during the preceding 3
months.
The Employment Outlook Survey spans eight industry sectors and eight
cities across India. The survey covers small, medium and large
companies across these sectors, studies attrition and employment
trends, and gleans information on hiring sentiments, all this covering
different locations, hierarchical levels and functional areas.
As part of a recent feature we introduced, we have set out to invite
thoughts on hiring and talent retention from respondents that go
beyond hiring and business sentiment inputs we usually solicit from
them.
With the most critical drivers that influence hiring being tracked
continually, the Employment Outlook Report is the only one of its kind
seeking to deliver high impact hiring decision support to its
stakeholders – Business & HR heads, Senior Management as well as
industry policy makers.
The current edition also studies the intensity of blue collar workforce
employment across industries and investigates if it corresponds with
hiring intent, with the help of an extensive secondary research
exercise.

Team
Lea
se E
mp
loym
ent
Ou
tlo
ok
Rep
ort
: Hal
f Ye
arly
Sp
ecia
l
2
Contents
1. Executive Summary 2. Project Objectives 3. Index definitions
3.1. Employment Outlook Index 3.2. Business Outlook Index
4. Depth Survey findings: Hiring and Talent Retention 5. Employment Outlook
5.1. Net Employment Outlook 5.2. Net Employment Outlook Growth – by sector 5.3. Net Employment Outlook Growth – by city
6. Business Outlook 6.1. Net Business Outlook 6.2. Net Business Outlook Growth – by sector 6.3. Net Business Outlook Growth – by city
7. Hiring Intent 7.1. Hiring Intent by Location 7.2. Hiring Intent by Hierarchy 7.3. Hiring Intent by Functional Area
8. Other Trends 9.1. Employment Outlook Index – city-sector drilldown 9.2. Business Outlook Index – city-sector drilldown 9.3. Attrition trends by sector 9.4. Attrition trends by city
9. Annexure: Research Methodology 9.1. Sample Design 9.2. Respondent Selection 9.3. Data Collection 9.4. Secondary Sources
10. Sample Distribution 10.1. City-wise breakup 10.2. Business size-wise breakup
11. Reasons for Attrition – the employer perspective 11.1. By city 11.2. By sector
12. Insights: Literature Review

Team
Lea
se E
mp
loym
ent
Ou
tlo
ok
Rep
ort
: Hal
f Ye
arly
Sp
ecia
l
3
Executive Summary
The Apr-Sep, FY14 half year records a high level of optimism in terms of the hiring sentiment.There is a healthy growth of 4 percentage points in the Employment Outlook Index. Forecasts for the business sentiment are,comparatively mixed, with a marginal improvement of 2 percentage points in the Business Outlook Index.
Sectors wise frontrunners that post significant growth in both the Employment and Business Outlook indices are ITeS (5 and 4 points respectively) and Healthcare/Pharma (4 and 5 points respectively). Retail is projected to rise by 5 percentage points in Employment outlook. Meanwhile, the only sector that badly loses is Infrastructure – the business outlook here goes down by 5 percentage points.
City trends point to Mumbai as the leader, with a large increase of 5 and 7 percentage points,respectively, in Employment and Business outlook. The other gainers include Bangalore (4 percentage point increase in Employment outlook) and Delhi (5 percentage point increase in Business outlook).
Across geographies, Tier-II cities lead hiring intent, with a big rise of 4 points. Metros follow suit, however, with a marginal improvement of a single point. Hiring at the Middle and Junior levels is set to be more popular in the forthcoming half year(Apr-Sep, FY14), with a 6 and 4 point increase in hiring intent. Split by functional areas, Blue collar and Engineering are far ahead of the rest by registering an increase of 6 and 5 points respectively. And, both Sales & Marketing and IT witness a marginal increase of 2 points.
Blue Collar hiring is forecast to increase by a significant rate in the coming 6 months, as per the intent captured per functional areas. Our literature research investigates and finds that the sectors that have a higher incidence of informal workforce hiring are, indeed, the ones that have an increased intent to hire blue collar workers over the coming half year.
The depth survey findings reveal a hunt for superior grade talent combined with a reward-and-recognize mode organizations are stepping into over the next 6 months. This would mean an intense talent acquisition and retention tug-of-war greeting the first half of the next fiscal.

Team
Lea
se E
mp
loym
ent
Ou
tlo
ok
Rep
ort
: Hal
f Ye
arly
Sp
ecia
l
4
Project Objectives The Employment Outlook Report aims at –
Providing forward looking estimates of hiring sentiment and thus enabling its users with a tool to make effective hiring / people decisions for the immediate next quarter / half year.
Providing *Hiring Sentiment Intelligence* for different industry sectors, business sizes and geographies, as well as across hierarchical levels and functional areas.
Index Definitions Employment Outlook Index: The Employment Outlook Index is computed as the
difference in the proportion of respondents who report an increase in hiring needs and those who report a decline in hiring needs over the next three / six months.
Business Outlook Index: The Business Outlook Index is computed by subtracting the percentage respondents who say business in the next three / six months is likely to decrease from the percentage who says it will increase.
4. Depth Survey Findings

Team
Lea
se E
mp
loym
ent
Ou
tlo
ok
Rep
ort
: Hal
f Ye
arly
Sp
ecia
l
5
Main drivers of Hiring
With a mixed business sentiment pattern across industries and cities, we delved into
factors beyond business prospects for the industry and city to look at what drives
hiring for the next 6 months. Employers seem to be in the mood to cherry pick great
talent at bargain rates of salary in a mixed-mood market. This looks like an attempt
by the surveyed employers to consolidate their position in the talent market.
The desire to acquire valuable talent is aimed at four broad profile categories as
illustrated below.
Root causes of attrition; and the reasons for attrition this present Half Year
Attrition in the present Half Year was attributed to two major reasons – 1. a small
element of wrongly calibrated hiring in the past and 2. better market opportunities.
The first reason is all too familiar: bad choices become apparent after significant
monies have been spent on training and orientation and some of the hires leave.
The second reason is inevitable in a supply-constrained market.
24
11
9
6
Profile categories in demand for April-September, 2013-14 [# of respondents]
Engineers with > 5 years experience
Analysts & Business Consultants
Specialized Software Programmers
Digital Marketing Professionals
Team
Lea
se E
mp
loym
ent
Ou
tlo
ok
Rep
ort
: Hal
f Ye
arly
Sp
ecia
l
6
Talent retention strategy and steps to retain top talent
Retention initiatives are concentrated around rewards and recognition over the next
6 months. Organizations are in performance evaluation mode and the outcomes are
all about how valuable talent needs to be rewarded and retained.
Seen in conjunction with the aggressive talent hunt organizations are on, as stated in
the first section of this chapter, retention of top talent would take a lot more than in
the previous Half Years.
What makes employers prefer specific tier-2 and tier-3 locations to hire in
significant numbers
A variant response obtained during the surveys carried out for this edition was the
augmentation of customer service personnel by a few of the respondents that
indicated they would hire substantially from both tier-2 and tier-3 cities / towns.
These respondents believe that rural BPOs that have emerged at locations such as
Hosur, Kochi, Udupi, Falda and Chindwara are a good ground for hiring cost-effective
support staff.

Team
Lea
se E
mp
loym
ent
Ou
tlo
ok
Rep
ort
: Hal
f Ye
arly
Sp
ecia
l
7
5. Employment Outlook
5.1 Net Employment Outlook 5.2 Net Employment Outlook Growth – by sector
5.3 Net Employment Outlook Growth – by city

Team
Lea
se E
mp
loym
ent
Ou
tlo
ok
Rep
ort
: Hal
f Ye
arly
Sp
ecia
l
8
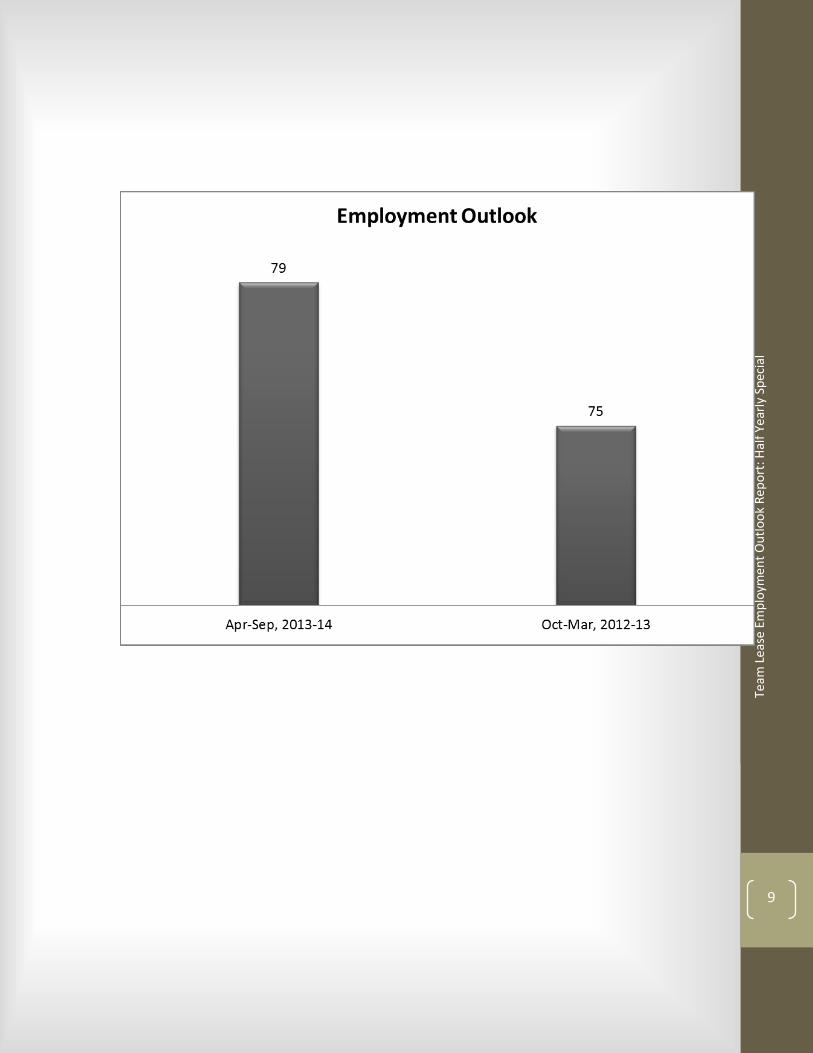
5.1 Net Employment Outlook
The half year period, Apr-Sep, FY14 sees a substantial increase of +4 points in the
net employment index. The Net Employment Outlook Indexis the difference in the
proportion of respondents reporting an increase in hiring needs and those reporting
a decline for the half year period in question.
Period (Figures in percentage)
Increase Decrease No Change Net Employment Outlook
Apr-Sep, FY14 84 5 11 +79
Oct-Mar,FY13 77 2 21 +75
More businesses have decided to hire over the forthcoming half year, compared
with the last half year).
Shaded cells have significant increases (gray) /decreases (red) in Index.
Team
Lea
se E
mp
loym
ent
Ou
tlo
ok
Rep
ort
: Hal
f Ye
arly
Sp
ecia
l
9

Team
Lea
se E
mp
loym
ent
Ou
tlo
ok
Rep
ort
: Hal
f Ye
arly
Sp
ecia
l
10
5.2 Net Employment Outlook Growth – by sector
Three sectors witness significant changes in the Net employment Outlook. The
outlook grows by +5 percentage points for ITeS and Retail. While, a four point
increase in the outlook is observed in Healthcare &Pharma.
Sector
(Figures in Percentage)
Half Year Net Increase /
Decrease Apr-
Sep,
FY14
Oct-
Mar,
FY13
IT 78 75 +3
ITES 79 74 +5
Financial Services [FS] 63 61 +2
Retail & FMCG [R&F] 81 76 +5
Infrastructure [INF] 60 63 -3
Manufacturing & Engineering [M&E] 51 53 -2
Telecom [TEL] 80 80 NC
Healthcare &Pharma [H&P] 75 71 +4
Four other sectors experience a marginal change in the Net employment Outlook-
the outlook grows by 3 and 2 percentage points for IT and Financial services
respectively and drops by 3 and 2 percentage points for Infrastructure and
Manufacturing respectively.

Team
Lea
se E
mp
loym
ent
Ou
tlo
ok
Rep
ort
: Hal
f Ye
arly
Sp
ecia
l
11

Team
Lea
se E
mp
loym
ent
Ou
tlo
ok
Rep
ort
: Hal
f Ye
arly
Sp
ecia
l
12
5.3 Net Employment Outlook Growth – by city
Mumbai and Bangalore, with a five and four percentage point growthin the
employment outlook lead the list in the forthcoming half year.
City
(Figures in Percentage)
Half Year Net Increase / Decrease Apr-Sep, FY14 Oct-Mar, FY13
Mumbai [Mum] 70 65 +5
Delhi [Del] 66 64 +2
Bangalore [Blr] 77 73 +4
Kolkata [Kol] 58 61 -3
Chennai [Chn] 65 66 -1
Pune [Pun] 71 68 +3
Hyderabad [Hyd] 59 61 -2
Ahmedabad [Ahd] 72 73 -1
A marginal increase in the outlook is noticed in Pune(+3 points) and Delhi(+2 points).
Four cities-Kolkata, Hyderabad, Ahmedabad and Chennai record a slight dip in the
outlook.

Team
Lea
se E
mp
loym
ent
Ou
tlo
ok
Rep
ort
: Hal
f Ye
arly
Sp
ecia
l
13

Team
Lea
se E
mp
loym
ent
Ou
tlo
ok
Rep
ort
: Hal
f Ye
arly
Sp
ecia
l
14
6. Business Outlook
6.1 Net Business Outlook 6.2 Net Business Outlook Growth – by sector
6.3 Net Business Outlook Growth – by city

Team
Lea
se E
mp
loym
ent
Ou
tlo
ok
Rep
ort
: Hal
f Ye
arly
Sp
ecia
l
15
6.1 Net Business Outlook
The coming half yearinches up the business outlook, although slightly by an increase
of two percentage points.
Period (Figures in percentage)
Increase Decrease No Change Net Business Outlook
Apr-Sep, FY14 81 7 12 +74
Oct-Mar, FY13 75 3 22 +72
The trend is characterised by a substantial growth in the number of respondents
reporting an increase as well asdecrease in the business sentiment.
[Shaded cells have significant increases (gray) /decreases (red) in Index.]

Team
Lea
se E
mp
loym
ent
Ou
tlo
ok
Rep
ort
: Hal
f Ye
arly
Sp
ecia
l
16

Team
Lea
se E
mp
loym
ent
Ou
tlo
ok
Rep
ort
: Hal
f Ye
arly
Sp
ecia
l
17
6.2 Net Business Outlook Growth – by sector
More than half of the sectors experience a growth in the business sentiment.
Amongst them, Healthcare &Pharma and ITeS have a significant growth of 5 and 4
percentage points respectively. While, the three sectors that have marginal growth
are Telecom, IT and Manufacturing.
Sector
(Figures in Percentage)
Half Year Net Increase / Decrease Apr-Sep,
FY14
Oct-Mar,
FY13
IT 74 72 +2
ITES 73 69 +4
Financial Services [FS] 60 62 -2
Retail & FMCG [R&F] 82 84 -2
Infrastructure [INF] 62 67 -5
Manufacturing & Engineering [M&E] 61 60 +1
Telecom [TEL] 59 56 +3
Healthcare &Pharma [H&P] 74 69 +5
Infrastructure turns out to be a laggard with a maximum drop of 5 percentage
points. Financial services and Retail slightly dip by 2 percentage points.

Team
Lea
se E
mp
loym
ent
Ou
tlo
ok
Rep
ort
: Hal
f Ye
arly
Sp
ecia
l
18

Team
Lea
se E
mp
loym
ent
Ou
tlo
ok
Rep
ort
: Hal
f Ye
arly
Sp
ecia
l
19
6.3 Net Business Outlook Growth – by city
Forthcoming half year sees Mumbai and Delhi contributing almost entirely to the
incremental growth in the business sentiment.
City
(Figures in Percentage)
Half Year Net Increase / Decrease Apr-Sep, FY14 Oct-Mar, FY13
Mumbai [Mum] 71 64 +7
Delhi [Del] 56 51 +5
Bangalore [Blr] 78 75 +3
Kolkata [Kol] 68 69 -1
Chennai [Chn] 82 80 +2
Pune [Pun] 80 80 NC
Hyderabad [Hyd] 72 73 -1
Ahmedabad [Ahd] 73 73 NC
Bangalore and Chennai report a marginal increase of 3 and 2 percentage points
respectively. The rest of the cities have little or no change in the business sentiment.

Team
Lea
se E
mp
loym
ent
Ou
tlo
ok
Rep
ort
: Hal
f Ye
arly
Sp
ecia
l
20

Team
Lea
se E
mp
loym
ent
Ou
tlo
ok
Rep
ort
: Hal
f Ye
arly
Sp
ecia
l
21
7. Hiring Intent
7.1 Hiring Intent by Geography 7.2 Hiring Intent by Hierarchy 7.3 Hiring Intent by Functional Area
Team
Lea
se E
mp
loym
ent
Ou
tlo
ok
Rep
ort
: Hal
f Ye
arly
Sp
ecia
l
22
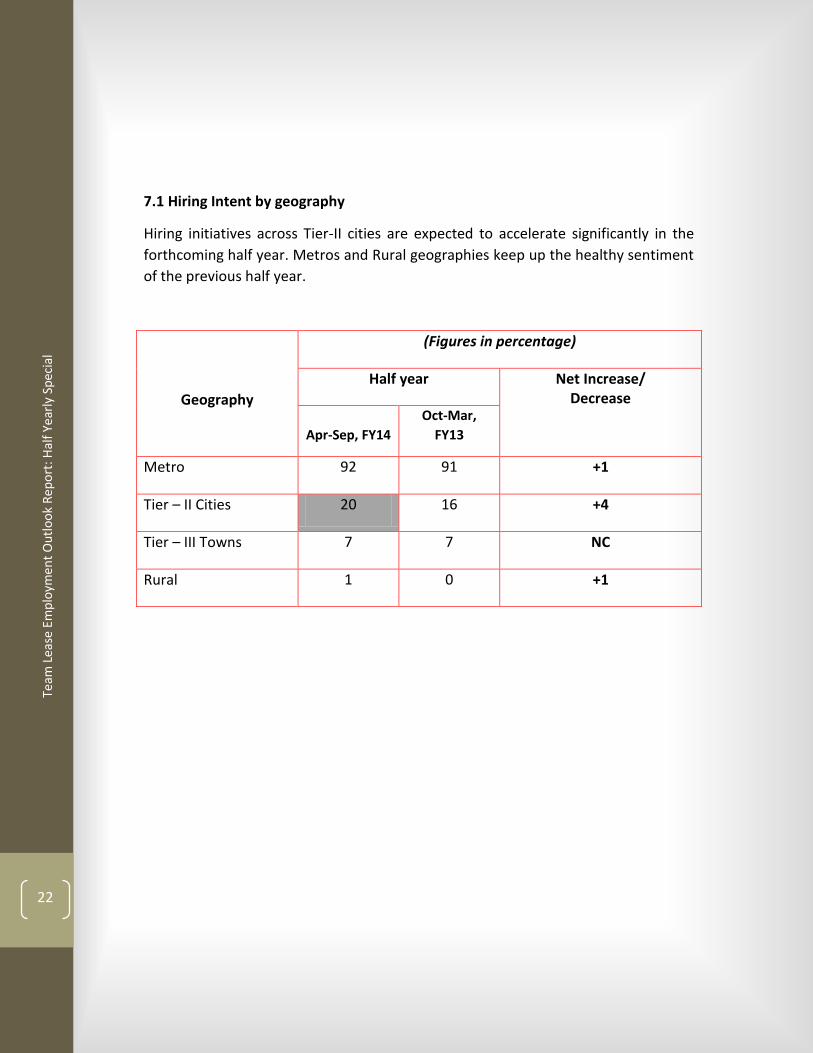
7.1 Hiring Intent by geography
Hiring initiatives across Tier-II cities are expected to accelerate significantly in the
forthcoming half year. Metros and Rural geographies keep up the healthy sentiment
of the previous half year.
Geography
(Figures in percentage)
Half year Net Increase/ Decrease
Apr-Sep, FY14
Oct-Mar,
FY13
Metro 92 91 +1
Tier – II Cities 20 16 +4
Tier – III Towns 7 7 NC
Rural 1 0 +1

Team
Lea
se E
mp
loym
ent
Ou
tlo
ok
Rep
ort
: Hal
f Ye
arly
Sp
ecia
l
23

Team
Lea
se E
mp
loym
ent
Ou
tlo
ok
Rep
ort
: Hal
f Ye
arly
Sp
ecia
l
24
7.2 Hiring Intent by Hierarchy
Businesses intend to increase hiring across organization levels, with a substantial
appreciation in the intent at the Middle and Junior levels. A negligible dip in hiring
intent is seen across Senior levels.
Hierarchy
(Figures in percentage)
Half year Net Increase/ Decrease
Apr-Sep, FY14
Oct-Mar,
FY13
Entry Level [No Experience]
48 47 +1
Junior Level [1 – 3 years’ Experience]
71 67 +4
Middle Level [3 – 7 years’ Experience]
47 42 +5
Senior Level [> 7 years’ Experience]
24 25 -1
Not Hiring 12 12 NC

Team
Lea
se E
mp
loym
ent
Ou
tlo
ok
Rep
ort
: Hal
f Ye
arly
Sp
ecia
l
25

Team
Lea
se E
mp
loym
ent
Ou
tlo
ok
Rep
ort
: Hal
f Ye
arly
Sp
ecia
l
26
7.3 Hiring Intent by Functional Area
The upcoming half year(HY2) sees an incremental change in hiring intent across
various functional areas. Blue Collar and Engineering profiles beat the incremental
trend and grow by 5 and 4 percentage points respectively.
Functional Area
(Figures in percentage)
Half year Net Increase/ Decrease
Apr-Sep, FY14
Oct-Mar,
FY13
Sales / Marketing / Customer Service [SMC]
85 84 +1
IT 32 31 +1
Engineering [ENG] 45 41 +4
Accounts / Finance [A&F]
10 11 -1
Administration / HR / Office Service [AHO]
11 13 -2
Blue Collar [BC]* 47 42 +5
Other 5 5 NC
Not hiring 7 8 -1
*Previously included under ‘Others’

Team
Lea
se E
mp
loym
ent
Ou
tlo
ok
Rep
ort
: Hal
f Ye
arly
Sp
ecia
l
27

Team
Lea
se E
mp
loym
ent
Ou
tlo
ok
Rep
ort
: Hal
f Ye
arly
Sp
ecia
l
28
8. Other Trends
8.1 Employment Outlook Index – city-sector drilldown 8.2 Business Outlook Index – city-sector drilldown
8.3 Attrition trends by sector 8.4 Attrition trends by city

Team
Lea
se E
mp
loym
ent
Ou
tlo
ok
Rep
ort
: Hal
f Ye
arly
Sp
ecia
l
29
8.1 Employment Outlook Index – city-sector drilldown
City
Half
Year
Total
Sector
IT
ITeS
FS
RMF
INF
M&E
TEL
H&P
Mum
Apr-Sep,
FY14 70 10 8 13 12 5 7 6 9
Oct-
Mar,
FY13
65 9 6 11 12 6 7 6 8
Del
Apr-Sep,
FY14 66 5 5 13 14 5 7 9 8
Oct-
Mar,
FY13
65 6 4 13 14 4 6 9 9
Blr
Apr-Sep,
FY14 77 8 10 8 9 5 11 13 13
Oct-
Mar,
FY13
74 6 8 8 9 6 9 14 14
Kol
Apr-Sep,
FY14 58 4 5 11 8 6 6 3 15
Oct-
Mar,
FY13
61 5 4 12 9 6 4 3 18

Team
Lea
se E
mp
loym
ent
Ou
tlo
ok
Rep
ort
: Hal
f Ye
arly
Sp
ecia
l
30
Chn
Apr-Sep,
FY14 65 7 7 8 11 8 7 5 12
Oct-
Mar,
FY13
66 6 8 9 10 8 8 6 11
Pun
Apr-Sep,
FY14 71 6 12 5 6 11 10 10 11
Oct-
Mar,
FY13
69 6 10 6 6 12 11 9 9
Hyd
Apr-Sep,
FY14 59 3 10 9 7 4 11 6 9
Oct-
Mar,
FY13
61 4 11 11 6 5 10 5 9
Ahd
Apr-Sep,
FY14 72 4 4 18 7 4 12 10 13
Oct-
Mar,
FY13
73 3 3 18 8 4 14 9 14

Team
Lea
se E
mp
loym
ent
Ou
tlo
ok
Rep
ort
: Hal
f Ye
arly
Sp
ecia
l
31
9.2 Business Outlook Index – city-sector drilldown
City
Half
Year
Total
Sector
IT
ITeS
FS
RMF
INF
M&E
TEL
H&P
Mum
Apr-Sep,
FY14 71 5 4 10 7 18 10 6 11
Oct-
Mar,
FY13 64 6 5 8 5 17 9 5 9
Del
Apr-Sep,
FY14 56
3 4 8 10 7 6 8 10
Oct-
Mar,
FY13 51 4 2 6 11 8 6 6 8
Blr
Apr-Sep,
FY14 78
9 4 11 10 9 12 15 8
Oct-
Mar,
FY13 76 8 5 9 9 9 13 13 10
Kol
Apr-Sep,
FY14 68
10 5 6 12 9 5 10 11
Oct-
Mar,
FY13 69 9 4 7 12 10 4 11 12

Team
Lea
se E
mp
loym
ent
Ou
tlo
ok
Rep
ort
: Hal
f Ye
arly
Sp
ecia
l
32
Chn
Apr-Sep,
FY14 82
9 11 12 9 10 9 8 14
Oct-
Mar,
FY13 81 8 9 10 9 12 9 9 15
Pun
Apr-Sep,
FY14 80 11 14 7 10 13 12 9 4
Oct-
Mar,
FY13 80 9 14 8 9 14 10 10 6
Hyd
Apr-Sep,
FY14 72 9 6 13 11 7 8 6 12
Oct-
Mar,
FY13 73 10 6 12 10 7 9 7 12
Ahd
Apr-Sep,
FY14 73 9 4 10 9 8 12 4 17
Oct-
Mar,
FY13 73 8 3 11 10 8 12 5 16
Team
Lea
se E
mp
loym
ent
Ou
tlo
ok
Rep
ort
: Hal
f Ye
arly
Sp
ecia
l
33
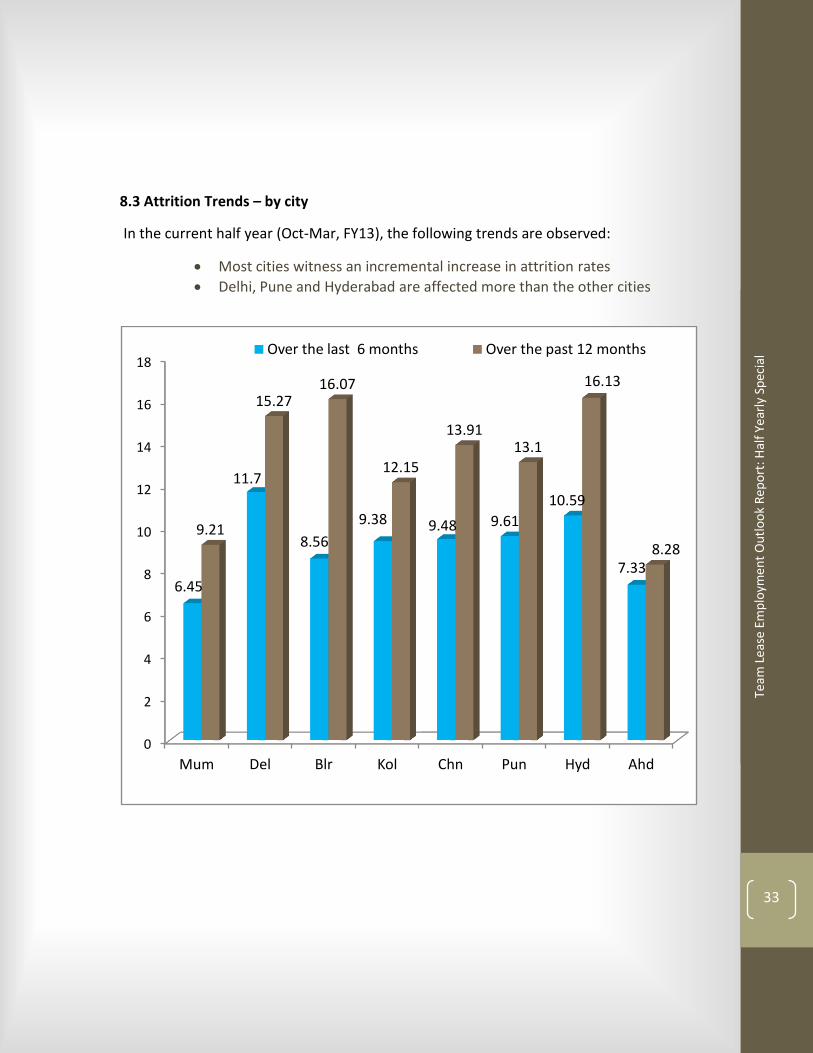
8.3 Attrition Trends – by city
In the current half year (Oct-Mar, FY13), the following trends are observed:
Most cities witness an incremental increase in attrition rates
Delhi, Pune and Hyderabad are affected more than the other cities
0
2
4
6
8
10
12
14
16
18
Mum Del Blr Kol Chn Pun Hyd Ahd
6.45
11.7
8.56
9.38 9.48 9.61
10.59
7.33
9.21
15.27 16.07
12.15
13.91 13.1
16.13
8.28
Over the last 6 months Over the past 12 months

Team
Lea
se E
mp
loym
ent
Ou
tlo
ok
Rep
ort
: Hal
f Ye
arly
Sp
ecia
l
34
Attrition Trends – by sector
In the current half year, Oct-Mar, FY13, most sectors report modest increases in
attrition. Infrastructure and ITeS are sectors contributing most toward both half
yearly and annual attrition.
0
2
4
6
8
10
12
14
16
M&E R&F FS IT ITES INF TEL H&P
8.9 9.56
8.65
9.71 10.12
10.97
9.56
8.57
10.96
13.78 13.28 13.11
15.52 15.07
11.24 11.25
Over the last 6 months Over the past 12 months
Team
Lea
se E
mp
loym
ent
Ou
tlo
ok
Rep
ort
: Hal
f Ye
arly
Sp
ecia
l
35
10.Annexure Research Methodology
The Employment Outlook Survey follows a rigorous and statistically validated process as detailed below.
10.1 Sample Design
Random sampling technique was used to identify respondents for the survey. Data sources used to collect contact data were:
1. Kompass directory for small, medium and large sized companies in the private sector. To ensure continuity with the baseline measurement, the core random sample was drawn from this database.
2. NASSCOM database for IT companies
3. Companies registered withbpo.india.org in the case of ITES and
4. Financial companies registered with the Bombay Stock Exchange (BSE).
10.2 Respondent Selection
Target respondents for the study were Business & HR Heads as well as Senior Managers with hiring mandates. The databases offered a contact name for each company listed. Interviewers called into each of these companies and obtained the names of the appropriate individuals who were responsible for hiring decisions.
10.3 Data Collection
The survey instrument was then administered to the target respondents using the CATI (Computer Aided Telephonic Interview) methodology. Appropriate computer software was used for data collection and tabulation. Please refer the following section named ‘Sample Distribution’ for details on city and business size-wise breakup of the sample.
10.4 Secondary Data Sources:
- Major sources of Indian and international research about informal workforce employment trends in India

Team
Lea
se E
mp
loym
ent
Ou
tlo
ok
Rep
ort
: Hal
f Ye
arly
Sp
ecia
l
36
10. Sample Distribution
10.1 City-wise breakup
10.2 Business Size Breakup
Small [Up to 249 employees]
Medium [250 – 999 employees]
Large [1,000 or more employees]
Mumbai 11 50 13
Delhi 11 52 10
Bangalore 14 52 13
Kolkata 14 50 14
Chennai 15 48 17
Pune 12 55 16
Hyderabad 12 52 16
Ahmedabad 13 42 12
Sectors / City
Mumbai Delhi Bangalore Kolkata Chennai Pune Hyderabad Ahmedabad Total
M&E 6 5 10 10 10 10 9 8 68
R&F 10 10 9 9 11 11 10 8 78
FS 11 10 12 7 9 11 10 5 75
IT 10 10 9 12 10 10 10 10 81
ITeS 9 11 10 10 12 10 10 9 81
INF 10 9 10 10 10 10 11 10 80
TEL 8 8 9 10 8 11 11 6 71
H&P 10 10 10 10 10 10 9 11 80
Total 74 73 79 78 80 83 80 67 614
Team
Lea
se E
mp
loym
ent
Ou
tlo
ok
Rep
ort
: Hal
f Ye
arly
Sp
ecia
l
37
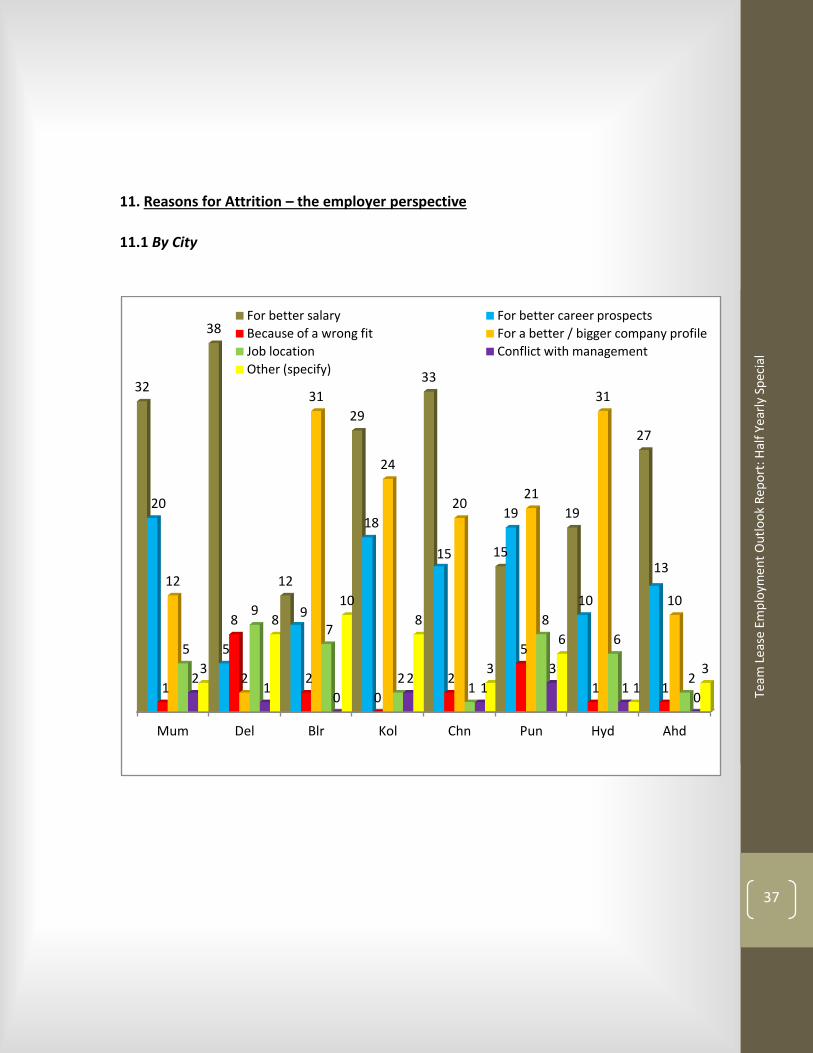
11. Reasons for Attrition – the employer perspective
11.1 By City
Mum Del Blr Kol Chn Pun Hyd Ahd
32
38
12
29
33
15
19
27
20
5
9
18
15
19
10
13
1
8
2
0
2
5
1 1
12
2
31
24
20 21
31
10
5
9
7
2 1
8
6
2 2 1
0
2 1
3
1 0
3
8
10
8
3
6
1
3
For better salary For better career prospects
Because of a wrong fit For a better / bigger company profile
Job location Conflict with management
Other (specify)

Team
Lea
se E
mp
loym
ent
Ou
tlo
ok
Rep
ort
: Hal
f Ye
arly
Sp
ecia
l
38
11.2 By Sector
0
5
10
15
20
25
30
35
M&E R&F FS IT ITES INF TEL H&P
22
13
29
19
22
31
22
17
11
14
25
23
26
16
9
21
1 1 0
3 4
5 6
5
17
22
9
17
8
14
12
28
0
8
4 5
3
1
9
11
1 0 0 0 0
2
0 0
9 8
7
10
5
3
1
5
For better salary For better career prospects Because of a wrong fit For a better / bigger company profile Job location Conflict with management Other (specify)
Team
Lea
se E
mp
loym
ent
Ou
tlo
ok
Rep
ort
: Hal
f Ye
arly
Sp
ecia
l
39
12. Insights: Literature Review
Blue Collar workforce:
Hiring Sentiment versus Employment Intensity
Team
Lea
se E
mp
loym
ent
Ou
tlo
ok
Rep
ort
: Hal
f Ye
arly
Sp
ecia
l
40
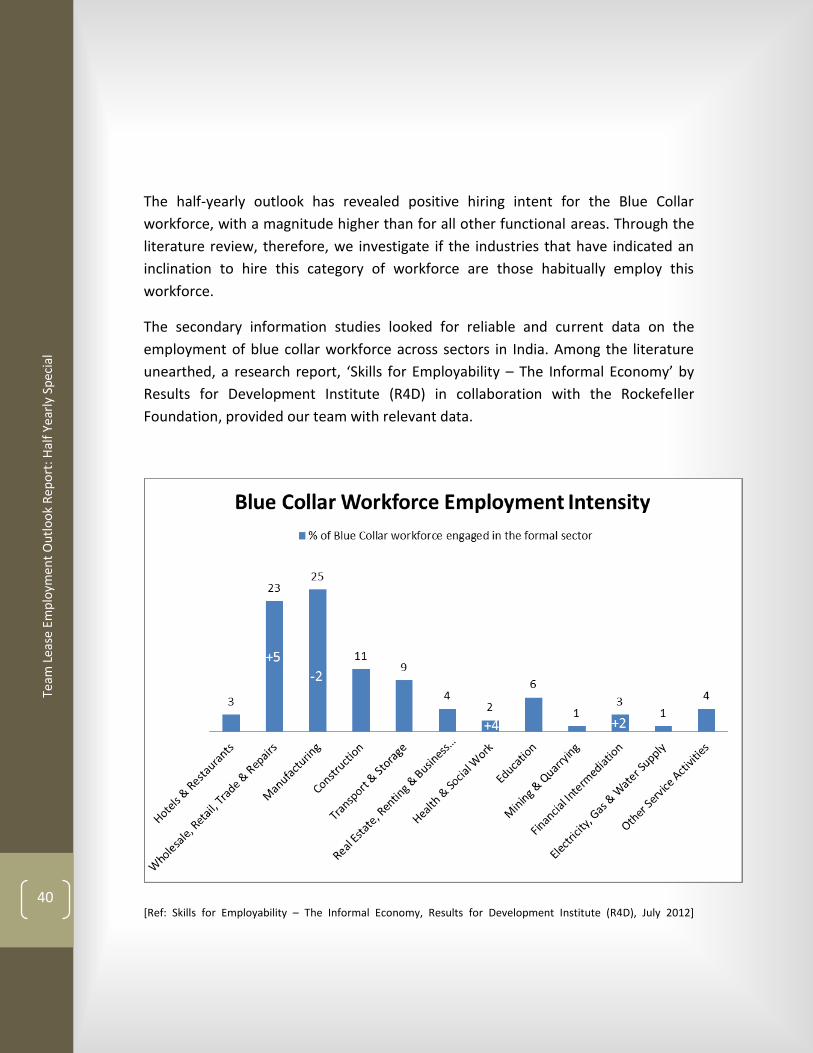
The half-yearly outlook has revealed positive hiring intent for the Blue Collar
workforce, with a magnitude higher than for all other functional areas. Through the
literature review, therefore, we investigate if the industries that have indicated an
inclination to hire this category of workforce are those habitually employ this
workforce.
The secondary information studies looked for reliable and current data on the
employment of blue collar workforce across sectors in India. Among the literature
unearthed, a research report, ‘Skills for Employability – The Informal Economy’ by
Results for Development Institute (R4D) in collaboration with the Rockefeller
Foundation, provided our team with relevant data.
[Ref: Skills for Employability – The Informal Economy, Results for Development Institute (R4D), July 2012]

Team
Lea
se E
mp
loym
ent
Ou
tlo
ok
Rep
ort
: Hal
f Ye
arly
Sp
ecia
l
41
The above chart illustrates the intensity of employment of blue collar workforce
across the formal sector in India. Of the 11 industry categories the research quotes,
we found 4 that directly correspond to those in the TeamLease Employment Outlook
Survey. Two of the four industry categories – Wholesale, Retail, Trade & Repairs and
Manufacturing – have high incidence of employment intensity of blue collar
workforce.
In terms of Business sentiment, Healthcare is the only industry with a significantly
high sentiment growth among the above four.
The Hiring sentiment scene is greener though. Three of the four industry categories
that correspond to the industries we research and report on are found to be having
increased inclination (two, significantly high) to hire blue collar workforce over the
next 6 months; only one – Manufacturing – is found to have a slightly reduced level
of hiring inclination.
Historical evidence of higher incidence of blue collar workforce employment in the
industries that responded with higher inclination to hire reinforces this forecast. The
informal workforce is the functional category to watch over the next 6 months.