Teaching communication in undergraduate science: the ...
71
1 HONOURS RESEARCH REPORT (BIOL6501) School of Biological Sciences, University of Queensland, Australia Name: Lucy Mercer-Mapstone (42041469) Supervisor: Dr Louise Kuchel Word Count: 9930 *Word limit revised to 10,000 as permitted by the Honours coordinator Teaching communication in undergraduate science: the current standard and best practice recommendations on how to improve.
Transcript of Teaching communication in undergraduate science: the ...

1
HONOURS RESEARCH REPORT (BIOL6501)
School of Biological Sciences, University of Queensland, Australia
Name: Lucy Mercer-Mapstone (42041469) Supervisor: Dr Louise Kuchel
Word Count: 9930
*Word limit revised to 10,000 as permitted by the Honours coordinator
Teaching communication in undergraduate science: the current
standard and best practice recommendations on how to improve.

2
STATEMENT OF AUTHORSHIP
The research carried out in the course of this investigation and the results presented in this report
are, except where acknowledged, the original work of the author, and all research was conducted
during the Honours program.
Signature:
Name: Lucy Mercer-Mapstone
Date: 17/10/2014

3
ABSTRACT
There is an international push from many sectors of society to improve the effectiveness with
which scientists communicate to non-scientific audiences. One approach to facilitating this
change is to ensure science graduates are equipped with a relevant and developed
communications skillset. This study used an evidence-based approach to explore ways to
improve the teaching of non-technical communication skills to undergraduate science students at
Australian research-intensive universities. A list of 12 ‘Key Elements of Effective Science
Communication’ was developed based on a literature critique and validated through a survey of
relevant experts. A detailed evidential baseline for not only what but how communication skills
are being taught currently was established by quantifying which communication skills are taught
explicitly, implicitly, or are absent in undergraduate science assessment tasks from a range of
assessment tasks (n=35) at several universities (n = 4) around Australia. Results indicate that 10
of the 12 key elements were absent from more than 50 per cent of assessment tasks and 77.14%
of all assessment tasks taught less than 5 key elements explicitly. Tasks aimed at non-scientific
audiences were significantly more explicit in teaching communication than those aimed at
scientific audiences. Innovative ‘template-style’ learning activities structured around selected
key elements and aimed explicitly to develop student ability to communicate with non-scientific
audiences were designed and implemented in three tertiary science courses. Triangulation of
multiple data sources showed that students improved in both their understanding of, and ability
to do, targeted communication. Academics reported improved learning of the science involved
in the tasks and indicated the tasks would be sustainable and implemented in future years. This
study indicates that important principles for effective communication to non-technical audiences
generally are absent from science assessment tasks but that effective science communication
skills can be integrated into existing science curricula successfully through the use of ‘template’
activities. Doing so can require little input from teaching academics and enhance student
learning of both science and communication.
Keywords: science communication, undergraduate skills, novel teaching activities, education,
learning gains.

4
INTRODUCTION
“Scientists must learn to communicate with the public, be willing to do so, and indeed consider it
their duty to do so” (Bodmer 1985). This widely disseminated statement was made by the Royal
Society of London nearly 30 years ago and since then the field of science communications has
undergone a rapid evolution. Originally, the transmission model of communication – a top down
transferal of facts from scientific to non-scientific audiences (van der Sanden & Meijman 2008)
– fulfilled the assumptions of the then popular deficit model of science communication – that by
simply making the facts of science available we are fulfilling the role of public education and
generating more interest in, and improving the understanding of, science and technology (Besley
& Tanner 2011). The proliferation of new media platforms, however, has underpinned current
recommendations for best practice to move away from the deficit or transmission model to a
more egalitarian two-way discourse, or dialogue-based science communication model (Mulder et
al. 2008; Bray et al. 2011). It is the engagement between scientific audiences (with technical
training in science) and non-scientific audiences (with no technical training in science) that is
pivotal in promoting the much-needed public engagement with science rather than just the public
understanding of science (Besley & Tanner 2011).
The non-scientific public are increasingly encouraged to be involved in the scientific debate
(Bubela et al. 2009) due to the rapid development of scientific and technological complexities
within society (Ryder 2001) but to what extent are they equipped to do so? Scientific literacy is
becoming problematic as the distance between scientific and non-scientific dialects is increasing
as science becomes progressively more specialised and jargon-heavy. So how do we bridge this
divide? One approach is to ensure that science graduates are equipped with the ability to
communicate science in an accessible manner to a range of audiences. It is increasingly
acknowledged that this role of science communication to broader range of audiences is the
responsibility of the science community (Brownell et al. 2013a; Leshner 2003; Greenwood
2001). Brownell et al. (2013a) argue that integrating structured communication training into
undergraduate science degrees will improve the two-way dialogue between scientists and the
public, and help to avoid mistrust of science research and diminish misunderstanding of pivotal
scientific issues such as those surrounding the debate over climate change (Brownell et al.
2013a; Somerville and Hassol, 2011).
5
‘Science communication’ will be defined for the purpose of this study as the process of
translating complex science into language and concepts that are engaging and understandable to
non-scientific audiences such as politicians, industry professionals, educators, journalists,
government, business, and the lay public (adapted from Burns et al. 2003). The need to provide a
definition arises because of the variation that exists in the literature. Science communication is a
young and interdisciplinary academic field. It draws on areas such as science, education, social
science, and communication (Mulder et al. 2008; Bray et al. 2011); a diversity which often
results in conflicting definitions and standards.
One area that lacks standardization or recommendations for ‘best practice’ is the teaching and
learning of communication with non-scientific audiences in an undergraduate science context.
There is an international movement acknowledging the benefits that training in science
communication would bring to undergraduate and postgraduate science students (e.g., Besley &
Tanner 2011; Bray et al. 2011). However, there are currently no requirements in Australia for
BSc programs to teach these skills. This also is the case in the United States of America (US)
where an analysis of neuroscience courses showed that students were required to undertake
specialized training in core components such as ethics or statistics but none in communication,
despite its inclusion as a core graduate competency (Brownell et al. 2013a). Undergraduate
science students often practice communication with scientific audiences through written reports
or seminars to peers but “they usually receive no explicit training in communication of scientific
concepts to a layperson audience” (Brownell et al. 2013a). There is very little evidence for, or
examples of, how to teach these skills effectively or to support what content should constitute the
core elements of such training (Mulder et al. 2008; Bray et al. 2011).
Tertiary education guidelines from the Australian Learning and Teaching Council (2011) include
communication as one of five fundamental learning outcomes for Australian undergraduate
science degrees. These guidelines dictate that science graduates should be able to communicate
scientific results effectively “to a range of audiences, for a range of purposes, and using a variety
of modes” (Jones et al. 2011). This statement indicates the requirement for a diverse range of
communication skills, but research indicates that the actuality of what is being taught currently
does not align with these requirements (Stevens 2013). Similarly, research shows that the current
training received by Australian science undergraduates does not align with employer and

6
workplace requirements (Zou, 2014; Herok et al. 2013; McInnis et al. 2000). Analytical,
technical, and problem-solving skills along with subject-specific knowledge apparently are being
taught successfully but communication skills consistently are falling short (according to surveys
of science graduates and employers) and do not reflect the needs of writing tasks outside
academia (McInnis et al. 2000; Gray et al. 2005). These findings gain further significance in
light of the fact that only 20 per cent of science graduates progress to be employed as technical
scientists (Graduate Careers Australia, 2011; University of Sydney, 2008).
So how can tertiary education practices be improved to meet modern educational, societal, and
employment demands for communication skills? Higher education has begun to address this
issue through a movement towards evidence-based strategies for improving teaching and
learning. A predominant example is the Carl Wieman Science Education Initiative (CWSEI) in
the US which is “aimed at dramatically improving undergraduate science education” (Wieman et
al. 2010). The CSWEI takes a four-step approach to improving teaching methods. These steps
involve establishing what students should learn, quantifying what they actually learn, developing
teaching and learning methods to produce optimum learning gains, and then disseminating and
adopting those practices which are most effective (Wieman et al. 2010). The current study aims
to address the need for explicit communication training (Brownell et al. 2013a) and the lack of
educational guidelines for communication in science degrees (specifically for communication
with non-scientific audiences) by implementing the first three steps of the CWSEI with a focus
on research-intensive universities around Australia.
The first aim of this study addresses the current lack of guidelines for teaching science
communication with non-technical audiences within an undergraduate science context, despite
recognition that a fundamental “recognizable framework” is essential for science communication
curricula (Mulder et al. 2008). Past international research has produced lists of ‘essential
elements’ or ‘core competencies’ for science communication in various post-graduate or
professional courses (Sevian & Gonsalves 2008; Miller et al. 2009; Bray et al. 2011; Baram-
Tsabari & Lewenstein 2013; Brownell et al. 2013; Fischhoff 2013) but this apparently has not
been explored or synthesized within an Australian undergraduate science context.
The second aim is to establish the extent to which communication concepts are being taught in
undergraduate science courses by examining contemporary assessment instructions. Previous

7
research has shown that 96-99 per cent of undergraduate science assessment tasks that involve
communication across five Group of Eight (Go8) Australian research-intensive universities are
targeted at an audience of ‘scientists of the same discipline’ (Stevens 2013). This highlights the
fact that there are very few assessment tasks that teach science undergraduates how to
communicate with non-scientific audiences but the study examined only general descriptions of
assessment tasks. These data do not answer the question: which core communication concepts
are being taught and assessed currently (and how) in Australian science courses? Establishing
this baseline is important in identifying effective solutions to improving the teaching of
communication skills.
The third aim of this study is to work with science teaching academics to develop and implement
innovative science communication assessment tasks and activities that explicitly teach
undergraduate science students how to communicate effectively with non-scientific audiences.
Brownell et al. (2013a) state that “upper-level undergraduate science courses should begin to
incorporate formalized, layperson-directed communication exercises” in parallel with science
content, but the practicalities of doing so present many implementation barriers. One such hurdle
includes the observation that science lecturers who are specialized in one specific subject cannot
be expected to be masters of educating undergraduates on a topic they themselves may find
challenging (Brownell et al. 2013a). Science academics rarely have the time, resources, or
formal training to communicate their own research to non-scientific audiences (Metcalfe &
Gascoigne 1995) let alone to develop the skills and courses required to teach such
communication thoroughly. A second hurdle to consider is the need to be explicit in the teaching
of communication skills. Detailed learning goals often are poorly articulated or implicit in course
content and this fundamental flaw in many curricula is addressed by Colthorpe et al. (2013) who
identify the need to teach and assess explicitly those concepts which are central to student
learning.

8
AIMS
These aims are to be explored within the context of undergraduate science education at
Australian research-intensive universities.
Research Question 1: What are the key elements of effective science communication to non-
scientific audiences appropriate to an undergraduate science
education?
Aims:
1A: Develop a list of the key elements of effective science communication derived from a
critique of the literature.
1B: Substantiate the list from 1A by seeking consensus and critical feedback among experts from
the fields of science, communication, education, and science communication.
Research Question 2: Are the key elements identified in Aim 1 assessed in undergraduate
communication tasks and how explicit are they?
Aims:
2A: Identify which key elements of effective science communication are explicit, implicit, or
absent in a selection of assessment tasks.
2B: Compare and contrast results of aim 2A for assessment tasks that target technical and non-
technical audiences, different year levels, and disciplines.
Research Question 3: How can explicit teaching of science communication elements be
integrated into undergraduate science degrees?
Aims:
3A: Work with science academics to design, implement, and assess activities that scaffold (i.e.
support/aid) explicitly the learning of one or more key elements (Aim 1) of science
communication in existing assessment tasks.
3B: Evaluate the activities from 3A to determine their success in teaching and learning.

9
METHODS
Ethics approval for this study was granted by the University of Queensland Behavioural &
Social Sciences Ethical Review Committee (Approval Number: 2014000655).
This research focused on assessment practices in undergraduate science courses at a subset of
Australian universities belonging to the Go8 coalition (Table 1), all of which are research-
intensive universities with similar teaching missions and cultures (Rowland 2012).
Undergraduate demographics of these universities are relatively uniform with the majority of
science students being Australian domestic students aged 17-25 years (Australian Government
Department of Industry 2013; Universities Australia 2014).
Aim 1A: Key elements of effective science communication’
Science communication is inherently interdisciplinary and a literature review was conducted
using various combinations of the following search terms accordingly: ‘science’,
‘communication’, ‘science communication’, ‘education’, ‘core competencies’, ‘key concepts’,
‘essential elements’, ‘communication skills’, ‘Australian tertiary education’, and
‘undergraduate’. A total of 99 articles from the fields of science, science communication,
communication, and education were identified as potentially useful to this study, 19 of which
contained information that was deemed specifically relevant. The 19 articles where then analysed
according to the following factors: sample size and type, methodology, analysis of results, and
justification of findings. A comprehensive list of key elements was compiled by recording any
element (element being defined as a skill, consideration, principle, or competency) cited in one
or more scholarly articles as important to effective science communication.
The comprehensive list of elements was distilled by relevance against the following criteria:
1. The number of scholarly citations – elements with five or more citations were included
automatically; elements cited only once were excluded as not representing common
themes in the literature; and elements with two to four citations were included or
excluded using criteria 2 and 3.
2. Relevance to an undergraduate science education context – based on the Teaching and
Learning Outcomes and standards for undergraduate science outlined by the Australian
Learning and Teaching Council (2011); and
10
3. Complexity – judged by what might be expected of undergraduate students with the
demographic outlined above.
Aim 1B: Obtaining feedback from experts
The resulting list from aim 1A was presented in an online survey (Appendix 1.1) to 20 experts
across Australia and New Zealand; five each from the fields of science, education,
communication, and science communication. Experts were identified based on their practical and
theoretical expertise in one of the above fields, and their familiarity with the Australian tertiary
education system. The survey contained a mix of open answer, multiple choice, and Likert scale
questions. Experts were asked first to provide their view on what concepts are central to effective
science communication (Appendix 1: Question 4), and thereafter invited to rate and comment on
the applicability and essentiality of the list of key elements. Results from the survey were used to
revise the list from aim 1A by highlighting the common themes that emerged in open response
answers using a simplified version of thematic analysis (Braun & Clarke 2006).
Aim 2A: Quantifying communication elements in undergraduate science assessment tasks
Written assessment instructions for communication-style assessment tasks in undergraduate
science courses were analysed to quantify the presence of each element of effective science
communication identified from Aim 1B. Tasks targeting communication with technical and non-
technical audiences were included in the analysis, where a technical or scientific audience was
defined as scientists from the same or similar discipline (e.g. tasks such as laboratory reports)
and a non-technical or non-scientific audience referred to non-scientists. Teaching materials
included written instructions, course profiles, assessment outlines, criteria rubrics, lecture notes,
and tutorial notes made available to students prior to completing the assessment. Verbal
instructions and supplementary documents (such as ‘suggested’ readings) were excluded from
analyses.
A total of 35 assessment tasks were analysed from four of the Go8 universities (ANU, UQ,
UniMelb, UWA). Table 2 summarizes the categories, year levels, and sample sizes of these
tasks. Suitable assessment tasks were identified using a database of existing Australian
undergraduate science assessment tasks (Stevens 2013) and teaching documents were obtained
11
by contacting by email course coordinators for all existing non-technical communication tasks (n
= 23) and for technical assessment tasks (n = 84).
Each key element (Aim 1B) was assessed per assessment task as being: ‘Explicitly present’ —
having words or phrases within the written assessment instructions which directly outline the
core aspects of that element; ‘Implicitly present’ — the element was indirectly alluded to but not
obviously stated; or ‘Not present’ — the key element was not referenced at all. The decision
process used is outlined in Appendix 1.2. In some cases elements existed only in marking criteria
provided as feedback post-assessment. These elements were recorded as implicit, even if
explicitly stated, since the provision of post-assessment feedback was not formative for the task
being assessed.
Aim 2B: Comparisons between tasks of different audiences
Statistical analyses (see Statistical Analyses, below) were run to compare and contrast
similarities and differences between the influences that the predictor variables (Table 2) had on
the explicitness of teaching in the assessment tasks.
Aim 3A: Developing and implementing novel science communication teaching activities
Science communication activities teaching communication of science to non-technical audiences
were designed and implemented in three undergraduate science courses at UQ, in consultation
with coordinating academics. The courses addressed a total of 294 students across the three
scientific disciplines of biology, physics, and chemistry. The implementation of these activities
was used to modify existing assessment tasks in each course. The following three courses and
tasks were used for the trials.
1. BIOL3000 – a third year biology course in ‘Conservation’ with 115 students, coordinated
by Dr John Dwyer. The assessment task required that students, in groups of three,
produce a 3 – 5 minute radio program that discussed multiple stakeholder perspectives on
a conservation issue.
2. PHYS3900 – a third year physics course in ‘Perspectives in Physics Research’ with 50
students, coordinated by Professor Michael Drinkwater. The assessment task required
students to explain complex physics concepts to two audiences (one scientific, one non-
scientific) in less than 70 words.
12
3. CHEM2052 – a second year chemistry course in ‘Chemical Biology’ with 129 students,
coordinated by Dr Philip Sharpe. The assessment task required students to produce three
pieces of assessment: a story pitch, a magazine article written for New Scientist, and a
short video segment for the nightly news, all based on an academic paper from the field
of chemistry.
The activities designed for each course focused on various key elements (Aim 1B) as chosen by
the course coordinators to be most relevant to the task. Template tutorial activities and aligning
teaching resources were designed to teach each of the selected elements explicitly and then
tailored to suit the specifications of each course, with regular consultation with the course
coordinators. The design of the activities was based on the best practice theories of active
learning, formative feedback, constructive alignment, and student engagement (Cook-Sather
2011; Biggs & Tang 2011; Wolf-Wendel et al. 2009; Kuh 2008; Ramsden 2003). Teaching was
delivered by Mercer-Mapstone with minimal input from the course coordinators.
Aim 3B: Evaluating and quantifying student learning
Control treatments in education research are not viable ethically, so triangulation across three
different data sources (Kember 2010) was used to evaluate student learning from the activities
designed in Aim 3A. The same data were collected for all three courses.
Student perspective
Students completed a paper-based survey at the end of each class (Appendix 1.3). Both open-
ended and Likert scale response questions were used. Students were asked about their level of
engagement with the activity (enjoyment, perceived value to future career, relevance to
assessment task), learning gains (the extent to which they felt their ability had improved), their
self-efficacy (confidence), and to identify the most important skills they learned from the activity
(one minute essay; Anderson & Burns 2013). The latter was used to determine whether the
intended explicit learning objectives for that activity were comprehended by students. These
open response answers were analysed using simplified thematic analysis (Braun & Clarke 2006).
Coded categories (Appendix 1.5) were formulated inductively (prior to analysis) and modified
deductively following a trial analysis of 30% of responses. Categories were refined until >95%
agreement was achieved in independent assessments by two researchers to guarantee their
validity and repeatability in application to remaining assessments.

13
Teaching Academics’ perspectives
Academic perceptions of student learning were recorded digitally via semi-structured interviews.
Questions for the interview (Appendix 1.4) also asked academics their perception of the
strengths and weaknesses of the activities, potential improvements, and the sustainability of
implementing the activities in subsequent years. Common themes, main points, and quotes were
extracted and transcribed for the purpose of providing supporting evidence for conclusions from
this study.
Student performance
Science communication criteria were designed to assess the intended learning outcomes for each
activity (Appendix 1.6) based on the key elements being taught explicitly. The criteria were
applied to student work upon completion of the task as a measure of student performance.
Student performance following implementation of the learning activities (2014 cohort) was to be
compared with student performance without implementation (2013 cohort) to quantify any
differences in application of communication skills.
STATISTICAL ANALYSIS
Summary statistics such as percentages, standard errors (SE), means ( ̅), and modes (Mo) were
calculated using Microsoft Excel 2007. All other statistics were calculated using the R statistical
package (R Core Team 2014).
Aim 2A & 2B: Quantifying the teaching of communication elements in Australian
undergraduate science degrees
Data for the classification of key element presence (implicit, explicit, absent) in the 35
assessment tasks were summarized by calculating percentages, standard errors, means, and
modes. A multinomial model (Venables & Ripley 2002) was built to include the response
variable (presence of communication elements as explicit, implicit, or absent within each of the
35 individual assessment tasks) and the following predictor variables: audience, year level,
major, assessment format, participation structure, and key element (levels for each variable
shown in Table 2). Only main effects were considered. Interactions amongst variables were not
analysed because those results would not have been meaningful within the context of this study.
A permutation test for association between predictors and the response variable was done as
follows. The deviance chi-square statistic was calculated for the model and observed data. The

14
data were then permuted under the null hypothesis of “no association between predictor variables
and the response” 10,000 times and a corresponding null distribution of associated chi-square
statistics derived. The value of the observed deviance chi-square statistic was then compared to
this null distribution to test for a significant association between the predictors and response
variable. The test was declared significant if the observed chi-squared value was greater than the
95th
percentile of the null distribution. A permutation test was used because many of the
categories of observed data contained fewer than five counts, which violated assumptions for the
standard large-sample chi-square test. Deviance chi-square tests were subsequently run for the
data relating to each of the 12 elements, separately, to elucidate the element-specific effects in
the model. Statistical values reported for effects of the predictor variables on individual elements
are those from the observed data. Element 12 (Table 6) was excluded because the response
variable had only one level.
Aim 3B: Evaluating and quantifying student learning gains
Responses to the 5-point Likert scale survey questions were treated as discrete and ordinal for
analysis. A conditional logit model (clm) was built to include the response variable (Likert
survey answers) and the following predictor variables (and levels): subject (biology, chemistry,
or physics), year level (two or three), and tutorial size (small: <50 students, or large >50
students). Only the main effects were explored; interactions amongst variables were not included
due to the small sample size. A likelihood ratio test was used to test for significant differences
between the clm with explanatory variables and a second clm without explanatory variables (the
null hypothesis). Aposteriori z-tests were used to explore differences between each combination
of levels for those significant variables more than two levels.
RESULTS
Aim 1A: Developing a list of ‘Key elements of effective science communication’
The majority of the 99 articles in the literature review discussed the theoretical basis of science
communication. There were no scholarly articles discussing the practicalities of implementing
science communication education in undergraduate science degrees or other levels of Australian
science training. Some did address various educational contexts in America and Europe, such as

15
for post-graduate or professional training courses in science communication (Brownell et al.
2013; Mayhew & Hall 2012; Miller et al. 2009; Tuten & Temesvari 2013; Whittington et al.
2014). Most methods used in the reviewed articles were qualitative rather than quantitative,
relying primarily on the Delphi methodology (Murry & Hammons 1995), surveys or interviews
to gauge expert opinion, or literature reviews and critiques.
Seventeen key elements of effective science communication were identified from the 19 relevant
scholarly articles derived from the literature review (Table 3). This comprehensive list was
distilled to a draft list of 10 essential elements (Table 5) against the stated assessment criteria.
Detailed descriptions of the decision making process and outcomes are outlined in Appendix 2.1.
Aim 1B: Obtaining feedback from experts
Fifteen out of the 20 invited experts participated in the survey (Table 4). Experts rated the draft
list of 10 key elements (as a whole) as ‘Extremely applicable’ (average of 4.8 out of 5) within the
context of teaching undergraduate students to communicate with non-scientific audiences. All
individual elements were rated as either mostly, highly, or absolutely essential within the context
(Table 5). Incorporating feedback from the survey of experts resulted in the list of elements
being edited and expanded from 10 to 12 elements (Table 6). Open responses generally aligned
with or reflected the list of 10 key elements when experts were asked prior to being presented
with the list of key elements to identify what they believed to be the key elements integral to
educating undergraduate science students to communicate to non-scientific audiences.
Aim 2A: Quantifying the communication elements that are explicit, implicit, or absent in
Australian science assessment tasks
Supporting materials were collected for 35 assessment tasks. Positive response rates from course
coordinators were: 79% (n = 18) for non-technical communication tasks and 20% (n = 17) from
technical tasks. There was a significant difference in how explicitly each of the 12 key elements
of effective science communication was taught across the 35 assessment tasks (Figure 1,
Permutation Test χ2
= 214.24, p = ˂ 0.0001). The majority of elements (83.33% or 10 of 12)
were absent from more than 50% of assessment tasks, with the exception of elements one and ten
(reference numbers in Table 6) which were taught explicitly in 51.43% and 94.29% of
assessment tasks respectively. The percentage of tasks that taught an element explicitly ranged

16
between 0% (element 12) and 94.3% (element 10). One task had all elements absent, 77.14% of
all assessment tasks taught less than five key elements explicitly, and 22.86% taught five or more
key elements explicitly. No task taught more than seven elements explicitly and only two of 35
tasks included this maximum number of explicit elements. Only 2 tasks (5.71%) had fewer than
five elements absent from their documentation and 65.71% of tasks had eight or more essential
elements absent from teaching materials. The percentages of tasks that taught each element
explicitly, implicitly, or not at all are shown in Figure 1.
Aim 2B: Similarities and differences in teaching of communication skills
Assessment tasks aimed at a non-scientific audience (n = 18) were significantly more explicit in
the teaching of communication elements than those assessment tasks aimed at scientific
audiences (n = 17; Permutation Test χ2
= 11.80, p < 0.01). The detailed comparisons between
these two types of assessment task for each individual element are shown in Figure 2.
There was a significant difference in how explicitly the communication elements were taught
between science majors (Permutation Test χ2
= 29.81, p = 0.045) with marine science having the
highest proportion and geography having the lowest (Figure 3). Overall, physics assessment
tasks were slightly more explicit in teaching communication elements than biology, chemistry, or
geography when majors were pooled into the four disciplines (Figure 3).
Various predictor variables significantly affected whether certain elements were taught explicitly
(Table 7). Prominent trends were that (a) communication elements in tasks aimed at non-
scientific audiences were taught more explicitly than in tasks aimed at scientific audiences, and
(b) the majority of group and multimedia tasks taught communication elements more explicitly
than individual or written or oral tasks.
Aim 3A: Developing and implementing explicit teaching of communication
Learning activities and assessment tasks
Seven activities (Table 8) were designed and implemented to support student learning of selected
key elements in the three undergraduate science courses. The three course coordinators chose
similar key elements as the focus for the activities despite differences in year level, discipline,
and assessment format: Elements One, Two, Three, and Seven (Table 6) were all selected by

17
every academic. Each course allocated different amounts of class time to the communication
activities: BIOL3000 – two x 45minute communication workshops integrated into two x 3hr
science practicals; CHEM2052 – one x 90minute communication workshop integrated into one x
3hr science practical; and PHYS3900 – eight hours across four workshops. Common features of
the learning activities were: teaching notes for lecturers to guide delivery plus handouts for
students; an engaging introductory presentation as to why science communication is important
and its relevance to students; and explicit learning objectives and their relevance to the
assignment. A mixture of oral, written, and multimedia formats was used across the activities.
Details of the activities, the elements they addressed, and lists of provided documentation are in
Table 8 with some examples of the teaching documentation provided in Appendix 2.2.
Adaptations were made to the assessment task formats and assessment instructions for all three
courses, with a new assessment task being designed and implemented specifically as a result of
this study for PHYS3900 (outlined in methods, above).
Aim 3B: Evaluating and quantifying student learning
Self-reported student perceptions
Student perceptions – learning gains
232 of the 294 students enrolled across the three courses (79%) responded to the Likert scale
survey questions. On average, across all communication skills, 94.91 ± 0.19% of students
reported improvements in their ability to carry out communication skills taught across all
subjects (Figure 5). 94.39% of students reported improvements in their confidence in
communicating science to non-scientific audiences as a result of the activities (Figure 6). Student
perceptions of improvement in their ability to “consider the social, political, or cultural context
of a scientific issue” and to “visualize data effectively” differed significantly between courses.
Students in third year biology (n = 86) reported significantly more improvement in the skill
involving context than second year chemistry students (n = 109) (LRTχ2
1 =5.529, p = 0.018).
Second year chemistry students reported significantly more improvement in their ability to
visualise data than third year physics students (n = 37, LRTχ2
1 =1 8.458, p = 0.003).
Student perception - engagement

18
Students’ enjoyment of the communication activities varied significantly among subjects
(LRTχ2
2 = 12.755, p = 0.002, Figure 6). Both second year chemistry and third year physics
students enjoyed the activities more than third year biology students (z = 3.462, p < 0.001, z =
2.073, p = 0.038 respectively). Enjoyment was also significantly different between year levels
and between tutorial sizes, with the second year students (chemistry) enjoying the activities more
than third year students (biology and physics) (LRTχ2
1 = 8.438, p = 0.004). Students in small
tutorial sizes enjoyed activities more than those in large tutorial sizes (LRTχ2
1= 10.903, p <
0.001). Students (on average) from each course placed different value on communication skills
for their intended career in science (Figure 6), with biology students rating them as very valuable
(Mo = 5/5), chemistry students as quite valuable (Mo = 4/5), and physics students as only
somewhat valuable (Mo = 3/5). Students across all courses rated the communication skills as
relevant to their assignments with very little variation (Figure 6). It should be noted, however,
that each of the above comparisons was partly confounded as a consequence of the small number
of courses involved.
Student perceptions – were the activities explicit?
188 of the total 294 students (64%) answered the open response question on the surveys. The
strongest response across all three subjects when asked to highlight the main skills they had
learned referred to aspects of ‘Target Audience’ (present in 68.09% of responses) followed by
the ability to ‘Translate complex science language into simple language for different audiences’
(40.96% of all responses). The most common skill relevant to ‘target audience’ identified in
these responses was the ability to “Recognise/identify the existence and/or the importance of
different/suitable target audiences” (28.76%). Chemistry (n = 95) and physics (n = 35) students
highlighted data visualisation and infographics in 37.9% and 20% of their responses respectively.
The use of appropriate style elements was a predominant theme for physics students, with the
ability to use analogy, metaphor, and simile being cited in 48.6%, 20%, and 20% of answers
respectively. Skills involving the ability to ‘Consider the levels of prior knowledge in the target
audience’ and ‘Separate essential from non-essential factual content’ were present in a much
higher proportion of the responses from physics students (26% and 20% for each skill
respectively) than from biology (3.4% and 0% for each skill respectively, n=58) or chemistry
students (8.4% and 3.2% for each skill respectively). The predominant skills highlighted through
these open responses aligned with the learning objectives for the respective activities (Table 8).
19
Other skills that students said they had gained from the activities included the simplification of
concepts, clarity and conciseness, problem solving and creativity, group work, the ability to
make communication interesting or engaging, and the need to communicate without bias.
Academic perceptions of student learning
All academics (n = 3) agreed that the teaching of science communication skills in the activities
was clear and explicit. Dr Sharpe (CHEM2052) noted that the approach of introducing students
to the key elements and engaging them in “developing their own conceptions” through class
discussions was effective and that the students would “probably have longer term memories of
those [communication] strategies than if it was a straight ‘infodump’”. All academics agreed that
the skills taught would be highly relevant and useful in helping students to complete the
assignment to a high standard. Prof. Drinkwater stated that he “saw it as a big improvement on
what we were doing last year. The things that made it better were that we were teaching,
practicing, and testing some specific [communication] skills”.
Academic perception – sustainability of activities
All academics stated they intended to implement the same learning activities and materials again
in future years. Dr Sharpe highlighted that “the most useful aspect [of the activities] is actually
having something compiled and ready to go that you can tweak around the edges”.
Academic perception – student engagement
All academics noted the success of using multimedia aspects during activities in stimulating
student engagement. Dr Sharpe stated that this “aspect gave students something concrete to
analyse which was good because it was less abstract and very practical”. All academics thought
that students received the activities positively and Prof. Drinkwater (PHYS3900) noted that
“most students were very enthusiastic…the number [of unenthusiastic students] was much less
than in previous years”. Dr Dwyer noted that he was expecting a higher caliber of assignments
this year relative to last year, specifically in terms of the extent of research and respect for
communication skills. Dr Sharpe and Prof. Drinkwater agreed that the icebreaker introductory
activity at the start of the first workshop was a successful approach to improving student
engagement and enthusiasm.

20
Academic perception – communication facilitating science content
Professor Drinkwater highlighted that in teaching communication he also taught science: “I was
very pleased with the idea of using specific concepts from the physics meaning that I could work
in two objectives from the course: one was to teach communication skills but the other one was
to teach core physics”. Dr Sharpe also agreed that the teaching of communication skills aided the
teaching of science skills by highlighting areas in need of improvement for student
understanding of science. He noted that in the language translation activity, when asked to
explain a chemistry concept to a non-scientific audience, students would say “Oh, I understand
the concept, I just can’t explain it” which for him, indicated that they didn’t have a fundamental
understanding of the science.
Areas for improvement included the need for smaller tutorial sizes in BIOL3000 and
CHEM2052, and either more time or better strategies for managing the larger tutorial sizes.
Quantitative student performance
Results presented here include assignments from BIOL3000 and PHYS3900 in 2014. The due
date for the CHEM2052 (2014) assignment was after the due date for this honours report.
Collection of 2013 assignments is ongoing but was unable to be completed within the honours
timeframe due to the ethics requirement of obtaining student consent. Analysis of these data will
continue and be included in future research and publications. Grades reported below are on a
scale of one to seven (one being ‘fail’ and seven being ‘outstanding’ (Appendix 1.6)).
BIOL3000 assignments for 2014 (n = 16 groups of three students) were assessed across eight of
the relevant communication criteria (Appendix 1.6) in alignment with the learning outcomes.
The average grade for all communication criteria across all assignments was 5.88 ± 0.11 or
‘Good with minor faults that need some work’. Groups scored highest for the criterion
‘Separating essential from non-essential scientific content’ ( ̅ = 6.31 or Excellent’) and least
well on ‘identifying a suitable audience’ ( ̅ = 4.06 or ‘Poor’). Grades were fairly uniform across
the other seven criteria with averages ranging from 6 – 6.31.
PHYS3900 assignments for 2014 (n = 29) were marked across four of the relevant
communication criteria (Appendix 1.6). The average grade for all communication criteria across
all assignments was 5.89 ± 0.09 or ‘Good with minor faults that need some work’. Students

21
scored highest for the criterion ‘Using language appropriate for the target audience’ ( ̅=6.25 or
‘Excellent’) and least well on ‘separating essential from non-essential scientific content’ ( ̅=5.60
or ‘Good’).
DISCUSSION
This research provides the first evidence-based approach to integrating explicit teaching of
science communication into undergraduate science degrees in Australia. This is an important
step towards enhancing the narrow and generally outdated communication skillset currently
taught in undergraduate science degrees (Stevens 2013; Colthorpe et al. 2013; Zou, 2014). The
results highlight that there is work to be done in improving the alignment between theory and
practice for teaching communication in science degrees but also provides encouraging evidence
for an efficient and effective solution. A critique of relevant literature (Aim 1) found that there
are common theoretically-derived elements for effective science communication across the fields
of science, communication, education, and science communication. These elements align closely
with the skills highlighted by expert practitioners from each of those fields as important for
successful science communication. The quantitative analysis of communication in assessment
tasks (Aim 2) revealed that most of these key communication elements were absent from the
majority of assessment instructions for communication-style learning tasks and relatively few
were taught explicitly. These results provide the first detailed evidence that Australian BSc
programs are not supporting adequately student development of the communication Threshold
Learning Outcome (TLO4) for science degrees, which recommends that science graduates be
competent in a diverse communication skillset (Jones et al. 2011). The learning activities
designed and evaluated in Aim 3 provide a successful example of an evidence based approach
that will help address the problem. Evidence shows that explicit support for student learning of
communication skills can be made with minimal time or resource commitment on behalf of the
teaching academics and result in improved learning of both communication and science within
existing assessment tasks. The results indicate that, with some tweaking and further validation,
the approach used in this study may provide a sound, empirically proven foundation from which
to develop useful templates that can be implemented readily across science courses, disciplines,
and universities.

22
The Theory and Practice of Science Communication (Aim 1)
The literature critique revealed that there has been thorough discussion and research on the
theoretical basis for ‘best practice’ in modern science communication. A predominant theme
focusses on the redefinition of science communication as an “exchange (negotiation) of
knowledge between scientists and the lay public in order to achieve a reciprocal understanding”
(van der Sanden & Meijmen 2007; Felt 2003). There are few studies, however, that articulate
clear recommendations for, or examples of, how apply this theory to train people in best practice
science communication. Miller and colleagues (2009) outlined and tested a curriculum for
training professional scientists in reflexive public engagement (which comprises many generic
communication skills) and Bray et al. (2011) conducted a study which negotiated a consensus
among experts as to which core concepts should be taught in a post-graduate science
communication course. There also are many optional science communication courses such as the
AAAS (2014) online module on communicating with the public or the European Commission’s
survival kit for science communication (Carrada 2006) which provide useful examples of
training targeted at professional scientists. These courses tend to result in the training of a self-
selected bias of scientists who seek out communication opportunities (Brownell et al. 2013a)
rather than providing fundamental education to the broad range of scientists in the context of
their tertiary studies. Those examples are useful in beginning to establish best practice for
science communication and indicating educational practices that do or don’t work, but they have
been targeted mostly at practicing professional or postgraduate audiences only. It is unclear
from previous research whether such teaching practices designed for professionals would be
transferrable to undergraduate science education. The lack of studies that directly address an
undergraduate science context highlights the need for evidence that can be used to inform the
implementation of quality education about communication for BSc students. The list of key
elements derived from the literature critique in this research provides an expert-validated starting
point from which a science communication framework could be developed.
These key elements are likely to be applicable outside of an Australian undergraduate context
due to their overall similarity with comparable resources for international postgraduate and
professional science communicators (Bray et al. 2011). Bray et al. (2011) found that “the
audience comes first in any interaction and this focus is non-negotiable” which aligns with the

23
findings of this study: the ability to identify and understand a target audience was ranked as the
most essential science communication skill by experts. Other similarities were the
acknowledgement of audience engagement, awareness of the social, political, and cultural
context, the tools of storytelling, purpose of communication, and knowledge of science
communication theories. What distinguished the lists was the level of sophistication in the skills
taught. Bray et al. (2011) took into account respect of the audience, fostering of trust between
audience and communicator, and highly specific outcomes of communication, all of which are
important but require a much more developed communicative skillset than can be expected
within an undergraduate context. So much agreement between the two separately derived
resources suggests that adopting common recommendations across multiple levels of tertiary
science education may be possible.
Three key elements have stood out as being the most central to effective science communication
as well as being most relevant to teaching science students how to communicate with non-
scientific audiences. Elements One, Two and Three (addressing audience, language, and content
respectively, Table 6) were most commonly cited in the literature and interestingly, also seen by
academics to be most relevant, which suggests a pedagogical alignment between science
communication literature and science academics. These three elements also had the highest
impact on student learning based on the results of the thematic analysis in Aim 3. It will be likely
that, when it comes to course content, lecturers of undergraduate science won’t have the time or
resources to teach all 12 key elements and so a prioritization of skills must occur. Academics can
be confident that by teaching these three elements, at a minimum, they are introducing the most
essential of science communication skills.
The critique undertaken was comprehensive across science communication, communication, and
science but could have been improved by including more education articles in order to access
some of the nuances relevant to undergraduate education. Similarly, future inclusion of non-
scholarly resources would be beneficial because science communication teaching practices often
are better established in professional training courses outside of the scholarly institution and may
offer more practical examples of effective education techniques. There may have been some bias
towards specifically journalistic principles in the communication field due to the researcher’s

24
training in tertiary journalism which influenced the initial decision-making process but the
validation from experts in a variety of fields suggests that this has not unduly biased the results.
What communication is taught in undergraduate science? (Aim 2)
There is a significant lack of explicitness and diversity in the way communication is currently
being taught to undergraduate science students, as shown by the results of Aim 2 (Figure 1). The
few similar studies that examine communication skills in science degrees (quantitative research
in this field is scarce) all provide evidence that these skills are poorly represented and
underdeveloped in BSc programs (Brownell et al. 2013a; Herok et al. 2013; Stevens 2013) .
Herok et al. (2013) found that although graduate attributes, such as communication, have been
articulated and disseminated, there has been a lack of translation into the constructive alignment
(Biggs & Tang 2011) of these graduate outcomes and educational practices. This has resulted in
a mismatch between what universities say graduates should be able to do at the end of a science
degree and the quality of the skills they actually possess (Herok et al. 2013). The low diversity of
communication elements found in assessment instructions in this study reflect the findings of
Stevens (2013) which showed that descriptions of communication-style assessment tasks mostly
focus on a very narrow range of audience, modes, and purposes. This finding is supported by
widespread complaints from journalists, industry, government and the public that scientists are
rarely equipped with the communication skills required to convey information effectively to non-
scientists (e.g., Zou, 2014; Besley & Tanner 2011; Nelkin, 1996). Significant change in current
teaching practices is required if BSc education is to produce graduates with proficiency in a
diverse range of communication skills.
The ability to identify and understand an audience is considered by some experts to be a
threshold concept in science communication (Pope-Ruark 2011) yet it was absent from almost
half of the assessment tasks analysed. Communication in tertiary science curricula often is taught
with a bias (96 per cent) towards scientific audiences (Stevens 2013). This bias might exist
because the inclusion of communication content in science courses is left mostly to the discretion
of the scientists in charge of lecturing and hence reflect their focus on traditional research and
conventional communication to other scientists (Dietz 2013; Barrie, Hughs & Smith 2009).
Lecturers at Australian research-intensive universities place a high value on teaching
communication skills as part of university courses (Stevens 2013) but this does not align with the

25
evidence showing a lack of implementation of such skills. There may be other implementation
barriers preventing lecturers from teaching communication more explicitly, such as a lack of
familiarity, confidence, or professional training in the subject — which are all major factors
limiting scientists’ willingness to engage with broader communities (Ecklund et al. 2012).
Lecturers who implement tasks aimed at non-scientific audiences are likely do so because of a
personal interest in communication as personal values are integrally involved in final decisions
about course content (Dietz 2013; Stevens 2013). These lecturers may think more deliberatively
about how to carry out science communication which could explain why key elements of
communication were more explicit in those tasks. Interest in communication or innovative
education methods also could explain the differences in response rates from course coordinators
of non-technical (79 per cent) versus technical assessment tasks (20 per cent).
Tasks that specify non-scientific audiences, using multimedia formats, and carried out in a group
structure were found to be more explicit than their alternatives (in the majority of cases, Table 7).
These results in combination with other ‘best practice’ studies give initial evidence for what
practices might promote best the explicit teaching of skills. For example, the idea that using a
multimedia approach is beneficial for student learning is rapidly gaining support with research
showing that new media in the classroom facilitates learning goals rather than distracting from
them (Wilcox 2012). This is important because science communication increasingly occurs
online (Bubela et al. 2009) and familiarity with the creation and use of multimedia will better
equip graduates with the requirements of a modern workplace. Research also indicates that
students have high motivation when completing assessment tasks that include new media skills
and are aimed at non-scientific audiences (Stevens 2013; Hoban 2007). Motivation is integral to
student learning as the more engaged students are with the content the more likely they are to
retain the skills they have learned (Kuh 2008). Academic perceptions in Aim 3 align with this as
all three lecturers commented on the usefulness and benefits of using multimedia in stimulating
student engagement.
The outliers when it came to explicitness of elements in Aim 2 are important in identifying those
areas that are in most need of improvement. Overall, Element Ten was taught explicitly in the
highest proportion of tasks because assessment tasks specify format clearly (e.g. essay,
laboratory report, web page) which aligns closely with the ‘mode’ of communication. It must be

26
considered, however, that the statement of assessment format tends to overlook the ‘how’ aspect
of communicating effectively within that format. The fact that Element Twelve was absent from
all assessment tasks is not surprising given that this element requires the most background
knowledge or research for it to be taught adequately and is rarely cited in the literature. This is an
important finding, however, as this element highlights the importance of why science
communication is necessary for scientists and is an integral part of overcoming many perception-
based implementation barriers within the student cohort, and perhaps for some teaching
academics.
There are three limitations to the interpretation provided for the analysis of assessment
instructions. The first is that judging whether a concept is implicit in instruction is difficult
because by nature an implicit concept is hard to discern. This might explain why the number of
key elements classified as ‘implicit’ in assessment tasks was much lower than for either of the
other categories. The sample size of 35 tasks also is relatively low and plans are in place to
expand the sample size. Verbal assessment instructions and supplementary documents, such as
recommended readings, were excluded from the analysis, which may mean that some nuances
and emphases for the assessment tasks were not recorded. The decision not to include these was
made because it cannot be assumed reliably that students will access them or, in the case of
verbal instructions, be able to refer back to them during completion of the task. It would be
worthwhile for future research to examine the presence of key elements in such instructions, to
explore the rates at which students use supplementary documents, and to establish the reliability
of verbal delivery in conveying this information.
A practical approach to science communication education (Aim 3)
Explicit teaching of science communication skills leads to improvements in students’ abilities to
apply those skills and increases their overall confidence in communicating science. This
conclusion is supported by the alignment of results from multiple data sources in Aim 3 and
provides support for the theory of constructive alignment as “an example of outcomes-based
education” (Biggs & Tang 2011). Constructive alignment is the process of articulating explicit
learning outcomes (for example, the specifications of TLO4) and aligning the design of teaching
activities and assessment tasks to facilitate students’ ability to achieve those outcomes (Biggs &
Tang 2011). This process was applied in Aim 3 by stating explicitly the expected learning

27
outcomes for students and aligning the design of activities, assessment tasks, and marking
criteria with those outcomes. This process appears to have facilitated students successfully
learning the specified science communication skills. The high impact of these learning activities
was evidenced by students’ ability to identify and retain understanding of these skills despite
them being embedded within a science-focused, information-intense class setting. They were
also able to apply them successfully in their assessment tasks as shown by the high scores for the
relevant marking criteria. Academics saw the value in this constructive alignment process for
improving both communication and science content relative to past years. All academics also
indicated that they would continue to teach the activities and tasks in future years, indicating that
sustainability of the implementations is likely. Sustainability is imperative to the efficacy of
these activities as ‘templates’. It suggests that these activities likely will be transferable across
research-intensive universities because student cohorts and teaching practices are fairly uniform
across the Go8 (Universities Australia 2014; Stevens 2013; Australian Government Department
of Industry 2013). The next step is to expand the sample size to establish whether these activities
continue to achieve their learning goals in a larger number of courses, across all year levels, and
between institutions. This will also be important in separating the effects of year level, subject,
and tutorial size without the partial confounding of those factors which was a limitation of this
study.
Results suggest the trialed science communication activities are transferrable across science
disciplines and year levels. The fact there were no significant differences in learning gains for six
of the eight skills taught across courses indicates that teaching and learning generally were
uniform for those skills. This supports development of these activities as ‘templates’ that can be
adapted by academics to suit individual courses. This uniformity also could have been a result of
the same person delivering the teaching and further research will be required to separate these
factors. There were two exceptions to this consistency: the significant differences in learning
gains between courses that taught data visualization and social, political, and cultural context.
These differences could be explained by variances in student cohorts or differences in teaching
time, but are likely due to the relevance of those skills to the corresponding assessment tasks.
Data trends indicate that students found skills that were going to be assessed to be more explicit
than those that were not assessed, suggesting that students focussed selectively on assessable
skills and hence the teaching of those skills had a higher impact. This is shown in both instances

28
with significant differences in learning gains: chemistry students reported significantly higher
learning gains than physics in their ability to visualize data and data visualization was assessed in
the chemistry but not the physics course. Likewise, biology students reported significantly higher
learning gains than chemistry in their ability to consider the social, political, or cultural context
of a scientific issue, which was assessed in biology but not in chemistry. Thematic analysis
results also reflected this trend with assessable skills having higher impact and retention in the
corresponding courses. These results support the large body of evidence that suggests assessment
is central to the quality of learning outcomes in higher education and is critical to optimal student
learning and retention (Biggs & Tang 2011; Morgan et al. 2005; Harden & Crosby 2000; Crooks
1998). It also indicates that academics should to assess the science communication skills taught
for optimal outcomes in future implementations. This could be done using a modified version of
the science communication criteria developed in Aim 3 (Appendix 1.6).
Initial results from student performance on communication criteria are positive and indicate that
on average all criteria were fulfilled to ‘Good’ or ‘Excellent’ standard in 2014 assessment tasks.
The exception was that biology students generally completed the identification of a target
audience poorly (Criteria 1, Appendix 1.6). This could be because students did not receive
marking criteria until after completing the task (physics and chemistry received them at the start
of the task), or because the assessment outline did not state the expectations sufficiently clearly.
Education research shows that providing criteria prior to assessment clarifies students’
expectations and helps to standardise the quality of student work and consistency in marking
(Saunders & Davis 2014; Brown et al. 1995; McDonald & Sansom 1979). It is important to note
that the collection of these data is ongoing. The data presented here are representative only of
2014 assessments from biology and physics. Analysis of tasks completed prior to the
implementation of science communication teaching (i.e., in 2013) will help confirm whether the
high standard of communication skills in 2014 are due to the learning activities or simply
attributes of the student cohort. It will also have implications for areas in need of adaptation for
the expansion of this study in the future.
Areas highlighted as having room for improvement were the structure of the activities in needing
more time and depth, and needing smaller tutorial sizes. Initial support for more teaching time is
offered by results of the thematic analysis that indicate certain skills had a much higher impact

29
on physics students than those in biology or chemistry. This could be attributed to the fact that
physics classes received three to four times more teaching hours or because they were given the
opportunity for formative feedback on assessment. Formative feedback allows students to
increase knowledge, understanding, or skills and improve their learning prior to evaluation and
has been shown to facilitate improved learning gains and learning strategies (Shute 2008). The
use of formative feedback in the physics workshops could explain the higher impact and
retention of skills in physics students. The need for smaller tutorial sizes was highlighted by both
students and academics. Communication lends itself to a discursive teaching format which is
much harder to deliver in-depth in large classes. This was indicated by the fact that smaller
tutorial sizes enjoyed the activities significantly more than large tutorials, although this factor
was confounded partially with subject and should be used as an indication for further research
only. It is the recommendation of this study that tutorial sizes of 30 or less would be ideal for
these activities. This limitation on class size is supported by Bandiera et al. (2010) who found
that tertiary student achievement decreased as class size increased in the UK, indicating that
smaller classes optimize student learning. It would be worthwhile investigating whether the
standard of learning would improve further should these changes be made in future years.
This study found evidence that aligned with a growing body of research suggesting that teaching
communication in science courses facilitates the learning of technical science rather than
distracting from it. This finding was supported by multiple data sources such as student
performance measures on science criteria, and student and academic feedback noting the
learning of subject-specific science content through the communication activities. This finding
aligns with a similar study at Stanford University (Brownell et al. 2013) that found that the
teaching of communication to non-scientific audiences in a neuroscience course significantly
improved understanding of original scientific literature, aided students’ critical analyses, as well
as improving communication skills. Similar results from Australian studies say that
communication assessment tasks in science degrees “led to learning gains in quantitative
reasoning skills”, interpretation of scientific results, and learning of core science competencies
(Kuchel et al. 2014; Stevens 2013). These combined results provide solid evidence to support the
idea that assessment tasks which ask students to convey scientific information to non-scientific
audiences lead to significant improvements in both science knowledge and communication
skillsets.

30
CONCLUSIONS AND FUTURE RESEARCH
This study applied an evidence-based approach to explore ways to improve the teaching of non-
technical communication skills to undergraduate science students at Australian research-
intensive universities. The list of ‘Key Elements of Effective Science Communication’ is the first
such set of guidelines to be developed specifically for an undergraduate context. The list of
elements provides a useful start to the development of a broader communication framework for
Australian undergraduate science degrees. The analysis of what (and how) communication skills
are taught currently in science degrees provides direction as to where and how improvements are
needed. The provision of tested and validated science communication template activities and
marking rubrics that can be adapted to specific courses is a promising approach to overcoming
the commonly cited implementation barrier of time-poor staff, lack of resources, and skill-
specific knowledge. Templates also ensure that the communication skills being taught are
explicit and relevant to students, and successful in achieving the intended learning outcomes.
The learning activities designed for this project represent a starting point for this endeavour.
Important directions in future research include the expansion of the list of key elements into a
detailed framework that considers a wider range of audiences, modes, and purposes for the
teaching of communication in Australian science degrees. Expansion of the sample size of
assessment tasks in Aim 2 to include more disciplines, year levels, and universities (Australian
and international) would help define the extent and nature of what improvements are needed to
achieve educational standards such as TLO4 (Communication). Finally, the dissemination and
implementation of the key elements and the learning activities in a wider range of universities
around Australia, as well as the development and implementation of relevant assessment tasks to
assess those skills, would increase the scope and applicability of this research.
ACKNOWLEDGEMENTS
First and foremost I would like to express my deep gratitude for the commitment, support, and
generosity shown by my supervisor, Dr Louise Kuchel, in guiding me through my honours
project. This year would also not have been possible (or as enjoyable) without my colleagues and
friends, Sarah Stevens and Bianca Zou, who were always around to offer advice and a laugh.
Special acknowledgment must go to Dr Simon Blomberg whose statistical knowledge and advice
saved me numerous hours of stress and frustration; and to the collaborative efforts of Dr John

31
Dwyer, Professor Michael Drinkwater, and Dr Philip Sharpe. Thanks also to the unwavering
support of my parents, Dr Gina Mercer and Dr Bruce Mapstone, and to all of my friends who
have ridden the highs and lows with me for every step of the way this year.
REFERENCES
AAAS (American Association for the Advancement of Science). (2009). Cultivating biological
literacy. In: Vision and change in undergraduate biology: A call to action (eds. Brewer,
C.A., and Smith, D.). Washington DC, pp. 10-19.
AAAS (American Association for the Advancement of Science). (2014). Communicating
Science: Tools for Scientists and Engineers. Available at:
[http://www.aaas.org/communicatingscience]. Last accessed: 9 October 2014.
Anderson, D. & Burns, S. (2013). One-minute paper: student perception of learning gains. Coll.
Stud. J. 47:1, 219-227.
Australian Government Department of Industry (2013). Higher Education Statistics. Available
at:
[http://www.innovation.gov.au/highereducation/HigherEducationStatistics/Pages/default.
aspx]. Last accessed 14 March 2014.
Bandiera, O., Larcinese, V. & Rasul, I. (2010). Heterogeneous Class Size Effects: New Evidence
from a Panel of University Students. Econ. J. 120:549, 1365-1398.
Baram-Tsabari, A. & Lewenstein, B.V. (2013). An Instrument for Assessing Scientists’ Written
Skills in Public Communication of Science. Sci. Commun., 35, 56-85.
Barrie, S, Hughes, C, Smith, C & Thomson, K. (2009). Key issues to consider in the renewal of
learning and teaching experiences to foster Graduate Attributes. Available at:
[http://www.itl.usyd.edu.au/projects/nationalgap/resources/GAPpdfs/NationalGAP_issue
s_Papers.pdf]. Last Accessed 19 September 2014.
Besley, J.C. & Tanner, A.H. (2011). What Science Communication Scholars Think About
Training Scientists to Communicate. Sci. Comm., 33, 239-263.
Biggs, J. & Tang, C. (2011). Teaching for Quality Learning at University. Open University
Press, Buckingham. Available at
32
[http://udprism01.ucd.ie/TalisPrism/doOpenURLSearch.do?sid=Talis:prod_talis&pid=Ke
y%3A1400700%3BArtifactType%3AMarc21S]. Last accessed: 14 October 2014.
Braun, V. & Clarke, V. (2006). Using thematic analysis in psychology. Qual. Res. Psychol., 3:2,
77-101.
Bray, B., France, B. & Gilbert, J.K. (2011). Identifying the essential elements of effective
science communication: What do the experts say? Int. J. Sci. Educ., Part B, 2, 23-41.
Brown, S., Race, P. & Rust, C. (1995). Using and experiencing assessment. Assessment for
Learning in Higher Education, Kogan-Page, London.
Brownell, S.E., Price, J.V. & Steinman, L. (2013). A writing-intensive course improves biology
undergraduates' perception and confidence of their abilities to read scientific literature
and communicate science. Adv. Physiol. Educ., 37, 70-79.
Brownell, S.E., Price, J.V. & Steinman, L. (2013a). Science Communication to the General
Public: Why We Need to Teach Undergraduate and Graduate Students this Skill as Part
of Their Formal Scientific Training. J Undergrad Neurosci Educ. 12:1, e6-10.
Bubela, T., Nisbet, M.C., Borchelt, R., Brunger, F., Critchley, C., Einsiedel, E., Geller, G.,
Gupta, A., Hampel, J., Hyde-lay, R., Jandciu, E.W., Jones, S.A., Kolopack, P., Lane, S.,
Lougheed, T., Nerlich, B., Ogbogu, U., O'riordan, K., Ouellette, C., Spear, M., Strauss,
S., Thavaratnam, T., Willemse, L. & Caulfield, T. (2009). Science communication
reconsidered. Nature Biotechn. 27:6, 514-518.
Bucchi, M. (2013). Style in science communication. Public Underst. Sci., 22, 904-915.
Carrada. G. (2006). A scientist’s survival kit: communicating science. Available at:
[http://ec.europa.eu/research/science-society/pdf/communicating-science_en.pdf]. Last
accessed: 9 October 2014.
Colthorpe, K., Rowland, S. & Leach, J. (2013). Good Practice Guide (Science) Threshold
Learning Outcome 4: Communication. Available at:
[http://www.acds.edu.au/tlcentre/wp-content/uploads/2013/12/Science-Good-Practice-
Guide-2013-TLO4.pdf]. Last accessed: 12 June 2014.

33
Cook-Sather, A. (2011). Lessons in Higher Education: Five Pedagogical Practices that Promote
Active Learning for Faculty and Students. J. Faculty Develop., 25:3, 33-39.
Crooks T. (1998). The impact of classroom evaluation practices on students. Assess. Educ. 5,
131–7.
Dietz, T. (2013). Bridging values and deliberation to science communication. PNAS, 110, 14081-
14087.
Ecklund, E., James, S. & Lincoln, A. (2012). How Academic Biologists and Physicists View
Science Outreach., PLoS ONE. 7:5, e36240.
Eisenberg, A. (1984). Effective writing in science. TrAC-Trend. Anal. Chem., 3, IV-VI.
Felt, U. (2003). Why Should the Public ‘Understand’ Science? A Historical Perspective on
Aspects of the Public Understanding of Science in Between Understanding and Trust:
The Public, Science and Technology, Routledge, London, UK. pp. 7–39.
Fischhoff, B. (2013). The sciences of science communication. P. Natl. Acad. Sci., 110, 14033-
14039.
Fog, K., Budtz, C., Munch, P. & Blanchette, S. (2010). Storytelling: Branding in Practice.
Springer Berlin Heidelberg, Frederiksberg, Denmark.
Gray, F.E., Emerson, L. & MacKay, B. (2005). Meeting the Demands of the Workplace: Science
Students and Written Skills. J. Sci. Educ. Technol., 14, 425-435.
Green, J. & Britten, N. (1998) Qualitative research and evidence based medicine. Brit. Med. J.
7139, 1230-1232.
Greenwood M. & Riordan D. (2001) Civic scientist/Civic Duty. Sci. Commun. 23, 28-40.
Group of Eight Australia (2014). Students. Available at: [http://www.go8.edu.au/students] Last
Accessed 19 March 2014.
Harden RM. & Crosby JR. (2000). AMEE education guide no. 20: The good teacher is more than
a lecturer – the twelve roles of the teacher. Med. Teach. 22, 334–47.
Hassoi, S. (2008). Improving How Scientists Communicate About Climate Change. Eos, 89,
106-107.

34
Herok, G., Chuck, J. & Millar, T. (2013). Teaching and evaluating graduate attributes in Science
Based Disciplines. Creative Educ. 4:7, 42-49.
Hoban, G. (2007). Using slowmation to engage preservice elementary teachers in understanding
science content knowledge. Contemp. Issues Tech. Teacher Educ. 7:2, 1-9.
Jones, S., Yates, B. & Kelder, J.-A. (2011). Learning and Teaching Academic Standards Project:
Science Learning and Teaching Academic Standards Statement. Available at:
[http://www.olt.gov.au/system/files/altc_standards_SCIENCE_240811_v3.pdf]. Last
accessed: 5 May 2014.
Kember, D. (2003). To Control or Not to Control: The question of whether experimental designs
are appropriate for evaluating teaching innovations in higher education. Assess. Eval.
Higher Educ., 28:1, 89-101.
Kuchel, L., Wilson, R., Stevens, S. & Cokley J. (2014, in press). A documentary video
assignment to enhance learning in large first-year science classes. Int. J. Innov. Sci. Math.
Educ.
Kuh, G.D. (2008). Why Integration and Engagement are Essential to Effective Educational
Practice in the Twenty-first Century. Peer Review, 10, 27-28.
Kulgemeyer, C. & Schecker, H. (2013). Students Explaining Science—Assessment of Science
Communication Competence. Res. Sci. Educ., 43, 2235-2256.
Leshner A. (2003). Public engagement with science. Science. 299, 977.
Manzini, S. (2003). Effective Communication of Science in a Culturally Diverse Society. Sci.
Commun., 25, 191-197.
Mayhew, M.A. & Hall, M.K. (2012). Science Communication in a Café Scientifique for High
School Teens. Sci. Commun., 34, 546-554.
McDonald, R. & Sansom, D. (1979). Uses of assignment attachments in assessment. Assess.
High. Educ. 5:1, 45-55.
McInnis, C., Hartley, R. & Anderson, M. (2000). What Did You Do with Your Science Degree?
A National Study of Employment Outcomes for Science Degree Holders 1990-2000.
University of Melbourne Centre for the Study of Higher Education. Available at:

35
[https://cshe.unimelb.edu.au/research/disciplines/docs/ScienceR.pdf]. Last accessed: 14
October 2014.
Metcalfe, J. & Gascoigne, T. (1995). Science Journalism in Australia. Public Underst. Sci., 4,
411-428.
Miller, S., Fahy, D. & Team, T.E. (2009). Can Science Communication Workshops Train
Scientists for Reflexive Public Engagement?: The ESConet Experience. Sci. Commun.,
31, 116-126.
Morgan, M. K., Clarke, R., Weidmann, M., Laidlaw, J. & Law, A. (2007). How assessment
drives learning in neurosurgical higher training. J. Clinic. Neurosci. 14:4, 349-354.
Mulder, H.A.J., Longnecker, N. & Davis, L.S. (2008). The State of Science Communication
Programs at Universities Around the World. Sci. Comm., 30, 277-287.
Murry, J.W., & Hammons, J.O. (1995). Delphi—a versatile methodology for conducting
qualitative research. Review of Higher Educ., 18:4, 423–436.
Polman, J., Newman, A., Farrar, C. & Saul, E.W. (2012). Science Journalism: Students learn
lifelong science literacy skills by reporting the news. Sci. Teach. 79, 44-47.
Pope-Ruark, R. (2011). Know Thy Audience: Helping Students Engage a Threshold Concept
Using Audience-Based Pedagogy. Int. J. Schol. Teach. Learn. 5:1, 6.
R Core Team (2014). R: A language and environment for statistical computing. Available at
[http://www.R-project.org/]. Last accessed 10 August 2014.
Ramsden, P. (2003). Learning to Teach in Higher Education. Taylor and Francis, Hoboken.
Rowland, S.L. (2012). Biochemistry, Molecular Biology, and the Changing Tertiary Education
Landscape in Australia. Biochem. Mol. Biol. Educ., 40, 24-28.
Ryan, M. (2004). Narrative across media: the languages of storytelling. University of Nebraska
Press, Lincoln, USA.
Ryder, J. (2001). Indentifying science understanding for functional scientific literacy. Stud. Sci.
Educ., 36, 1-44.

36
Saunders, K. & Davis, S. (1998). The use of assessment criteria to ensure consistency of
marking: some implications for good practice. Qual. Assur. Educ. 6:3, 162-171.
Sevian, H. & Gonsalves, L. (2008). Analysing how scientists explain their research: A rubric for
measuring the effectiveness of scientific explanations. Int. J. Sci. Educ., 30, 1441-1467.
Shute, V. (2008). Focus on Formative Feedback. Rev. Educ, Research. 78:1, 153-189.
Somerville R. & Hassol SJ. (2011). Communicating the science of climate change. Phys Today.
64, 48-53.
Stevens, S. (2013). What communication skills are taught in Australian science degrees and what
else do students learn from "communication to non-scientists" tasks? Honours thesis.
School of Biological Sciences, University of Queensland, Australia.
Tuten, H. & Temesvari, L. (2013). Popular science journalism: facilitating learning through peer
review and communication of science news. J. Coll. Sci. Teach., 42, 46-49.
van der Sanden, M. C. A. & Meijman F. J. (2008). Dialogue guides awareness and understanding
of science: an essay on different goals of dialogue leading to different science
communication approaches. Public Underst. Sci., 17:1, 89-103.
van der Sanden, M.C.A. & Meijman, F.J. (2012). A step-by-step approach for science
communication practitioners: a design perspective. J. Sci. Commun., 11.
Venables, W. N. & Ripley, B. D. (2002). Modern Applied Statistics with S-Plus. Fourth Edition.
Springer, New York, USA.
Whittington, C.P., Pellock, S.J., Cunningham, R.L. & Cox, J.R. (2014). Combining content and
concepts of communication into an upper-level biochemistry course. Biochem. Mol. Biol.
Educ., 42, 136-141.
Wilcox, C. (2012). Guest Editorial It's Time To e-Volve: Taking Responsibility for Science
Communication in a Digital Age. Biol. Bull., 222:2, 85-87.
Zou, B. (2014). Teaching Communication for Science Engagement with Non-scientists in
Tertiary Science Education: Student, Lecturer and Employer Beliefs. Honours thesis.
School of Agriculture and Food Science, University of Queensland, Australia.

37
TABLES
Table 1. Names of Australian Go8 universities included in this study and their abbreviations
Institution Abbreviation
Australian National University ANU
The University of Queensland UQ
The University of Melbourne UniMelb
The University of Western Australia UWA

38
Table 2. Variables used in the analysis of assessment tasks (Aim 2). A total of 35 assessment
tasks were examined..
Category (Predictor
variable) Sub-category
Number of assessment tasks
represented in each category
Audience Non-scientific 18
Scientific 17
University (not included in
statistical analyses)
UQ 20
UWA 2
UniMelb 2
ANU 11
Major Biology 9
Ecology 5
Marine Biology 1
Mathematics and Statistics 1
Chemistry 4
Physics 2
Biochemistry 1
Genetics 2
Geography 10
Discipline (not included in
statistical analyses)
Biology 17
Chemistry 6
Physics 3
Geography 10
Format Multimedia 8
Oral 4
Written 23
Participant Structure Group 11
Individual 24
Undergraduate Year Level First year 4
Second Year 11
Third Year 20

39
Table 3. The comprehensive list of 17 key elements of effective science communication derived from the literature (Aim 1A) in order
from most to least citations. Elements excluded from the refined list of 10 are indicated by the presence of a reason for exclusion.
Essential element of effective
science communication Academic Source(s)
Number of
sources cited
Reason element was excluded
from initial list
Identify/consider a suitable
target audience
Bray et al. (2011); Colthorpe et al. (2013); AAAS (2009);
Miller et al. (2009); van der Sanden and Meijman (2012);
Whittington et al. (2014); Mayhew and Hall (2012);
Kulgemeyer and Schecker (2013); Brownell et al. (2013);
Tuten and Temesvari (2013); Manzini (2003); Eisenberg
(1984); Hassoi (2008)
13
Use language that is appropriate
for the target audience - e.g.
consider what jargon to use or
explain
Baram-Tsabari and Lewenstein (2013); Colthorpe et al.
(2013); Sevian and Gonsalves (2008); Mayhew and Hall
(2012); Kulgemeyer and Schecker (2013); Brownell et al.
(2013); Manzini (2003); Hassoi (2008)
8
Use (factual) content that is
appropriate, interesting, and
relevant to the target audience
Bray et al. (2011); Baram-Tsabari and Lewenstein (2013);
Colthorpe et al. (2013); van der Sanden and Meijman
(2012); Whittington et al. (2014); Kulgemeyer and
Schecker (2013)
6
Consider the social, political, and
cultural context of the
communication
Bray et al. (2011); AAAS (2009); Sevian and Gonsalves
(2008); Miller et al. (2009); Polman et al. (2012); Tuten
and Temesvari (2013); Manzini (2003)
7
Promote audience engagement
with the scientific content
Baram-Tsabari and Lewenstein (2013); Bray et al. (2011);
Colthorpe et al. (2013); Sevian and Gonsalves (2008);
Mayhew and Hall (2012)
5
Use style elements such as
humour, anecdotes, metaphors,
imagery, etc.
Baram-Tsabari and Lewenstein (2013); Bray et al. (2011);
Colthorpe et al. (2013); Sevian and Gonsalves (2008);
Bucchi (2013); Eisenberg (1984); Hassoi (2008)
7

40
Essential element of effective
science communication Academic Source(s)
Number of
sources cited
Reason element was excluded
from initial list
Consider the levels of prior
knowledge in your target
audience
Baram-Tsabari and Lewenstein (2013); Fischhoff (2013);
Sevian and Gonsalves (2008); Mayhew and Hall (2012);
Kulgemeyer and Schecker (2013)
5
Communicate organised ideas
and concepts using clarity,
accuracy, and logic
Gray et al. (2005); Sevian and Gonsalves (2008); Brownell
et al. (2013); Eisenberg (1984)
4 This element is important to
communication in general and
was not specific enough to
science communication for
inclusion on the final list. It also
usually is included in other
criteria of education
assessment.
Use the tools of storytelling to
create a coherent narrative
Bray et al. (2011); Baram-Tsabari and Lewenstein (2013);
Mayhew and Hall (2012)
3
Identify the
purpose/goal/objective of the
communication
Colthorpe et al. (2013); Miller et al. (2009); van der
Sanden and Meijman (2012)
3
Consider aesthetic components
to promote the visual appeal of
the communication
Gray et al. (2005); Sevian and Gonsalves (2008);
Whittington et al. (2014)
3 This is a skill that is specific to
certain categories of
communication (e.g. web
design) rather than a generic or
widely applicable skill of
science communication.
Use a suitable mode of
communication
Colthorpe et al. (2013); Kulgemeyer and Schecker (2013) 2

41
Essential element of effective
science communication Academic Source(s)
Number of
sources cited
Reason element was excluded
from initial list
Present the information within a
relatable context
Kulgemeyer and Schecker (2013); Polman et al. (2012) 2
Use correct grammar,
punctuation, and spelling
Gray et al. (2005) 1 This element is important to
communication in general and
was not specific enough to
science communication for
inclusion on the final list. It also
commonly is categorised as a
skill for primary and secondary
rather than tertiary education.
Use a suitable platform for
dissemination
Colthorpe et al. (2013) 1 The term ‘platform’ holds more
weight in a journalism context
but the connotations are better
expressed in combination with
‘mode’ rather than separately
for undergraduate science.
Consideration of potential
misconceptions as a result of the
communication
van der Sanden and Meijman (2012) 1 Better categorised under more
specific courses such as
environmental management
rather than as a generic science
communication element.
Evaluate the adequacy of the
communication
(Fischhoff (2013)) 1 This requires a more developed
self-evaluative skillset that is
considered too advanced for an
undergraduate demographic.

42
Table 4. Identities of experts who participated in the validation survey that generated the final
list of essential elements (Aim 1B). The indicated fields of expertise are self-reported. Those
experts who did not wish to be identified by name are listed as ‘anonymous’.
Respondent (Institution) Field of expertise
Science Education
Science
Communication Communication Other
Doctor Lindy Orthia (ANU)
Doctor William Rifkin (UQ) Sociology
Doctor Rod Lamberts (ANU)
Doctor Sean Perera (ANU)
Professor Susan Stocklmayer
(ANU)
Associate Professor Nancy
Longnecker (UWA)
Associate Professor Roslyn
Gleadow (Monash)
Donna Meiklejohn (QUT)
Brad Turner (UQ)
Associate Professor John
Cokley (Swinburne)
Journalism
Anonymous 1
Anonymous 2
Anonymous 3
Anonymous 4
Anonymous 5 History &
Philosophy
of Science

43
Table 5: Average rankings from most to least essential of the ten key elements within the context
of undergraduate science tertiary education in Australia. Elements were ranked by 15 experts
across the fields of science, communication, education, and science communication and are
based on a seven-point Likert scale ranging from 0 as ‘Not at all essential’ to 7 as ‘Absolutely
essential’.
Rank Key elements of effective science communication
Average rating
of essentiality
1 Use language that is appropriate for your target audience 6.80
2 Identify the purpose and intended outcome of the communication 6.53
3 Present the scientific information in an engaging context 6.47
4 Consider the levels of prior knowledge in the target audience 6.33
5 Identify a suitable target audience 6.27
6 Use a suitable mode and platform to communicate 6.27
7 Use the tools of storytelling and narrative 6.13
8 Consider the social, political, and cultural context of the science being
communicated
6.07
9 Use style elements such as humour, anecdotes, metaphors, and imagery 6.00
10 Include factual content that is relevant to the target audience's
understanding of the science
5.87

44
Table 6. The final list of key elements of effective science communication in an undergraduate
science context. Changes and additions made in response to feedback from experts (Table 4) are
in bold. Elements are referenced by number in the results section and other figures.
Reference
number
Key elements of effective science communication
1 Identify and understand a suitable target audience
2 Use language that is appropriate for your target audience
3 Separate essential from non-essential factual content in a context that is
relevant to the target audience
4 Consider the social, political, and cultural context of the scientific information
5 Promote audience engagement with the science
6 Use/consider style elements appropriate for the mode of communication (such as
humour, anecdotes, analogy, metaphors, rhetoric, images, body language, eye
contact, and diagrams)
7 Consider the levels of prior knowledge in the target audience
8 Use the tools of storytelling and narrative
9 Identify the purpose and intended outcome of the communication
10 Use a suitable mode and platform to communicate with the target audience
11 Encourage a two-way dialogue with the audience
12 Understand the underlying theories leading to the development of science
communication and why it is important

45
Table 7. Significant effects of predictor variables on how explicitly certain key elements were taught across the 35 assessment tasks as
determined by deviance chi-square tests (Aim 2B). The symbols > & < are used below to indicate more or less explicit teaching of a
task respectively.
Key Element Predictor variables that
had a significant effect
Statistical values Direction of the effect
Identify and understand a
suitable target audience
Audience LRT χ2
2 = 6.24, p = 0.044 Non-scientific audiences > scientific
audiences
Year level LRT χ2
4= 19.94, p = 0.001 Third year courses > first year > second year
Use language that is
appropriate for your target
audience
Participation structure LRT χ2
2 = 8.12, p = 0.017 Individual tasks > group tasks
Separate essential from non-
essential factual content in a
context that is relevant to the
target audience
Audience LRT χ2
2 = 7.53, p = 0.023 Non-scientific audiences > scientific
audiences
Format LRT χ2
4 = 13.66, p = 0.008 Multimedia > written > oral.
Participation structure LRT χ2
2 = 9.77, p = 0.007 Group tasks > individual tasks
Promote audience engagement
with the science
Year level LRT χ2
4 = 18.67, p < 0.001 First year > second year > third year
Participation structure LRT χ2
2 = 6.59, p = 0.037 Group tasks > individual tasks
Use/consider style elements
appropriate for the mode of
communication
Format LRT χ2
4 = 9.97, p = 0.040 Multimedia > written > oral.
Identify the purpose and
intended outcome of the
communication
Audience LRT χ2
1 = 7.84, p = 0.005 Non-scientific audiences > scientific
audiences
Year level LRT χ2
2 = 7.84, p < 0.001 Second year > first year > third year
Format LRT χ2
2 = 10.72, p = 0.004 Oral > written > multimedia
Use a suitable mode and
platform to communicate with
the target audience
Audience
LRT χ2
1 = 7.74, p = 0.005 Non-scientific audiences > scientific
audiences

46
Table 8. Description and details of the seven learning activities designed and implemented to support explicit teaching of
communication (Aim 3A).
Description of task and purpose
Activity Name: Language and Jargon translation
Duration (minutes): 30
Key Elements Taught: Consider a target audience (Element One)
Use language that is appropriate for your target audience (Element Two)
Separate essential from non-essential factual content in a context that is relevant to the target audience
(Element Three)
Course: BIOL3000, PHYS3900, CHEM2052
Teaching Documents: Teaching notes for delivery, Student handout
Format: Written
Description: This activity guided students through an easily-applied, step-by-step process for translating complex scientific language
into language that was understandable and accessible for different, non-scientific target audiences. Students work through one
example as a class and then practiced this by taking complex science definitions and translating them for pre-specified audiences on a
worksheet in pairs. This activity allows course coordinators to teach/include scientific content that is relevant to their courses as well
as equipping students with a skill that will be applicable in many situations throughout their degree and career.
Activity Name: Effective Data Visualisation Through Infographics
Duration (minutes): 20
Key Elements Taught: Use language that is appropriate for your target audience (Element Two)
Separate essential from non-essential factual content in a context that is relevant to the target audience
(Element Three)
Create/use style elements (diagrams) appropriate for the mode of communication (Element Six)
Course: CHEM2052, PHYS3900
Teaching Documents: Teaching notes for delivery, Student handout
Format: Multimedia, Written
Description: This activity started with a class analysis of two diagrams: one the original table from the scientific literature, and the
other an infographic visualisation of that data. Students worked as a class to create a list of what makes an engaging infographic and
to decide what to do and what not to do when visualizing data for a non-scientific audience. Students were then presented with a data

47
set and asked to work in groups of four to draw their own infographic which visualised the given data in the most effective way on a
sheet of butcher’s paper. Prizes were given for the best infographics. This activity gets students to actively engage in the process of
data visualisation rather than just being told outright, and teaches students to synthesize data sets and to apply some of the basic skills
of effective science communication. This activity also worked well as a class ‘icebreaker’.
Activity Name: Communicating with Style: Analogy, Metaphor, and Simile
Duration (minutes): 30
Key Elements Taught: Consider a target audience (Element One)
Use language that is appropriate for your target audience (Element Two)
Separate essential from non-essential factual content in a context that is relevant to the target audience
(Element Three)
Create/use style elements (analogy, metaphor, and simile) appropriate for the mode of communication
(Element Six)
Consider levels of prior scientific knowledge in the target audience (Element Seven)
Course: PHYS3900
Teaching Documents: Teaching notes for delivery, Student handout
Format: Oral, Written
Description: This activity started with an introduction to analogy, metaphor, and simile: explaining how they are used, their strengths
and weaknesses, and why they are useful for science communication. Students were then given three complex scientific concepts and
asked to explain each concept to three different, pre-specified, non-scientific audiences using an analogy, metaphor, or simile that
simplified the explanation and made the science accessible to the target audience.
Activity Name: Stakeholder Analysis
Duration (minutes): 30
Key Elements Taught: Consider the social, political, and cultural context of the scientific information (Element Four)
Course: BIOL3000
Teaching Documents: Take-home student worksheet
Format: Written
Description: This activity was given as a take home worksheet as part of BIOL3000. Students were asked to identify all the potential
invested stakeholders in a conservation issue in regards to cultural, political, economic, and social investment and then to identify and
analyse the three main stakeholders in regards to how and why they might be invested in the issue. This activity allowed students to
consider all aspects of a conservation issue alongside the science involved in the topic.

48
Activity Name: Science Communication Speed Dating
Duration (minutes): 15
Key Elements Taught: Consider a target audience (Element One)
Use language that is appropriate for your target audience (Element Two)
Separate essential from non-essential factual content in a context that is relevant to the target audience
(Element Three)
Course: PHYS3900
Teaching Documents: Teaching notes for delivery
Format: Oral
Description: This activity was used as an ‘icebreaker’ at the start of the course and as an introduction to science communication.
Students were asked to pair up and over four rounds were given four science concepts to explain verbally to their respective partners
who enacted being a specified non-scientific target audience. Each round lasted two minutes and then the roles reversed in the pairs so
that each had a chance to do the explaining. At the end of the speed dating round there was a class discussion about what the most
important considerations were in regards to communicating science to non-scientific audiences which meant students were actively
engaged in the learning rather than just receiving the information outright. The activity made students communicate science and then
allowed them to analyse the results of this interaction, as well as getting them to recall scientific information. It was a good way to
warm up the class in the first tutorial and helped students to realise that science communication is perhaps not as easy as some might
think. This helped reinforce the importance of learning these communication skills.
Activity Name: Target Audience Analysis: Radio
Duration (minutes): 25
Key Elements Taught: Identify a suitable target audience (Element One)
Identify the purpose and intended outcome of the communication (Element Nine)
Consider the social, political, and cultural context of the scientific information (Element Four)
Course: BIOL3000
Teaching Documents: Teaching notes for delivery, Student handout, Radio segment
Format: Multimedia, written
Description: Students were asked to listen to a five-minute radio segment on a controversial conservation issue and then form groups
to analyse: the main messages; the potential interested audiences; the main invested stakeholders in the issue with regards to culture,
economy, politics, and social groups; the opposing arguments in the segment; and the purpose and outcome of the segment. These
were then summarised in groups and presented to the class for discussion.

49
Activity Name: Target Audience Analysis: Video
Duration (minutes): 20
Key Elements Taught: Identify and understand a suitable target audience (Element One)
Consider the social, political, and cultural context of the scientific information (Element Four)
Consider levels of prior scientific knowledge in the target audience (Element Seven)
Course: CHEM2052, PHYS3900
Teaching Documents: Teaching notes for delivery, Student handout
Format: Multimedia, written
Description: Students were asked to watch a three-minute science video and then as a class to discuss what some of the main
considerations which might have influenced the authors in making the video. They then worked in pairs on a worksheet that guided
them through the process of audience analysis for who they considered to be the target audience of the video. This activity gets
students to actively engage in the process of audience analysis rather than just being told outright, and introduces them to some of the
central considerations of communication as well as the mode of communication on which they are being assessed (video – for
CHEM2052).

50
FIGURES
0
10
20
30
40
50
60
70
80
90
100
1 2 3 4 5 6 7 8 9 10 11 12
Per
cen
t (%
)
Key elements of effective science communication
Absent
Implicit
Explict
Figure 1. The percentage of each key element of effective science communication that was
explicit, implicit, or absent in core written teaching documents for all 35 assessment tasks across
the Australian Go8 universities: ANU, UQ, UWA, and UniMelb (see Table 6 for descriptions of
elements).

51
0
10
20
30
40
50
60
70
80
90
100
1 2 3 4 5 6 7 8 9 10 11 12
Per
cen
t A
bse
nt
(%)
Key elements of effective science communication
C
0
10
20
30
40
50
60
70
80
90
100
1 2 3 4 5 6 7 8 9 10 11 12
Per
cen
t Im
plic
it (
%)
B
0
10
20
30
40
50
60
70
80
90
100
1 2 3 4 5 6 7 8 9 10 11 12
Per
cen
t Ex
plic
it (
%)
A Non-scientific
Scientific
Audience
Figure 2. A comparison of the presence of each key element of science communication (Table 6)
in assessment tasks that target scientific versus non-scientific audiences. A) Percentages for each
element that was taught explicitly. B) Percentages for each element that was taught implicitly. C)
Percentages for each element that was absent. Data were collected from supporting teaching
materials for 35 communication-style assessment tasks across the Australian Go8 universities:
ANU, UQ, UWA, and UniMelb).
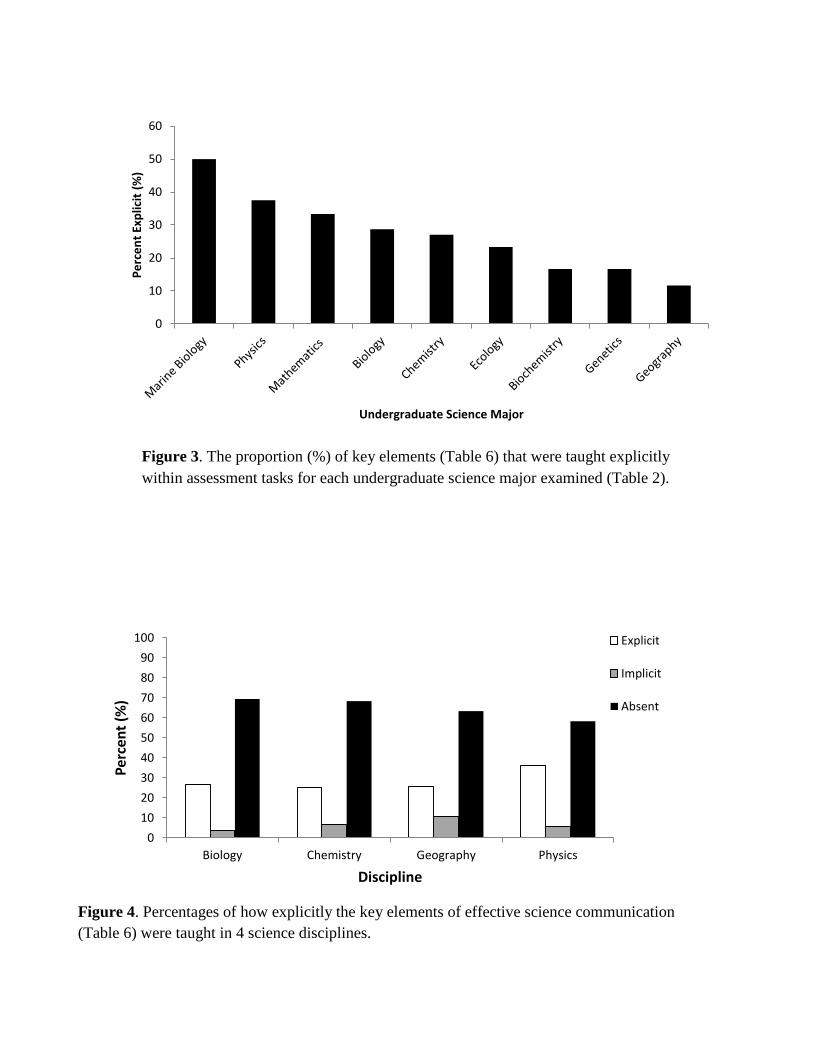
52
0
10
20
30
40
50
60
70
80
90
100
Biology Chemistry Geography Physics
Per
cen
t (%
)
Discipline
Explicit
Implicit
Absent
Figure 4. Percentages of how explicitly the key elements of effective science communication
(Table 6) were taught in 4 science disciplines.
0
10
20
30
40
50
60P
erc
en
t Ex
plic
it (
%)
Undergraduate Science Major
Figure 3. The proportion (%) of key elements (Table 6) that were taught explicitly
within assessment tasks for each undergraduate science major examined (Table 2).

53
0.00
0.50
1.00
1.50
2.00
2.50
3.00
3.50
4.00
4.50
5.00A
vera
ge L
iker
t-Sc
ale
Re
spo
nse
Science Communication Skill
Biology
Physics
Chemistry
Figure 5. Self-reported student learning gains (averaged across three science courses for 232
students) in response to the question “How much has your ability to do the following skills
improved as a result of the workshop activities?” on a Likert scale of 0 = Not at all to 3 =
somewhat to 5 = Very Much. Abbreviated science communication skills on the X axis align
with the key elements shown in Table 6 as follows: Audience - Element One, Language –
Element Two, Prior Knowledge – Element Seven, Context – Element Four, Content –
Element Three, Style and Data Visualization – Element Six, Purpose – Element Nine. Data
bars not shown where those skills were not taught in those courses.

54
0.00
0.50
1.00
1.50
2.00
2.50
3.00
3.50
4.00
4.50
5.00
Enjoyment Relevance Value Confidence
Ave
rage
Lik
ert
-Sca
le R
ep
on
se
Question Topic
Biology
Physics
Chemistry
Figure 6. Student perceptions (averaged across three science courses for 232 students) on a
Likert scale of 0 = Not at all to 3 = somewhat to 5 = Very Much. The abbreviated question
topics align with the following questions: Enjoyment - Did you enjoy these communication
activities?; Relevance - How relevant do you feel these class activities are to your
assignment?; Value - How valuable do you believe these communication skills will be to
your career in science?; and Confidence - Do you feel more confident in effectively
communicating science to a non-scientific audience as a result of these activities?

55
APPENDIX 1: Research methods
1.1 Survey for experts used in Aim 1B
Aim 1B: Questions for survey of experts, distributed using the online survey tool ‘Survey
Monkey’ (https://www.surveymonkey.com)
1. Please state your name.
2. Please indicate if you give consent to your name being included in a list of people/experts
consulted in any publications arising from this study. (Multiple Choice Question)
I am happy to be acknowledged.
Please keep my identity anonymous.
3. Which of the following do you consider your primary field of expertise? (Can select more
than one) (Multiple Choice Question)
Science
Communication
Science communication
Education
Other (please comment)
4. In your opinion, what key elements are integral to educating undergraduate science
students to communicate to non-scientific audiences?
5. Please consider the following list of key elements of effective science communication.
This suggested list was designed as a possible guide in teaching undergraduate science
students to communicate to non-scientific audiences:
Key elements of effective science communication
Identify a suitable target audience
Use language that is appropriate for your target audience
Include factual content that is relevant to the target audience
Consider the social, political, and cultural context of the science being communicated

56
Promote audience engagement with the scientific content
Use style elements such as humour, anecdotes, metaphors, and imagery
Consider the levels of prior knowledge in the target audience
Use the tools of storytelling and narrative
Identify the purpose and intended outcome of the communication
Use a suitable mode and platform to communicate
Present the scientific information within a relatable and engaging context
How applicable do you think this list is for teaching undergraduate science students to
communicate to non-scientific audiences? (Likert Scale)
1 - Not at all applicable
2 - Rarely applicable
3 - Neutral
4 - Somewhat applicable
5 - Extremely applicable
6. Please provide reasons for your above answer if you wish.
7. Please rate how essential each element from the below list is within the context of
educating undergraduate science students to communicate to non-scientific audiences.
(Likert scale)
Key elements of effective science communication
Identify a suitable target audience
Use language that is appropriate for your target audience
Include factual content that is relevant to the target audience
Consider the social, political, and cultural context of the science being communicated
Promote audience engagement with the scientific content
Use style elements such as humour, anecdotes, metaphors, and imagery
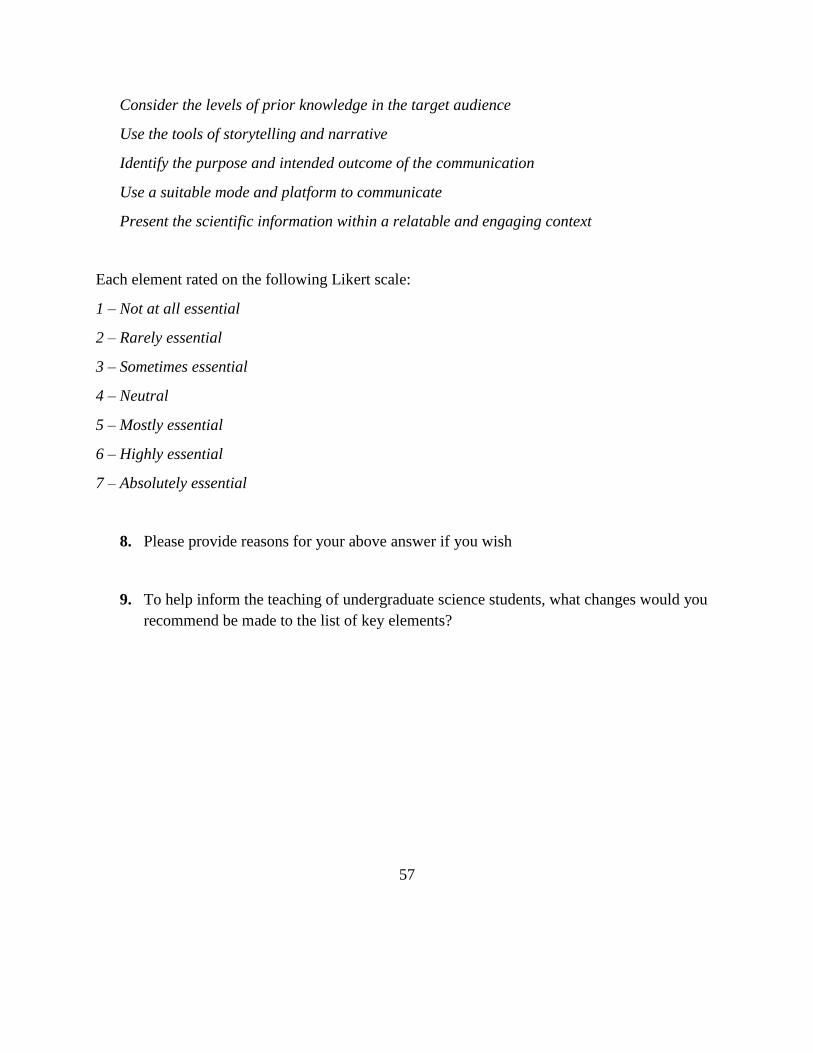
57
Consider the levels of prior knowledge in the target audience
Use the tools of storytelling and narrative
Identify the purpose and intended outcome of the communication
Use a suitable mode and platform to communicate
Present the scientific information within a relatable and engaging context
Each element rated on the following Likert scale:
1 – Not at all essential
2 – Rarely essential
3 – Sometimes essential
4 – Neutral
5 – Mostly essential
6 – Highly essential
7 – Absolutely essential
8. Please provide reasons for your above answer if you wish
9. To help inform the teaching of undergraduate science students, what changes would you
recommend be made to the list of key elements?

58
1.2 Decision making flow-chart in Aim 2A
Essential element directly
explained or referenced in core
documents
Essential element vaguely
referenced in core documents
Essential element referenced in
marking criteria not given to
students
EXPLICIT
ABSENT
IMPLICIT
YES
NO
YES
NO
NO
YES
Decision-making flow chart used as an aid for the analyses of documents used to teach and assess
communication tasks in regard to the presence of key elements of effective science communication.

59
1.3 Science communication survey to assess self-reported student learning gains in Aim 3B
Student Science Communication Survey
Please take a few minutes to answer the following questions on the activities you have
completed in the communication activities.
Please take a minute to write down what you felt were the main skills you learnt in the
communication activities.
For the questions below please tick the most appropriate box.
Not at
all
A little Some
what
Quite a
lot
Very
much
Did you enjoy these communication activities?
How relevant do you feel these class activities
are to your assignment?
How valuable do you believe these
communication skills will be to your career in
science?

60
As a result of these activities, how much do you think your ability to do the following things
has improved?
Not
at all
A little Some
what
Quite
a lot
Very
much
…ability to identify and analyse a target audience
…ability to use appropriate language to
communicate science
…ability to consider prior knowledge in an audience
…ability to separate essential from non-essential
content
…ability to consider the social/political/cultural
context of a scientific issue
…ability to identify the purpose and outcome of a
communication
…ability to use style elements such as analogy,
metaphor, and simile
…ability to visualize data effectively
Not
at all
A
little
Some
what
Quite
a lot
Very
much
Do you feel more confident in effectively communicating
science to a non-scientific audience as a result of these
activities?

61
1.4 Semi-structured interview with academics to assess learning gains in Aim 3B
1. Tell me about your overall impressions about the learning activity.
2. In your opinion, how clear or explicit was the teaching of these communication skills?
3. Do you see the skills taught as being useful and relevant in helping students to complete
the assignment to a high standard?
4. What were your impressions about how the students dealt with the communication
content being taught?
5. If provided with all the written resources, would you feel comfortable teaching this
activity in subsequent years on your own?
6. Would you feel comfortable encouraging or mentoring other teaching academics to
implement similar activities in their courses?
7. Are there any changes you would recommend to improve the teaching of these skills?
8. Did you notice any tangible differences in the quality of the communication component
of the assessment pieces from this year compared to previous years?
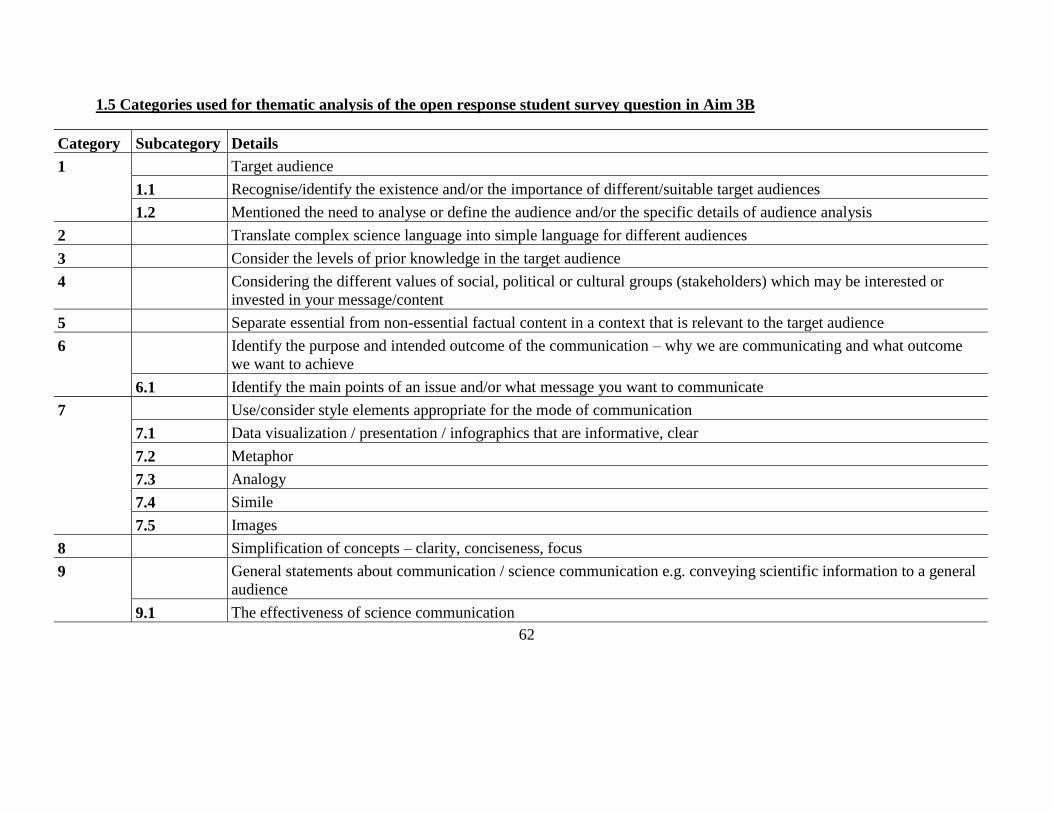
62
1.5 Categories used for thematic analysis of the open response student survey question in Aim 3B
Category Subcategory Details
1 Target audience
1.1 Recognise/identify the existence and/or the importance of different/suitable target audiences
1.2 Mentioned the need to analyse or define the audience and/or the specific details of audience analysis
2 Translate complex science language into simple language for different audiences
3 Consider the levels of prior knowledge in the target audience
4 Considering the different values of social, political or cultural groups (stakeholders) which may be interested or
invested in your message/content
5 Separate essential from non-essential factual content in a context that is relevant to the target audience
6 Identify the purpose and intended outcome of the communication – why we are communicating and what outcome
we want to achieve
6.1 Identify the main points of an issue and/or what message you want to communicate
7 Use/consider style elements appropriate for the mode of communication
7.1 Data visualization / presentation / infographics that are informative, clear
7.2 Metaphor
7.3 Analogy
7.4 Simile
7.5 Images
8 Simplification of concepts – clarity, conciseness, focus
9 General statements about communication / science communication e.g. conveying scientific information to a general
audience
9.1 The effectiveness of science communication

63
Category Subcategory Details
9.2 The importance of science communication
10 Other
10.1 Make content / communication engaging / interesting
10.2 Need for more time / depth for the tutorial content
10.3 Problem solving / creativity
10.4 Group/team work
10.5 The need to communicate without bias / recognizing bias
10.6 Content was too simple or has been covered in earlier courses
10.7 Enjoyed the tutorial(s), comments on them being good/useful etc.
10.8 Understanding/explaining concepts quickly

64
1.6: Science communication marking criteria used to mark assignments pre- and post-implementation of novel communication
activities as part of data collection for aim 3B.
Criterion / Grade Subcategory 7 – Outstanding (no
faults)
6 – Excellent (minor
faults that are easily
fixed)
5 – Good (minor faults
that need some work)
4 – Poor (many faults that
need extensive work)
3-1 – Fail (all
skills absent)
1) Identify a suitable
target audience
NA Audience is clearly
identified and highly
suitable and relevant.
Audience is clearly
identified and suitable but
could have been more
relevant.
Audience is identified but
this could have been done
more clearly. Audience
could have been more
suitable and relevant.
Consideration has been
given to audience but this is
not clearly identified.
Audience could have been
much more suitable and is
not particularly relevant.
No consideration
given to audience.
2) Use language that
is appropriate for
the target audience
NA All language is suitable
for the target audience.
5% of the language is
unsuitable for audience.
5-20% of the language is
unsuitable for audience.
20-50% of the language is
unsuitable for audience.
More than 50 % of
the language is
unsuitable for
audience.
3) Purpose and
outcome
3A) Purpose of the
communication
is clear
The purpose of the
communication is made
exceptionally clear.
The purpose of the
communication is made
clear.
The purpose of the
communication is present
but needs clarity.
The purpose of the
communication is not clear.
No clear purpose.
3B) The outcome
is achieved
effectively
Student achieves a
highly effective
outcome which aligns
directly with the
purpose.
Student achieves an
effective outcome which
aligns with the purpose.
The outcome could have
been more effectively
achieved and only
indirectly aligns with the
purpose.
The outcome is ineffective
and does not align with the
purpose.
No clear outcome.
4) Consider the
levels of prior
knowledge in the
target audience
NA All concepts used are
appropriate for and can
be understood by
audience.
Most concepts used are
appropriate for and can be
understood by audience.
Some concepts used are
appropriate for and can be
understood by audience.
Few concepts used can be
understood by audience.
None of the
concepts can be
understood by
audience.
5) Consider the 5A) Stakeholder The stakeholders are The stakeholders are The stakeholders are The stakeholders are No relevant

65
social, political,
and cultural
context of the
scientific
information
identification
and relevance clearly identified,
highly relevant to the
scientific issue.
identified,
relevant to the scientific
issue.
identified but could
have been more relevant
to the scientific issue.
not clearly identified
and could have been
more relevant to the
scientific issue.
stakeholders
identified.
5B)
Representative
of the main
social, political
or cultural
issues
Highly representative of
the all main social,
political, or cultural
issues.
Representative of most of
the main social, political, or
cultural issues.
Representative of some of
the main social, political, or
cultural issues.
Representative of a few of
the main social, political, or
cultural issues.
Stakeholders do not
represent the main
social, political, or
cultural issues.
6) Use appropriate
stylistic element
that is relevant to
the audience
6A) Infographic or
diagram
Diagram used is
relevant to format of
publication,
content and message
is very clear,
has high aesthetic
impact,
all elements of the
diagram are relevant,
clear, and appealing
to the audience.
Diagram used is
relevant to format of
publication,
content and message is
clear,
has aesthetic impact,
the majority of the
elements of the diagram
are relevant, clear, and
appealing to the
audience.
Diagram used is
somewhat relevant to
format of publication
but could have been
better chosen,
content and message
require more clarity,
has some aesthetic
impact,
the majority of the
elements of the diagram
are relevant, clear, and
appealing to the
audience but this could
be improved.
Diagram used is
not really relevant to
format of publication,
content and message
require a lot more
clarity,
has little aesthetic
impact,
the majority of the
elements of the diagram
are not relevant, clear,
and appealing to the
audience.
Diagram used is not
relevant to format
of publication and
no thought has been
given to impact,
clarity, or appeal.
6B) Analogy,
simile, or
metaphor
The element chosen is
suitable for the
content,
relevant to the
audience,
The element chosen is
suitable for the content,
mostly relevant to the
audience,
conveys the information
The element chosen
could have been more
suitable for the content,
is mostly relevant to
the audience,
The element chosen
could have been more
suitable for the content,
was not relevant to the
audience,
The element chosen
was not suitable,
clear, or relevant,
and creates
confusion.
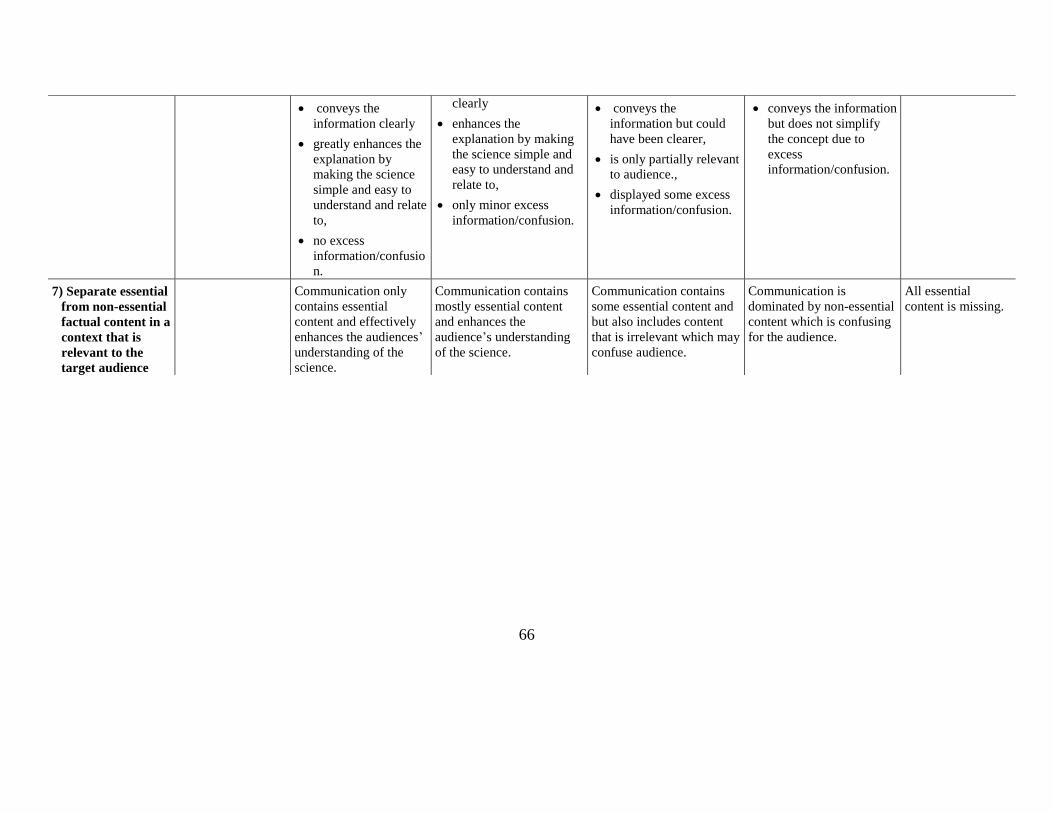
66
conveys the
information clearly
greatly enhances the
explanation by
making the science
simple and easy to
understand and relate
to,
no excess
information/confusio
n.
clearly
enhances the
explanation by making
the science simple and
easy to understand and
relate to,
only minor excess
information/confusion.
conveys the
information but could
have been clearer,
is only partially relevant
to audience.,
displayed some excess
information/confusion.
conveys the information
but does not simplify
the concept due to
excess
information/confusion.
7) Separate essential
from non-essential
factual content in a
context that is
relevant to the
target audience
Communication only
contains essential
content and effectively
enhances the audiences’
understanding of the
science.
Communication contains
mostly essential content
and enhances the
audience’s understanding
of the science.
Communication contains
some essential content and
but also includes content
that is irrelevant which may
confuse audience.
Communication is
dominated by non-essential
content which is confusing
for the audience.
All essential
content is missing.
67
APPENDIX 2: Results
2.1: A detailed outline of the decisions made in the distillation of key elements from 17 to 10
as part of Aim 1A.
Some elements were considered on an individual basis for inclusion or exclusion in the final list.
The elements addressing mode and purpose of communication had only two and three citations
respectively (Table 3) but were included (despite having low citation rates) because both
elements have been identified previously by the Australian Learning and Teaching Council
(2011) as integral to the communication skills taught in Australian science degrees. Likewise,
‘Use the tools of storytelling and narrative’ had only three citations but was included because it
is acknowledged widely in more generic communication textbooks and guides as being an
important part of effective communication (Ryan, 2004; Page & Thomas, 2011; Fog et al.,
2010).
The complexity of the skills required to understand or deliver each essential element also was
considered on an individual basis in refining the list of 17 key elements. For example, the
element ‘Evaluate the adequacy of the communication’ was excluded because this is a process
which requires a highly developed self-evaluative skill set that is largely specific to people
specializing in communication. Specificity to science communication was also considered and
elements such as ‘Use correct grammar, punctuation, and spelling’ and ‘Communicate
organised ideas and concepts using clarity, accuracy, and logic’ were excluded because they are
not specific to science communication, though they clearly are important to communication in
general. ‘Consider aesthetic components to promote the visual appeal of the communication’
was excluded because it is a skill specific to particular modes of communication (e.g. web
design) and is not generically applicable.

68
2.2 Examples of teaching documents for the implementation of novel science
communication activities as part of Aim 3A
2.2A Student handout used to guide students through audience analysis of a science video
Target Audience Analysis
This activity will help you develop the following science communication skills:
Identify and understand a suitable target audience
Consider levels of prior scientific knowledge in the target audience
Consider the social, political, and cultural context of the scientific information.
It’s really important that whenever you communicate science you have a very clear idea of who
you are communicating with. Without knowing this, you won’t be able to adapt the way you
communicate in order to present your message effectively.
WHAT YOU WILL DO
You will view a science video. Watch it carefully. Who do you think was the intended target
audience of this video? Who might be most interested in this video?
We will brainstorm the answers to these questions as a class, so think about some of the
following communication concepts and what audience they might be appropriate for:
The language the presenter used
The complexity of the scientific content included in the explanations
The types of images, video, and music used
The style elements included such as humour.
As a class we’re going to define who we think is likely to be the intended target audience.
Group Instructions:
In pairs, please take 5 minutes to work through the following audience analysis activity on the
worksheet. Use the audience we defined as a class.

69
TARGET AUDIENCE ANALYSIS
Now that you have a specific audience lets break down and analyse the specific details of that
audience.
What demographic might the majority of your audience be within the following categories?
There are no definite answers to these questions but this process will get you thinking about who
exactly you are communicating with.
Age bracket: 10-15 / 15-20 / 20-30 / 30-45 / 45-60 / 60+
Gender: Mainly female / mainly male / both
Potential political agenda/beliefs
For example, what political party is this audience most likely to agree with?
Cultural or religious background:
For example, will your target audience have strong Christian beliefs?
Prior training in science:
Primary school / High school / University Undergraduate / University Post-Graduate
Stage of career or education
Geographical location

70
2.2B Student handout used to guide students through language and jargon translation
CHEM2052: Concept and Language tutorial activity
The following activity will help you to:
Use language that is appropriate for your target audience
Consider the levels of prior knowledge in the target audience
Separate essential from non-essential factual content in a context that is relevant to the
target audience.
As you begin to communicate science, keep in mind a specific target audience. Adapt the
language you use and the content you include to ensure that audience can understand everything
you say. Here are some examples of questions you should consider:
o How much jargon should you use?
Lacrimation or crying? Herbivore or planting eating? Sessile or not
moving?
o Will you use acronyms?
Carbon dioxide vs CO2?
o What prior knowledge in science will your audience already have?
o What scientific content will you need to explain? What scientific content can you
assume your audience will understand?
The following activity is designed to help you get started on the process of jargon translation. In
the first column are scientific concepts that a second year chemistry or biology student can be
expected to understand. Your job is to work in pairs to explain each concept to two audiences:
1. A scientist of a different discipline.
2. A non-scientific audience of a grade 10 high school student.
Consider the above questions as you explain and translate these concepts. The first row is filled
out for you as an example. Here are some tips to get you started:

71
Keep sentences short and your word count to an absolute minimum.
After defining the concept for the first audience, go through and underline any words that
your non-scientific audience might not understand. Make a list of these and then translate
each word into clear and simple language which you can then use when you write the
second explanation for your non-scientific audience.
Separate essential content from non-essential content. What prior knowledge will your
audience already have? What information does your audience absolutely need to know to
understand the concept? What information isn’t relevant and could be removed?
Scientific concept Explanation for a scientist Explanation for a grade 10 high
school student
Greenhouse effect
(Worked example)
The greenhouse effect is the
phenomenon whereby the earth’s
temperature rises which is caused by the
presence of chemical compounds in the
earth’s atmosphere called greenhouse
gases, such as water vapor, carbon
dioxide, and methane, which trap short-
wave infrared solar radiation.
The greenhouse effect keeps the earth
warm. This effect is caused by
chemicals in the air that surrounds the
planet which trap heat from the sun.