Teachers' perspectives of effective lesson planning: A ...
235
W&M ScholarWorks W&M ScholarWorks Dissertations, Theses, and Masters Projects Theses, Dissertations, & Master Projects 2014 Teachers' perspectives of effective lesson planning: A Teachers' perspectives of effective lesson planning: A comparative analysis comparative analysis Jessica Miller Wunderle Straessle William & Mary - School of Education Follow this and additional works at: https://scholarworks.wm.edu/etd Part of the Curriculum and Instruction Commons, Educational Leadership Commons, and the Instructional Media Design Commons Recommended Citation Recommended Citation Straessle, Jessica Miller Wunderle, "Teachers' perspectives of effective lesson planning: A comparative analysis" (2014). Dissertations, Theses, and Masters Projects. Paper 1550154173. https://dx.doi.org/doi:10.25774/w4-8swa-7371 This Dissertation is brought to you for free and open access by the Theses, Dissertations, & Master Projects at W&M ScholarWorks. It has been accepted for inclusion in Dissertations, Theses, and Masters Projects by an authorized administrator of W&M ScholarWorks. For more information, please contact [email protected].
Transcript of Teachers' perspectives of effective lesson planning: A ...

W&M ScholarWorks W&M ScholarWorks
Dissertations, Theses, and Masters Projects Theses, Dissertations, & Master Projects
2014
Teachers' perspectives of effective lesson planning: A Teachers' perspectives of effective lesson planning: A
comparative analysis comparative analysis
Jessica Miller Wunderle Straessle William & Mary - School of Education
Follow this and additional works at: https://scholarworks.wm.edu/etd
Part of the Curriculum and Instruction Commons, Educational Leadership Commons, and the
Instructional Media Design Commons
Recommended Citation Recommended Citation Straessle, Jessica Miller Wunderle, "Teachers' perspectives of effective lesson planning: A comparative analysis" (2014). Dissertations, Theses, and Masters Projects. Paper 1550154173. https://dx.doi.org/doi:10.25774/w4-8swa-7371
This Dissertation is brought to you for free and open access by the Theses, Dissertations, & Master Projects at W&M ScholarWorks. It has been accepted for inclusion in Dissertations, Theses, and Masters Projects by an authorized administrator of W&M ScholarWorks. For more information, please contact [email protected].

TEACHERS’ PERSPECTIVES OF EFFECTIVE LESSON PLANNING:
A COMPARATIVE ANALYSIS
A Dissertation
Presented to
The Faculty of the School of Education
The College of William and Mary in Virginia
In Partial Fulfillment
Of the Requirements for the Degree Doctor of Education
ByJessica Miller Wunderle Straessle
March 2014

TEACHERS’ PERSPECTIVES OF EFFECTIVE LESSON PLANNING:
A COMPARATIVE ANALYSIS
by
Jessica Miller Wunderle Straessle
Approved March 2014 by
Jahres H. Stronge, Ph.D.
Co-Chairperson of Doctoral Committee
Thomas J. W^rcLJ^h.D.
Co-Chairperson of Doctoral Committee
ttfjAhi 10■ jtyu d-Leslie W. Grant, Ph. D.

DEDICATION
To all the dedicated educators
who make a difference in lives of children daily

Table of Contents
ACKNOWLEDGEMENTS..............................................................................................vi
LIST OF TABLES.......................................................................................................... viii
LIST OF FIGURES............................................................................................................x
ABSTRACT....................................................................................................................... xi
Chapter 1 Introduction.......................................................................................................2
Background of the Study.................................................................................................. 2Rationale of the Study........................................................................................................3Statement of the Problem.................................................................................................10Statement of Purpose.......................................................................................................10Research Questions..........................................................................................................11Significance of the Study.................................................................................................12Definitions of Key Terms................................................................................................12Limitations and Delimitations of the Study.....................................................................15
Chapter 2 Literature Review...........................................................................................18
Importance of Teacher Effectiveness...............................................................................19What Makes Teachers Effective? Conceptual Frameworks for Effective Teachers 25Effective Teachers: Lesson Planning............................................................................. 35Planning and Preparing for Instruction........................................................................... 37Effective Planning Attributes.......................................................................................... 61Written Lesson Plans...................................................................................................... 63Summary......................................................................................................................... 69
Chapter 3 Methodology....................................................................................................75
Research Questions......................................................................................................... 75Sample............................................................................................................................. 77Instrumentation............................................................................................................... 77Procedures....................................................................................................................... 86Data Analysis.................................................................................................................. 86Ethical Considerations.................................................................................................... 89
iv

Chapter 4 Analysis of Results..........................................................................................90
Research Questions......................................................................................................... 90The Study........................................................................................................................ 92Findings for Research Questions...................................................................................109
Chapter 5 Summary and Discussion of Findings........................................................ 140
Summary of Findings.....................................................................................................142Discussion..................................................................................................................... 168Conclusion.................................................................................................................... 179Limitations.................................................................................................................... 182Recommendations for Future Research........................................................................ 183
Appendix A Original Survey Instrum ent.................................................................... 185
Appendix B Final Survey A ...........................................................................................191
Appendix C Final Survey B ...........................................................................................197
Appendix D Regions of the United States.................................................................... 204
Appendix E Letter to Participants............................................................................... 205
Appendix F Participant Consent.................................................................................. 206
References....................................................................................................................... 207
Vita.................................................................................................................................. 225
v

ACKNOWLEDGEMENTS
The successful completion of this dissertation is the product of the dedicated, supportive, and caring faculty at The College of William and Mary; without whom, I would not be the well-rounded educator and thinker that I have become. My experience at William and Mary has been blessed with a “village” that worked together to help me reach my goals. I appreciate everyone who played a role in my growth. The network and collegiality of professors, students, and staff is unparalleled and created a truly supportive environment.
Specifically, I would like to acknowledge a handful of faculty members at William and Mary with whom I have worked throughout my studies. Dr. Chris Gareis served as my academic advisor and chair of my comprehensive exam committee. His guidance helped me navigate through the program with few challenges. He challenged me to take the extra classes in order to have those necessary for an administrative license, a decision which gave me a wealth of knowledge in the field. Dr. Gareis is a superb educator and taught me to be creative and to look at education differently. I was a teacher when I took classes with Dr. Gareis; he improved my teaching by showing me the importance of alignment, models of teaching, and assessment. Both my students and I benefited from his unique teaching style which inspired me
Dr. James Stronge guided me through the dissertation phase of the doctoral program. He offered sage advice that guided this study from a broad range of interests and initial ideas to a completed project. His support, encouragement, and understanding have been invaluable. The completion of this project is largely a result of Dr. Stronge’s knowledge, enthusiasm, understanding, and guidance.
I would be remiss if I did not also mention the wonderful faculty who worked with me as committee members. Dr. Megan Tschannen-Moran worked as a member of my comprehensive exam committee as well as a professor of many of my classes. She is an excellent role model for women in leadership and I thank her. Dr. Mark Hofer, as a member of my comprehensive exam committee, was a source of comfort when times were difficult and always willing to take time for his students. As a member of my dissertation committee, Dr. Thomas Ward has been a continuing source of support and guidance for me in statistics. His passion shines when discussing research and gave me confidence. Dr. Leslie Grant selflessly accepted a position on my dissertation committee and I appreciate all the time and effort required to help me finish.
To my mother, Margaret Wunderle, my first teacher, thank you for sharing your passion with me. To my father, Robert Wunderle, thank you for your love of learning and the example you set for me. You showed me that even experts in a field can learn more. To my brothers, Robert and Joseph Wunderle, thank you for thinking and ideas on a daily basis.
Most importantly, to my husband, Chris, thank you for your love and support throughout this journey. From the moment I began this program through its completion, you have made sacrifices in your own career and at home to ensure that I finished this program. You were my cheerleader when the thought of finishing seemed a far off dream
vi

and you were my strong-hold when I became overwhelmed with motherhood and being a student. Without your support, this goal could not have been possible. To my daughter, Ella, thank you for your patience with mom. Finally, thank you to the numerous colleagues, friends and relatives for their unending support. I appreciate all the support and thank you all!
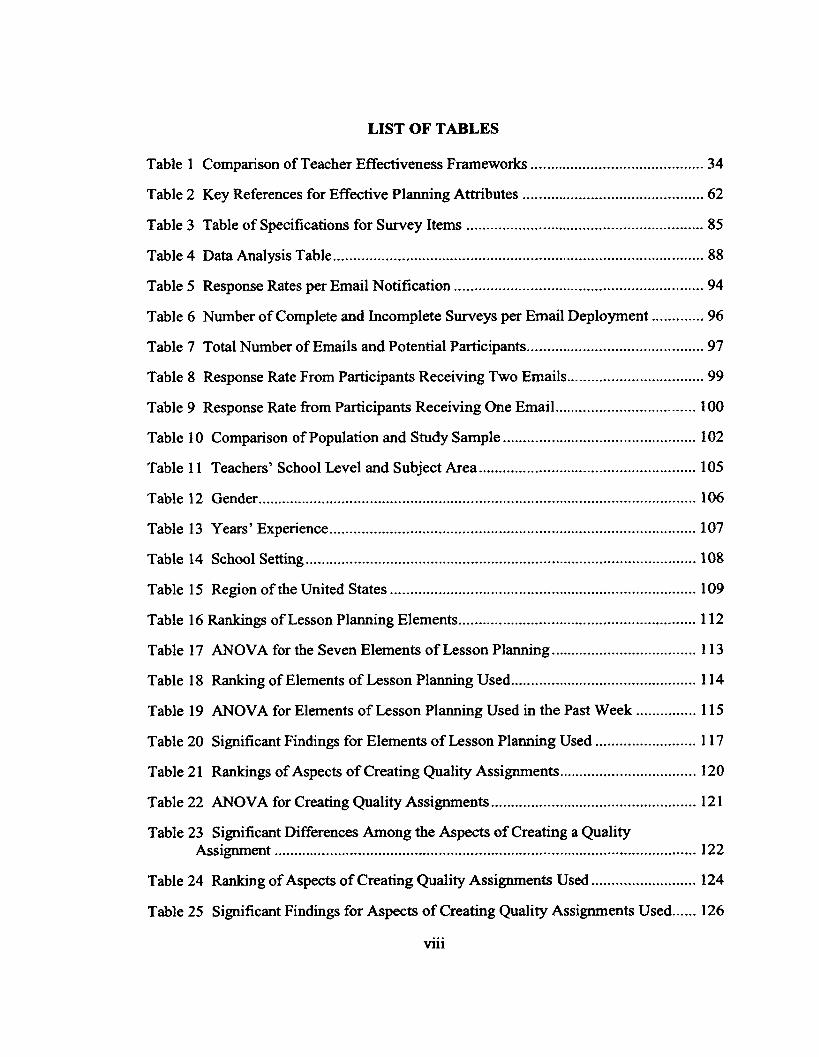
LIST OF TABLES
Table 1 Comparison of Teacher Effectiveness Frameworks............................................34
Table 2 Key References for Effective Planning Attributes..............................................62
Table 3 Table of Specifications for Survey Items............................................................85
Table 4 Data Analysis Table............................................................................................. 88
Table 5 Response Rates per Email Notification............................................................... 94
Table 6 Number of Complete and Incomplete Surveys per Email Deployment............. 96
Table 7 Total Number of Emails and Potential Participants.............................................97
Table 8 Response Rate From Participants Receiving Two Emails...................................99
Table 9 Response Rate from Participants Receiving One Email....................................100
Table 10 Comparison of Population and Study Sample................................................. 102
Table 11 Teachers’ School Level and Subject Area....................................................... 105
Table 12 Gender.............................................................................................................. 106
Table 13 Years’ Experience.............................................................................................107
Table 14 School Setting...................................................................................................108
Table 15 Region of the United States............................................................................. 109
Table 16 Rankings of Lesson Planning Elements............................................................ 112
Table 17 ANOVA for the Seven Elements of Lesson Planning.....................................113
Table 18 Ranking of Elements of Lesson Planning Used............................................... 114
Table 19 ANOVA for Elements of Lesson Planning Used in the Past Week................115
Table 20 Significant Findings for Elements of Lesson Planning Used.......................... 117
Table 21 Rankings of Aspects of Creating Quality Assignments...................................120
Table 22 ANOVA for Creating Quality Assignments.................................................... 121
Table 23 Significant Differences Among the Aspects of Creating a QualityAssignment.......................................................................................................... 122
Table 24 Ranking of Aspects of Creating Quality Assignments Used........................... 124
Table 25 Significant Findings for Aspects of Creating Quality Assignments Used 126
viii

Table 26 Rankings of Aspects of Lesson Structure........................................................ 128
Table 27 ANOVA for Aspects of Logically Structured Lessons...................................130
Table 28 Significant Differences for Aspects of Logically Structured Lessons 131
Table 29 Ranking of Aspects of Logically Structured Lessons Used............................132
Table 30 Significant Findings for Aspects of Logically Structured Lessons Used 133
Table 31 ANOVA Results for Demographic Factors and Ranking of Elements ofLesson Planning................................................................................................... 135
Table 32 Type of Lesson Plans Used by Teachers......................................................... 136
Table 33 Coded Responses for Lesson Plan Review...................................................... 137
Table 34 Descriptive Statistics for Those who Use Written Lesson Plans.....................137
Table 35 How Often Lesson Plans are Referred to During the Course of a Day 138
Table 36 ANOVA Comparing Number of Years Taught and Type of LessonPlan Used............................................................................................................. 139
Table 37 Significant Differences Among Aspects of Creating a Quality Assignment.. 150
Table 38 Significant Findings for Aspects of Creating Quality Assignments Used 153
Table 39 ANOVA Results for Demographic Factors and Ranking of Elements ofLesson Planning................................................................................................... 160
Table 40 Type of Lesson Plans Used by Teachers......................................................... 161
Table 41 Coded Responses for Lesson Plan Review...................................................... 162
Table 42 How Often Lesson Plans are Referred to During the Course of a Day...........164
Table 43 Results for the Impact of Objectives on Student Achievement.......................170

LIST OF FIGURES
Figure 1- The major sources of variance in a student’s achievement. Adapted fromHattie 2003............................................................................................................. 23
Figure 2-Instruction Cycle. Adapted from Ko 2012.........................................................68
x

TEACHERS’ PERSPECTIVES OF EFFECTIVE LESSON PLANNING:A COMPARATIVE ANALYSIS
ABSTRACTThis study investigated the perceptions that K-12 teachers have about various
Elements of Lesson Planning. Specifically, the researcher sought to determine which
research-based Elements of Lesson Planning teachers perceived as having the greatest
impact on student achievement and if certain demographic characteristics affected those
perceptions. Data were collected with two surveys created by the researcher based on Stronge’s (2007) Framework for Effective Teachers. A national stratified random sample
of 184 U.S. educators ranked seven elements of teacher planning in the order they
believed that those qualities impact student achievement. Participants were also asked to
rank aspects of Creating Quality Assignments and Logically Structured Lessons in the order they believed those aspects to impact student achievement. Finally, participants
were asked to self-report what elements they have used in their classroom and how they
plan lessons. This study revealed that teachers did not differentiate among the Elements of Lesson Planning, but that teachers reported using Clear Lesson and Learning
Objectives significantly more than other elements. It was also found teachers believe
some aspects of Creating Quality Assignments impact student achievement significantly more than others including: Real World Connections, Depth of Knowledge Necessary to
Complete Assignments, Providing Students with Performance Standard and/or Guideline, Student Control and Cross Curricular Assignments. Teachers also noted using
Real World Connections to Assignments when creating assignments significantly more often than any other aspect. Additionally, teachers perceived all aspects of Logically
Structured Lessons as having a more significant impact on student achievement than Sequencing of Questions to be Asked by the Teacher. Teachers also reported using all
the other aspects significantly more than Sequencing of Questions to be Asked by the
Teacher. Finally, it was found that most teachers use written lesson plans and that there
is no standard practice for how often teachers refer to their written plans.JESSICA MILLER WUNDERLE STRAESSLE
DEPARTMENT OF EDUCATIONAL POLICY, PLANNING, AND LEADERSHIP
THE COLLEGE OF WILLIAM AND MARY IN VIRGINIA
xi

TEACHERS’ PERSPECTIVES OF EFFECTIVE LESSON PLANNING:
A COMPARATIVE ANALYSIS

Chapter 1
Introduction
Background of the Study
The Call for Teacher Quality
On February 17, 2009, President Obama signed into law the American Recovery
and Reinvestment Act (ARRA) o f 2009. This historic legislation was designed not only to
stimulate the economy, but also to invest in critical sectors, including education (United
States Department of Education, 2009). The ARRA provided $4.35 billion for the Race
to the Top Fund, a competitive grant program designed to “encourage and reward States
that are creating the conditions for education innovation and reform” (U.S. Department of
Education, 2009, p. 2). In order to receive funds, states must show and implement
ambitious plans in four core education reform areas, including: “adopting standards and
assessments that prepare students to succeed in college and the workplace and to compete
in the global economy; building data systems that measure student growth and success,
and inform teachers and principals about how they can improve instruction; recruiting,
developing, rewarding, and retaining effective teachers and principals, especially where
they are needed most; and turning around our lowest-achieving schools” (U.S.
Department of Education, 2009, p. 2). Most important among these core areas, as
reflected in the weights assigned in the grant decision-making process, is the
development of effective teachers (U.S. Department of Education, 2009). This emphasis
placed on teacher effectiveness by the policymakers is a clear indicator they believe the
quality of instruction that students receive is the most important influence on student
2

achievement (Hershberg & Robertson-Kraft, 2010). Therefore, the need for teachers to
be effective in their teaching is vital to student achievement.
Rationale of the Study
Having a deeper understanding of what constitutes teacher effectiveness is
important. In the recent past, substantial attention has been paid to teacher effectiveness
due to rising concerns regarding the quality of education students receive. Teacher
effectiveness is now being considered when developing teacher evaluations, when
teacher compensation is being discussed, and when teacher preparation changes. These
discussions are taking place at all levels of policy making, including federal, state, and
local levels. Recently, during a speech on the National Call on Flexibility and
Productivity, The U.S. Secretary of Education, Arne Duncan, suggested that “states and
districts use teacher effectiveness in the classroom as a factor in teacher layoffs.”
(Duncan, 2011, p 1).
Teachers are an important link in the educational chain. As Brophy and Good
(1986) determined, “the myth that teachers do not make a difference in student learning
has been refuted” (p. 370). The difference teachers make even outweighs the impact of
the school. Teachers interact with students through daily instruction, which gives
teachers the ability to directly impact student achievement. As Jackson and Davis (2000)
stated, “instruction is the daily bread of life, composed of the tools, strategies, lessons,
and activities, teachers and students use to learn” (p. 63). While school district curricula,
state standards, and national standards all play a role in what students should learn, it falls

4
to the teacher to structure how students actually learn the material (Stronge, 2007).
Therefore, teachers play a significant role in the educational system.
Additionally, in a speech regarding “A New Approach to Teacher Education
Reform and Improvement,” the Secretary of Education called for teacher preparation
programs to turn out effective teachers—a mission which is “central to the fiiture of our
children and our nation in a globally competitive, knowledge-based economy” (Duncan,
2011, p 1). Without a deeper understanding of what constitutes teacher effectiveness,
important decisions will be made without the full depth of knowledge. These decisions
will impact schools, teachers, and students alike; therefore it is vital to have a deeper
understanding of teacher effectiveness.
The Importance of Being Effective
There is abundant evidence that teacher effectiveness raises student achievement
(Ascher & Frucher, 2001; Borman & Kimbal, 2005; Chard, 2004; Darling-Hammond,
2000; Haycock, 1998). Effective teachers do make a difference in the lives of students.
Marzano, Pickering, and Pollock (2001) found that an individual teacher can have a
powerful effect on students even if the school does not. This important finding
recognizes the importance of having qualified and effective teachers in the classrooms.
In recent years, research on teacher effectiveness has reported a direct relationship to
student learning (Darling-Hammond & Young, 2002; Stronge, Ward, & Grant, 2011;
Stronge, Ward, Tucker, & Hindman, 2007). It has been documented how important
effective teachers are to the success of students (Allington & Johnston, 2000; Hattie,
2003; Hanushek, Kain, O’Brien, & Rivkin, 2005; Sanders, Wright, & Langeuin, 2008;

5
Wright, Horn, & Sanders, 1997). While these studies are just the tip of the iceberg to
understanding the importance of teachers being effective, the results reveal that both
students and schools require quality teachers to excel.
What Makes a Teacher Effective?
While the relationship between teacher effectiveness and student achievement can
easily be seen in the above studies, figuring out what makes a teacher effective is much
more difficult. Hattie (2003) identified five major dimensions of excellent teachers:
“Expert Teachers
• can identify essential representations of their subject,
• can guide learning through classroom interactions,
• can monitor learning and provide feedback,
• can attend to affective attributes, and
• can influence student outcomes” (p.5).
From these five dimensions follow sixteen “prototypic attributes of expertise”
(Hattie, 2003, p.5) that give further definition to the dimensions.
In addition to Hattie’s findings, Stronge (2002,2007) conducted a meta-review of
the available research on teacher effectiveness and found that the “qualities of effective
teachers could be divided into four dimensions:
• instruction
• student assessment

6
• learning environment
• personal qualities” (p. 168).
Finally, Danielson (2007) had similar findings in a study that identified aspects of
teacher responsibilities. She found through empirical studies and theoretical research that
the complex activity of teaching could be divided into four domains of teaching
responsibility:
• planning and preparation
• the classroom environment
• instruction
• professional responsibilities (Danielson, 2007).
These studies represent specific ways instructional effectiveness can be observed
or witnessed.
The Importance of Lesson Planning Research
Research has shown that thinking and planning play a significant role in
classroom teaching (Earle, 1998); that teachers “plan in a rich variety of ways [that] have
real consequences in the classroom”; that teachers “make planning decisions frequently
during interactive teaching”; that teacher theories and belief systems “influence their
perceptions, plans, and actions” (Clark & Peterson, 1986, p.292). Lesson planning is an
important aspect of a teacher’s job that directly impacts what and how students learn the
necessary material; therefore how teachers plan is important to study. In addition, Smith
(1977) states that “teacher planning is important for educational research and policy in

7
that: 1.) planning decisions and activities are a major factor affecting the quality,
quantity, and nature of classroom instruction, 2.) the effects o f planning decisions and
activities upon instruction can be assessed, and 3.) the cost of making alterations and
adjustments to planning decisions is minimal and thus planning represents a potentially
powerful tool for the improvement of instruction” (p.l).
Although there is a growing body of evidence about teacher effectiveness, in
general, and instructional planning, more specifically, there still remains a dearth of clear,
direct evidence regarding teachers’ lesson planning. Understanding the lesson planning
process, and how to intervene in the process to improve instruction, is helpful for both
teachers and administrators. This can be done through watching instruction and also
through the pre-active or planning phase. When it comes to research regarding the
relationship between the planning process and that which leads to effective instruction,
there is a paucity of research available. As Jasper (1986) stated, it is important to
understand the relationship between the planning process and effective instruction; until
this relationship is understood, administrators and supervisors cannot help teachers plan
effectively. There also is concern in the field as it is not really known how to
differentiate good and bad plans, or how these plans play out in the classroom, so
principals cannot use only the lesson plan to effectively monitor instruction.
Lesson Planning
It could be argued that a teacher’s role is not to teach but to arrange for learning
(Danielson, 2007). The importance in lesson planning is evident in the many decisions a
teacher must make in order to prepare students for the learning experience. Panasuk,

8
Stone, & Todd (2002) agreed that lesson planning involves a conscious effort by teachers
to develop “a coherent system of activities that promote the development of students’
cognitive structures” (p. 808). A study by Zahorik, Halbach, Ehrle, & Molnar (2003)
determined that effective teachers excel at instructional orientation, which deals with the
type of content taught and how it is taught. The study highlighted the need for effective
teachers to be effective planners as well. Lesson planning is the cognitive process of
thinking about what will happen in the classroom during a lesson (Jalongo, Reig, &
Helterbran, 2007). This involves the consideration of multiple aspects of the classroom,
ranging from methods to engage the students in the material to the different ways
students may react.
Looking at national level teaching standards such as the Interstate New Teacher
Assessment and Support Consortium (INTASC) (2013) and the National Board for
Professional Teaching Standards (NBPTS) (2012), instructional planning is a key aspect
of any teacher’s work in order to give students meaningful learning experiences (Ko,
2012). Planning for instruction is thus a critical step that all effective teachers take,
whether intentionally or intuitively (Thompson & Stryker, 2010), and meaningful
planning is complex (Marshall, 2012). Planning may appear simple but going through
the day-to-day planning motions does not guarantee meaningful activities will avail
(Marshall, 2012). According to Burden and Byrd (2003), “The goal of planning is to
ensure student learning; therefore, planning helps create, arrange and organize
instructional events to enable that learning to occur” (p. 23). It is important then that the
planning is effective in order for the instructional events to be effective and for learning

9
to follow. An effective teacher should then be able to plan in a manner that understands
the complexities of teaching and learning using a variety of skills and understanding to
meet the needs of all students. As scholars have reported “carefully planned, fine-tuned
lessons reflect an understanding of many different teaching techniques” (Orlich, Harder,
Callahan, Trevisan, & Brown, 2004, p. 15). Effective teachers are effective planners as it
would be difficult to carry out effective instruction without having a concrete solid plan
beforehand. This plan would be based on the teacher’s knowledge of the students, the
content, the resources, and the instructional strategies available. Marshall (2012) says the
depth of instructional planning comes from inquiry into the whys of children’s actions
and responses, and the hows of supporting each child. Thompson and Stryker (2010)
state that “effective planning processes combined with appropriate teaching techniques
lead to high quality learning experiences at all educational levels” (p. 187).
In Yinger’s (1980) study of teacher planning, he found that an interesting
characteristic emerged: Routines played a major role in the teacher’s planning. Routines
were used by the teacher to regulate activities and to simplify planning. In fact he found
that routines were so much a part of planning that he described the planning “as decision
making about the selection, the organization, and the sequencing of routines” (p. 111). If
planning can be described simply as coordinating many routines, then the development
and use of routines by teachers must be important to the planning process, which is in
turn, a quality of effective teachers. Hattie (2003) also discusses routines and the need for
teachers to have routines in order to be experts. Listed under the dimension of
Monitoring and Providing Feedback, Hattie (2003) determined that expert teachers are

10
more automatic than non-expert teachers. The difference between expert teachers and
experienced teachers in the area of automaticity is that expert teachers use “automaticity
so as to free working memory to deal with other more complex characteristics of the
situation, whereas experienced non-experts do not optimize the opportunities gained from
automaticity” (Hattie, 2003, p. 8). With this finding, the use of routines and how they
free a teacher are important to teacher effectiveness in planning. Expert teachers take the
time saved and put it into the act of teaching (Hattie, 2003).
Statement of the Problem
The problem investigated in this study is the lesson planning differences among
teachers. While it has been found that effective teachers matter in terms of student
success, and that key aspects of effectiveness are planning and the decisions made by a
teacher, there is a lack of understanding as to the differences in planning among teachers
and how to best impact teachers’ lesson planning.
Statement of Purpose
The purpose of the study was to determine which of the seven elements of
effective planning identified by Stronge (2007), teachers perceive as having the greatest
impact on student achievement. In addition, the study explored the similarities and
differences in teacher planning using the seven qualities of effective planning identified
by Stronge (2007) in order to understand what teachers think the important aspects of
planning for effectiveness are and if this differs depending on various descriptive data
including region, level taught, gender, and years’ experience.

11
Research Questions
1) Which of the following seven lesson planning elements do teachers perceive as
having the greatest impact on student achievement: Clear Lesson and Learning
Objectives, Creating Quality Assignments, Logically Structured Lessons,
Instructional Strategies, Timing, Learning Differences, and Developing Age and
Content Appropriate Lessons?
2) Which of the following seven lesson planning elements are reported by teachers as
being used and with what level of relative importance: Clear Lesson and Learning
Objectives, Creating Quality Assignments, Logically Structured Lessons,
Instructional Strategies, Timing, Learning Differences, and Developing Age and
Content Appropriate Lessons?
3) What aspects of creating a quality assignment do teachers perceive as having the
greatest impact on student achievement? What aspects of creating a quality
assignment do teachers use when planning?
4) What aspects of lesson structure do teachers perceive as having the greatest impact on
student achievement? What aspects of lesson structure do teachers use when
planning?
5) Is there a difference in teachers’ perceptions regarding which lesson planning
elements have the greatest impact on student achievement when considering: (a)
elementary school, middle school, or high school level; (b) content areas such as
science, social studies, language arts, mathematics; (c) region of the United States;
(d) rural, urban, or suburban areas; (e) years of experience; and (f) gender?

12
6) What method of lesson planning do teachers use most prominently? For teachers
who use formal written lesson plans, how many times per day do they reference the
written plans?
Significance of the Study
The results from this study could be used to inform those in education about this
particular aspect of teacher effectiveness. It might help identify what teachers perceive as
being important in the planning process as opposed to what the research states.
Additionally, the study could help administrators as they examine lesson plans, as they
discuss planning with teachers, and as they discuss time management with teachers. It
might impact the knowledge administrators have about planning to help focus more
attention on this aspect of the teaching profession. Finally, the study may shed light on
the disconnect between what the literature says concerning what teachers who plan
effectively should do and the reality of what teachers perceive are effective planning
strategies. This will help as administrators plan for staff development and making a
connection between research and practice.
Definitions of Key Terms
Assignments: Assignments are comprised of activities that students work on
independently after teaching has taken place. Students complete assignments in the
classroom.

13
Child-managed activity: This term differs from child-centered in this study and is
defined as an activity that allows the students or child to manage their own attention
(Cameron, Connor & Morrison, 2005).
Curriculum Standards: Also termed Curriculum Goals by some and defined as
part of the Curriculum designing process that is the result of answering the question
“What destination do you have in mind for learners as far as a particular curriculum or
subject is concerned” (Omstein & Hunkins, 2009, p. 225). Goals are derived from aims
and indicate “what a particular subject or educational program should teach students”
(Omstein & Hunkins, 2009, p.225).
Depth o f Knowledge: This pertains to the extent to which teachers require
students to “demonstrate mastery of knowledge in day-to-day classroom assignments or
assessment tasks” (Koh & Luke, 2009).
Instructional Strategies: Also referred to as Instructional Activities by some
researchers, these are the various choices educators have in determining what the students
could do or participate in to learn a concept (Danielson, 2007).
Planning: Clark and Yinger (1979) described planning as “a process of preparing
a framework for guiding teacher action, a process strongly oriented toward particular
action” (p. 9-10).
Planning Decisions: Peterson, Marx, and Clark (1978) defined planning decisions
as the decisions a teacher makes “prior to the act of teaching” (p. 418).

14
Routines: Yinger (1980) defined routines as mechanisms that a teacher uses to
“establish and regulate activities and to simplify planning” (p.l 11).
Scaffolding: Scaffolding refers to the teacher giving students help: not so much
as “to rob the child of his or her own initiative, and not too little so that a child got
frustrated by failure” (Bruner, 2000, p.). Scaffolding allows students to solve a problem
or reach a goal which would be beyond their abilities if not for the assistance (Mertzman,
Vierk, Kildahl, Wintheiser, Hung, & Goldstein, 2007).
Student Control: Student control refers to students having the opportunity to
determine the parameters of a task or assignment in class (Koh & Luke, 2009). Koh and
Luke (2009) give the following examples as areas where students might exercise some
control within classroom assignments: “determining the topics or questions to answer,
alternate procedures, tools and resources to use, length of a writing response, or
performance marking criteria” (p. 296).
Student Misconceptions: These are inaccurate ideas students have about the
subject matter they are to be taught, prior to the lesson or unit being taught. Teachers can
use a pre-assessment to determine students’ misconceptions about the topic and then plan
to help them see and understand this misconception during the teaching of the lesson or
unit (Stronge, 2007).
Timing: Timing in this paper, unless otherwise stated, refers to the teacher
planning in such a way that students’ time with the material is maximized which includes
scaffolding, discussions, reaching conclusions or applying what has been learned, taking

15
notes or writing about the experience, and replacing any materials used (Omstein &
Lasley, 2004).
Limitations and Delimitations of the Study
Limitations describe the characteristics of a study that may impact the
generalizability of findings, which are outside of the researcher’s control. Delimitations
describe the purposeful inclusionary or exclusionary decisions that limit the scope of the
study (http://www.clt.astate.edu/sdrake/Research/chapter_l .htm).
There are some limitations to this study to which the researcher has no control and
therefore must acknowledge before beginning.
1) The number of teachers choosing to respond to the survey. While it is hoped that
all the teachers will respond and with 100% effort, that aspect is not within the
researcher’s control.
2) The number of teachers from each subgroup who respond is not able to be
controlled. While the sample size and number of possible participants is elevated
to get as many responses as possible, which teachers choose to participate cannot
be controlled and may impact generalizability.
3) Determining which teachers receive the survey. Since a third party is sending out
the survey to a random sample of teachers, the researcher does not have control
over which teachers receive the survey. This is positive for the randomness of the
sample, as well as the researcher not impacting the sample; however, it may
impact generalizability.

16
4) All school districts and each school within that district have different policies
regarding lesson planning. This limitation can impact the study in terms of the
influence of these policies on teacher behaviors and perceptions in a systemic
manner.
5) The lesson planning training that the teachers received by their School of
Education and through staff development may vary among teachers included in
the study.
6) The researcher cannot control how the teachers plan or if the teachers in the study
plan at all. For the most part it is believed that teachers plan lessons ahead of
time; however, it is not outside the realm of possibility that a teacher might “wing
it” when it comes to planning. It is assumed on the researcher’s part that teachers
plan beforehand.
In addition to the limitations that exist, a few delimitations exist.
1) The biggest delimiter is the number of surveys to be distributed. This decision is
made and set by the researcher and the third party executes those decisions.
Hoping to get the best response rate, the researcher will set the number of surveys
sent out in hopes of having both a reasonable sample size and goodness of
sample.
2) The researcher also controls the number of surveys sent out to the subgroups. By
dividing the large sample into equal parts for the subgroups, it is hoped that close
to the same percentage will respond.

17
3) The survey created was rank ordered which forces the participants to make a
decision by ranking items. Rank ordering “represents an ordering of values of a
variable with no assumption of an equal interval between the values” (Gall, Gall,
& Borg, 2007, p. 132); therefore it will be unknown how strongly participants feel
about each item.
4) The aspects of effective teachers’ planning come exclusively from those stated in
Stronge’s (2007) book Qualities o f Effective Teachers. While a section is
included for participants to add other aspects they perceive as having an impact
on student achievement, they will not have the chance to rank order written-in
responses.
5) Participation in the study will be limited to teachers teaching in a K-12 setting in
public schools. Those in private or charter schools will not be included and this
may impact the generalizability of the results to those populations.

Chapter 2
Literature Review
Secretary of Education, Arne Duncan, said in a speech given at the U. S. Chapter
of Commerce’s Education and Workforce Summit (2009),
I believe that the quality of our education system says as much about the
long-term health of our economy as the stock market, the unemployment
rate and the size of the gross domestic product. That’s because the quality
of our work force and the intellectual breadth and depth of our future
leaders is directly related to the quality of education we provide today...
recognizing [that] America’s common agenda [is] to promote economic
security through education, (para. 2-3)
The educational system, therefore, is an important aspect of our country’s global success.
One way to improve the quality of the education system is to improve those who directly
impact the education of its children—teachers. As noted in How the World’s Best-
Performing School Systems Come out on Top, an international study comparing data from
the Organization for Economic Co-operation and Development’s (OECD) Programme for
International Student Assessment (PISA), “The quality of an education system cannot
exceed the quality of its teachers” (Barber & Mourshed, 2007, p. iii). Therefore, the need
for teachers to be effective in their craft is vital to student achievement, the educational
system, and the economy at large.
18
19
The review of related literature will focus on the need for effective teachers, what
qualities make a teacher effective, and finally, how effective teachers conduct lesson
planning. The chapter will include major reviews of the following key topics related to
the qualities of effective teachers and, more specifically, will examine aspects of lesson
planning that have been noted as used by effective teachers.
Importance of Teacher Effectiveness
The report “A Nation at Risk” by the National Commission on Excellence in
Education (1983) highlighted the need for accountability within the educational system
and started the nation’s movement to high standards. The report ushered in a new era in
education, the Age of Accountability (Stronge et al., 2007). In 2001 the No Child Left
Behind Act was signed into law, and established requirements for the standards and
assessment systems of states (United States Department of Education, 2001). As a result
of the accountability movement, the past three decades of reform have focused on the
development of standards, assessments to measure student achievement, and school
reporting to explain results (Stronge et al., 2007). Due to the focus on standards and
assessment practices, it has become apparent that many policy makers and funding
agencies, both public and private, believe that test scores are directly related to teaching
quality (Ding & Sherman, 2006; Kupermintz, 2003; Newton, Darling-Hammond, Haertel,
& Thomas, 2010). The public has also come to believe that in order to improve
education the quality of teachers must be upgraded (Johnson, 1997). Therefore, a lot of
pressure has been put on university Schools of Education and school districts to ensure
teachers are effective.

20
The research on teaching, and the urgency to upgrade teacher quality, first began
as a reaction to the reports by Coleman (1966) and Jencks (1972) which were interpreted
to say that neither schools nor teachers made a difference in student achievement (Porter
& Brophy, 1988). As a result of these reports, efforts were made to try and “teacher
proof’ the curriculums (Porter & Brophy, 1988, p. 74). The failed attempts at “teacher
proofing” the curriculum led to the discovery that in order to achieve true gains in
education, the system would need to work through teachers instead of trying to work
around them (Porter & Brophy, 1988). Nuthall (2005) said that research should first
“find out what kind of knowledge would be most useful for informing teachers thinking
and guiding their practice” (p. 900). By discovering this information, it is possible to
work through teachers in a meaningful manner to promote student achievement. This
sentiment also acknowledges what research has shown on the impact of teachers on
student achievement.
Variety of Teacher Effectiveness
As Darling-Hammond and Youngs (2002) stated there is a wide degree of variety
when it comes to effectiveness level in teachers. To elaborate on that statement, Nye,
Konstantopoulos, and Hedges (2004) found in their study that there are substantial
differences among teachers’ abilities to produce achievement gains in students.
Likewise, Hanushek, Kain, O’Brien, and Rivkin (2005) found variation in teacher
effectiveness, most of which was within a school as opposed to between schools. It is
clear that some teachers are more effective than others. The differences in effectiveness,
however, can have a startling impact on students. Determining a teacher’s effectiveness

21
can be a difficult proposition with the school culture being a nested system and the
extraordinarily large number of variables that impact students on a daily basis.
Impact of an Effective Teacher
Since the inception of accountability and testing in the world of education began,
efforts to evaluate teachers based on student achievement have become a primary focus
(Kuppermintz, 2003). This move has resulted in the growth of educational outcome
indicators (Meyer, 1996). While most schools and districts have yet to develop and
implement viable performance indicators (Meyer, 1996), value-added models have begun
to be used. Of the various value-added models used in the literature, a common
characteristic is that they measure the school performance or the school inputs using a
statistical regression model which includes many variables as possible in order to isolate
the contribution of schools from other sources of student achievement (Meyer, 1996).
One of the most talked about value added models is the Tennessee Value Added
Assessment System (TVAAS). A study using TVAAS, which uses a “statistical mixed
model methodology to enable multivariate, longitudinal analysis of student achievement
data” (Wright, Horn & Sanders, 1997, p 58), found that the most important factor
affecting student learning is the teacher. Specifically, the study by Wright et. al (1997)
examined the 1994-1995 Tennessee Comprehensive Assessment Program (TCAP) scores
across 5 subjects for students in grades 3-5. TCAP tests are given to students in grades 2-
8 each spring. Therefore student academic gain can be seen from year to year (Wright, et
al., 2007). This study conducted 30 analyses, 15 subject-grade analyses were done in two
different sets of school systems in Tennessee. Of the two sets of school systems, one

22
consisted of 30 East Tennessee school systems and the other had 24 Middle Tennessee
school systems. The results from the analysis showed that the teacher and the
achievement level for the student had the biggest impact on student achievement. In fact,
the teacher effect was highly significant in every analysis and has a “larger effect-size
than any other factor in 20 of 30 analyses” (p 61). The results of this large scale analysis
show that teachers make a difference.
Using the TVAAS, Sanders, Wright, and Langeuin (2008) conducted a study of
the impact of teacher effectiveness. They found that highly effective teachers are capable
of producing nearly three times the student achievement gains of low-performing
teachers. They also found that five above average teachers can overcome the deficit
reported for low socio-economic status. The study which looked at 5,300 math teachers
from Tennessee for grades 4-8 during the school year 2002-2003 through 2006-2007 used
a 2-way ANOVA to find that the differences among classrooms are primarily attributable
to the individual teacher. The study also found a significant positive effect in teacher
effectiveness when teachers moved from high poverty to lower poverty schools. This
result demonstrates that an effective teacher can be effective in multiple settings.
Another value-added study by Hanushek, Kain, O’Brien, and Rivkin in 2005
looked at the impact of teachers on student achievement. Using data from the Texas
Assessment of Academic Skills (TAAS) from the 1995-1996 school year to the 2000-
2001 school year, on students in grades 4-8 in Texas, they found that if a student is
placed with a teacher who is in the 85th percentile in their skill then students can be
expected to achieve 0.22 standard deviations above the achievement gains of those placed

23
with a median teacher. In order to try and circumvent problems with reliability and
validity, the researchers matched teachers and students using data from Texas Schools
Micropanel Data (TSMD). These data show that having an effective teacher has a
positive impact on student achievement. The results also show the possibility of an
achievement gap between students who consistently have effective teachers and those
who consistently do not have effective teachers.
Hattie (2003) provided a pie chart (Figure 1) which shows the variance attributed
to various influences on student achievement. This chart mimics what was found by
Wright et al. (1997) in that the student and the teacher have the biggest influence over
student achievement. The chart is a compilation of many studies on the subject of student
achievement variance using Hierarchical Linear Modeling (HLM).
Figure 1- The major sources of variance in a student’s achievement. Adapted from Hattie 2003

24
Figure 1 shows that while students themselves account for the greatest amount of
variance in achievement, teachers are the next biggest influence (Hattie, 2003) and are
the largest source of varience that the schools have control over. As Hattie (2003) stated
the answer “lies in the person who gently closes the classroom door and performs the
teaching act—the person who puts into place the end effects o f so many policies, who
interprets these policies, and who is alone with students during their 15,000 hours of
schooling” (p. 2-3).
Debating Teacher Effectiveness
While many studies exist that promote the link between teacher effectiveness and
student achievement, there are others which debate how much the teacher effectiveness
literature can be trusted to give a complete picture of characteristics of effective teachers
(Brophy, 1986; Porter & Brophy, 1988). Concerns regarding the use of value added
measures abound. One issue critics have with value added models is that they seem to tie
quality to a test score (Hill, 2009). The belief is that quality needs to be determined by
more than one factor and include items such as: emotional support, instructional quality,
and quantity of exposure to subject matter for example (Hill, 2009).
The value-added model has been criticized for its “lack of external review, lack of
transparency, issues with missing data, and the lack of consideration of student
background variables” (Eckert & Dabrowski, 2010, p. 89). In fact, there is little
published research findings from TVAAS that specifically pertain to teacher
effectiveness, which Kuppermitz (2003) found puzzling. Likewise, TVAAS findings
have not been widely published, and those that have did not use the entire TVAAS model

25
and all these concerns lead to debate over the quality of the model created. As Meyer
(1996) stated, the most difficult part of creating a high-quality indicator system is
collecting all the data that is required. This missing data can lead to the value-added
indicator being biased. Kuppermintz (2003) agreed that these validity and reliability
concerns have created controversy when tied to teacher evaluation and teacher pay.
What Makes Teachers Effective?
Conceptual Frameworks for Effective Teachers
Although there are different opinions regarding how the teacher effectiveness data
should be interpreted and used, there is agreement that effective teachers make a
difference (Goldhaber, 2002; Harris, 2009; Hill, 2009; Milanowski, 2004; Odden,
Borman & Fermanich, 2004; Sanders et. al, 2008; Wright et. al, 1997). Therefore, we
need to “ensure that this greatest influence is optimized to have powerful and
sensationally positive effects on the learner” (Hattie, 2003, p 3). While there are an
endless number of characteristics and methods combinations teachers can use to achieve
results, there are behaviors and techniques that emerge in the evaluation of effective
teachers (Polk, 2006). In order to optimize this knowledge and to make the best use of
the research, it is important to determine what behaviors and techniques make some
teachers more effective than others.
Various researchers have created frameworks for effective teaching. While each
is different in its scope, all support research-based characteristics and practices of
effective teachers. The importance of having a framework was noted by Danielson
(1996, 2007) when she made the analogy to a road map. Since teaching is complex,

26
having a road map through the terrain can help teachers better meet their goals
(Danielson 1996,2007).
Davis & Thomas (1989)
Davis and Thomas (1989) wrote the book Effective Schools and Effective
Teachers for teachers, and used the available effective-schooling research as the basis for
the framework. The framework set forth in the book divides effective teaching into three
behaviors: behaviors that increase academic engagement, behaviors relating to the
organizing and structuring of learning, and behaviors that deal with interpersonal
relationships.
• Academic engagement behaviors include: instructional pacing and timing,
teacher expectations for students and self, and classroom management.
• Organizing and Structuring Learning behaviors include: orienting students for
new learning, increasing clarity, developing efficient routines, ensuring high
success rates, wait time, and monitoring student progress.
• Building Interpersonal relationships includes: having empathy, respect, and
genuineness; expressing interest and enthusiasm; and listening to students.
The three behaviors working together lead to effective teaching.
Ornstein & Lasley (2004)
Omstein and Lasley (2004) authored a pre-service teacher textbook which divides
effective teaching into two parts: the art and the science of teaching. The framework that
they provide is a result of the extent research available on effective teaching strategies.

27
While the authors state that the art of teaching features are more difficult to measure due
to the fact that it often involves attitudes and behaviors; which are not easily observable,
it is important to include. Effective teachers are masters at both the art and science of
teaching.
• The Science o f Teaching includes developing instructional objectives, planning
for instruction, grouping students for instruction, assessing and evaluating student
work
• The Art o f Teaching involves finding motivating factors for students, recognizing,
students’ individuality with their own set of needs, and looking at a student’s self
esteem and the impact it has on learning.
Danielson (2007)
Currently, the Framework for Teaching (Danielson, 1996,2007) is the basis on
which several district-level teacher evaluation systems are being based (Gallagher, 2004;
Holtzapple, 2001, 2002; Kimball, White, Milanowski, and Borman, 2004; Milanowski,
2004). Danielson (2007) describes the framework as “those aspects of a teacher’s
responsibilities that have been documented through empirical studies and theoretical
research as promoting improved student learning” (p. 1). The Framework consists of 22
components clustered into the following 4 domains of teaching responsibility:
• Planning and Preparing, including components such as knowledge of content
and pedagogy, knowledge of students, setting instructional outcomes,

28
demonstrating knowledge of resources, designing coherent instruction, and
designing student assessments.
• The Classroom Environment, which emphasizes creating an environment of
respect and rapport, by establishing a culture for learning, managing classroom
procedures, managing student behavior, and organizing physical space.
• Instruction, including communicating with students, using questioning and
discussion techniques, engaging students in learning, using assessment in
instruction, and demonstrating flexibility and responsiveness.
• Professional Responsibilities contains aspects of being a professional by
reflecting on teaching, maintaining accurate records, communicating with
families, participating in a professional community, growing and developing
professionally, showing professionalism.
Danielson’s framework encompasses many of the qualities Hattie (2003; 2009)
found to be impactful on student achievement.
Marzano (2007)
In the book The Art and Science o f Teaching: A Comprehensive Framework for
Effective Instruction, Marzano, proposes a framework around ten essential design
questions. The questions are then unpacked and the research behind the strategies is
given. This would be the “science” of teaching. However, research will never be able to
identify the instructional strategies that work in every class and in every situation; the
teacher must then be the artist and paint the picture of instruction for the students. As
Marzano stated, “The best research can do is tell us which strategies have a good chance

29
(i.e. high probability) of working well with students. Individual classroom teachers must
determine which strategies to employ with the right students at the right time” (p. 5). By
correctly implementing the science and art of teaching there will be a positive effect on
students. This can be difficult and the artist must understand much about their craft prior
to implementation. This framework takes into consideration the research and ways to
implement the instructional strategies in a classroom.
• What will I do to establish and communicate learning goals, track student
progress, and celebrate success? Includes setting and communicating learning
goals, tracking student progress and celebrating success, feedback and clear
learning goals, formative assessment—more formative assessment higher effect
size, reinforcing effort.
• What will I do to help students effectively interact with new knowledge? Includes
creating critical-input experiences which help students to actively process content
and using a comprehensive approach to teaching including: previewing, macro
strategies, and various instructional strategies such as summarizing and note
taking, nonlinguistic representations, questioning, reflection on the student’s part,
cooperative learning.
• What will I do to help students practice and deepen their understanding o f new
knowledge? Includes schema development, development of procedural
knowledge, development of declarative knowledge, and homework.
30
• What will I do to help students generate and test hypotheses about new
knowledge? Includes problem based learning and engaging students in their
learning.
• What will I do to engage students? Includes pacing, teacher enthusiasm and
intensity, physical activity, making information interesting and unusual, using
questioning to apply mild pressure, having students become individually invested,
creating mild controversy and competition.
• What will 1 do to establish or maintain classroom rules and procedures? Includes
organizing classroom for effective teaching and learning and interacting with
students about classroom rules and procedures.
• What will I do to recognize and acknowledge adherence and lack o f adherence to
classroom rules and procedures? Includes use of reinforcement, punishment, and
no immediate consequence, using verbal and non-verbal acknowledgement, being
proactive, and designing and overall discipline plan.
• What will I do to establish and maintain effective relationships with students?
“Includes developing a relationship with students that shows concern and
cooperation but also balancing it with the appropriate level of dominance which is
defined as guidance and control” (p. 153).
• What will I do to communicate high expectations fo r all students? Includes
teacher beliefs about student achievement and how beliefs impact actions and
ultimately student success, discusses affective tone, and quality of interactions
with students

31
• What will I do to develop effective lessons organized into a cohesive unit?
Includes discussion of organizing a unit of instruction and various lessons,
involves knowledge of the craft of teaching, using a variety of instructional
strategies depending on goal/objective of the lesson.
Stronge (2007)
Numerous teacher evaluation systems in the United States and internationally are
based on a framework developed by Stronge (2007). Stronge’s (2007) framework on
understanding teacher effectiveness is based on a meta-review of the existing literature on
teacher effectiveness. The framework consists of six teacher qualities including:
• Prerequisites for Effective Teaching, including characteristics such as a teacher’s
educational coursework, verbal ability, certification, content knowledge, and
teaching experience.
• Teacher as a Person, where the emphasis is on the teacher’s non-academic
characteristics such as caring, fairness & respect, interactions with students,
enthusiasm & motivation, attitude toward teaching, and reflective practice.
• Classroom Management and Organization, with the purpose of establishing a
classroom environment that is conducive to teaching and learning including
organization and discipline.
• Planning and Organizing fo r Instruction, including the practices maximizing
instructional time, understanding the importance of instruction, communicating
expectations for student achievement, and planning for instructional purposes.
32
• Implementing Instruction, including the practices of using and adapting
instructional strategies with regards to student need, understanding the
complexities of teaching, using questioning techniques and supporting student
engagement.
• Monitoring Student Progress and Potential, such as using homework and ongoing
assessment to gamer data regarding student progress, providing students with
meaningful feedback, and using assessments as a means to inform instructional
decisions.
Within Stronge’s (2007) framework a very comprehensive picture of effective
teaching is painted. In comparing Stronge’s (2007) framework with the others, the
framework is a good compilation of what other researchers have found on effective
teachers.
Looking at Table 1 there are many attributes that play a role in defining a teacher
as effective. Examining the attributes that overlap with four of the five models, a pattern
begins to emerge. The attributes: Classroom Management, Organization, Discipline o f
Students, Communicating Expectations, Questioning, Student Engagement, Monitoring
Student Progress, and Using Assessments to Address Student Needs and Abilities can all
be planned before the teacher begins to implement instruction. As expected then, another
attribute that four of the five models have in common is Instructional Planning. As a
teacher plans for instruction and lessons, the other attributes must be taken into
consideration, and can be addressed in the way a teacher plans. Even the Teacher as a
Person qualities of: Respect and Fairness, Interactions with Students, and Enthusiasm

33
can be seen or impacted by the teacher’s instructional planning. It is important to focus
on Instructional Planning, then, in order to determine how teachers plan and how they
should plan to be most effective.

Table 1
Comparison o f Teacher Effectiveness Frameworks
Stronge
Davis
&
Thom
as
Orns
tein
&
Lasl
ey
Dan
iels
on
Mar
zano
Prerequisites for Effective TeachingVerbal Ability................................................ • • •Knowledge of Teaching and Learning.......... •Certification Status.......................................Content Knowledge...................................... • •Teaching Experience.....................................Teacher as a PersonCaring............................................................. • •Fairness and Respect...................................... • • • •Interactions with Students............................. • • •Enthusiasm.................................................... • • •Motivation.....................................................Dedication to Teaching................................. •Reflective Practice......................................... • • •Classroom Management &OrganizationClassroom Management................................ • • • •Organization................................................... • • • •Discipline of Students.................................... • • •Planning & Organizing for InstructionMaximizing Instruction Time........................ • •Importance of Instruction............................... • •Communicating expectations........................ • • •Instructional Planning.................................... • • •Implementing InstructionInstructional Strategies.................................. • •Complexity.................................................... • •Questioning................................................... • • •Student Engagement...................................... • • •Monitoring Student Progress & PotentialHomework..................................................... • •Monitoring Student Progress......................... • • • •Using assessments to address student needs andabilities.................................................... • • •

35
Effective Teachers: Lesson Planning
Formal lesson planning is a legitimate and necessary instructional activity
according to most educators and researchers (Omstein & Lasley, 2004). It has been
studied extensively by those in education most likely due to the fact that it can be,
“prescribed, categorized, and classified” (Omstein & Lasley, 2004, p. 147). However, the
term lesson planning is one that often gets misinterpreted as it can be used in many ways.
Jalongo, Reig, & Helterbran (2007) define it as the cognitive process of thinking about
what will happen in the classroom during a lesson. Omstein & Lasley (2004) divide
lesson planning into two parts: formal planning and mental planning. Formal planning is
“structured and task oriented” while mental planning is the “teacher’s spontaneous
response to events in the classroom” (Omstein & Lasley, 2004, p. 147). While mental
planning is necessary, it is very challenging to measure as it often goes unseen and
unmentioned when planning is discussed. However, formal planning is what is most
commonly associated when the term lesson planning is used. This involves the
consideration of multiple aspects of the classroom, ranging from methods to engage the
students in the material to the different ways students may react. Although there are
many different kinds of planning teachers do which serve many functions in the
classroom, daily lesson planning was identified as one of the most important types of
planning (Clark & Yinger, 1979). In the search for ways to improve classroom
instruction, researchers have not based their prototypes of effective planning behaviors on
effective practice, but instead have focused on the planning behaviors of effective
teachers, which is a logical conclusion (Jasper, 1986).

36
In order for an effective teacher to excel in planning and preparation, they must
“design instruction that reflects an understanding of the disciplines they teach—the
important concepts and principles within that content, and how the different elements
relate to one another and those in other disciplines” (Danielson, 2007, p. 27). The ability
to transition between the various related disciplines makes the task of designing a lesson
more coherent. Another quality of instructional effectiveness is the ability to design
coherent instruction and sound assessment in terms of the approach to topics which are
appropriate to the developmental range of students in the class (Danielson, 2007; Stronge,
2002, 2007). In addition Davis and Thomas (1989) make the claim that effective teachers
are able to increase clarity in their coherent instruction and assessment. Increasing the
clarity and having coherent instruction helps meet the needs of all students as it ensures
logical bonds between concepts, student understanding, and student focus for students at
any level. Stronge (2002, 2007) found that effective teachers plan enrichment and
remediation opportunities for students and that they use their familiarity of students’ prior
knowledge as well as learning styles to provide “effective vehicles for instruction” (p.
38). Danielson (2007) also found that effective teachers understand their students’
backgrounds, interests, and skills, which helps to plan instruction effectively for all
learners.
Similar to the findings of Danielson (2007) and Stronge (2002, 2007) regarding
qualities of effective teachers in planning, McEwan (2002) stated:
[Highly effective teachers] are able to articulate the objective(s) of the
lesson, relate the current lesson to past and future lessons, and take into

37
account the needs of their students and the nature of what they want to
teach. Skillful teachers include components in their lessons that will
attract their students’ interest and keep them engaged. They are able to
mentally walk through their lesson presentations beforehand, anticipating
where problems of understanding or organization might occur and making
adjustments up until the last minute, (p. 87-88)
Effective teachers must be effective planners as the decisions made by the teacher
directly impact each individual in the classroom on a daily basis.
Planning and Preparing for Instruction
In Stronge’s book Qualities o f an Effective Teachers (2007), Planning and
Organizing for Instruction is one of the six qualities within the framework for effective
teachers. Looking more closely at Planning and Organizing for Instruction, Stronge
(2007) identifies 7 elements that are included during instructional planning by effective
teachers: Clear Lesson and Learning Objectives, Creating Quality Assignments,
Logically Structured Lessons, Instructional Strategies including use of organizers,
Timing, Learning Differences, and developing age and content appropriate plans. In this
section, each of these 7 elements will be examined independently; however, they often
overlap and link together. Effective teachers should therefore use these elements together
and constantly to ensure their lesson planning is addressing each of them not only
independently but also cohesively.

38
Clear Lesson and Learning Objectives
Among the many decisions a teacher must make, research indicates that planning
for effective teaching includes identifying clear lesson objectives (Stronge, 2002, 2007).
A lesson plan therefore must have an objective to be effective. Objectives defined by
Omstein and Lasley (2004) are descriptions of what is to take place at the classroom
level; they specify the content and sometimes the level of proficiency to be met. Using
instructional objectives helps the teacher focus on what students should know at the end
of the lesson plan and also benefits students by letting them know what is expected of
them (Omstein & Lasley, 2004). Instructional objectives serve as a road map for both
teachers and students as they help teachers plan what they are going to teach and when
they are going to teach it (Omstein & Lasley, 2004). Therefore, it is imperative that the
road map be as clear as possible and the instructional outcomes stated in terms of student
learning rather than student activity (Danielson, 2007).
As teachers begin planning, more than half begin with the setting of goals or
objectives (Koeller & Thompson, 1980). As the starting point, the objectives need to be
clear to ensure the rest of the planning process has grounding. As Bain and Jacobs
(1990) found in their study of 49 first grade teachers whose classes made the greatest
gains from the Stanford Achievement Test at the end of kindergarten to the Stanford
Primary Achievement Test at the end of 1st grade, the effective teachers shared certain
characteristics including providing clear and focused instruction. This clear instruction
resulted from having Clear lesson and learning objectives. The teacher must be clear in
his or her mind about what the objective of the lesson is and must be able to clearly

39
articulate and present that objective to students. Rosenshine (1986) conducted a review
of the available research on effective teaching and found that a pattern emerged which
began with “a short statement of goals” (p.60). This short statement clarifies for the
teacher as well as students what they should leam during the lesson. It helps to focus the
subsequent behaviors and actions, so that everyone is working toward the same
understood goal. Additionally, Jones, Jones, and Vermette (2011) found that a common
pitfall in lesson planning for novice teachers is the learning objective is unclear. The
study compiled three years of data on pre-service teachers from a secondary methods
education course. Nearly 500 units of teaching were used to gamer these results. The
lack of a clear objective left teachers attempting to teach too much information and put
them in a time crunch. As a result of not having a clear end in mind, the novice teachers
spent most of the time lecturing students on useless facts. This left both the students and
the teacher frustrated and confused. The study found that state standards provide a good
place to start in determining what to teach, but it is important to have a focused learning
objective that is clear to both the teacher and students. This clarity of the objective will
help educators avoid this instructional trap. These results show the importance of taking
the standards and breaking them down into smaller goals and objectives.
A study by Zahorik, Halback, Ehrle, and Molnar (2003) found what students miss
out on when the teacher does not have clear lesson objectives. In the study of 26
elementary school teachers who taught in classrooms with a student-teacher ratio of 15:1
for at least 2 years, they found that effective teachers focus their goals on the basic
knowledge and skills. This allows them plenty of time for individualized instruction.
40
The study found that effective teachers’ students scored 21.8 points above the mean and
ineffective teachers’ students scored 11.0 points below the mean when compared with all
students in the same program with the same class size. The difference was in the focus
on instruction. Within the group of ineffective teachers, two prominent groups could be
formed; the disinclined and the disarmed. The disinclined teachers rejected the teaching
methods of the effective teachers creating a student-focused atmosphere; which led to
little teaching of basic skills and little time for individual student attention. The disarmed
teachers believed in the importance of basic skills, but their lack of management skills
often caused them to lose focus and teach lessons with “overly long introductions,
awkward transitions, laborious explanations, and unproductive lesson diversions” (p. 77).
This lack of focus on the lesson and learning objective resulted in less time on instruction
and limited individualized instruction. Creating focused lesson and learning objectives
helps the teacher build a strong lesson by guiding what is to be taught, but also by
ensuring both students and teacher arrive at the destination.
It is difficult to formulate answers to the rationale and purpose of the lesson
without first clearly identifying objectives (Lambert, 1988); without a rationale or
purpose, a teacher is lost in a sea of information, which leaves both the teacher and
students frustrated and confused. Clarity can often be difficult to determine in the case of
teacher effectiveness because teacher clarity is a function of student understanding (Polk,
2006). Therefore during the planning process it is necessary for teachers to produce
Clear lesson and learning objectives. This will help them to focus the rest of their
planning and help produce student understanding.

41
Some important findings from research on effective teaching in the area of Clear
Lessons and Learning Objectives are:
• Effective teachers provided clear and focused instruction (Bain & Jacobs, 1990)
• Effective teachers begin with a short statement of goals (Rosenshine, 1986)
• One of the most common lesson planning pitfalls of novice (pre-service) teachers
is the learning objective is unclear (Jones, Jones, & Vermette, 2011)
• Effective teachers have a clear focus on content to be taught and how it is taught
(Zahorik et. al, 2003).
Creating Quality Assignments
While beginning lesson planning with clear learning objectives is a great start for
effective teaching, it is only the first step. What is produced as a result of the clear and
focused goals is equally important. Creating Quality Assignments is another
characteristic of an effective teachers’ lesson planning. Effective teachers recognize the
assignment is just as important as the objective as it is the means to the end.
A qualitative study by Wharton-McDonald, Pressley, and Hampston (1998) which
used observation, interviews, and artifacts to study 9 first grade literacy teachers, who
were assigned the rating of high, middle, or low based on the reading achievement,
writing achievement, and engagement of their students, found that high achieving
teachers were able to integrate many goals into a single lesson. These teachers were able
to integrate multiple goals because they planned for them. While this seems to be in
contrast with the idea that effective teachers have clear goals and ineffective teachers try

42
to include too much information in a lesson, this ability to integrate multiple goals may
come in the form of connecting across the curriculum. Therefore, if teachers have Clear
lesson and learning objectives for various skills, they can meet many in a single lesson.
As Pressley, Wharton-McDonald, Allington, Block, Morrow, Tracey, Baker, Brooks,
Cronin, Nelson, and Woo (1998) found in their study of characteristics of effective
teachers, the most effective teachers used strong connections across the curriculum. This
study included 5 teams of researchers observing literacy instruction in 28 first-grade
classrooms across 5 states. The 30 teachers were identified for observation from
administrators who noted them as outstanding or typical. From this pool, the researchers
selected the most and least effective teachers and further analyzed their instruction,
finding that the most effective of the group had strong curricular connections. Using
clear objectives and curricular connections the effective teachers were able to produce
quality assignments for their classrooms. As both the afore mentioned studies found,
effective teachers had classrooms with high quality reading and writing experiences as
well as an intense involvement of students in literacy activities (Pressley et. al, 1998;
Wharton-McDonald et. al, 1998). The well-developed objectives and quality
assignments led to academic engagement for students (Pressley et. al, 1998), which in
turn can produce student achievement.
The idea that clear objectives, followed by quality assignments, leads to student
achievement, should make sense. Clare (2001) found a significant relationship between
the quality of classroom assignments and the quality of student work. Therefore, the
quality of the assignment impacts student achievement. The qualitative study which took

43
place over a 2 year time frame collected data from elementary and middle school
teachers. In all, 24 participants completed the Language Arts focused study which
examined using assignments and student work as indicators of classroom practice. Koh
and Luke (2009) found similar results in their quantitative study of teachers in Singapore,
finding a correlation between the quality of teachers’ assignment tasks and student work.
The findings were significant at both the 5* and 9th grade level. They found that the
correlations were moderate to high indicating that the quality of the assignment impacted
the quality of student work. However, when looking at most lessons developed for the
classroom, Clare (2001) found that teachers’ assignments were fairly basic in the areas of
cognitive challenge and alignment of goals and assessment. This illuminates the need for
teachers to create clear objectives followed by quality assignments, so that student
achievement will follow. Care must be taken, however, when examining the results of
Clare’s (2001) study; while a statistically significant association between quality of
classroom assignments and quality of student work was found, it is important to
understand that the analysis did not “directly test for direction of influence, or a causal
relation,” between the two (p. 27).
Creating quality assignments and lessons can take time and be a challenge.
Teachers attempting to create these types of lessons need to consider many factors in
their decision making process. Clare (2001) found, after conducting an exploratory factor
analyses to reduce the data and examine the underlying dimensions that two dimensions
came forward from the observational data: constructivist practice and quality of lesson
implementation. The first factor measured aspects of the data such as: the quality of

44
classroom discussions, level of student participation in classroom discussions, cognitive
challenge of the lesson activities, and quality of instructional feedback. The second
factor measured qualities such as: classroom management, the level of student
engagement in the lesson, the clarity of the learning goals, and alignment of the goals and
lesson activities. After further analysis Clare (2001) found that the first observation
factor, constructivist practice was associated with the quality of classroom assignments
(r=0.57, p<0.01) (p.27). In contrast, the quality of lesson implementation did not
significantly associate with classroom assignments (r=0.03) (p. 27). This data suggests
that while planning, teachers need to start with a clear objective and then, when planning
the lesson activity and assignments, focus on the quality of the elements and not the
implementation.
Koh and Luke (2009) collected 4,097 samples of teacher’s assignments or
assessment tasks for students from Grade 5 and Grade 9 lessons in English, social studies,
mathematics, and science in 59 Singapore schools. The researchers used discriminant
function analyses on the authentic intellectual quality criteria to examine the quality of
teachers’ assignment tasks between the four subject areas for both grade levels. The
findings at Grade 5 were significant with two discriminant functions accounting for 67%
and 24% of the variance, respectively. Function 1 consisted of: connections to the real
world beyond the classroom, knowledge criticism, knowledge manipulation, depth of
knowledge, and student control. Function 2 consisted of: supportive task framing
explicit performance standards/marking criteria, and sustained writing. Based on these
results, Koh and Luke (2009) found that the differences between social studies and the

45
other three subject areas were significant on “connections to the real world beyond the
classroom, student control, and sustained writing” (p. 300). In Grade 9 it was found that
English assessments demanded students to apply and generate knowledge that were
related to the real world, social studies tasks required students to engage in more critique
of knowledge and sustained writing as well as giving students control over the tasks.
These results give educators at each grade level something to think about when creating
assignments for students. Teachers need to ensure that the assignment aligns with the
goal and outcome, and that it is appropriate for the developmental age of students in the
class.
Research findings about Creating Quality Assignments include:
• In quality classrooms there were connections made across the curriculum and that
on a daily basis there was an intense involvement of literacy activities with
academic engagement Pressley et. al (1998).
• Highly qualified teachers integrate many goals into a single lesson and that highly
qualified classrooms are filled with high quality reading and writing experiences.
Wharton-McDonald et. al (1998).
• There is a relationship between quality of classroom assignments and student
work (Clare 2001; Koh & Luke 2009).
• The qualities of the elements in the activity have more impact than the
implementation (Clare, 2001).
• When planning activities, different subjects need different types of intellectual
quality (Koh & Luke, 2009).

46
Logically Structured Lessons
Lambert (1988) stated, the best objectives of teachers and students are worthless
if they are not properly implemented—therefore “the skillful orchestration of the
objectives, strategies, materials, and equipment and the careful organization,
development ,and sequencing of the lesson are absolutely crucial to successful teaching”
(p. 4). Zahorik et al. (2003) agreed, finding that carefully planned activities had clear
goals and a logical structure with a step-by-step content progression. Davis and Thomas
(1989) emphasized logically structuring lessons because “organizing and structuring
teaching activities to improve learning is not independent of maintaining high academic
engagement” (p 132).
Sequence. Sequencing is an important aspect of logically structuring lessons.
The teacher sets students up for success by identifying a sequence and ensuring the
knowledge gained is based in grounded ideas and building from that point, which, in their
review of extent research, Good and Brophy (2003), found effective teaching requires
that teachers plan sequences of lessons and do not plan in isolation. Jones et al. (2011)
found many novice teachers do not show evidence of idea development in their lesson
planning. A lack of sequential planning then causes students to be taught concepts in
isolation which leaves students to try and connect ideas and form understanding on their
own. Students may then develop misconceptions and misunderstandings about how
concepts relate.
In addition to examining the sequencing of lessons, effective teachers need to be
flexible when the sequence must be altered. Wharton-McDonald et al. (1998) found that

47
high-achieving teachers were skilled at incorporating mini-lessons into on-going lessons
as opportunities came around. This small adaptation of sequence made by the teacher
can positively impact student achievement. Similarly, Pressley et al. (1998) found that
the most effective teachers used “opportunistic teaching and re-teaching.. .with the
teacher consistently monitoring students as they read and wrote and offering mini
lessons” (p. 15). Pressley et al. (1998) also found that, within teacher planning, the most
effective classrooms had a balance of skill instruction thus sequencing skills can have
consequences on student achievement.
In addition to ensuring that multiple lessons are sequenced appropriately, it is also
important that components of individual lessons are sequenced appropriately. This gives
order and familiarity to students as they know what to expect during the lesson. Having a
sequential lesson also ensures that all aspects of the lesson are covered and in order.
Omstein and Lasley (2004) noted two different views for lesson sequencing depending
on the lesson objective: the transmission view and the constructivist view. The
transmission view can be used when the teacher’s goal is to teach discrete processes; it
follows a typical sequence of “explanations and lectures, demonstrations and
experiments, questioning to check for understanding, and practice and drill” (p. 174).
Within the first step, explanations and lectures, it is important for the teacher to follow a
planned sequence which will minimize diversions or tangential discussions (Omstein &
Lasley, 2004). In addition, during a lecture explanations of concepts should be included
in the proper place to maintain the sequence of knowledge building discussed previously.

48
Rosenshine (1986) stated that researchers have found that when effective teachers teach
concepts and skills explicitly they:
• Begin a lesson with a short statement of goals;
• Begin a lesson with a short review of previous, prerequisite learning;
• Present new material in small steps, with student practice after each step;
• Give clear and detailed instructions and explanations;
• Provide active practice for all students;
• Ask many questions, check for student understanding, and obtain responses from
all students;
• Guide students during initial practice;
• Provide systematic feedback and corrections;
• Provide explicit instruction and practice for seatwork exercises and, where
necessary, monitor students during seatwork; and
• Continue practice until students are independent and confident (p. 61-62).
Similarly, Zahorik et al. (2003) found that the “more effective teachers’ primary
teaching method was explicit, step-by-step instruction” (p. 76). This allowed the teacher
to give clear directions, explain concepts in a logical manner, use modeling of the
concepts, provide feedback, and adapt the information as necessary.
The constructivist view is used when students are co-creating concepts with the
teacher (Omstein & Lasley, 2004). The different nature of this type of lessons requires a
different sequence for the lesson presentation. The constructivist view according to

49
Omstein and Lasley (2004), needs to follow a process of “present new information within
the context of prior knowledge and previously learned material, allow students to repeat
learning tasks to cement them in memory, use mnemonics that can significantly increase
the memory of content, assign students active, hands-on tasks that require them to
investigate, analyze, and solve problems using real world applications, allow students to
use multiple ways to demonstrate learning, [and] provide ways for student to engage in
metacognitive learning, to think about how they think, (p. 176). While the constructivist
view differs from the transmission view in purpose and sequence, a quality they have in
common is that the sequence of building knowledge from a base is consistent. Effective
teachers know when to teach from a transmission view and when to teach from a
constructivist view (Omstein & Lasley, 2004).
Alignment Alignment goes hand-in-hand with sequencing. It is important for
lesson planning to be sequential, and within the sequence there must be alignment in all
aspects—particularly the learning objective, activity, and evaluation. This alignment
ensures that students are doing activities which support the learning objective and are
being evaluated on the same learning objective. A study in 2005 by Panasuk and Todd
examining 261 lesson plans from 39 teachers in urban low-performing middle schools in
New England found that teachers show their “skillfulness in planning when they use
varied approaches and lesson components focus on lesson coherency” (p. 230). Using
factor analysis they found that lesson coherency in design was important in determining
the effectiveness of planning (Panasuk & Todd, 2005). Looking at the final step in lesson
planning, a written lesson plan, DiPaola and Hoy (2008) note that alignment can be seen

50
between standard/objective, activity, and evaluation. This alignment between lesson
segments is important for the overall coherency of the lesson. From the objectives to the
variety of activities compiled in the plan, a leader can infer a teacher’s coherency in
lesson design and the variety of strategies being used in the classroom.
While alignment can be found within a written lesson plan, it does not speak to
the quality of the lesson or its component parts. Clare (2001) found in her study of lesson
planning that most planned lessons received a 2 rating on a 1-4 scale, especially with
regard to alignment of the teachers’ goals with their grading criteria. This lack of
alignment may cause some evaluation issues with reliability and validity. To understand
the importance of alignment, Wang, Haertel, and Walberg (1993a) conducted a study
which found that Design and Delivery of Curriculum and Instruction, which includes,
alignment among goals, contents, instruction, assignments, and evaluation, yielded
moderate benefits to student learning. The study which encompassed the use of three
methods of analysis—content analyses, expert ratings, and meta-analyses—used data
collected from 61 research experts, 91 meta-analyses, and 179 handbook chapters and
narrative reviews and used the measure of academic achievement as student learning.
While moderate benefits may not be staggering proof of the importance of alignment, it
shows how a small change in lesson plan thinking can make an impact.
Findings for Logically Structured Lessons include:
• Lessons should be planned sequentially and not in isolation (Good & Brophy,
2003).

51
• There should be a step-by-step process within lesson planning and there should be
evidence of developing ideas for students (Zahorik, 2003; Wang et al., 1993a;
Pressley et al. 1998; Jones et al., 2011).
• There should be a balance of skill instruction (Pressley et al., 1998).
• Most teacher lessons are weak in the area of alignment of teachers’ goals and
grading criteria (Clare, 2001).
• Alignment between goals and classroom activities yielded moderate benefits to
learning (Wang et al., 1993a).
• Lesson coherency is important in determining the effectiveness of planning
(Panasuk & Todd, 2005).
Instructional Strategies
Instructional strategies refer to the type of instruction used by the teacher teaching
students a concept. The teaching activities are usually utilitarian, versatile, and finite in
scope with respect to the intended outcome (Gareis, 2007). In addition, the activities
prompt student engagement and learning and should be used within a teaching model
(Gareis, 2007). Effective teachers use a variety of instructional strategies (Stronge, 2007;
Tomlinson & McTighe, 2006) during instruction. When a teacher correctly and adeptly
uses a variety of instructional strategies, lessons and tasks become more engaging to
learners (Tomlinson & McTighe, 2006). Therefore, teachers must find a balance between
practicing, drilling, lecturing, problem solving, and questioning, and match how they
teach the intended learning outcome (Omstein & Lasley, 2004; Pressley et. al, 1988). A
study by Johnson (1997), which included 63 semi-structured interviews with school

52
board members, principals, and teachers, found that both principals (90%) and teachers
(94%) believe that effective teachers must carefully plan instructional strategies. While
this study was looking at what the groups believed to be traits/characteristics of effective
teachers, the percentage of administrators and teachers that place an emphasis on
planning instructional strategies is important to note.
Wang et al. (1993a) found that different modes of instruction produce different
learning outcomes. Therefore it is important to ensure alignment between the learning
outcome and the instructional strategy employed by the teacher. A meta-analysis by
Marzano, Pickering, and Pollock (2001) had the goal of identifying instructional
strategies that have a high probability of enhancing student achievement for all students
in any grade level and across all subject areas. The nine categories of instructional
strategies that affect student achievement were found to be identifying similarities and
differences, summarizing and note taking, reinforcing effort and providing recognition,
homework and practice, nonlinguistic representations, cooperative learning, setting
objectives and providing feedback, generating and testing hypotheses, and questions,
cues, and advance organizers (Marzano et al., 2001). The range for effect size for these
instructional strategies is from 1.61 to 0.59. The authors remind us to look at these effect
sizes carefully as they are an average effect size from the studies examined. In addition
they call for more research on the effects of instructional strategies on specific types of
students in specific situations and with specific content. While there is little research on
such subjects, what is known is that the ‘‘unexamined use of instructional strategies might
produce some unintended negative consequences” (Marzano et al., 2001, p. 9).

53
Written lesson plans can provide administrators a glimpse into how teachers use
instructional strategies. In 1984, Frudden conducted a study of 529 participants
including superintendents, principals, vice principals, supervisors, coordinators, and
consultants from urban, suburban, and rural communities across the United States and
Toronto participating in professional improvement programs. That study found that
examining lesson plans provides a sense of the teacher’s variety of instructional methods.
This variety of instructional methods and use of instructional strategies is important to
student achievement, because using only one instructional strategy for all lessons and
subjects with all students is not best practice.
Teaching models can help to frame the use of instructional strategies. Teaching
models are organized frameworks that contain a lesson or series of lessons and follow
sequential steps, stages, or processes; they are inclusive of various instructional strategies
(Gareis, 2007). In addition to the instructional strategy component, frameworks also
work to organize intelligence-oriented education, which gives students the means to
educate themselves (Joyce, Weil, & Calhoun, 2004). They are aimed at academic and
meta-cognitive outcomes and maybe student-, subject-, or grade-specific (Gareis, 2007).
The instructional strategies provided by the teacher are of no use to the students unless
situated in a teaching model which helps them make a connection between the strategy
and how to utilize it for future problems. As Wharton-McDonald et al. (1998) found,
high achievement teachers used a more integrated and well balanced instruction. Using
teaching models and instructional strategies together helps teachers provide that
integrated and balanced instruction.

54
Organizers. A particular instructional strategy that has gained a lot of attention of
the years has been the use of organizers. Marzano et al. (2001) found that using
advanced organizers is one instructional strategy which has a high probability of
enhancing student achievement for all students in all grades and in all subjects.
Specifically, they found that the use of questions, cues, and advance organizers had an
average effect size of 0.59 which turns out to be a 22% gain in student achievement. In
addition to the study by Marzano et al. (2001), Wang et al. (1993a) found that the use of
advance organizers impact student learning by teaching students to be organized in their
thoughts in a meaningful way. Therefore, the use of organizers is a way to enhance
student connections and increase teacher effectiveness.
Findings about the use of Instructional Strategies are as follows:
• Johnson (1997) found that both principals and teachers believe effective teachers
must carefully plan instructional strategies.
• Wang et al. (1993a) found different modes of instruction produce different
learning outcomes.
• The nine categories of instructional strategies that affect student achievement
were found to be: identifying similarities and differences, summarizing and note
taking, reinforcing effort and providing recognition, homework and practice,
nonlinguistic representations, cooperative learning, setting objectives and
providing feedback, generating and testing hypotheses, and questions, cues and
advance organizers (Marzano et al., 2001).

55
• Frudden (1984) found that examining lesson plans provides a sense of the
teacher’s variety of instructional methods.
• Wharton-McDonald et al. (1998) found that high achievement teachers used a
more integrated and well balanced instruction.
• The use of advanced organizers positively impacts student achievement (Marzano
et al., 2001; Wang et al. 1993a).
• Cameron, Connor, & Morrison (2005) found that the more time teachers spend
on organization in the fall the more child-managed activities there will be in the
spring.
Timing
In addition to planning for a variety of instructional strategies, the amount of time
students spend engaged in the act of learning also impacts student achievement. The
teacher needs to not only plan these strategies but plan the implementation so that the
students’ time with the material is maximized. Omstein & Lasley (2004) state that when
planning, enough time should be allocated to the lesson so that “demonstration can be
complete, the students can discuss what they have observed, students can reach
conclusions and apply principles they have learned, students can take notes or write about
the demonstration, and materials can be collected and stored” (p. 173). Wharton-
McDonald et al. (1998) found that in low quality classrooms more time is spent in
transitions or waiting for directions, whereas in the high quality classrooms time is spent
engaged in the learning process. Wang, Haertel, and Walberg (1993b) agreed, finding
that the more time spent on instruction, the better for student achievement.

56
Additionally, teacher organization can lead to engaged learning time for students.
A 3-year longitudinal study of 44 first grade classrooms from 5 schools in the same
district on the urban fringe of a large Midwest City found that an increase in teacher
organization is positively related to an increase in student achievement and leads to more
time for individualized instruction (Cameron, Connor, Morrison, & Jewkes, 2008). The
study defined organization as “the amount of time teachers spend providing their students
information about classroom events and instructional activities, including explaining
purposes of the activities, procedures for their successful completion, and how to
transition between and plan subsequent tasks” (p. 173) and focused on vocabulary and
word reading. The researchers found that in the fall an average student placed in a
classroom with more minutes of organization (1SD or 4.34 min above the average)
scored a 1.30-point increase above the average word reading score in the spring. This
extra time for individualized instruction meets the individual needs of students and gives
students time directly engaged in their work. An earlier study by Cameron, Connor, &
Morrison (2005) found that the more teacher organization in the fall leads to more child-
managed activities in the spring. This organization then allows for more time spent on-
task as opposed to in transition and going through directions and procedures. Therefore,
effective teachers must plan efficiently and set up their classrooms so that learning time
can be maximized.
Another aspect of timing is using the right strategy at the right time or asking the
right question at the right time (Marzano, 2007). As was stated previously, it is important
that the teacher balance instruction and use the appropriate strategy to be in alignment

57
with all other elements of the lesson. Time is a factor which effective teachers must
consider at all times and tends to be a common strand among teachers’ decision patters
(Jasper, 1986).
Research regarding Timing includes:
• Wharton-McDonald et al. (1998) & Wang et al. (1993b) found that in high quality
classrooms time is spent engaged in the learning process.
• Timing also deals with using the right strategy at the right time or asking the right
question at the right time (Marzano, 2007).
Learning Differences
Building off planning instructional strategies, effective teachers consider learning
differences in their planning. The variety of instructional strategies that a teacher plans
for should meet the needs of all students. Each person sitting in a classroom is an
individual. Each comes to the classroom with various experiences, knowledge, and
attitudes. It is then foolish to assume that each individual learns in the same manner.
The teacher must account for these differences in planning and ensure that each
individual gets the material in a way that is meaningful to him or her. This is not a trivial
task, and it requires teachers to have some understanding of personalities and how to
work with each type. As Polk (2006) notes, it is important for teachers to be aware of
their own personality traits and characteristics as well as those of the students in order to
adapt instruction appropriately. Brookhart and Loadman (1992) state that assessing a
teacher solely on their academic ability negates the professional orientation of teaching.

58
While this knowledge is important, teachers also need to be able to make connections
between the academic concepts, build relationships with the students, and transform their
knowledge to meet the instructional needs of their students (Brookhart & Loadman,
1992). This mimics what Bain and Jacobs (1990) found, which is that highly effective
teachers adjust their teaching style to the needs of the class. Likewise, Rosenshine (1986)
found that effective teachers change their instruction when working with different groups
of students. It is clear that effective teachers must plan their instruction with the
understanding that they need to meet the needs of a diverse group of learners.
One way that teachers can meet the needs of a diverse group of learners is to plan
to teach students individually or in groups. As Wharton-McDonald et al. (1998) found in
their study of effective teachers, high achievement teachers provided individualized
instruction and review for those students in need. Likewise Bain and Jacobs (1990) noted
that highly effective teachers retaught using alternative strategies when students did not
learn material the first time. Additionally, Johnson (1997) noted that 67% of teachers
saw individualizing instruction as one characteristic of an effective teacher. Davis &
Thomas (1989) stated that effective teachers give additional examples or explanations
when needed, use clear language, and bring attention to important ideas. These
examples of effective teaching emphasize the importance of organization. As Cameron
et al. (2008) found, teachers who are more organized were more likely to individualize
instruction. This individualized instruction can be the difference in student achievement.
Another aspect of teacher organization that plays a role in learning differences is
the organization of thought during planning. In their study pointing out the six biggest

59
lesson planning pitfalls of novice teachers, Jones et al. (2011) found that novice teachers
did not create an assessment or one was done by students outside of class, and as a result
the teachers were unable to differentiate learning. This important aspect of lesson
planning echoes what was stated previously about the need for clear lesson and learning
objectives as well as logically structured lessons which are appropriately aligned.
Findings regarding lesson planning for Learning Differences:
• Teachers need to adjust their instruction to meet the needs of their many different
students (Bain & Jacobs, 1990; Rosenshine, 1986; Davis & Thomas, 1989).
• Teachers can adjust instruction by teaching small groups or individually
(Wharton-McDonald et al., 1998; Bain & Jacobs, 1990).
• Planning for assessment impacts the teacher’s ability to appropriately differentiate
(Jones et al. 2011).
Developing Age and Content Appropriate Plans
Another aspect of effective lesson planning, which relates to planning for learning
differences, is planning lessons that are developmentally appropriate for the students. As
Marshall (2012) stated, “when teachers look at a child’s abilities, they can plan ways to
support him/her at an appropriate developmental level. They can also modify or adapt
ideas to meet the developmental levels of all children in the group” (p. 25). While
students may also vary in their abilities to complete and be a part of certain lessons, it is
the responsibility of the teacher to ensure that the content and activities are age
appropriate for the students. Students will not be engaged if the material is too young,

and if the material is too complex they will feel overwhelmed. The teacher must
understand the age of the children, know cognitively and developmentally what is
appropriate, and know what interests the age group. One way teachers can develop age
and content appropriate plans, while also meeting learning differences and using varied
instructional strategies, is through authentic activities. Wharton-McDonald et al. (1998)
found that high achieving teachers provided many opportunities for the students to
engage in authentic reading and writing activities. These authentic opportunities give
students the ability to interact with material that is in their world and that they find
interesting and familiar. Pressley et al. (1998) found that to help students and to motivate
them, the teacher must present them with a small challenge which extended slightly
beyond their competence. In order to do this, the teacher must know the students, the
material, and the concepts well enough to challenge students appropriately. While
students might struggle with the challenge, the most effective teachers are ready to
support the students and help them progress but stop short of doing the assignment for
them (Pressley et al., 1998). Teachers must also be able to scaffold effectively for their
students. Both Wharton-McDonald et al. (1998) and Pressley et al. (1998) found that
more effective teachers provided appropriately matched tasks and instructional
scaffolding for their students. Ensuring each student is appropriately challenged—with
age appropriate content and materials, add to the complexity of the modem teacher’s
lesson planning.
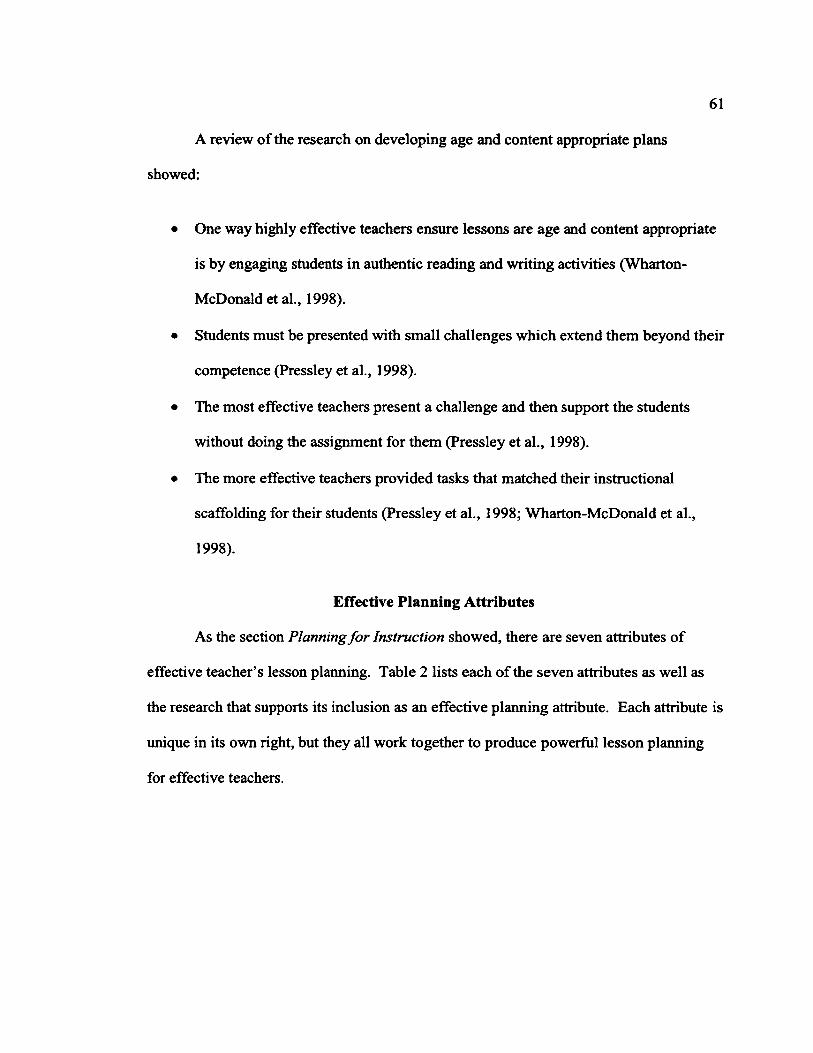
61
A review of the research on developing age and content appropriate plans
showed:
• One way highly effective teachers ensure lessons are age and content appropriate
is by engaging students in authentic reading and writing activities (Wharton-
McDonald et al., 1998).
• Students must be presented with small challenges which extend them beyond their
competence (Pressley et al., 1998).
• The most effective teachers present a challenge and then support the students
without doing the assignment for them (Pressley et al., 1998).
• The more effective teachers provided tasks that matched their instructional
scaffolding for their students (Pressley et al., 1998; Wharton-McDonald et al.,
1998).
Effective Planning Attributes
As the section Planning for Instruction showed, there are seven attributes of
effective teacher’s lesson planning. Table 2 lists each of the seven attributes as well as
the research that supports its inclusion as an effective planning attribute. Each attribute is
unique in its own right, but they all work together to produce powerful lesson planning
for effective teachers.

Table 2
Key References for Effective Planning Attributes
Clear Lesson & Learning
Objectives
CreatingQuality
Assignments
LogicallyStructuredLessons
InstructionalStrategies Timing Learning
Differences
DevelopingAge
AppropriatePlans
Bain & Jacobs (1990) • •Rosenshine (1986) • • • •Jones et. al (2011) • •Zahorik (2003) • • •Pressley et al. (1998) • • •Wharton-McDonald (1998) • • • • • •Clare (2001) • •Koh & Luke (2009) •Wang et al. (1993a) • •Wang etal. (1993b) • •Marzano et al (2001) •Johnson (1997) •Cameron et. al (2005) •Cameron (2008) • •Good & Brophy (1997) •Panasuk & Todd (2005 •Marzano (2007) •Jasper (1986) • • •
0 \K)

63
Written Lesson Plans
Written lesson plans are the result of the planning process and can be a “window
through which we can see how teachers conceive the structure of lessons in relation to
their concrete instructional activities” (Shimizu, 2008, p. 943). Omstein & Lasley (2004)
explained that a written lesson plan “sets forth the instructional activities for each day”
and is sometimes referred to as a daily plan (p. 162). Ko (2012) conducted research into
pre-service teachers’ views on lesson planning and found that most participants (84%)
found the process of designing a written lesson plan as helpful in preparing and
organizing for teaching. Further, lesson plans can be characterized as conventional and
alternative, each of which will be explored, in turn.
Conventional Plans
Conventional lesson plans came about as an adaptation of a rational model of
planning from economics as well as national and city planning. They are developed by
setting goals, formulating alternatives, predicting outcomes for each alternative, and then
evaluating each alternative for its effectiveness in reaching and achieving desired
outcomes (Yinger, 1980). Tyler (1949) was one of the first educational theorists to
propose using this style of planning in education, and he recommended four questions for
effective planning:
• what educational purposes should the school seek to attain,
• what educational experience can be provided that are likely to attain these
purposes
• how can these educational experiences be effectively organized, and

64
• how can we determine whether these purposes are being attained (p. 1).
This linear model begins with the specifications of objectives and ends with a
lesson evaluation (John, 2006; Yinger, 1980). While this approach to planning has been
around since the 1950s, it gained prominence during the curriculum and pedagogical
reforms of the 1960s and 1970s (John, 2006). Others have constructed variants on the
model including Bloom (1956), who extended taxonomies of learning outcomes; and
Taba (1962) and Popham and Baker (1970), who added more sophisticated constructs
around instruction (John, 2006; Yinger, 1980). The result has been a model that
recommends four steps for creating an effective plan: “specify objectives, select learning
activities, organize learning activities, and specify evaluation procedures” (Yinger, 1980,
p. 108). At its root, this conventional plan is based in a systems approach to planning. A
study by Koeller & Thompson (1980), which used a questionnaire given to outstanding
teachers, found that although most schools of education teach students to use the Tylerian
method, half of the 56 participants did not follow this method. Teachers are choosing a
different planning model and they are differed in their preference (Ko, 2012).
Many other lesson plan formats have found their basis in this conventional plan.
As Jalongo, Rieg, and Helterbran (2007) state, “lesson plans operationally defined by
most colleges of education consists of an introduction (behavior or not), materials,
procedures, and evaluation” (p. 12). While this format adds other elements deemed
necessary for pre-service teachers, the ends and means approach is still the underlying
force. Additionally, the Four Stages of Lesson Planning (FSLP) strategy (Panasuk &
Todd, 2005), which was developed to help coherency in planning, stems from the basic

65
Tylerian model. The FSLP strategy uses objectives, homework, developmental activities,
and mental mathematics (Panasuk & Todd, 2005). While the order of the plan is
different, the underlying ends/means relationship still exists.
While most teachers leam this method of planning in their schooling, most are
choosing a different way to plan (Ko, 2012). The study, by Ko (2012), which conducted
research into pre-service teachers’ views on lesson planning included forty-five pre
service elementary teachers (K-6) in a practicum seminar course and consisted of
collecting data via survey, lesson plans, and a follow-up interview. Ko (2012) found that
twenty-two percent of the participants favored using the traditional lesson planning
format as they felt creating a new template or format would be more work. It was also
found that thirty- three percent of participants used bullet points or a list as a lesson plan
(Ko, 2012), this finding mimics what Morine-Dershimer (1979) found.
A study by Sanchez and Valcarcel (1999) reported that only 15 percent of
teachers, in their study, considered objectives to be important and a key element in their
planning, but viewed the objectives as a minimum standard or key idea to be covered.
While this study shows that although teachers leam lesson planning in a linear way, it is
not always what is happening. Also, the study shows the lack of importance placed on
objectives is in direct conflict with the research on elements of effective teaching, which
found that clear lesson and learning objectives are necessary for effective planning (Bain
& Jacobs, 1990; Rosenshine, 1986; Jones, Jones, & Vermette, 2011; Zahorik et. al,
2003). While the research shows that this is an important aspect of planning, in practice
teachers are not using objectives as a focal point but looking at content knowledge,

66
sequencing, and activities (Brown, 1988; Kagan & Tippins, 1992; McCutcheon, 1980;
Sanchez & Valcarcel, 1999; Yinger, 1980; Zahorik, 1975). There are a couple reasons
this could be happening. Researchers have found that lesson plans required by
administrators for evaluation purposes are usually only procedural in nature and therefore
emphasize the procedural aspect of planning (Danielson & McNeal, 2000; Halverson,
Kelly, & Kimball, 2004; McCutcheon, 1980; Morine-Dershimer, 1979). Additionally,
most teachers form only brief outlines of lesson plans and have a mental image of their
lesson plan (Morine-Dershimer, 1979), so most lesson planning occurs mentally as
opposed to on paper. Finally, due to the dynamic nature of the classroom, teachers know
that lesson plans will shift and are often not implemented as planned (Clark & Peterson,
1986) so the “importance of instructional objectives is diluted” (Ko, 2012, p. 90).
Alternative Plans
Despite the widespread use of and teaching of the conventional plan, there are
alternatives. One of the most widely accepted has been the “naturalistic” or “organic”
model based on the work of Egan (1992, 1997, 2005), who claims there is a mismatch
between specific objectives and the complex nature of the classroom, and believes
naturally-emerging planning structures to be more beneficial (John, 2006). Naturalistic
planning involves beginning with the activities and allowing the objectives to flow from
the activities (John, 2006). This requires a flow from means to ends as opposed to
starting with the end in mind.
In developing lesson plans using this model, Egan (2005) states that the
techniques and frameworks within the model are simply a way for teachers to achieve

67
their objective, and that the frameworks can be left behind after a teacher has become
familiar with die principles. This differs from the conventional plan which has remained
structurally similar even as teachers have become familiar with it. The naturalistic
viewpoint is that the frameworks are not supposed to be a “straitjacket” for plans (Egan,
2005, p. 1).
Another approach to creating lesson plans is the ‘interactional method’ which
stresses the interactive rather than the discrete character of objectives (John, 2006). In
this approach the emphasis is on form, which is not based on the shape of a lesson but
more on the principles which change during interactive teaching (John, 2006). The
importance of form differs from the emphasis placed on the mechanics of planning in the
conventional method. The interactional method has been compared to the structure of a
musical performance wherein the score is analogous to the lesson plan, and the
performance itself shifts according to interpretation and improvisation (Alexander, 2000).
This viewpoint takes into consideration the complexity and dynamic nature of a
classroom, which is often, found lacking in conventional plans.
In her research, Ko (2012) found that forty-four percent of the participants
preferred to create a concept map to map out their lesson plans. This map allowed the
pre-service teachers to visualize the lesson structure and connections to students, content,
and community better than a conventional lesson plan (Ko, 2012). Ko (2012) argues that
the nonlinear models of developing lesson plans appear to be more sophisticated than the
conventional methods and based on her findings, Ko (2012), developed an instruction
cycle (Figure 2) as an alternative planning model. The instruction cycle has nine stages,

68
all of which have double pointed arrows as to allow the opportunity to go back and forth
among the stages as needed. Ko (2012) argues that with a model like the instruction
cycle, pre-service teachers can design a more “solid and elaborate lesson plan that shows
consistency among objectives, instructional strategies, and assessment” (p. 96).
^ N Learning ___n—“v outcomes S——
Figure 2-Instruction Cycle. Adapted from Ko 2012
Conventional plans constructed based on the rational model of planning look
good on paper, alternative methods take into account the dynamic nature of the classroom
when planning. Regardless of the format, all lesson plans share similar characteristics
such as objectives and activities, the fundamental question is if these plans can be used to
make an inference about instructional effectiveness as defined.

69
Summary
In a global economy it is important to have an educated workforce for several
reasons. Education raises the productivity of the workforce and thus leads to economic
growth (Goldin & Katz, 2008). Additionally, education contributes to the adoption and
diffusion of new technologies as well as innovation and technological advance (Goldin &
Katz, 2008). As society continues to push the envelope in terms of technology and the
world becomes flatter, it is vital that the American workforce remain the most innovative
and educated in the world. President Obama recognized this need for innovation and
technological advance when he created the Race to the Top Fund, a competitive grant
program designed to “encourage and reward States that are creating the conditions for
education innovation and reform” (U.S. Department of Education, 2009, p. 2). In order
to these goals, the quality of teachers must meet the demands of the system, because “the
quality of an education system cannot exceed the quality of its teachers” (Barber &
Mourshed, 2007, p. iii). Teacher effectiveness is a prime indicator of quality.
Many researchers have developed conceptual frameworks around the idea of
teacher effectiveness, trying to paint a clear picture of what qualities and skills effective
teachers exhibit. Davis & Thomas (1989), Omstein & Lasley (2004), Danielson (2007),
Stronge (2007), and Marzano (2007) all created frameworks around the idea of teacher
effectiveness. Stronge’s (2007) framework of Qualities o f Effective Teachers includes
six teacher qualities for effectiveness, and is a good compilation of what other researchers
have found on effective teachers and paints a comprehensive picture of effective
teaching.

70
Many attributes of effective teachers delineated in the above frameworks overlap:
classroom management, organization, discipline of students, communicating
expectations, questioning, student engagement, monitoring of student progress, and using
assessments to address student needs and abilities were found in four of the five models
examined. A common thread with all these attributes is they can be planned for and be
prepared prior to the implementation of instruction. Further examining, the attribute of
instructional planning, which is seen in four of the five models, might be the most vital to
success in all areas of teacher effectiveness.
Stronge (2007) notes seven elements of effective teacher lesson planning: clear
lesson and learning objectives, Creating Quality Assignments, Logically Structured
Lessons, Instructional Strategies, Timing, Learning Differences, and develop age and
content appropriate plans. Each of these qualities is unique in its own right, but together
they work to create lesson planning that is comprehensive and effective.
Clear lesson and learning objectives are both needed for effective lesson planning
as it gives the teacher a stable place from which to build. They help create a clear road
map which should be stated in terms of student learning rather than student activity
(Danielson, 2007). Having clear lesson and learning objectives enables effective
teachers to provide clear and focused instruction (Bain & Jacobs, 1990). This is
accomplished by setting goals at the beginning (Rosenshine, 1986) and having a clear
focus on the content to be taught (Zahorik, et. al, 2003). While much research has shown
the importance of having objectives (Koeller & Thompson, 1980; Rosenshine, 1986;
Bain & Jacobs, 1990; Jones et. al, 2011) for cohesion and individualized instruction

71
(Zahorik et. al, 2003), Sanchez and Valcarcel (1999) reported that only 15 percent of
teachers, in their study, considered objectives as important and a key element in their
planning. This lack of focus on the objective might impact the teachers overall planning
as this element of effective teachers planning impacts other elements directly and
indirectly.
Being able to focus lesson planning around a clear lesson and learning objective
allows teachers in creating quality assignments, which can enable student achievement.
Clare (2001) found a relationship between the quality of classroom assignments and the
quality of student work. One way to create a quality assignment is by connecting
concepts across the curriculum and planning lessons that include a variety of clear lesson
objectives that cross the curriculum (Pressley et. al, 1998). These clear objectives and
quality assignments lead to student academic engagement (Pressley et. al, 1998) and
student achievement.
Clear lesson and learning objectives and quality assignments only work if the
lessons are logically structured. As Zahorik et al. (2003) found, carefully planned
activities had clear goals and a logical structure with a step -by-step content progression.
Lessons can be logically structured in two ways: sequencing and alignment. Both the
sequence of a single lesson and the sequence of a set of lessons are important. Having
sequence ensures that students will be able to connect ideas and leam concepts that are
connected as opposed to in isolation. Alignment ensures that all the elements within the
lesson planning sequence are working together toward the goal of student achievement,
especially the objective, activity, and evaluation. This cohesiveness of lesson planning is

72
important in determining the effectiveness of planning (Panasuk & Todd, 2005). When
all aspects of a logically sequenced lesson are in alignment, student achievement will
follow.
Instructional strategies also play a role in creating quality assignments and
logically sequencing lessons. Effective teachers use a variety of instructional strategies
(Stronge, 2007; Tomlinson & McTighe, 2006) during instruction. When a teacher
correctly and adeptly uses a variety of instructional strategies, lessons and tasks become
more engaging to learners (Tomlinson & McTighe, 2006). Therefore, it is important that
teachers balance the instructional strategies they employ. Using the appropriate
instructional strategy is also important as different modes of instruction produce different
learning outcomes (Wang et al., 1993a). Marzano et. al (2001) identified nine categories
of instructional strategies that impact student achievement, and knowing when to use,
how to properly apply, or time these techniques is vital to planning. One instructional
strategy that has gotten a lot of attention in research is the use of organizers. Effective
teachers use organizers with students. Knowing how and when to use an organizer and
understanding its purpose will help teachers use them with students. Organizers have a
high probability of enhancing student achievement for all students in all grades and in all
subjects (Marzano et. al, 2001). In order to use this strategy with students, teachers must
be organized in their understanding of the concept.
In addition, the timing, or pacing of instructional strategies is important. This
aspect of lesson planning impacts the sequencing of the lesson and allows teachers to
maximize students’ time with the material. In effective teachers’ classrooms more time is

73
spent on teaching and learning and less time on transitioning (Wharton-McDonald et. al,
1998; Wang et.al, 1993b). Effective planning must take into consideration the time spent
with students engaged with the material as well as to the timing of instructional
strategies.
To meet the needs of all learners in the classroom, effective teachers need to also
consider learning differences when lesson planning. Each child in the classroom is an
individual and the teacher must account for these differences in planning to make the
material meaningful for each student. Bain and Jacobs (1990) found that highly effective
teachers are able to do this and adjust their teaching style to the needs of the class.
Therefore, effective teachers must enter lesson planning understanding that they need to
meet the needs of a diverse group of learners. Teachers can accomplish this by planning
to teach in small groups or individually (Wharton-McDonald et al., 1998; Bain & Jacobs,
1990; Davis & Thomas, 1989).
Developing age and content appropriate lesson plans relates to planning for
learning differences. The teacher must understand the age of the children, know
cognitively and developmentally what is appropriate, and know what interests the age
group. One way effective teachers develop age and content appropriate plans, while
meeting learning difference, and using varied instructional strategies, is through the use
of authentic activities (Wharton-McDonald et al., 1998). Additionally, teachers need to
lesson plan to challenge students just outside their comfort zone and support them by
scaffolding (Pressley et al., 1998; Wharton-McDonald et al., 1998). Ensuring each

74
student is appropriately challenged with age appropriate content and materials add to the
complexity of the modem teacher’s lesson planning.
The seven lesson planning elements, identified by Stronge (2007), work
independently and cohesively in the planning stages. As teachers begin to produce
written lesson plans, much of the lesson planning process can be lost. While teachers are
taught in Schools of Education to use linearly produced plans, in reality many teachers do
not follow that system and do not write down the process they used during their lesson
planning. Conventional plans imply that the lesson planning process is an ends/means
relationship, which can leave out the complexity of thought that is undertaken in the
lesson planning process. Alternative plans tend to be more organic in nature and are
developed as a teacher tries to write down the lesson planning process they went through.
Seeing the need for a more sophisticated written plan model, Ko (2012) developed the
instruction cycle. Regardless of how teachers write their plans on paper, the lesson
planning process they undergo is vital to student success. Teachers need to be effective
not only in their teaching but also in their lesson planning in order to promote student
achievement.

Chapter 3
Methodology
Effective teachers make a difference in the classroom. Teacher planning is an
important part to being an effective teacher. Looking at Stronge’s (2007) Framework for
Effective Teachers, Planning and Organizing for Instruction is one of six qualities of
effective teachers. Looking deeper into this particular quality, seven elements of teacher
planning were identified as part of an effective teacher’s lesson planning: Clear Lesson
and Learning Objectives, Creating Quality Assignments, Logically Structured Lessons,
Instructional Strategies, Timing, Learning Differences, and developing age and content
appropriate plans. The purpose of this study was to determine teachers’ perceptions as to
which of these seven elements has the greatest impact on student achievement, as well as
to discern what teachers actually do during their lesson planning. In order to meet the
purposes of the study and to gather the needed data, a survey was created based on the
seven elements of effective teacher planning noted by Stronge (2007). Teachers were
also asked to self-report how they plan for lessons.
Research Questions
1) Which of the following seven lesson planning elements do teachers perceive as
having the greatest impact on student achievement: Clear Lesson and Learning
Objectives, Creating Quality Assignments, Logically Structured Lessons,
Instructional Strategies, timing, Learning Differences, and Developing Age and
Content Appropriate Lessons?
75

76
2) Which of the following seven lesson planning elements are reported by teachers
as being used and with what level of relative importance: Clear Lesson and
Learning Objectives, Creating Quality Assignments, Logically Structured
Lessons, Instructional Strategies, Timing, Learning Differences, and Developing
Age and Content Appropriate Lessons?
3) What aspects of creating a quality assignment do teachers perceive as having the
greatest impact on student achievement? WTiat aspects of creating a quality
assignment do teachers use when planning?
4) What aspects of lesson structure do teachers perceive as having the greatest
impact on student achievement? What aspects of lesson structure do teachers use
when planning?
5) Is there a difference in teachers’ perceptions regarding which lesson planning
elements have the greatest impact on student achievement when considering: (a)
elementary school, middle school, or high school level; (b) content areas such as
science, social studies, language arts, mathematics; (c) region of the United
States; (d) rural, urban, or suburban areas; (e) years of experience; and (f)
gender?
6) What method of lesson planning do teachers use most prominently? For teachers
who use formal written lesson plans, how many times per day do they reference
the written plans?

77
Sample
The target population for this study was K-12 teachers within the United States.
A stratified random sample was used to ensure that selected subgroups in the population,
specifically, elementary school, middle school, and high school teachers, were adequately
represented in the sample (Gall, Gall, & Borg, 2007).
The sample was obtained using the services of Market Data Retrieval (MDR), a
company that has been used for over 40 years in educational marketing. MDR maintains
a list of over three million K-12 teachers in the United States
(http://www.schooldata.com/pdfs/MDR_Ed_catalog.pdf). From this list MDR created a
customized list of over 5,000 randomly selected teachers in the United States. The list
was stratified so that elementary, middle, and high school teachers were equally
represented in the sample with each composing approximately one-third of the selected
sample in this equal-size stratified sampling approach.
Instrumentation
The instrument used was developed by the researcher based on the findings of
Stronge (2007) regarding Planning and Organizing for Instruction. The survey was
designed during preliminary planning along with a table of specification (see Table 3) to
account for the validity of the instrument. After the initial design, the survey was sent to
two colleagues who sent feedback regarding wording, structure, and readability. The
survey was then sent to a panel of practitioners who made suggestions and comments as
to the clarity of each individual item as well as each item’s relevance (Appendix A). The
panel of practitioners was also asked if there were other changes that should be made to

78
the instrument. Feedback was given regarding wording, clarity, formatting, and adding
items. After all feedback was received and reviewed, the survey was altered to account
for problem areas identified by the panel. A third copy of the survey was then created
based on all the feedback received, and was sent to a panel of experts in the field of
teacher effectiveness, lesson planning and research. The panel of experts reviewed the
survey for the clarity and relevance of each individual item and included changes that
should be made to make the survey instrument more valid. Below are the changes made
after review from the panel of practitioners and the panel of experts.
Panel of Practitioners
In order to ensure the validity of the survey instrument, the first step taken, was to
have a panel of practitioners review the instrument. The survey instrument was emailed
to seven possible practitioners for feedback. The practitioners were provided with the
research questions and definitions of key terms. They were then asked to provide
feedback about the instrument on each individual item to ensure the clarity of the item, if
anything was missing from the instrument that should be included, if anything should be
eliminated from the survey, and if there were any other changes that needed to be made
to the overall instrument. Five practitioners responded to the request. In response to the
feedback received the survey instrument was altered by:
• Adding a heading to Part 1, Elements of Lesson Planning to ensure it was
congruent with the other items.
• The term “rank” was changed to “rank-order” to specify that the items should be
ranked and ordered.
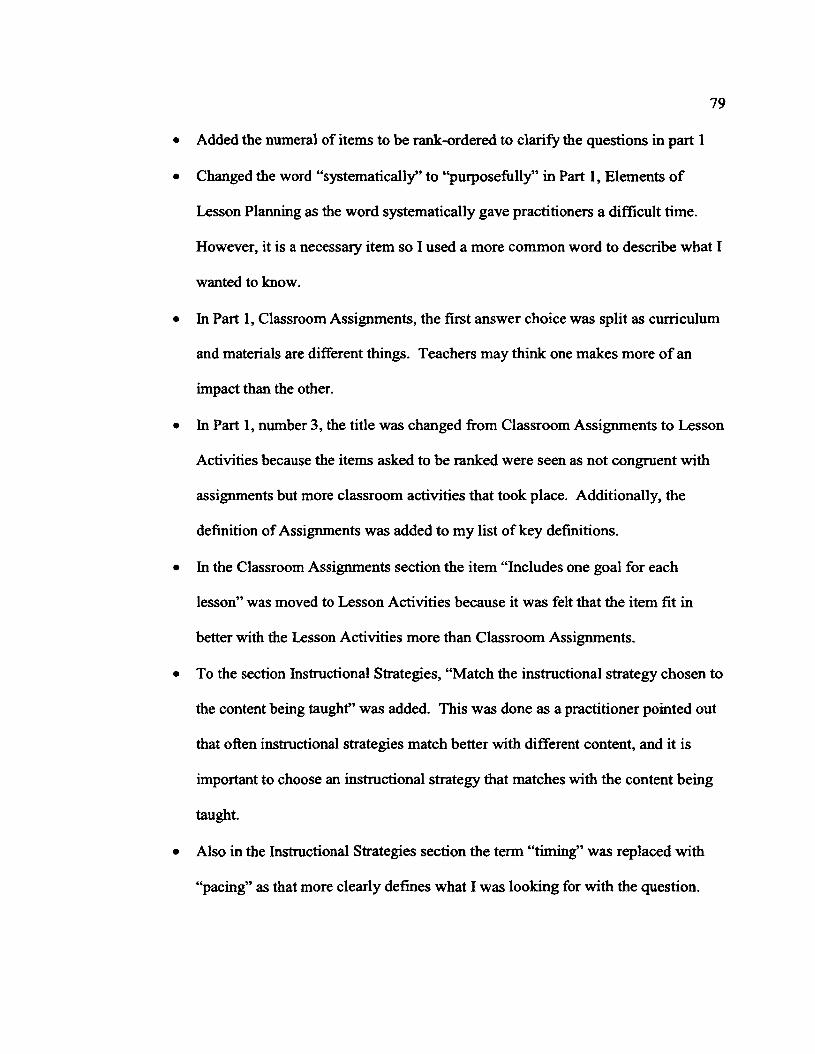
79
• Added the numeral of items to be rank-ordered to clarify the questions in part 1
• Changed the word “systematically” to “purposefully” in Part 1, Elements of
Lesson Planning as the word systematically gave practitioners a difficult time.
However, it is a necessary item so I used a more common word to describe what I
wanted to know.
• In Part 1, Classroom Assignments, the first answer choice was split as curriculum
and materials are different things. Teachers may think one makes more of an
impact than the other.
• In Part 1, number 3, the title was changed from Classroom Assignments to Lesson
Activities because the items asked to be ranked were seen as not congruent with
assignments but more classroom activities that took place. Additionally, the
definition of Assignments was added to my list of key definitions.
• In the Classroom Assignments section the item “Includes one goal for each
lesson” was moved to Lesson Activities because it was felt that the item fit in
better with the Lesson Activities more than Classroom Assignments.
• To the section Instructional Strategies, “Match the instructional strategy chosen to
the content being taught” was added. This was done as a practitioner pointed out
that often instructional strategies match better with different content, and it is
important to choose an instructional strategy that matches with the content being
taught.
• Also in the Instructional Strategies section the term “timing” was replaced with
“pacing” as that more clearly defines what I was looking for with the question.

80
Additionally, the definition of timing was added as a key term to clarify what is
meant by timing throughout the paper.
• The item “An overall lesson that is balanced in its use of instructional strategies
(Use of a variety of instructional strategies throughout the day” was replaced by
“Extensive use of scaffolding” as the former was confusing to panel members and
when the research was reviewed it spoke mainly of one curriculum, what was
meant with the question was extensive use of scaffolding, which was also in the
research.
• The item “A smooth integration of instructional strategies into a lesson” was
removed from instructional strategies because it was confusing to panel members,
but also because what was meant by this item is covered with another item
already listed, “Match the instructional strategy chosen to the learning outcome.”
If these are matched properly, there will be a smooth transition within the lesson
to the instructional strategy chosen.
• In Appropriate Lessons, the item “Teacher supports students as they struggle, but
does not do the activity for student” was removed as it was stated by the panel
that this is more of an approach to teaching and not a lesson planning concept.
• The term “authentic activities” in Appropriate Lessons was changed to “real
world application activities” as the panel members felt the term authentic was
confusing.
• In Part 2, “I believe the more organizational work the teacher plans in the fall with
students, leads to more child-centered activities in spring”, and “I believe the
amount of organization in the classroom leads to the amount of individual time

81
spent with students.” were removed from the survey as they do not have anything
to do with planning specifically and were not integral to my research questions.
Panel of Experts
After changes were made to the survey instrument based on the comments and
suggestions of the panel of practitioners, the survey, in its new form, was sent to a panel
of experts. The survey was sent to eight potential expert panel members. They were
asked to evaluate the instrument question by question. They were asked if the question
was clear, if the question was relevant, if they had any changes they would recommend
and what the changes would be, and if they had any other comments about the question.
Four panel members responded and from their responses the following changes were
made.
• Altered the wording of prompts to make them clearer and less awkward as was
noted by 1 of the 4 experts.
• Changed the answer responses choices to align them all and make them
grammatically parallel as noted by 3 of the 4 experts.
• The section Elements of Lesson Planning was changed by creating a new item
“For lesson planning to effectively impact student learning it must consider the
amount of time students spend engaged in the act of learning.” This was added
due to the mention of timing in the conceptual framework and not addressing it in
the survey. Additionally, “Uses graphic organizers in the planning process to
enhance instructional delivery.” Was deleted because use of organizers, of any
kind, falls under the instructional strategies domain and is then covered by “For

82
lesson planning to effectively impact student learning it must contain a variety of
instructional strategies.” Finally, the item “Purposefully develops plans that align
content to appropriate cognitive skills.” was changed to “For lesson planning to
effectively impact student learning it must align content to developmentally
appropriate skills.” This was done as the conceptual framework references
developmentally appropriate, but the survey item was identifying a different
concept.
• In the section Classroom Assignments, “Uses curriculum materials in classroom
assignments” was changed to read, “Uses adopted curriculum materials in
classroom assignments.” The addition of the word adopted clarifies which
curriculum materials are being discussed. Three of the four expert panelists
suggested clarifying which curriculum materials were being discussed.
• Added definitions for “student control” and “depth of knowledge” to clarify the
terms.
• The sections Lesson Activities, Instructional Strategies, Student Learning Styles,
and Appropriate Lessons in Part 1 were removed as they were extra questions that
did not directly address my research questions. Additionally, Part 2 was removed
as it did not directly address any of my research questions.
• In the Demographics Section- Part 4, content area was added as my research
questions ask if there are different perceptions between the groups. Additionally,
I combined 11-15 and 16-20 in years of experience to give fewer answer choices
but maintain blocks where effective teacher behavior may shift.

83
• Added questions regarding which items teachers have used in their planning in
order to accommodate the research questions that ask which lesson planning
elements teachers use.
The Survey
The survey contained three parts (see Appendices B and C). The first part asked
participants to rank-order items. The items dealt with Elements of Lesson Planning,
Classroom Assignments, and Lesson Structure. Rank items were chosen to avoid
participants from scoring all elements the same and leading to little discrimination
between survey items (Gall, Gall, & Borg, 2007). Part one also asked teachers to give a
self-report on which items, if any, they used in the last week for each of the mentioned
categories. A self-report allowed inferences to be made about how participants differ in
their lesson planning thinking and processing (Gall, Gall, & Borg, 2007). The second
section contained a question regarding the use of lesson plans by teachers. Participants
could respond that they used written lesson plans, no formal lesson plans, or mental
plans. If participants responded that they used written lesson plans, they were then asked
how often they refer to those plans during the course of the day. If participants
responded that they used no formal plans or that they used mental plans, the survey
skipped them to section three. The third and final section contained six demographic
questions related to the research. The questions pertained to a.) the type o f school where
the participant works, b.) the content area where the participant works, c.) the gender the
participant identifies with, d.) the number o f years teaching experience, e.) the locale o f
the school, and, f ) the state where they work. The State where the school is located was

84
then used to determine which region of the United States the participant works. This
allowed examination of differences between regions of the United States with regards to
planning. The States were in regions ahead of time according to the regions used by the
U. S. Census Bureau (See Appendix D).
Two versions of the survey were sent out to participants (see Appendices B and
C). The difference between the surveys was the order of the questions in Part 1. In
Survey A, the rank-order items appeared before the multiple choice items. Survey B had
the multiple choice items appear before the rank-order items. Using two versions of the
survey accounted for any bias there might have been in the ordering of the questions.
The Kruskal-Wallis statistical measure was then used to determine if the order of the
questions impacted participants’ responses. Additionally, the rank-order answer choices
and the multiple choice answer choices were randomized for each participant to account
for the bias in the ordering of the answer choices.

Table 3
Table o f Specifications for Survey Items
85
Research QuestionsElements of Effective
Teachers’ Lesson Planning Survey Instrument
1.) Which of the following seven lesson planning elements do teachers perceive as having the greatest impact on student achievement: Clear Lesson and Learning Objectives, Creating Quality Assignments, Logically Structured Lessons, Instructional Strategies, Timing, Learning Differences, and Developing Age and Content Appropriate Lessons?
Parti: Elements of Lesson Planning
2.) Which of the following seven lesson planning elements are reported by teachers as being used and with what level of relative importance: Clear Lesson and Learning Objectives, Creating Quality Assignments, Logically Structured Lessons, Instructional Strategies, Timing, Learning Differences, and Developing Age and Content Appropriate Lessons?
Parti: Elements of Lesson Planning in Practice
3.) What aspects of creating a quality assignment do teachers perceive as having the greatest impact on student achievement? What aspects of creating a quality assignment do teachers use when planning? Are there other aspects of creating a quality assignment teachers use when planning?
Part 1: Classroom Assignments and
Classroom Assignments in Practice
4.) What aspects of lesson structure do teachers perceive as having the greatest impact on student achievement? What aspects of lesson structure do teachers use when planning?
Part 1: Lesson Structure and Lesson Structure in
Practice
5.) Is there a difference in teachers’ perceptions regarding which lesson planning elements have the greatest impact on student achievement when considering: (a) elementary school, middle school, or high school level; (b) content areas such as science, social studies, language arts, mathematics; (c) region of the United States; (d) rural, urban, or suburban areas; (e) years of experience; and (f) gender?
Demographic Information and Part 1: Elements of
Lesson Planning
6.) What method of lesson planning do teachers use most prominently? For teachers who use formal written lesson plans, how many times per day do they reference the written plans?
Part 2: Types of Lesson Plans and Written Lesson
Plans

86
Procedures
Using a national database of teachers in the United States, an email was sent to
potential participants informing them of their selection to participate in this study. The
email contained a link to an on-line survey in which participants rank ordered aspects of
lesson planning as they perceived them to impact student achievement. A follow up
email was sent one week after the initial email to remind those who had not yet
completed the survey that they still had the opportunity. A second email reminder was
sent a week later, approximately 2 weeks after the initial email. This email reminded
those who still had not participated that they still had a chance. Potential participants
received a total of three emails asking for their participation in the study. Research
indicates that 91% of data collected from on-line surveys is completed within the first 13
days (Mitra, Jain-Shukla, Robins, Champion, & Durant, 2008); therefore, email
reminders were sent in the first two weeks to encourage an advantageous response rate
from participants. In addition, the survey remained active on-line for one month from the
date that participants first received the email notice.
Data Analysis
Results of this study were analyzed using descriptive statistics and analysis of
variance (ANOVA), as applicable (see Table 4). Means and standard deviations were
calculated and ranked for each survey item. For selected research questions, the means
were subjected to an ANOVA for each demographic variable to determine significance
within the groups. Using an ANOVA allowed the researcher the ability to distinguish
between groups of teachers and to see if there were any differences in their perspectives

87
with regards to planning. An ANOVA compares the amount of between-groups variance
in individuals’ scores with the amount of within-groups variance (Gall, Gall, & Borg,
2007). The ANOVA was completed instead of a t-test to try to prevent a Type I error
from occurring due to running multiple t-tests (Gravetter & Wallnau, 2008). A resulting
significant F statistic meant that between-group variance was significantly greater than
variance by chance (Kiess & Green, 2010). If a significant F-ratio was found then a post-
hoc test was run to determine where the significant differences were found. The alpha
level was set at 0.05 which will give a 5% risk of a Type I error. If there was no
significant F-ratio found then a post-hoc test was not necessary.

Table 4
Data Analysis Table
Research Questions Data Sources Data Analysis Procedures1.) Which of the following seven lesson planning elements do teachers perceive as having the greatest impact on student achievement: Clear Lesson and Learning Objectives, Creating Quality Assignments, Logically Structured Lessons, Instructional Strategies, Timing, Learning Differences, and Developing Age and Content Appropriate Lessons?
Part 1: Elements of Lesson Planning
Descriptive statistics, ANOVA and post-hoc
analysis
2.) Which of the following seven lesson planning elements are reported by teachers as being used and with what level of relative importance: Clear Lesson and Learning Objectives, Creating Quality Assignments, Logically Structured Lessons, Instructional Strategies, Timing, Learning Differences, and Developing Age and Content Appropriate Lessons?
Part 1: Elements of Lesson Planning in
Practice
Descriptive statistics, ANOVA and post-hoc
analysis
3.) What aspects of creating a quality assignment do teachers perceive as having the greatest impact on student achievement? What aspects of creating a quality assignment do teachers use when planning?
Part 1: Classroom Assignments and
Classroom Assignments in Practice
Descriptive statistics, ANOVA and post-hoc
analysis
4.) What aspects of lesson structure do teachers perceive as having the greatest impact on student achievement? What aspects of lesson structure do teachers use when planning?
Part 1: Lesson Structure, Lesson
Structure in Practice and open ended question
Descriptive statistics, ANOVA and post-hoc
analysis
5.) Is there a difference in teachers’ perceptions regarding which lesson planning elements have the greatest impact on student achievement when considering: (a) elementary school, middle school, or high school level; (b) content areas such as science, social studies, language arts, mathematics; (c) region of the United States; (d) rural, urban, or suburban areas; (e) years of experience; and (f) gender?
Demographic Information and Part 1:
Elements of Lesson Planning
Descriptive statistics, ANOVA and post-hoc
analysis
6.) What method of lesson planning do teachers use most prominently? For teachers who use formal written lesson plans, how many times per day do they reference the written plans?
Part 2: Written Lesson Plans
Descriptive Statistics, ANOVA and post-hoc to
determine if there is a difference between veteran
and novice teachers.
oo00

89
Ethical Considerations
Participants’ privacy and psychological safety was protected throughout the
duration of the study. An introductory email was sent to participants explaining the study
and the ethical safeguards provided. Each participant had the choice to participate or not,
as well as, the opportunity to drop out of the study at any given time. Additionally, the
researcher received approval from the Human Subjects Review Committee at The
College of William and Mary before any data were collected.

Chapter 4
Analysis of Results
This study investigated the perceptions that K-12 teachers have about various
elements of lesson planning. Specifically, the researcher sought to determine which
research-based Elements of Lesson Planning teachers perceived as having the greatest
impact on student achievement and if certain demographic characteristics effected those
perceptions. Data were collected with two surveys created by the researcher (see
Appendices B and C) based on Stronge’s (2007) Framework for Effective Teachers.
Within this framework, Planning and Organizing for Instruction is one of six qualities of
effective teachers. Breaking Planning and Organizing for Instruction down further seven
elements of teacher planning were identified as part of an effective teacher’s lesson
planning: Clear Lesson and Learning Objectives, Creating Quality Assignments,
Logically Structured Lessons, Instructional Strategies, Timing, Learning Differences, and
developing age and content appropriate plans. A national stratified random sample of 184
U.S. educators ranked seven elements of teacher planning in the order they believed that
those qualities impact student achievement. Participants were also asked to rank aspects
of Creating Quality Assignments and Logically Structured Lessons in the order they
believed those aspects to impact student achievement. Finally, participants were asked to
self-report what elements they have used in their classroom and how they plan lessons.
Research Questions
1) Which of the following seven lesson planning elements do teachers perceive as
having the greatest impact on student achievement: Clear Lesson and Learning
90

91
Objectives, Creating Quality Assignments, Logically Structured Lessons,
Instructional Strategies, Timing, Learning Differences, and Developing Age and
Content Appropriate Lessons?
2) Which of the following seven lesson planning elements are reported hy teachers
as being used and with what level of relative importance: Clear Lesson and
Learning Objectives, Creating Quality Assignments, Logically Structured
Lessons, Instructional Strategies, Timing, Learning Differences, and Developing
Age and Content Appropriate Lessons?
3) What aspects of creating a quality assignment do teachers perceive as having the
greatest impact on student achievement? What aspects of creating a quality
assignment do teachers use when planning?
4) What aspects of lesson structure do teachers perceive as having the greatest
impact on student achievement? What aspects of lesson structure do teachers use
when planning?
5) Is there a difference in teachers’ perceptions regarding which lesson planning
elements have the greatest impact on student achievement when considering: (a)
elementary school, middle school, and high school level; (b) teaching different
content areas such as science, social studies, language arts, mathematics; (c) in
different regions of the United States; (d) in rural, urban, and suburban areas; (e)
with different years of experience; and (f) of a different gender?
6) What method of lesson planning do teachers use most prominently? For teachers
who use formal written lesson plans, how many times per day do they reference
the written plans?
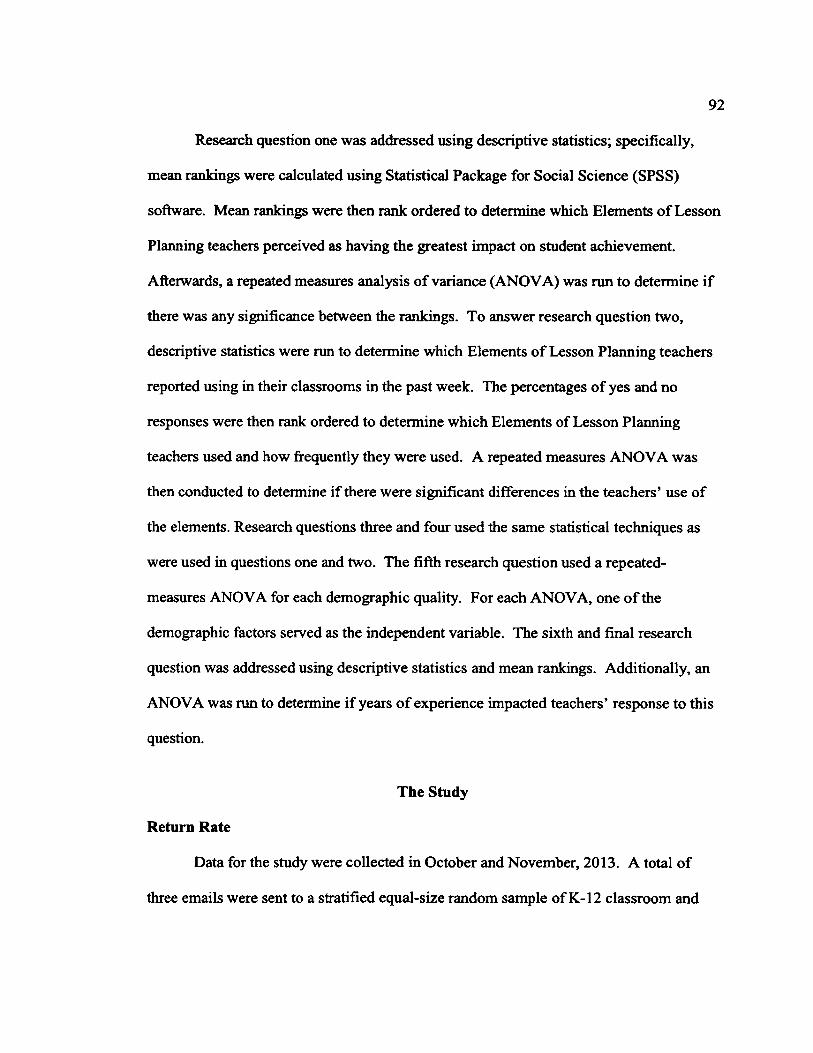
92
Research question one was addressed using descriptive statistics; specifically,
mean rankings were calculated using Statistical Package for Social Science (SPSS)
software. Mean rankings were then rank ordered to determine which Elements of Lesson
Planning teachers perceived as having the greatest impact on student achievement.
Afterwards, a repeated measures analysis of variance (ANOVA) was run to determine if
there was any significance between the rankings. To answer research question two,
descriptive statistics were run to determine which Elements of Lesson Planning teachers
reported using in their classrooms in the past week. The percentages of yes and no
responses were then rank ordered to determine which Elements of Lesson Planning
teachers used and how frequently they were used. A repeated measures ANOVA was
then conducted to determine if there were significant differences in the teachers’ use of
the elements. Research questions three and four used the same statistical techniques as
were used in questions one and two. The fifth research question used a repeated-
measures ANOVA for each demographic quality. For each ANOVA, one of the
demographic factors served as the independent variable. The sixth and final research
question was addressed using descriptive statistics and mean rankings. Additionally, an
ANOVA was run to determine if years of experience impacted teachers’ response to this
question.
The Study
Return Rate
Data for the study were collected in October and November, 2013. A total of
three emails were sent to a stratified equal-size random sample of K-12 classroom and
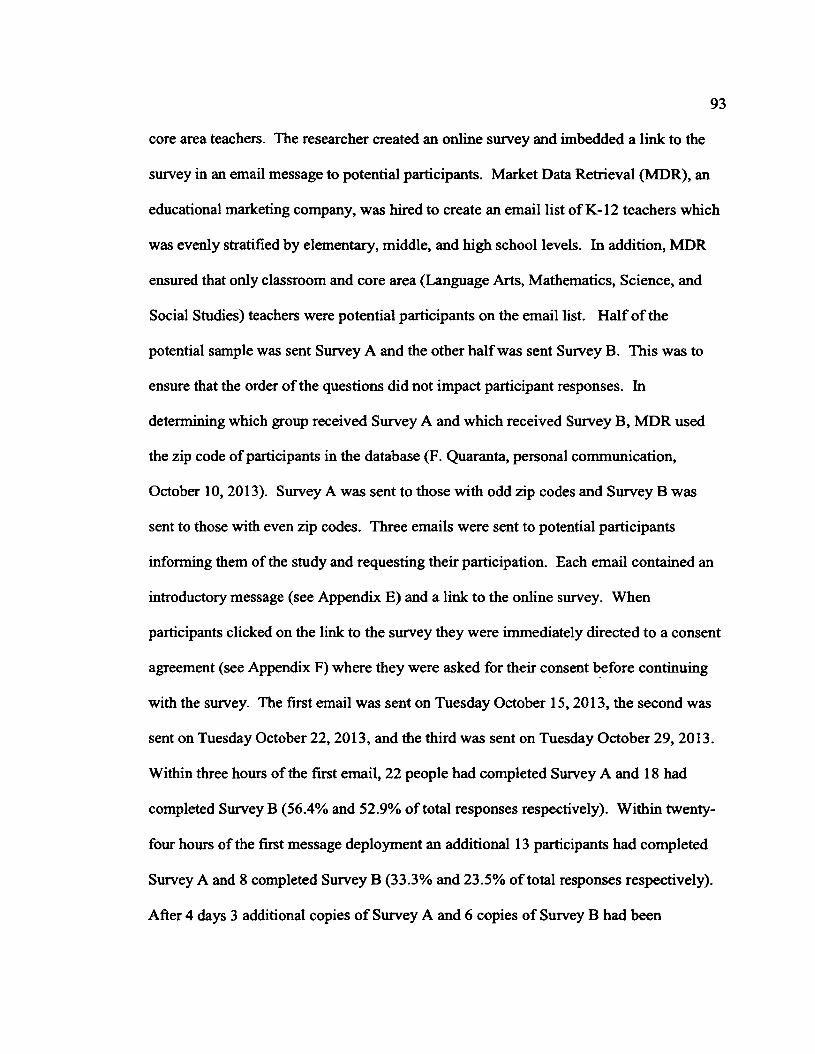
93
core area teachers. The researcher created an online survey and imbedded a link to the
survey in an email message to potential participants. Market Data Retrieval (MDR), an
educational marketing company, was hired to create an email list of K-12 teachers which
was evenly stratified by elementary, middle, and high school levels. In addition, MDR
ensured that only classroom and core area (Language Arts, Mathematics, Science, and
Social Studies) teachers were potential participants on the email list. Half of the
potential sample was sent Survey A and the other half was sent Survey B. This was to
ensure that the order of the questions did not impact participant responses. In
determining which group received Survey A and which received Survey B, MDR used
the zip code of participants in the database (F. Quaranta, personal communication,
October 10, 2013). Survey A was sent to those with odd zip codes and Survey B was
sent to those with even zip codes. Three emails were sent to potential participants
informing them of the study and requesting their participation. Each email contained an
introductory message (see Appendix E) and a link to the online survey. When
participants clicked on the link to the survey they were immediately directed to a consent
agreement (see Appendix F) where they were asked for their consent before continuing
with the survey. The first email was sent on Tuesday October 15,2013, the second was
sent on Tuesday October 22, 2013, and the third was sent on Tuesday October 29, 2013.
Within three hours of the first email, 22 people had completed Survey A and 18 had
completed Survey B (56.4% and 52.9% of total responses respectively). Within twenty-
four hours of the first message deployment an additional 13 participants had completed
Survey A and 8 completed Survey B (33.3% and 23.5% of total responses respectively).
After 4 days 3 additional copies of Survey A and 6 copies of Survey B had been

94
completed (7.7% and 17.6% of total responses respectively). After the fourth day, which
was a Friday, and before the deployment of the second email to participants, only one
copy of Survey A was completed and two copies of Survey B. The results for the second
and third email deployment followed a similar pattern with most responses arriving
within the first twenty-four hours after which the response rate declined. Very few
responses came after day 4, which was a Friday, in all three cases. Table 5 shows the
response rate per email deployment.
Table 5
Response Rates per Email Notification
Elapsed Time after
Email Deploymen
t
EmailSent
October15
Survey A Number
ofComplete d Surveys
EmailSent
October15
Survey B Number
ofComplete d Surveys
Email Sent
October 22
Survey A Number
of Complete d Surveys
Email Sent
October 22
Survey B Number
ofComplete d Surveys
Email Sent
October 29
Survey A Number
ofComplete d Surveys
Email Sent
October 29
Survey B Number
ofComplete d Surveys
3 horns 22 18 12 15 19 1624 hours 13 8 2 4 8 114 days 3 6 3 5 4 67 days 1 2 0 0 1 114 days N/A N/A N/A N/A 4 1
Consistent with research which indicates that 91% of data collected from on-line
surveys is completed within the first 13 days (see Mitra, Jain-Shukla, Robins, Champion,
& Durant, 2008), the rate of participation dropped as the amount of time after the email
notification about the study increased.

95
In addition to looking at the response rate per email deployment, Table 6
delineates the number of complete and incomplete surveys. After the first deployment of
the email message and what the researcher felt was an unusually high number of
incomplete survey responses, more detailed instructions were added to the emails sent out
for the second and third deployment. The on-line survey program which was used
(Survey Monkey) had participants drag and drop sentences in order they instead of
simply choosing a number for each sentence. The researcher thought this method might
be confusing to participants and therefore additional information was added to the
introductory letter (Appendix E) for deployments two and three stating:
“If you have already taken this survey, Thank you so much!
If you have not, there is still time! A tip for the rank order questions:
ignore the number drop down menu and simply drag and drop the
sentences into the order you wish. The number drop down menu works
quickly and moves the sentences into the spot you choose, this happens
quickly and often you won't realize what happened. The easiest fix is to
just drag and drop the sentences in the order you want them.”
These additional instructions do not seem to have impacted the number of
incomplete surveys, as the percentage of incomplete surveys was consistently high:
25.5%, 41.1%, and 26.5% for the three email deployments respectively.

96
Table 6
Number o f Complete and Incomplete Surveys per Email Deployment
Survey Complete Incomplete TotalsSurvey A Deployed October 15
39 17 56
Survey B Deployed October 15
34 8 42
Total for October 15 73 (74.5%) 25 (25.5%) 98
Survey A Deployed October 22
17 14 31
Survey B Deployed October 22
23 14 37
Total for October 22 40 (58.8%) 28(41.2%) 68
Survey A Deployed October 29
35 7 42
Survey B Deployed October 29
37 19 56
Total for October 29 72 (73.5%) 26 (26.5%) 98
Totals 185 79 264
Sampling Anomaly
A sampling anomaly occurred with the third email deployment MDR sent, the
third email was sent to a different stratified equal-size random sample of K-12 classroom

97
and core area teachers than the first two. This anomaly meant that half the sample
received an email inviting them to participate two times and the other half received an
email one time. This provides a reason that the number of responses for the October 29th
deployment improved over the October 22nd deployment as seen in Table 6. Table 7
breaks down the full email list created and deployed for the study as well as the
percentages for each.
Table 7
Total Number o f Emails and Potential Participants
Total Emails Sent
ElementarySchool
MiddleSchool High School
Received Survey A twice
2,543 (49.8%) (*24.4%)
853 (33.5%) (*8.2%)
843 (33.1%) (*8.1%)
847 (33.3%) (*8.1%)
Received Survey B twice
2,561 (50.2%) (*24.6%)
857 (33.4%) (*8.2%)
863 (33.6%) (*8.3%)
841 (32.8%) (*8.1%)
Total Receiving two emails
5,104(*49.1%)
Received Survey A once
2,756 (52.0%) (26.5%)
924 (33.5%) (*8.9%)
918 (33.3%) (*8.9%)
914(33.1%)(*8.8%)
Received Survey B once
2,541 (48.0%) (24.4%)
856 (33.7%) (*8.2%)
847 (33.3%) (*8.1%)
838 (32.9%) (*8.1%)
Total Receiving one email
5,297(*50.9%)
Grand Total for all Potential Participants
10,401 3,490 (33.6%) 3,471 (33.4%) 3,440 (33.1%)
*This percentage reflects the percentage from the Granc Total of Potential Participants.
The table shows that the emails were distributed almost equally among the
stratified groups of elementary, middle, and high school teachers in both the group that
received two emails and the group that received one email. Additionally, an almost equal
number of participants received Survey A and Survey B.

98
In order to account for any differences which may have occurred due to the
sampling anomaly, the researcher used a chi-square test to determine if the frequency
counts were distributed differently for the different samples (Gall, Gall, & Borg, 2007).
Chi-square tests were run on all demographic information to ensure the two groups were
evenly matched. Participants in the two groups showed no differences in the type of
school where they taught, x2 (2, n = 184) = 1.096, p > 0.05. In addition the two groups
showed no difference with respect to the gender of the participants, x2 (1,« = 184) =
0.195, p > 0.05. Looking at the number of years participants taught, there was no
difference between the groups, x2 (4, n = 184) = 2.740, p > 0.05. With regards to the
school setting begin rural, suburban, or urban, the two groups did not differ, x2 (2, n -
184) = 0.540, p > 0.05. Participants also did not differ between groups in which region of
the U.S. where they teach, x2 (3, w = 181) = 0.450, p > 0.05. Finally, looking at the
primary content area in which the teachers teach, there was no difference found between
the groups, x2 (9, n - 184) = 6.507, p > 0.05. However, within this area five of the
answer choices had only a few respondents. This is due to the fact that participants listed
multiple content areas as they teach various subjects.
The results from the chi-square tests showed that there was no difference between
the participants who received one email and those that received two on all the
demographic information available. It can then be assumed that the results are based on
participants’ responses and not differences between the groups.
Knowing there is essentially no difference between the two groups, the researcher
looked at the response rates from the sample. Of the completed surveys from those

99
participants receiving two emails, an equal percent responded to Survey A (2.2%) and
Survey B (2.2%). Additionally, when you look at the response rates for the stratified
groups, they are almost equal as well (see Table 8). The overall response rate of 2.2% for
both Survey A and Survey B is low and may indicate the perceptions given are those of
the sample only and not necessarily the population. Looking at the response rate from
participants who received only one email, the percentages follow the same pattern as
those receiving two emails. Survey A and Survey B received similar response rates
(1.3% and 1.5%, respectfully) and the stratified categories are similar as well (see Table
9). The overall response rate of 1.4% is lower than the participants who received two
emails, which is most likely due to the fact that potential participants were not sent a
follow up email to remind them of the opportunity to participate.
Table 8
Response Rate From Participants Receiving Two Emails
Emails Delivered Survey A
Completed Survey A
Emails Delivered Survey B
Completed Survey B
ElementarySchoolTeacher
853(33.5% of total)
9(1.1%) 857 (33.4% of total)
11 (1.3%)
MiddleSchool
Teachers
843(33.1% of total)
18 (2.1%) 863(33.6% of total)
19 (2.2%)
High School Teachers
847(33.3% of total)
29 (3.4%) 841(32.8% of total)
26 (3.1%)
TotalTeachers
2,543 56 (2.2%) 2,561 56 (2.2%)

100
Table 9
Response Rate from Participants Receiving One Email
Emails Delivered Survey A
Completed Survey A
Emails Delivered Survey B
Completed Survey B
ElementarySchool
Teacher
924(33.5% of total)
8 (0.9%) 856 (33.7% of total)
10(1.2%)
MiddleSchool
Teachers
918(33.3% of total)
14(1.5%) 847(33.3% of total)
17 (2.0%)
High School Teachers
914(33.1% of total)
13(1.42%) 838(32.9% of total)
10(1.2%)
TotalTeachers
2,756 35(1.3%) 2,541 37 (1.5%)
The results indicate that the total response rate from the 10,401 emails that were
sent is 1.8%. This low response rate may impact the generalizability of the results.
In addition to comparing the two different groups, the researcher also compared
the percentages of respondents in the sample with those in the possible sample pool to
examine if the sample is an adequate representation. According to the National Center
for Education Statistics Schools and Staffing Survey for the last year data is available,
2007-2008, there are 3,404,520 public school teachers (https://nces.ed.gov/surveys/
sass/tables/sass0708_029_tl2n.asp). MDR maintains email addresses for 3,373,713
public school teachers (http://www.schooldata.com/pdfs/MDR_Ed_catalog.pdf). This
number includes teachers of all subjects, grades, and schools. These totals are close and
using MDR gave the researcher the best possible sample pool in which to generalize to
the total population of K-12 classroom and core area teachers.

101
The total number of teachers that could have been included in the sample was
1,381,364. This number is smaller than the number of email addresses MDR has on file
for public school teachers due to the fact that only public school classroom teachers,
Language Arts, Mathematics, Science, and Social Studies teachers were included in the
email list developed. Table 10 breaks down the totals from the possible sample pool and
the totals from those participating in the study. The numbers provided for all items were
garnered via personal communications with Frank Quaranta, a MDR expert on November
27,2013.
When looking at differences in the percentages between the population and the
sample, if the percentage is greater than 5% it may impact the generalizability of the
study if any significant differences are found between groups. Therefore, the percentages
of teachers represented in the sample were different than those from the possible sample
pool. The following variable sections will examine the representation of the group within
the sample. The sample used was comprised of 184 teachers K-12 representing 41
different states.
Demographic information
The Elements of Effective Teachers’ Lesson Planning survey contained six
demographic items. Those items requested information on the participants’ school level
where they worked, (elementary, middle or high school), subject area taught, gender,
years of experience, school setting in which they worked, and the state in which they
worked.

Table 10
Comparison o f Population and Study Sample
102
Total % of TotalTotal
Participating in the Study
% of Total Participating in the Study
Difference in %
ElementarySchool
Teachers
690,959 50.0% 38 20.8% -29.2
MiddleSchool
Teachers
236,471 17.1% 68 37.1% +20
High School Teachers
453,934 32.8% 78 42.4% +9.6
MaleTeachers
170,950 17.2% 43 23.5% +6.3
FemaleTeachers
824,446 82.8% 140 76.6% -6.2
Rural Setting Teachers
355,683 34.7% 52 28.4% -6.3
SuburbanSetting
Teachers
387,447 37.8% 100 54.3% +16.5
UrbanSetting
Teachers
280,972 27.4% 32 17.4% -10
1-5 Years’ Experience
86,819 8.0% 22 12.0% +4
5-10 Years’ Experience
141,185 13.0% 38 20.8% +7.8
10-20 Years’ Experience
200,399 18.5% 65 35.3% +16.8
20+Years’ Experience
657,141 60.5% 59 32.2% -28.3
NortheastRegion
611,318* 17.9%* 23 12.7% -5.2
MidwestRegion
922,517* 27.0%* 41 22.7% -4.3
South Region 1,278,376* 37.4%* 87 48.1% +10.7West Region 610,243* 17.8%* 30 16.6% -2.2*These numbers reflect all elementary, middle and high school teachers in the region and not only classroom and core area teachers. Numbers retrieved from http://www.schooldata.com/pdfs/MDR_Ed_catalog.pdf

103
Level o f school and subject area. One hundred and eighty-five teachers
completed the survey; however, one survey had to be removed from analysis because the
participant’s subject area was an instructional coach. Therefore, the information
provided would not have been appropriate or helpful in finding out the lesson planning
practices of teachers as an instructional coach works with the lesson plans of the
classroom teacher. Six other participants had classroom subjects outside of the core
subjects of Language Arts, Mathematics, Science, and Social Studies, but were kept as
the classes required teachers to create lesson plans. Additionally, although there were
one hundred eight-four usable surveys, one participant chose to answer all the questions
but provide no demographics. The survey was deemed usable because the only research
question that requires knowledge of the participants’ demographics is question five.
Table 11 shows the number of usable completed surveys by school level and subject area
taught.
With regards to the number of teachers by school level, national data available on
classroom teachers from the National Center for Education Statistics (NCES) for the most
recent year available, 2007-2008 show that elementary school teachers comprised 63.1%
of the workforce while secondary teachers, middle school and high school, accounted for
32.3%. Public school teachers that teach in a combined K-12 school covered the final
4.6% of teachers
(https://nces.ed.gOv/pubs2009/2009324/tables/sass0708_2009324_tl2n_01.asp).
Comparing these percentages with the study sample shows that elementary school
teachers were underrepresented and secondary teachers were overrepresented.

The NCES data also show the breakdown of classroom teachers by subject area.
For elementary school teachers, 86.8% were considered elementary teachers who taught
all core subject areas, 8.2% were reported as teaching Language Arts, 2.7% taught
Mathematics, 1.2% taught Science, and 1.1% taught Social Studies
(https://nces.ed.gov/surveys/sass/tables/sass0708_033_tln.asp). When comparing these
numbers with the sample study of elementary teachers, the trend is similar though all
areas are underrepresented. In addition, the study sample contains some groups which
were not accounted for in the national survey. Looking at secondary teachers nationally,
Language Arts teachers comprised 31.4%, Mathematics teachers 27.1%, Science teachers
20%, and Social Studies teachers 21.5% of the population
(https://nces.ed.gov/surveys/sass/tables/sass0708_033_tln.asp). In comparison to the
study sample, secondary Language Arts teachers are adequately represented, but the
others are underrepresented. Similar to elementary teachers, the sample contains two
groups which were not taken into account on the national level.

Table 11
Teachers ’ School Level and Subject Area
LA Math Sci SS All Other LA, MA, Sci
LA & MA
MA&Sci.
LA & SS Total
Elem.3 (1.6%) 3 (1.6%) 0 0 26
(14.2%) 1 (0.5%) 2(1.1%) 2(1.1%) 1 (0.5%) 0 38(20.8%)
Middle 23(12.6%)
11(6.0%)
16(8.7%)
13(7.1%) 0 2(1.1%) 0 0 2(1.1%) 1 (0.5%) 68
(37.2%)High 36
(19.7%)17
(9.3%) 8 (4.4%) 12(6.6%) 0 3(1.6%) 0 0 0 1 (0.5%) 77
(42.1%)Total 62
(33.9%)31
(16.9%)24
(13.1%)25
(13.7%)26
(14.2%) 6 (3.3%) 2(1.1%) 2(11%)
3 (1.6%) 2(1.1%) 183

Gender. Out of the 184 completed surveys, 140 were completed by females
(76.5%) and 43 by males (23.5%). Again, one participant chose not to respond to this
demographic question. This split is representative of the target population of U.S. public
school teachers. NCES data from the most recent available year 2007-2008 indicated that
75% of U. S. teachers were female and 25% male
(https://nces.ed.gov/surveys/sass/tables/sass0708_029_tl2n.asp). Table 12 shows the
breakdown of participants by gender.
Table 12
Gender
Frequency Percent Valid Percent CumulativePercent
Valid Female 140 76.1 76.5 76.5male 43 23.4 23.5 100.0Total 183 99.5 100.0
Missing System 1 .5Total 184 100.0
Teaching experience. Participants were asked to select a range of years that most
accurately reflected the total number of years of teaching experience they had in
education. The choices were: (a) less than 3 years, (b) 3-5 years, (c) 6-10 years, (d) 11-
20 years, and (e) 20+ years. The participants’ responses are shown in Table 13; the
majority of participating teachers had eleven or more years’ experience. A majority of
teachers in public elementary and secondary teaching positions nationally also have
eleven or more years’ experience, according to 2007-2008 NCES data (53 % of teachers,
to include non-core secondary teachers). The smallest group on a nation-wide scale is
teachers with less than three years’ experience (13.4%). Teachers with between three and

107
nine years’ experience comprised 33.6% of the teaching population
(https://nces.ed.gov/prograxns/digest/dl 1/tables/dtl l_072.asp). While these percentages
reflect the trend of study sample, teachers with less than three years’ experience are
underrepresented, teachers with three to nine years’ experience are slightly
underrepresented, and teachers with more than eleven years’ experience are
overrepresented in the sample.
Table 13
Years ’ Experience
Frequency Percent Valid Percent CumulativePercent
Valid less than 3 years 9 4.9 4.9 4.93-5 years 13 7.1 7.1 12.06-10 years 38 20.7 20.8 32.811-20 years 64 34.8 35.0 67.820+ years 59 32.1 32.2 100.0Total 183 99.5 100.0
Missing System 1 .5Total 184 100.0
School setting. Participants were asked to characterize the setting of the school in
which they worked as rural, suburban, or urban. Table 14 shows the breakdown of
participants’ responses showing that over half of the participants were from the suburban
setting. The national data available on school setting from the NCES shows that
nationally, 38.8% of teachers teach in a rural area or a town. An additional 35.5% of
teachers are in suburban public schools. Finally, 25.9% are in the city or urban areas
(https://nces.ed.gov/pubs2009/2009324/tables/sass0708_2009324_tl2n_01.asp).
Comparing these national numbers with the study sample from Table 14, rural and urban

108
teachers are underrepresented and suburban teachers are overrepresented in the study’s
sample. Note that for the purposes of this study, rural area and town were combined.
Table 14
School Setting
Frequency Percent Valid Percent CumulativePercent
Valid Rural 52 28.3 28.4 28.4Suburban 99 53.8 54.1 82.5Urban 32 17.4 17.5 100.0Total 183 99.5 100.0
Missing System 1 .5Total 184 100.0
Region. The participants’ region was determined by asking teachers in which
state they currently worked. States were then grouped into regions based on the regions
of the United States used by the U.S. Census Bureau (see Appendix D). Region 1 listed
as the “Northeast” encompasses nine states; Region 2 is identified as the “Midwest” and
includes twelve states; Region 3 referred to as the “South” is the largest region consisting
of sixteen states and the District of Columbia; and Region 4 called the “West” includes
thirteen states. Appendix D contains a complete listing of the states divided by region.
The results in Table 15 show that approximately half of the respondents worked in one of
the states comprising the South region. This makes sense as the South region included
the most states with high populations. Table 15 shows all the respondents’ answers and
the percentages for each. Looking at the NCES data for region, the South comprised the
38.3%, the Midwest 22.7%, the Northeast 19.9%, and the West 19.0% of public school
teachers (https://nces.ed.gov/surveys/sass/tables/sass0708_2009324_tl s_02.asp). In
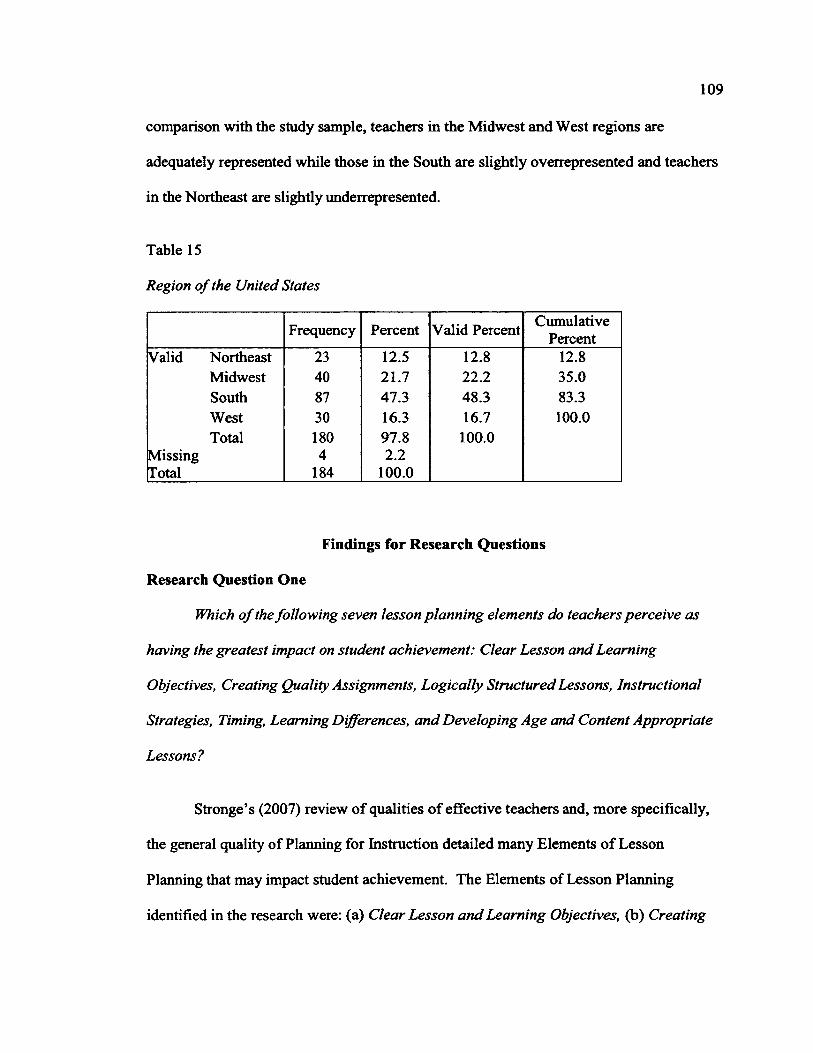
109
comparison with the study sample, teachers in the Midwest and West regions are
adequately represented while those in the South are slightly overrepresented and teachers
in the Northeast are slightly underrepresented.
Table 15
Region o f the United States
Frequency Percent Valid Percent CumulativePercent
Valid Northeast 23 12.5 12.8 12.8Midwest 40 21.7 22.2 35.0South 87 47.3 48.3 83.3West 30 16.3 16.7 100.0Total 180 97.8 100.0
Missing 4 2.2Total 184 100.0
Findings for Research Questions
Research Question One
Which o f the following seven lesson planning elements do teachers perceive as
having the greatest impact on student achievement: Clear Lesson and Learning
Objectives, Creating Quality Assignments, Logically Structured Lessons, Instructional
Strategies, Timing, Learning Differences, and Developing Age and Content Appropriate
Lessons?
Stronge’s (2007) review of qualities of effective teachers and, more specifically,
the general quality of Planning for Instruction detailed many Elements of Lesson
Planning that may impact student achievement. The Elements of Lesson Planning
identified in the research were: (a) Clear Lesson and Learning Objectives, (b) Creating

110
Quality Assignments, (c) Logically Structured Lessons, (d) Timing, (e) Instructional
Strategies, (f) Learning Differences, and (g) Developing Age and Content Appropriate
Lessons. K-12 classroom and core area teachers were asked to rank these lesson planning
elements from 1-7 in the order in which they impact student achievement. A rank of 1
represented the least important quality and the rank of 7 represented the most important
quality. Descriptive statistics were calculated for each quality, including mean and
standard deviation. Mean rankings shown in Table 16 show that the teachers ranked
Creating Quality Assignments as having the most impact on student achievement and
Logically Structured Lessons has having the least impact.
While the term assignment seems ambiguous the operational definition for the
purposes of this study is: Assignments are comprised of activities that students work on
independently after teaching has taken place. Students complete assignments in the
classroom (see Chapter 1). Teachers were not directly provided with this definition;
however, the panel of practioners and experts were given this information as they
reviewed the survey instrument. Not providing participants with the definition limits the
generalizability of the study because the wording chosen may have affected participants’
perceptions and rankings.
Interestingly, participants in the study were somewhat polarized on their views of
Clear Lesson and Learning Objectives as this element was given the ranking of 1 and 7
more than any other element. The other elements received rankings that were fairly
evenly spread. Creating Quality Assignments was boosted by the number of respondents
marking it a 6 or 7, but as Table 16 shows, many participants also gave it a 2 ranking,

I l l
thus, bringing the mean down. Table 16 provides further descriptive statistics for the
rankings of the Elements of Lesson Planning including the frequency that each element
was ranked, the percentage of teachers giving the element that ranking, the median rank,
the mean ranking, and the standard deviation.
After examining the means and standard deviations for the seven Elements of
Lesson Planning shown in Table 16, a repeated-measures ANOVA was conducted on the
mean Elements of Lesson Planning. The ANOVA indicated no significant differences in
the teacher’s perception of which element impacted students the most, F (6,1098) =
0.568, p = 0.76. Table 17 shows the repeated-measures ANOVA results. On the whole,
teachers seemed to rank all the Elements of Lesson Planning equally since no significant
findings were present.

Table 16Rankings o f Lesson Planning Elements
112
Frequency o f Ordered Responses
N =184
Percentage o f Teachers N=184
TeacherMean
TeacherMeanRank
StandardDeviation
CreatingQuality
Assignments
#1 =23 #2 = 31 #3 = 20 #4 = 20 #5 = 20 #6 = 37 #7 = 33
#1 = 12.5% #2 = 16.8% #3 = 10.9% #4 = 10.9% #5 = 10.9% #6 = 20.1% #7 = 17.9%
4.23 1 2.10
InstructionalStrategies
#1 =21 #2 = 23 #3=26 #4 = 36 #5 = 30 #6 = 26 #7 = 22
#1 = 11.4% #2 = 12.5% #3= 14.1% #4 = 19.6% #5 = 16.3% #6= 14.1% #7 = 12.0%
4.07 2 1.87
Timing
#1 =25 #2 = 24 #3 = 33 #4 = 26 #5 = 24 #6 = 20 #7 = 32
#1 = 13.6% #2 = 13.0% #3 = 17.9% #4= 14.1% #5 = 13.0% #6 = 10.9% #7 = 17.4%
4.02 3 2.02
Developing Age and Content
Appropriate Lessons
#1 =24 #2 = 23 #3 = 30 #4 = 31 #5 = 30 #6 = 27 #7= 19
#1 = 13.0% #2 = 12.5% #3 = 16.3% #4 = 16.8% #5 = 16.3% #6 = 14.7% #7 = 10.3%
3.96 4 1.88
LearningDifferences
#1 =26 #2 = 27 #3 = 25 #4 = 24 #5 = 37 #6 = 29 #7= 16
#1 = 14.1% #2 = 14.7% #3 = 13.6% #4 = 13.0% #5 = 20.1% #6 = 15.8% #7 = 8.7%
3.92 5 1.90
Clear Lesson and Learning
Objectives
#1 =44 #2 = 32 #3= 15 #4= 13 #5= 12 #6 = 21 #7 = 47
#1 = 23.9% #2 = 17.4% #3 = 8.2% #4 = 7.1% #5 = 6.5%
#6= 11.4% #7 = 25.5%
3.91 6 2.40
LogicallyStructuredLessons
#1 =21 #2 = 24 #3 = 35 #4 = 34 #5 = 31 #6 = 24 #7= 15
#1 = 11.4% #2 = 13.0% #3 = 19.0% #4 = 18.5% #5 = 16.8% #6 = 13.0% #7 = 8.2%
3.88 7 1.78

113
Table 17
ANOVA fo r the Seven Elements o f Lesson Planning
Source Type in Sum of Squares df Mean
Square F Sig.
LessonPlanningSphericity Assumed Greenhouse-Geisser Huynh-Feldt Lower-bound
15.94615.94615.94615.946
65.2975.4731.000
2.6583.0112.91315.946
.568
.568
.568
.568
.756
.734
.740
.452Error(LessonPlanning)
Sphericity Assumed Greenhouse-Geisser Huynh-Feldt Lower-bound
5136.0545136.0545136.0545136.054
1098969.2911001.577183.000
4.6785.2995.12828.066
Research Question Two
Which o f the following seven lesson planning elements are reported by teachers
as being used and with what level o f relative importance: Clear Lesson and Learning
Objectives, Creating Quality Assignments, Logically Structured Lessons, Instructional
Strategies, Timing, Learning Differences, and Developing Age and Content Appropriate
Lessons?
Stronge (2007) noted in his research of effective teacher’s planning that effective
teachers were found to use Clear Lesson and Learning Objectives, Creating Quality
Assignments, Logically Structured Lessons, Instructional Strategies, Timing, Learning
Differences, and Developing Age and Content Appropriate Lessons when creating lesson
plans. Teachers were asked in the survey to note which Elements of Lesson Planning
they had used in creating their lesson plans in the past week. Each teacher, through use
of a multiple choice question, had the opportunity to select as few or as many of the

114
seven elements as they needed to respond. By selecting the element in the survey they
were responding, yes, they used the element. If the element was not selected they were
responding that, no, they did not use the element in the past week. Table 18 shows Clear
Lesson and Learning Objectives was used by the most teachers while lesson planning in
the past week. Age and Content Appropriate Plans was used by the fewest number of
teachers; however, the percentage of teachers still utilizing this element was 75.5%.
Based on these results it seems that teachers find each of these elements important in
lesson planning as more than 75% of the respondents used each during the week.
Table 18
Ranking o f Elements o f Lesson Planning Used
Frequency of Ordered Responses
N =184
Percentage of Teachers
N=184TeacherMean
TeacherMeanRank
StandardDeviation
Clear Lesson and Learning
Objectives
Yes- 169 No- 15
Yes-91.8% No- 8.2%
1.08 1 .274
LogicallyStructuredLessons
Yes- 155 No-29
Yes- 84.2% No- 15.8%
1.16 2 .365
CreatingQuality
Assignments
Yes-153 No-31
Yes- 83.2% No- 16.8%
1.17 3 .375
Timing Yes-153 No-31
Yes- 83.2% No- 16.8%
1.17 3 .375
InstructionalStrategies
Yes-151 No-33
Yes-82.1% No- 17.9%
1.18 5 .385
LearningDifferences
Yes-146 No-38
Yes- 79.3% No- 20.7%
1.21 6 .406
Developing Age and Content
Appropriate Lessons
Yes-139 No- 45
Yes- 75.5% No- 24.5%
1.24 7 .431

115
Something interesting to note would be that the means for Clear Lesson and
Learning Objectives and Logically Structured Lessons were 6th and 7th, respectively,
when looking at the impact on student achievement, but when looking at the mean for the
same aspects being used in the past week, these elements had the two highest means.
After examining the means and standard deviations and frequencies for the seven
Elements of Lesson Planning shown in Table 18, a repeated-measures ANOVA indicated
a significant difference in the teachers’ use of the elements during the past week, F (6,
1098) = 4.041,/? < 0.01. Table 19 shows the repeated-measures ANOVA results.
Table 19
ANOVA for Elements o f Lesson Planning Used in the Past Week
Source Type III Sum of Squares df Mean
Square F Sig.
useslessplanelementsSphericity Assumed 2.747 6 .458 4.041 .001Greenhouse-Geisser 2.747 5.428 .506 4.041 .001Huynh-Feldt 2.747 5.613 .489 4.041 .001Lower-bound 2.747 1.000 2.747 4.041 .046
Error(useslessplanelements)Sphericity Assumed Greenhouse-Geisser Huynh-Feldt Lower-bound
124.396124.396124.396124.396
1098993.2801027.174183.000
.113
.125
.121
.680
In order to find where the differences were between the elements used in the
classroom, another repeated measures ANOVA was calculated, but this time with the
elements in order by mean (1) Clear Lesson and Learning Objectives; (2) Logically
Structured Lessons; (3) Creating Quality Assignments; (4) Timing; (5) Instructional
Strategies; (6) Learning Differences; (7) Developing Age and Content Appropriate

116
Lessons. The results showed significant differences between some of the elements;
however, in order to determine where significant differences occurred, additional
calculations were completed based on the means and standard deviations. An excel
spreadsheet was created in order to compare the actual differences in the observed means.
By calculating error variance based on the Games-Howell procedure (1976), and using
the q-value, the critical difference was found. The critical difference was then compared
with the difference in means between the two items being compared. If the difference
was greater than the critical difference, there was a significant difference between the two
items. By doing these calculations, the researcher was able to compare the means of all
the elements individually as opposed to just the adjoining pairs that SPSS compared.
Table 20 shows where significances occurred. Within Table 20 the Seven Elements of
Lesson Planning are noted based on the mean (1) Clear Lesson and Learning Objectives
(Objectives); (2) Logically Structured Lessons (Structure); (3) Creating Quality
Assignments (Assignments); (4) Timing (Timing); (5) Instructional Strategies
(Strategies); (6) Learning Differences (Differences); (7) Developing Age and Content
Appropriate Lessons (Appropriate).
The table shows that teachers used the element Clear Lesson and Learning
Objectives significantly more than Learning Differences and Developing Age and
Content Appropriate Lessons. This is interesting as teachers did not perceive any
difference in impacting student achievement, yet it is used significantly more than two of
the other elements. These results might help explain why there was such a split in the
frequency of rankings for Clear Lesson and Learning Objectives in research question one.

Table 20
Significant Findings for Elements o f Lesson Planning Used
Objectives Structure Assignments Timing Strategies Differences Appropriate
Objectives NS NS NS NS NS S S
Structure NS NS NS NS NS NS NS
Assignments NS NS NS NS NS NS NS
Timing NS NS NS NS NS NS NS
Strategies NS NS NS NS NS NS NS
Differences S NS NS NS NS NS NS
Appropriate s NS NS NS NS NS NS

118
Research Question Three
What aspects o f creating a quality assignment do teachers perceive as having the
greatest impact on student achievement? What aspects o f creating a quality assignment
do teachers use when planning?
In Stronge’s (2007) Framework for Effective Teachers, Creating Quality
Assignments was an area within Instructional Planning that was found by research to
make an impact on student achievement. After conducting further research in the area of
Creating Quality Assignments, eight aspects were presented as being part of Creating
Quality Assignments. K-12 classroom and core area public school teachers were asked to
rank the following aspects: (a) Using State Curriculum in classroom assignments, (b)
Using the Adopted Curriculum Materials in classroom assignments, (c) Using Cross
Curricular Assignments, (d) Using Real World Connections to Assignments, (e) Giving
Students Control over Assignments, (f) Using Sustained Writing on assignments, (g)
Using Depth o f Knowledge in order for students to complete an assignment, and (h)
Providing Students with a Scoring Guideline on assignments. Teachers ranked these 8
items based on how they believed them to impact student achievement. A rank of 1
meant that teachers thought that aspect made the least impact, and a rank of 8 meant it
made the most impact. Descriptive statistics were calculated for each item, including
mean, median, and standard deviation. Mean rankings shown in Table 21 show that the
teachers ranked using Real World Connections to Assignments as having the most impact
on student achievement and Using Sustained Writing on Assignments as having the least
impact. Table 21 also shows that the results from the study broken down by the number
of teachers and the frequency and percentage that each item was ranked. One teacher did

119
not respond to this question so the total number of participants is 183. Looking across
the Aspects of Creating Quality Assignments the frequencies and percentages are fairly in
proportion to the mean rank and there is nothing that appears to be unusual in the
distribution of responses.

120
Table 21
Rankings o f Aspects o f Creating Quality Assignments
Frequency of Ordered Responses
N=183
Percentage o f Ordered Responses N = 183
Teache r Mean
Teache r Mean Rank
StandardDeviation
Real World Connections to Assignments
#1 = 18 #2 = 14 #3 = 12 #4= 19
#5=21 #6 = 27 #7 = 26 #8 = 46
#1 = 9.8% #2 = 7.7% #3 = 6.6% #4 = 10.4%
#5= 11.5% #6 = 14.8% #7 = 14.2% #8 = 25.1%
5.33 1 2.35
Depth of Knowledge
Necessary to Complete
Assignments
#1 = 17 #2 = 16 #3 = 16 #4 = 18
#5=26 #6 = 31 #7 = 36 #8 = 23
#1 = 9.3% #2 = 8.7% #3 = 8.7% #4 = 9.8%
#5 = 14.2% #6= 16.9% #7= 19.7% #8 = 12.6%
5.03 2 2.20
Providing Students with Performance
Standard and/or Scoring Guideline for Assignments
#1 = 13 #2=22 #3=25 #4 = 23
#5 = 24 #6 = 23 #7 = 32 #8 = 21
#1 =7.1% #2 = 12.0% #3 = 13.7% #4= 12.6%
#5= 13.1% #6= 12.6% #7 = 17.5% #8= 11.5%
4.78 3 2.17
Student Control Over Assignments
#1 =22 #2=20 #3=25 #4 = 26
#5 = 20 #6 = 25 #7= 19 #8 = 26
#1 = 12.0% #2 = 10.9% #3 = 13.7% #4 = 14.2%
#5 = 10.9% #6 = 13.7% #7 = 10.4% #8 = 14.2%
4.55 4 2.29
CrossCurricular
Assignments
#1 = 15 #2 = 38 #3=29 #4 = 21
#5 = 26 #6 = 20 #7 = 21 #8= 13
#1 = 8.2% #2 = 20.8% #3 = 15.8% #4= 11.5%
#5 = 14.2% #6 = 10.9% #7= 11.5% #8 = 7.1%
4.17 5 2.11
Adopted Curriculum Materials in Classroom
Assignments
#1 =34 #2 = 32 #3=22 #4= 15
#5 = 21 #6= 14 #7 = 25 #8 = 20
#1 = 18.6% #2 = 17.5% #3 = 12.0% #4 = 8.2%
#5 = 11.5% #6 = 7.7% #7 = 13.7% #8 = 10.9%
4.09 6 2.43
State Curriculum in
Classroom Assignments
#1 =39 #2 = 25 #3 = 26 #4= 15
#5= 18 #6 = 21 #7= 15 #8 = 24
#1 =21.3% #2 = 13.7% #3 = 14.2% #4 = 8.2%
#5 = 9.8% #6= 11.5% #7 = 8.2% #8 = 13.1%
4.04 7 2.45
Sustained Writing on
Assignments
#1 =25 #2= 16 #3 = 28 #4 = 46
#5 = 26 #6 = 22 #7 = 9 #8= 11
#1 = 13.7% #2 = 8.7% #3= 15.3% #4 = 25.1%
#5 = 14.2% #6 = 12.0% #7 = 4.9% #8 = 6.0%
4.03 8 1.94

121
After examining the means and standard deviations for the Aspects of Creating
Quality Assignments shown in Table 21, a repeated-measures ANOVA was conducted to
determine if there were significant differences among the means. The repeated-measures
ANOVA indicated a significant difference (F (7, 1274) = 7.92, p < .001) among the
means. Table 22 shows the repeated-measures ANOVA results. These results required
some additional statistical follow up to determine where the differences between the
items occur.
Table 22
ANOVA for Creating Quality Assignments
Source Type III Sum of Squares df Mean
Square F Sig.CreatingAssignments Sphericity Assumed
Greenhouse-Geisser Huynh-Feldt Lower-bound
320.890320.890320.890320.890
75.4595.6481.000
45.84158.77956.818320.890
7.9177.9177.9177.917
.000
.000
.000
.005Error(Creating Sphericity Assumed Assignments) Greenhouse-Geisser
Huynh-Feldt Lower-bound
7376.4857376.4857376.4857376.485
1274993.5931027.885182.000
5.7907.4247.176
40.530
In order to determine where significant differences occurred, hand calculations
were completed based on the means and standard deviations. Similar to research
question two, an excel spreadsheet was created in order to compare the actual differences
in the observed means. The critical difference was calculated as well as the difference
between means, the two were then compared. If the difference was greater than the
critical difference, there was a significant difference between the two items. By

122
comparing the difference and critical difference, significant differences were found
between multiple Aspects of Creating a Quality Assignment. Table 23 shows where
significant differences occurred. The items in Table 23 are placed based on their means
from most impact on student achievement to least impact: (1) Real World Connections to
Assignments (Real); (2) Depth of Knowledge Necessary to Complete Assignments
(Depth); (3) Providing Students with Performance Standard and/or Guideline for
Assignments (Rubric); (4) Student Control Over Assignments (Student Control); (5)
Cross Curricular Assignments (Cross); (6) Using Adopted Curriculum Materials in
Classroom Assignments (Adopted); (7) Using State Curriculum in Classroom
Assignments (State); (8) Using Sustained Student Writing on Assignments (Writing).
Table 23
Significant Differences Among the Aspects o f Creating a Quality Assignment
Real Depth Rubric StudentControl Cross Adopted State Writing
Real NS NS NS NS NS S S S
Depth NS NS NS NS NS NS S S
Rubric NS NS NS NS NS NS S S
StudentControl NS NS NS NS NS NS S S
Cross NS NS NS NS NS NS NS S
Adopted S NS NS NS NS NS NS NS
State s S S S NS NS NS NS
Writing s s s s S NS NS NS

123
Teacher responses to aspects of Creating a Quality Assignment can be grouped.
Real World Connections to Assignments, Depth of Knowledge Necessary to Complete
Assignments, Providing Students with Performance Standard and/or Guideline for
Assignments, and Student Control Over Assignments tend to focus the heart of the
activity and assignment on the student and his/her needs to successfully complete the
task. Cross Curricular Assignments, Using Adopted Curriculum Materials in Classroom
Assignments, Using State Curriculum in Classroom Assignments, and Using Sustained
Student Writing on Assignments focus more on the needs of the institution when creating
an assignment. The highest ranking items are very student-centric, focusing on the
individual needs of students. The lower ranking items tend to be more institution-centric.
Based on these results teachers feel that focusing on the student-centric aspects of
Creating Quality Assignments makes more of an impact on student achievement than a
top-down model.
The second part of question three looks at what Aspects of Creating Quality
Assignments teachers are using in their classrooms. Teachers were asked to choose from
the eight items which they had used in their classroom in the past week. The teachers
could select as many or as few items as they needed to answer the question. If they
selected an aspect, it meant that yes they had used that item and if they did not select it
that meant “no” they had not used that aspect. Descriptive statistics were then run on the
results to determine the frequency of responses, mean, and standard deviation. Table 24
shows the responses and is ordered based on which aspect was used the most and which
was used the least. Looking at the Mean Ranking, congruent with what the teachers
perceived as the most import aspect, Real World Connections and Depth of Knowledge

124
were the top two aspects used in the classroom. Using the State Curriculum in
Classrooms is the only aspect that seems to be different in use and perception as it was
used 3rd most, but the perception was that it was 7th when teachers rank-ordered the items.
This could be related to what districts and individual schools require from teachers with
respect to lesson plans.
Table 24
Ranking o f Aspects o f Creating Quality Assignments Used
Frequency of Ordered
Responses N =184
Percentage of Teachers N=184
TeacherMean
Teacher Mean Rank
StandardDeviation
Real World Connections to Assignments
Yes- 164 No-20
Yes- 89.1% No- 10.9%
1.11 1 .31
Depth of Knowledge
Necessary to Complete
Assignments
Yes-140 No-44
Yes-76.1% No- 23.9%
1.24 2 .43
State Curriculum in Classroom Assignments
Yes-132 No-52
Yes-71.7% No- 28.3%
1.28 3 .45
Providing Students with Performance Standard and/or
Scoring Guideline for Assignments
Yes-117 No- 67
Yes- 63.6% No- 36.4%
1.36 4 .48
Adopted Curriculum Materials in Classroom
Assignments
Yes-110 No-74
Yes- 59.8% No- 40.2%
1.40 5 .49
Sustained Writing on Assignments
Yes-104 No-80
Yes- 56.5% No- 43.5%
1.43 6 .50
Student Control Over Assignments
Yes- 94 No-90
Yes-51.1% No- 48.9%
1.49 7 .50
Cross Curricular Assignments
Yes- 87 No- 97
Yes- 47.3% No- 52.7%
1.52 8 .50

125
Something interesting about these findings is the percentages of teachers that
replied yes and no. The Elements of Lesson Planning were used by 75% or higher for
each element, yet the Aspects of Creating Quality Assignments dips below 50% for the
8th item and is within the 50%-60% range for half of the items. This is curious and may
be the result of teachers disagreeing with the Aspects of Creating Quality Assignments
given and, thus, choosing other ways to plan assignments. The implication here is that
due to many teachers not using a few of the provided Aspects of Creating Quality
Assignments there are other aspects teachers prefer to use.
To determine if some of these aspects of Creating Quality Assignments were used
significantly more than others hand calculations were completed based on the means and
standard deviations. Similar to research questions two and three, an excel spreadsheet
was created in order to compare the actual differences in the observed means. The
critical difference and difference between means was calculated, the two were then
compared. If the difference was greater than the critical difference, there was a
significant difference between the two items. By comparing the difference and critical
difference, it was found there were many significant differences in which aspects teachers
used in the past week. Real World Connections to Assignments was used significantly
more than any of the other seven aspects. Depth of Knowledge Necessary to Complete
Assignments was used significantly more than half of the listed aspects of Creating
Quality Assignments. Table 25 gives a complete picture of where significant differences
occurred. The table is organized by the mean from Table 24 and is as follows: (l)Real
World Connections to Assignments (Real); (2) Depth of Knowledge Necessary to
Complete Assignments (Depth); (3) State Curriculum in Classroom Assignments (State);

126
(4) Providing Students with Performance Standard and/or Scoring Guideline for
Assignments (Rubric); (5) Adopted Curriculum Materials in Classroom Assignments
(Adopted); (6) Sustained Writing on Assignments (Writing); (7) Student Control Over
Assignments (Student Control); (8) Cross Curricular Assignments (Cross).
Table 25
Significant Findings for Aspects o f Creating Quality Assignments Used
Real Depth State Rubric Adopted Writing StudentControl Cross
Real NS S S S S S S S
Depth S NS NS NS S S S S
State s NS NS NS NS S S S
Rubric s NS NS NS NS NS NS S
Adopted s S NS NS NS NS NS NS
Writing s s S NS NS NS NS NSStudentControl s s s NS NS NS NS NS
Cross s s s S NS NS NS NS
The results seem to indicate that teachers think Real World Connections to
Assignments are more important in impacting student achievement and, as a result, use
this aspect in their planning significantly more than any of the other listed aspects. With
so many significant differences there is an indication that teachers prefer to use student-
centric assignments as opposed to institution-centric assignments which is consistent with
their perception on the impact on student achievement. Another indication is there may

127
be other ways of Creating a Quality Assignments that teachers use more frequently, but
were not listed in the survey.
Research Question Four
What aspects o f lesson structure do teachers perceive as having the greatest
impact on student achievement? What aspects o f lesson structure do teachers use when
planning?
Stronge’s (2007) research in Framework for Effective Teachers found
Instructional Planning to be important for effective teachers; further research found that
Lesson Structure was an important aspect of Instructional Planning and it was determined
that there were five items that impact student achievement when structuring lessons. K-
12 public school teachers were asked to rank the five items (a) Focusing Attention on the
Sequence o f a Single Lesson, (b) Focusing Attention on the Sequence o f Multiple Lessons,
(c) Giving Step-by-Step Instructions, (d) Focusing Attention on the Sequence o f Questions
to be Asked by the Teacher, and (e) Aligning the Learning Objective, Activity, and
Assessment. Teachers ranked these 5 items on their impact on student achievement. A
rank of 1 meant that teachers thought that aspect o f creating a quality assignment made
the least impact and a rank of 5 meant it made the most impact. Descriptive statistics
were calculated for each item, including mean, median, and standard deviation. Mean
rankings shown in Table 26 show that the teachers ranked Aligning Learning Objective,
Activity, and Assessment as having the greatest impact on student achievement and
Sequencing of Questions to be Asked by the Teacher as having the least impact. Table 26

128
also shows the mean, median, standard deviation and the results broken down by the
number of teachers and the frequency and percentage that each item was ranked.
Table 26
Rankings o f Aspects o f Lesson Structure
Frequency of Ordered Responses
N =184
Percentage of Ordered Responses N = 184
TeacherMedianRank
TeacherMean
TeacherMeanRank
StandardDeviation
Alignment of the
Learning Objective, Activity,
and Assessment
#1 =35 #2 = 24 #3 = 15 #4 = 16 #5 = 94
#1 = 19.0% #2= 13.0% #3 = 8.2% #4 = 8.7% #5 = 51.1%
5.0 3.60 1 1.64
Sequencing of Multiple Lessons in a
Unit
#1 =25 #2 = 40 #3=39 #4 = 58 #5 = 22
#1 = 13.6% #2 = 21.7% #3 = 21.2% #4 = 31.5% #5 = 12.0%
3.0 3.07 2 1.25
Sequencing of a Single
Lesson
#1=24 #2 = 46 #3 = 58 #4 = 40 #5 = 16
#1 = 13.0% #2 = 25.0% #3 = 31.5% #4 = 21.7% #5 = 8.7%
3.0 2.88 3 1.15
Step-by-stepInstructions
#1 = 51 #2 = 34 #3 = 30 #4 = 41 #5 = 28
#1 = 27.7% #2= 18.5% #3 = 16.3% #4 = 22.3% #5 = 15.2%
3.0 2.79 4 1.45
Sequencing of Questions to be Asked
by the Teacher
#1 =49 #2 = 40 #3 = 42 #4 = 29 #5 = 24
#1 = 26.6% #2 = 21.7% #3 = 22.8% #4 = 15.8% #5 = 13.0%
3.0 2.67 5 1.36

129
Looking across the descriptive statistics the difference in median value sticks out.
For Aligning Lesson Objective, Activity, and Assessment the median is 5 whereas the
median for the other items is 3. This could mean that this item, in particular, is different
than the others as more than 50% of teachers ranked it as the most important aspect of
lesson structure in impacting student achievement. None of the other percentages appear
out of line with the mean and ranking. Step-by-Step Instructions and Sequencing of
Questions to be Asked by the Teacher both have the highest percentage of participants
assigning it a ranking of 1 or 2, meaning they are the least important aspects when it
comes to impacting student achievement as perceived by the teachers in the study.
After examining the means and standard deviations for the Aspects of Logically
Structured Lessons shown in Table 26, a repeated-measures ANOVA was conducted on
the Aspects of Logically Structured Lessons means. The repeated-measures ANOVA
indicated a significant difference (F (4, 732) = 10.26,/? < 0.001) among the means. Table
27 shows the repeated-measures ANOVA results. These results require some additional
statistical follow up to determine where the differences between the items occur.

130
Table 27
ANOVA for Aspects o f Logically Structured Lessons
SourceType HI Sum of Squares
df MeanSquare F Sig.
LogicallyStructuredSphericity Assumed Greenhouse-Geisser Huynh-Feldt Lower-bound
97.66397.66397.66397.663
43.5793.6591.000
24.41627.28926.69197.663
10.25810.25810.25810.258
.000
.000
.000
.002Error(LogicallyStructured)
Sphericity Assumed Greenhouse-Geisser Huynh-Feldt Lower-bound
1742.3371742.3371742.3371742.337
732654.930669.604183.000
2.3802.6602.6029.521
In order to determine where significant differences occurred, additional
calculations needed to be completed based on the means and standard deviations. An
excel spreadsheet was created in order to compare the actual differences in the observed
means. Similar to the procedure used to find the differences in research questions two
and three, the error variance and the q-value were calculated in order to determine the
critical difference. The critical difference was then compared with the difference in
means between the two items being compared. If the difference was greater than the
critical difference, there was a significant difference between the two items (Games &
Howell, 1976). By doing these calculations, the researcher was able to compare the
means of all the aspects individually. By comparing the difference and critical
difference, significant differences were found between multiple Aspects of Logically
Structured Lessons. Table 28 shows where significant differences occurred. The items
in Table 28 are in rows based on their means from most impact on student achievement to
least impact: (1) Alignment of the Learning Objective, Activity, and Assessment (Align);

131
(2) Sequencing of Multiple Lessons in a Unit (Sequence Multiple); (3) Sequencing of a
Single Lesson (Sequence Single); (4) Step-by-step Instructions (Instructions); and (5)
Sequencing of Questions to be Asked by the Teacher (Questions).
Table 28
Significant Differences for Aspects o f Logically Structured Lessons
Align SequenceMultiple
SequenceSingle Instructions Questions
Align NS NS NS S SSequenceMultiple NS NS NS NS S
SequenceSingle NS NS NS NS S
Instructions S NS NS NS S
Questions s S S S NS
These results show that teachers believe that all aspects of Logically Structured
Lessons are significantly more important than Sequencing of Questions to be Asked by
the Teacher.
To answer the second part of research question 4, teachers were asked to choose
from the five items given as Aspects of Logically Structured Lessons and state which, if
any, they had used in their classroom in the past week. The teachers could select as many
or as few items as they needed to answer the question. If they selected an aspect, it meant
that yes they had xxsed that item and if they did not select it that meant “no” they had not
used that aspect. Descriptive statistics were run on the results to determine the frequency
of responses, mean, and standard deviation. Table 29 shows the responses and is ordered

132
based on which aspect was used the most and which was used the least. Congruent with
what the teachers perceived as the most import aspect and least important aspect,
Alignment of the Learning Objective, Activity, and Assessment and Sequencing of
Questions to be Asked by the Teacher were used most frequently and least frequently.
Table 29
Ranking o f Aspects o f Logically Structured Lessons Used
Frequency of Ordered Responses
N =184
Percentage of Teachers
N=184TeacherMean
TeacherMeanRank
StandardDeviation
Alignment of the
Learning Objective, Activity,
and Assessment
Yes- 161 No- 23
Yes- 87.5% N o -12.5%
1.12 1 .331
Step-by-stepInstructions
Yes- 156 No-28
Yes- 84.8% No- 15.2%
1.15 2 .360
Sequencing of Multiple Lessons in a
Unit
Yes- 138 No-46
Yes- 75.0% No- 25.0%
1.25 3 .434
Sequencing of a Single
Lesson
Yes- 130 No-54
Yes-70.7% No- 29.3%
1.29 4 .457
Sequencing of Questions to be Asked
by the Teacher
Yes- 97 No-87
Yes- 52.7% No- 47.3%
1.47 5 .501
After looking at the frequencies and other descriptive statistics for the aspects of
Logically Structured Lessons teachers reported using in the past week a repeated
measures ANOVA was calculated to see if teachers’ use of the aspects was significant.

133
The ANOVA showed that teachers used some aspects of Logically Structured Lessons
more than others. Table 30 shows which items were significant. The table lists items in
order by mean (1) Alignment of the Learning Objective, Activity, and Assessment
(Align); (2) Step-by-step Instructions (Instructions); (3) Sequencing of Multiple Lessons
in a Unit (Sequence Multiple); (4) Sequencing of a Single Lesson (Sequence Single); and
(5) Sequencing of Questions to be Asked by the Teacher (Questions). The table shows
that similar to teachers’ ranking of impact, Sequencing of Questions to be Asked by the
Teacher was used significantly less by the teachers than the other four aspects.
Additionally, it shows that Aligning the Learning Objective, Activity, and Assessment
was used significantly more than three of the other items listed. This makes sense since
the teachers ranked it as the most important aspect of Lesson Structure that impacts
student achievement, the teachers also use it significantly more often.
Table 30
Significant Findings for Aspects o f Logically Structured Lessons Used
Align Instructions SequenceMultiple
SequenceSingle Questions
Align NS NS S S SInstructions NS NS NS S SSequenceMultiple S NS NS NS S
SequenceSingle s S NS NS S
Questions s s S S NS
An interesting result is that there was no significant difference in impact on
student achievement between Sequencing of a Single Lesson and Step-by-Step

134
Instructions, but a significant difference was found in teachers’ usage of these elements.
Step-by-Step Instructions was used significantly more often than Sequencing of a Single
Lesson, which may indicate that teachers find it important to use step-by step instructions
in the classroom but do not see the impact on student achievement.
Research Question Five
Is there a difference in teachers ’perceptions regarding which lesson planning
elements have the greatest impact on student achievement when considering: (a)
elementary school, middle school, or high school level; (b) content areas such as science,
social studies, language arts, mathematics; (c) region o f the United States; (d) rural,
urban, or suburban areas; (e) years o f experience; and (f) gender?
Teachers in the study ranked the seven general Elements of Lesson Planning in
the order in which they perceived those elements to impact student achievement. Each
ranking was then tested for statistical significance using a repeated-measures ANOVA.
For each ANOVA one of the following demographic factors served as the independent
variable; (a) school level where they worked (elementary, middle or high school); (b)
subject area taught; (c) gender; (d) years of experience; (e) school setting in which they
worked (rural, suburban, urban); and (f) region of the United States. It was found that
none of these factors significantly impacted how teachers rank-ordered the Elements of
Lesson Planning. These results help to support the idea that the seven researched
Elements of Lesson Planning are seen as equally important across these demographic
areas. Table 31 shows the demographics used as independent variables and the ANOVA
results.

135
Table 31
ANOVA Results for Demographic Factors and Ranking ofElements o f Lesson Planning
Demographic ANOVA Results SignificanceSchool level F (2,180) = 1.748, p> 0.05 Not significantSubject Area F (9,173) = 1.082, p > 0.05. Not significantGender F ( l , 181)= 1.749, p> 0.05. Not significantYears of Experience F (4,178) = 0.876,/? > 0.05. Not significant
School Setting F ( 2, 180) = 0.133, p > 0.05. Not significantRegion F ( 3 ,176) = 0.900, p > 0.05. Not significant
Research Question Six
What method o f lesson planning do teachers use most prominently? For teachers
who use formal written lesson plans, how many times per day do they reference the
written plans?
After teachers were asked to rank-order items and disclose which lesson planning
elements they used in their classroom, they were asked questions about the lesson plans
they use in the classroom. Teachers were asked what type of lesson plans they used and
were given the choice of (a) I use written lesson plans, (b) I use no formal lesson plans, or
(c) I use a mental model for lesson plans. One-hundred eighty three teachers responded
to this question and one did not. Table 32 shows the frequency and percentage of
teachers’ responses. Table 32 shows that over 60% of the teachers use written lesson
plans and a little more than a quarter of teachers use a mental model.

136
Table 32
Type o f Lesson Plans Used by Teachers
Frequency Percent ValidPercent
CumulativePercent
Valid I use written lesson plans 116 63.0 63.4 63.4I use no formal lesson plans 14 7.6 7.7 71.0I use a mental model for lesson plans 53 28.8 29.0 100.0
Total 183 99.5 100.0Missing System Total
1184
.5100.0
In addition to giving information on what type of lesson plans teachers use in their
classroom, teachers were also asked how many times per day they reference their written
lesson plans. For teachers who responded that they use no formal lesson plans or use a
mental model, they automatically skipped this question. Therefore, 67 (36.6%) teachers
automatically skipped this question in the survey. One hundred sixteen teachers were
then asked, “Based on your experience using a written lesson plan, how often do you
refer to your written lesson plan during the course o f a day? ” The teachers were then
given an open response box to type their answers. Due to the open response box, a
variety of answers were received. Therefore, a code was developed for responses in
order to insert the data into SPSS. After looking over all the answers both numerically
and reading what teachers responded the following code was developed (See Table 33).
The code was developed to categorize all the responses to ensure the most accurate
picture of what teachers’ responses were.

137
Table 33
Coded Responses for Lesson Plan Review
Code What It Means0 zero, never, none1 1 time per day, in the morning,
once, rarely, very little, seldom
2 2, 2-3, sometimes, a couple3 3 or 4 times, 3-4, a few times4 5-7 times per day, often, quite
a bit, several5 A lot6 Before every class period7 Less than once per day, every
few days, almost everyday8 Did not answer
After inputting the data into SPSS for how often teachers refer to their written
lesson plans in a day descriptive statistics were calculated. One hundred sixteen teachers
responded and 68 were missing. The sixty-eighth person missing skipped both questions
about lesson plans. Table 34 shows the mean, median, and mode of the data as well as
the standard deviation. The mode reveals that more teachers refer to their lesson plans
once per day than any other category. One respondent remarked, “I glance at them in the
morning, but I know what is in them.”
Table 34
Descriptive Statistics for Those who Use Written Lesson Plans
N Valid 116Missing 68
Mean 3.4828Median 3.0000Mode 1.00Std. Deviation 2.18088

138
After examining the descriptive statistics, the frequency of the possible responses
was examined. The result showed that 14.7% of respondents refer to their lesson plans
approximately once per day. Interestingly, the frequencies for the next three codes (2, 3,
and 4) were equal and used by 8.7% of teachers. This seems to indicate that aside from
the 14% of teachers who refer to their lesson plans about once a day, there is no standard
practice. Table 35 shows the frequencies for how teachers responded to how often they
refer to their written lesson plans during the course of a day.
Table 35
How Often Lesson Plans are Referred to During the Course o f a Day
Frequency Percent ValidPercent
CumulativePercent
Valid O, zero, never, none 3 1.6 2.6 2.61 time, in the morning, once, rarely, very little, seldom 27 14.7 23.3 25.9
2, 2-3, sometimes, a couple 16 8.7 13.8 39.73 or 4, 3-4, a few 16 8.7 13.8 53.45-7 Times, quite a bit, often, several 16 8.7 13.8 67.27+ times, a lot 11 6.0 9.5 76.7Before every class 15 8.2 12.9 89.7Less than once per day, every few 8 4.3 6.9 96.6days, almost everydaydid not answer 4 2.2 3.4 100.0Total 116 63.0 100.0
Missing System 68 37.0Total 184 100.0
In addition to looking at the frequencies of teacher responses, a one-way ANOVA
was run to compare the mean difference between teachers’ years of experience and the
type of lesson plans they use. This was done as the perception is that as teachers advance

in their careers they use written plans less often. The following Table 36 shows the result
that there was no significant difference between the number o f years taught and the type
of lesson plan used by the teacher F (2, 180) = 0.913, p > 0.05.
Table 36
ANOVA Comparing Number o f Years Taught and Type o f Lesson Plan Used
Sum of Squares df Mean Square F Sig.
Between Groups 2.253 2 1.127 .913 .403Within Groups 222.151 180 1.234Total 224.404 182

Chapter 5
Summary and Discussion of Findings
The need for teachers to be effective in their chosen profession is vital to the
success of students, schools, and the economy in the United States. As Secretary of
Education Arne Duncan said in a 2009 speech,
.. .the quality of our education system says as much about the long-term
health of our economy as the stock market, the unemployment rate and the
size of the gross domestic product. That’s because the quality of our work
force and the intellectual breadth and depth of our future leaders is directly
related to the quality of education we provide today, (para. 2-3)
There is an abundance of research focused on the importance of effective teachers
(see Porter & Brophy, 1988; Ding & Sherman, 2006; Kuppermintz, 2003; Newton,
Darling-Hammond, Haertel, & Thomas, 2010), with much of that research focusing on
the impact of an effective teacher on student achievement. One of the most notable
studies was of the Tennessee Value Added Assessment System (TVAAS), which Sanders
et. al, (2008) reported finding that highly effective teachers can produce nearly three
times the student achievement gains of low-performing teachers. Other studies looking at
the impact of effective teachers have found similar results (Wright et. al, 1997; Hanushek
et. al, 2005). Although there is some difference in opinion on how teacher effectiveness
data should be used, there is agreement that effective teachers make a difference
(Goldhaber, 2002; Harris, 2009; Hill, 2009; Milanowski, 2004; Odden, Borman &
Fermanich, 2004; Sanders et. al, 2008; Wright et. al, 1997).
140

141
As the importance of effective teachers became better understood, research
became more focused on attempting to determine particular characteristics of teachers
who effectively promote student achievement and learning (see Darling-Hammond, 2000;
Hattie, 2003, 2009; Stronge et. al, 2007). Looking across frameworks for effective
teachers, meta-analysis by Stronge (2007) identified several general qualities that impact
student achievement and painted a comprehensive picture of effective teaching. One of
the qualities Stronge (2007) identified was Planning & Organizing fo r Instruction.
Within this quality, Instructional Planning of the teacher was identified as an indicator of
effectiveness. Looking more deeply at Instructional Planning, Stronge (2007) identified
seven elements that are included during Instructional Planning by effective teachers:
Clear Lesson and Learning Objectives, Creating Quality Assignments, Logically
Structured Lessons, Instructional Strategies including the use of organizers, timing,
Learning Differences, and developing age and content appropriate plans. This study
sought to determine teachers’ perceptions as to which of these seven elements has the
greatest impact on student achievement and discern which elements teachers actually
utilize during their lesson planning. Furthermore, the study attempted to determine which
aspects of Creating Quality Assignments and Logically Structured Lessons teachers
perceived as having the most impact on student and achievement and which aspects
teachers utilize in planning.
Data were collected via a national stratified random sample of 184 teachers who
completed an online survey in October and November of 2013. Specifically, the teachers
were asked to rank the seven Elements of Lesson Planning by effective teachers. They

142
were also asked to identify which of the elements they used in their planning in the past
week. Additionally, teachers were asked to rank aspects of Creating Quality
Assignments and Logically Structured Lessons and identify which items they used in the
recent planning. These aspects were drawn from further research which identified
aspects of these lesson planning elements that were effective (see Clare, 2001; Good &
Brophy, 2003; Jones et al., 2011; Koh & Luke, 2009; Pressley et. al, 1998; Wang et al.,
1993a; Wharton-McDonald et. al, 1998; Zahorik, 2003). Finally, teachers were asked
administrative questions about their lesson plans as well as six demographic questions.
Results revealed that among the seven elements of effective lesson planning there
was no significant difference in teachers’ rankings of the elements’ impact on student
achievement. There were significant differences in teachers’ perceptions of which
aspects of Creating Quality Assignments and Logically Structured Lessons most impact
student achievement. Additionally, significant differences were found among the
elements of planning, aspects of creating assignments, and aspects of Logically
Structured Lessons that teachers used in their planning in the past week. When
examining results based on the demographic criteria, no significant differences were
found. Finally, it was found that most teachers use written lesson plans and the number
of times they refer to them varies as well as the variety of reasons for referring to them.
Summary of Findings
Research Question One
Which o f the following seven lesson planning elements do teachers perceive as
having the greatest impact on student achievement: Clear Lesson and Learning

143
Objectives, Creating Quality Assignments, Logically Structured Lessons, Instructional
Strategies, Timing, Learning Differences, and Developing Age and Content Appropriate
Lessons?
Teachers participating in the study ranked seven Elements of Lesson Planning in
the order which they perceived those qualities to impact student achievement. The
Elements of Lesson Planning were based on Stronge’s (2007) review of qualities of
effective teachers and more specifically the general quality of Planning for Instruction,
which identified Elements of Lesson Planning that impact student achievement including:
(a) Clear Lesson and Learning Objectives, (b) Creating Quality Assignments, (c)
Logically Structured Lessons, (d) Timing, (e) Instructional Strategies, (f) Learning
Differences, and (g) Developing Age and Content Appropriate Lessons. O f the given
elements, teachers ranked Creating Quality Assignments as having the most impact on
student achievement (M = 4.23, SD = 2.10). Teachers ranked Logically Structured
Lessons has having the least impact (M = 3.88, SD = 1.78). There was no significant
difference among the elements in the teachers’ rankings of which element impacted
students the most F (1,183) = 0.100, p > 0.05. In general, teachers ranked all the
Elements of Lesson Planning equally since no significant finding was present. This
finding may indicate that the Elements of Lesson Planning put forth by Stronge (2007)
are deemed equally important and useful in student achievement by teachers.
Interestingly, participants in the study were somewhat polarized on their views of
Clear Lesson and Learning Objectives. Teachers gave this element a number 1 ranking
(least impact) or a number 7 ranking (most impact) almost twice as much as any other

144
element with 23.9% and 25.5% of the responses respectively. All the other elements
received an average of 12.6% of participants giving a number 1 ranking and 12.4%
giving a number 7 ranking. This polarization may come from the development of
standards and objectives by districts, states, and the common core are taking the
importance of creating the objectives away from teachers. By creating these standards
and giving them to teachers it might be causing teachers to over-focus on the activity as
the objectives have already been provided to them. Giving teachers prescribed standards
and objectives may change how teachers plan. Some teachers might still begin with the
objective and clarify its meaning and purpose before moving to the activity, while others
may assume that the standards and objectives given to them are clear and start with the
activity. Since the standards did not originate with the teacher, potential exists for a lack
of clarity. This lack of clarity might also lead to a lack of alignment between objective
and assignment. If teachers use the standards and objectives given to them as a guide to
then create their own objectives to work toward the given standards then perhaps they
will feel more ownership over these objectives and ensure the objectives are an equal
focal point to that of the activity or assignment. As Jones et. al (2003) noted, “state
standards provide a good place to start in determining what to teach, but it is important to
have a focused learning objective that is clear to the teacher and students.” If teachers
just use what is given, it might not be fully clear to them and that lack of clarity will
likely be passed onto students through the activities and assignments.
In a small way, the standards movement mimics the failed attempts at “teacher
proofing” the curriculum. Previous attempts at “teacher proofing” the curriculum led to

145
the discovery that in order to achieve true gains in education, the system would need to
work through teachers instead of trying to work around them (Porter & Brophy, 1988).
The standards movement might be seen as a middle ground in that teachers are told what
standards to teach, but are then left to decide how to teach it.
Although teachers were limited in their choices of which Elements of Lesson
Planning they could rank, the seven provided by Stronge (2007) seem to be a good
representation based on the fact that teachers did not think that one element was
significantly more important than the others. Though potential still exists that there may
be other elements not identified by Stronge (2007) which might be viewed as impacting
student achievement more significantly.
Research Question Two
Which o f the following seven lesson planning elements are reported by teachers
as being used and with what level o f relative importance: Clear Lesson and Learning
Objectives, Creating Quality Assignments, Logically Structured Lessons, Instructional
Strategies, Timing, Learning Differences, and Developing Age and Content Appropriate
Lessons?
In the survey teachers were asked to mark the Elements of Lesson Planning that
they had used in the past week during their preparations to teach. The teachers were
given a multiple choice format and were able to select as few or as many elements as they
desired. By selecting the element, it signified that the teacher had used the element in the
past week during planning.

146
Clear Lesson and Learning Objectives was the element of lesson planning that
participants reported using the most in the previous week of planning (91.8%) (M = 1.08,
SD = 0.274). This result shows that teachers appear to be implementing a key tenant of
research on effective teaching, that increasing clarity and developing instructional
objectives impact students in a variety of ways (Danielson, 2007; Davis and Thomas,
1989; Marzano, 2007; Omstein & Lasley, 2004: Stronge, 2007). By setting these
objectives it helps the teacher establish and communicate with students (Marzano, 2007)
which, in turn, helps with classroom management and organization (Stronge, 2007).
While it is encouraging to see that teachers are reported using this element at a high
frequency, it is interesting that teachers are using the element but do not perceive the
impact as there was no significant difference found between it and the other elements in
research question one. Additionally, this finding should be taken with caution as teachers
are reporting that they use Clear Lesson and Learning Objectives, it is possible that the
objectives being used are not what those in research would deem clear. As stated
previously, teachers might assume by using state or national standards that they are clear
when this might not be the case.
The reason this element might be used by so many is due to the requirements for
lesson planning set by the school, district, or state. Many schools and districts require
teachers to have written lesson plans and within those plans a stated objective is
mandatory (Hoy & Miskel, 2008).
After examining the mean result values a repeated-measures ANOVA indicated a
significant difference in teachers’ use of the elements during the past week F (1, 183) =

147
22.763,p < 0.05. Once statistics were completed to determine the mean difference and
critical difference by calculating error variance based on the Games-Howell procedure
(1976), it was found that significant differences occurred between the means for Clear
Lesson and Learning Objectives (M = 1.08, SD = 0.274) and Learning Differences (M =
1.21, SD = 0.406) and Clear Lesson and Learning Objectives (M = 1.08, 0.274) and
Developing Age and Content Appropriate Lessons (M = 1.24, SD = 0.431). Looking at
the percentage of teachers that used each of these seven elements in the past week, the
percentage is quite high. The significant difference probably comes from the fact that
many districts require written lesson plans which require objectives to be stated;
therefore, more teachers use this element than the others as it is required.
While there was a significant difference between a few elements, it is important to
note that each of the seven elements was used by at least 75% of teachers in the previous
week. This high percentage gives further evidence that the seven elements researched in
Stronge (2007) represent what teachers should be doing in the classroom. While many
other Elements of Lesson Planning exist, it seems that teachers are aware of these seven
and many report using them although the degree of fidelity might be in question.
Research Question Three
What aspects o f Creating a Quality Assignment do teachers perceive as having
the greatest impact on student achievement? What aspects o f Creating a Quality
Assignment do teachers use when planning?

148
Clark & Yinger, 1979; Kagan & Tippins, 1992; Sanchez & Valcarcel, 1999;
Yinger, 1980; and Zahorick, 1975, found that teachers are looking more at content
knowledge, sequencing, and activities when lesson planning as opposed to objectives.
Therefore taking a deeper look into what aspects of Creating Quality Assignments
teachers believe make a difference in student achievement was important.
After conducting further research in the area of Creating Quality Assignments
(see Clare 2001; Koh & Luke 2009; Pressley et. al 1998; Wharton-McDonald et. al
1998), eight aspects were presented as being part of Creating Quality Assignments. K-12
classroom and core area public school teachers were asked to rank the following aspects:
(a) Using State Curriculum in classroom assignments, (b) Using the Adopted Curriculum
Materials in Classroom Assignments, (c) Using Cross Curricular Assignments, (d) Using
Real World Connections to Assignments, (e) Giving Students Control over Assignments,
(f) Using Sustained Writing on Assignments, (g) Using Depth o f Knowledge in Order for
Students to Complete an Assignment, and (h) Providing Students with a Scoring
Guideline on Assignments. Teachers ranked these 8 items based on how they believed
them to impact student achievement. A rank of 1 meant that teachers thought that aspect
made the least impact, and a rank of 8 meant it made the most impact.
Real World Connections to Assignments (M = 5.33, SD = 2.35) and Depth of
Knowledge Necessary to Complete Assignments (M = 5.03, SD = 2.20) were ranked as
the top two aspects of Creating Quality Assignments that teachers believe impact student
achievement. Using State Curriculum in Classroom Assignments (M = 4.04, SD = 2.45)
and Sustained Writing on Assignments (M = 4.03, SD = 1.94) were ranked lowest. A
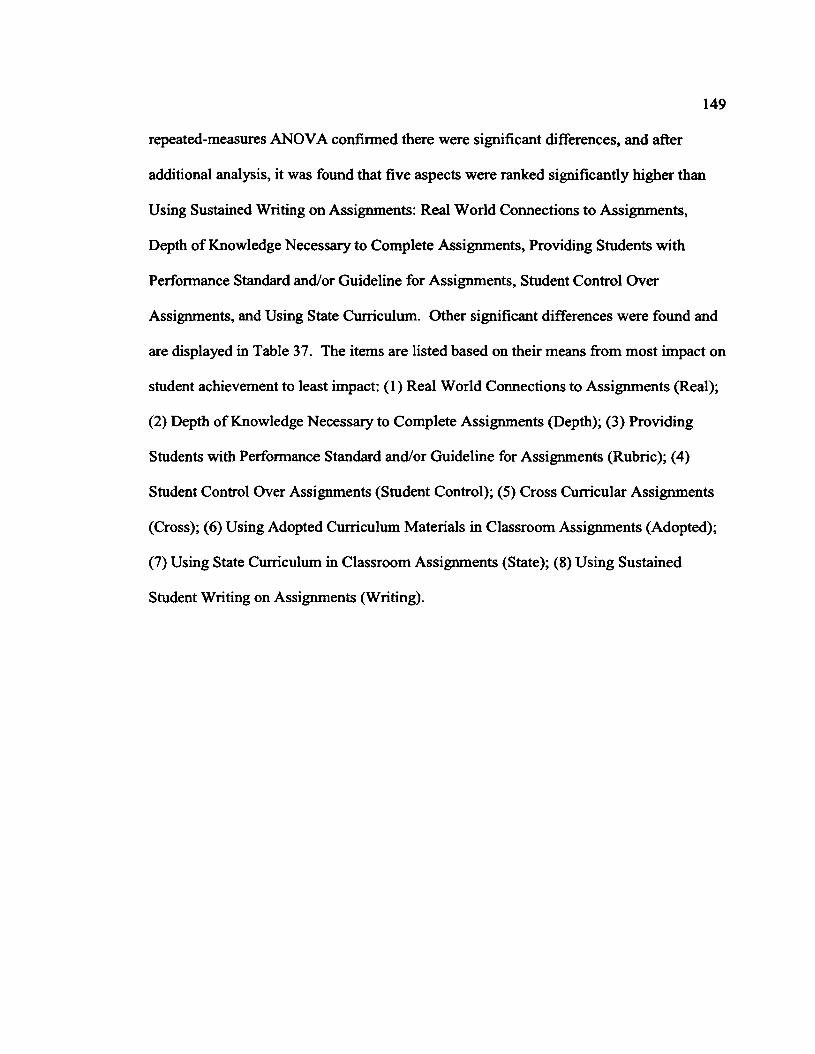
149
repeated-measures ANOVA confirmed there were significant differences, and after
additional analysis, it was found that five aspects were ranked significantly higher than
Using Sustained Writing on Assignments: Real World Connections to Assignments,
Depth of Knowledge Necessary to Complete Assignments, Providing Students with
Performance Standard and/or Guideline for Assignments, Student Control Over
Assignments, and Using State Curriculum. Other significant differences were found and
are displayed in Table 37. The items are listed based on their means from most impact on
student achievement to least impact: (1) Real World Connections to Assignments (Real);
(2) Depth of Knowledge Necessary to Complete Assignments (Depth); (3) Providing
Students with Performance Standard and/or Guideline for Assignments (Rubric); (4)
Student Control Over Assignments (Student Control); (5) Cross Curricular Assignments
(Cross); (6) Using Adopted Curriculum Materials in Classroom Assignments (Adopted);
(7) Using State Curriculum in Classroom Assignments (State); (8) Using Sustained
Student Writing on Assignments (Writing).

150
Table 37
Significant Differences Among Aspects o f Creating a Quality Assignment
Real Depth Rubric StudentControl Cross Adopted State Writing
Real NS NS NS NS NS S S S
Depth NS NS NS NS NS NS S S
Rubric NS NS NS NS NS NS S SStudentControl NS NS NS NS NS NS S S
Cross NS NS NS NS NS NS NS S
Adopted S NS NS NS NS NS NS NS
State s S S S NS NS NS NS
Writing s s s s S NS NS NS
The table shows that both Using State Curriculum and Using Sustained Writing
on Assignments were ranked significantly lower than half of the other aspects.
Additionally, Using Adopted Curriculum Materials in Classroom Assignments was
ranked significantly lower than Real World Connections to Assignments. These results
mimic what Koh and Luke (2009) found - that lessons which consisted of connections to
the real world beyond the classroom, knowledge criticism, knowledge manipulation,
depth of knowledge, and student control were used to determine the quality of teachers’
assignments. Teacher responses to aspects of Creating a Quality Assignment can be
grouped. Real World Connections to Assignments, Depth of Knowledge Necessary to
Complete Assignments, Providing Students with Performance Standard and/or Guideline

151
for Assignments, and Student Control Over tend to focus the heart of the activity and
assignment on the student and his/her needs to successfully complete the task. Cross
Curricular Assignments, Using Adopted Curriculum Materials in Classroom
Assignments, Using State Curriculum in Classroom Assignments, and Using Sustained
Student Writing on Assignments focus more on the needs of the institution when creating
an assignment. The curriculum choices are out of the students’ hands which also impacts
cross curricular activities. Using Sustained Student Writing could be seen as both
student-centric and institution-centric depending on the individual and the topic. It is
grouped with the institution-centric group as often students are given sustained writing
activities and assignments to prepare them for standardized writing exams based on the
curriculum, which would be an institution-centric focus for an assignment. Looking at
these two groups, the top ranked items (1-4) are very student-centric, focusing on the
individual needs of students. The bottom items are more institution-centric. Based on
these results teachers feel that focusing on the student-centric aspects of Creating Quality
Assignments makes more of an impact on student achievement than a top-down model.
In addition to giving their perceptions as to the most and least useful aspects in
developing quality assignments for impacting student achievement, teachers were asked
which of the given eight aspects they used in their classroom planning in the past week.
Descriptive statistics showed that Real World Connections (89.1%)(M = 1.11, SD = 0.31)
and Depth of Knowledge (76.1%) (M = 1.24, SD = 0.43) were the two most used aspects
of Creating Quality Assignments. This is in congruence with what teachers perceived as
having the biggest impact on student achievement. Student Control Over Assignments

152
(51.1%XM = 1.49, SD = 0.50) and Cross Curricular Assignments (47.3%)(M = 1.52, SD
= 0.50) were the two aspects used the least. While these two differ from what was found
in the first part of the question, their placement does not differ greatly. Looking across
the items, using State Curriculum in Classroom Assignments was the only element whose
impact ranking did not align with what they did in the classroom. This difference most
likely comes from teachers being required to use state standards in their written lesson
plans in order to show coverage of the standards in the classroom. After examining the
descriptive statistics it was found that all the aspects were used significantly less than the
first, Real World Connections in Assignments. Aspects were ordered based on their
mean use by teachers: (1) Real World Connections to Assignments (Real); (2) Depth of
Knowledge Necessary to Complete Assignments (Depth); (3) State Curriculum in
Classroom Assignments (State); (4) Providing Students with Performance Standard
and/or Scoring Guideline for Assignments (Rubric); (5) Adopted Curriculum Materials in
Classroom Assignments (Adopted); (6) Sustained Writing on Assignments (Writing); (7)
Student Control Over Assignments (Student Control); (8) Cross Curricular Assignments
(Cross). Table 38 shows where significant differences appeared in teachers’ use of these
eight items.
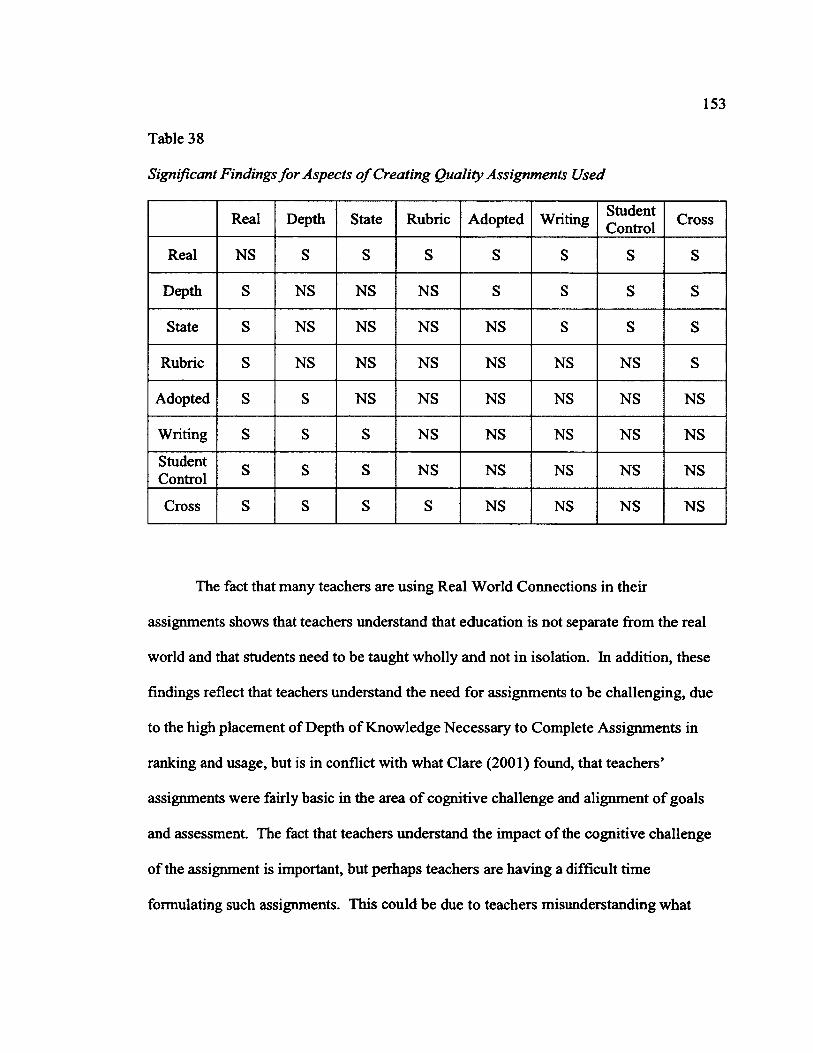
153
Table 38
Significant Findings for Aspects o f Creating Quality Assignments Used
Real Depth State Rubric Adopted Writing StudentControl Cross
Real NS S S S S S S S
Depth S NS NS NS S S S S
State s NS NS NS NS S S S
Rubric s NS NS NS NS NS NS sAdopted s S NS NS NS NS NS NS
Writing s S S NS NS NS NS NS
StudentControl s s S NS NS NS NS NS
Cross s s S S NS NS NS NS
The fact that many teachers are using Real World Connections in their
assignments shows that teachers understand that education is not separate from the real
world and that students need to be taught wholly and not in isolation. In addition, these
findings reflect that teachers understand the need for assignments to be challenging, due
to the high placement of Depth of Knowledge Necessary to Complete Assignments in
ranking and usage, but is in conflict with what Clare (2001) found, that teachers’
assignments were fairly basic in the area of cognitive challenge and alignment of goals
and assessment. The fact that teachers understand the impact of the cognitive challenge
of the assignment is important, but perhaps teachers are having a difficult time
formulating such assignments. This could be due to teachers misunderstanding what
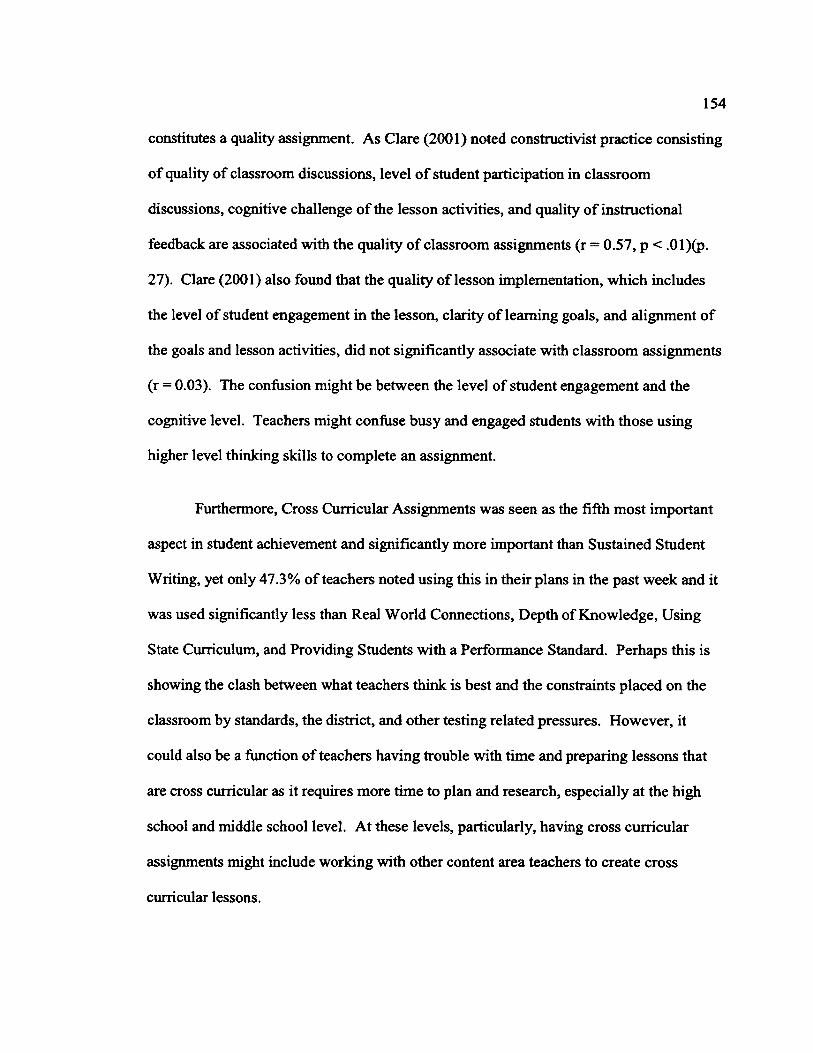
154
constitutes a quality assignment. As Clare (2001) noted constructivist practice consisting
of quality of classroom discussions, level of student participation in classroom
discussions, cognitive challenge of the lesson activities, and quality of instructional
feedback are associated with the quality of classroom assignments (r = 0.57, p < .01)(p.
27). Clare (2001) also found that the quality of lesson implementation, which includes
the level of student engagement in the lesson, clarity of learning goals, and alignment of
the goals and lesson activities, did not significantly associate with classroom assignments
(r = 0.03). The confusion might be between the level of student engagement and the
cognitive level. Teachers might confuse busy and engaged students with those using
higher level thinking skills to complete an assignment.
Furthermore, Cross Curricular Assignments was seen as the fifth most important
aspect in student achievement and significantly more important than Sustained Student
Writing, yet only 47.3% of teachers noted using this in their plans in the past week and it
was used significantly less than Real World Connections, Depth of Knowledge, Using
State Curriculum, and Providing Students with a Performance Standard. Perhaps this is
showing the clash between what teachers think is best and the constraints placed on the
classroom by standards, the district, and other testing related pressures. However, it
could also be a function of teachers having trouble with time and preparing lessons that
are cross curricular as it requires more time to plan and research, especially at the high
school and middle school level. At these levels, particularly, having cross curricular
assignments might include working with other content area teachers to create cross
curricular lessons.

155
Finally, it is interesting to note from research question two that 83% of teachers
reported using Creating Quality Assignments in their classrooms in the past week.
However, when looking at the aspects of Creating Quality Assignments given, less that
60% of teachers reported using Adopted Curriculum Materials in Classroom*
Assignments, Sustained Writing on Assignments, Student Control Over Assignments,
and Cross Curricular Assignments. This fact raises questions as to what teachers are
doing to create quality assignments. One possibility is that teachers are using other
aspects of Creating Quality Assignments in their lesson planning. If this is the case,
knowing what these aspects are and if they are effective is important. Another possibility
is that teachers are using certain aspects dining lesson planning for quality assignments,
but they are not truly creating quality assignments, and they do not realize the difference.
Recall that Clare (2001) found teachers’ assignments were fairly basic in the area of
cognitive challenge; this finding could be an indication of that trend.
Research Question Four
What aspects o f lesson structure do teachers perceive as having the greatest
impact on student achievement? What aspects o f lesson structure do teachers use when
planning?
Lambert (1988) noted that the “skillful orchestration of objectives, strategies,
materials, and equipment and the careful organization, development, and sequencing of
the lesson are absolutely crucial to successful teaching” (p. 4). With this idea in mind
and knowing that teachers are looking more at content knowledge, sequencing, and
activities when lesson planning and writing lesson plans ahead of objectives (see Clark &
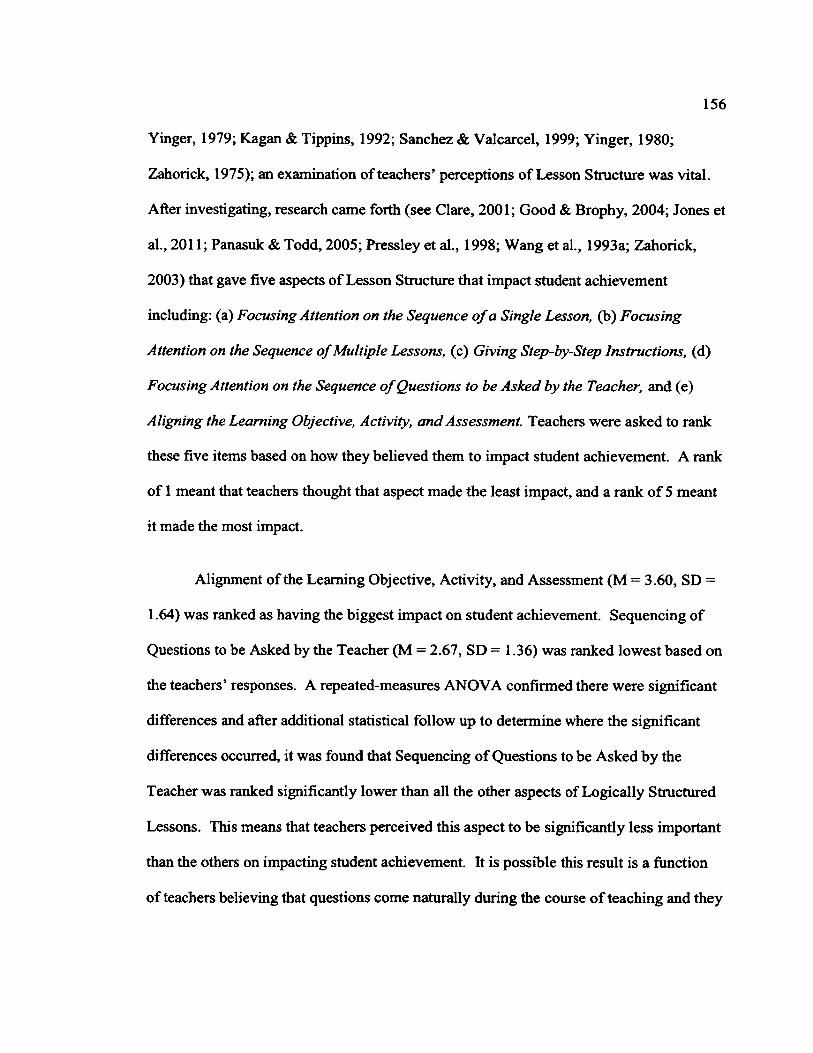
156
Yinger, 1979; Kagan & Tippins, 1992; Sanchez & Valcarcel, 1999; Yinger, 1980;
Zahorick, 1975); an examination of teachers’ perceptions of Lesson Structure was vital.
After investigating, research came forth (see Clare, 2001; Good & Brophy, 2004; Jones et
al., 2011; Panasuk & Todd, 2005; Pressley et al., 1998; Wang et al., 1993a; Zahorick,
2003) that gave five aspects of Lesson Structure that impact student achievement
including: (a) Focusing Attention on the Sequence o f a Single Lesson, (b) Focusing
Attention on the Sequence o f Multiple Lessons, (c) Giving Step-by-Step Instructions, (d)
Focusing Attention on the Sequence o f Questions to be Asked by the Teacher, and (e)
Aligning the Learning Objective, Activity, and Assessment. Teachers were asked to rank
these five items based on how they believed them to impact student achievement. A rank
of 1 meant that teachers thought that aspect made the least impact, and a rank of 5 meant
it made the most impact.
Alignment of the Learning Objective, Activity, and Assessment (M = 3.60, SD =
1.64) was ranked as having the biggest impact on student achievement. Sequencing of
Questions to be Asked by the Teacher (M = 2.67, SD = 1.36) was ranked lowest based on
the teachers’ responses. A repeated-measures ANOVA confirmed there were significant
differences and after additional statistical follow up to determine where the significant
differences occurred, it was found that Sequencing of Questions to be Asked by the
Teacher was ranked significantly lower than all the other aspects of Logically Structured
Lessons. This means that teachers perceived this aspect to be significantly less important
than the others on impacting student achievement. It is possible this result is a function
of teachers believing that questions come naturally during the course of teaching and they

157
want the freedom to respond authentically to students’ answers. While this point of view
is valid, teachers are losing sight of an important teaching tool. Aside from extracting
knowledge from students; teachers scaffold questioning when asking questions. This
scaffolding can help students leam to ask questions. While it might not be necessary for
teachers to plan all questions to be asked, it is important to plan key questions in a
sequence in order to guide reflective discussions that enhance students’ thinking,
comprehension, and learning (Willen, 1990). Additionally, planning questions helps
teachers not to fall into a routine of asking only one type of question such as memory or
fact questions, which have been found to be predominate in the classroom (Korkmaz,
2009). The only other significant difference found was that Alignment of the Learning
Objective, Activity, and Assessment was ranked significantly higher when compared
with Step-by-Step Instructions. A possible conclusion for this finding is teachers may
use instruction-giving as a means of maintaining classroom order and pace and do not
view it as part of lesson planning.
In addition to giving their perceptions as to the most and least useful aspects in
Lesson Structure, teachers were asked which of the given five aspects they used in their
classroom planning in the past week. Descriptive statistics showed that Alignment of the
Learning Objective, Activity, and Assessment (87.5%)(M =1.12, SD = 0.331) and Step-
by-Step Instructions (84.8%) (M = 1.15, SD = 0.360) were the two aspects reported as
being used the most when structuring a lesson. Alignment of the Learning Objective,
Activity, and Assessment being most used is congruent with what teachers believe is the
most important aspect in impacting student achievement; however, Clare (2001) found

158
that most teachers are weak in this area of planning. Therefore, while teachers are
reporting using this aspect of planning Lesson Structure, the quality of the alignment is
unknown.
The use of Step-by-Step Instructions differs greatly from what teachers noted as
the aspects having the most impact on student achievement. Alignment of the Learning
Objective, Activity, and Assessment was ranked significantly higher than Step-by-Step
Instructions in the first part of research question four, but was then reported as being the
second most used aspect by a high percentage of teachers—significantly more than
Sequencing a Single Lesson and Sequencing of Questions to be Asked by the Teacher. A
reason for this result could be that while teachers do not see the impact of Step-by-Step
Instructions when it comes to student achievement, using Step-by-Step Instructions in the
classroom helps with the dynamic nature of teaching. Step-by-Step Instructions are a
practical way for teachers to ensure all students understand what is being asked of them.
While teachers may not see this as particularly beneficial when it comes to student
achievement, it does help with classroom management and organization, which are also
important in ensuring student achievement (Danielson, 2007; Davis & Thomas, 1998;
Marzano, 2007; Stronge, 2007).
Sequencing of Questions to be Asked by the Teacher (52.7%)(M = 1.47, SD =
0.501) was the aspect of Lesson Structure used the least, which aligns with what teachers
ranked as the aspect having the least impact on student achievement. After examining
the descriptive statistics it was found that Sequencing of Questions to be Asked by the
Teacher was used significantly less than all other aspects. Again, this could possibly be

159
attributed to teachers wanting to respond authentically to students in the classroom and
seeing the planning of questions as a hindrance to this dynamic flow.
Sequencing of a Single Lesson (70.7%)(M = 1.29, 0.457) was found to be used
significantly less than Alignment of the Learning Objective, Activity, and Assessment. A
possible conclusion for this finding could be that teachers believe the alignment of the
objective, activity and assessment is sequencing a single lesson. By ensuring that there is
Alignment of the Learning Objective, Activity, and Assessment, teachers are building a
lesson which is coherent for students. Step-by-Step Instructions was also found to be
used significantly more than Sequencing of a Single Lesson. Again, this result is
probably the function of practicality in the classroom as many teachers reported using
Step-by-Step Instructions, which helps with classroom management.
Research Question Five
Is there a difference in teachers ’perceptions regarding which lesson planning
elements have the greatest impact on student achievement when considering: (a)
elementary school, middle school, or high school level; (b) content areas such as science,
social studies, language arts, mathematics; (c) region o f the United States; (d) rural,
urban, or suburban areas; (e) years o f experience; and (f) gender?
Teachers were asked to provide information on the six demographic areas
indicated in the question. Results from research question one, where teachers ranked the
seven general Elements of Lesson Planning identified by Stronge (2007) in the order in
which they perceived the elements to impact student achievement were also used. A

160
repeated-measures ANOVA was conducted and each of the demographic factors served
as the independent variable. It was determined that none of the demographic areas
significantly impacted how teachers ranked the Elements of Lesson Planning at the p <
0.05 significance level. Table 39 shows the demographics and ANOVA results. Since
none of the demographic areas had a significant finding, the results for research question
one are strengthened as it seems to represent all teachers equally.
Table 39
ANOVA Results for Demographic Factors and Ranking o f Elements o f Lesson Planning
Demographic ANOVA Results SignificanceSchool level F (2, 180) = 1.748, p > 0.05 Not significantSubject Area F (9, 173)= 1.082, p> 0.05. Not significant
Gender F ( 1, 181) = 1.749, p > 0.05. Not significantYears of
Experience F(4, 178) = 0.876,/? > 0.05. Not significant
School Setting F ( 2, 180) = 0.133, p > 0.05. Not significantRegion F (3,176) = 0.900, p > 0.05. Not significant
These results speak to the universality of practice among teachers across all
demographic categories that were analyzed in the study. Additionally, their perceptions
of what are important Elements of Lesson Planning for student achievement are quite
consistently among all teacher groups. It should be noted, however, that while no
significant results were found, it is possible that with a sample which more closely
resembles the population, results might differ.

161
Research Question Six
What method o f lesson planning do teachers use most prominently? For teachers
who use formal written lesson plans, how many times per day do they reference the
written plans?
Teachers were asked in the survey to disclose how they lesson plan. Table 40
shows that over 60% of teachers use written lesson plans. Almost half as many teachers
(28.8%) reported using a mental model for planning. Only a small percentage used no
formal lesson plans.
Table 40
Type o f Lesson Plans Used by Teachers
Frequency Percent Valid Percent CumulativePercent
Valid I use written lesson plans 116 63.0 63.4 63.4
I use no formal lesson plans 14 7.6 7.7 71.0
I use a mental model for lesson plans 53 28.8 29.0 100.0
Total 183 99.5 100.0Missing System 1 .5Total 184 100.0
These results mimic Ko’s (2012) findings that most participants in her study of
pre-service teachers (84%) found the process of designing a written lesson plan helpful in
preparing and organizing for teaching. While teachers did not specify if their plans were
conventional or alternative in nature, it is assumed that a large percentage of written plans

162
are conventional based on research which indicates that written lesson plans required by
administrators for evaluation purposes tend to be procedural in nature (Daniels &
McNeal, 2000; Halverson et. al, 2004; McCutcheon, 1980; Morine-Dershimer, 1979).
The mental model and no formal plan options might have been an outlet for teachers who
prefer to use alternative plans.
Teachers who reported using written lesson plans were then asked how many
times during the day they refer to their lesson plans. The researcher developed a code in
order to categorize the various answers given (see Table 41). The code was developed as
teachers had varied responses to this question and the researcher needed to be able to
disaggregate the data.
Table 41
Coded Responses for Lesson Plan Review
Code What It Means0 zero, never, none
11 time per day, in the morning,
once, rarely, very little, seldom
2 2, 2-3, sometimes, a couple3 3 or 4 times, 3-4, a few times
4 5-7 times per day, often, quite a bit, several
5 A lot6 Before every class period
7 Less than once per day, every few days, almost everyday
8 Did not answer

163
Based on the variety of responses, when the data were run, it was obvious that
lesson plan utilization is a very personal choice. While most teachers view their lesson
plans at least once daily, there were a variety of responses. Table 42 shows the
distribution of responses for how many times teachers refer to their lesson plans during
the day. It can be seen that for the most part, teachers use their written lesson plans on a
daily basis, but what was interesting is that all of the responses, save those coded as 1,
were quite even. This speaks to the “art” of teaching that Marzano (2007) refers to in his
book, The Art and Science o f Teaching: A Comprehensive Framework fo r Effective
Instruction. Teachers can use research to identify what has a high probability of working
in the classroom (Marzano, 2007), but the teachers must determine how the science of
teaching works best for their classroom, including how written lesson plans play a role in
lesson delivery.

164
Table 42
How Often Lesson Plans are Referred to During the Course o f a Day
Frequency Percent ValidPercent
CumulativePercent
Valid 0 , zero, never, none 3 1.6 2.6 2.61 time, in the morning, once, rarely, very little, seldom 27 14.7 23.3 25.9
2, 2-3, sometimes, a couple 16 8.7 13.8 39.73 or 4, 3-4, a few 16 8.7 13.8 53.45-7 Times, quite a bit, often, several 16 8.7 13.8 67.27+ times, a lot 11 6.0 9.5 76.7Before every class 15 8.2 12.9 89.7Less than once per day, every few
days, almost everyday S 4.3 6.9 96.6
did not answer 4 2.2 3.4 100.0Total 116 63.0 100.0
Missing System Total
68184
37.0100.0
Most teachers gave a more detailed response in addition to providing a number or
adverb to describe how often they refer to their lesson plans. For those teachers who
refer to their plans once a day the general attitude can be summed up in this teacher’s
response, “I glance at them in the morning, but I know what is in them.” Likewise,
teachers who reported viewing their plans less than once a day responded similarly to
another teacher who said, “[I refer to my plans] almost never. I know what I need to
accomplish in each class without looking. The written plan is present for those who may
come to observe. These plans should, of course, be updated as circumstances change;
however, there is seldom time to do that.” This statement might give insight as to the
reason some teachers may or may not refer back to their plans. Teachers may have them
available for visitors but not have them written for any other purpose. These teachers

165
might have responded that they used no formal plans or a mental model if not for the
requirement of having written plans. Also as the teacher states, there is little time in the
day to make changes, though perhaps some teachers make these changes mentally.
While it is possible that teachers mentally make changes to their plans based on the
dynamic of the classroom, others stated they use their plans to write down changes. One
teacher stated that the written plans were referred to “every class period. I preview it
before school. I review it after school and make adjustments to the next day's lesson.
During my prep period I consider long-term changes that might be needed.” Other
teachers echoed this sentiment responding, “my written lesson plans are more of a living
document. I am constantly revising and updating them "real time" depending on what
happens through the course of the day/lessons.” This view also shows how organic and
personal lesson plans can be and how each teacher can create their “art” in different ways
based on the needs of the day and class. Another teacher mentioned that “I use written
lesson plans as an organizer for myself and I reference them as needed. They serve as a
place to record learning targets and also to note what was done by students/teacher during
the course of the lesson. My teaching is responsive, so I often redesign activities on the
fly and note these in my plans. I mentally know what I'm going to do, so I don't ‘rely’ on
the plans, but use them as a planning document and record for what I've done.” From this
teacher’s response, it is possible to see that some teachers use a combination of written
and mental plans. It also shows that teachers respond to the dynamic nature of the
classroom. Many teachers wrote about how their plans might evolve based on the
interaction with students.

166
In addition to being required to have written lesson plans as many teachers stated,
some are also required to post agendas or objectives on the board. These teachers
referenced this mandate when discussing written plans. Many said something similar to
what this teacher expressed: “My written lesson plan is in a teacher plan book; it, the
agenda, content and language objectives are then written on the board. I refer to my
teacher plan book daily or weekly, but the students and I refer to the agenda every hour.”
This statement gives a way teachers are reminded of the process they went through in
lesson planning and can refer to it themselves or with the class. Many teachers reported
using their plans in this manner.
Regardless of how teachers used their lesson plans after writing them, what can be
seen from the responses is the art of teaching. Each teacher, as a unique individual, wrote
in a manner that showed they understood the need for a lesson plan, but each also had a
reasonable answer for how they used the written plan in the classroom. Asking teachers a
questions such as this is eye-opening and gives a deeper understanding for what goes on
in the teachers’ classrooms and why.
In addition to examining how often teachers referred to their written lesson plans
during the day, a one-way ANOVA was completed to compare the mean difference
between teachers’ years of experience and the type of lesson plans they use, and it was
found that there was no significant difference between the number of years taught and the
type of lesson plan used by teachers F (2, 180) = 0.913,p > 0.05. In their written
comments, teachers did allude to their years of teaching as impacting how often they
refer to their lesson plans during the day with one teacher stating, “I have been teaching

167
for almost 20 years and though I do write out lesson plans in greater or less detail for my
own benefit (possibly teaching [a] unit again in a following year or to another class) and
sometimes for administrators, I do not frequently refer to these plans except for the
beginning of each day/each class and at the end of the day in preparing for the following
day.” Another teacher with six to ten years’ experience viewed her written lesson plans
differently, writing, “my lesson plans are basically posted on the board each day in the
form of the agenda, objective, and essential questions. I refer to these regularly
throughout the class, as I teach too many different classes to remember the order of
lessons without referencing my written plans. I have become more dependent on written
lesson plans as I have advanced through my career. When I was a younger teacher I could
do this mentally, but those days are gone.” Similarly another teacher with more than
twenty years’ experience stated, “[I use my written lesson plan] all the time; I use it as
my memory as I would forget to do what was planned.” These perspectives show how
individual the craft of teaching can be and how teachers think about their craft. As
teachers advance in their teaching profession, the question remains if they need the
written lesson plan more, or less. These statements give an argument to both sides.
While these statements came from more veteran teachers, a teacher with less than three
years’ experience noted, “I refer to it several times during the first time I present the
lesson. Afterwards, I rely on memory.” Another teacher with less than three years’
experience stated, “[I refer to my written lesson plans] at least three times—Beginning-
Middle-End for each class. It is posted and we as a class use it as the guideline to class.”
Again these statements show the individual nature of teaching and how each teacher

168
believes he/she is most effective. These sentiments are in line with the variety of other
teacher responses.
Discussion
The following discussion section will examine the major areas for consideration
from the findings of this study. While many significant findings were discovered these
six items stood out as the most important from the study. The sections will examine
Support for the Elements of Lesson Planning, Debating Creating Clear Lesson and
Learning Objectives, How to Create Quality Assignments, The Impact of Alignment, and
Teacher Questioning, and Making Sense of a Research Sample. Each section will
contain a more in-depth look into the area as well as relating the findings back to research
available on the topic when applicable.
Support for the Elements of Lesson Planning
This study provides evidence that K-12 classroom and core area teachers across
the United States hold similar perspectives when it comes to the impact of and usage of
the Elements of Lesson Planning described within the study and based on research found
in Stronge’s (2007) book Elements o f Effective Teachers. The study also shows that
teachers’ perceptions of those elements are not affected by level of school (elementary,
middle, high), content area (language arts, mathematics, social studies, science), years of
experience, gender, region of the United States, or school setting (rural, suburban, urban).
This inter-rater agreement adds support for the validation of the Elements of Lesson
Planning examined in the study. This suggests that a standard for effective lesson

169
planning exists. Such a standard may be reflected in the research backed elements
included in this study which originated in Stronge’s (2007) framework.
Teachers’ ranking of the elements with no significant difference shows the
relatively equal importance teachers perceive each element to have on student
achievement. Additional support for this finding is that each of the Elements of Lesson
Planning was reported as being used by at least 75% of the teachers. This suggests that
teachers are aware of what works as supported by the extant research and are attempting
to implement these elements in their classroom. The question as to the teachers’
understanding of the elements and the fidelity of implementation is unknown. Finally,
this suggests that a standard for effective lesson planning, indeed, exists. Such a standard
may be reflected in the research backed elements included in this study which originated
in Stronge’s (2007) framework.
Debating Creating Clear Lesson and Learning Objectives
Teachers did not rate Creating Clear Lesson and Learning Objectives as
significantly different than any other of the seven Elements of Lesson Planning when it
comes to impacting student achievement; however, when looking at the modes for this
particular element (see Table 43), the rating chosen more often than the others was seven
(greatest impact on student achievement on a scale of 1-7). This mode was followed
closely by a rating of one (least impact on student achievement). Thus, teachers were
polarized in how they ranked this particular item.

170
Table 43
Results fo r the Impact o f Objectives on Student Achievement
Frequency of Ordered Responses
N =184
Percentageof
TeachersN=184
TeacherMean
TeacherMeanRank
StandardDeviation
Clear Lesson and Learning
Objectives
#1 =44#2 = 32 #3 = 15 #4= 13 #5 = 12 #6 = 21 #7 = 47
#1 = 23.9% #2 = 17.4% #3 = 8.2% #4 = 7.1% #5 = 6.5% #6= 11.4% #7 = 25.5%
3.91 6 2.40
When analyses were run, it was found there was no significant difference between
the Elements of Lesson Planning, but the striking difference between the teachers’
response to this particular element is worth noting and possibly studying more in-depth.
It is possible that the standards movement has helped to create this discrepancy in
teachers’ perceptions. Myers (2007) believes the standards movement has led to less
individualized instruction and less control for teachers over what goes on in the
classroom. This same belief may be held by teachers who see the lesson and learning
objectives as government mandated but possibly having little impact on the individuals in
the classroom setting. Other teachers may view these objectives as having a large impact
on student achievement as they are a guide to what students will be required to know for
standardized tests. Further still, some teachers may use the standards given to them and
create objectives from them to fit the needs of their classroom and to individualize
instruction. Follow-up interviews with teachers regarding this particular element would

171
yield more information as to how teachers view Clear Lesson and Learning Objectives.
In addition, the terminology and teachers’ views on what constitutes a clear learning and
lesson objective might vary significantly. The research (see Bain & Jacobs, 1990; Jones
et. al, 2011; Rosenshine, 1986; Zahorik et. al, 2003) shows that having Clear Lesson and
Learning Objectives leads to student achievement.
How to Create Quality Assignments
Eighty-three percent of teachers reported using Creating Quality Assignments in
the past week. Therefore, it can be concluded that teachers feel this is a very important
element in lesson planning. This study also suggests that there are aspects of Creating a
Quality Assignment which were not included in the survey. Of the eight given aspects of
Creating a Quality Assignment, half of them were used by less than half of the teachers in
the study. This result leads to the implication that teachers are using other aspects to
create quality assignments than the ones provided or that some of the aspects included in
this study are not really quality based on teachers’ perceptions. In order to have a more
clear picture of how teachers Create Quality Assignments during planning it might be
necessary to ask this question in a more open-ended format and then correlate the
responses with research. The study does show this is an element of lesson planning that
almost all teachers report using; however, a more in-depth examination is needed to know
more decisively how teachers create quality assignments and if the assignments they
create actually meet quality metrics. Clare (2001) found that teachers’ assignments were
fairly basic in cognitive challenge and alignment which suggests they may not.

172
The Impact of Alignment
Teachers ranked Alignment of the Learning Objective, Activity, and Assessment
as significantly important when it comes to student achievement. They also reported
using this aspect of Lesson Structure more than any other. The findings for this aspect
of Lesson Structure demonstrate that teachers believe it makes a difference in student
achievement. This belief is substantiated by research which found alignment between
lesson segments is important in lesson coherency for students (Wang et al., 1993a).
Teachers can show skillful planning by the use of varied approaches to teaching and
lesson components that focus on lesson coherency (Panasuk & Todd, 2005). Looking
closely at how lessons are aligned is a small change that can make an impact on student
achievement. The results of this study show that teachers understand this benefit and
report using it during their planning. While it is clear that teachers understand that
alignment is important in lesson planning; a question remains as to how effective teachers
are at implementing alignment between lesson items. Clare (2001) found that most
teachers are weak in the area of alignment of teachers’ goals and grading criteria.
Therefore, caution must be taken when looking at the result as there was no finding to
state if teachers use Alignment of the Learning Objective, Activity, and Assessment when
they plan aside from self-report.
The relationship between Alignment of the Learning Objective, Activity, and
Assessment and Clear Lesson and Learning Objectives also merits a closer look,
especially based on the discrepancies in the mode of the latter in research question one.
Based on the results from research question one, teachers seem divided over the

173
importance of Clear Lesson and Learning Objectives, but from research question four,
they are united in their belief that Alignment of the Learning Objective, Activity, and
Assessment highly impacts student achievement. This is interesting as part of Alignment
of the Learning Objective, Activity, and Assessment is the learning objective which was
controversial. Some concerns are then raised as to the fidelity of alignment between the
objective, activity, and assessment. The relationship between these two findings may be
the result of the standards movement and teachers being given standards and not creating
their own, or not ensuring they create clear objectives from the given standards.
Confusion arises when teachers teach a standard and not an objective. Teachers who use
the standard and do not create objectives run the risk of not fully understanding the intent
of the standard and not being clear on the intent when developing lesson plans. If the
objective or standard is not clear then aligning the assessment and grading criteria will be
unclear as well.
Teacher Questioning
Stronge (2002) stated that “Questions should be considered carefully and prepared
in advance of a lesson to ensure that they support the goals and emphasize the key points,
along with maintaining appropriate levels of difficulty and complexity.” However, the
reality of what this study found is that teachers have definitively different points of view
about questioning and, specifically, planning for the sequence of questions to be asked.
Sequencing the Questions to be Asked by the Teacher was ranked as the least important
aspect of Lesson Structure, and was found to be significantly less important in regard to
student achievement than all the other given aspects. In addition, Sequencing the

174
Questions to be Asked by the Teacher was reported as being used less than any other
aspect and significantly less than all the other aspects. Perhaps this is a result of teachers
trying to ensure the classroom does not become a place where everything is prescribed.
The standards movement has ushered in an era where teachers are told what to teach and
students are assessed using tests given to them by the state, not the teacher. In some
cases curriculum materials from the state or the district, which are aligned to the
standards, include questions the teacher can ask and direct them on when to ask those
specific questions. This might feel like another way teachers are told how and what to
teach - by being given a script of what to ask students. Teachers are, then, left with only
the lesson activity and/or assignment to showcase their teaching art. This may lead to
teachers wanting to respond authentically in the classroom and, thus, questioning is a
natural skill for teachers (Wilen, 2001). However, the idea of questioning as a natural
teaching behavior that does not require planning is a myth and teachers need to utilize
questions effectively (Wilen, 2001). Although it is easy to picture a teacher leading
students through a review of previously read materials or material presented by asking
questions, these types of questions are usually lower level. However, teachers need to
use a variety of questions to ensure the cognitive level of the assignment is met.
Therefore, teachers must plan for key questions and not rely on their natural teaching
behavior or the questions given to them by the curriculum.
This study found that teachers are not including questioning sequences during
their lesson planning and do not feel planning for the sequence of questions to be asked
impacts student achievement; however, the research and literature disagree. Questioning

175
is an important skill for teachers to plan for three reasons. First, it ensures that teachers
are asking high quality questions and not simply asking to ask, which is one of the
greatest barriers to effective use of questions (Miller, 2007). High quality questions
should have certain characteristics including (1) clarity, (2) purposefulness, (3)
usefulness, (4) level customization, (5) sequence, (6) orientation to thinking, (7)
flexibility, and (8) well-constructedness (Good & Brophy, 2004; Kauchack & Eggen,
1998; Korkmaz & Yesil, 2010). Not only are these high quality questions important,
but also the placement of these questions within the lesson can add to a student’s depth of
knowledge about the topic. Ensuring that quality questions are asked and preparing them
ahead of time is not simple and takes time. Creating questions that contain the listed
characteristics is detailed work and time consuming. Based on some teachers’ responses
to research question six, teachers feel their time is limited. This fact may deter teachers
from creating and sequencing their questions during lesson planning. This is an area
where administrators and schools of education can work with teachers as they prepare
them for the classroom. A second reason is that teachers should plan some of their
questions in advance to ensure that a variety of question types are asked. According to
Kagan (1999) there are three categories of questions: fat and skinny questions, high-
consensus and low-consensus questions, and review and true questions. These question
types use a variety of Bloom’s Taxonomy to get students to think (Kracl, 2012). Using
different types of questions and considering their placement within a lesson allows
teachers to help students think creatively, critically, and analytically (Korkmaz, 2009).
By using a variety of questions students have to use a wide anay of knowledge to answer,
which improves student achievement. Finally, questioning is a lifelong skill that is

176
critical for students to be successful in the 21st century (Korkmaz, 2009). Effective
problem solvers use questions to fill in the gaps in their knowledge (Costa, 2001). In
addition, by asking the right questions students can improve their communication skills
and gather better information, leam more, build stronger relationships, manage people
more effectively, and help others (Korkmaz, 2009). Therefore, teachers need to
effectively utilize questions and question placement as students leam how to ask quality
questions from the example set. Students will discover that the question is a valuable
learning tool if they have good scaffolding. Through hearing a variety of quality
questions, students will leam that asking questions will help them organize their thinking
to achieve certain objectives (Korkmaz, 2009) and begin to develop this skill.
Making Sense of a Research Sample
Due to the sampling anomaly experienced, the sample for this study was looked at
in depth and decisions had to be made on how to move forward. The original plan for the
study was to send an email to approximately 5,000 potential participants from a sample
pool created by a third party. The same 5,000 potential participants would then receive a
follow up email a week later and then two weeks later. Each potential participant would
then receive a total of three emails. This would have allowed for the sample
demographics to be viewed as one sample. When the sampling anomaly was detected
after the third email was sent, decisions had to be made and the sample had to be treated
differently. After working with the company who created the email lists trying to figure
out where the anomaly took place it was determined from looking at the email address
sent that the anomaly took place with the final email deployment. The first and second

177
emails were sent to the same potential participants (approximately 5,000). The third
email was sent to an entirely new pool of potential participants (approximately 5,000).
This alteration from the original intent of the study changed the sample pool. The
researcher had some choices as far as how to deal with the sample anomaly: 1) The
initial results could be tossed out and the study could begin again with a new sample pool
of approximately 5,000 participants receiving an email and two reminder emails. This
choice was bypassed due to the timing that the emails would have been sent, right before
the Thanksgiving and Winter Holiday breaks. The research felt as if the response rate
would have been lower due to timing. Additionally, it would have been possible for
participants from the first round of emails to be included in the second round. This
would have complicated the sample further. 2) Send the participants who received the
third email, a follow up email. This choice would have allowed for all the participants to
receive two emails. This choice was not made as the researcher would still have had the
same issue of having two different samples. In addition, due to the anomaly the
researcher wanted to maintain control over the sample and not introduce any new
possible problems. 3) Use the results garnered from the three emails that were sent.
This option was chosen; however, due to the two different sample sets the researcher
needed to ensure that the two groups were comparable in all demographic areas in order
to ascertain that the results of the study were due to participants’ responses and not
because of a difference between the two sample groups. Therefore, chi-square tests were
calculated on all the demographics of the two sample groups and it was found that the
groups were equal on all measures. These results allowed the study to move forward
viewing the two sample groups as one big sample.

178
Implications for Improving Teacher Practice
The support shown for the Elements of Lesson Planning provides a launching
point for improving teacher practice when it comes to properly implementing lesson
planning. If effective teachers are effective planners, then it is necessary for all teachers
to improve their planning processes in order to become more effective in their craft. The
fact that teachers in the study did not differentiate between the Elements of Lesson
Planning shows that they find them equally important, which is congruent with the
literature. In addition, the high number of teachers reporting using the elements in the
past week adds to the idea that these research-based elements are important in practice as
well. Both of these findings support the idea that in order to improve teacher practice,
administrators can focus on these elements when discussing planning with teachers.
Giving planning discussions focus will help administrators and teachers alike to pinpoint
areas where teachers can become more effective. These planning discussions and
information gleamed from examining teacher lesson plans can help administrators and
districts determine the types of teacher education to offer to their teachers. Additionally,
this information can help in the assessment and evaluation of teachers on a more
individualized basis as the administrator can determine where planning weaknesses exist.
Finally, understanding these elements and how they should work in a classroom can help
in the hiring process as administrators can focus their questions with prospective teachers
and gamer valuable information from them as to their planning and understanding of the
important Elements of Lesson Planning.

179
In addition to giving helpful information with regards to the Elements of Lesson
Planning, the study can also help schools of education and administrators focus on
creating quality assignments. The study found that teachers understand that student-
centric assignments are beneficial in promoting student achievement; however, the
planning of these activities and assignments can be time consuming and overwhelming.
Schools of education and administrators can work with teachers on aspects of how to
create quality assignments for the classroom to ensure students are getting the biggest
benefit from their engaged learning time. Discussions can also include how to ensure the
activities and assignments are in alignment with the objective and assessment.
Finally these findings can impact teacher practice by helping to create a culture of
teaching in schools that develops individual teachers’ lesson planning skills. By giving
administrators and teachers a focal point to begin discussions, each individual teacher
will be given the ability develop their planning skills in a manner that is useful to them
with their respective class and their self-efficacy with each of the Elements of Lesson
Planning.
Conclusion
Effective teachers make a significant impact on student achievement and
conversely ineffective teachers can negatively impact students. Therefore, understanding
what makes teachers effective is important. Lesson planning is a vital part of being an
effective teacher and should be used by teachers to prepare themselves for what will take
place in the classroom. This preparation and how it is carried out can be effective or
ineffective depending on the teachers’ thinking and organization. Educators’ perceptions
180
about what research based Elements of Lesson Planning provides valuable insight what
teachers perceive as important when lesson planning. Teacher reported classroom
practices also provide insight into what tools teachers are choosing to use in the
classroom. The combination gives a glimpse into the complexity of the lesson planning
process. Understanding teachers’ thinking and organization of thought during planning
can be a powerful tool for administrators or schools of education in helping prepare
teachers for the classroom.
A central finding of this study was that there was congruence among teachers
when it came to the Elements of Effective Lesson Planning. There was no significant
difference found among the elements as to their ranking of impact on student
achievement. This result was consistent when looking at the demographics of (a) school
level, (b) content area taught, (c) years’ experience, (d) school setting, (e) region of the
country, and (f) gender. This finding is important because people’s experiences can
shape their perceptions and actions when lesson planning; however, when it comes to the
Elements of Effective Lesson Planning, teachers were in agreement. An interesting result
which likely merits further study was how teachers perceived Clear Lesson and Learning
Objectives. While this element was not significantly different than the others, it did
polarize teachers in their responses when looking at the mode of response. There is a
possibility this finding could be attributed to an unintended consequence of the standards
era. Further support was given to this idea by the fact that teachers reported using Clear
Lesson and Learning Objectives significantly more than some of the other elements.

181
Other important findings surrounded the research on Creating Quality
Assignments and Lesson Structure. Teachers have significantly different perceptions as
to which aspects of both these elements were effective in impacting student achievement.
More specifically, teachers perceive more student-centric classroom assignments are
most effective including: (1) Real World Connections to Assignments', (2) Depth o f
Knowledge Necessary to Complete Assignments', (3) Providing Students with
Performance Standard and/or Guideline fo r Assignments', and (4) Student Control Over
Assignments. Additionally, teachers reported using mainly student-centric assignments in
their classrooms. The one deviation from this was teachers’ use of State Curriculum in
Assignments. This finding may be a result of building-based requirements for lesson
planning which often mandate that the state standard and curriculum be included and
used. Concerning Lesson Structure, Sequencing Questions to be Asked by the Teacher
impacted student achievement significantly less than all other Lesson Structure aspects.
This finding was corroborated when teachers reported using all other aspects of Lesson
Structure significantly more than Sequencing Questions to be Asked by the Teacher.
This finding is not surprising, but needs to be further investigated as planning for
questioning has many benefits for teachers and students alike.
Lesson Planning has been a subject of interest for many years since the findings
of Coleman (1966) and Jencks (1972) which led to efforts to “teacher proof’ curriculums
(Porter & Brophy, 1988, p. 74). As a result, many studies can be found on lesson
planning when searched in an educational database. Few studies, however, exist which
look at teachers’ perceptions of planning and how that differs from what teachers report

182
using. The current study adds to the literature by garnering teachers’ perspectives on
lesson planning.
Limitations
Generalizability of the study’s results was affected by a few factors. First, the
study relied on a survey which used rank ordering for data collection. Rank ordering is
preferable to rating scales for several reasons, including the fact that rankings provide
greater variability in results; however, participants were forced to choose among
competing variables and were not permitted to find the variables equally valuable.
Caution needs to be used when interpreting the results of rank ordered responses as there
cannot be an assumption of equal intervals between the ranks (Gall, Gall, & Borg, 2007)
as would be expected between intervals on a rating scale. Additionally, the choice to use
rank ordering in the survey required participants to rank all items even if the participants
did not think the item should be included. This fact then allowed for all items to be
ranked and included in the results regardless of whether participants thought they should
be or not. Findings can then be skewed by including items that participants did not find
worthy because they were required to rank them. In addition, the wording chosen to
describe the Elements of Lesson Planning and aspects of Creating Quality Assignments
and Logically Structured Lessons in the survey may have affected participants’
perceptions and rankings. Also, the ranking system given to participants may have
seemed counter intuitive with the value of 1 being given to the element or aspect that had
the least impact. The low response rate (n = 183, 1.8%) impacts generalizability by
reducing the power of the findings from the statistical analysis. A larger sample would

183
have decreased the possible error in analysis and would have been more representative of
the population (Gall, Gall, & Borg, 2007). Finally, the use of self-report by the
researcher could have impacted the findings as it is not clear if teachers were actually
using the elements and aspects they reported using; therefore, the results of study focus
on what teachers stated they do and not for certain what teachers actually do in their
classrooms.
Recommendations for Future Research
Additional research may add to the understanding of effective teachers’ lesson
planning. The following are recommended:
• The current study provided participants with Elements of Lesson Planning to rank
in the order in which they perceived them to impact student achievement. By
withholding the research-based framework from participants and simply asking
them to identify Elements of Lesson Planning that effective teachers use may
have allowed for them to identify elements outside those given. This could give
researchers an idea of what teachers are thinking and correlate that with the
research-based elements. These responses could he solicited through an open-
ended questionnaire or by individual or group interviews.
• In the current study, participants were provided by research-based Aspects of
Creating Quality Assignments. Giving participants the option to identify aspects
on their own without the given research-based aspects might yield results that
help administrators understand what teachers use to create quality assignments.
This information can be garnered through an open-ended questionnaire or by

184
individual or group interviews. Teacher responses could then be compared with
research-based strategies to determine if they correlate. In addition, teachers
could explain more in depth why they think those aspects are important in
Creating a Quality Assignment.
• Within the current study, it was found that there was a huge discrepancy in how
teachers viewed the impact of Creating Clear Lesson and Learning Objectives. A
large number of teachers thought it was the most important element and an almost
equal group found it to be the least effective element in impacting student
achievement. Asking teachers follow up questions to this particular element
would yield important results in determining if the standards movement has
impacted teachers creating Clear Lesson and Learning Objectives or their
perspective on the role objectives play in lesson planning. This could be done by
asking teachers open-ended questions either in questionnaire or interview format
regarding lesson objectives.
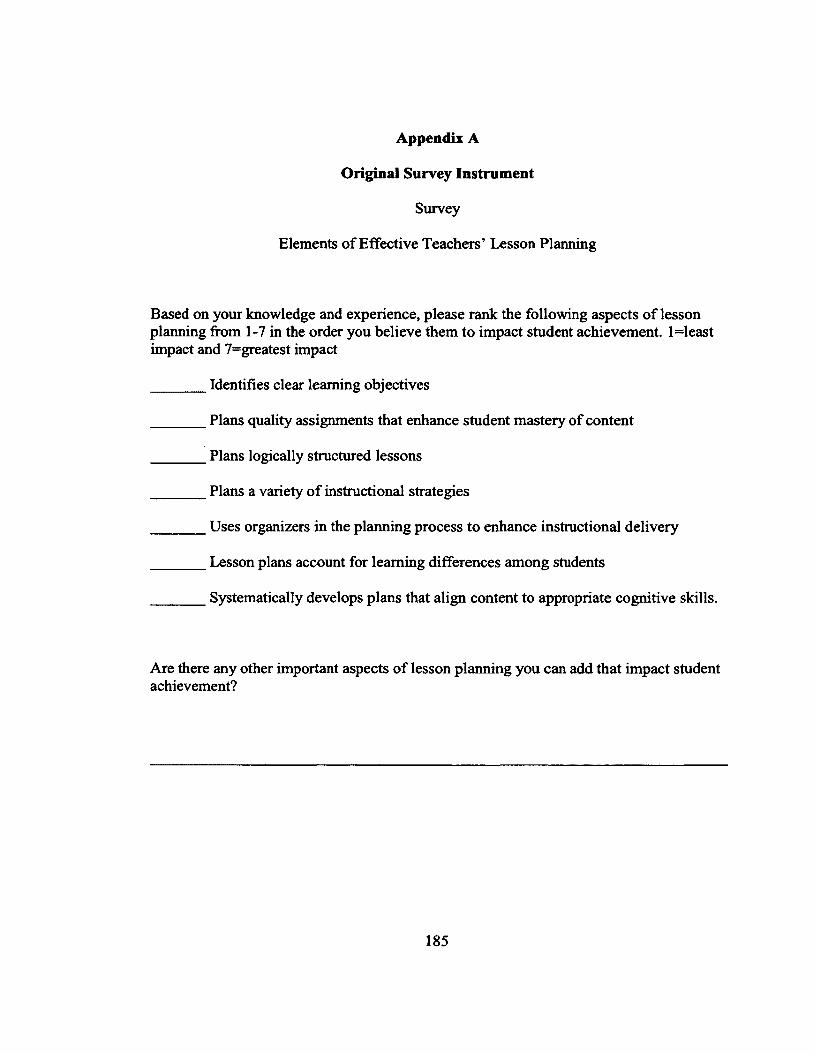
Appendix A
Original Survey Instrument
Survey
Elements of Effective Teachers’ Lesson Planning
Based on your knowledge and experience, please rank the following aspects of lesson planning from 1-7 in the order you believe them to impact student achievement. l=least impact and 7=greatest impact
_______Identifies clear learning objectives
_______Plans quality assignments that enhance student mastery of content
_______Plans logically structured lessons
_______Plans a variety of instructional strategies
_______Uses organizers in the planning process to enhance instructional delivery
_______Lesson plans account for learning differences among students
_______Systematically develops plans that align content to appropriate cognitive skills.
Are there any other important aspects of lesson planning you can add that impact student achievement?
185

186
CLASSROOM ASSIGNMENTS
Based on your knowledge and experience, please rank the following considerations aboutcreating classroom assignments from 1-7 in the order you believe them to impact studentachievement. l=least impact and 7=greatest impact
Uses of state curriculum and materials in classroom assignments
Includes cross curricular assignments
Includes real world connections to assignments
Includes student control over assignments
Uses sustained writing on assignments
Includes depth of knowledge necessary to complete assignments
Providing students with a performance standard and scoring guideline forassignments
Includes one goal for each lesson
CONSTRUCTIVIST CLASSROOM ASSIGNMENTS
Based on your knowledge and experience, please rank the following considerations about creating classroom assignments from 1-4 in the order you believe them to impact student achievement. l=least impact and 4=greatest impact.
Quality of classroom discussions
Level of student participation in the classroom discussions
Cognitive challenge of lesson activities
Quality of instructional feedback
Are there any other important aspects of creating assignments you can add that impact student achievement?

187
LESSON STRUCTURE
Based on your knowledge and experience, please rank the following items about lessonstructure from 1-5 in the order you believe them to impact student achievement. l=leastimpact and 5=greatest impact
________Focusing attention on the sequence of a single lesson
________Focusing attention on the sequence of multiple lessons in a unit.
_______Giving step-by step instructions
_______Focusing attention on the sequence of questions to be asked by the teacher
_______Aligning the learning objective, activity, and assessment
Are there any other important aspects of lesson structure you can add that impact student achievement?
INSTRUCTIONAL STRATEGIES
Based on your knowledge and experience, please rank the following uses of instructional strategies in lesson planning from 1-5 in the order you believe them to impact student achievement. l=least impact and 5=greatest impact
________Use of a variety of instructional strategies to teach the same concept
________Matching the instructional strategy chosen to the learning outcome
________The timing of implementation of the instructional strategy
________An overall lesson that is balanced in its use of instructional strategies (Use of avariety of instructional strategies throughout the day)
________A smooth integration of instructional strategies into a lesson
Are there any other important aspects of using instructional strategies you can add that impact student achievement?
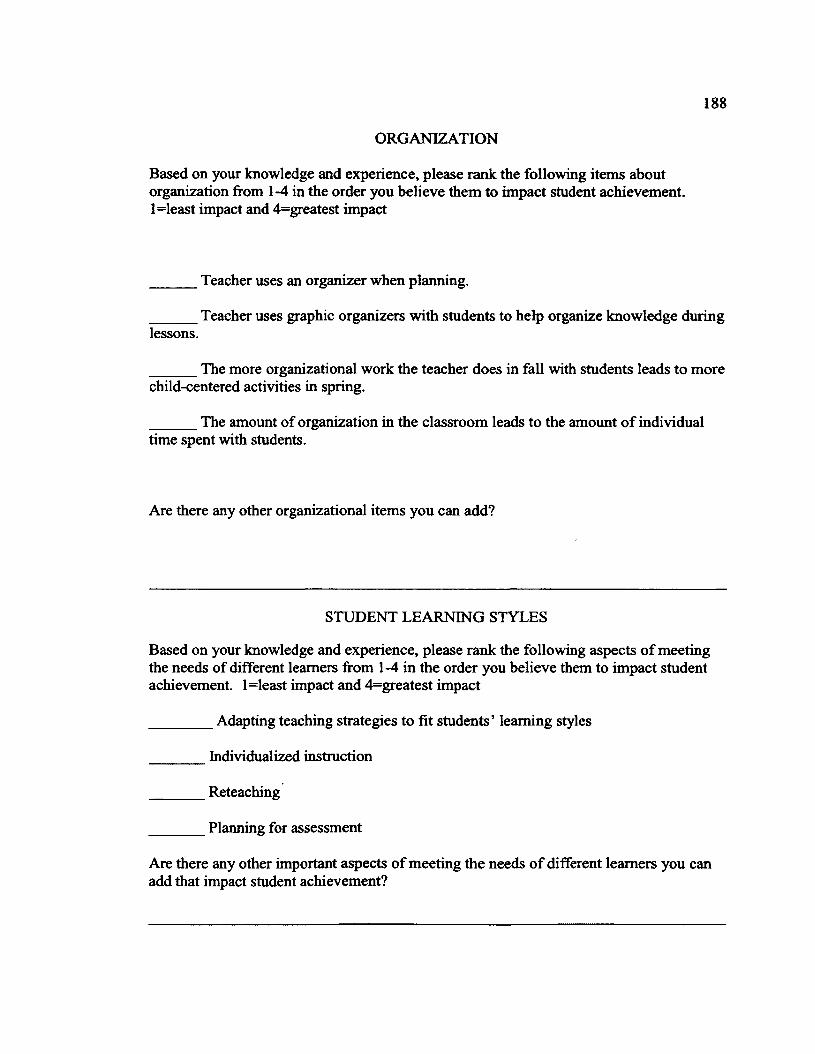
188
ORGANIZATION
Based on your knowledge and experience, please rank the following items aboutorganization from 1-4 in the order you believe them to impact student achievement.l=least impact and 4=greatest impact
______Teacher uses an organizer when planning.
______Teacher uses graphic organizers with students to help organize knowledge duringlessons.
______The more organizational work the teacher does in fall with students leads to morechild-centered activities in spring.
______The amount of organization in the classroom leads to the amount of individualtime spent with students.
Are there any other organizational items you can add?
STUDENT LEARNING STYLES
Based on your knowledge and experience, please rank the following aspects of meeting the needs of different learners from 1-4 in the order you believe them to impact student achievement. l=least impact and 4=greatest impact
________Adapting teaching strategies to fit students’ learning styles
_______Individualized instruction
_______Reteaching
_______Planning for assessment
Are there any other important aspects of meeting the needs of different learners you can add that impact student achievement?

189
APPROPRIATE LESSONS
Based on your knowledge and experience, please rank the following ways to develop ageand content appropriate lessons from 1-4 in the order you believe them to impact studentachievement. l=least impact and 4=greatest impact
_______Teacher gives students small challenges just beyond their abilities
_______Teacher matches the student task and the instructional scaffolding
_______Teacher supports students as they struggle, but does not do the activity forstudent
_______Teacher uses authentic activities in the classroom
Are there any other important aspects of developing age and content appropriate lessons you can add that impact student achievement?
Based on your knowledge and experience, and using lesson plans please give your perspective on how often teachers refer to their written lesson plans during the course of a lesson.
_______Teachers refer to their written lesson plans 0 times during a lesson
_______Teachers refer to their written lesson plans 1-3 times during a lesson
_______Teachers refer to their written lesson plans 3-5 times during a lesson
_______Teachers refer to their written lesson plans 5-10 times during a lesson
_______Teachers refer to their written lesson plans +10 times during a lesson

190
DEMOGRAPHIC INFORMATION
Which of the following best describes the school in which you currently work?
________Elementary School
________Middle School
________High School
________Other___________________________________________________
Please indicate your gender.
_______Female
_______Male
_______Other_______________________________________________________
Please indicate the total number of years that you have worked in education.
_______ 1-5 years
_______6-10 years
_______ 11-15 years
_______16-20 years
_______+20 years
Which of the following best describes the setting of the school where you currently work?
_______Rural
_______ Suburban
_______Urban
Please list the state where you currently work.

Appendix B
Final Survey A
Elements of Effective Teachers’ Lesson Planning
Parti
DIRECTIONS: Based on your knowledge and experience, please respond to the following questions regarding Lesson Planning by rank ordering.
ELEMENTS OF LESSON PLANNING
Based on your knowledge and experience, please rank-order the following seven elements of lesson planning from 1-7 in the order you believe them to impact student achievement. 1 =least impact and 7=greatest impact
_______For lesson planning to effectively impact student learning it must identify clearlearning objectives
_______For lesson planning to effectively impact student learning it must create qualityassignments that enhance student mastery of content.
_______For lesson planning to effectively impact student learning it must createlogically structured lessons.
_______For lesson planning to effectively impact student learning it must contain avariety of instructional strategies.
_______ For lesson planning to effectively impact student learning it must consider theamount of time students spend engaged in the act of learning.
_______ For lesson planning to effectively impact student learning it must account forlearning differences among students.
_______ For lesson planning to effectively impact student learning it must align contentto developmentally appropriate skills.
191

192
ELEMENTS OF LESSON PLANNING IN PRACTICE
Which of the following lesson planning elements have you used in the past week during lesson planning? Select as many or as few as apply.
_______Identifying clear learning objectives
_______Planning quality assignments that enhance student mastery of content
_______Planning logically structured lessons
_______Planning a variety of instructional strategies
_______Ensuring the amount of time students spend engaged in the act of learning ismaximized.
_______Accounting for learning differences among students
_______Developing plans that align content to developmentally appropriate skills.
CLASSROOM ASSIGNMENTS
Based on your knowledge and experience, please rank-order the following eight items that can be considered when creating classroom assignments that you believe impact student achievement. Please use the following scale in rank ordering the items: l=least impact and 8=greatest impact.
______Uses state curriculum in classroom assignments
Uses adopted curriculum materials in classroom assignments
Includes cross curricular assignments
Includes real world connections to assignments
Includes student control over assignments
Uses sustained writing on assignments
______Includes depth of knowledge necessary to complete assignments
Provides students with a performance standard and/or scoring guideline forassignments

193
CLASSROOM ASSIGNMENTS IN PRACTICE
Which of the following lesson planning elements have you used in the past week during lesson planning? Select as many as needed.
Uses state curriculum in classroom assignments
Uses adopted curriculum materials in classroom assignments
Includes cross curricular assignments
Includes real world connections to assignments
Includes student control over assignments
Uses sustained writing on assignments
Includes depth of knowledge necessary to complete assignments
Provides students with a performance standard and/or scoring guideline forassignments
LESSON STRUCTURE
Based on your knowledge and experience, please rank-order the following five items about lesson structure in the order you believe them to impact student achievement.Please use the following scale in rank ordering the items: l=least impact and 5=greatest impact.
_______Focusing attention on the sequence of a single lesson
_______Focusing attention on the sequence of multiple lessons in a unit.
_______Giving step-by step instructions
_______Focusing attention on the sequence of questions to be asked by the teacher
_______Aligning the learning objective, activity, and assessment

194
LESSON STRUCTURE IN PRACTICE
Which of the following lesson structure elements have you used in the past week during lesson planning? Select as many as needed.
_______Focusing attention on the sequence of a single lesson
_______Focusing attention on the sequence of multiple lessons in a unit.
_______Giving step-by step instructions
_______Focusing attention on the sequence of questions to be asked by the teacher
_______Aligning the learning objective, activity, and assessment
Are there any other important aspects of lesson structure you use to impact student achievement?
Part 2
TYPE OF LESSON PLANS
For the following question, please choose the single most appropriate response.
Based on your experience which type of lesson planning do you use most prominently?
I use written lesson plans
I use no formal lesson plans
I use a mental model for lesson plans

195
WRITTEN LESSON PLANS
Based on your experience using a written lesson plan, how often do you refer to your written lesson plan during the course of a day?
I refer to my written lesson plans______times per day.
Part 3
DEMOGRAPHIC INFORMATION
Which of the following best describes the school in which you currently work?
________Elementary School
________Middle School
________High School
________Other__________________________________________________
Please indicate the primary content area(s) in which you teach.
_______Language Arts
_______Mathematics
_______Science
_______Social Studies
Other ________________________

196
Please indicate your gender.
_______Female
_______Male
_______Other_______________________________________________________
Please indicate the total number of years that you have taught.
_______less than 3 years
_______ 3-5 years
_______6-10 years
_______11-20 years
_______20 + years
Which of the following best describes the setting of the school where you currently work?
_______Rural
_______Suburban
_______Urban
Please list the state where you currently work.

197
Appendix C
Final Survey B
Elements of Effective Teachers’ Lesson Planning
Parti
DIRECTIONS: Based on your knowledge and experience, please respond to the following questions regarding Lesson Planning by rank ordering.
ELEMENTS OF LESSON PLANNING IN PRACTICE
Which of the following lesson planning elements have you used in the past week during lesson planning? Select as many or as few as apply.
_______Identifying clear learning objectives
_______Planning quality assignments that enhance student mastery of content
_______Planning logically structured lessons
_______Planning a variety of instructional strategies
_______Ensuring the amount of time students spend engaged in the act of learning ismaximized.
_______Accounting for learning differences among students
_______Developing plans that align content to developmentally appropriate skills.

198
ELEMENTS OF LESSON PLANNING
Based on your knowledge and experience, please rank-order the following sevenelements of lesson planning from 1-7 in the order you believe them to impact studentachievement. l=least impact and 7=greatest impact
_______For lesson planning to effectively impact student learning it must identify clearlearning objectives
_______For lesson planning to effectively impact student learning it must create qualityassignments that enhance student mastery of content.
_______For lesson planning to effectively impact student learning it must createlogically structured lessons.
_______For lesson planning to effectively impact student learning it must contain avariety of instructional strategies.
_______ For lesson planning to effectively impact student learning it must consider theamount of time students spend engaged in the act of learning.
_______ For lesson planning to effectively impact student learning it must account forlearning differences among students.
_______ For lesson planning to effectively impact student learning it must align contentto developmentally appropriate skills.

199
CLASSROOM ASSIGNMENTS IN PRACTICE
Which of the following lesson planning elements have you used in the past week during lesson planning? Select as many as needed.
Uses state curriculum in classroom assignments
Uses adopted curriculum materials in classroom assignments
Includes cross curricular assignments
Includes real world connections to assignments
Includes student control over assignments
Uses sustained writing on assignments
Includes depth of knowledge necessary to complete assignments
______Provides students with a performance standard and/or scoring guideline forassignments
CLASSROOM ASSIGNMENTS
Based on your knowledge and experience, please rank-order the following eight items that can be considered when creating classroom assignments that you believe impact student achievement. Please use the following scale in rank ordering the items: l=least impact and 8=greatest impact.
______Uses state curriculum in classroom assignments
Uses adopted curriculum materials in classroom assignments
______Includes cross curricular assignments
______Includes real world connections to assignments
Includes student control over assignments
Uses sustained writing on assignments
Includes depth of knowledge necessary to complete assignments
Provides students with a performance standard and/or scoring guideline forassignments

200
LESSON STRUCTURE IN PRACTICE
Which of the following lesson structure elements have you used in the past week during lesson planning? Select as many as needed.
_______Focusing attention on the sequence of a single lesson
_______Focusing attention on the sequence of multiple lessons in a unit.
_______Giving step-by step instructions
_______Focusing attention on the sequence of questions to be asked by the teacher
_______Aligning the learning objective, activity, and assessment
LESSON STRUCTURE
Based on your knowledge and experience, please rank-order the following five items about lesson structure in the order you believe them to impact student achievement. Please use the following scale in rank ordering the items: l=least impact and 5=greatest impact.
_______Focusing attention on the sequence of a single lesson
_______Focusing attention on the sequence of multiple lessons in a unit.
_______Giving step-by step instructions
_______Focusing attention on the sequence of questions to be asked by the teacher
_______Aligning the learning objective, activity, and assessment

201
Part 2
TYPE OF LESSON PLANS
For the following question, please choose the single most appropriate response.
Based on your experience which type of lesson planning do you use most prominently?
_______ I use written lesson plans
_______ I use no formal lesson plans
_______ I use a mental model for lesson plans
WRITTEN LESSON PLANS
Based on your experience using a written lesson plan, how often do you refer to your written lesson plan during the course of a day?
I refer to my written lesson plans times per day.

202
Part 3
DEMOGRAPHIC INFORMATION
Which of the following best describes the school in which you currently work?
________Elementary School
________Middle School
________High School
________Other__________________________________________________
Please indicate the primary content area(s) in which you teach.
_______Language Arts
_______Mathematics
_______Science
_______Social Studies
_______Other___________________________________
Please indicate your gender.
_______Female
_______Male
Other

203
Please indicate the total number of years that you have taught.
_______less than 3 years
_______ 3-5 years
_______6-10 years
_______11-20 years
_______20 + years
Which of the following best describes the setting of the school where you currently work?
_______Rural
_______Suburban
_______Urban
Please list the state where you currently work.

Appendix D
Regions of the United States
Four Regions of the United States
REGION I: NORTHEAST REGION 3: SOUTH
ConnecticutMaineMassachusetts New Hampshire Rhode Island Vermont New Jersey New York Pennsylvania
REGION 2: MIDWEST
IllinoisIndianaMichiganOhioWisconsin Iowa Kansas Minnesota Missouri Nebraska North Dakota South Dakota
DelawareDistrict of ColumbiaFloridaGeorgiaMarylandNorth CarolinaSouth CarolinaVirginiaWest VirginiaAlabamaKentuckyMississippiTennesseeArkansasLouisianaOklahomaTexas
REGION 4: WEST
ArizonaColoradoIdahoMontanaNevadaNew MexicoUtahWyomingAlaskaCaliforniaHawaiiOregonWashington
204

Appendix E
Letter to Participants
College of William and Mary Dissertation Study: Thank you for reading this email!
My name is Jessica Straessle and I am a former teacher, Navy spouse, and a doctoral student in the Education Policy, Planning, and Leadership program at the College of William and Mary in Virginia.
To collect data for my dissertation, I have created a short on-line survey entitled, “Elements of Effective Teachers’ Lesson Planning.” This survey asks participants to rank elements of lesson planning against one another in terms of their impact on student achievement. Additionally, as a participant, you will be asked for information regarding your own lesson planning techniques.
Click the link at the top of the page to begin the survey
The survey will take approximately 10-15 minutes to complete. Once you click on the link to begin the survey, the first page you will see is the Consent Agreement that describes the study and its ethical safeguards.
If you would like a copy of the results from this study, send an email to [email protected] with “survey results” in the subject line. Once I have compiled all of the information, I will gladly send you a summary.
Why were you selected to participate in this study?
I have employed the services of a school internet company that assists with online surveys. From the list of teachers throughout the U.S., you were randomly selected you as a participant.
As an educator, spouse, and student, I know how valuable time can be. That is why I have designed the survey to be brief, and I sincerely hope you will take just a couple minutes to complete the survey. In advance, let me thank you so much for taking the time to help me by taking my dissertation survey!
205
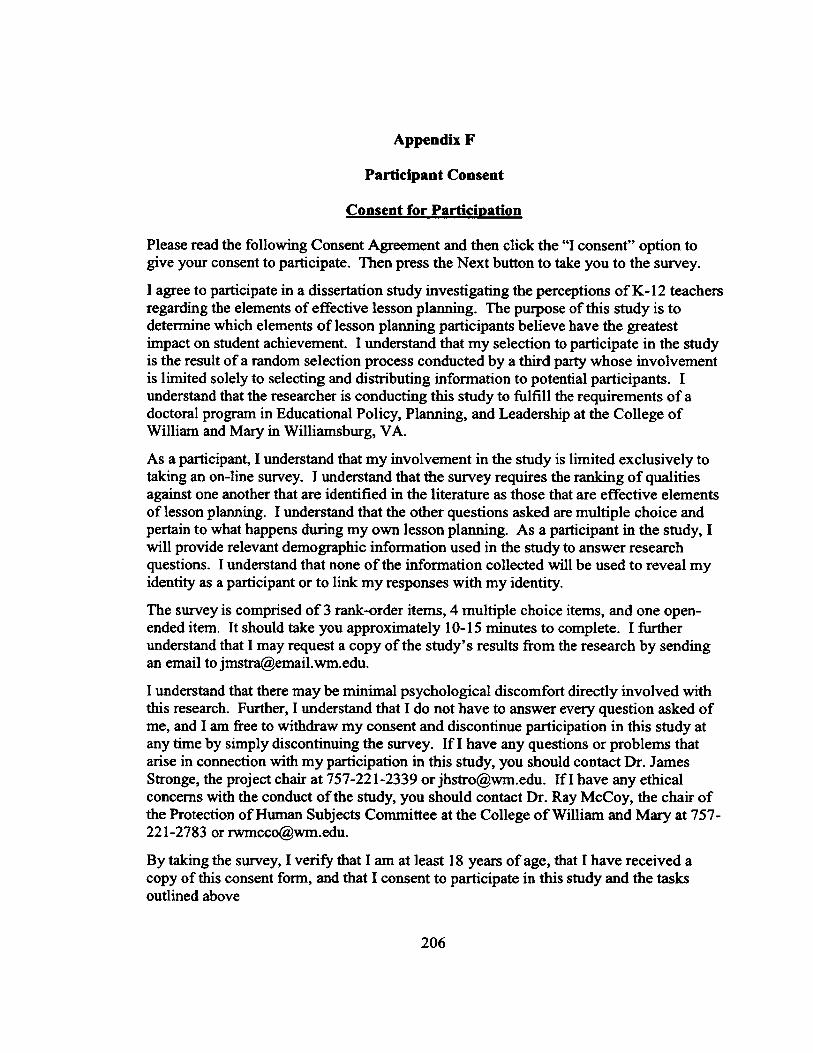
Appendix F
Participant Consent
Consent for Participation
Please read the following Consent Agreement and then click the “I consent” option to give your consent to participate. Then press the Next button to take you to the survey.
I agree to participate in a dissertation study investigating the perceptions of K-12 teachers regarding the elements of effective lesson planning. The purpose of this study is to determine which elements of lesson planning participants believe have the greatest impact on student achievement. I understand that my selection to participate in the study is the result of a random selection process conducted by a third party whose involvement is limited solely to selecting and distributing information to potential participants. I understand that the researcher is conducting this study to fulfill the requirements of a doctoral program in Educational Policy, Planning, and Leadership at the College of William and Mary in Williamsburg, VA.
As a participant, I understand that my involvement in the study is limited exclusively to taking an on-line survey. I understand that the survey requires the ranking of qualities against one another that are identified in the literature as those that are effective elements of lesson planning. I understand that the other questions asked are multiple choice and pertain to what happens during my own lesson planning. As a participant in the study, I will provide relevant demographic information used in the study to answer research questions. I understand that none of the information collected will be used to reveal my identity as a participant or to link my responses with my identity.
The survey is comprised of 3 rank-order items, 4 multiple choice items, and one open- ended item. It should take you approximately 10-15 minutes to complete. I further understand that I may request a copy of the study’s results from the research by sending an email [email protected].
I understand that there may be minimal psychological discomfort directly involved with this research. Further, I understand that I do not have to answer every question asked of me, and I am free to withdraw my consent and discontinue participation in this study at any time by simply discontinuing the survey. If I have any questions or problems that arise in connection with my participation in this study, you should contact Dr. James Stronge, the project chair at 757-221-2339 [email protected]. If I have any ethical concerns with the conduct of the study, you should contact Dr. Ray McCoy, the chair of the Protection of Human Subjects Committee at the College of William and Mary at 757- 221-2783 [email protected].
By taking the survey, I verify that I am at least 18 years of age, that I have received a copy of this consent form, and that I consent to participate in this study and the tasks outlined above
206

References
Aaronson, D., Barrow, L., & Sander, W. (2007). Teachers and student achievement in the
Chicago public high schools. Journal o f Labor Economics, 25(1), 95-135.
Alexander, R. (2000). Culture and Pedagogy: International Comparisons in Primary
Education. Oxford: Blackwell.
Allington, R. L., & Johnston, P. H. (2000). What do we know about effective fourth-grade
teachers and their classrooms? Albany, NY: The National Research Center on
English Leaning & Achievement, State University of New York.
Ascher, C., & Frucher, N. (2001). Teacher quality and student performance in New York
City’s Low performing schools. Journal ofEducation fo r Students Placed at Risk,
6, 199-214.
Bain, H. P. & Jacobs, R. (1990). The case for smaller classes and better teachers.
Streamlined Seminar—National Association o f Elementary School Principals,
9(1).
Barber, M., & Mourshed, M. (2007). How the world’s best-performing school systems
come out on top. London: McKinsey & Company. Retrieved February 10, 2012,
from http://www.mckinsey.com/locations/ukireland/publications/pdf'
Education_report.pdf.
Berliner, D. C. (1986). In pursuit of the expert pedagogue. Educational Researcher,
15(7), 5-13.
Berliner, D. C. (2004). Describing the behavior and documenting the accomplishments of
expert teacher. Bulletin o f Science, Technology and Society, 24, 200-212.
207

Borko, H., &Livingston, C. (1989). Cognition and improvisation: Differences in
mathematics instruction by expert and novice teachers. American Educational
Research Journal, 26(4), 473-498.
Borman, G. D., & Kimbal, S. M. (2005). Teacher quality and educational equality: Do
teachers with higher standards-based evaluation ratings close student achievement
gaps? Elementary School Journal, 106(1), 3-20.
Brookhard, S. M., & Loadman, W. E. (1992). Teacher assessment and validity: What do
we want to know? Journal o f Personnel Evaluation in Education, 5, 347-357.
Brophy, J. E. (1979). Advances in teacher effectiveness research. Journal o f Classroom
Interaction, 15(1), 17-24.
Brophy, J., & Good, T. L. (1986). Teacher behavior and student achievement. In M.
Wittrock (Ed.), Handbook o f Research on Teaching (3rd ed.) (pp. 328-375). New
York: Macmillan.
Brown, D. S. (1988). Twelve middle-school teachers’ planning. The Elementary School
Journal, 89(1), 69-87. Retrieved from the JSTOR database.
Bruner, J. (2000). Reading for possible worlds. National Reading Conference Yearbook,
49,31-40.
Burden, P., & Byrd, D. (2003). Methods o f effective teaching (3rd ed.). Boston: Allyn
and Bacon.
Cameron, C. E., Connor, C. M., & Morrison, F. J. (2005). Effects of variation in teacher
organization on classroom functioning. Journal o f School Psychology, 43, 61-85.
doi: 10.1016/j.jsp.2004.12.002
Cameron, C. E., Connor, C. M., & Morrison, F. J., & Jewkes, A. M. (2008). Effects of
classroom organization on letter-word reading in first grade. Journal o f School
Psychology, 4 6 ,173-192. doi:10.1016/j.jsp.2007.03.002
CCSSO (2013, April). InTASC model core teaching standards and learning
progressions for teachers 1.0. Retrieved from
http://www.ccsso.org/Resources/Publications/InTASC_Model_Core_Teaching_St
andards and Learning Progressions for Teachers_ 10.html
Chard, D. J. (2004). Toward a science of professional development in early reading
instruction. Exceptionality, 12, 175-191.
Clare, L. (2001). Exploring the technical quality of using assignments and student work
as indicators of classroom practice. Educational Assessment, 7(1), 39-59.
Clark, C. M. & Peterson, P. M. (1986). Teachers’ thought processes. In M. Wittrock
(Ed.) Handbook o f Research on Teaching (3rd ed.) (pp. 255-296). New York:
Macmillan.
Clark, C. M., & Yinger, R. J. (1987). Teacher planning. In J. Calderhead (Ed.),
Exploring teachers’ thinking (p. 84-103). London: Cassell.
Clark, C. M, & Yinger, R. J. (1979). Three studies o f teacher planning (Research Series
No. 55). East Lansing: Michigan State University, Institute for Research on
Teaching.
Coleman, J. S., Campbell, E. Q., Hobson, C. J., McPartland, J., Mood, A. M., Weinfield,
F. D., etal. (1966). Equality o f educational opportunity. Washington, DC: U.S.
Government Printing Office.

Costa, A. L. (2001). Habits of mind. In A. L. Costa (Ed.), Developing Minds: A Resource
Book fo r Teaching Thinking (pp.80-86). Alexandria, VA: Association for
Supervision and Curriculum Development.
Danielson, C. (2007). Enhancing professional practice: A framework fo r teaching (2nd
edition). Alexandria, VA: Association for Supervision and Curriculum
Development.
Danielson, C., & McGreal, T. L. (2000). Teacher evaluation to enhance professional
practice. Alexandria, VA: Association for the Supervision and Curriculum
Development.
Darling-Hammond, L. (2000). Teacher quality and student achievement: A review of
state policy evidence. Education Policy Analysis Archives, 8(1).
Darling-Hammond, L. & Youngs, P. (2002). Defining “highly qualified teachers”: What
does “scientifically-based research” actually tell us? Educational Researcher,
31(9), 13-25. Retrieved October 25, 2010 from the JSTOR database.
Davis, G. A. & Thomas, M. A. (1989). Effective schools and effective teachers. Boston,
MA: Allyn & Bacon.
Ding, C., & Sherman, H. (2006). Teaching effectiveness and student achievement:
Examining the relationship. Educational Research Quarterly, 29(4), 40-51.
Retrieved October 25,2010 from the Education Research Complete database.
DiPaola, M. F., & Hoy, W. K. (2008). Principals improving instruction: Supervision,
evaluation, and professional development. Boston: Pearson Education, Inc.
212
Egan, K. (1997). The educated mind: How cognitive tools shape our understanding.
Chicago: University of Chicago Press.
Egan, K. (2005). An imaginative approach to teaching. San Francisco: Jossey-Bass.
Emmer, E. T., Evertson, C. M., & Anderson, L. M. (1980). Effective classroom
management at the beginning of the school year. The Elementary School Journal,
80(5), 219-231.
Feldon, D. F. (2007). Cognitive load and classroom teaching: The double-edged sword
of automaticity. Educational Psychologist, 42(3), 123-137.
Frudden, S. J. (1984). Lesson plans can make a difference in evaluating teachers.
Education, 104(A), 351-353. Retrieved November 15, 2010 from the Education
Research Complete database.
Gall, M. D., Gall, J. P., & Borg, W. R. (2007). Educational research: An introduction (8th
ed.). Boston, MA: Pearson.
Games, P. A., 8c Howell, J. F. (1976). Pairwise multiple comparison procedures with
unequal n's and/or variances: A Monte Carlo study. Journal o f Educational
Statistics, 1, 113-125.
Gareis, C. R. (2007). Instructional planning: Using teaching models as frameworks for
instructional strategies.
Goldhaber, D., (2002). The mystery of good teaching: Surveying the evidence on
student achievement and teachers’ characteristics. Education Next, 2 (1).
Retrieved February 29, 2012 from http://educationnext.org/the-mystery-of-good-
teaching/

Goldin, C. & Katz, L. F. (2008). The Race Between Education and Technology.
Cambridge, MA: The Belknap Press of Harvard University Press.
Good, T. L. & Brophy, J. E. (2004). Looking in classrooms. New York, NY: Harper &
Rowe.
Gravetter, F. J. & Wallnau, L. B. (2008). Essentials o f statistics for the behavioral
sciences (6th ed.). Belmont, CA: Thomson Wadsworth.
Halverson, R., Kelly, C., & Kimball, S. (2004). How principals make sense of complex
artifacts to shape local instructional practice. In W. K. Hoy & C. G. Miskel
(Eds.), Educational administration, policy, and reform: Research and
measurement (pp. 153-188). Greenwich, CT: George F. Johnson.
Hanushek, E. A., Kain, J. F., O’Brien, D. M., & Rivkin, S. G. (2005). The market for
teacher quality (Working Paper #11154). Cambridge, MA: National Bureau of
Economic Research. Retrieved February 8, 2012 from
http://www.nber.org/papers/wl 1154.
Hattie, J. (2009). Visible learning: A synthesis o f over 800 meta-analyses relating to
student achievement. New York: Routledge.
Hattie, J. (2003). Teachers make a difference: What is the research evidence? Retrieved
February, 14 2012 from
http://www.leadspace.govt.nz/leadership/pdfrjohn_hattie.pdf.
Haycock, K. (1998). Good teaching matters: How well-qualified teachers can close the
gap. Magazine o f History, 13(1), 61-63.

214
Hershberg, T. & Robertson-Kraft, C. (2010). Maximizing the opportunity provided by
race to the top. Perspectives on Urban Education, 7(1), 128-131. Retrieved
February 18, 2011 from the Education Research Complete database.
Hill, H. C. (2009). Evaluating value-added models: A validity argument approach.
Journal o f Policy Analysis & Management, 28(4), 700-709.
Hunter, M. (1979). Teaching is decision making. Educational Leadership, 37(1), 62-67.
Jackson, A. W., & Davis, G. A. (2000). Turning points 2000: Educating adolescents in
the 2l sl century. New York: Teachers College Press.
Jalongo, R., Rieg, S. A., & Helterbran, V. R. (2007). Planning for learning:
Collaborative approaches to lesson design and review. New York: Teachers
College Press.
Jasper, B. A. (1986). An investigation o f the differences in antecedents to planning and
lesson plans between identified effective and ineffective teachers (Unpublished
doctoral dissertation). The University of Texas at Austin, Austin, TX.
Jencks, C., Smith, M., Acland, H., Bane, M. J., Cohen, D., Gintis, H., Heyns, B., &
Michelson, S. (1972). Inequality: A reassessment o f the effect offamily and
schooling in America. New York: Basic Books.
John, P. D. (2006). Lesson planning and the student teacher: Re-thinking the dominant
model. Journal o f Curriculum Studies, 38(4), 483-498. Retrieved January 15,
2011 from the Education Research Complete database.
Johnson, B. L. (1997). An organizational analysis of multiple perspectives of effective
teaching: Implications for teacher evaluation. Journal o f Personnel Evaluation in
Education, 11, 69-87.

215
Johnson-Leslie, N. A. (2007). Effective vs. ineffective teachers educating our children:
A content analysis. International Journal o f Learning, 13(9), 132-142. Retrieved
July 6,2012 from the Education Research Complete database.
Jones, K. A., Jones, J. L., & Vermette, P. J. (2011). Six common lesson planning pitfalls:
Recommendations for novice educators. Education, 131(4), 845-864.
Joyce, B. R., Weil, M., & Calhoun, E. (2004). Models o f Teaching (7th ed.). Boston:
Allyn and Bacon.
Kagan Publications. 1999. Higher-level Thinking Questions. San Clemente, CA: Kagan.
Kagan, D. M. & Tippins, D. J. (1992). The evolution of functional lesson plans among
twelve elementary and secondary student teachers. The Elementary School
Journal, 92(4), 477-489. Retrieved November 10, 2010 from the Education
Research Complete database.
Korkmaz, I. (2009). The examination of elementary teachers’ effectiveness on using
questioning strategies in their classrooms. The International Journal o f Learning,
16(6), 513-522. Retrieved February 3,2014 from Education Research Complete
Database.
Korkmaz, O. & Yesil, R. (2010). A comparison of different teaching applications based
on questioning in terms of their effects upon pre-service teachers’ good
questioning skills. College Student Journal, 44(4), 1006-1020. Retrieved
February 3, 2014 from Education Research Complete Database.
Kauchak, D.P. & Eggen P.D. (1998). Learning and teaching: Research based method.
Boston: AViacom Company.

216
Ko, E. K. (2012). What is your objective?: Preservice teachers’ views and practice of
instructional planning. The International Journal o f Learning, 18(7), 89-100.
Retrieved May 14, 2013 from the Education Research Complete database.
Koh, K. & Luke, A. (2009). Authentic and conventional assessment in Singapore
schools: An empirical study of teacher assignments and student work.
Assessment in Education: Principles, Policy & Practice, 16(3), 291-318.
Retrieved July 6,2012 from Education Research Complete database.
Koeller, S. & Thomspon, E. (1980). Another look at lesson planning. Educational
Leadership, 37(8), 673-675.
Kracl, C. L. (2012). Review or true? Using higher-level thinking questions in social
studies instruction. The Social Studies, 103, 57-60.
Kupermintz, H. (2003). Teacher effects and teacher effectiveness: A validity
investigation of the Tennessee value added assessment system. Educational
Evaluation & Policy Analysis, 25(3), 287-298. Retrieved October 28, 2010 from
The JSTOR database.
Lambert, G. E. (1988). Lesson planning and the experienced teacher. OCSS Review,
24(1), 52 58. Retrieved from ERIC database.
Leinhardt, G. & Greeno, J. G. (1986). The cognitive kill of teaching. Journal o f
Educational Psychology, 78(2), 75-95.
Marshall, B. (2012). Teacher lesson planning: Superficial or deep? Teaching Young
Children, 6(2), 24-26.

217
Marzano, R. J. (2007). The art and science o f teaching: A comprehensive frameworkfor
effective instruction. Alexandria, VA: Association for Supervision and
Curriculum Development.
Marzano, R. J., Pickering, D. J., & Pollock, J. E. (2001). Classroom instruction that
works: Research-based strategies for increasing student achievement.
Alexandria, VA: Association for Supervision and Curriculum Development.
McCutcheon, G. & Miner, H. R. (2002). A contemporary study of teacher planning in a
high school English class. Teachers and Teaching: theory and practice, 8(1), 81-
94.
McCutcheon, G. (1980). How do elementary school teachers plan? The nature of
planning and influences on it. The Elementary School Journal, 81(1), 4-23.
McEwan, E. K. (2002) 10 traits o f highly effective teachers. Thousand Oaks, CA:
Corwin Press, Inc.
Mertzman, T., Vierk, J., Kildahl, T., Wintheiser, J., Hung, Y., and Goldstein, A. (2007).
Improving teachers’ scaffolding choices. International Journal o f Learning,
13(11), 7-15.
Meyer, R. H. (1996). Value-added indicators of school performance. In E. Hanushek, &
D. Jorgenson (Eds.), Improving America’s Schools: The Role o f Incentives
(pp. 197-223). Retrieved from http://site.ebrary.com.proxy.wm.edu/lib/
williamandmary/docDetail.action?docID=10041154
Milanowski, A. (2004). The relationship between teacher performance evaluation scores
and student achievement: Evidence from Cincinnati. Peabody Journal o f
Education, 79(4), 33-53.

218
Miller, G.R. (2007). Engaging diverse learners in historical thinking. Lynch Graduate
School of Education, UMI Microform 3268509.
Mintz, S. L. & Yarger, S. J. (1980). Conceptual level and teachers ’ written plans. Paper
presented at the annual meeting of the American Educational Research
Association Boston, MA April, 1980.
Mitra, A., Jain-Shukla, P., Robbins, A., Champion, H. & Durant, R. (2008). Differences
in Rate of Response to Web-Based Surveys Among College Students.
International Journal on E-Learning, 7(2), 265-281. Chesapeake, VA: AACE.
Mohan, M. & Hull, R. E. (1975). Teaching effectiveness: Its meaning, assessment, and
improvement. Englewood Cliffs, NJ: Educational Technology Publications.
Morine, G. (1976). A study o f teacher planning. BTES Technical Report 75-11-6. San
Francisco, CA: Far West Laboratory for Educational Research and Development.
Morine-Dershimer, G. (1978-1979). Planning in classroom reality an in-depth look.
Educational Research Quarterly, 3(4), 83-99.
National Board for Professional Teaching Standards (2012). Early childhood generalist
standards. Retrieved from http://www.nbpts.org/generalist-ec
The National Commission on Excellence in Education. (1983). A nation at risk: The
imperative for educational reform. Retrieved from
datacenter.spps.org/uploads/sotw_a_nation_at_risk_1983.pdf
Newton, X. A., Darling-Hammond, L., Haertel, E., & Thomas, E. (2010). Value-added
modeling of teacher effectiveness: An exploration of stability across models and
contexts. Education Policy Analysis Archives, 18(23), 1-23. Retrieved November
21, 2010 from the Education Research Complete database.

Nuthall, G. (2005). The cultural myths and realities of classroom teaching and learning:
A personal journey. Teachers College Record, 107(5), 895-934.
Nye, B., Konstantopolulos, S., & Hedges, L. V. (2004). How large are teacher effects?
Educational Evaluation and Policy Analysis, 26(3), 237-257.
Odden, A., Borman, G., & Fermanich, M. (2004). Assessing teacher, classroom, and
school effects, including fiscal effects. Peabody Journal o f Education, 79(4), 4-
32.
OECD. (2010). Strong performers and successful reformers in education: Lessons from
PISA for the United States. Retrieved from February 17, 2012 from
http://www.oecdilibrary.org/education/lessons-from-pisa-for-the-united-
states_9789264096660-en
Orlich, D., Harder, R., Callahan, R., Trevisan, M., & Brown, A. (2004). Teaching
strategies: A guide to effective instruction (7th ed.). Boston: Houghton Mifflin.
Omstein, A. C. & Hunkins, F. P. (2009). Curriculum: Foundations, principles, and
issues (5th ed.). Boston: Pearson.
Omstein, A. C. & Lasley, T. J. (2004). Strategies fo r Effective Teaching (3rd ed.).
Boston: McGraw Hill.
Panasuk, R., Stone, W., & Todd, J. (2002). Lesson planning strategy for effective
mathematics teaching. Education, 122(4), 808-827. Retrieved November 13, 2010
from the Education Research Complete database.
Panasuk, R. M., & Todd, J. (2005). Effectiveness of lesson planning: Factor analysis.
Journal o f Instructional Psychology, 32(2). Retrieved November 13,2010 from
the Education Research Complete database.

Peterson, P. L., Marx, R. W., & Clark C. M. (1978). Teacher planning, teacher behavior,
and student achievement. American Educational Research Association, 15(3),
417-432. Retrieved January 26, 2011 from JSTOR.
Peterson, P. L. & Clark, C. M. (1978). Teachers’ reports of their cognitive processes
during teaching. American Educational Research Journal, 15(4), 555-565.
Retrieved November 14, 2011 from JSTOR.
Polk, J. A. (2006). Traits of effective teachers. Arts Education Policy Review, 107(4),
23-29.
Popham, W. J. & Baker, E. L. (1970). Systematic instruction. Englewood Cliffs, NJ:
Prentice-Hall.
Porter, A. C. & Brophy, J. (1988). Synthesis of research on good teaching: Insights from
the work of the institute for research on teaching. Educational Leadership, 45(8),
74-85.
Pressley, M., Wharton-McDonald, R., Allington, R., Block, C. C., & Morrow, L. (1988).
The nature o f effective first-grade literacy instruction (Report No. CELA-R-
11007). Albany, NY: National Research Center on English Learning and
Achievement.
Rosenshine, B. V. (1986). Synthesis of research on explicit teaching. Educational
Leadership, 43(7), 60-69.
Rossman, G. B. & Rallis, S. F. (2003). Learning in the field: An introduction to
qualitative research (2nd ed.). Thousand Oaks, CA: Sage Publications.
Sanchez, G., & Valcarcel, M. V. (1999). Science teachers’ views and practices in
planning for teaching. Journal o f Research in Science Teaching, 36(4), 493-513.

Sanders, W. L., Wright, S. P., & Langevin, W. E. (2008). Do teacher effect estimates
persist when teachers move to schools with different socioeconomic
environments? (R30SA06034). Nashville, TN: National Center on Performance
Incentives Vanderbilt Peabody College. Retrieved February 8,2012 from
https://my.vanderbilt.edu/performanceincentives/ncpi-publications/outcomes-for-
students-and-teachers/incentive-pay-and-the-teacher-workforce/do-teacher-effect-
estimates-persist-when-teachers-move-to-schools-with-different-socioeconomic-
environments/
Shimizu, Y. (2008). Exploring Japanese teachers’ conception of mathematics lesson
structure: similarities and differences between pre-service and in-service
teachers’ lesson plans. Mathematics Education, 40, 941-950.
Smith, J. K. (1977). Teacher planning fo r instruction (Report No. 12). St. Ann, MO:
Central Midwestern Regional Educational Lab. (ERIC Document Reproduction
Service No. ED 155 156).
Stronge, J. H. (2007). Qualities o f effective teachers (2nd ed.). Alexandria, VA:
Association for Supervision and Curriculum Development.
Stronge, J. H. (2002). Qualities o f effective teachers. Alexandria, VA: Association for
Supervision and Curriculum Development.
Stronge, J. H., Ward, T. J., & Grant, L. W. (2011). What makes good teachers good? A
cross case analysis of the connection between teacher effectiveness and student
achievement. Journal o f Teacher Education, 62 (4), 339-355.
Stronge, J. H., Ward, T. J., Tucker, P. D., & Hindman, J. L. (2007). What is the
relationship between teacher quality and student achievement? An exploratory

223
United States Department of Education. (2009). Race to the top program executive
summary, Retrieved February 18, 2011 from
http://www.ed.gov/programs/racetothetop/executivesummary.pdf.
Wang, M. C., Haertel, G. D., & Walberg, H. J. (1993a). Toward a knowledge base for
school learning. Review o f Educational Research, 63(3), 249-294. Retrieved
April 6,2012 from JSTOR database.
Wang, M. C., Haertel, G. D., & Walberg, H. J. (1993b). What helps students learn?
Educational Leadership 51(4), 74-79.
Wharton-McDonald, R., Pressley, M., & Hampston, J. M. (1988). Literacy instruction in
nine first-grade classrooms: Teacher characteristics and student achievement.
The Elementary School Journal, 99(2), 101-128.
Wilen, W. W. (2001). Exploring myths about teacher questioning in the social studies
classroom. The Social Studies, 92(1), 26-32.
Willen, W. (1990). Teaching and learning through discussion. Springfield, IL: Charles
C Thomas.
Wright, S. P., Horn, S. P., & Sanders, W. L. (1997). Teacher and classroom context
effects on student achievement: Implications for teacher evaluation. Journal o f
Personnel Evaluation in Education, 11, 57-67.
Yinger, R. J. (1980). A study of teacher planning. The Elementary School Journal,
80(3), 107-127. Retrieved January 15, 2011 from the Education Research
Complete database.
Yinger, R. J. (1979). Routines in teacher planning. Theory into Practice, 18(3), 163-169.
Retrieved January 15,2011 from the Education Research Complete database.

224
Zahorik, J. A. (1970). The effect of planning on teaching. The Elementary School
Journal, 71(3), 143-151. Retrieved January 26, 2011 from JSTOR.
Zahorik, J. A. (1975). Teachers’ planning models. Educational Leadership, 33,134-139.
Zahorik, J., Halbach, A., Ehrle, K., & Molnar, A. (2003, September). Teaching practices
for smaller classes. Educational Leadership, 61(1), 75-77. Retrieved November
21, 2010 from the Education Research Complete database.

Birthdate:
Birthplace:
Education:
Vita
Jessica Miller Wunderle Straessle
June 20,1979
Decatur, Georgia
2014 The College of William and MaryWilliamsburg, Virginia Doctor of Philosophy
2004
2001
Georgia State University Atlanta, Georgia Master of Education
The College of William and Mary Williamsburg, Virginia Bachelor of Science
Professional Experience:
Third Grade Teacher (2004-2009). Providence Elementary School, Virginia Beach, Virginia.
Administrative Internship (Summer 2008). Virginia Beach City Public Schools, Virginia Beach, Virginia.
Pre-K Teacher (2003-2004). Seaborn Lee Elementary School, Atlanta, Georgia
Honors:
Kappa Delta Pi Member since 2008
Educational Testing Service (ETS) Recognition of Excellence for test scores on Praxis II: Content Knowledge (1998-2003)
High/Scope qualified Teacher since 2004
225