TEABAG TECHNOLOGY IN LONG CHAIN ALKANE SELECTIVE …
218
i TEABAG TECHNOLOGY IN LONG CHAIN ALKANE SELECTIVE OXIDATION A Thesis Submitted to the University of Cardiff for the Degree of Doctor in Philosophy By Yuan Shang Chemistry Department, University of Cardiff April 2014
Transcript of TEABAG TECHNOLOGY IN LONG CHAIN ALKANE SELECTIVE …

i
TEABAG TECHNOLOGY IN LONG CHAIN ALKANE
SELECTIVE OXIDATION
A Thesis Submitted to the University of Cardiff for the
Degree of Doctor in Philosophy
By
Yuan Shang
Chemistry Department
University of Cardiff
April 2014
ii
ACKNOWLEGDGMENTS
I would like to take the opportunity to thank many people who directly or otherwise made the
writing of this thesis possible
First of all I would like to thank my academic supervisors Prof Graham Hutchings and Dr
Jonathan Bartley for offering me the opportunity to pursue the research and for their warm
encouragement when I felt embarrassed and even gave up Without their generous help I would
not be able to complete this thesis
I would like to thank Johnson Matthey and Sasol for funding the collaborative project I would
like to thank my industrial supervisor Xavier Baucherel and his colleague Mike Watson for
their help from Johnson Matthey in both my research and the financial support
I would also like to thank Frans Prinsloo Nishlan Govender from Sasol The travel to South
Africa is very memorable I would like to specially thank Chris Nicolaides who unfortunately
left us forever He is so nice and friendly to me
I would like to thank Don Bethell Matt House Rhys Lloyd Tom Davies who gave me great
assistance and guidance in the study and technical analysis
I would like to thank all my lab mates from lab 076 and lab 188 especially my colleagues
Edouard Huguet and Sivaram Pradhan They are so amazing and gave me so many help They
enlightened my life these years
Outside the university I would also like to thank my family for their endless support both
financial and emotional throughout I love them
iii
ABSTRACT
This thesis describes the searching preparation characterization and catalytic evaluation of
active catalysts for the terminal selectivity of long chain linear alkanes The focus of the thesis
is the study of shape selective materials including the organic material cyclodextrins and the
inorganic material zeolite and zeolitic membranes Prepared catalysts were performed with n-
decane or n-hexane as models to produce the terminal oxidation products 1-decanol 1-hexanol
decanoic acid and hexanoic acid
Studies with the Andrews glass reactor showed a stable terminal selectivity of 5-9 in the
autoxidation of n-hexane in short time reactions A comparison between the Andrews glass
reactor and Parr stainless steel reactor showed that the autoxidation reactions can get higher
conversion but lower terminal selectivity in the stainless steel reactor than the glass reactor
Most of the metalsupport catalysts showed very low conversion and very poor terminal
selectivity Increasing the temperature leads to higher conversion but results in more cracked
products and less selectivity for oxygenated C10 products The most active catalyst was 5 wt
AuTiO2 However these catalysts did not show good terminal alcohol selectivity (lt3)
whereas the cracked acid selectivity was high (320) Cyclodextrin covered AuSiO2 catalysts
showed limited changes in terminal selectivities (1-2)
Zeolite 4A silicalite-1 ZSM-5 zeolite XY coated catalysts were successfully synthesized
with alumina and silica sphere supports The most attractive oxidation results were performed
by zeolite XY and zeolite 4A coated silica catalysts in n-hexane liquid phase oxidation
iv
especially for with short reaction time With zeolite XY membrane in a 30 min reaction the
terminal selectivity was 16 while the terminal selectivity for the blank reactions was 0-9
With longer reaction time the terminal selectivity decreased to 6-7 Zeolite 4A membrane
can produce a terminal selectivity of 13 in 4 h reactions
v
CONTENTS
Chapter 1 Introduction 1
11 Significance of the thesis 2
12 Aim of the thesis 2
13 Catalysis 3
14 Challenges in the selective oxidation 4
15 Industrial applications of long chain linear alcohols 5
16 Current manufacture of long linear alcohols in industry 6
17 Alkane oxidation in literature 8
18 Zeolites 10
181 Zeolite composition 10
182 Shape selective application of zeolite 11
183 Synthesis of the zeolite membrane 12
19 The model reactions in this research 14
110 The research branches in this project 15
1101 Supported catalyst investigations for shape selective catalysts 15
1102 Teabag technology 15
111 References 16
Chapter 2 Experimental Techniques 19
21 Introduction 20
22 Catalyst preparation 20
221 Preparation of supported metal catalysts 20
222 Preparation of zeolite and zeolitic coated catalysts 23
223 Preparation of cyclodextrin modified catalysts 25
vi
23 Catalyst characterization technique 25
231 X-ray powder diffraction 25
232 Scanning electron microscopy 27
233 Surface area method (BET) 29
234 Atomic absorption spectroscopy 30
235 X-ray photoelectron spectroscopy 31
24 Reactors used in the project 32
241 The Parr multiple stainless steel reactor system 32
242 The Andrews glass reactor system 34
25 Analysis and qualification of reaction products 35
251 Analysis by Gas Chromatography 35
252 Quantification of the products via response factor 36
2521 Use of internal standard 36
2522 Calculations of relative response factors of each compound 36
2523 Quantification and analysis of the reaction 39
26 References 41
Chapter 3 Andrews Glass Reactor 42
31 Introduction 43
32 Experimental 44
321 Apparatus and reaction 44
322 Safety operating procedure 45
323 Characterization technique 48
33 Results 48
331 Andrews glass reactor in blank hexane oxidation 48
vii
3311 Comparison between Andrews glass reactor and stainless steel reactor
49
3312 Repeat Iglesiarsquos blank reaction 51
3313 The unknown products in analysis 51
3314 Application of aqua regia as washing agent 52
3315 Time on-line reactions 53
3316 Discussion 55
332 Reaction with Mn-ZSM5 56
34 Conclusion 57
35 References 58
Chapter 4 Catalytic investigation for teabag coating 60
41 Introduction 61
42 Experimental 62
421 Metalsupport catalysts 62
422 RhRu loaded catalysts 63
43 Results 64
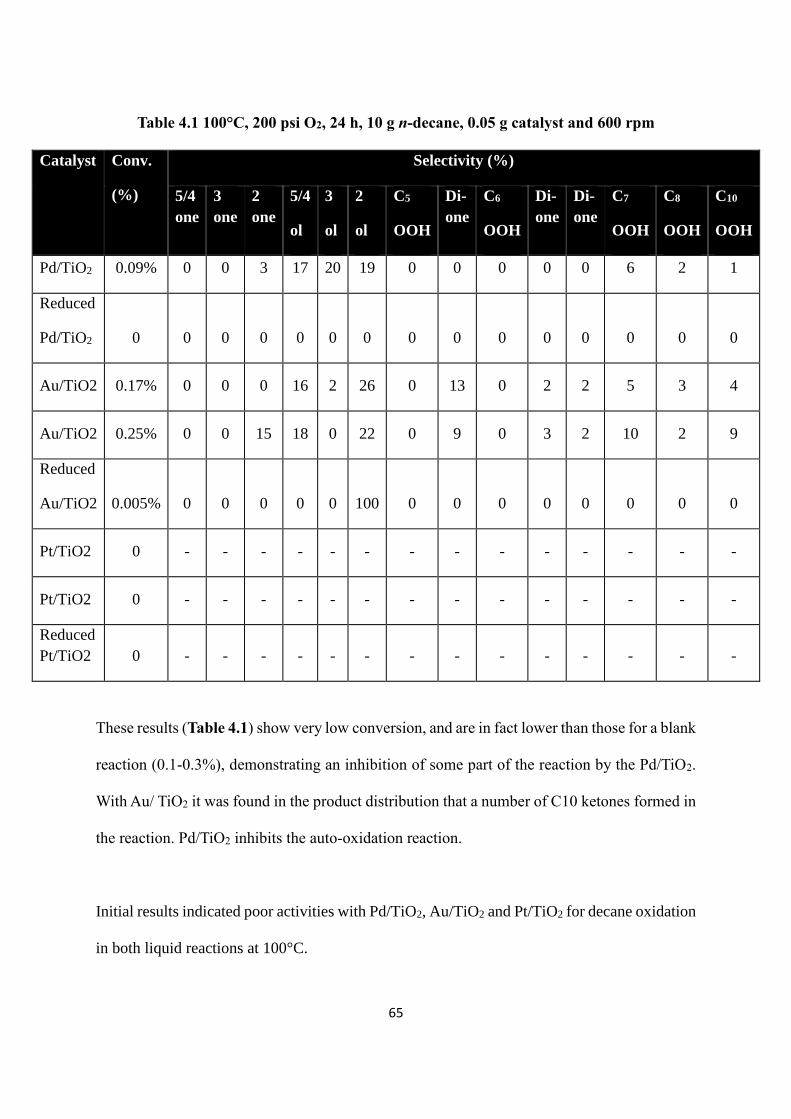
431 Pd Au Pt loaded supported catalysts 64
432 Higher temperature reactions 66
433 Discussion 68
434 Use of a radical scavenger 68
435 Development of the catalyst preparation method 70
436 Ru and Rh loaded catalysts 75
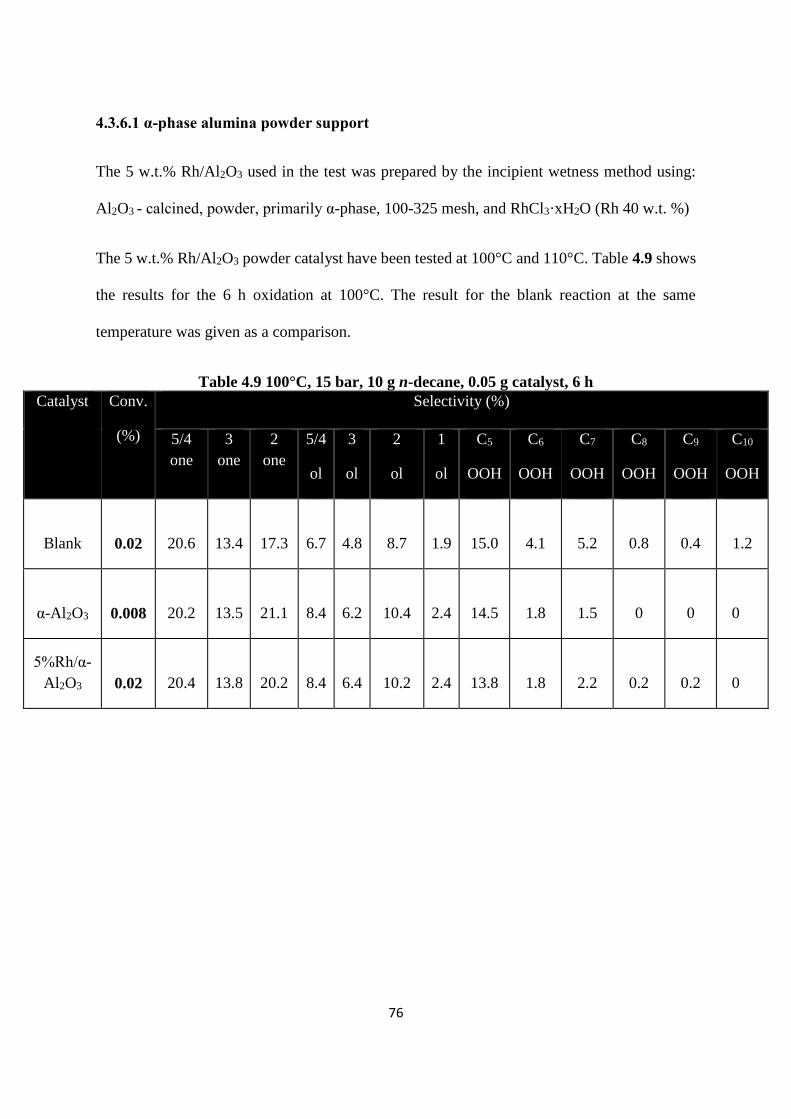
4361 α-phase alumina powder support 76
4362 γ-phase alumina powder support 78
4363 Loading with alumina spheres 83
44 Conclusion 85
viii
45 References 87
Chapter 5 Cyclodextrin covered catalysts 88
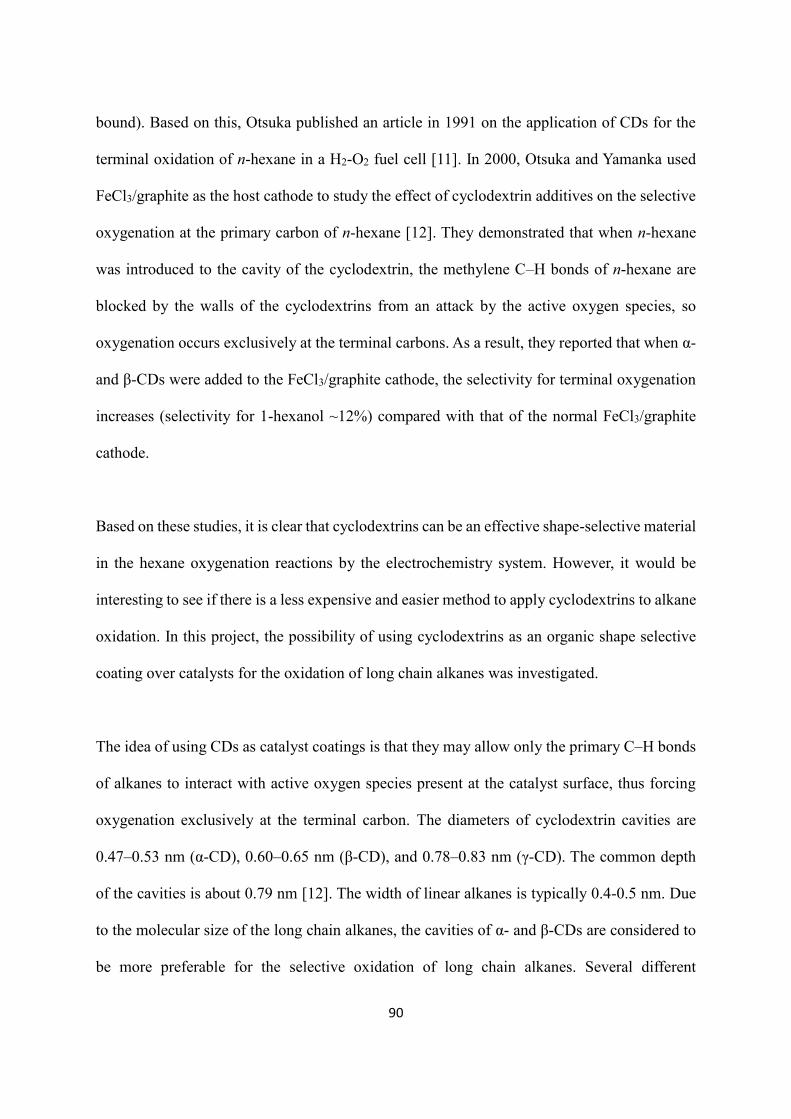
51 Introduction 89
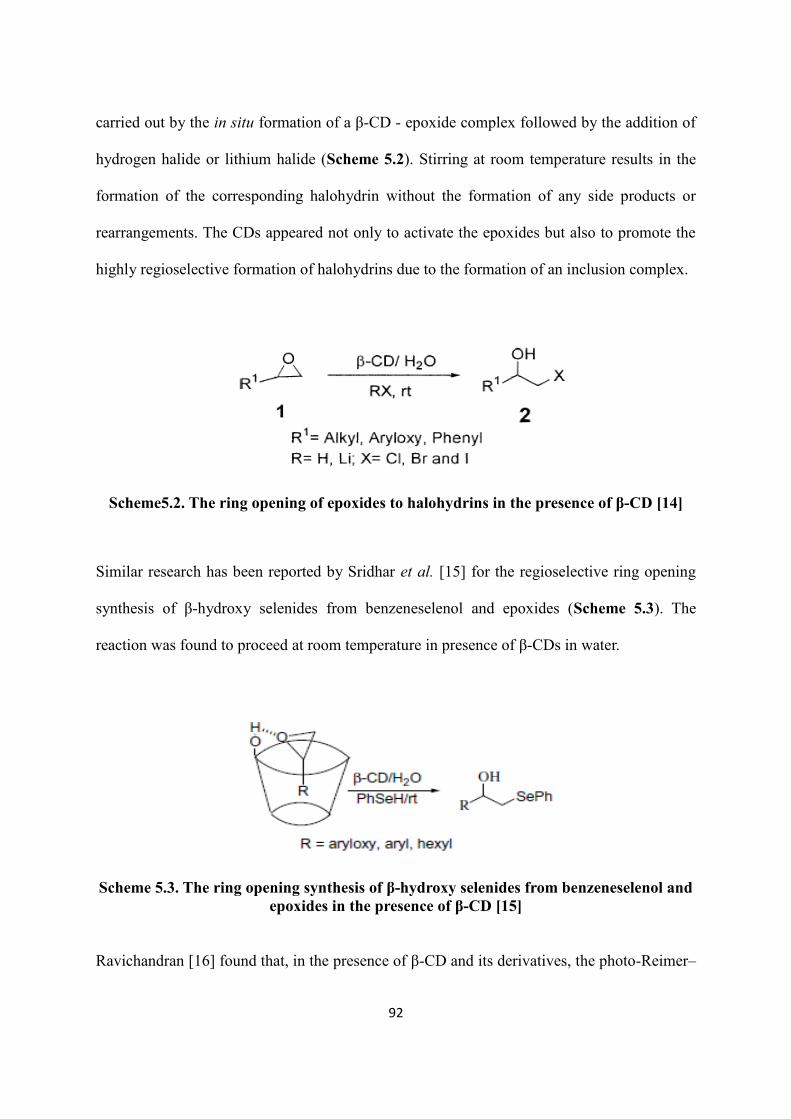
52 Cyclodextrins as catalyst modifiers 91
53 Experimental 95
531 Preparation of CD covered catalysts 95
532 Catalyst testing 96
54 Results 97
541 BET analysis 97
542 Activity of CDs 98
5421 Activity of CDs under reaction conditions 98
5422 Activity of CDs with the addition of radical scavenger 100
543 CD modified AuSiO2 101
5431 The fully covered AuSiO2 101
5432 Different level of CD coverage over catalysts 102
5433 Cyclodextrin modified catalyst recycling 104
544 CD modified AuHCl treated SiO2 105
55 Conclusion 107
56 References 107
Chapter 6 Teabag Technology 109
61 Introduction 110
62 The teabag technology project 110
63 Zeolite membrane synthesis 112
631 Preparation method 112
ix
632 Supports in zeolite coating 116
633 Other factors for preparation 119
634 Deactivation 123
64 Experimental 124
641 Preparation of coated catalysts 124
6411 Zeolite A coated samples with silica powder support 125
6412 Zeolite 4A coated samples with sphere supports 126
6413 Silicalite-1 coating with sphere supports 127
6414 ZSM-5 coating with α- and -Al2O3 128
642 Reaction conditions 129
643 Characterization 130
65 Results 130
651 Zeolite A coating with powder support 130
6511 Coated SiO2 in liquid phase reaction 130
6512 Discussion 147
6513 Coated MgO in gas phase reaction 147
6514 Discussion 156
6515 Conclusion 157
652 Zeolite A coating with sphere support 158
6521 Results 159
6522 Results and discussion 161
653 Silicalite-1 coating with sphere support 162
6531 S1 coating with α-alumina spheres 162
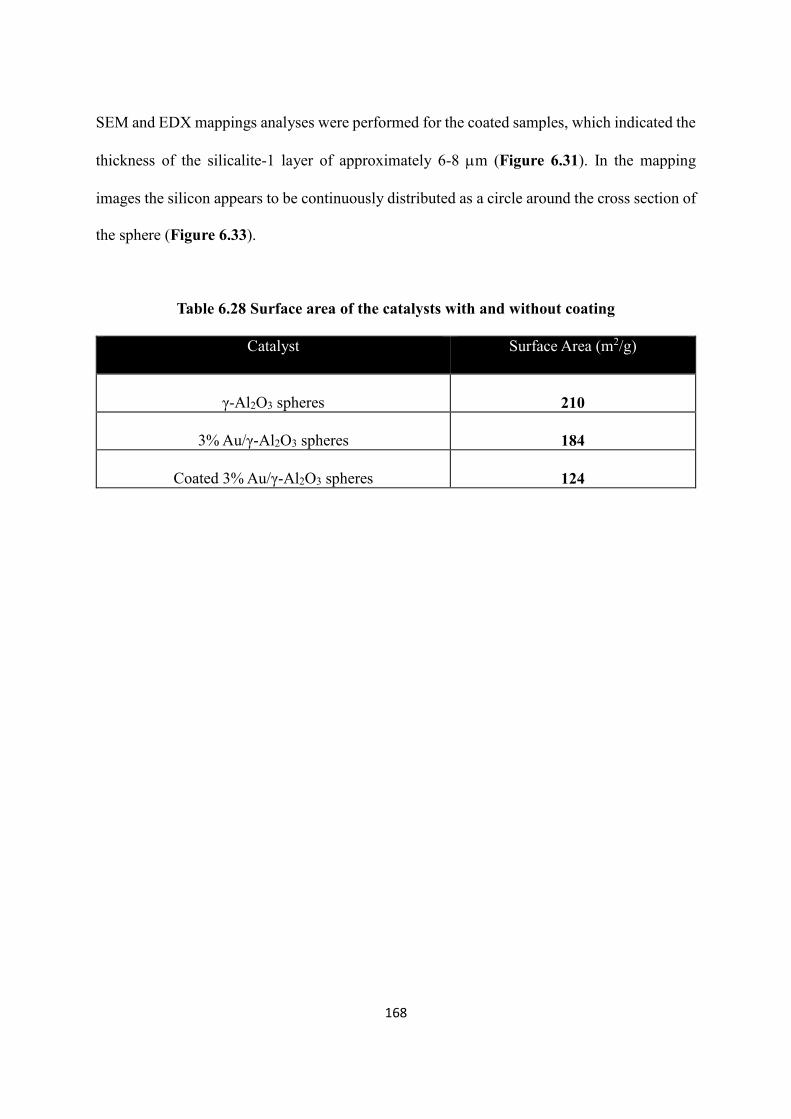
6532 S1 coating with γ-alumina spheres 167
6533 Discussion and conclusion 172
654 ZSM-5 coating with alumina sphere support 173
x
6541 ZSM-5 coating with α-alumina spheres 173
6542 ZSM-5 coating with β-alumina spheres 182
6543 Discussion 189
655 Zeolite XY coating with silica sphere support 191
6551 Results 191
6552 Discussion 192
656 Zeolite A coating in hexane oxidation 193
66 Conclusion 196
67 References 198
Chapter 7 Conclusions 201
xi
ABBREVIATIONS
ordmC Degrees centigrade
Aring Angstrom
AAS Atomic Absorption Spectroscopy
Al2O3 Alumina
Bar Unit of Pressure
BET Brunauer Emmett Teller
cm Centimetre
EDX Energy Dispersive X-ray Spectroscopy
FID Flame Ionisation Detector
NMR Nuclear Magnetic Resonance
g Grams
GC Gas Chromatography
GC-MS Gas Chromatography Mass-Spectrometer
MgO Magnesium Oxide
m Metre
min Minute
mL Millilitre
ppm Parts Per Million
psi Pounds Per Square Inch
S1 Silicalite-1
SEM Scanning Electron Microscopy
SiO2 Silica
TEM Transmission Electron Microscopy
VMgO Vanadium-Magnesium Mixed Oxides
xii
XPS X-Ray Photoelectron Spectroscopy
XRD X-Ray Diffraction
XRF X-ray Fluorescence
ZSM-5 Zeolite Socony Mobil ndash 5
1
CHAPTER 1
Introduction
2
INTRODUCTION
11 Significance of the thesis
Organic compounds such as alcohols aldehydes ketones epoxides and acids are widely used
in everyday life and industry Therefore the production of these compounds is of key
importance in modern chemistry research and to the chemical industry There are many ways
to produce these oxygen-containing organic compounds but oxidation of saturated
hydrocarbons is one of the most significant It is widely known that there are large quantities
saturated hydrocarbons obtained from natural gas and petroleum [1] in fact in South Africa
Sasol (one of the sponsors of this thesis) produces large amount of alkanes in its Fischer
Tropsch process [2] Alkanes as a relatively environmentally friendly and low cost feedstock
are ideal for the production of those valuable organic compounds Various products can be
obtained by oxidation of alkanes In this thesis the study focused on the terminal oxidation of
long chain alkanes whose products can be used in the manufacture of plasticizers lubricants
solvents surfactants and materials for further chemical functionalization
12 Aim of the thesis
The thesis is a fundamental study into the terminal oxidation of long chain n-alkanes using n-
decane and n-hexane as model compounds to produce 1-decanol decanoic acid or 1-hexanol
and hexanoic acid (Figure 11) in liquid phase reactions There are two challenges in this study
how to enhance the activity of the reaction and how to control the regioselectivity of the
oxidation To overcome the challenges catalysis was introduced into the project The project
was collaboration between Cardiff University Johnson Matthey and Sasol
3
Figure 11 Aim of the thesis ndash terminal oxidation of decane
13 Catalysis
Catalysis is the change in rate of a chemical reaction due to the participation of a catalyst
Unlike other reagents that participate in the chemical reaction a catalyst is not consumed by
the reaction itself A catalyst may participate in multiple chemical transformations Catalysts
that speed the reaction are called positive catalysts Substances that interact with catalysts to
slow the reaction are called inhibitors (or negative catalysts) Substances that increase the
activity of catalysts are called promoters and substances that deactivate catalysts are called
catalytic poisons A catalyst does not change the thermodynamics of the reaction but simply
provides a new and easier pathway by lowering the activation energy A good catalyst must
possess both high activity and long-term stability But its single most important attribute is its
selectivity which reflects its ability to direct conversion of the reactant(s) along one specific
pathway [3]
Catalysis can be divided into three categories homogeneous catalysis heterogeneous catalysis
4
and biocatalysis Homogeneous catalysis covers all the cases where catalysts and reactants are
in the same phase while heterogeneous catalysis covers all the cases where catalysts and
reactants are in different phases Homogeneous catalysts exhibit a higher activity per unit mass
of metal than heterogeneous catalysts [4] however it is difficult to recover the catalyst In
heterogeneous catalysis there is little difficulty in separating and recycling the catalyst
Biocatalysis is a rather special case somewhere between the homogeneous and heterogeneous
catalysis In most cases biocatalysts are enzymes which are often seen as a separate catalyst
group [5]
14 Challenges in the selective oxidation of alkanes
Economic factors and technological innovations often induce changes in the chemical
feedstocks used to produce commodity organic chemicals These reasons caused alkanes to
replace acetylene in many commercial processes several decades ago Alkanes as the least
expensive and most abundant hydrocarbon resource have a very important potential role in the
chemical industry However very few selective methods are available for converting alkanes
into more valuable products Furthermore several desirable reactions utilizing alkanes are not
thermodynamically favourable at reasonable temperatures Even where alkanes are used their
transformations are often inefficient This is because alkanes are saturated and lack functional
groups Hydrocarbons can only undergo reaction after cleavage of C-H or C-C bonds In most
instances the strength of the C-H bonds involved controls the rate and selectivity of oxidation
turnovers [6 7] As a result preferential oxidation specific C-H bonds except as dictated by
their relative bond strengths remains a formidable challenge C-H bonds at terminal positions
in n-alkanes are ~13 kJmol stronger than secondary C-H bonds (eg 410 kJmol vs 397
kJmol for propane) [8] thus terminal oxidation selectivities are typically below 10 in C10-
5
alkanes unless spatial constraints imposed by the H-abstractor or by the structure of the voids
around active sites favour terminal attachment or inhibit access to secondary or tertiary
carbons
Another problem in the selective oxidation of alkanes is the initial product of alkane oxidation
is often more reactive toward the oxidant than the alkane itself Overoxidation of the initial
product will dramatically reduce the desired product yield
15 Industrial applications of long chain linear alcohols
Linear primary alcohols are amphiphiles composed of a polar part (hydroxyl group) and an
apolar part (alkane chain) The amphiphile molecules can be utilized as surfactants The limited
solubility makes them aggregate in the interface between two phases to form micelles
Therefore linear primary alcohols are good detergents They are also used in the composition
of plastics and cement where they can increase the fluidity of the material Another industrial
application of linear alcohols is that they are very important materials for further chemical
functionalization based on the large number of reactions the hydroxyl group may undergo
(Figure 12 [9]) The resulting products are important commercial intermediates
6
Figure 12 Typical examples of reactions that can undergo terminal alcohols [9]
16 Current manufacture of long linear alcohols in industry
Two basic dominating industrial-scale processes are used to manufacture linear alcohols the
Ziegler process and the oxo synthesis (hydroformylation) starting from petrochemical
feedstocks [10] The Ziegler chemistry process contains five steps hydrogenation ethylation
growth reaction oxidation and hydrolysis The starting material is ethylene (Figure 13)
Terminal Linear alcohol + Oxygen rarr Aldehyde + carboxylic acid
+ Alkali Melt rarr carboxylic acid
+ Alkali rarr Dimeric Alcohol
+ Proton rarr Ether Olefin
+ Alkyne rarr Vinyl Ether
+ Carboxylic acid rarr Easter
+ Hydrogen Halide rarr Alkyl Halide
+ AmmoniaAmine rarr Amine
+ AldehydeKetone rarr Acetal
+ Sulfide rarr Thiol
+AlcoholateH2S rarr Xanthate
+Metal rarr Metal alkoxide
7
Figure 13 The multi-step Ziegler process
Al2O3 is not recycled during the reaction so it is not a catalytic process
The second industrial route is hydroformylation also known as the oxo process (Figure 14)
The process typically is accomplished by treatment of an alkene with high pressures (10-100
atm) of carbon monoxide and hydrogen at temperatures between 40 and 200ordmC [11] Transition
metal catalysts are required It is a heterogeneous catalytic process
Al
Al(C2H5)3 + (x+y+z) C2H4 Al
(CH2CH2)xCH2CH3
(CH2CH2)yCH2CH3
(CH2CH2)zCH2CH3 Triethylalumininum Ethylene
Growth Product
(CH2CH2)xCH2CH3
(CH2CH2)yCH2CH3
(CH2CH2)zCH2CH3
Growth Product
Oxidation
Al
O(CH2CH2)xCH2CH3
Aluminum Alkoxide
O(CH2CH2)yCH2CH3
O(CH2CH2)zCH2CH3
Al
O(CH2CH2)xCH2CH3
O(CH2CH2)yCH2CH3
O(CH2CH2)xCH2CH3
+
CH3-CH2-(CH2CH2)xOH
linear Primary Alcohols
Al(OH)3 +
Aluminium
Hydroxide
CH3-CH2-(CH2CH2)yOH
CH3-CH2-(CH2CH2)zOH
3 H20
8
Figure 14 Two-step oxo processes
Both the Ziegler process and the oxo process use alkenes as the feedstocks and require multi-
step reactions A process using long chain linear alkanes as the feed would be less expensive
and more environmentally friendly
17 Alkane oxidation in literature
Literature covering long chain alkane oxidation is limited Most of the literature discussing
alkane activation relates to short chain linear alkanes (eg methane to butane) or cyclic
hydrocarbons (eg cyclohexane) in which different catalytic approaches were presented
A bio-catalytic approach has been used for the alkane oxidation It was reported that enzymes
(momo-oxygenase) can oxidize the terminal group of linear alkane with oxygen [12] The
catalytic active centre of the mono-oxygenase (Fe) is surrounded by a large protein structure
which controls the substrate to the oxidation centre
Homogeneous catalysts were also reported in the terminal selective oxidation of alkanes In the
literature in the presence of tetra-n-butylammonium salts of vanadium-containing
polyphosphomolybdates [PMo11VO40]4minus and [PMo6V5O39]
12minus n-Octane can be efficiently
oxidized by hydrogen peroxide in acetonitrile The terminal selectivity was reported to be 82
9
[13]
However due to the scope of this project only heterogeneous catalysts were available to be
coated by shape selective materials Therefore this review is focused on heterogeneous
catalysts Compared with biocatalysis and homogeneous catalysis heterogeneous catalysis is
preferred in industry because it is easier to operate and less expensive There have been some
attractive catalysts reported in the terminal oxidation of alkanes using heterogeneous catalysts
In gas phase studies Mathebula reported a dehydrogenation process to produce the terminal
alcohol using n-hexane as the reactant [14] Following this method VMgO was employed as
the catalyst for the dehydrogenation of n-hexane to the terminal hexene The conversion was
reported to be 5 with a terminal selectivity less than 2 Then hydroxylation of alkene was
applied by a two-step process using sodium perborate followed by oxidation over H2O2NaOH
to obtain the terminal alcohol
In liquid phase studies the key results were reported by Thomas for n-hexane oxidation in
liquid phase [15-21] In his study Thomas used ALPO catalysts with air as the oxidant The
terminal selectivity can be extremely high (up to 87 conversion 655 selectivity with Co-
ALPO-18) Iglesia [22] tried to reproduce Thomasrsquos results under similar experimental
conditions using Mn-ALPO catalysts However the conversion was quite low (002-005)
while the terminal selectivity was 7 only Iglesia concluded that Mn-ALPO did not lead to
any preference for terminal selectivity in contradiction with Thomasrsquo results Iglesia published
his own results using Mn-ZSM5 as the catalyst (Table 11) [23]
Unlike Thomasrsquos study Iglesia noticed the autoxidation reaction and demonstrated a clear
10
difference in the terminal selectivity in the presence of catalysts It was clear that when the
catalyst was present the terminal selectivity was initially high (24) but the selectivity
declined when conversion increased In contrast the terminal selectivity in the autoxidation was
always 7-8
Table 11 Iglesiarsquos results for oxidation of n-hexane with Mn-ZSM-5 catalysts
Time
(hours)
Conversion
()
Terminal selectivity ()
with Mn-ZSM-5
Terminal selectivity ()
Autoxidation
05 0007 24 7
25 0013 185 8
4 0047 15 8
7 01 10 7
18 Zeolites
181 Zeolite composition
Zeolites are microporous crystalline solids with well-defined structures Generally they contain
silicon aluminium and oxygen in their framework Structurally they are complex crystalline
inorganic polymers based on an infinitely extending three-dimensional four-connected
framework of AlO4 and SiO4 tetrahedra linked to each other by the sharing of oxygen ions
(Figure 15) Each AlO4 tetrahedron in the framework bears a net negative charge which is
balanced by an extra-framework cation The framework structure contains channels or
interconnected voids that are occupied by the cations and water molecules The cations are
mobile and ordinarily undergo ion exchange The water may be removed reversibly generally
by the application of heat which leaves intact a crystalline host structure permeated by the
11
micropores and voids which may amount to 50 of the crystals by volume [24]
Figure 15 The microporous molecular structure of a zeolite (ZSM-5)
18 2 Shape selective application of zeolite
Due to the very regular pore structure of molecular dimensions zeolites are well-known as a
shape selective material The maximum size of the molecular or ionic species that can enter the
pores of a zeolite is controlled by the dimensions of the channels which is usually less than 10
Aring
Zeolite shape selectivities can be distinguished into three types depending on whether pore
size limits the entrance of the reacting molecule or the departure of the product molecule or
the formation of certain transition states (Figure 16)
Reactant selectivity occurs when only parts of the reactant molecules are small enough
to diffuse through the catalyst
Product selectivity occurs when some of the products formed within the pores are too
bulky to diffuse out as observed products They are either converted to less bulky
12
molecules (eg by equilibration) or eventually deactivate the catalyst by blocking the
pores
Restricted transition state selectivity occurs when certain reactions are prevented
because the corresponding transition state would require more space than available in
the cavities Neither reactant nor potential product molecules are prevented from
diffusing through the pores Reactions requiring smaller transition states proceed
unhindered
Figure 16 The type of shape selectivities [25]
183 Synthesis of the zeolite membrane
As a well-known shape selective catalyst zeolites can be synthesized as membrane for the
purpose of separation adsorption or for the selective reaction An ideal zeolite membrane
13
combines the general advantages of inorganic membranes (temperature stability solvent
resistance) with perfect shape selectivity A continuous zeolite membrane can principally
discriminate the components of gaseous or liquid mixtures dependent on their molecular size
Several methods for the preparation of the zeolite coatings can be found in the literature
1) Slurry coating or wash-coating in which the zeolite is brought onto the support from a wash-
coat solution containing precursors of binders based on alumina zirconia silica titania or
silica-alumina The coatings are calcined to obtain bonding of the crystallites to the support
surface [26] This method yields crystal layers which have a low continuity and a limited
accessibility since they are partly covered by the macroporous wash-coating
2) Dry gel conversion in which a gel containing the alumino-silicate precursor water and
template is brought onto the support dried and subsequently crystallized by contacting with
steam at 105-150degC [27]
3) In situ coating the most widely used method recently in which the crystals are directly
grown close to or on the support either from a gel or a solution[28-41] In this way coatings
may be grown that have a high continuity and can be optimized for use as either a membrane
or a catalyst
Although typical zeolite coating synthesis can be carried out in a dry gel it is more common
today to synthesize zeolite coatings by a hydrothermal method in dilute aluminosilicate systems
in which the amorphous gel phase is not present The first so called lsquoclear solutionrsquo (or lsquoclear
to eye solutionrsquo) system that produced zeolite NaA was reported at the International Zeolite
Association (IZA) meeting in Tokyo in 1986 [28] The batch composition in it formed the
starting point of the present work in clear solution One of the advantages of the clear solution
14
is it permits the use of in situ observations using light scattering techniques to study the
synthesis[29] especially the nucleation and crystal growth processes occurring within the
solution phase
Another important factor in the zeolite membrane synthesis is the selection of support
Generally support materials should be chosen that are readily available attrition resistant and
chemically stable For the purposes of the reaction the most widely used supports were alumina
and silica More details of the literature review are presented in Chapter 6
19 The model reactions in this research
The basic idea of the project is using shape-selective materials (eg cyclodextrins and zeolites)
to realize the terminal selective oxidation of long chain alkanes In the studies n-hexane and
n-decane were selected as the models to produce the linear alcohols Cyclodextrins were
applied as an organic shape selective material whereas zeolites were used as inorganic shape
selective materials The shape selective catalysts were built by the active supported catalyst
substrate and a continuous shape-selective membrane layer composed of shape-selective
materials (eg cyclodextrin or zeolite covered catalysts) An ideal catalyst system following
the principle of the idea is shown in the Figure 17
Figure 17 The ideal shape-selective catalyst system
15
Therefore the typical reactions were three phase reactions between gaseous (oxygen) liquid
(n-hexane or n-decane) and solid catalysts which are often encountered in the chemical
industry The advantages of liquid phase reactions are the relatively lower reaction
temperatures and higher time-yields than gas phase reaction the disadvantages are the products
must be separated and purified afterwards and the stability of catalysts also needs to be
considered
110 The research branches in the project
1101 Supported catalyst investigations for shape selective catalysts
As shown in the Figure 17 the shape selective catalysts were built by the active supported
catalyst substrate and a continuous shape-selective membrane layer composed by shape-
selective materials (eg cyclodextrins or zeolites covered catalysts) Therefore the first step
of the research is to find the proper active supported catalysts
1102 Teabag technology
Teabag catalysts prepared by teabag technology is an idea that zeolite coatings work as the
teabag to control the diffusion of reactants to the active sites in a specific configuration that
only allows the oxidation of the terminal position Small aggregates of zeolite crystals as a
coating on the surface of a catalyst have improved external mass transfer characteristics and a
high internal accessibility especially in fast liquid phase and gasliquid phase reactions [42]
In the project zeolites with suitable pore size were selected so that only the wanted reactant
and product can pass through the outer coating to an oxidation catalyst underneath The catalyst
selectivity is determined by the molecules it will allow to diffusion through the zeolite coating
16
to the activate catalyst beneath In chapter 6 the synthesis and reaction tests of catalysts with
zeolite A MFI zeolite X coatings are discussed in details
111 References
[1] G Centi F Cavani F Trifiro Selective Oxidation by Heterogeneous Catalysis Kluwer
AcademicPlenum Publishers (2001) 26
[2] ME Dry Journal of Chemistry Technology and Biotechnology 77 (2002) 43
[3] Principles and practice of heterogeneous catalysis JM Thomas WJ Thomas VCH
Publishers (2005)
[4] Industrial catalysis J Hagen Wiley-VCH (2006)
[5] Catalysis concepts and green applications G Rothenberg Wiley-VCH (2008)
[6] C Batiot BK Hodnett Applied Catalysis A General 127 (1996) 179
[7] JA Labinger Journal of Molecular Catalysis A Chemical 220 (2004) 27
[8] DF McMillen KE Lewis GP Smith DM Golden Journal of Physical Chemistry 86
(1982) 709
[9] All about the fatty alcohols Condea (2000)
[10] UR Kreutzer Journal of the American Oil Chemistsrsquo Society 61 (1984) 343
[11] The Fischer-Tropsch archive httpwwwfischer-tropschorg
[12] M Baik M Newcomb RA Friesner SJ Lippard Chemical Reviews 103 (2003) 2385
[13] BR Cook TJ Reinert KS Suslick Journal of the American Chemical Society 108
(1986) 7281
[14] HB Friedrich N Govender MR Mathebula Applied Catalysis A General 297 (2006)
81
[15] JM Thomas R Raja G Sankar RG Bell Nature (1999) 227
17
[16] R Raja JM Thomas Chemical Communications (1998) 1841
[17] R Raja G Sankar JM Thomas Journal of the American Chemistry Society 121 (1999)
119
[18] JM Thomas R Raja G Sankar R G Bell Studies in Surface Science and Catalysis
130 (2000) 887
[19] R Raja G Sankar JM Thomas Angewandte Chemistry 39 (2000) 231
[20] JM Thomas R Raja G Sankar RG Bell Accounts of Chemical Research 34 (2001)
191
[21]R Raja JM Thomas Journal of Molecular Catalysis A 3 (2002) 181
[22] B Modeacuten B Zhan J Dakka J G Santiesteban E Iglesia Journal of Physical Chemistry
111 (2007) 1402
[23] B Zhan B Modeacuten J Dakka JG Santiesteban E Iglesia Journal of Catalysis 245
(2007) 316
[24] N van der Puil FM Dautzenberg H van Bekkum JC Jansen Microporous and
Mesoporous Materials 27 (1999) 95
[25] Web division of fuel chemistry American chemical society
httpwwwchemdexorgchemistry_linkamerican_chemical_society_acs_division_fuel_che
mistry
[26] ER Geus AE Jansen J Schoonman H van Bekkum Studies in Surface Science and
Catalysis Elsevier (1991)
[27] M Matsukata Chemistry Communication (1996)1441
[28] P Wenqin S Ueda and M Koizumi Proceedings of the 7th International Zeolite
Conference(Eds Y Murakami A Lijima and JW Ward) Elsevier (1986)177
[29] L Gora K Streletzky RW Thompson GDJ Phillies Zeolites 18 (1997)119
18
[30] T Cetin M Tatlier A Erdem-Senatalar U Demirler M Urgen Mircoporous and
Mesoporous Materials 47 (2001) 1
[31] O Andac SMT elli M Tatlier A Erdem-Senatalar Microporous and Mesoporous
Materials 88 (2006) 72
[32] Z Zhou J Yang Y Zhang L Chang W Sun J Wang Separation and Purification
Technology 55 (2007) 392
[33] Z Wang J Hedlund J Sterte Microporous and Mesoporous Materials 52 (2002) 191
[34] M Tatlier M Demir B Tokay A Erdem-Senatalar L Kiwi-Minsker Microporous and
Mesoporous Materials 101 (2007) 274
[35] JC Jansen JH Koegler H van Bekkum HPA Calis CM van den Bleek F Kapteijn
JA Moulijn ER Geus N van der Puil Microporous and Mesoporous Materials 21 (1998)
273
[36] H Kalipcilar A Culfaz Microporous and Mesoporous Materials 52 (2002) 39
[37] K Aoki K Kusakabe S Morooka Journal of Membrane Science 141 (1998) 197
[38] Collier Paul John Golunskin Stanislaw Edmund US Patent No0032628 2005
[39] P Collier S Golunski C Malde J Breen R Burch Journal of the American Chemitry
Society 125 (2003) 12414
[40] N Nishiyama K Ichioka D Park Y Egashira K Ueyama L Gora W Zhu F Kapteijn
JA Moulijn Industrial amp Engineering Chemistry Research 43 (2004) 1211
[41] JK Edwards BE Solsona P Landon AF Carley A Herzing CJ Kiely GJ Hutchings
Journal of Catalysis 235 (2005) 69
[42] Introduction to zeolite science and practice Herman van Bekkum New York Elsevier
Science BV (2001)
19
CHAPTER 2
Experimental
Techniques
20
EXPERIMENTAL TECHNIQUES
21 Introduction
This chapter serves to describe (i) the catalyst preparation methods (ii) the basic principles of
the characterization techniques used in this study (iii) the reactors and reaction conditions used
for catalyst testing (iv) the methods to analyse and quantify the products
22 Catalyst preparation
In this project a large number of different types of catalysts were prepared and tested including
supported metal catalysts oxide catalysts and zeolite and zeolitic membrane coated catalysts
The typical preparation methods are given in this chapter The specific preparation methods
are discussed in details in the appropriate chapters
221 Preparation of supported metal catalysts
Various supported metal catalysts were prepared by impregnation methods using different
metals and oxide or carbon supports Depending on the nature of the supports the impregnation
methods were different For powder supports an incipient wetness method was used while for
the oxide sphere supports a vacuum incipient wetness method was used
The most commonly used supports were silica and alumina powder or alumina spheres while
the most commonly used metal was gold Therefore Aualumina powder and Aualumina
sphere preparations are used as examples to introduce the typical preparation processes The
reagents for the preparation are given in Table 21
21
Table 21 Reagents for the preparation of Aualumina powder or Aualumina sphere
catalysts
Reagent Molar mass (gmol-1) Supplier Purity
HAuCl4bull3H2O 39383 Aldrich 9999
γ- alumina powder 10196 Aldrich gt99
α- alumina sphere 10196 Saint Gobian -
To prepare a 5 wt Aualumina powder catalyst by incipient wetness an aqueous solution of
HAuCl4bull3H2O was prepared by dissolving 5 g of HAuCl4bull3H2O in 50 ml distilled water 10ml
of the solution was then simultaneously added to 475 g of γ-Al2O3 powder The paste formed
was dried at 110C overnight and then calcined in static air at 400C for 3 h [1]
To prepare a 5 wt Aualumina sphere catalyst by vacuum incipient wetness an aqueous
solution of HAuCl4bull3H2O was prepared by dissolving 5 g of HAuCl4bull3H2O in 50 ml distilled
water 1 g of alumina spheres were placed into a sealed two neck round bottom flask (Figure
21) The flask was heated to 80degC using an oil bath and evacuated using a vacuum pump for
1 h 1 ml of the HAuCl4bull3H2O solution was added into the flask through a syringe The flask
was shaken until all the solution was absorbed into the spheres The spheres were then dried
at 110degC overnight calcined at 400degC for 3 h
Other supported metal catalysts were synthesized by varying the starting reagents as shown in
Table 22
22
Figure 21 Vacuum incipient wetness experimental set-up
Table 22 Summary of the supported metal catalysts prepared
Catalyst Metal Reagent Support
5 wt PdSiO2 PdCl2 Silica gel
5 wt PdTiO2 PdCl2 Titania
5 wt PtSiO2 PtCl4 Silica gel
5 wt PtTiO2 PtCl4 Titania
25-25 wt Pd-AuSiO2 PdCl2 HAuCl4bull3H2O Silica gel
3 wt RhAl2O3 RhCl3bullxH2O γ-Al2O3
3 wt RuAl2O3 RuCl3bullxH2O γ-Al2O3
5 wt AuSiO2 HAuCl4bull3H2O Silica gel
5 wt AuTiO2 HAuCl4bull3H2O Titania
5 wt AuAl2O3 HAuCl4bull3H2O γ-Al2O3
5 wt AuC60 HAuCl4bull3H2O C60
5 wt Augraphite HAuCl4bull3H2O Graphite
5 wt RhAl2O3 RhCl3bullxH2O α-Al2O3 sphere
5 wt AuAl2O3 RuCl3bullxH2O α-Al2O3 sphere
3 wt Au Al2O3 HAuCl4bull3H2O γ-Al2O3 sphere
23
222 Preparation of zeolite and zeolitic coated catalysts
Different zeolite and zeolitic materials were prepared and tested as catalysts including zeolite
4A silicalite-1 ZSM-5 and zeolite X In addition to using these materials as catalysts they
were also used as coatings for supported metal catalysts
The zeolite coated catalysts were synthesized following the method reported by Collier et al
[2 3] For example to prepare a zeolite 4A coated Aualumina catalyst the following procedure
was used 5 g of AuAl2O3 spheres were added to a 5 wt solution of the polyelectrolyte (2-
propen-1-ammonium NN-dimethyl-N-2-propenyl chloride known as magnafloc lt35)
containing dilute ammonia and stirred at room temperature for 20 min An aqueous sodium
aluminate solution (607 g sodium aluminate (Alfa Aesar) dissolved in 52 g distilled water)
was rapidly added into an aqueous sodium metasilicate solution (1551 g sodium metasilicate
(Alfa Aesar anhydrous) dissolved in 52 g distilled water) to make the zeolite precursor
solution The spheres were subsequently separated and washed with distilled water and then
added to the zeolite precursor solution The mixture containing the spheres was stirred at room
temperature for 2 h and then hydrothermally crystallized at 100degC for 24 h in a 60 ml Teflon
lined stainless steel autoclave The Teflon liner was cleaned before and after each synthesis in
NaOH solution for 24 h under the synthesis conditions Finally the zeolite coated spheres were
separated from the crystallization solution and washed with distilled water dried at 110degC and
then calcined in air at 500degC for 2 h
The silicalite-1 coated catalysts were synthesized with a silicalite-1 precursor solution which
consisted of TEOS (98 Aldrich) tetrapropylammonium hydroxide (TPAOH) (1 M solution
in water Aldrich) ethanol (EtOH Fluka) and distilled water with the molar ratios of 05
24
TPAOH 120 H2O8EtOH 2 SiO2 Approximately 10 g of catalyst sphere was immersed in 15
g of the precursor solution The crystallization was carried out under hydrothermal conditions
at 180degC for 24 h in a 60 ml stainless steel autoclave with Teflon liner The Teflon liner was
cleaned before and after each synthesis in NaOH solution for 24 h under the synthesis
conditions The coating procedure was repeated twice The products were rinsed repeatedly by
distilled water separated by filtration and dried at 90degC overnight then calcined in air at 600degC
for 5 h with a heating rate of 1degCmin [4]
The ZSM-5 coating synthesis method was adapted from the work of Deijger et al [5] in which
they investigated ZSM-5 zeolite coatings on ceramic foam supports with surface areas below
1 m2g The catalysts to be coated were cleaned by boiling in toluene for 1 h and dried overnight
at 110degC before being immersed in the zeolite precursor solution The zeolite precursor solution
was prepared by adding tetrapropylammonium hydroxide (TPAOH Aldrich 1 M solution in
water) sodium aluminate (NaAlO2 Aldrich Al 50-56) to tetraethyl orthosilicate (TEOS
Aldrich 98) in a PTFE beaker The molar ratio of the precursor solution was 1 Al2O3 40
SiO2 10 TPAOH 800 H2O The precursor solution was stirred for 10 h at room temperature
as an aging process before transferring the reaction mixture to an autoclave In all experiments
1 g of catalyst was added to the autoclave The volume of precursor solution was varied (32 ml
or 15 ml) to observe the influence of the amount of precursor Syntheses were carried out under
autogenous conditions at 160degC for 24 h in Teflon-lined 60 ml autoclaves Teflon liners were
cleaned before and after each synthesis in NaOH solution for 24 h under synthesis conditions
The coated samples and the extra synthesized powder for the same batch were washed with
deionised water and dried overnight at 110degC Finally the samples were calcined at 550degC for
12 h using a heating rate of 5degCmin
25
223 Preparation of cyclodextrin modified catalysts
Cyclodextrin (CD) modified catalysts were prepared by an impregnation method Using CD
modified AuSiO2 as an example the detailed steps of the preparation are as follows The BET
surface area of the AuSiO2 was determined Assuming CD molecules cover the catalyst
surface as a monolayer without gaps the required mass of CDs to completely cover the surface
of catalysts was calculated (eg to cover 1 g of AuSiO2 037 g of α-CDs or 035 g of β-CDs
is needed) Five times the calculated amount of CD was then dissolved in 25 ml of deionised
water which was heated to 45C with stirring 5 ml of the CD solution was added to 1 g of
AuSiO2 and the mixture heated to 45C and stirred for 30 min and then put into an oven to dry
overnight at 110oC
Figure 22 Ideal Au SiO2 surface covered by cyclodextrin molecules
23 Catalyst characterization technique
231 X-ray powder diffraction
X-ray diffraction (XRD) is a versatile non-destructive technique that reveals detailed
information about the crystallographic structure of natural and manufactured materials [6]
26
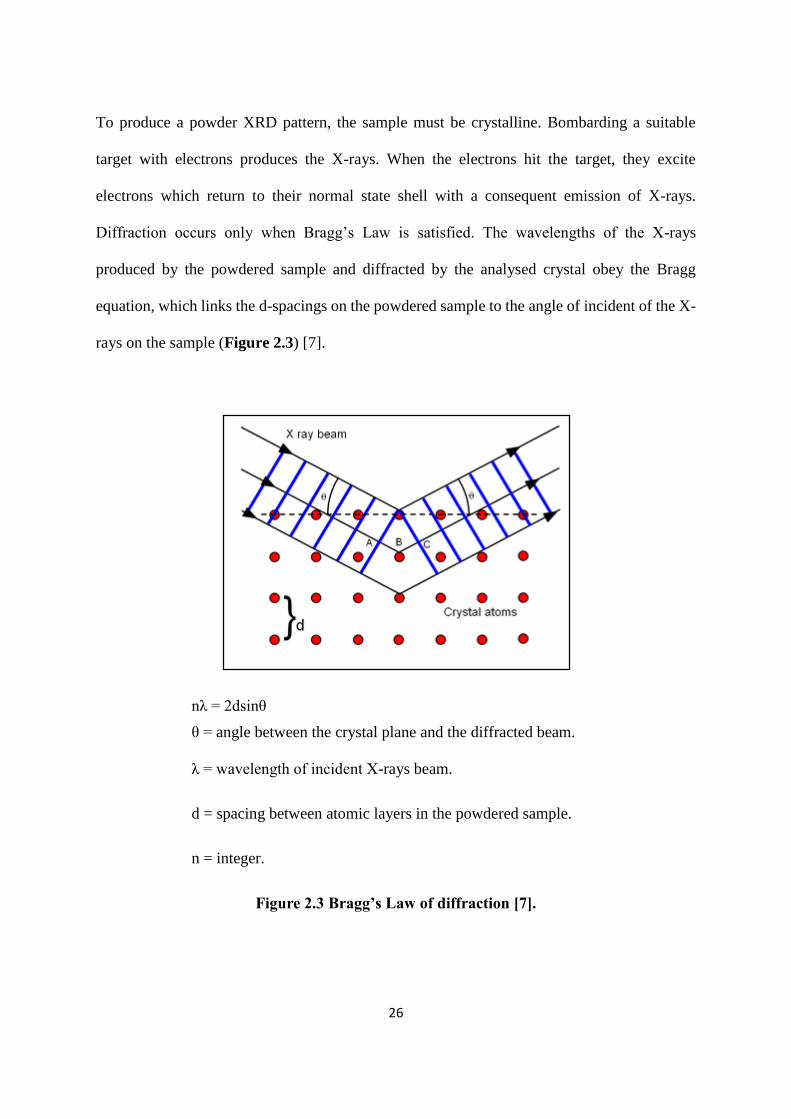
To produce a powder XRD pattern the sample must be crystalline Bombarding a suitable
target with electrons produces the X-rays When the electrons hit the target they excite
electrons which return to their normal state shell with a consequent emission of X-rays
Diffraction occurs only when Braggrsquos Law is satisfied The wavelengths of the X-rays
produced by the powdered sample and diffracted by the analysed crystal obey the Bragg
equation which links the d-spacings on the powdered sample to the angle of incident of the X-
rays on the sample (Figure 23) [7]
nλ = 2dsinθ
θ = angle between the crystal plane and the diffracted beam
λ = wavelength of incident X-rays beam
d = spacing between atomic layers in the powdered sample
n = integer
Figure 23 Braggrsquos Law of diffraction [7]
27
The data obtained shows a series of lines of varying intensities at different 2θ values obtained
as the analyser crystal turns A qualitative analysis of the sample is thus carried out The
schematic of an X-ray diffractometer is shown in Figure 24
Figure 24 Schematic of an X-ray diffractometer [8]
In this project the XRD analysis was performed using a PANalytical Xpert Pro diffraction
system with a monochromatic Cu Kα1 source operated at 40 keV and 30 mA Catalysts
analysed by XRD must be powders therefore the catalysts prepared using preformed supports
were ground into a very fine powder
232 Scanning electron microscopy
The Scanning electron microscope (SEM) is a microscope that uses electrons rather than light
to form an image The SEM has a large depth of field which allows a large amount of the
sample to be in focus at one time The SEM also produces images of high resolution which
means that closely spaced features can be examined at a high magnification Preparation of the
samples is relatively easy since most SEMs only require the sample to be conductive The
28
combination of higher magnification larger depth of focus greater resolution and ease of
sample observation makes the SEM one of the most heavily used instruments in research areas
today [9]When using the SEM a beam of electrons is generated in the electron gun which is
located at the top of the SEM column This beam is attracted through the anode condensed by
a condenser lens and focused as a very fine point on the sample by the objective lens The
electron beam hits the sample producing among others secondary and backscattered electrons
from the sample The electrons are collected by a secondary electron or a backscattered electron
detector converted to a voltage and amplified The scan coils are energized (by varying the
voltage produced by the scan generator) and create a magnetic field which deflects the beam
back and forth in a controlled pattern The varying voltage is also applied to the coils around
the neck of the cathode-ray tube (CRT) which produces a pattern of light deflected back and
forth on the surface of the CRT The pattern of deflection of the electron beam is the same as
the pattern of deflection of the spot of light on the CRT SEM must be run in vacuum This is
because if the sample is in a gas filled environment an electron beam cannot be generated or
maintained because of a high instability in the beam Gases could react with the electron source
causing it to burn out or cause electrons in the beam to ionize which produces random
discharges and leads to instability in the beam Figure 25 shows the schematic of an SEM
instrument
In this project the SEM images were taken by a Zeiss Evo-40 series scanning electron
microscope The method was widely used in the characterization of zeolite coated catalysts
The coated sphere samples were placed in the sample holder directly in the characterization
29
Figure 25 Schematic of a Scanning electron microscope [10]
233 Surface area method (BET)
Surface area is one of the key tools to characterize porous materials The BET method is the
most frequently used method to calculate the surface area It provides precise specific surface
area evaluation of materials by nitrogen multilayer adsorption measured as a function of
relative pressure using a fully automated analyser The technique encompasses external area
and pore area evaluations to determine the total specific surface area in m2g yielding important
information in studying the effects of surface porosity and particle size The concept of BET
30
theory is based on the extension of the Langmuir theory which is a theory for monolayer
molecular adsorption to multilayer adsorption with the following hypotheses (a) gas
molecules physically adsorb on a solid in layers infinitely (b) there is no interaction between
each adsorption layer and (c) the Langmuir theory can be used for each layer Therefore the
BET equation is expressed in Equation 21
1 ʋ [(P0P) - 1] = (c-1)(ʋmc) ( P P0) + 1 (ʋmc)
where P= equilibrium pressure
P0= saturation pressure of the gas
ʋ= adsorbed gas quantify
ʋm= monolayer adsorbed gas quantity
c=constant
Equation 21 The BET equation
In this project samples were analysed using the Quantachrome Autosorb-1 instrument Before
performing the analysis samples were degassed by placing a 01 g sample in a glass tube (d =
12 mm) and heating under helium for an hour at 120˚C The sample filled glass tube is then
placed into a Dewar flask containing liquid nitrogen and analysed by the machine
234 Atomic absorption spectroscopy
Atomic absorption spectroscopy (AAS) is a technique for determining the concentration of a
particular metal element in a sample The technique can be used to analyse the concentration
of over 70 different metals in a solution The technique makes use of absorption spectrometry
31
to assess the concentration of an analyte in a sample Therefore it relies heavily on the Beer-
Lambert law
In short the electrons of the atoms in the atomizer can be promoted to higher orbitals for a
short amount of time by absorbing a set quantity of energy (ie light of a given wavelength)
This amount of energy (or wavelength) is specific to a particular electron transition in a
particular element and in general each wavelength corresponds to only one element This
gives the technique its elemental selectivity
As the quantity of energy (the power) put into the flame is known and the quantity remaining
at the other side (at the detector) can be measured it is possible from the Beer-Lambert law
to calculate how many of these transitions took place and thus get a signal that is proportional
to the concentration of the element being measured A diagram of AAS is given in Figure 26
Figure 26 Diagram of AAS [11]
32
235 X-ray Photoelectron Spectroscopy
X-ray Photoelectron Spectroscopy (XPS) is a quantitative spectroscopic technique that
measures the elemental composition empirical formula chemical state and electronic state of
the elements that exist within a material XPS spectra are obtained by irradiating a material
with a beam of X-rays while simultaneously measuring the kinetic energy and number of
electrons that escape from the top 5 to 20 nm of the material being analysed Because the energy
of an X-ray with particular wavelength is known the electron binding energy of each emitted
electron can be determined by using an equation that is based on the work of Ernest Rutherford
(Equation 22)
Eb= Ep- (Ek + ɸ)
Where Eb = binding energy of the electron
Ek = kinetic energy of the electron measured
Ep = the energy of the X-ray photons being used
Φ = work function of the spectrometer (often ignored)
Equation 22 XPS equation
XPS analysis in this project was carried out with an ESCALAB 220 spectrometer using an
achromatic AlKα source and analyser pass energy of 100 eV
24 Reactors used in the project
Two types of reactors have been used in the project the Parr multiple stainless steel reactor
system and the Andrews glass reactor system
33
241 The Parr multiple stainless steel reactor system
The Parr series 5000 multiple reactor system (Figure 27) has been used for the liquid phase
oxidation of n-decane and n-hexane with oxygen It is a system with six stainless steel vessels
which can perform six reactions at different pressures and temperatures simultaneously The
volume of each vessel is 45 ml Stirring with this system was operated by a single magnetic
stirrer therefore all six vessels have the same stirring speed during a single run In the
experiments PTFE stirring seeds were the most frequently used while glass stirring seeds were
also applied in some reactions The autoclaves can be operated up to 3000 psi and 275degC [12]
The typical reactions performed with this system were always with 005 g of catalyst 10 g n-
decane or n-hexane a stirring speed of 600 rpm 15 bar O2 at different temperatures and
reaction times Before reactions the autoclave was flushed twice with O2 to remove all the air
Then the reactors were heated to the desired temperature (100C 110C 120C or 130C) for
different runtimes There was no sample tube with this reactor therefore in order to exactly
control the reaction time ice water was used to cool down the autoclave at the end of the
reaction
242 The Andrews glass reactor system
The Andrews glass reactor system (Figure 28) has been used mainly for the liquid phase
oxidation of n-hexane with oxygen The three glass reactors (887ml starter kit Andrews
Glass) were heated in separate oil baths by three separate hotplates Oxygen pressure was
controlled in each reactor It was observed there were small temperature variations for the
different reactors because of their separate heating controllers Reactors A and B were found
34
to have quicker heating rates than reactor C It always took reactor C several minutes more to
reach the temperature set point
Figure 27 Multi reactor system and control box
Figure 28 Andrews Glass Reactor System
35
The volume of each glass vessel is 120 ml Stirring with this system was always controlled to
the same stirring speed and PTFE stirring seeds and glass stirring seeds were both employed
The reactors can be operated up to 225 psi [13]
The typical reactions performed with this system were always with 005 g catalyst 25 ml n-
hexane a stirring speed of 600 rpm 3 bar O2 at different temperatures and reaction times
Before reaction the vessel was flushed twice with O2 to remove all the air Then the reactors
were heated to the desired temperature (110C 120C 130C 150C) for different runtimes
A PTFE sample tube was used and in most cases the samples were taken directly from this In
some specific cases ice water was used to cool down the reactor at the end of the reaction
25 Analysis and qualification of reaction products
251 Analysis by Gas Chromatography
The first step of reaction product analysis was through gas chromatography (GC)GC is a
common type of chromatography for separating and analysing compounds that can be
vaporized without decomposition which was suitable in this project After the oxidation of the
long chain alkane there was a mixture of various products These can be separated in the GC
as they have different boiling points The higher the boiling point of the compound the later
the retention time of the compound
Analysis were carried out using a Varian Star 3800 equipped with a Chrompack CP Wax 52CB
25 m 053 mm 20 μm capillary column and an FID detector In the analysis 02 microl sample
was injected into the GC Helium was the carrier gas employed in the system Injection
parameters on the GC used a split ratio of 101
36
To achieve the best separation the temperature programs in the GC were as follows
(i) For n-decane products
Start at 60degC hold for 7 min
Ramp at 35degCmin to 115degC hold for 12 min
Ramp at 4degCmin to 220degC hold for 1 min
Ramp at 50degCmin to 240degC hold for 2 min
(ii) For n-hexane oxidation products
Start at 35degC hold for 7 min
Ramp at 35degCmin to 220degC hold for 3 min
252 Quantification of the products via response factor
2521 Use of internal standard
To quantify the products an internal standard was added to the reaction products The internal
standard used was 124-trichlorobenzene in both n-decane and n-hexane oxidation reactions
The advantage of this standard is that it did not interfere with the reaction and it is eluted from
the column at a different retention time from the other compounds of interest (Figure 23 and
24) 015 ml of 124-trichlorobenzene was added to the reaction products mixture
2522 Calculations of relative response factors of each compound
The relative response factor (K) of each product was determined using the ratio of the areas
under the peak of a known amount of product and a constant amount of the internal standard
(124-trichlorobenzene)
37
The anticipated compounds in the product mixture (eg 2-5 decanone 1-5 decanol etc) were
used to prepare five mixtures containing known amounts of products as well as the internal
standard For example to calibrate n-decane oxidation products the first to fifth calibrated
solution should contain 10 g n-decane 1030507090 mg of each anticipated compound and
015 ml internal standard The five mixtures were injected into the GC and the area of the peaks
of the internal standard and the anticipated compounds measured The mass of the compounds
were known therefore the internal response factor can be calculated using Equation 23 The
final internal response factor was the average value from the five solutions
K = [(AreaIS) (MassAC)] [(MassIS areaAC)]
Where K = Relative Response Factor
AreaIS = Area of Internal Standard in GC
MassAC = Mass of specific anticipated compound
MassIS = Mass of internal standard
AreaAC = Area of specific anticipated compound
Equation 23 Calculation of internal standard
All the relative response factors of the known products of n-dexane and n-hecane oxidation
were calculated in this way The retention time and response factor of each reaction product
are given in Table 23 and 24
38
Table 23 Order retention time and internal response factor of each product for n-
decane reaction
Order on the
GC trace
Compounds Retention Time
(min)
Internal
Response Factor
1 n-decane 344 0498
2 54-decanone (54 one) 1181 062
3 3-decanone (3 one) 1254 059
4 2-decanone (2 one) 1345 0588
5 54-decanol (54 ol) 1626 0606
6 3-decanol (3 ol) 1694 0598
7 2-decanol (2 ol) 1802 062
8 internal standard 2044 NA
9 pentanoic acid (C5OOH) 2525 1
10 1-decanol (1 ol) 2565 0616
11 hexanoic acid (C6OOH) 2930 0904
12 heptanoic acid (C7OOH) 3269 0822
13 octanoic acid (C8OOH) 3566 0806
14 nonanoic acid (C9OOH) 3838 08
15 decanoic acid (C10OOH) 4085 0788
39
Table 24 Order retention time and internal response factor of each product for n-
hexane reaction
(The hexanal can not be separated as it has the same retention time as 2-hexanol )
2523 Quantification and analysis of the reaction
According to Table 23 and 24 all the response factors for the known compounds were
determined Hence the amount of each known compounds in the product mixture can be
calculated using Equation 24
Order on the
GC trace
Compounds Retention Time
(min)
Internal
Response Factor
1 n-hexane 0858 0894
2 3-hexanone (3 one) 875 0762
3 2-hexanone (2 one) 1012 069
4 hexanal 1012 NA
5 3-hexanol (3 ol) 1692 0684
6 2-hexanol (2 ol) 191 066
7 internal standard 23325 NA
8 1-hexanol (1 ol) 2806 0685
9 hexanoic acid (C6OOH) 4066 09125
40
MassAC = (MassIS AreaAC K) (AreaIS)
Where K = Relative Response Factor
AreaIS = Area of Internal Standard in GC
MassAC = Mass of specific anticipated compound
MassIS = Mass of internal standard
AreaAC = Area of specific anticipated compound
Equation 24 Calculation of amount of products
Then the yield conversion and selectivity of the reaction can be calculated following the
formula below
Yield of each product () =
___________K x (Area of Product AreaIS) x MassIS x100
(Mass of n-decane (10g) Molar mass of decane x Molar mass of product)
Conversion () = Sum Yield of each product = Total Yield
Product Selectivity () = Yield of each product Total Yield
Further experimental and characterisation details are discussed in the corresponding results
chapters
41
26 References
[1] JK Edwards BE Solsona P Landon AF Carley A Herzing CJ Kiely GJ Hutchings
Journal of Catalysis 236 (2005) 69
[2] P Collier S Golunski C Malde J Breen R Burch Journal of the American Chemistry
Society 125 (2003) 12414
[3] Collier Paul John Golunskin Stanislaw Edmund US Patent No0032628 2005
[4] DCVu MMiyamoto NNishiyama SIchikawa YEgashira KUeyama Microporous
and Mesporosous Materials 115 (2008) 106
[5] GBF Seijger OL Oudshoorn WEJ van Kooten JC Jansen H van Bekkum CM
van den Bleek HPA Calis Micropurous and Mesoporous Materials 39 (2000) 195
[6] PANalytical httpwwwpanalyticalcomindexcfmpid=135
[7] httpwwwesercstonybrookeduProjectJavaBragg
[8] Providing Solutions To Your Diffraction Needs Cupertino Scitag inc (1999)
[9] httpmseiastateedumicroscopyhomehtml
[10]httpwwwifw-dresdendeinstitutesikmorganisationdep-31equipmentaes-
microprobe-phi660
[11] httpwwwuniversetodaycom81974atomic-absorption-spectroscopy
[12] httpwwwparrinstcom
[13] Andrews glass website httpwwwandrewsglasscomPRV_supporttpl
42
CHAPTER 3
Andrews Glass
Reactor
43
ANDREWS GLASS REACTOR
31 Introduction
In liquid phase long chain alkane selective oxidation studies the key results were reported by
Thomas for n-hexane oxidation [1-7] In his study Thomas used ALPO catalysts with air as
the oxidant The terminal selectivity can be extremely high (up to 87 conversion 655
selectivity with Co-ALPO-18) Iglesia [8] tried to reproduce Thomasrsquos results under similar
experimental conditions using Mn-ALPO catalysts However the conversion was quite low
(002-005) while the terminal selectivity was 7 only Iglesia concluded that Mn-ALPO
did not lead to any preference for terminal selectivity in contradiction with Thomasrsquo results
Iglesia published his own results using Mn-ZSM5 as the catalyst (Table 31) [9] Unlike
Thomasrsquos study Iglesia noticed the autoxidation reaction and demonstrated a clear difference
in the terminal selectivity in the presence of catalysts It was clear that when the catalyst was
present the terminal selectivity was initially high (24) but the selectivity declined when
conversion increased In contrast the terminal selectivity in the autoxidation was always 7-8
In this project it was attempted to obtain the high level of terminal selectivity as Iglesia did
Most of the reactions performed in this project were carried out in the Parr stainless steel reactor
with or without a PTFE liner However it was noticed that Iglesia et al employed the Andrews
glass reactor in their research Hence the focus of this chapter was the comparison between the
stainless steel reactor and the Andrews glass reactor Studies using the Andrews glass reactor
were also performed
44
Table 31 Iglesiarsquos results for oxidation of n-hexane with Mn-ZSM-5 catalysts
Time
(hours)
Conversion
()
Terminal selectivity ()
with Mn-ZSM-5
Terminal selectivity ()
Autoxidation
05 0007 24 7
25 0013 185 8
4 0047 15 8
7 01 10 7
32 Experimental
321 Apparatus and reaction
The Andrews glass reactors system was set up as shown below in Figure 31 The three glass
reactors (887 ml starter kit Andrews Glass) were heated in separate oil baths by three separate
hotplates Oxygen pressure was controlled in each reactor Temperature variations were
observed for the different reactors because of their separate heating controllers Reactors A and
B were found to have quicker heating rates than reactor C It always took reactor C several
minutes more to reach the temperature set point Hexane oxidation reactions were performed
under conditions equivalent to Iglesiarsquos work [8] 25 ml hexane 3 bar oxygen 130degC for short
time reactions
45
Figure 31 Andrews Glass Reactor System
322 Safety operating procedure
To avoid dangers of operation the safety operating procedure for the reactor is given as follows
To switch instruments on
Put beakers with silicon oil on top of the hotplates Hold the wire-mesh covered glass reactors
with clamps and immerse two-thirds of the glass reactor into the silicon oil baths Switch on
the power to the hotplates Temperature and stirrer speed are controlled by and displayed on
the hotplates Pressure is displayed on a gauge on the head of the reactor and can be controlled
by inlet and outlet valves also on the reactor head The glass reactors should be handled gently
Preparing a sample in the Andrews glass reactor
Place reactants in the glass cylinder Reactants should occupy no more than two-thirds of the
available space of the cylinder The cylinder is then aligned with the head and joined The
46
rubber ring in the head of the reactor should be well fitted into the top of the glass cylinder
Hold the head and the glass cylinder securely together and then tighten the head to the glass
cylinder carefully
Controlling the stirrer speed and temperature of the reactor
The stirrer speed and temperature can be set on the hotplate The temperature detector must be
immersed into the oil bath the depth of the detector head should be kept in the same level in
the glass cylinder
Allowing gas flow into the reactor
The Andrews glass reactor set-up has inlet and outlet valves (on the head part) The inlet valve
is connected to oxygen and is opened briefly to fill the reactor to the desired pressure The
outlet valve is kept closed during a reaction but remains open at all other times Both the inlet
and outlet valves turn clockwise to close Pressure in the cylinder is maintained when the outlet
and inlet valves are closed The pressure in the gas line is limited by a regular therefore
normally the pressure in the glass line is not higher than 5 bar However to avoid any accidents
when releasing the gas into or out of the cylinder open the inlet or outlet valves is slowly
Controlling the gas flow
Open the oxygen valve on the wall The pressure inside the glass reactor is controlled by turning
the glass inlet and outlet valves in the reactor head To increase the pressure turn the inlet valve
anti-clockwise To decrease the pressure turn the outlet valve anti-clockwise The gauge in the
reactor head will show the pressure inside the reactor
47
Purging the glass reactor
Before staring any reaction it is necessary to evacuate the air present in the reactor and fill the
reactor to the desired pressure with oxygen Open the oxygen valve on wall behind the reactors
This will allow the gas to enter the glass reactor when the inlet on the reactor head is opened
Fill the reactor to the desired pressure by repeatedly briefly opening and closing in the inlet
line Then close the inlet valve and open the outlet valve on the head slowly to release the
pressure This is repeated three times after which the reactor is pressurised and the inlet and
outlet valves are closed Close the gauge on the wall behind the reactors Monitor the pressure
in the reactor for approximately 5 minutes to ensure there are no leaks
Starting a reaction
After placing the sealed glass reactors and oil baths on the hotplate put the temperature detector
to the right position (as mentioned above) Purge the reactor and pressurise to the desired
working pressure Switch on the stirrer and set the desired temperature in the digital display
connected to the hotplates
Ending a reaction
If the reaction is to be stopped for a required time switch off the hotplate then put the reactor
into ice bath for quick cooling Once cool the gas is evacuated from the reactor by slowly
opening the outlet valve on the reactor head The cylinder can then be disconnected and the
reaction mixture emptied Always allow the reactor to cool before opening it
Cleaning the autoclave
After each reaction the reactor should be thoroughly washed and cleaned to remove all traces
of the reactants As well as cleaning the glass cylinders it is also necessary to clean the stirrer
bar
48
Instrument shutdown
Specified users will normally carry out instrument shutdown
Ensure that the hotplate especially the heating is switched off when the reaction is finish The
oxygen line to the equipment must also be closed when not used for filling the reactors and the
instrument lines vented
Emergency shutdown procedure
1 Switch off electricity at the sockets
2 O2 gas supply should be shut off at the cylinder
3 If it is safe to do so (ie no visible sign of leakage from the apparatus) remove the glass
reactor(s) from the hotplate(s) (if applicable)
4 Do not allow anyone to touch the equipment or any contents of the reactor unless the person
is a trained and competent user
323 Characterization techniques
Reaction samples were analysed by gas chromatography with a CP Wax 52CB column 25 m
053 mm 20 microns using a programmed temperature ramp Each sample was injected at
least twice
33 Results
331 Andrews glass reactor in blank hexane oxidation
Hexane oxidation was carried out under the same conditions 3 bar oxygen 130degC with various
amounts of hexane 10g (the amount consistent with using the Parr stainless steel reactor) and
25ml (Iglesiarsquos reported system) for 30 min and 1 hour
49
3311 Comparison between Andrews glass reactor and stainless steel reactor
Reactions were carried out over 30 min and 1h with 10 g hexane and repeated several times at
a stir speed 3 in the hotplate The oxidation results were given in Table 32 and Table 33
Table 32 Glass reactor 130degC 3 bar O2 10 g n-hexane stir speed 3 30 min
Reactor Conv () Selectivity ()
3 one 2 one 3 ol 2 ol 1 ol oic
A 00017 29 35 9 11 15 0
B 00010 33 36 9 13 7 0
Table 33 Glass reactor 130degC 3 bar O2 10 g n-hexane stir speed 3 1 h
Reactor Conv () Selectivity ()
3 one 2 one 3 ol 2 ol 1 ol oic
A 00060 34 34 7 12 11 0
B 00050 35 36 8 11 7 0
For the longer reaction time the 1-hexanol selectivity may have decreased slightly Compared
with the stainless steel reactor results reported previously (Table 34) the conversion in the
glass reactor is lower
Table 34 Steel reactor 130degC 5 bar O2 10g n-hexane blank 600 rpm 30 min
Reactor Conv () Selectivity ()
3 one 2 one 3 ol 2 ol 1 ol oic
Stainless steel
30min 00051 20 34 13 15 18
0
50
A Further time on-line study was performed to compare the two reactors The results were
shown in Table 35 and Table 36 From the results the blank reactions gave higher conversion
but lower terminal selectivity in the stainless steel reactor than the glass reactor which indicates
the stainless steel reactor itself may have some activity in the oxidation reaction
Table 35 Hexane auto-oxidation with glass reactor (reaction conditions 130degC 3 bar
O2 25 ml n-hexane 600 rpm time-on-line)
Time
(h)
Reactor Conv() Selectivity ()
Ketones Alcohols Acid Others 1-hexanol
05 A 00001 15 0 0 85 0
1 A 00002 16 13 1 70 5
2 A 00008 14 10 0 76 5
3 A 00118 13 11 0 76 6
4 A 00223 14 11 0 75 6
Table 36 Hexane auto-oxidation with stainless steel reactor (reaction conditions 130degC
3 bar O2 25 ml n-hexane 600 rpm time-on-line)
Time
(h)
Conv
()
Selectivity ()
Ketones Alcohols Hexanoic acid Others 1-Hexanol
0 0
1 0001 72 15 0 12 0
2 0002 65 24 0 8 2
3 0008 56 24 0 20 3
4 0022 63 18 0 19 1
51
3312 Repeat Iglesiarsquos blank reaction
A few reactions were performed under conditions equivalent to Iglesiarsquos work at 130ordmC 3 bar
O2 stir speed 2 for 30 min and 1 hour however no products were detected The GC sensitivity
may also be a reason for products not being detected It should be noted that the stir speed taken
in these reactions was lower than before the change is made because it was found when
catalysts were added to the reactor at a high stir speed the stirrer bar became trapped
3313 The unknown products in analysis
In a further analysis of GC traces it was found that there were large quantities of unknown
products in the hexane oxidation (as shown in Figure 32) which were not included in the
calculated results In order to have a clear product distribution the results were calculated
including these unknown products discussed in the following section in this chapter
Figure 32 The GC trace with the unknown products (marked with )
52
GC-MS analysis was then introduced to identify the known and unknown products With a
polar column in GC-MS all the known products in hexane oxidation have been successfully
identified and a few the unknown products have been successfully analysed Table 37 showed
the possible main unknown products They are all named as lsquoothersrsquo in the following result
tables
Table 37 List of suggested unknown products
Possible main unknown Products Retention time in GC-MS
2-pentanol 2-methyl- C6H14O 368
3-pentanol 3-methyl- C6H14O 384
4-methyl-2-pentacetate C8H16O 451
Propanoic acid 703
Nonanoic acid 1843
C6H12O4 2005
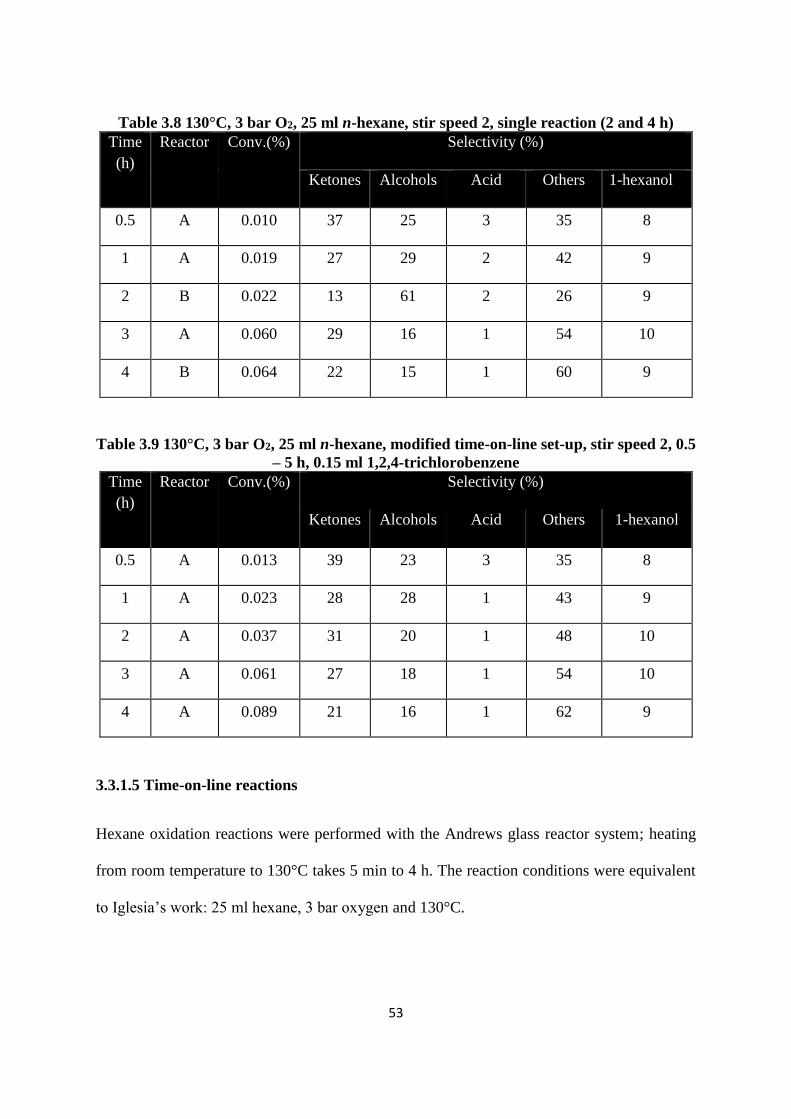
3314 Application of aqua regia as washing agent
In the previous reactions aqua regia was not always used as a washing agent To check if this
can influence the reaction results reactions were carried out immediately after washing the
reactors carefully with aqua regia (Table 38) Compared with the Table 39 (without washing
with aqua regia) the selectivity did not show much difference from the previous reactions
which were not washed with aqua regia
53
Table 38 130degC 3 bar O2 25 ml n-hexane stir speed 2 single reaction (2 and 4 h)
Time
(h)
Reactor Conv() Selectivity ()
Ketones Alcohols Acid Others 1-hexanol
05 A 0010 37 25 3 35 8
1 A 0019 27 29 2 42 9
2 B 0022 13 61 2 26 9
3 A 0060 29 16 1 54 10
4 B 0064 22 15 1 60 9
Table 39 130degC 3 bar O2 25 ml n-hexane modified time-on-line set-up stir speed 2 05
ndash 5 h 015 ml 124-trichlorobenzene
Time
(h)
Reactor Conv() Selectivity ()
Ketones Alcohols Acid Others 1-hexanol
05 A 0013 39 23 3 35 8
1 A 0023 28 28 1 43 9
2 A 0037 31 20 1 48 10
3 A 0061 27 18 1 54 10
4 A 0089 21 16 1 62 9
3315 Time-on-line reactions
Hexane oxidation reactions were performed with the Andrews glass reactor system heating
from room temperature to 130degC takes 5 min to 4 h The reaction conditions were equivalent
to Iglesiarsquos work 25 ml hexane 3 bar oxygen and 130degC
54
Reactions with time-on-line modification
In order to investigate the time-on-line oxidation status during a reaction a modification was
made to one of the glass reactors The modification consists of PTFE tubing being inserted into
the reaction solution through the reactor top The flow in the tubing can be controlled by two
PTFE valves outside the reactor Therefore samples can be taken while a reaction is running
The internal standard (124-trichlorobenzene Sigma-Aldrich ge99 015 ml) was added to
the solution before reaction In this section the reactions were all carried out in modified
reactors with a time-on-line sampling port Hexane oxidation reactions were still performed
under conditions equivalent to Iglesiarsquos work 25 ml hexane 3 bar oxygen and 130degC with
varied time period Reactions were repeated two times The terminal selectivity (hexanoic acid
+ 1-hexanol) is around 5-9 (Table 310 and Table 311)
Table 310 130degC 3 bar O2 25 ml n-hexane modified time-on-line set-up stir speed 2
05 ndash 5 h 015 ml 124-trichlorobenzene
Time
(h)
Reactor Conv() Selectivity ()
Ketones Alcohols Acid Others 1-hexanol
05 A 0003 44 21 2 33 7
1 A 0018 16 13 1 70 5
2 A 0057 14 10 0 76 5
3 A 0094 13 11 0 76 6
4 A 0163 14 11 0 75 6
5 A 0247 11 11 0 78 6
55
Table 311 130degC 3 bar O2 25 ml n-hexane stir speed 2 various times 015 ml 124-
trichlorobenzene repeated
Time (h) Reactor Conv() Selectivity ()
Ketones Alcohols Acid Others 1-hexanol
05 A 0005 30 14 0 56 5
1 A 0019 15 9 1 75 5
2 A 0059 13 9 0 78 5
3 A 0101 12 10 0 78 6
4 A 0160 14 11 0 75 6
5 A 0259 10 10 0 80 6
3316 Discussion
Figure 34 showed the conversion vs selectivity in all the blank reactions in this project They
showed similar terminal selectivities to Iglesiarsquos work (Figure 35) [8-9]
Blank reactions Conv vs termianl selectivity
0
1
2
3
4
5
6
7
8
9
10
0 005 01 015 02 025 03
Conversion ()
Term
inal
Sele
cti
vit
iy (
)
56
Figure 34 Conversion vs terminal selectivity in all the blank reactions
Figure 35 Iglesiarsquos results [8-9]
332 Reaction with Mn-ZSM5 (from JM)
The Mn-ZSM5 catalyst as described in Iglesiarsquos work was provided by Johnson Matthey to
investigate the activity and selectivity under the equivalent conditions However it was found
that both the conversion and terminal selectivity was extremely low (Table 312)
The Mn-ZSM5 catalyst was activated before each reaction and then used in the reaction after
cooling down to the room temperature Therefore it is possible that the sample absorbed
moisture which could block the pore structure Hence a time-on-line test reaction was
performed to check this In the reaction shown below the Mn-ZSM5 was put into the hexane
as soon as possible after being removed from the furnace From the results (Table 313) the
hot catalyst is still not very active and shows little difference in product distribution from the
cool catalyst The results are still different from Iglesiarsquos
57
Table 312 130degC 3 bar O2 25 ml n-hexane stir speed 2 varied time 100 g Mn-ZSM5
015 ml 124-trichlorobenzene
Time (h) Reactor Conv() Selectivity ()
Ketones Alcohols Acid Others 1-hexanol
05 A 0007 15 1 0 84 0
1 A 0010 10 0 0 90 0
2 A 0015 12 1 0 87 0
3 A 0018 16 2 0 82 0
4 A 0021 18 2 0 80 0
5 A 00294 17 2 0 81 0
Table 313 130degC 3 bar O2 25 ml n-hexane stir speed 2 time-on-line 1 g Mn-ZSM5
Time (h) Reactor Conv() Selectivity ()
Ketones Alcohols Acid Others 1-hexanol
30min A 0
1h A 0
4h A 002 29 12 0 59 2
34 Conclusion
Comparison between the Andrews glass reactor and Parr stainless steel reactor showed that the
blank reactions got higher conversion but lower terminal selectivity in the stainless steel reactor
than the glass reactor which indicates the stainless steel reactor itself may have some activity
in the oxidation reaction
58
The time on-line blank reaction results showed similar terminal selectivities to Iglesiarsquos work
in autoxidation [8-9] with the terminal selectivity 5-9 However the terminal selectivity
with Mn-ZSM5 was still very low (~0) Iglesiarsquos results cannot be reproduced
Except the linear alcohol and acids calibrated and listed in the experimental section in Chapter
2 further analysis found a few unknown products after the oxidation reaction GC-MS analysis
was performed and some of the unknown products were identified as the acids and other C6
alcohols
35 References
[1] JM Thomas R Raja G Sankar RG Bell Nature (1999) 227
[2] R Raja JM Thomas Chemical Communications (1998) 1841
[3] R Raja G Sankar JM Thomas Journal of the American Chemistry Society 121
(1999) 119
[4] JM Thomas R Raja G Sankar R G Bell Studies in Surface Science and Catalysis
130 (2000) 887
[5] R Raja G Sankar JM Thomas Angewandte Chemistry 39 (2000) 231
[6] JM Thomas R Raja G Sankar RG Bell Accounts of Chemical Research 34 (2001)
191
[7]R Raja JM Thomas Journal of Molecular Catalysis A 3 (2002) 181
59
[8] B Modeacuten B Zhan J Dakka J G Santiesteban E Iglesia Journal of Physical
Chemistry 111 (2007) 1402
[9] B Zhan B Modeacuten J Dakka JG Santiesteban E Iglesia Journal of Catalysis 245
(2007) 316
60
CHAPTER 4
Catalytic
Investigation for
Teabag Coating
61
CATALYTIC INVESTIGATION
FOR TEABAG COATING
41 Introduction
The aim of the project is to realise the terminal oxidation of long chain n-alkanes for example
using n-decane and n-hexane as model compounds to produce 1-decanol decanoic acid or 1-
hexanol and hexanoic acid (Figure 41) in liquid phase reactions There are two challenges in
this study how to enhance the activity of the reaction and how to control the regioselectivity
of the oxidation To overcome the challenges various catalysts were introduced into the project
Figure 42 Aim of the thesis ndash terminal oxidation of decane
As introduced in Chapter 1 teabag technology involves two components the active supported
catalyst substrate and the shape selective coating In this chapter the focus is to find the
relatively active and selective substrate catalysts
62
42 Experimental
421 Metalsupport catalysts
A series of metalsupport catalysts were prepared in the project by the impregnation method
In the case Pd Au and Pt were employed The synthesis method is shown as below [1]
Preparation method for the 5 wt PdTiO2
i Dissolve 05 g PdCl2 in 10 ml deionized water Stir and heat at 85degC for 30 min
ii Place 19 g TiO2 in a Petri dish Dropwise add the PdCl2 solution to the Petri dish Shake
the dish until the powder and solution mix well
iii Dry the paste at 110degC for 16 h Grind the paste and then calcine at 400degC for 3 h
Preparation method for the 5 wt AuTiO2
i Prepare the HAuCl4 solution which includes 01 g Au3+
ii Place 19 g TiO2 in a beaker Dropwise add the HAuCl4 solution to the beaker Stir 30
min until the powder and solution mix well
iii Dry the paste at 110degC for 16 h Grind the paste and then calcine at 400degC for 3 h
Preparation method for the 5 wt PtTiO2
i Use 02655g H2PtCl6middot6H2O and 10g deionized water to prepare the solution which
includes 01g Pt4+
ii Place 19g TiO2 in a beaker Dropwise add the H2PtCl6 solution to the beaker Stir until
the powder and solution mix well
iii Dry the paste at 110degC overnight Grind the paste and then calcine at 500degC for 6h
Parts of the prepared catalysts were reduced in H2 To prepare the reduced catalysts the
63
catalysts were calcined in flowing H2 at 300degC for 3 h
Other supports were also employed such as activated carbon (Aldrich G60 Waterlink
Sutcliffe Carbons Activated Carbon Grade 207A Mesh 12 20) graphite SiO2
(Grace gt99 60-100 mesh) and alumina
The reaction conditions taken for the powder form catalysts usually are 200 psi O2 600 rpm
100degC110degC 10 g n-decane and 005 g catalyst
422 RhRu loaded catalysts
Synthesis of catalyst
1 wt and 3 wt Rhα-Al2O3 Rhγ-Al2O3 Ruγ-Al2O3 were prepared by the incipient
wetness method and deposition precipitation (DP) method separately The incipient wetness
method was carried out as before Taking the 1 wt Rhγ-Al2O3 as an example to prepare 1g
1 wt Rhγ-Al2O3 099 g γ-Al2O3 was dispersed in a solution of 0025 g RhCl3middotxH2O ( Alfa
Aesar) The water amount in the solution was the least amount to form a paste The paste was
dried overnight at 110degC and then calcined at 400degC for 3 h The DP preparation is carried out
as followed (taking the 3 wtRhγ-Al2O3 as an example) to prepare 1 g 3 wt Rhγ-Al2O3
099 g γ-Al2O3 was first dispersed in an aqueous solution of 0075 g RhCl3middotxH2O A quantity
of 1 M Na2CO3 was slowly added to the RuCl3 solution until the pH value of the mixture
reached 105 The suspension was then maintained at the same pH for 1 h during the
precipitation process The resulting solid was washed with deionized water several times until
no chloride ion was detected by addition of silver nitrate solution to the filtrate All the catalysts
were dried at 110degC (12 h) in air Finally they were calcined at 500degC for 5 h in air [2]
Alumina (Saint-Gobain surface area 025 m2g) spheres have been tested in this project to date
The vacuum incipient wetness method was employed in the preparation of sphere catalysts To
64
prepare 1 g catalyst 1 g alumina sphere was placed into a sealed two necked round bottom
flask The flask was heated to 80degC with an oil bath and evacuated by a vacuum pump for 1 h
The calculated amount of metal solution was added into the flask through a syringe The flask
was shaken until all the metal solution was absorbed into the spheres Then the spheres were
dried at 110degC overnight and then calcined at 400degC for 3 h
Reactions
The reaction conditions taken for the powder form catalysts usually are 15 bar O2 600 rpm
110degC 10 g n-decane and 005 g catalyst With the sphere supports different from the previous
work the reaction system has to be adjusted as single sphere is much heavier (eg the mass of
a single silica sphere 009 g) than the catalysts used in the previous reactions (005 g in each
reaction)
43 Results
431 Pd Au Pt loaded supported catalysts
The metal loaded catalysts and reduced catalysts were used in reactions under the conditions
100degC 200 psi O2 24 h 005 g catalyst and 600 rpm
65
Table 41 100degC 200 psi O2 24 h 10 g n-decane 005 g catalyst and 600 rpm
Catalyst Conv
()
Selectivity ()
54
one
3
one
2
one
54
ol
3
ol
2
ol
C5
OOH
Di-
one
C6
OOH
Di-
one
Di-
one
C7
OOH
C8
OOH
C10
OOH
PdTiO2 009 0 0 3 17 20 19 0 0 0 0 0 6 2 1
Reduced
PdTiO2 0 0 0 0 0 0 0 0 0 0 0 0 0 0 0
AuTiO2 017 0 0 0 16 2 26 0 13 0 2 2 5 3 4
AuTiO2 025 0 0 15 18 0 22 0 9 0 3 2 10 2 9
Reduced
AuTiO2 0005 0 0 0 0 0 100 0 0 0 0 0 0 0 0
PtTiO2 0 - - - - - - - - - - - - - -
PtTiO2 0 - - - - - - - - - - - - - -
Reduced
PtTiO2 0 - - - - - - - - - - - - - -
These results (Table 41) show very low conversion and are in fact lower than those for a blank
reaction (01-03) demonstrating an inhibition of some part of the reaction by the PdTiO2
With Au TiO2 it was found in the product distribution that a number of C10 ketones formed in
the reaction PdTiO2 inhibits the auto-oxidation reaction
Initial results indicated poor activities with PdTiO2 AuTiO2 and PtTiO2 for decane oxidation
in both liquid reactions at 100degC
66
432 Higher temperature reactions
With the intention of obtaining higher conversion it was decided to increase the reaction
temperature to 110degC More catalysts were prepared and tested at 100degC and 110degC The
conversion and product distribution results were shown in Table 42 and Table 43 It was still
found that none of the catalysts showed good activity at 100degC However the Au catalysts
appear to be better than others on TiO2 and SiO2 supports
Table 42 100 degC n-decane 10 g catalyst 005 g 200 psi O2 24 h
Catalyst Conv
()
Selectivity ()
54
one
3
one
2
one
54
ol
3
ol
2
ol
C5
OOH
Di-
one
C6
OOH
C7
OOH
C8
OOH
C10
OOH
Blank 030 22 13 18 7 6 10 4 11 0 6 2 1
TiO2
TiO2 010 34 22 8 10 3 8 9 7 0 0 0 0
AuTiO2 025 15 18 0 22 0 9 5 10 2 9 0 0
PtTiO2 0 - - - - - - - - - - - -
Pd-
AuTiO2 004 37 6 6 5 3 2 7 34 0 0 0 0
Carbon
Carbon 002 13 0 0 65 0 0 0 22 0 0 0 0
AuCarbon 0 - - - - - - - - - - - -
SiO2
AuSiO2 017 34 28 2 3 11 0 11 7 0 1 3 0
Au-
PdSiO2 029 17 13 9 9 11 26 5 8 0 2 1 0
67
Table 43 110degC n-decane 10 g catalyst 005 g 15 bar O2 24 h
Catalyst Conv
()
Selectivity ()
54
one
3
one
2
one
54
ol
3
ol
2
ol
C5
OOH
Di-
one
C6
OOH
C7
OOH
C8
OOH
C10
OOH
Blank 144 26 7 8 17 2 2 4 12 8 6 1 2
TiO2
TiO2 368 19 10 16 13 8 9 6 10 0 6 1 1
AuTiO2 571 24 15 4 4 2 13 7 20 1 4 2 2
Repeat
AuTiO2 288 15 13 13 11 8 11 5 8 0 7 7 1
PtTiO2 005 0 0 0 52 0 0 0 48 0 0 0 0
SiO2
SiO2 121 27 18 13 6 4 5 7 10 8 3 0 0
AuSiO2 202 27 18 21 6 2 2 5 13 2 1 2 0
AuPdSiO2 187 14 15 16 10 8 11 6 5 5 7 1 1
Al2O3
Al2O3 039 26 14 6 18 5 4 7 8 10 1 0 0
AuAl2O3 104 15 11 12 21 6 3 7 15 5 3 2 1
Carbon
AuCarbon 001 0 0 0 0 0 0 0 100 0 0 0 0
Blank reactions have been repeated and got conversions range from 144-202
68
433 Discussion
Table 44 shows the comparison of the conversions at 100degC and 110degC The increase of the
reaction temperature from 100 degC to 110 degC resulted in an increase in the conversions observed
At the temperature of 110 degC a number of catalysts showed some activity but it must also be
remembered that there is also a considerable rise in auto-oxidation through a temperature
increase Therefore a radical scavenger was introduced
Table 44 Conversion at 100degC and 110degC
Catalyst Conv at
100degC()
Conv at
110degC()
Blank 030 144
TiO2 010 368
AuTiO2 025 571 (288)
PtTiO2 0 005
AuSiO2 017 202
AuPdSiO2 029 187
AuCarbon 0 001
434 Use of a radical scavenger
In order to identify the real activity of the catalyst Tempo has been employed in the reactions
to kill the auto-oxidation by acting as a radical scavenger The TEMPO form used was
stabilized on a polymer support
69
Table 45 110degC n-decane 10 g catalyst 005 g TEMPO 0005 g 15 bar O2 24 h
Catalyst Conv
()
Selectivity ()
54
one
3
one
2
one
54
ol
3
ol
2
ol
C5
OOH
Di-
one
C6
OOH
C7
OOH
C8
OOH
C10
OOH
Blank 0 - - - - - - - - - - - -
TiO2
TiO2 011 30 13 4 9 10 22 7 5 0 0 0 0
AuTiO2 028 17 14 15 8 15 14 7 6 1 1 2 0
SiO2
SiO2 086 21 13 13 5 3 2 4 30 4 6 1 1
AuSiO2 099 21 14 18 8 7 8 5 9 4 4 4 1
Al2O3
AuAl2O3 062 15 10 17 7 12 13 5 10 5 4 1 0
Table 46 Conversions without and with TEMPO
Catalyst Conv without
TEMPO()
Conv with
TEMPO()
Blank 144 0
SiO2 121 086
AuSiO2 202 099
TiO2 368 011
AuTiO2 571288 028
AuAl2O3 104 062
70
The results show a greater drop in conversion for the TiO2 based samples than for the SiO2 and
Al2O3 samples This decrease is most marked as the TiO2 samples have the greatest conversion
without TEMPO and become those with the lowest conversion once the radical scavenger is
added The level of conversion obtained from catalytic processes still remains too low at this
stage to develop further with a coating so the search for a suitable materialconditions was
continued
435 Development of the catalyst preparation method
The impregnation method used previously within this work used a large excess of water It was
thought that this may be leading to disadvantageous distribution of metal particles both in
terms of size and distribution within the pores of the material An alternative method of
preparation using the incipient wetness method to only fill the pores of the material was
therefore used and compared to the previous method The support materials were exposed to
the same preparation conditions (acidheat treatments) so that the effects of these could be
negated Please note that from here the modified GC program and column are used to analyse
the products Table 47 reports the results from a catalyst tested by both the old and new
methods A higher conversion is reported with the new method and an increase in acid
selectivity
71
Table 47 Comparison between GC analysis methods
Catalyst Con
v
()
Selectivity ()
54
one
3
one
2
one
54
ol
3
ol
2
ol
C5
OOH
1
ol
C6
OOH
C7
OOH
C8
OOH
C9
OOH
C10
OOH
Al2O3(Old) 039 26 14 18 6 5 4 7 - 10 1 0 -
1
Al2O3(New) 069 217 150 176 60 43 74 72 14 61 90 20 06
15
Table 48 24h 110ordmC 600 rpm 15 bar Oxygen n-decane (10 g) 005 g catalyst
Catalyst Conv
()
Selectivity ()
54
one
3
one
2
one
54
ol
3
ol
2
ol
C5
OOH
1
ol
C6
OOH
C7
OOH
C8
OOH
C9
OOH
C10
OOH
TiO2 196 182 109 135 76 48 78 114 10 122 79 09 19 17
AuTiO2 343 275 127 32 96 70 52 83 09 109 112 11 05 19
SiO2 161 262 172 183 43 33 58 73 10 63 68 10 04 21
AuSiO2 218 178 135 132 54 35 68 82 11 115 125 36 05 22
Graphite 281 177 133 150 95 61 93 82 11 67 87 15 06 22
AuGrap
hite 387 145 106 110 73 48 74 87 15 111 133 67 10 22
G60 0 - - - - - - - - - - - - -
AuG60 0 - - - - - - - - - - - - -
72
Graphite was tried as the support this time and was the catalyst with the highest conversion so
far The conversion and selectivity of products are shown graphically in Figure 42 to Figure
47
Figure 42 24 h 110ordmC 600 rpm 15 bar Oxygen 005 g TiO2
Total Yield ()=196
00
50
100
150
200
250
C1
C2
C3
C4
C5
Penta
noic A
cid
Hex
anoic
Acid
Hep
tanoi
c Aci
d
Octan
oic Aci
d
nona
noic A
cid
Positions of Oxidation for C10 Products and Cracked Acids
Ketones
Alcohols
Acids
73
Figure 43 24h 110 ordmC 600 rpm 15 bar Oxygen 005 g AuTiO2
Figure 44 24h 110 ordmC 600 rpm 15 bar Oxygen 005 g SiO2
Total Yield ()=343
00
50
100
150
200
250
C1
C2
C3
C4
C5
Penta
noic A
cid
Hex
anoic
Acid
Hep
tanoi
c Aci
d
Octan
oic Aci
d
nona
noic A
cid
Positions of Oxidation for C10 Products and Cracked Acids
Ketones
Alcohols
Acids
Total Yield ()=161
00
50
100
150
200
250
300
C1
C2
C3
C4
C5
Penta
noic A
cid
Hex
anoic
Acid
Hep
tanoi
c Aci
d
Octan
oic Aci
d
nona
noic A
cid
Positions of Oxidation for C10 Products and Cracked Acids
Ketones
Alcohols
Acids
74
Figure 45 24 h 110 ordmC 600 rpm 15 bar Oxygen 005 g AuSiO2
Figure 46 24 h 110 ordmC 600 rpm 15 bar Oxygen 005 g graphite
Total Yield ()=218
00
50
100
150
200
250
C1
C2
C3
C4
C5
Penta
noic A
cid
Hex
anoic
Acid
Hep
tanoi
c Aci
d
Octan
oic Aci
d
nona
noic A
cid
Positions of Oxidation for C10 Products and Cracked Acids
Ketones
Alcohols
Acids
Total Yield ()=281
00
50
100
150
200
250
300
C1
C2
C3
C4
C5
Penta
noic A
cid
Hex
anoic
Acid
Hep
tanoi
c Aci
d
Octan
oic Aci
d
nona
noic A
cid
Positions of Oxidation for C10 Products and Cracked Acids
Ketones
Alcohols
Acids
75
Figure47 24 h 110 ordmC 600 rpm 15 bar Oxygen 005 g AuGraphite
436 Ru and Rh loaded catalysts
From the literature the α- and γ-alumina supports are two of the most widely used supports for
the preparation of RuRh catalysts and zeolite coating It should be noted that from the previous
results with gold the alumina powder support showed less activity than the titania and silica
powder supports however titania support does not suit the coating conditions therefore
several different types of alumina supports were selected and tested in this section
Total Yield ()=387
00
20
40
60
80
100
120
140
160
180
200
C1
C2
C3
C4
C5
Penta
noic A
cid
Hex
anoic
Acid
Hep
tanoi
c Aci
d
Octan
oic Aci
d
nona
noic A
cid
Positions of Oxidation for C10 Products and Cracked Acids
Ketones
Alcohols
Acids
76
4361 α-phase alumina powder support
The 5 wt RhAl2O3 used in the test was prepared by the incipient wetness method using
Al2O3 - calcined powder primarily α-phase 100-325 mesh and RhCl3middotxH2O (Rh 40 wt )
The 5 wt RhAl2O3 powder catalyst have been tested at 100degC and 110degC Table 49 shows
the results for the 6 h oxidation at 100degC The result for the blank reaction at the same
temperature was given as a comparison
Table 49 100degC 15 bar 10 g n-decane 005 g catalyst 6 h
Catalyst Conv
()
Selectivity ()
54
one
3
one
2
one
54
ol
3
ol
2
ol
1
ol
C5
OOH
C6
OOH
C7
OOH
C8
OOH
C9
OOH
C10
OOH
Blank 002 206 134 173 67 48 87 19 150 41 52 08 04
12
α-Al2O3 0008 202 135 211 84 62 104 24 145 18 15 0 0
0
5Rhα-
Al2O3 002 204 138 202 84 64 102 24 138 18 22 02 02
0
77
Table 410 110degC 15 bar 10 g n-decane 00 5g catalyst 6 h
Catalyst Conv
()
Selectivity()
54
one
3
one
2
one
54
ol
3
ol
2
ol
1
ol
C5
OOH
C6
OOH
C7
OOH
C8
OOH
C9
OOH
C10
OOH
Blank 007 287 172 232 35 24 41 10 154 22 19 02 01
0
α-Al2O3 006 222 141 195 52 39 70 13 186 43 29 04 02
01
5Rhα-
Al2O3 006 221 138 185 58 44 71 14 210 25 27 02 02
01
It is found the 5 wt RhAl2O3 did not show activity above that observed for the autoxidation
at 100degC while the product distribution between the Al2O3 with and without the addition of
5Rh is very similar At a raised temperature 110degC it is again found that there is no change
in the activity and product distribution between the autoxidation and Al2O3 with and without
the addition of 5Rh (Table 410) According to the results at 100degC and 110degC it seems that
the Rh did not help the oxidation on the Al2O3 support This may be due to the fact that the 5
wt loading of Rh is too high a concentration for the Al2O3 support A later BET analysis
showed that the surface area of this kind of Al2O3 powder is 1m2g which means the 5 wt
loading of Rh is too concentrated for the α-Al2O3 Therefore a less loading of Rh should be
tested
The reaction results with a 01 wt Rh loading at 110oC are given in Table 411 From this
table it is found that both the conversion and selectivity are quite similar between the blank α-
Al2O3 and the metal added catalyst which means the 01 wt Rhα-Al2O3 powder catalyst is
inactive The α-Al2O3 with a low surface area is not a suitable support for the project
78
Table 411 110degC 15 bar 10 g n-decane 005 g catalyst 6 h
Catalyst Conv
()
Selectivity ()
54
one
3
one
2
one
54
ol
3
ol
2
ol
1
ol
C5
OOH
C6
OOH
C7
OOH
C8
OOH
C9
OOH
C10
OOH
Blank 007 287 172 232 35 24 41 10 154 22 19 02 01
0
α-Al2O3 006 222 141 195 52 39 70 13 186 43 29 04 02
01
01Rh
α-Al2O3 006 221 138 185 58 44 71 14 210 25 27 02 02
01
4362 γ-phase alumina powder support
In order to allow a higher loading of Rh on the support the γ-Al2O3 with a surface area of 140
m2g was employed at this time A 3 wt Rh was added to the γ-Al2O3 as an initial test (Table
412) The product distribution for blank and the α-Al2O3 based catalyst reactions under the
same conditions are given as a comparison
According to Table 412 there is no difference between the blank α-Al2O3 support and the 01
wt Rh added catalyst however there is a definite increase in the activity with a 3 Rh
addition on the γ-Al2O3 As well as the conversion increase the product distribution changes ndash
compared with the blank γ-Al2O3 support the selectivity for the ketones decreased while the
cracked acids increased It is clear that the particle size and concentration of active centre on
the supports significantly influence the activity of the catalyst Therefore a further
investigation was carried out A lower loading of Rh on the same support and other catalyst
preparation technique was tried to gain a best performance
79
Table 412 110degC 15 bar 10 g n-decane 005 g catalyst 6 h
Catalyst Conv
()
Selectivity ()
54
one
3
one
2
one
54
ol
3
ol
2
ol
1
ol
C5
OOH
C6
OOH
C7
OOH
C8
OOH
C9
OOH
C10
OOH
Blank 007 287 172 232 35 24 41 10 154 22 19 02 01
0
α-Al2O3 006 222 141 195 52 39 70 13 186 43 29 04 02
01
01Rh
α-Al2O3 006 221 138 185 58 44 71 14 210 25 27 02 02
01
γ-Al2O3 003 214 138 245 90 67 125 27 68 04 05 0 0
03
3Rhγ-
Al2O3 102 155 109 131 91 57 84 13 158 101 64 14 03
21
Different loadings of Rh by different preparation technique on γ -Al2O3
1 wt and 3 wt Rhγ-Al2O3 were prepared by incipient wetness method and deposition
precipitation method respectively and the reaction results are given below
80
Table 413 110degC 15 bar 10 g n-decane 005 g catalyst 6 h (by incipient wetness
method)
Catalyst Conv
()
Selectivity ()
54
one
3
one
2
one
54
ol
3
ol
2
ol
1
ol
C5
OOH
C6
OOH
C7
OOH
C8
OOH
C9
OOH
C10
OOH
Blank 007 287 172 232 35 24 41 10 154 22 19 02 01 0
untreated
γ-Al2O3 003 214 138 245 90 67 125 27 68 04 05 0 0
03
1Rhγ-
Al2O3 062 163 113 139 73 49 77 14 177 96 70 10 02
16
3Rhγ-
Al2O3 093 155 109 131 91 57 84 13 158 101 64 14 03
21
Table 414 110degC 15 bar 10 g n-decane 005 g catalyst 6 h (by deposition precipitation
method)
Catalyst Conv
()
Selectivity ()
54
one
3
one
2
one
54
ol
3
ol
2
ol
1
ol
C5
OOH
C6
OOH
C7
OOH
C8
OOH
C9
OOH
C10
OOH
Blank 007 287 172 232 35 24 41 10 154 22 19 02 01 0
Untreated
γ-Al2O3 003 214 138 245 90 67 125 27 68 04 05 0 0
03
1Rhγ-
Al2O3 032 174 121 163 70 49 81 15 182 72 58 07 03
07
3Rhγ-
Al2O3 030 162 110 156 85 58 96 16 176 68 55 07 04
08
81
Having a cross comparison among the results a few conclusions can be drawn a) with the
incipient wetness method the different loading of Rh makes a difference in the activity
however the difference in selectivity is limited b) with the DP method the activity with
different loading can be regarded as the same within the experimental error the catalysts
prepared by DP are less active than by the incipient wetness method c) with higher Rh loading
the selectivity of ketones decreased while the internal alcohol increased in comparison with the
autoxidation untreated γ-Al2O3 and less loading of Rh catalyst but the changes between the
two different loading samples were not significant the total cracked acids selectivity does not
change for both the two preparation technique
Using the 3 wt Rhγ-Al2O3 from the same batch four parallel reactions were done to confirm
the results (Table 415) According to the table reaction 1 and reaction 2 were done when the
batch was new and the quite similar conversion and product distribution was reached however
the reaction 3 and 4 which were done days later different product distributions and similar
conversion was reached with the same loading catalyst prepared by DP method This probably
means the Rh formed by the incipient wetness method is not stable in air and became inactive
in the storage
82
Table 415 110degC 15 bar 10 g n-decane 005 g 3 wtRhγ-Al2O3 6 h (by incipient
wetness method)
Reaction Conv
()
Selectivity ()
54
one
3
one
2
one
54
ol
3
ol
2
ol
1
ol
C5
OOH
C6
OOH
C7
OOH
C8
OOH
C9
OOH
C10
OOH
1 093 155 111 136 91 57 86 12 161 94 62 13 03
21
2 102 155 109 131 91 57 84 13 158 101 64 14 03
21
3 032 176 124 171 91 59 95 13 126 65 51 10 03
15
4 041 159 114 153 94 61 96 15 137 76 61 12 04
15
Different metal on the same support
Ru is also a metal with suggested possible activity in the system Therefore the 3 wt Ruγ-
Al2O3 was prepared by the incipient wetness method and DP method as well 3 wt Rh Au
and Ru were added to γ-Al2O3 support respectively and then compared in Table 416 It looks
that by the incipient wetness prep the Rh is the most active system while the Ru is not working
The 3 wt Ruγ-Al2O3 prepared by DP method showed no activity at all
83
Table 416 110degC 15bar 10g n-decane 005g catalyst 6h (by incipient wetness method)
Catalyst Conv
()
Selectivity ()
54
one
3
one
2
one
54
ol
3
ol
2
ol
1
ol
C5
OOH
C6
OOH
C7
OOH
C8
OOH
C9
OOH
C10
OOH
γ-Al2O3 003 214 138 245 90 67 125 27 68 04 05 0 0
03
3Rhγ-
Al2O3 102 155 109 131 91 57 84 13 158 101 64 14 03
21
3Auγ-
Al2O3 036 142 102 145 97 73 120 20 139 62 84 05 03
07
3Ruγ-
Al2O3 0004 351 159 192 127 64 108 0 0 0 0 0 0
0
4363 Loading with alumina spheres
To allow the addition of zeolite coating the metal added sphere catalyst needs to be tested
With a very low surface area of the alumina sphere (diameter = 5 mm surface area = 025
m2g) only a very low loading is allowed on it or the metal on the surface would be too
concentrated to react with the alkanes Table 417 shows the reaction results with 01wt Au
and Rh added alumina spheres However it was found that such low loadings do not help the
activity the conversion with the addition of metal is even lower than the blank spheres But
the 01Rhalumina sphere can achieve a quite different product distribution ndash the selectivity
of the cracked acids is quite low
As we know a low surface sphere is better for the zeolite coating however it limits the
performance of the active centre This is an incompatible problem which needs to be solved
84
As a trial to add more active centres on the support for zeolite coating a smaller alumina sphere
was also employed This type of alumina sphere is with 1mm diameter and 203 m2g surface
area An experiment with the addition of 3 wt Au proves the active centre on it works better
than the low surface area alumina sphere (Table 418) As nobody used a high surface area
alumina support in the zeolite coating before we did not know what would happen when it is
coated A test was carried out and discussed in Chapter 6
Table 417 110 degC 15 bar 10 g n-decane 6 h 600 rpm 2 spheres (low surface area
Al2O3 sphere)
Catalyst
Conv
()
Selectivity ()
54
one
3
one
2
one
54
ol
3
ol
2
ol
1
ol
C5
OOH
C6
OOH
C7
OOH
C8
OOH
C9
OOH
C10
OOH
Untreated
Al2O3
spheres 021 207 131 168 64 45 73 18 190 49 44 03 02
06
01 Au
Al2O3
spheres 012 142 129 196 77 54 88 18 188 46 53 03 02
04
01 Rh
Al2O3
spheres 004 233 159 249 87 69 111 30 111 05 07 0 11
03
85
Table 418 110degC 15 bar 10 g n-decane 6 h 600 rpm 005 g spheres (high surface area
Al2O3 sphere)
Catalyst Conv
()
Selectivity ()
54
one
3
one
2
one
54
ol
3
ol
2
ol
1
ol
C5
OOH
C6
OOH
C7
OOH
C8
OOH
C9
OOH
C10
OOH
untreated
Al2O3
spheres 004 215 138 216 92 64 106 25 102 14 20 02 04
04
3 Au
Al2O3
spheres 026 235 148 188 54 38 60 15 158 49 44 04 01
07
44 Conclusion
Both decane and hexane oxidation have been studied as model reactions The reactions were
carried out using either a Parr stainless steel reactor or an Andrews glass reactor under a range
of conditions Various catalysts have been tested for decane oxidation at the beginning of the
project eg 5 wtAuTiO2 25 wtAu-25 wtPdSiO2 Most of the catalysts showed
very low conversion and very poor terminal selectivity Increasing the temperature leads to
higher conversion but results to more cracked products and less selectivity for oxygenated C10
products Figure 48 shows the activity of the auto-oxidation and the catalysts activity From
this figure it can be seen that the most active catalyst was 5 wt AuTiO2 However these
catalysts did not show good terminal alcohol selectivity whereas the cracked acid selectivity
was high (320) (Figure 49)
86
Figure 48 Conversion with different catalysts (reaction conditions 110oC 10 g n-
decane 005 g catalyst 15 bar O2 600 rpm stainless steel reactor)
Figure 49 Product distribution with 5 wt AuTiO2 (reaction conditions 110oC 10 g
n-decane 005 g catalyst 15 bar O2 600 rpm stainless steel reactor)
87
45 References
[1] J K Edwards B E Solsona P Landon A F Carley AHerzing CJ Kiely and GJ
Hutchings Journal of Catalysis 235 (2005) 69
[2] P Siva Sankar Reddy N Pasha MGV Chalapathi Rao N Lingaiah I Suryanarayana
PS Sai Prasad Catalysis Communications 8 (2007) 1406
88
CHAPTER 5
Cyclodextrin Covered
Catalysts
89
CYCLODEXTRIN COVERED CATALYSTS
51 Introduction
Cyclodextrins (CDs) are cyclic oligosaccharides composed of six (alpha) seven (beta) or eight
(gamma) glucopyranose units linked by α(1-4)-glycosyl bonds that have the shape of hollow
truncated cones They have a central cavity of 6-10 nm which can form complexes with various
organic compounds in aqueous solution inside their hydrophobic cavities [1] Due to their
unusual properties cyclodextrins have been widely investigated and utilized in pharmacy
biology the food industry analytical chemistry separation science and various other areas [2-
9]
Figure 53 Chemical structure of α- and β-CDs
Although the application of cyclodextrins as a shape-selective material has been widely
reported the number of reports focusing on their application to the oxidation of linear alkanes
is limited The first literature concerning alkane oxidation with cyclodextrins was published in
1972 by Lammers [10] Lammers et al proposed that α-CD derivatives can encapsulate one n-
hexane molecule in its stretched conformation in the interior of the cavity whereas β-CD
derivatives can encapsulate one n-hexane molecule in a compact coil form (but only loosely
90
bound) Based on this Otsuka published an article in 1991 on the application of CDs for the
terminal oxidation of n-hexane in a H2-O2 fuel cell [11] In 2000 Otsuka and Yamanka used
FeCl3graphite as the host cathode to study the effect of cyclodextrin additives on the selective
oxygenation at the primary carbon of n-hexane [12] They demonstrated that when n-hexane
was introduced to the cavity of the cyclodextrin the methylene CndashH bonds of n-hexane are
blocked by the walls of the cyclodextrins from an attack by the active oxygen species so
oxygenation occurs exclusively at the terminal carbons As a result they reported that when α-
and β-CDs were added to the FeCl3graphite cathode the selectivity for terminal oxygenation
increases (selectivity for 1-hexanol ~12) compared with that of the normal FeCl3graphite
cathode
Based on these studies it is clear that cyclodextrins can be an effective shape-selective material
in the hexane oxygenation reactions by the electrochemistry system However it would be
interesting to see if there is a less expensive and easier method to apply cyclodextrins to alkane
oxidation In this project the possibility of using cyclodextrins as an organic shape selective
coating over catalysts for the oxidation of long chain alkanes was investigated
The idea of using CDs as catalyst coatings is that they may allow only the primary CndashH bonds
of alkanes to interact with active oxygen species present at the catalyst surface thus forcing
oxygenation exclusively at the terminal carbon The diameters of cyclodextrin cavities are
047ndash053 nm (α-CD) 060ndash065 nm (β-CD) and 078ndash083 nm (γ-CD) The common depth
of the cavities is about 079 nm [12] The width of linear alkanes is typically 04-05 nm Due
to the molecular size of the long chain alkanes the cavities of α- and β-CDs are considered to
be more preferable for the selective oxidation of long chain alkanes Several different
91
cyclodextrin modified catalysts have been prepared and are discussed in this chapter
52 Cyclodextrins as catalyst modifiers
There are no previous studies on how to apply cyclodextrins as a direct coating material for
catalysts applied to long chain alkane oxidation However CDs have been applied as
regioselective catalysts or catalyst modifiers in various other chemical reactions [13-19]
Guy et al [13] reported some preliminary results obtained on the effects of CDs during the
ring-opening reaction of epoxides with LiN3 in aqueous media The experiment was carried out
by stirring a mixture of epoxide LiN3 and β-CD in water at room temperature They observed
an lsquoincrease in the regioselectivity of the ring-opening processrdquo A regioselectivity of 59
could be obtained for compound 2b (Scheme 51) when the reaction was performed in the
presence of β-CD compared to 86 without the use of β-CD Although a good selectivity
can be reached with the use of β-CD as a mediator a decrease in the regioselectivity was
observed as the conversion of styrene oxide was increased and after 43 hours of reaction the
selectivity had dropped to 20
Scheme 51 The ring- opening reaction of epoxides with LiN3 in aqueous media in the
presence of β-CD [14]
Reddy et al [14] reported the regioselective ring opening of epoxides to halohydrins with
hydrogen and lithium halides in the presence of β-CD using water as solvent The reaction was
92
carried out by the in situ formation of a β-CD - epoxide complex followed by the addition of
hydrogen halide or lithium halide (Scheme 52) Stirring at room temperature results in the
formation of the corresponding halohydrin without the formation of any side products or
rearrangements The CDs appeared not only to activate the epoxides but also to promote the
highly regioselective formation of halohydrins due to the formation of an inclusion complex
Scheme52 The ring opening of epoxides to halohydrins in the presence of β-CD [14]
Similar research has been reported by Sridhar et al [15] for the regioselective ring opening
synthesis of β-hydroxy selenides from benzeneselenol and epoxides (Scheme 53) The
reaction was found to proceed at room temperature in presence of β-CDs in water
Scheme 53 The ring opening synthesis of β-hydroxy selenides from benzeneselenol and
epoxides in the presence of β-CD [15]
Ravichandran [16] found that in the presence of β-CD and its derivatives the photo-Reimerndash
93
Tiemann reaction of phenols with chloroform proceeds with high selectivity for the formation
of 4-hydroxy benzaldehydes The β-CDs were reported to have two effects on the reaction
(Scheme 54) Firstly both the yield of the aldehyde and the reaction rate were enhanced
Secondly the position of formylation was altered ie the ratio of 23 (paraortho attack) was
increased The presence of β-CD showed an enhanced yield up to 74 with 824 selectivity
for the formation of 4-hydroxy benzaldehyde against a yield of up to 62 with 666
selectivity for the same compound without the presence of β-CD
Scheme 54 The formation of 4-hydroxy benzaldehydes [16]
Pattekhan and Divakar reported the regioselective acetylation of 4-t-butylcyclohexanol in the
presence of β-CD [17] The experiment was carried out with 10ndash20 times excess of acetic
anhydride At a molar ratio of 110 of 4-t-butylcyclohexanolacetic anhydride (Scheme 55)
they reported a conversion of 990 to 4-t-butylcyclohexyl acetate with a transcis ratio of
348 with very little unreacted alcohol present (transcis ratio 25) They also found that with
an increase in the concentration of β-CD (although the ester yield was less than the control) the
transcis ratio increased steadily from 346 for 101 (yield 577) to 549 for 11 eq (yield
744) of 4-t-butylcyclohexanol to β-CD However the trans ester yield was comparable to
the control (769) in the presence of 1 eq of β-CD They concluded that the results showed
that the selectivity in esterification between the trans and cis alcohols was due to inclusion
complex formations within the β-CD cavity
94
Scheme 55 4-t-butylcyclohexanol to acetic anhydride [17]
Hirai and Shiraishi [18] reported their study of regioselective carboxylation of aromatic
compounds using CDs as catalysts under mild conditions producing terephthalic acid 44rsquo-
biphenyldicarboxylic acid and 26-naphthalene-dicarboxylic acid (Scheme 56) In their
opinion it is the inclusion complex formations of β-CD with the aromatic hydrocarbon and
carbon tetrachloride in the reaction mixture that promotes the yield and selectivity of the target
dicarboxylic acids The high selectivity was ascribed to the conformation of the β-CDndasharomatic
monocarboxylate inclusion complexes
95
Scheme 56 The formation of terephthalic acid 44rsquo-biphenyldicarboxylic acid and 26-
naphthalene-dicarboxylic acid [18]
Ji et al [19] reported how the amount of β-CD can affect the oxidation of sulfides to sulfoxides
and sulfones with aqueous hydrogen peroxide in the presence of β-CD In their operation 1
mmol of β-CD was dissolved in 25 ml of deionised water at 45 oC and then the methyl phenyl
sulfide was added under stirring and hydrogen peroxide was slowly added as well They found
that a rise in the amount of β-CD strongly increases the conversion of methyl phenyl sulfide
from 56 to 93 at 45 ordmC
From the literature survey in various reactions CDs can be effective catalyst modifiers and
work at room temperature or very low reaction temperature and are easy to apply and low cost
According to this the method to create CD covered catalysts were developed as in the
Experimental section below
53 Experimental
531 Preparation of CD covered catalysts
The main method of catalyst preparation was impregnation The porous catalysts were
96
impregnated in the CDs solution to leave adsorbed CDs on the surface Using CD covered
AuSiO2 as an example the detailed steps of the preparation were as follows
1 BET surface area of the AuSiO2 determined
2 Assuming CD molecules cover the catalyst surface one by one without gaps and create a
monolayer (Figure 52) the required mass of CDs to completely cover the surface of catalysts
was calculated (eg to cover 1 g of AuSiO2 037 g of α-CDs or 035 g of β-CDs is needed)
3 The calculated amount of CDs was then dissolved in 25 ml of deionised water by heating to
45C and stirring
4 5 ml of the CDs solution was added to 1 g of AuSiO2 and the mixture heated to 45C and
stirred for 30 min and then put into an oven to dry overnight at 110ordmC
Figure 52 Ideal catalyst surface covered by cyclodextrin molecules
532 Catalyst testing
Reactions were carried out in a high-pressure stainless steel autoclave with a nominal volume
of 45 ml and a magnetic PTFE stirrer In each experiment the reaction unit was flushed once
with O2 to remove the air And then the pressure was increased to 15 bar O2 at room temperature
Normally the prepared catalysts were tested in the unit using the following conditions 15 bar
O2 600 rpm stirring speed 110degC 10 g n-decane and 005 g catalyst 16 h
97
In most cases the tested catalysts were modified following the method described in Section
531 to create fully covered catalysts However in some cases the catalysts were modified by
less than a monolayer of cyclodextrins (samples denoted 14 α-CDs covered AuSiO2 for
catalysts with a coverage of 14 monolayer) Samples were not able to be fully recycled after
reactions therefore each experiment was performed with fresh catalyst In addition some
reactions were carried out with addition of PS-TEMPO (2266-Tetramethyl-1-piperidinyloxy
provided by Johnson Matthey) as a radical scavenger
02 μl samples of the reaction mixtures were analysed after reaction using a gas chromatograph
(Varian 3380) fitted with a CP-WAX52 CB column and an FID detector An internal standard
(0150 ml 124-trichlorobenzene) was added to the product mixture to quantify the results
54 Results
541 BET analysis
The BET surface area of the catalysts covered by different amounts of cyclodextrins was
determined as shown in Table 51
Table 51 The BET surface area of the different catalysts
Catalysts Surface Area (m2g)
5 wtAuSiO2 254
14 α-CDs covered AuSiO2 222
α-CDs fully covered AuSiO2 155
14 β-CDs covered AuSiO2 189
β-CDs fully covered AuSiO2 96
It was observed that with an increasing amount of cyclodextrins the surface area of the
98
catalysts decreased For example for the α-CD series the standard AuSiO2 the specific
surface area was decreased by 12 with 14 α-CD coverage and 39 with the fully covered
AuSiO2 According to Poncheal et al [20]this reduction in surface area correlates with the
covering of the nitrogen adsorption sites by the cyclodextrin on the substrate catalyst surface
which hinders the nitrogen molecules access to the binding sites Therefore the decrease of the
surface area is an evidence of the successful loading of cyclodextrin on the surface of AuSiO2
542 Activity of CDs
5421 Activity of CDs under reaction conditions
At the beginning of the research it was important to establish the activity of CD themselves
under the reaction conditions Therefore reactions with only CD and no catalyst were carried
out Two different amounts of CDs were used (005 g and 100 g) An average of two blank
reactions (no catalysts only decane and oxygen) is also given for comparison The results were
shown in Table 52
Table 52 Activity of CDs
Catalyst Conv() Selectivity ()
C10
Ketones
C10
Alcohols
Cracked
Acids Others Terminal
Blank 066 586 66 120 236 26
005g α-CDs 030 474 63 107 355 27
100g α-CDs 011 224 126 160 489 21
005g β-CDs 032 422 75 128 374 17
100g β-CDs 017 187 131 152 530 31
Reaction conditions 16 h 110oC 15 bar O2 10 g n-decane 005 g or 100 g CDs stainless
steel reactor
99
The addition of both α- and β-CDs leads to a decrease of conversion when compared to the
blank reaction under the same conditions In the product distribution there was a definite
decrease in the selectivity to ketones and an increase in the selectivity to alcohols and acids
The unknown other products increased as well especially with 100 g of CD
In the CD structures there are a number of OH groups (Figure 51) therefore it could be
possible that the CDs are being oxidized rather than decane It has been reported that without
tethering them to a catalyst cyclodextrins can be oxidized and yield ketones and carboxylic
acids [21] It is also possible that the CDs react and produce some of the unknown products
To determine whether the cyclodextrins were stable under the reaction conditions they were
added into another solvent performing the reaction under the decane reaction conditions
Reactions were performed with α- or β-CDs (005 g) in water (10 g) keeping the other
conditions the same as for the reaction using decane (stainless steel reactor 15 bar O2 600 rpm
stirring speed 110degC 16 h) After the reaction no products were observed in the GC trace
(Figure 53) which indicates that the CDs are not reacting under the reaction conditions The
product distribution changes observed are due to modifying the catalyst
However no trend in terminal selectivity with the additions of CDs is observed (Table 55) and
the range of terminal selectivities observed is considered to be within the experimental errors
Therefore it is assumed that without a catalyst the CDs are not shape-selective catalysts for
the oxidation of decane
100
Figure 53 GC analysis β-CDs reacting with water
5422 Activity of CDs with the addition of radical scavenger
A radical scavenger ndash PS-TEMPO was added to the reaction Previously it has been shown that
that 0005 g PS-TEMPO can suppress the radical reaction in blank reactions (Chapter 4)
Therefore 0005 g PS-TEMPO was added into the reaction in order to observe the non-radical
catalytic reaction with CDs
The results are given in Table 53 It was found that the conversion decreased with the addition
of PS-Tempo For all the reactions with PS-TEMPO a 005 conversion was observed and the
selectivity of the other products increased However an increase in selectivity for alcohols and
acids was still observed when the amount of α-CDs is increased from 005 g to 100 g The
terminal selectivities were very low (around 05-08)
101
Table 53 Activity of CDs with PS-TEMPO
Catalyst Conv() Selectivity ()
C10
Ketones
C10
Alcohols
Cracked
Acids Others Terminal
005g α-CDs 030 474 63 107 355 27
With PS-
TEMPO 005 26 22 32 920 05
100 g α-CDs 011 224 126 160 489 21
With PS-
TEMPO 005 34 29 49 888 07
005g
β-CDs 032 422 75 128 374 17
With PS-
TEMPO 005 26 22 38 904 08
Reaction conditions 16 h 110oC 15 bar O2 10 g n-decane 005 g or 100 g CDs 0005 g PS-
TEMPO stainless steel reactor
543 Activity of CD modified AuSiO2
5431 The fully covered AuSiO2
In Chapter 4 it is reported that AuSiO2 is one of the best catalysts for decane oxidation
Therefore the CDs were impregnated onto AuSiO2 to prepare CD modified catalysts and the
results are shown in Table 54
It was found that the conversion was higher with the AuSiO2 without having being modified
by the addition of CDs This could be because of the CD on the surface covering some of the
active sites on the AuSiO2 leading to the decreased conversion It was also found the terminal
selectivity was increased slightly from 27 to around 32 with CDs Repeating the reaction
showed the same results although this increase is considered to be within the experimental
errors
102
Table 54 Activity of CD modified AuSiO2
Catalyst Conv() Selectivity ()
C10
Ketones
C10
Alcohols
Cracked
Acids Others Terminal
Blank 068 586 66 120 236 26
AuSiO2 100 497 106 145 252 27
005g
α-CDs 030 474 63 107 355 27
α-CD
modified
AuSiO2 053 290 167 162 382 31
005g
β-CDs 032 422 75 128 374 17
β-CD
modified
AuSiO2 070 325 173 158 344 32
Reaction conditions 16 h 110degC 15 bar O2 10 g n-decane 005 g catalyst stainless steel
reactor
5432 Different level of CD coverage over catalysts
When preparing the CD covered AuSiO2 the amount of CD needed to fully cover the surface
area of AuSiO2 was calculated However tests were performed to investigate if different levels
of coverage can affect the terminal selectivity which is also a potential way to prove if the CDs
are shape selective A quarter of the amount of CD was added to the catalyst which was tested
under the same reaction conditions as previously and the results are shown in Table 55
103
Table 55 Activity of CD modified AuSiO2
Catalyst Conv() Selectivity ()
C10
Ketones
C10
Alcohols
Cracked
Acids Others Terminal
AuSiO2 100 497 106 145 252 27
α-CD 14
covered
AuSiO2 071 291 150 179 380 29
α-CD fully
covered
AuSiO2 053 290 167 162 382 31
β-CD 14
covered
AuSiO2 050 320 160 160 360 29
β-CD fully
covered
AuSiO2 070 325 173 158 344 32
Reaction conditions 16 h 110oC 15 bar O2 10 g n-decane 005 g catalyst stainless steel
reactor
According to Table 51 it was found that different amounts of CDs lead to a different coverage
level of CDs on the catalyst surface However from Table 55 it can be seen that with different
level of CD coverage the difference between product distributions was very limited The trend
of BET surface area change and terminal selectivity change for the α-CD covered AuSiO2 is
shown in Figure 54
104
Figure 54 The trend of BET surface area change and terminal selectivity change
There was a 02-03 increase in the terminal selectivity between the 14 covered sample and
the fully covered sample Thus there is a general trend in increasing terminal selectivity with
increase CD content This increase is however also considered to be within the experimental
error Therefore from these experiments it cannot be concluded if the CDs worked as a shape-
selective coating in the reaction
5433 Cyclodextrin modified catalyst recycling
To check the stability of CDs on the modified catalysts decane oxidation reactions with α- and
β-CD covered AuSiO2 were performed then the catalysts were recycled and reused However
it should be noticed that the full repeat was impossible as there was a loss of catalyst during
the recycle and for 005 g catalyst only 002 g was recovered after recycling
105
Table 56 Reaction with recycled CD modified AuSiO2
Catalyst Conv() Selectivity ()
C10
Ketones
C10
Alcohols
Cracked
Acids Others Terminal
α-CD
covered
AuSiO2 0668 315 192 300 192 24
Recycled
α-CD
covered
AuSiO2
0100 383 191 203 210 23
β-CD
covered
AuSiO2 0556 345 161 312 172 24
Recycled
β-CD
covered
AuSiO2
0053 323 198 275 191 26
Reaction conditions 16 h 110oC 15 bar O2 10 g n-decane 005 g catalyst stainless steel
reactor
Although there was a huge decrease in the conversion the change in the terminal selectivity
was minor (Table 56) This result may indicate that the AuSiO2 was deactivated after the
reaction As no decrease in terminal selectivity was found with the recycled catalyst it is
thought that CDs still covered the catalyst after the reaction However due to the large loss of
catalysts in the recycling process and the experimental error at low conversion the results are
not clear
544 CD modified AuHCl treated SiO2
In Chapter 4 it was found that the acid treated silica support did not show a difference from
the silica support without acid treatment in terminal selectivity However it was considered
worth determining if there is any difference with the cyclodextrin coatings Therefore AuHCl
treated SiO2 was also modified with CDs and tested under the same reaction conditions (Table
106
57)
Table 57 Activity of CD covered AuHCl treated SiO2
Catalyst Conv() Selectivity ()
C10
Ketones
C10
Alcohols
Cracked
Acids Others Terminal
AuHCl
treated
SiO2 090 445 113 158 284 29
α-CD
covered 080 311 159 183 347 30
β-CD
covered 050 286 151 164 399 28
Reaction conditions 16 h 110oC 15 bar O2 10 g n-decane 005 g catalyst stainless steel
reactor
A decrease in conversion was again observed when CDs were added to the reaction The
terminal selectivity of the treated AuHCl treated SiO2 is slightly higher than the non-treated
AuSiO2 and the conversion slightly lower The difference in conversion and terminal
selectivity are both considered to be within the experimental errors With CDs on AuHCl
treated SiO2 no changes in terminal selectivity were detected in the reaction however the
conversion decreases This may be because the CDs are not selective in the reaction However
it could also be possible that the H+ remained on the surface of the Au catalyst and then reacts
with the ndashOH bond on the CDs
107
55 Conclusions
The aim of the project was to synthesize coatings onto active catalysts which can effectively
oxidize long chain alkanes in the primary position In this chapter cyclodextrins were
investigated as an organic shape-selective material to coat the AuSiO2 catalysts Addition of
CDs without the catalyst decreased the conversion but no trend in terminal selectivity was
observed With the CD covered AuSiO2 catalyst a decrease in conversion is seen compared to
the blank reaction however the changes in terminal selectivities are still limited and considered
to be within the experimental errors To conclude the CD covered catalysts which were
prepared by the direct impregnation method did not play an important role in increasing the
terminal selectivity
56 References
[1] GA Signorell TC Kaufmann W Kukulski A Engel H Remigy Journal of Structural
Biology 157 (2007) 321
[2] J Haggin Chemical Engineering News 70 (1992) 25
[3] J Szejtli Cyclodextrin Technology Kluwer Academic Publishers Dordrecht (1988)
[4] R Dagani Chemical Engineering News 71 (1993) 4
[5] H Parrot-Lopez H Galons AW Coleman J Mahuteau M Miocque Tetrahedron
Letters 33 (1992) 209
[6] DW Armstrong W Li AM Stalcup H VSecor RR Izac JI Seeman Analytical
Chemistry Acta 234 (1990) 365
[7] DW Armstrong AM Stalcup ML Hilton JD Duncan JR Faulkner S Chang Anal
Chem 62 (1990) 1610
[8] J Szejtli Cycfoakxtrin Technology Kluwer Academic Dordrecht (1988)
108
[9] ML Bender and M Komiyama Cyclodextrin Chemistry Springer Berlin (1978)
[10]JNJJ Lammers Recueil 91 (1972) 1135
[11] K Otsuka K Furuka Electrochimica Acta 37 (6) (1992) 1135
[12] K Otsuka I Yamanaka Catalysis Today 57 (2000) 71
[13] A Guy J Doussot R Garreau A Godefroy-Falguieres TetrahedronAsymmetry 3
(1992) 247
[14] MA Reddy K Surendra N Bhanumathi KR Rao Tetrahedron 58 (2000) 6003
[15] R Sridhar B Srinivas K Surendra NS Krishnaveni KR Rao Tetrahedron Letters 46
(2005) 8837
[16] R Ravichandran Journal of Molecular Catalysis A Chemical 130 (1998) 205
[17] HH Pattekhan S Divakar Journal of Molecular Catalysis A Chemical 184 (2002) 79
[18] H Hirai Y Shiraishi Reactive amp Fuctional Polymers 67 2007 1115
[19] H Ji XHu D Shi Z Li Russian Journal of Organic Chemistry 42 (7) (2006) 959
[20] A Ponchel S Abramson J Quartararo D Bormann Y Barbaux E Monflier
Microporous and Mesoporous Materials 75 (2004) 261
[21] ME Deary DM Davies Carbohydrate Research 317(1-4) (1999) 10
[22] K Otsuka I Yamanaka Catalysis Today 57 (2000) 71
109
CHAPTER 6
Teabag Technology
110
TEABAG TECHNOLOGY
61 Introduction
The aim of this research project is to realize the selective oxidation of long chain alkanes to
alcohols and acids at the terminal position Therefore various selective materials can be
considered Zeolites known as one of the most popular shape-selective catalysts is the focus
of the chapter Zeolites can be synthesized as membranes for the purpose of separation
adsorption or for the selective reaction An ideal zeolite membrane combines the general
advantages of inorganic membranes (temperature stability solvent resistance) with shape
selectivity Small aggregates of zeolite crystals as a coating on the surface of a catalyst can
improve external mass transfer characteristics especially in fast liquid phase and gasliquid
phase reactions [1] A continuous zeolite membrane can discriminate the components of
gaseous or liquid mixtures dependent on their molecular size Hence in this chapter the aim is
to utilize zeolite membrane as coatings outside the metalsupport catalysts to realise the
selectivity of the terminal long chain alkane oxidation product This technology is called teabag
technology Specifically teabag technology is an idea that zeolite coatings work as the teabag
to control the diffusion of reactants to the active sites in a specific configuration that only allows
the oxidation of the terminal position This chapter aims to find a zeolite with the suitable pore
size so that only the wanted reactant and product can pass through the outer coating to an
oxidation catalyst underneath
62 The teabag technology project
lsquoTeabag technologyrsquo was first named by Johnson Matthey (JM) which is one of the sponsors
and co-operating companies of the research project The key work in this area has been carried
111
out by Paul Collier (JM) who used zeolite A as the coating material on the catalyst (eg Pt-
FeSiO2 Pd-FeSiO2) for the CO oxidation in the presence of butane [2 3] The zeolite A
coating synthesis process they used was as follows 5 g catalyst spheres were added into a 5
wt solution of polyelectrolyte (Percol 1697 from Allied Colloids Ltd) containing dilute
ammonia to adjust the pH value between 10 and 11 The solution was stirred at room
temperature for 20 minutes Subsequently the spheres were separated from the solution and
washed with demineralized water Then the spheres were rapidly added to a zeolite gel which
was composited with a solution of 607 g sodium aluminate in 52 g demineralized water to a
solution of 1551 g sodium metasilicate in 52 g demineralized water The gel was stirred at
room temperature for 2 hours and then hydrothermally crystallized at 100˚C for 24 hours The
zeolite coated catalyst spheres were separated from the crystallization solution and washed with
demineralized water dried at 105˚C and then calcined at 500˚C for 2 hours The oxidation
experiment results showed with the coated catalyst carbon monoxide is selectively oxidized at
temperature between 150˚C and 400˚C (Figure 61)
However this technique cannot be applied in this project in exactly the same way because the
pore size of zeolite A is too small (pore size ranges from 3-45 Aring KNaA 3 Aring NaA 4 Aring
CaNaA 45 Aring) for the long chain alkane diffusion Therefore other zeolite membrane needs
to be explored to fit the long chain alkanes Considering the molecule size of hexane and decane
MFI type zeolite (including silicalite-1 and ZSM-5) zeolite X and mordernite are all possible
candidates (pore size ranges from 8-10 Aring)
112
Figure 61 CO and butane conversion comparison with the presence of zeolite A coated
catalyst
63 Zeolite membrane synthesis
In order to create a typical zeolite membrane coating for this project it is important to
understand the current research stage of zeolite membrane synthesis and the parameters that
influence the synthesis
631 Preparation method
The methods for the preparation of the zeolite coatings recorded in the literature can be
generally catalogued into three different ways
113
1) Slurry coating or wash-coating in which the zeolite is brought onto the support from a wash-
coat solution containing precursors of binders based on alumina zirconia silica titania or
silica-alumina The coatings are calcined to obtain bonding of the crystallites to the support
surface [4]
2) Dry gel conversion in which a gel containing the aluminosilicate precursor water and
template is brought onto the support dried and subsequently crystallized by contacting with
steam at 105-150ordmC [5]
3) In situ coating in which the crystals are directly grown close to or on the support either from
a gel or a solution with the hydrothermal synthesis conditions [6-21]
The disadvantage of first and second methods is that the crystal layers created in those ways
always show a low continuity and a limited accessibility therefore it is more common today
to use the in situ hydrothermal method in dilute aluminosilicate systems in which the amorphous
gel phase is not present Zeolite coatings prepared in this way have a high continuity and can
be optimized for use as either a membrane or a catalyst
The first hydrothermal method system that produced zeolite NaA was reported at the
International Zeolite Association (IZA) meeting in Tokyo in 1986 by Wenqin et al [6] The
batch composition in it formed the starting point of the present work in clear solution Another
advantage of the clear solution method is that it permits the use of in situ observations using
light scattering techniques to study the synthesis [7] especially the nucleation and crystal
growth processes occurring within the solution phase After Wenqin et al [6] published the
system almost all syntheses of zeolite A coatings were accomplished using the clear solution
system with the composition xNa2OyAl2O31SiO2200H2O where x ranges from 5 to 13 and
114
y ranges from 01 to 02
Cetin et al [8] used a small difference in their batch composition they used the aluminosilicate
solution with a composition of 10Na2OAl2O3SiO2200H2O The same ratio was also utilized
in the research of Andac et al [9] Anhydrous NaOH pellets were dissolved in deionised water
and granular sodium aluminate and sodium silicate were added to the solution Additions were
made to solutions cooled to below 27ordmC and the final reaction mixture was stirred for 15 min
at the temperature prior to the syntheses Hydrothermal crystallization was carried out in a
stainless steel reaction vessel at 60ordmC for various periods of time ranging from 1 to 10 h It was
reported that a zeolite film with a thickness of about 15 μm could be obtained after a synthesis
time of 10 h
Different compositions have also been reported in the literature for the zeolite A coatings Wang
et al [10] employed a solution with 03Na2OAl2O334SiO242 (TMA)2O 237H2O The
experiments were run at a higher temperature of 100ordmC for 24 h coatings were successfully
applied to a porous α-Al2O3 support The particle size of the zeolite crystallites was 250 nm by
SEM
As a development of the hydrothermal synthesis a seeding method was introduced into the
zeolite membrane preparation For example Sterte et al [11] synthesized mono disperse
silicalite-1 crystals and then used the crystals as seeds in the synthesis of coatings Supports
were seeded first and then zeolite membranes were grown by the hydrothermal method
described in the other methods [6-10] They showed that coatings synthesized by this method
had better adhesivity thermal stability and crystal orientation than those prepared by other
115
methodologies
In a synthesis of ZSM-5 coatings on stainless steel Tatlier et al [12] used a substrate heating
method keeping the reaction mixture at temperatures below 100ordmC while the metal plates were
heated to a temperature above 100ordmC It was demonstrated that continuous ZSM-5 coatings of
different textures with different crystal morphologies and void fractions could be formed
depending on the reaction conditions (Table 61) The mass of the coatings increased with the
substrate temperature and the duration of synthesis because of the effect of temperature on the
rate of crystallization The method was regarded to be beneficial in respect to the synthesis
duration compared to the conventional procedures
Table 61 Mass and thickness of the coatings at an oil bath temperature of 90degC
Resistance
temperature
(degC)
Synthesis
duration
(days)
Coating
mass
(mgcm2)
Actual
coating
thickness
(μm)
Equivalent
coating
thickness (μm)
Void
fraction
200 3 01a ndash ndash ndash
240 3 02a ndash ndash ndash
280 3 05 40 29 028
240 5 17 120 97 020
240 8 27 270 153 043
280 5 33 380 188 051
a The coating is not crystalline
116
632 Supports in zeolite coating
For the synthesis of zeolite coatings support materials should be chosen that are readily
available attrition resistant and chemically stable under the reaction conditions
In Table 62 various types of support are given together with their physical and chemical
properties [13]
Supports such as α-Al2O3 [9 14 15] quartz [8] and stainless steel [8 9] were reported in use
for the zeolite A coating in the literature reviewed to date And as reported in the US patent
20050032628 [2] the catalyst substrate comprises at least one platinum group metal which
are known as effective catalysts for the oxidation of a wide variety of chemical species
supported on a support material The support materials are preferably oxidized materials
including silica alumina titania and so on It is possible that preparations using these supports
could be adapted to introduce an active metal to the support before applying the zeolite coating
It was reported that the formation of a continuous coating of zeolite is not easy to achieve over
an alumina or stainless steel support using conventional hydrothermal crystallization
techniques [9 16] The surface charge of zeolites is negative at basic pH (typical zeolite
synthesis conditions) which means that there is an electrostatic barrier preventing the growth
of zeolite coatings on supports To overcome this several methods of introducing positive
charge to the supports were investigated
117
Table 62 Supports currently used in the preparation of zeolite coatings
Support Nature Surface Amount of
surface
material areaa OH- groupsb
Spheresextrudates
α-Al2O3 Hydrophobic high low
γ- Al2O3 Hydrophilic high high
Single crystal wafers
Si Hydrophilic low high
TiO2 Hydrophilic low medium
Sapphire(α-Al2O3) Hydrophobic low low
Platesdisks
Stainless steel Hydrophilic low high
Quartz Hydrophilic low high
Vitreous glass Hydrophilic low high
Pressed carbon Hydrophobic high low
Foams
α-Al2O3 Hydrophilic high low
Fibres
Carbon Hydrophobic medium low
Vegetal Hydrophilic medium medium
Inorganic Hydrophilic medium high
Inserts
Gold Hydrophobic low low
Teflon Hydrophobic low low
a Lowlt 1 m2g-1 medium 1-10 m2g-1 highgt 10m2g-1
b Lowlt 1 OH nm-2 medium 1-25 OH nm-2 highgt 25 OH nm-2
Collier et al [16] reported a method using a copolymer of acrylamide and the methyl chloride
quaternary salt of 2-(dimethylamino) ethyl acrylate The polymer species are strongly adsorbed
118
on the support by the electrostatic attraction between the quaternary ammonium groups of the
adsorbate and the oxide ions at the support surface resulting most probably in a flat
conformation The presence of excess quaternary ammonium groups imparts an overall
positive charge to the polymer-covered support surface allowing the zeolite coating to stick
Andac et al [9] reported a treatment method for stainless steel to introduce positive charge to
the surface The stainless steel plates were first boiled in toluene for 30min and then held at
60ordmC for 15 min in a mixture of H2O2(30) NH4OH(25) and H2O in a 115 ratio by volume
In this way NH4+ is attached to the support surface creating the positive charge
A typical method of preparation catalyst substrate was investigated by Nishiyama et al [17]
In the report they prepared the silicalite-1 coating with PtTiO2 by impregnation in two steps
1) Preparation of PtTiO2 particles Platinum-loaded titania catalyst was prepared by the
impregnation of spherical TiO2 particles with Pt from a solution of hydrogen
hexachloroplatinate (IV) hexahydrate The impregnation solution was prepared by dissolving
H2PtCl6middot6H2O salt in deionised water Then the slurry was dried at 120ordmC overnight and at
500ordmC for 6 h in air Reducing in hydrogen for 3 h at 300ordmC is required before utilization
2) Zeolite coating The surface of the PtTiO2 particles was positively charged by treatment in
a solution of 04 wt polyethyleneimine in deionised water Then the particles were immersed
in a 10 wt silicalite-1 solution The crystallization was carried out in the closed vessel at
180ordmC for 24h (Figure 62) After washing with deionized water and drying the product at 90ordmC
overnight it was calcined in air at 500ordmC for 6 h
119
Figure 62 Reaction vessel used for zeolite coating
633 Other factors for preparation
Some other factors that would influence the production of zeolite coating have been
investigated including the operating temperature [1 8 9] the utilization of ultrasound [1 9
18] the role of water content [14] and the aging time [5]
Temperature
The preparation of continuous zeolite coatings is related to two competing phenomena
occurring on the surface nucleation and crystal growth The thickness of the zeolite coating
may be decreased in the case where a higher number of smaller crystals growing on the unit
surface of the substrate are available In this respect temperature may be a significant factor
for the property of the coating prepared
Puil et al [1] prepared samples coated in zeolite beta by a hydrothermal method for 18 h at
155ordmC The autoclaves were then cooled to room temperature in air and the solids recovered
by filtration washed and dried at 120ordmC before the coated particles were removed by a 500
μm sieve The samples were then suspended in water and treated ultrasonically for 2-4 h to
120
remove any lsquoloosersquo crystals after which the samples were again filtered dried sieved and
calcined at 550ordmC for 12 h The ion-exchange was carried out in aqueous 01 M NH4Cl at room
temperature for 24 h followed by drying at 120ordmC and calcining at 550ordmC They reported after
calcination and ion-exchange the supported zeolite beta coatings show activity in the reaction
The activity is similar to the intrinsic activity of commercial zeolite β samples
Cetin et al [8] reported that the temperature affected the thickness of the zeolite 4A layers They
found the thickness of closed zeolite 4A layers may be decreased at relatively lower synthesis
temperatures when relatively longer synthesis times are employed They suggested the possible
reason might be that the rate of nucleation being less temperature sensitive than the rate of
crystal growth Zeolite 4A coatings of 1 and 07 μm thickness have been prepared on quartz
and stainless steel substrates respectively at 45ordmC No subsequent calcination of the material
was reported in the paper
In 2005 Andac et al [9] successfully carried out the zeolite A hydrothermal crystallization on
stainless steel plates at temperatures of 50ordmC and 60ordmC for various periods of time ranging from
2 to 15 h by using a heater and a temperature controller The experiment was carried out in an
ultrasonic water bath And then the product was filtered using a filter paper with fine mesh size
The filtrate was then refiltered through a 01 μm PVDF membrane before washing thoroughly
with deionized water and drying overnight in an oven at 65ordmC
Ultrasound
Use of ultrasound in polymer synthesis is known to be helpful in providing rate and yield
enhancements In the zeolite coating synthesis the effect of ultrasound was reported by a few
121
researchers [1 9 18] leading to a conclusion that the ultrasonic irradiation leads to acceleration
of crystallization of zeolite coating and some other benefits For example Andac et al [9]
reported that in the presence of ultrasound the thickness of the zeolite A coatings on stainless
steel plates could be decreased from about 15 μm to about 06 μm and a closed layer was
obtained after 3 h of synthesis instead of 10 h at 60ordmC The final roughness value was also
smaller for the coating prepared in the presence of ultrasound
This phenomenon is likely to be due to an increase in the nucleation rate resulting in a higher
number of particles forming on the substrate at earlier synthesis times in the presence of
ultrasound Hence with the ultrasound lower temperature and shorter times than with the
conventional preparation method can be expected
Water Content
Kalipcilar et al [14] found a relationship between the water content in the synthesis solutions
and the thickness of the coating formed They carried out the synthesis of silicalite layers on α-
Al2O3 disks with a molar batch composition of 65Na2O25SiO2xH2O69TPABr (69 g silicic
acid 79 g TPABr) by varying the water content from 500 to 2000 miles at 200ordmC They found
that the silicalite layer which was synthesized from the most concentrated batch was formed
from crystals with an average size of 100 μm and a thickness of 36 μm And the layer thickness
and average crystal size decreased to about 8 and 7 μm respectively when the batch containing
1400 miles of water was used As shown in Figure 63 the continuity of the layer and the
crystal size was improved as the water content of the batch was increased from 500 to 1136
miles and decreased on further dilution of the batch to 1400 and 2000 miles
Gavalas et al [19] investigated the effect of the batch composition on the properties of ZSM-
122
5 layers on non-porous and porous α-Al2O3 supports They found the dilution of the
crystallization solution led to a partial coverage of the surface and poor growth of the crystals
under the surface
Sterte et al [20] observed that decreasing amounts of water in the clear crystallization solution
resulted in the formation of a continuous film Thin oriented silicalite-1 films with thicknesses
in the range of 180 nm to 1 μm have been obtained by varying the contents of the reaction
mixture
Figure 63 Surface SEM images of silicalite-1 layers synthesized from the batch with a
molar composition 65Na2O25SiO2xH2O69TPABr at 200ordmC (a) 500 mol (b) 800 mol
(c) 1136 mol and (d) 1400mol
123
Calcination Rate
In an early work of preparation of MFI membranes [21] it has been recommended that
calcination of supported MFI membranes should be carried out in air at a maximum
temperature of 400ordmC with a low heating rate of 1 ordmCmin However no particular reason for
using a low rate was given
Hedlund et al [22] that thin silicalite-1 films on asymmetric α-Al2O3 can be calcined at 500ordmC
with a heatingcooling rate as high as 5ordmCmin without reducing the membrane quality They
also reported that films with different microstructure thickness and on other types of supports
may behave differently
Aging the solution
The formation of zeolite coatings and their properties such as the thickness continuity and
orientation of the crystals are related to the presence and macro-organization of a precursor
phase Based on this view preshaped zeolite coatings can be prepared
Gora et al [5] especially emphasized the effect of aging in their report for the zeolite synthesis
In the experiment the aluminosilicate gel was aged for 385h at 25 ordmC The solution was shown
to be very effective as an initiator for nucleation They found addition of even 27 of the
solution to a reaction mixture (10Na2O 02Al2O31SiO2200H2O) increased the nucleation rate
considerably which means that aging the solution could accelerate the coating speed
634 Deactivation
Deactivation is a problem for all the catalysts Due to the structure of the zeolite catalyst coking
124
is the most common reason for the deactivation However in research on a silicalite-1 coating
Nishiyama et al [17] reported that the deactivation of the coated catalyst was reduced
compared with the uncoated one They regarded the reason probably to be the protection
against poisoning impurities in the feed
64 Experimental
641 Preparation of coated catalysts
From the literature survey it can be concluded that the hydrothermal method is the most
common way to prepare zeolite coatings which was also the method taken in this project
However the hydrothermal method can be divided into several kinds of different methods
depending on the exact preparation procedure According to the coating steps the hydrothermal
method can be divided into a direct synthesis method and a secondary synthesis method (the
seeding method) according to the batch composition it can be divided into the normal method
(with template) and the template-free method Different preparation methods have been
attempted in this project as the research developed The preparation methods of coated catalysts
have been improved subsequently also with different metal active centres powdersphere
supports and zeolite membranes The tested samples in this project have been listed in Table
63
The details of synthesis and characterization for each sample are discussed in the following
sections in chronological order
125
Table 63 List of synthesized zeolite coating samples
Zeolite coating type Substrate catalyst
theoretical wt loadings
Support type
Zeolite A SiO2
HCl treated SiO2
5 wt AuSiO2
MgO
α-Al2O3
γ-Al2O3
SiO2 powder
MgO powder
SiO2 spheres
α-Al2O3 spheres
γ-Al2O3 spheres
Silicalite-1 3 wt Auγ-Al2O3 γ-Al2O3 spheres
ZSM-5 01 wt Rhα-Al2O3
01 wt Auα-Al2O3
α-Al2O3 spheres
Zeolite XY SiO2 SiO2 spheres
6411 Zeolite A coated samples with silica powder support
Powder form silica support was employed at the beginning of the coating attempts unlike many
of the literature reports of coatings where extended solids such as rod and sphere supports were
used The synthesis of 5 wt AuSiO2 has been discussed in Chapter 4 The corresponding
coated samples (coated SiO2 coated HCl SiO2 and coated AuSiO2) were prepared in two steps
Preparation the substrate catalysts
To make a comparison three kinds of substrate catalysts (SiO2 HCl treated SiO2 and 5 wt
AuSiO2 ) were coated Among them the HCl treated SiO2 and AuSiO2 were prepared with the
SiO2 support (silica powder Grace gt99 60-100 mesh) and dilute HCl solution
HAuCl4middot3H2O solution respectively by the incipient wetness method The dilute HCl solution
should be adjusted to the same pH value with the HAuCl4middot3H2O solution Using the 5 wt
AuSiO2 as an example to prepare 1 g 5 wt AuSiO2 095 g SiO2 powder was impregnated
by a solution with 01 g HAuCl4middot3H2O The samples were dried in the 110degC oven and then
calcined at 400 degC for 3 h at a heating rate of 20degC min
126
Synthesis of the zeolite A coatings
Substrate catalysts were washed with 01 M HCl in an ultrasonic bath for 20 min and then
washed again with deionised water before drying at 110degC overnight Then a zeolite solution
with the batch composition tetraethyl orthosilicate (TEOS) (Aldrich) Al2(SO4)3 (Aldrich)
NaOH H2O was made The molecular ratio is 80SiO21Al2O310Na2O1500H2O The solution
was stirred for three hours before being mixed with the substrate and placed into autoclaves
The autoclaves were heated at 180degC for 24 h Finally the products were washed in deionized
water in the ultrasonic bath and dried at 110degC overnight
At the same time in order to test if the catalysts still remain active after being treated in this
way the catalysts were treated in the same manner as the coating procedure but without the
coating solution The products with coating solution are called the lsquocoated productsrsquo while the
products without coating solution are called the lsquotreated productsrsquo in the following section
6412 Zeolite 4A coated samples with sphere supports
Silica spheres (Saint-Gobain diameter 32 mm surface area 025 m2g) and alumina (Saint-
Gobain surface area 075 m2g) spheres have been employed in the synthesis The AuSiO2
and AuAl2O3 spheres were prepared by a vacuum incipient wetness method The zeolite 4A
coatings have been synthesized following the method reported by Collier et al [2] 5 g of 5
wt AuSiO2 spheres or alumina spheres were added to a 5 wt solution of the
polyelectrolyte Two kinds of polyelectrolyte have been tested polydiallyl dimethyl
ammonium chloride and 2-propen-1-ammonium NN-dimethyl-N-2-propenyl chloride
(magnafloc lt35) containing dilute ammonia and stirred at room temperature for 20 minutes
The spheres were subsequently separated from the solution and washed with demineralized
127
water and then added to a zeolite solution which was prepared with rapid addition and stirring
The solution contained 607 g sodium aluminium oxide (Alfa Aesar) in 52 g demineralized
water to a solution of 1551 g sodium metasilicate (Alfa Aesar anhydrous) in 52 g
demineralized water The mixture containing the spheres was stirred at room temperature for
2 hours and then hydrothermally crystallized at 100degC for 24 hours Finally the zeolite-coated
spheres were separated from the crystallization solution and washed with demineralized water
dried at 105degC and then calcined in air at 500degC for 2 hours
6413 Silicalite-1 coating with sphere supports
1 wt and 3 wt Rhα-Al2O3 Rhγ-Al2O3 Ruγ-Al2O3 were prepared by the incipient
wetness method and deposition precipitation (DP) method separately The incipient wetness
method was carried out as previously reported in Chapter 4 Taking the 1 wt Rhγ-Al2O3
as an example to prepare 1 g 1 wt Rhγ-Al2O3 099 g γ-Al2O3 had a solution of 0025 g
RhCl3middotxH2O (Alfa Aesar) added The water content was predetermined and was that required
to form a paste with the alumina support The paste was dried overnight at 110degC and then
calcined at 400degC for 3 h The DP preparation was performed as follows (taking the 3
wtRhγ-Al2O3 as an example) to prepare 1 g 3 wt Rhγ-Al2O3 099 g γ-Al2O3 was first
dispersed in an aqueous solution of 0075 g RhCl3middotxH2O A quantity of 1 M Na2CO3 was slowly
added to the RuCl3 solution until the pH value of the mixture reached 105 The suspension was
then maintained at the same pH for 1 h during the precipitation process The resulting solid
was washed with deionized water several times until no chloride ion was detected by silver
nitrate solution in the filtrate All the catalysts were dried at 110degC (12 h) in air Finally they
were calcined at 500degC for 5 h in air [23] Alumina (Saint-Gobain surface area 025 m2g)
spheres have also been tested
128
The vacuum incipient wetness method was employed in the preparation of sphere catalysts To
prepare 1g catalyst 1 g alumina spheres were placed into a sealed two neck round bottom flask
The flask was heated to 80degC with an oil bath and connected to a vacuum pump for 1 h The
calculated amount of metal solution was added into the flask through a syringe The flask was
shaken until all the metal solution was absorbed into the spheres The spheres were then dried
at 110degC overnight before calcination at 400degC for 3 h
Coatings have been applied to AuAl2O3 and RhAl2O3 based spheres The silicalite-1 precursor
solution consisted of TEOS (98 Aldrich) tetraprophylammonium hydroxide (TPAOH) (1
M solution in water Aldrich) ethanol (EtOH) (Fluka) and deionized water with the molar
ratios of 05TPAOH 120H2O 8EtOH 2SiO2 Approximately 10 g of catalyst sphere was
immersed in 15 g of the precursor solution The crystallization was carried out under
hydrothermal conditions at 180degC for 24 h in a stainless steel vessel with agitation The coating
procedure was repeated twice The products were rinsed repeatedly with deionized water
separated by filtration and dried at 90degC overnight then calcined in air at 600degC for 5 h with a
heating rate of 1degCmin [24]
6414 ZSM-5 coating with α- and -Al2O3
Synthesis of ZSM-5 coatings on both α- and -Al2O3 was attempted Synthesis were carried
out in Teflon-lined 60 ml autoclaves Teflon liners were cleaned before and after each synthesis
in NaOH solution for 24 h under the synthesis conditions Supports were cleaned by boiling in
toluene for 1 h and dried overnight at 110degC before being immersed in the zeolite precursor
solution The zeolite precursor solution was prepared by adding tetrapropylammonium
hydroxide (TPAOH Aldrich 1 M solution in water) sodium aluminate (NaAlO2 Aldrich Al
129
50-56) to tetraethyl orthosilicate (TEOS Aldrich 98) in a PTFE beaker The molar ration
of the precursor solution was 1 Al2O3 40 SiO2 10 TPAOH 800 H2O
The precursor solution was stirred for 10 h at room temperature as an aging process before
filling the autoclaves In all experiments 1 g of support was added to the autoclaves The
volume of precursor solution was varied (32 ml or 15 ml) to observe the influence of the amount
of precursor Syntheses were carried out at 160degC for 24 h Then the coated samples and the
extra synthesized powder for the same batch were washed with deionized water and dried
overnight at 110degC Finally the samples were calcined at 550degC for 12 h using a heating rate
of 5degCmin
642 Reaction conditions
The reaction conditions taken for the powder form catalysts in this project usually are 15 bar
O2 600 rpm 110degC 10 g n-decane and 005 g catalyst Therefore the zeolite A coated SiO2
HCl treated SiO2 and 5 wt AuSiO2 were tested under the same conditions
With the sphere supports the reaction system was adjusted They have been tested both in
stainless steel autoclaves and the Andrews glass reactor according to Iglesiarsquos work [25] In
addition as a single sphere is much heavier (eg the mass of a single silica sphere asymp 009g)
than the catalysts used in the previous reactions (005g in each reaction) in the experiment 1
g sphere catalysts have been used in each reaction at 110degC Other conditions used in the
stainless steel reactor are the same as before 15 bar O2 60 0rpm and 10 g n-decane In the
Andrews glass reactor the conditions are 3 bar O2 600 rpm and 25 ml n-hexane
130
643 Characterization
In the coating experiments the weight of the samples before and after coating was recorded to
determine the coverage of the coatingm2 support
The uncoated and coated spheres were crushed into powders to perform XRD analysis XRD
patterns of both the supports and the coated samples were analysed by a PANanlytical Xrsquopert
MPD X-ray diffractometer with a monochromatic CuKa source at 40 KeV and 40 mA The
morphology of the coated spheres was analysed by a Zeiss Evo-40 series scanning electron
microscopy EDX mapping was carried out by the same instrument in conjunction with an
INCAx-sight EDX detector Reaction samples were analysed by gas chromatography with a
CP Wax 52CB column 25 m 053 mm 20 microns using a programmed temperature ramp
Each sample was injected at least twice
65 Results
651 Zeolite A coating with powder support
Coating of SiO2 and MgO based catalysts was attempted using the direct template-free method
in which powder form SiO2 and MgO supports were employed It is important to ascertain the
effects of treatment on the bulk catalyst Hence the lsquotreatedrsquo catalysts were tested in this section
as well As the SiO2 based catalysts works better in the liquid phase while the MgO based
catalysts proved to be more active in the gas phase the coated and treated SiO2 and MgO based
catalysts were separately tested in the corresponding phase
6511 Coated SiO2 in liquid phase reaction
The SiO2 based catalysts were analysed by the BET XRD SEMampEDX before testing in
131
reactions
BET
When studying the data on surface area (Table 64) it is quite obvious that after being coated
the surface area of the sample is dramatically reduced There is also a slight increase in the
surface area of the samples when treated but not coated SEM images have been taken to check
the morphology of the samples and to see if reasons can be ascribed for the changes in surface
area
Table 64 BET results for the SiO2 based catalysts
Catalysts Surface Area(m2 g-1)
SiO2 268
HCl SiO2 277
AuSiO2 255
Coated SiO2 14
Coated HCl SiO2 7
Coated AuSiO2 6
Treated SiO2 270
Treated HCl SiO2 286
Treated AuSiO2 315
SEM amp EDX
According to the SEM images (Figure 64) it can be seen that both the untreated catalysts and
the treated catalysts show similar morphologies under the microscope The coated samples
present a much different morphology clearly showing a roughened overlayer both attached to
the large macroscopic particles and also unattached and separate For the coated SiO2 catalyst
(Figure 64 b) it can be seen that the coating does not cover the whole surface and a large
presence of the smoother SiO2 support is visible In contrast following acid and disposition of
gold (Figure 64 e and h) the covering seems more complete although there is clearly still a
132
large amount of unattached coating present The Au particle distribution on the support is clear
shown in the BSD detector in Figure 65
(a) SiO2 (b) Coated SiO2 (c) TreatedSiO2
(d) HCl SiO2 (e) Coated HCl SiO2 (f) Treated HCl SiO2
(g) AuSiO2 (h) Coated AuSiO2 (i) Treated AuSiO2
Figure 64 Comparison of SEM Images of the SiO2 Catalysts
Each image is approximately 550 μm wide
133
Figure 65 Au particles in BSD detector
Compared with the coated catalysts it was known the surface area had been massively
decreased with the addition of the coating so it was expected that at a high magnification image
a difference should be observed This is indeed the case (Figure 66) with the untreated silica
presenting a smooth appearance while the surface of the coated samples show a large degree
of roughness It is likely that the surface area decrease is caused by the coating blocking a large
amount of the pore structure of SiO2
(a) SiO2 (b) Coated SiO2
=
Figure 66 Surface of the uncoated and coated SiO2 samples
According to the EDX results (Table 65) the treated AuSiO2 appeared to show a decrease in
the Au present which probably means that the Au was lost in the treatment (most likely in the
134
ultrasonic bath) However in the SEM image of the treated AuSiO2 sample Au particles can
still be observed (Figure 67 b) And the Au particles look less in number and smaller in size
than before treatment (Figure 67 a) Therefore it is suggested that the apparent loss of Au
might due to both the loss during the treatment and the detector limitation
The EDX results (Table 65) also show that the coating contains an amount of sodium (except
the coated SiO2) and that the coating is sufficiently thick and complete to mean that no gold is
observed from under the coating Importantly no aluminium is detected showing the formed
coating is not a zeolite but instead silica
Table 65 EDX results for SiO2 based Catalysts
Catalysts O (Weight ) Si (Weight) Other Element
(Weight)
SiO2 625 375 0
HCl SiO2 618 382 0
AuSiO2 598 362 Au 40
Coated SiO2 642 358 0
Coated HCl SiO2 638 335 Na 27
Coated AuSiO2 620 357 Na 23
Treated SiO2 610 390 0
Treated HCl SiO2 614 386 0
Treated AuSiO2 622 374 Au 04
(a)AuSiO2 (b) Treated AuSiO2
Figure 67 Au particles on the AuSiO2 and treated AuSiO2 with the BSD detector
135
XRD
Examining the bulk of the catalysts by XRD shows only two observable phases for all the
catalysts These are an amorphous silica and gold (in the relevant samplesFigure 68) There
are no changes observed by the addition of the coating which could mean it is too small to be
observed or it may be amorphous in nature The large gold particles observed in the SEM are
also confirmed by the XRD data where highly defined sharp peaks are observed
Figure 68 XRD Analysis for the SiO2 based catalysts
o - SiO2 peak x ndash Au peak
Liquid Phase Reactions
To check if the SiO2 based catalysts are still active after being treated the treated SiO2 based
catalysts were tested in reactions (Figure 69-Figure 611 Table 66-Table 68) According to
the results below after being treated in the coating procedure the catalysts still remain active
136
Figure 69 24 h 110ordmC 600 rpm 15 bar Oxygen 10 g n-decane
005 g Treated SiO2
Table 661 24 h 110ordmC 600 rpm 15 bar Oxygen 10g n-decane 005g Treated SiO2
Catalyst Conv
()
Selectivity ()
54
one
3
one
2
one
54
ol
3
ol
2
ol
1
ol
C5
OOH
C6
OOH
C7
OOH
C8
OOH
C9
OOH
C10
OOH
Treated
SiO2 128 250 160 170 64 40 59 09 90 73 52 10 01
23
C10 Terminal selectivity = 09+23 = 32
Cracked Acid selectivity = 90 + 73 + 52 + 10 + 01= 226
137
Figure 610 24 h 110ordmC 600 rpm 15 bar Oxygen 10 g n-decane
005 g Treated HCl SiO2
Table 67 24 h 110ordmC 600 rpm 15 bar Oxygen 10g n-decane 005 g Treated HCl SiO2
Catalyst Conv
()
Selectivity ()
54
one
3
one
2
one
54
ol
3
ol
2
ol
1
ol
C5
OOH
C6
OOH
C7
OOH
C8
OOH
C9
OOH
C10
OOH
Treated
HCl SiO2 204 229 150 160 73 46 65 09 97 83 51 11 02
22
C10 Terminal selectivity = 09+22 = 31
Cracked Acid selectivity = 97 + 83 + 51 + 11 + 02= 244
138
Figure 611 24 h 110ordmC 600 rpm 15 bar Oxygen 10 g n-decane
005 g Treated 5 wtAuSiO2
Table 68 24 h 110ordmC 600 rpm 15 bar Oxygen 10 g n-decane 005 g Treated
5 wt AuSiO2
Catalyst Conv
()
Selectivity ()
54
one
3
one
2
one
54
ol
3
ol
2
ol
1
ol
C5
OOH
C6
OOH
C7
OOH
C8
OOH
C9
OOH
C10
OOH
Treated
AuSiO2 179 253 156 173 62 39 63 10 85 68 55 09 03 23
C10 Terminal selectivity = 10+23 = 33
Cracked Acid selectivity = 85 + 68 + 55 + 09 + 03= 220
Then the three coated catalysts were tested and results for them are given below (Figure 612
to Figure 614 Table 69 to Table 611) And the results are compared in Table 612
139
Figure 6121 24 h 110ordmC 600 rpm 15 bar Oxygen 10g n-decane
005 g Coated SiO2
Table 69 24 h 110ordmC 600 rpm 15 bar Oxygen 10 g n-decane 005 g Coated SiO2
Catalyst Conv
()
Selectivity ()
54
one
3
one
2
one
54
ol
3
ol
2
ol
1
ol
C5
OOH
C6
OOH
C7
OOH
C8
OOH
C9
OOH
C10
OOH
Coated
SiO2 351 201 126 143 97 61 87 13 94 76 62 12 05
23
C10 Terminal selectivity = 13+23 = 36
Cracked Acid selectivity = 94 + 76 + 62 + 12 + 05= 249
140
Figure 613 24 h 110ordmC 600 rpm 15 bar Oxygen 10 g n-decane
005 g Coated HCl SiO2
Table 610 24 h 110ordmC 600 rpm 15 bar Oxygen 10 g n-decane 005 g Coated HCl
Treated SiO2
Catalyst Conv
()
Selectivity ()
54
one
3
one
2
one
54
ol
3
ol
2
ol
1
ol
C5
OOH
C6
OOH
C7
OOH
C8
OOH
C9
OOH
C10
OOH
Coated
HCl SiO2 479 196 122 143 93 60 82 13 107 84 60 14 04
21
C10 Terminal selectivity = 13+21 = 34
Cracked Acid selectivity = 107 + 84 + 60 + 14 + 04= 269
141
Figure 614 24 h 110ordmC 600 rpm 15 bar Oxygen 10 g n-decane
005 g Coated AuSiO2
Table 611 24 h 110ordmC 600 rpm 15 bar Oxygen 10 g n-decane 005 g Coated AuSiO2
Catalyst Conv
()
Selectivity ()
54
one
3
one
2
one
54
ol
3
ol
2
ol
1
ol
C5
OOH
C6
OOH
C7
OOH
C8
OOH
C9
OOH
C10
OOH
Coated
AuSiO2 471 206 117 134 94 58 83 14 107 86 61 14 04
20
C10 Terminal selectivity = 14+20 = 34
Cracked Acid selectivity = 107 + 86 +61 + 14 + 04 = 272
142
If a good zeolite coating is formed outside the catalysts the activity of the catalysts will be
limited However with the current coating the conversion became higher than before (Table
612) while the product distribution of the systems remained similar To this extent it seems
that the coating may be promoting the reaction by acting as a radical initiator The catalysts
with the highest activity (Coated HCl SiO2 and coated AuSiO2) were then tested in the
presence of TEMPO to try to scavenge the radical reaction (Figure 615 and Figure 616)
Table 612 Compare the SiO2 Based Catalysts
Catalyst Conv
()
Selectivity ()
54
one
3
one
2
one
54
ol
3
ol
2
ol
1
ol
C5
OOH
C6
OOH
C7
OOH
C8
OOH
C9
OOH
C10
OOH
SiO2 161 269 164 188 52 36 48 08 70 64 58 13 01
28
AuSiO2 242 224 145 167 55 47 70 10 87 78 67 18 02
29
Treated
SiO2 128 250 160 170 64 40 59 09 90 73 52 10 01
23
Treated
HCl SiO2 194 229 150 160 73 46 65 09 97 83 51 11 02
22
Treated
AuSiO2 179 253 156 173 62 39 63 10 85 68 55 09 03
23
Coated
SiO2 351 201 126 143 97 61 87 13 94 76 62 12 05
23
Coated
HCl SiO2 479 196 122 143 93 60 82 13 107 84 60 14 04
21
Coated
AuSiO2 471 206 117 134 94 58 83 14 107 86 61 14 04
20
143
Figure 615 24 h 110ordmC 600 rpm 15 bar Oxygen 10 g n-decane 005 g
Coated HCl SiO2 0005 g TEMP
Table 613 24 h 110ordmC 600 rpm 15 bar Oxygen 10 g n-decane 005 g Coated HCl SiO2
0005g TEMPO
Catalyst Conv
()
Selectivity ()
54
one
3
one
2
one
54
Ol
3
ol
2
ol
1
ol
C5
OOH
C6
OOH
C7
OOH
C8
OOH
C9
OOH
C10
OOH
Coated
HCl SiO2+
TEMPO 055 200 137 164 69 46 70 15 105 69 83 12 02
27
C10 Terminal selectivity = 15+27 = 42
Cracked Acid selectivity = 105 + +69 +83 + 12 + 02= 271
144
Figure 616 24 h 110ordmC 600 rpm 15 bar Oxygen 10 g n-decane 005 g Coated AuSiO2
0005 g TEMPO
Table 614 24h 110ordmC 600 rpm 15 bar Oxygen 10g n-decane 005g Coated AuSiO2
0005g TEMPO
Catalyst Conv
()
Selectivity ()
54
one
3
one
2
one
54
Ol
3
ol
2
ol
1
ol
C5
OOH
C6
OOH
C7
OOH
C8
OOH
C9
OOH
C10
OOH
Coated
AuSiO2
+TEMPO 022 173 126 180 94 62 92 14 111 53 72 06 04
14
C10 Terminal selectivity = 14 + 14 = 28
Cracked Acid selectivity = 111 + 53 + 72 + 06 + 04= 246
Only very slight differences in product distribution was found between the reactions with and
without TEMPO (Table 615) which are within experimental error It is interesting to note
though that the coated acid-treated SiO2 catalyst is the most active observed in the presence of
TEMPO compared to the previous best of 045 for AuTiO2 while pure SiO2 was inactive
145
in the presence of TEMPO This shows that either the acid treatment or the coatings are helping
to promote activity
Table 615 Compare the results with and without TEMPO
Catalyst Conv
()
Selectivity ()
54
one
3
one
2
one
54
Ol
3
ol
2
ol
1
ol
C5
OOH
C6
OOH
C7
OOH
C8
OOH
C9
OOH
C10
OOH
Coated
HCl SiO2
+TEMPO 055 200 137 164 69 46 70 15 105 69 83 12 02
27
Coated
HCl SiO2 479 196 122 143 93 60 82 13 107 84 60 14 04
21
Coated
AuSiO2+
TEMPO 022 173 126 180 94 62 92 14 111 53 72 06 04
14
Coated
AuSiO2 471 206 117 134 94 58 83 14 107 86 61 14 04
20
A time-on-line study was then carried out to further investigate the activity of the coated
samples The comparison of results was shown in Figure 617 to Figure 619The three SiO2
coated catalysts coated SiO2 coated HCl SiO2 and coated AuSiO2 have been tested time on-
line without and with TEMPO The conversion and terminal selectivity (C10 terminal
selectivity and cracked acids selectivity) without and with TEMPO are compared
146
Figure 617 Coated SiO2 and coated SiO2 with TEMPO
Figure 618 Coated HCl SiO2 and coated HCl SiO2 with TEMPO
Figure 619 Coated AuSiO2 and coated AuSiO2 with TEMPO
147
6512 Discussion
It can be seen that both conversion and selectivity for the reformation of shortened acids are
quite different between the reactions without and with TEMPO Though the conversion with
TEMPO is much reduced (as would be expected) the selectivity for shortened acids is higher
(typically ~10) than when TEMPO is not present The presence of increased selectivity for
shortened acids seems to be at the expense of C10 ketones while little difference is seen in the
C10 terminal selectivity
The results both in the presence and absence of TEMPO show a considerable induction period
with a large increase in conversion only occurring after 16 hours of time on line This is similar
to work previously reported on the autoxidation of n-decane
In the presence of TEMPO the three coated samples have little difference in both conversion
and selectivity From this it is suggested that in these reactions the activity is due to the SiO2
overlayer more than the catalyst underneath
In order to test the activity of the coating formed the coated MgO catalysts were also tested in
liquid phase under the same conditions to make a comparison
6513 Coated MgO in gas phase reaction
MgO based Catalysts were analysed and tested in gas phase reactions discussed in this section
BET
It is found in Table 616 that after being coated or treated the surface area increased The
situation is a little different from the SiO2 samples To have a good understanding of this the
148
structure of the catalyst particles are shown in the SEM images (Figure 620)
Table 616 BET results for the MgO based catalysts
SEMampEDX
According to the Figure 620 it can be found that before the treatment the blank catalysts are
in very small particles after being treated the particles maintain their original size however
some become stuck together to form large macroscopic particles (images c f i)
In a higher magnification image of the MgO without any treatment (Figure 621 a) and coated
MgO (Figure 621 b) Obviously both the size and surface properties are quite different from
SiO2 crystals And it can be clearly seen that something is covering the MgO substrate The
formed coating composition is discussed in the following XRD and XPS section
Catalysts Surface Area(m2g)
MgO 98
HCl MgO 74
AuMgO 51
Coated MgO 39
Coated HCl MgO 110
Coated AuMgO 169
Treated MgO 134
Treated HCl MgO 112
Treated AuMgO 120
149
(a) MgO (b) Coated MgO (c) Treated MgO
(d) HCl MgO (e) Coated HCl SiO2 (f) Treated HCl SiO2
(g) AuMgO (h) Coated AuMgO (i) Treated AuMgO
Figure 620 Comparison of SEM Images of MgO Based Catalysts
Each image is approximately 550 μm wide
(a) MgO (b) Coated MgO
Figure 621 SEM images of MgO and Coated MgO with a higher magnification
150
Table 617 EDX results for MgO Based Catalysts
Catalysts O
(Weight )
Mg
(Weight)
Si
(Weight)
Other Element
(Weight)
MgO 508 483 0 Ca 084
HCl MgO 465 521 0 Cl 08 Ca 06
AuMgO 485 466 0 Cl 13 Ca 08 Au 28
Coated MgO 590 59 350 0
Coated HCl
MgO
604 309 87 0
Coated AuMgO 614 222 165 0
Treated MgO 623 377 0 0
Treated HCl
MgO
628 372 0 0
Treated
AuMgO
612 358 0 Au 30
In the untreated blank catalysts some Cl and Ca are found which corresponds with impurities
in the magnesium carbonate (The starting material for the production of MgO) They disappear
in the coated and treated samples which is likely to be due to the treatment by ultrasonic bath
and washing It is clear that the OMg ratio is quite different among the original MgO based
catalysts the coated catalysts and the treated catalysts If the increase of O ratio in the coated
samples only comes from the coating formed it would not be expected that the treated samples
would also observe the O ratio increase This will be discussed with the XRD results together
below
As above the EDX analysis found the treated AuSiO2 lost some Au (Au became only 04
after being treated) but this did not occur with the treated AuMgO It is suggested that this is
due to the different surface properties ndash as shown in the SEM the SiO2 support we employed
151
has a very smooth surface It is also noticeable that again that the gold is no longer observed
once the coating has been laid down
Again no aluminium was observed after this preparation so further analysis was taken with
XPS to test if the concentration of aluminium is only in the surface region
XPS
A small amount coated MgO sample was analysed in the XPS with the elements seen below
along with their binding energies (Table 618) As is visible from the data there is a large
presence of silicon but no aluminium is observed again showing the coating to be more silica-
like in nature The low level of magnesium detected suggests that the coating is relatively thick
(gt5 nm)
Table 618 Binding Energy of the Detected Element
Detected Element Binding Energy (eV) Approximate Composition (Atom )
O 5329 543
C 2847 102
Si 1036 338
Mg 499 13
Ca ~350 05
XRD
From the XRD results (Figure 622) we can clearly distingush the MgO and Au peaks (circles
and crosses resectively) in the untreated and coated samples However for the coated and
treated catalysts there are some other peaks in the figure which are unmarked A simple search
and match on this data suggests that the treaments impossed have led to a bulk hydroxylation
and the formation of Mg(OH)2 This explains the O increase in the treated MgO samples as
seen by EDX (Table 617) Again the gold peaks observed by XRD are very sharp showing the
152
presence of relatively large gold particles and no bulk structure is found for the coating
Figure 622 XRD Analysis for MgO Based Samples
o ndashMgO x - Au
153
Coated MgO in liquid phase reaction
MgO based catalysts were tested in the liquid phase reaction as shown in Table 619
Table 619 24 h 110ordmC 600 rpm 15 bar Oxygen 10 g n-decane 005 g Catalyst
Catalyst Conv
()
Selectivity ()
54
one
3
one
2
one
54
Ol
3
ol
2
Ol
1
ol
C5
OOH
C6
OOH
C7
OOH
C8
OOH
C9
OOH
C10
OOH
MgO 162 211 145 175 71 48 85 18 67 61 86 08 04
19
HCl
MgO 040 194 119 163
10
4 73
14
3 25 44 52 56 02 12
12
AuMgO 138 215 155 200 94 65
13
7 23 26 24 36 13 06
06
Coated
MgO 165 232 150 160 85 54 74 11 74 59 56 14 06
24
Coated
HCl
MgO 060 205 156 148 87 55 78 21 113 80 31 08 03
15
Coated
AuMgO 147 206 131 141 89 56 84 15 99 82 64 08 01
24
The high conversion that was observed for the coated SiO2 based catalysts was not observed
this time This is somewhat surprising as previously it appeared that the coating was promoting
the reaction but may be explained by the different nature of the coating In the next section the
coating on the MgO samples is analysed and it can be seen that no sodium is present (Table
617) unlike the SiO2 coated samples (Table 612)
Coated MgO in Gas Phase Reaction
Both the coated and treated MgO samples have been tested in the gas phase reactions (Table
620 to Table 624)
154
Table 620 Conversions obtained with different catalysts in the gas phase reactor when
varying the CO ratio
Catalyst Temp
(degC)
CO Conv
()
Cracked Decene C10
oxygenates
COx
MgO 318 141 27 97 1 00 2
MgO 318 71 17 97 1 00 2
AuMgO 275 141 11 96 1 00 3
AuMgO 275 71 08 97 1 00 1
Table 621 N2O oxidant 141 CO 089 n-decane 133 s residence time
Catalyst Temp
(degC)
X Cracked Decene C10
alcoholketones
CO
Coated MgO 239 03 76 52 00 19
282 04 84 43 00 11
305 06 94 24 00 4
327 13 96 14 02 2
Coated Acid
MgO
211 01 52 261 00 22
253 02 59 109 00 30
275 04 57 44 00 39
295 06 91 32 00 6
Coated
AuMgO
210 09 84 13 00 15
250 25 93 06 06 6
270 22 94 07 16 4
290 32 92 12 11 5
155
Table 622 - O2 oxidant 141 CO 089 n-decane 133s residence time
Catalyst Temp
(degC)
X Cracked Decene C10
alcoholketones
CO
Coated MgO 237 02 77 63 00 16
259 06 72 25 00 26
282 09 79 25 00 19
307 15 87 14 02 11
326 25 89 08 06 9
Coated Acid
MgO
209 01 70 177 00 13
230 02 78 84 00 13
251 04 83 59 00 11
275 06 94 00 00 6
293 20 94 16 03 4
Coated
AuMgO
208 05 41 25 00 57
229 04 93 24 00 5
249 11 71 07 00 28
270 20 85 21 06 12
295 37 97 27 02 0
Table 623 N2O oxidant 141 CO 089 n-decane 133 s residence time
Catalyst Temp
(oC)
X Cracked Decene C10
alcoholketones
CO
Treated MgO 238 03 90 49 00 5
260 09 96 16 00 2
282 19 97 08 05 1
306 47 97 07 03 2
329 84 97 06 09 1
Treated acid MgO 209 01 70 217 00 8
229 03 91 50 00 4
248 08 94 18 03 4
270 24 98 06 04 1
288 65 99 05 03 1
Treated AuMgO 211 05 94 29 00 3
249 11 91 14 00 8
252 23 95 07 00 5
274 48 97 04 01 2
294 95 97 02 02 2
156
Table 624 O2 oxidant 141 CO 089 n-decane 133 s residence time
Catalyst Temp
(oC)
X Cracked Decene C10
alcoholketones
CO
Treated MgO 238 08 90 35 00 7
260 17 90 22 13 6
283 31 94 29 22 1
304 47 92 26 29 2
Treated acid MgO 208 04 81 49 00 14
228 08 85 108 09 4
247 18 87 53 25 5
266 31 87 35 30 7
286 34 90 30 39 3
Treated AuMgO 212 11 87 14 00 12
232 26 87 08 00 13
252 46 91 13 01 8
274 70 92 13 02 7
293 82 93 13 05 6
6514 Discussion
The XRD results of MgO-based catalysts were quite similar to that of the SiO2-based catalysts
in which only the peaks of SiO2 substrate were detected for the coated samples Thus it can be
concluded the coating formed in the direct template-free method is perhaps some amorphous
SiO2 which according to the SEM images covered the substrates to an extent where the gold
was no longer observed by EDX Although the coating is probably SiO2 it is unlikely the
coatings formed on the SiO2 and MgO are the same due to the quite different appearance in the
characterization and the presence of sodium is absent from those on MgO
Combining all the liquid phase reaction results above it seems that instead of a zeolite coating
some other product is produced in the procedure And according to Table 612 the product
surprisingly seemed to be more active in decane oxidation As the phenomenon did not appear
157
again with the coated MgO based catalysts two proposals may be made based on this One is
if it is the same coating the activity should be not due to the coating only the other is the
coating formed on the SiO2 and MgO supports is not the same coating - perhaps some factors
influenced the coating formation which led to a different coating formed which can be proved
in the different appearance in the characterization in XRD Further investigation on this is given
in the following gas phase section
From these gas phase reaction results it can be seen that both the coated and treated catalysts
give an increased conversion in comparison to the untreated MgO-based systems Combined
with the characterization data this increase in activity is suggested to result from the conversion
of MgO to Mg(OH)2 In terms of selectivity for C10 oxygenated products the treated samples
show the best result followed by the coated and then the untreated It should be remembered
that these catalysts were tested under long residence times which was been shown to give
lower C10 oxygenation selectivity The best results are obtained with the acid-washed and then
the treated MgO which gave 39 selectivity at 34 conversion These selectivity increases
are not as high as had been hoped for so further development of the coating is required while
attempting to preserve the substrate in an unaltered form
6515 Conclusion
Although a significant increase of the C10 terminal selectivity was not found with any of the
powder formed coated catalysts it is notable that many catalysts show a high terminal
selectivity in the form of cracked acids As the oxidation of decane is viewed as a model
reaction for terminal products this probably has some promise as we can expect that a wide
range of terminally oxidized linear alkanes could be achieved
158
In this section SiO2 and MgO based catalysts were synthesised with a zeolite coating in which
the direct template-free zeolite membrane preparation method was employed From SEM EDX
XRD and XPS data it can be concluded that with this method the desired zeolite coating was
not obtained Instead an amorphous SiO2 overlayer was formed on the surface The direct
template-free method does not seem to produce the desired coating for our powder catalysts
Especially for the SiO2 based catalysts the SiO2 membrane formed not only on the surface of
catalyst substrates but also some excess that was not tethered to the surface
The coated samples do however show increased activity in both liquid and gas phase reactions
In the liquid phase the coated SiO2 based catalysts showed a conversion increase of 1-2
however the terminal selectivity is not affected As the coated SiO2 based catalysts have low
surface area (Table 4) it seems that the activity per unit area is quite high The treated MgO
based catalysts in the gas phase reactor showed some good activity The work now needs to
move on to study a system with an ordered pore structure
652 Zeolite A Coating with sphere support
From the previous experience the final product after a successful coating is a mixture of coated
samples extra zeolite and water Therefore with the powder form of supports such as silica
and alumina it is difficult to separate the coated samples from the mixture From a wide search
in the literature the conclusion is the same zeolite coatings were reported to be synthesized on
supports with big structures eg stainless steel cell or plate alumina spheres and silica spheres
In this section zeolite 4A coatings with alumina spheres have been tested The synthesis
procedure for the catalysts is described in the experimental section
159
6521 Results
Coatings on the alumina spheres have been carried on the alumina spheres without any active
centre only The alumina spheres have also been treated by the two different polyelectrolytes
coated in the same way and then used in reactions Figure 623 shows the surface of one of the
coated alumina spheres under the SEM According to the image there is a full coverage of
zeolite on the sphere while the pore structure is still clear
The coated alumina spheres were then used in the liquid phase reaction at 100degC for 16 h to
test the selectivity The reaction product distribution is shown in Table 625 and Figure 624
to Figure 626
Figure 623 Surface of the coated alumina spheres (treated by polydiallyl dimethyl
ammonium chloride)
160
Table 625 100degC 15 bar 10 g n-decane 3 Coated Al2O3 spheres 16 h
Catalyst Conv
()
Selectivity ()
54
one
3
one
2
one
54
ol
3
ol
2
ol
1
ol
C5
OOH
C6
OOH
C7
OOH
C8
OOH
C9
OOH
C10
OOH
Blank 018 229 144 158 76 49 78 13 125 43 61 08 05
12
1 014 190 119 166
10
1 71
11
3 21 162 20 28 05 03
02
2 007 158 108 184 97 69
12
0 22 197 09 18 06 04
06
1- Treated by polydiallyl dimethyl ammonium chloride
2- Treated by magnafloc lt35
There must be some differences between different spheres both in mass and coating status To
avoid problems caused by this the reactions have been repeated to confirm the results It was
found that the conversions of the reactions were between 010- 014 for the spheres treated
by polydiallyl dimethyl ammonium chloride and 007-011 for the spheres treated by
magnafloc The C10 terminal selectivity was always below 28
Figure 624 100degC 15 bar 10 g n-decane blank reaction 16 h
161
Figure 625 100degC 15 bar 10 g n-decane 3 coated Al2O3 spheres 16 h
Figure 626 100degC 15 bar 10 g n-decane 3 coated Al2O3 spheres 16 h
6522 Discussion and conclusion
From the results with the zeolite A coatings the conversion is almost the same as blank
162
reactions However the coatings changed the product distribution (Figure 624 to 626) as
compared to the blank reactions there is a definite increase in the selectivity for decanols
Generally the selectivity for the shortened acids decreased especially for the hexanoic acid and
heptanoic acid though the pentanoic acid increased For the terminal position there is not much
change in total conversion however the decanoic acid decreased This means the zeolite A does
not work for the primary position instead it seems it works in stopping the cracking in the
position 3 and 4 and helping the decanol production in these positions Probably the pore size
of the zeolite A (around 4 Aring) is a little bit small for the CH3 groups (around 43 Aring) while the
smaller group CH2 is more suitable in its pore size
According to the above results the zeolite 4A does not work for the terminal selectivity other
zeolites with larger pore sizes should be tried such as mordenite and silicalite-1
653 Silicalite-1 coating with sphere support
In this section silicalite-1 coating was applied to two different types of sphere supports the α-
alumina sphere (diameter 5 mm) and the γ-alumina sphere (diameter 2 mm) It is well known
the α-Al2O3 is a stable support for hydrothermal synthesis while -Al2O3 has less heat
resistance However -Al2O3 has a higher surface area (210 m2g) it is therefore possible to
load more active centres on it than on α-Al2O3 (082 m2g) which is an attractive advantage
6531 S1 coating with α-alumina spheres
01 wt Rhalumina sphere and 01 wt Aualumina sphere were treated as the procedure
described in the experimental section to synthesize silicalite-1 coated catalysts
163
Characterization
XRD analysis of the uncoated and coated samples was carried out to observe if the silicalite-1
layer was successfully synthesized The results can be found in Figure 627 and Figure 628
0 10 20 30 40 50 60 70 80 90
0
10000
20000
30000
40000
50000
60000
70000
80000
90000
Inte
ns
ity
2 Thetadegree
Uncoated RhAl2O
3
Uncoated AuAl2O
3
Coated RhAl2O
3
Coated AuAl2O
3
XRD analysis for uncoatedcoated samples
Figure 627 XRD analysis for the uncoated and coated samples
From Figure 627 it is observed that the uncoated Rh and AuAl2O3 (black and red in the figure)
show exactly the same peaks which were identified as matched α-Al2O3 No metal peaks were
found probably due to the very small metal particle size In comparison with the uncoated
samples the two coated samples (green and blue in the figure) showed very similar peaks
expect a few small peaks around 23deg These small peaks were searched and matched the MFI
pattern however it is not possible to distinguish between ZSM-5 and silicalite-1 A further
investigation with a more accurate scan between the 5deg and 40deg in the XRD was carried out
164
and the results are shown in Figure 628 In Figure 628 the major peaks of MFI are marked
with a cross These peaks were found to match the MFI peaks very well However as the
ZSM5 and silicalite-1 have very similar structures we can still not identify if it is silicalite-1
through the XRD results but an ordered structure was formed with the substrate catalysts
0 5 10 15 20 25 30 35 40 45
0
1000
2000
3000
4000
5000
6000
xxx
x
x
xxxx
x
Inte
ns
ity
2 Thetadegree
Coated RhAl2O
3
Coated AuAl2O
3
Further XRD analysis for coated Rh and AuAl2O
3 samples
Figure 628 Further XRD analysis for the coated samples
(x ndash MFI peaks o - α-Al2O3 peaks)
Table 626 shows the surface area change before and after coating Figure 629 shows the
morphology of the uncoated and coated spheres At the same magnification it was found that
after being coated the surface of catalyst spheres was covered by visible cubic particles which
are probably the accumulated silicalite-1 particles
165
Table 626 Surface area of the uncoated and coated catalysts
Catalyst Surface Area (m2g)
01 wt Rhα- Al2O3 spheres 1
Coated 01 wt Rhα- Al2O3 spheres 43
01 wt Auα- Al2O3 spheres 1
Coated 01 wt Auα- Al2O3 spheres 48
(a) 01 wt Auα-Al2O3 sphere
(b) Coated 01 wt Auα-Al2O3 sphere
Figure 629 Surface morphology of the uncoated and coated catalysts
166
Reaction
Although through the XRD results we cannot tell if the formed zeolitic material is ZSM5 or
silicalite-1 it is highly possible it is silicalite-1 as in the precursor there is no Al source the
only Al in this system comes from the alumina support which should be unable to dissolve in
the zeolitic material synthesis procedure Therefore in the following part we assume it is
silicalite-1 coated catalysts formed and call it the lsquoS1 coatedrsquo samples
The S1 coated samples were tested in the liquid phase reactions with n-decane at 110degC with
6h reactions The corresponding results are given in the Table 627
Table 627 110degC 15 bar 10 g n-decane 6 h 600 rpm 2 spheres Catalyst Conv
()
Selectivity ()
54
one
3
one
2 one 54
ol
3
ol
2
ol
1
ol
C5
OOH
C6
OOH
C7
OOH
C8
OOH
C9
OOH
C10
OOH
01
RhAl2O3
spheres 004 238 151 223 65 48 82 14 143 17 16 0 02
02
Coated
01
Rh Al2O3
spheres 012 244 162 215 51 35 58 13 136 36 36 03 10
02
01
Au Al2O3
spheres 012 142 129 196 77 54 88 18 188 46 53 03 02
04
Coated
01
Au Al2O3
spheres 016 269 176 241 53 33 51 11 70 43 41 03 01
09
From the results in the Table 627 it is difficult to gain much understanding of the performance
of the S1 coatings in the selective oxidation Comparing the conversions in Table 627 it can
be observed that both the samples with coatings obtained a higher conversion than those
without coating The two coated samples demonstrate a similar conversion which might be
167
caused by the coatings themselves instead of being caused from the active centres in the
substrate catalysts This may be due to the coated samples used in this trial having low activity
(as described earlier) therefore the activity of the coatings cannot be covered In comparison
with the decanone and decanol products it can be found that when without coatings the
selectivity for the decanone and decanols are very different for the Rh and Au catalysts
however after being coated the selectivity for these two kinds of products became similar to
each other This is further evidence that the activities performed observed in these two reactions
were caused by the coatings themselves However on the two different catalysts the coatings
which were analysed as the same type of coating in the XRD analysis showed different acid
selectivity especially for pentanoic acid and decanoic acid
6532 S1 coating with γ-alumina spheres
It is well known the α-Al2O3 is a stable support for hydrothermal synthesis while -Al2O3 has
less heat resistance However -Al2O3 has a higher surface area (210 m2g) it is therefore
possible to load more active centres on it than on α-Al2O3 (082 m2g) which is an attractive
advantage In this section the same coating synthesis procedure was again applied to the 3 wt
Au loaded smaller size γ-alumina spheres (diameter 2 mm) which have a surface area of 210
m2g Table 628 shows the surface area change before and after coating while Figure 630
shows the surface morphology of the uncoated and coated spheres Similar to the coating with
the α-Al2O3 sphere it was found that after being coated the surface of catalyst spheres was
covered by cubic particles which should be the accumulated silicalite-1 particles Further
characterization by SEM and EDX has been performed to check if the coating layers are
continuous and to determine their thickness (Figure 631 to Figure 633)
168
SEM and EDX mappings analyses were performed for the coated samples which indicated the
thickness of the silicalite-1 layer of approximately 6-8 m (Figure 631) In the mapping
images the silicon appears to be continuously distributed as a circle around the cross section of
the sphere (Figure 633)
Table 628 Surface area of the catalysts with and without coating
Catalyst Surface Area (m2g)
γ-Al2O3 spheres 210
3 Auγ-Al2O3 spheres 184
Coated 3 Auγ-Al2O3 spheres 124
169
(a) 3 wt Auγ-alumina sphere
(b) Coated 3 wt Auγ-alumina sphere
Figure 630 Surface morphology of the uncoated and coated catalysts
170
(a) The edge of 1 mm 01 AuAl2O3 (mag= 32 KX)
(b) The edge of coated samples in higher magnification (mag =1147 KX)
Figure 631 SEM images of the cross section of the S1 uncoated and coated 3 wt
Au-Al2O3 spheres
171
Figure 632 The edge of the coated samples in BSD detector
EDX analysis Au wt = 22
(a)An overall SEM image (b) Al (c) Si
(d) O (e) Au
Figure 633 EDX Mapping the cross section of the S-1 uncoated and coated 3
wtAu-Al2O3 spheres
172
Reaction
3 wt Auγ-Al2O3 catalysts before and after coating were used in the reactions for a 6 h run
as shown in Table 629
Table 629 110degC 15 bar 10 g n-decane 6 h 600 rpm 005 g catalysts (with γ-Al2O3
sphere)
Catalyst Conv
()
Selectivity ()
54
one
3
one
2
one
54
ol
3
ol
2
ol
1
ol
C5
OOH
C6
OOH
C7
OOH
C8
OOH
C9
OOH
C10
OOH
3
AuAl2O3
spheres 026 235 148 188 54 38 60 15 158 49 44 04 01
07
Coated
3
AuAl2O3
spheres 014 168 115 174 98 71 113 19 93 47 78 06 04
11
6533 Discussion and conclusion
The product distribution with the coated 3 wt Au γ-alumina spheres (Table 629) is different
from the results with the relatively bigger α-alumina spheres (Table 627) which probably
means the performance of this coated catalyst is not only the performance of the coating but
also that of the underneath catalyst This time the coating lowers the activity of the catalyst
with a small increase the terminal selectivity (though further experiments are needed to see if
this is within experimental error) in comparison with the uncoated catalyst the selectivity for
ketones goes down and for the decanols and acids all go up except the pentanoic acid again
However for the C10 terminal position the increase is minimal
Summarizing the section it can be concluded a 6-8 m thick continuous silicalite-1 coating
layer was successfully synthesized on the 3 wtAu-Al2O3 However the sample was not
found to work well as a teabag catalyst for the liquid phase oxidation of decane (Table 629)
173
which may due to the activity of the silicalite-1 in the liquid phase Therefore other zeolite
materials which are not active themselves in the liquid phase would be useful as coatings in
this study As reported in Iglesiarsquos work and our previous research the H+ form of the zeolite
is not active for the liquid phase reaction therefore zeolite A and ZSM-5 can be considered
possible options in the project Given the pore size requirement for the decane molecules it is
suggested that ZSM-5 should be the better option However the silicalite-1 coatings could still
be useful materials to test in the gas phase where silicalite-1 is not active
654 ZSM-5 coating with alumina sphere support
The synthesis of ZSM-5 coatings was carried out only with the alumina supports without any
metal loadings Experiments have been performed with both α- and -Al2O3 To develop the
optimized amount of the zeolite precursor solution for the hydrothermal synthesis different
volumes of solution with exactly the same molar composition have been used (32 ml and 15
ml) The results are shown below in sections for α- and -Al2O3 respectively
6541 ZSM-5 coating with α-Al2O3 spheres
With 32 ml zeolite precursor solution
Coverage of the coating was calculated by the weight of the coating per surface area of the
support (082 m2g) which was 00694 gm2 for this 32 ml zeolite precursor solution synthesis
as shown in Table 630 below However this is only a rough estimate as the weight change
might be slightly affected by deposition of non-crystalline material
Table 630 Coverage of the coating on the α-Al2O3 support (32 ml solution)
Support
Weight before
coated (g)
Weight after
coated (g)
Coverage
(gm2)
α-Al2O3 10491 11060 00694
174
With the normal scan by the XRD (Figure 634) it was found that the intensity of the coated
sample is much less than uncoated one this may be due to the coating or some crystallinity
may be lost during the synthesis Small ZSM-5 peaks are found in the diffractogram of the
coated α-Al2O3
10 20 30 40 50 60 70 80
0
5000
10000
15000
20000
25000
30000
35000
40000
45000
50000
55000
60000
65000
70000
75000
after
Normal Scan -Al2O
3 before and after coating
Inte
nsity
2 Thetadegree
before
after
(Intensity10)Z
Figure 634 Normal Scan α-Al2O3 before and after coating
z = likely ZSM-5 peaks
175
A low angle XRD scan for the coated samples showed more intense ZSM-5 peaks (Figure
635)
0 10 20 30 40 50 60
0
200
400
600
800
1000
1200
ZZ
Inte
nsity
2 Thetadegree
after coating
-Al2O
3
Low Angle Scan coated -Al2O
3
Z
Figure 635 Low angle scan coated α-Al2O3
The coated α-Al2O3 under the SEM showed that the morphology of the surface was not
homogeneous Some of the surface was covered with faceted micron-sized agglomerates while
other parts of the surface were covered by the deposition of nano-sized particles (Figure 636
and Figure 637)
EDX element mappings of the complete coated sphere and cross-sections of the coated sphere
were performed In Figure 638 as an example 638(a) is the original whole coated α-Al2O3
sphere 638(b) (c) and (d) are the distribution of Al Si and O respectively in the blue green
and white colour 638(e) is the mixture image of 638(b) (c) and (d) The mapping images of
the cross sections especially in Figure 639(c) showed the elements to be distributed as we
176
expected for a layer with a silicon circle around the edge of the sphere However from the
mixture image (Figure 38(e)) the elements do not appear to be distributed uniformly
Figure 636 Faceted micron-sized and nano-sized particles on the surface
Figure 637 Nano-sized particles
177
(a)An overall SEM image (b) Al (c) Si
(d) O (e) Mix
Figure 638 Mapping for a whole coated α-Al2O3 sphere
(a)A cross-section image (b) Al (c) Si
(d) O (e) Mix
Figure 639 Mapping for the cross-section of a coated α-Al2O3 sphere
With 15 ml zeolite precursor solution
The hydrothermal synthesis procedure was exactly the same as for the samples shown above
but with less zeolite precursor solution 15 ml The coverage of the coating with 15 ml zeolite
precursor solution was calculated again as before It was found that the coverage was 00693
178
gm2 (Table 631) Compared to the amount for the 32 ml solution synthesis (00694 gm2) the
coverage level was exactly the same This showed that the ability of spheres to load coatings
is limited and in both the two syntheses the maximum loading was reached
Table 631 Coverage of the coating on the α-Al2O3 support (15ml solution)
Support
Weight before
coated (g)
Weight after
coated (g)
Coverage
(gm2)
α-Al2O3 10486 11054 00693
With a low angle scan of the coated samples by XRD the main peaks of ZSM-5 are still visible
(Figure 640) which is similar to the 32 ml solution
0 10 20 30 40 50 60
0
400
800
1200
1600
2000
ZZ
Uncoated -Al2O
3
Inte
nsity
2 Thetadegree
Coated -Al2O
3
Low Angle Scan -Al2O
3 before and after coating
Z
Figure 640 Low angle scan α-Al2O3 before and after coating
In Figure 641 and Figure 642(a) there are clearly three different morphologies fluffy nano-
179
sized particles large faceted micron-sized particles and smaller micro-sized particles the larger
faceted micron-sized particles were also found in the results of the 32 ml solution synthesis It
appears as though the supports were fully covered However the thickness of the layer is
difficult to identify as in Figure 642(b)
The EDX element mapping showed a homogeneous silicon distribution over the support sphere
(Figure 643 (c)) However the mixture image did not show the element distribution to be
uniform (as for the 32 ml solution) this may due to the different particles having differing
compositions
Figure 641 Surface of the α-Al2O3 (mag = 130KX)
180
(a) Surface of the coated α-Al2O3 with a higher magnification (mag = 1178)
(b) Cross-section of the coated α-Al2O3 (mag = 16KX)
Figure 642 Morpology of the coated α-Al2O3 (mag = 130KX)
181
(a)An overall SEM image (b) Al (c) Si
(d) O (e) Mix
Figure 643 Mapping of a whole coated α-Al2O3 sphere
(a)A cross-section image (b) Al (c) Si
(d) O (e) Mix
Figure 644 Mapping of the cross-section of a coated α-Al2O3 sphere
According to the above characterization the ZSM-5 coating was successfully achieved on the
α-Al2O3 spheres although there were a few irregularly shaped faced micron sized particles
The next stage is to try to synthesize small crystals and a thinner layer ZSM-5
182
6542 ZSM-5 coating with -Al2O3 spheres
With 32 ml zeolite precursor solution
The coverage level of the coating was unable to be calculated as some of the support spheres
were found to be crushed after the hydrothermal synthesis This may be because the -Al2O3
heat resistance was reduced under the atmospheric conditions inside the autoclave However
in the previous synthesis of silicalite-1 layer (180degC) it was found that the 3 Au-Al2O3 was
much more stable as compared the blank -Al2O3 spheres used in the ZSM-5 synthesis (160degC)
In the XRD low angle scan no ZSM-5 peaks were found (Figure 645) This may be due to
the coating not forming or a thin coating layer which cannot be detected by XRD
0 10 20 30 40 50 60
0
400
800
1200
1600
2000
2400
2800
3200
after
before
Inte
nsity
2Thetadegree
Low Angle Scan -Al2O
3 before and after coating
Figure 2 Low angle scan -Al2O3 before and after coating
From the same autoclave the extra ZSM-5 powder was calcined separately with good heating
rate control and identified as ZSM-5 (Figure 646)
183
0 10 20 30 40 50 60
0
2000
4000
6000
8000
10000
12000
14000
16000
Inte
nsity
2 Thetadegree
Low Angle Scan the extra ZSM-5 in the autoclave
Figure 646 Low angle scan the extra ZSM-5 powders in the same batch with -Al2O3
The SEM images further confirmed there are no visible layers on the -Al2O3 surface It is
possible that a very thin layer or particles was synthesized that is below the detection limits of
the SEM therefore catalytic results are required to see if there is any change in product
distribution as compared with the un-treated -Al2O3 In Figure 647(b) residues of carbon
from the template are detected In the mapping images it looks as though the silicon distribution
is not a circle (Figure 648) however this could be an artefact due to the cutting of the spheres
in the sample preparation for the SEM scan
184
(a)
(b)
Figure 647 SEM images of the surface of coated -Al2O3
185
(a)A cross-section image (b) Al (c) Si
(d) O (e) Mix
Figure 648 Cross-section of a coated -Al2O3 sphere
With 15 ml zeolite precursor solution
The hydrothermal synthesis procedure was performed as for the samples shown above but
with a less zeolite precursor solution 15 ml
The coverage level of the coating was again unable to be calculated Low angle XRD revealed
the coated sample to be different from the 32 ml solution Several peaks in the measured
diffractogram (Figure 649) are similar to the main peaks of ZSM-5 (marked with lsquoorsquo)
however the main peaks (marked with lsquoxrsquo) in this are more likely to be from silicon dioxide
However the extra powder from the α- and - batches is similar and both are identified as ZSM-
5 after calcination (Figure 650) Combining all the XRD analyses it is reasonable to conclude
that -Al2O3 itself has an influence on the synthesis of coatings at its surface
186
0 10 20 30 40 50 60
0
400
800
1200
1600
2000
2400
2800
xxxx
x
ooCoated -Al
2O
3
Low Angle Scan -Al2O
3 before and after coating
Inte
nsity
2 Thetadegree
Uncoated -Al2O
3
o
x
Figure 649 Low angle scan uncoated and coated -Al2O3 surface
o ndash likely to be ZSM-5 x ndash might be silicon dioxide peaks
0 10 20 30 40 50 60
0
400
800
1200
1600
2000
2400
2800
3200Low Angle Scan the extra ZSM-5 in - and - batch
with -Al2O
3
Inte
nsity
2 Thetadegree
with -Al2O
3
Figure 650 Low angle scan the extra powders with α- and - batch
In the SEM images below (Figure 651) it is observed the coverage on the surface does not
look like the regular ZSM-5 particles The thick fluffy coating is probably silicon dioxide as
187
indicated from the more intense XRD peaks Silicon dioxide might not have the same desired
shape selectivity or radical scavenger properties as a zeolite
Figure 651 Surface of the coated γ-Al2O3
Figure 652 the cross-section of the coated γ-Al2O3
188
The element mapping (Figure 653 and Figure 654) below showed a homogeneous silicon
distribution both on the whole sphere and the cross-section images
(a)An overall SEM image (b) Al (c) Si
(d) O (e) Mix
Figure 653 Mapping of a whole coated -Al2O3 sphere
(a)A cross-section image (b) Al (c) Si
(d) O (e) Mix
Figure 654 Mapping of the cross-section of a coated -Al2O3 sphere
The two extra powders made from 15 ml precursor solutions (α- and -Al2O3) were observed
and found to be different as well (Figure 655) in the α-Al2O3 batch there are faceted micron-
189
sized particles while in the -Al2O3 batch the morphology looked the same as the coated -
Al2O3 surface
From all of the analyses of the coated -Al2O3 there is a large quantity of fluffy layers found
which are likely to be a kind of silicon dioxide The catalytic application of coated -Al2O3
may not be successful because of it Therefore it might not be a good option to use -Al2O3 for
the ZSM-5 coating
6543 Discussion
According to the above characterization the ZSM-5 coating was successfully achieved on the
α-Al2O3 spheres although there were a few irregularly shaped ZSM-5 crystals Coated γ-Al2O3
samples were found covered with a relatively large quantity of fluffy nano-sized particles
which are likely to be a type of silicon dioxide as detected by the XRD ZSM-5 particles may
be present as indicated by very weak XRD peaks but probably as a minority or with a very
small crystal sizes and therefore not detected by XRD The formation of different layers on the
α- and γ-Al2O3 may be because aluminum may leach from the support under the synthesis
conditions People reportedly to coat the γ-Al2O3 with a thin layer of mesoporous silica [26]
which will reduce the risk of crack formation due to stress under the synthesis conditions The
α and γ-Al2O3 supports clearly have an influence over the formation of coatings at their surface
190
(a) From the α-batch
(b) From the -batch
Figure 655 the morphology of the extra powders from the α-Al2O3 and -Al2O3 batches
191
655 Zeolite XY coating with silica spheres
6551 Results
The zeolite XY coated silica samples were characterized by XRF and XRD (provided by JM)
XRF results (Table 633) showed the silica to alumina ratio in the coated silica spheres and
zeolite powder from batch 1 and 2 The XRD results identified the samples as quartz and
cristabolite sample 2 as faujasite crystallite size 473 nm sample 3 as quartz and sample 4 as
faujasite crystallite size 508 nm
Table 633 XRF analysis results
Sample 1 Sample 2 Sample 3 Sample 4
Si content 4047 1864 4026 1850
Al content 263 1341 328 1339
Na content 079 1123 138 1113
Calculated Si content 00144 00066 00143 00066
Calculated Al content 00005 00025 00006 00025
Silica to alumina ratio 2956 267 2358 265
Sample 1 - Silica spheres from batch 1
Sample 2 - Zeolite powder from batch 1
Sample 3 - Silica spheres from batch 2
Sample 4 - Zeolite powder from batch 2
The two batches of zeolite XY coated silica spheres were tested in the hexane oxidation with
short (30 min) and longer (4 h) reaction times respectively The results were given in Table
634 As a comparison according to Table 635 the terminal selectivity in a blank reaction in
the same reaction time was 0 (30 min) and 4 (4 h)
192
Table 634 Zeolite X coated silica 130degC 3 bar O2 25 ml n-hexane 600 rpm
Reaction
Time
Conv
()
Selectivity ()
Ketones Alcohols Hexanoic acid Others 1-hexanol
Batch 1
30 min 003 43 42 0 19 16
4 h 029 17 20 0 63 6
Batch 2
30 min 004 36 40 0 22 13
4 h 060 11 21 0 68 7
Table 635 Blank reactions 130degC 3 bar O2 25 ml n-hexane 600 rpm single reaction
Reaction
Time
(h)
Conv
()
Selectivity ()
Ketones Alcohols Hexanoic acid Others 1-hexanol
05 0
4 0074 23 17 0 60 4
6552 Discussion
Comparing Table 634 with Table 635 it was found that the terminal selectivity was much
higher than the blank reaction especially for short reaction times In a 30 min reaction the
terminal selectivity was 16 with batch 1 which was even higher than the highest terminal
selectivity reported before (up to 13 ) with the zeolite A coated silica With a longer reaction
time while the terminal selectivity decreased to 6-7 the conversion was highly increased
The zeolite XY coated silica sample was active and selective which indicates the zeolite XY
coating works in the hexane oxidation
193
656 Zeolite A in hexane oxidation
In section 651 and 652 it was concluded that with 4Aring pore size zeolite A was not applicable
for the decane molecule to pass through However it is still worth trying in the smaller hexane
molecule oxidation In this section coated samples with different synthesis times or amounts
of supports were tested for hexane oxidation in the liquid phase For comparison some of the
silica spheres were treated at the same pH and then calcined The results of all the reactions are
given below in Table 636
Table 636 130degC 3 bar O2 25 ml n-hexane stir speed 2 single reaction (4 h) SiO2
spheres and 24 h1 g zeolite A coated SiO2 spheres
Catalyst Reactor Conv() Selectivity ()
Ketones Alcohols Acid Others 1-hexanol
silica C 038 20 13 0 67 5
Bases
treated
silica B 052 13 17 0 70 5
8 h
1g silica B 070 15 15 0 70 4
8 h
3g silica C 053 14 15 0 71 6
12 h
1g silica B 013 31 22 0 47 13
12 h
3g silica C 024 24 18 0 58 10
24 h1 g
silica B 061 14 12 1 73 4
From the above table the 12 h1 g batch shows some promise for terminal selectivity And
compared to the reaction result with only the silica sphere it appears that the conversion with
the coated sample was lower than with the silica spheres only This is equivalent to the teabag
technology principle Therefore the synthesis was repeated several times and tested again All
194
the results are given in Table 637
Table 637 130degC 3 bar O2 25 ml n-hexane stir speed 2 single reaction (4 h) SiO2
spheres and zeolite-A coated SiO2 spheres
Catalyst Reactor Conv() Selectivity ()
Ketones Alcohols Hexanoic
acid
Others 1-hexanol
Batch 1 B 026 17 14 1 68 7
Batch 2 B 013 31 22 0 47 13
Batch 3 B 011 28 23 0 49 11
Batch 4 B 046 12 13 0 75 5
Batch 5 B 050 10 12 0 78 5
It was found that some of the batches showed an interesting terminal selectivity Some of the
batches were analysed with XRD to check the structure of the samples From Figure 656 it
can be seen that the intensity ratios of first two major peaks are different for the three samples
Figure 657 is a standard XRD pattern for the zeolite A structure however our products appear
to have a additional peak at lower 2 Theta which does not seem to be from the zeolite A structure
all the other peaks observed are also present in the zeoltie A structure The source of the first
strong peak is unknown However the ratio between the first and second peak changed in the
three batches It is notable that the batch 3 which showed 11 terminal selectivity has a quite
different 1st2nd peak ratio from the others
195
0 10 20 30 40 50 60
0
500
1000
1500
2000
2500
3000
3500
4000
4500
5000
5500
Inte
nsity
2 Thetadegree
batch 5
batch 4
batch 3
Figure 656 XRD analysis for three batches of 12 h synthesized zeolite A powder
Figure 657 The standard XRD pattern of zeolite A [27]
8
OOH
196
66 Conclusions
This chapter showed the most focused work in this research in which different types of zeolites
and zeolitic material coatings were synthesized onto substrate catalysts including zeolite 4A
silicalite-1 ZSM-5 zeolite XY Characterization and catalytic tests were performed
correspondingly with n-decane or n-hexane
Application of zeolite A coating with silica powder support did not produce a significant
increase of the C10 terminal selectivity but many catalysts show a high terminal selectivity in
the form of cracked acids This probably has some promise as it can be expected that a wide
range of terminally oxidized linear alkanes could be achieved SiO2 and MgO based catalysts
coated by a direct template-free zeolite membrane preparation method was concluded not with
the desired zeolite coating Instead an amorphous SiO2 overlayer was formed on the surface
However the coated samples do show increased activity in both liquid and gas phase reactions
In the liquid phase the coated SiO2 based catalysts showed a conversion increase by 1-2
however the terminal selectivity is not affected As the coated SiO2-based catalysts have low
surface area (Table 4) it seems that the activity per unit area is quite high The treated MgO-
based catalysts in the gas phase reactor showed some good activity
Zeolite A coated alumina catalysts showed a C10 terminal selectivity always below 28 with
the conversion of reactions between 007 - 014 The conversion is almost equivalent to the
blank reactions However the coatings changed the product distribution (Figure 624 to 626)
as compared to the blank reactions Generally the selectivity for the shortened acids decreased
especially for the hexanoic acid and heptanoic acid though the pentanoic acid increased For
the terminal position there is not much change in total however the decanoic acid decreased
197
while the selectivity for decanols increased slightly by 1 This means that the zeolite A does
not work for the primary position instead it seems it works in stopping the cracking in the
position 3 and 4 and helping decanol production in these positions Probably the pore size of
the zeolite A (around 4 Aring) is a little bit small for the CH3 groups (around 43 Aring) while the
smaller group CH2 is more suitable in its pore size
Silicalite-1 coating was applied to both α- and γ-alumina sphere supports with Rh or Au metal
loaded as the active centres It can be concluded that a 6-8 microm thick continuous silicalite-1
coating layer was successfully synthesized on the 3Auγ-Al2O3 However the sample was
not found to work well as a teabag catalyst for the liquid phase oxidation of decane (Table
629) The terminal selectivity change was minimal This may due to the activity of the
silicalite-1 in the liquid phase
ZSM-5 coating was successfully achieved on the α-Al2O3 spheres although there were a few
irregularly shaped ZSM-5 crystals Coated γ-Al2O3 samples were found covered with a
relatively large quantity of fluffy nano-sized particles which are likely to be a type of silicon
dioxide as detected by the XRD ZSM-5 particles may be present as indicated by very weak
XRD peaks but probably as a minority or with a very small crystal sizes and therefore not
detected by XRD The formation of different layers on the α- and γ-Al2O3 may be because
aluminum may leach from the support under the synthesis conditions It was found that the α
and γ-Al2O3 supports clearly have an influence over the formation of coatings at their surface
Zeolite X and Y coated silica catalysts tested with n-hexane liquid phase oxidation showed
much higher terminal selectivity than the blank reaction especially with a short reaction time
198
In a 30 min reaction the terminal selectivity was 16 while the terminal selectivity for the
blank reactions was 0-9 With a longer reaction time the terminal selectivity decreased to 6-
7
Zeolite 4A coated silica spheres were also found to work in raising the terminal selectivity in
hexane liquid phase oxidation A stable 1-hexanol selectivity of gt4 was observed with 4 h
reaction It was also observed that the synthesis time of the coating affected the reaction With
a coating synthesis time of 12 h the maximum 1-hexanol selectivity could reach 13
67 References
[1] N van der Puil FM Dautzenberg H van Bekkum JC Jansen Microporous and
Mesoporous Materials 27 (1999) 95
[2] Collier Paul John Golunskin Stanislaw Edmund US Patent No0032628 2005
[3] RN Devi FC Meunier T Le Goaziou C Hardarcre PJ Collier SE Golunski LF
Gladden MD Mantle Journal of Physical Chemistry C 112(29) (2008) 10968
[4] ER Geus AE Jansen J Schoonman H van Bekkum Catalysis and Adsorption by
Zeolites Studies in Surface Science and Catalysis vol65 Elsevier Amsterdam ( 1991) 451
[5] M Matsukata Chemical Communications (1996) 1441
[6] P Wenqin SUeda and MKoizumi Proceedings of the 7th International Zeolite Conference
(Eds Y Murakami A Lijima and JWWard) Elsevier Tokyo (1986) 177
[7] L Gora K Streletzky RW Thompson GDJ Phillies Zeolites 18 (1997) 119
[8] T Cetin M Tatlier A Erdem-Senatalar U Demirler M Urgen Mircoporous and
Mesoporous Materials 47 (2001) 1
199
[9] O Andac SM Telli M Tatlier A Erdem-Senatalar Microporous and Mesoporous
Materials 88 (2006) 72
[10] Z Zhou J Yang Y Zhang L Chang W Sun J Wang Separation and Purification
Technology 55 (2007) 392
[11] Z Wang J Hedlund J Sterte Microporous and Mesoporous Materials 52 (2002) 191
[12] M Tatlier MDemir BTokay AErdem-Senatalar LKiwi-Minsker Microporous and
Mesoporous Materials 101 (2007) 274
[13] JC Jansen JH Koegler H van Bekkum HPA Calis CM van den Bleek F Kapteijn
JA Moulijn ER Geus N van der Puil Microporous and Mesoporous Materials 21 (1998)
213
[14] H Kalipcilar A Culfaz Microporous and Mesoporous Materials 52 (2002) 39
[15] K Aoki K KusakabeSMorooka Journal of Membrane Science 141 (1998) 197
[16] P Collier S Golunski C Malde J Breen R Burch Journal of the American Chemistry
Society 125 (2003) 12414
[17] N Nishiyama K Ichioka D Park Y Egashira K Ueyama L Gora W Zhu F Kapteijn
JA Moulijn Industrial Engineering Chemistry Research 43 (2004) 1211
[18] J Park BC Kim SS Park HC Park Journal of Materials Science Letters 20 (2001)
531
[19] Y Yan ME Davis GR Gavalas Industrial Engineering Chemistry Research 34 (1995)
1652
[20] BJ Schoeman A Erdem-Senatalar J Hedlund J Sterte Zeolites 19 (1997) 21
[21] ER Genus Hvan Bekkum Zeolites 15(4) (1995) 333
[22] F Jareman C Andersson J Hedlund Microporous and Mesoporous Materials 79 (2005)
1
200
[23] P Siva Sankar Reddy N Pasha MGV Chalapathi Rao N Lingaiah I Suryanarayana
PS Sai Prasad Catalysis Communications 8 (2007) 1406
[24] DC Vu M Miyamoto N Nishiyama S Ichikawa Y Egashira K Ueyama
Microporous and Mesporosous Materials 115 (2008) 106
[25] B Modeacuten B Zhan J Dakka J G Santiesteban E Iglesia Journal of Physical
Chemistry 111 (2007) 1402
[26] MR Othman SC Tan S Bhatia Microporous and Mesoporous Materials
121 (2009) 138
[27] Web database of zeolites httpwwwiza-structureorgdatabases
201
CHAPTER 7
Conclusions
202
CONCLUSIONS
This thesis describes the searching preparation characterization and catalytic evaluation of
active catalysts for the terminal selectivity of long chain linear alkanes The focus of the thesis
is the preparation characterization and catalytic evaluation of the shape-selective materials
including the organic material cyclodextrins and the inorganic materials zeolite and zeolitic
membranes Prepared catalysts were performed with n-decane or n-hexane as models to
produce the terminal products 1-decanol 1-hexanol decanoic acid and hexanoic acid The
conclusions of the research to date were summarized as follows
Firstly the studies with the Andrews glass reactor were presented for the purpose of reproducing
the best selective results available in the literature published by Thomas [1-4] and Iglesia [5 6]
for the oxidation of n-hexane in liquid phase However Thomas et al did not calculate the
autoxidation with the ALPO catalysts Iglesiarsquos work was more crucial in this area The time
on-line blank reaction results showed similar terminal selectivities to Iglesiarsquos work in
autoxidation with the terminal selectivity stable at 5-9 However the terminal selectivity
with Mn-ZSM5 was still very low (~0) Iglesiarsquos high terminal selectivity with Mn-ZSM5
could not be reproduced
A comparison between the Andrews glass reactor and the Parr stainless steel reactor showed
that the autoxidation reactions performed higher conversion but lower terminal selectivity in
the stainless steel reactor than the glass reactor which indicates the stainless steel reactor itself
may have some activity in the oxidation reaction
203
Various catalysts have been evaluated for decane oxidation in the project eg 5 wt AuTiO2
25 wt Au - 25 wt PdSiO2 Most of the catalysts showed very low conversion and very
poor terminal selectivity Increasing the temperature leads to higher conversion but results in
more cracked products and less selectivity for oxygenated C10 products Figure 71 showed the
activity of the auto-oxidation and the activity of a range of catalysts It was found that the most
active catalyst was 5 wt AuTiO2 However these catalysts did not show good terminal
alcohol selectivity (lt3) whereas the cracked acid selectivity was high (320)
Figure 71 ndash Conversion with different catalysts (reaction conditions 110oC 10 g n-
decane 005 g catalyst 15 bar O2 600 rpm stainless steel reactor)
Cyclodextrins were investigated as an organic shape-selective material to coat the AuSiO2
catalysts in Chapter 5 Addition of CDs alone without the catalyst decreased the conversion
but no trend in terminal selectivity was observed With the CD covered AuSiO2 catalyst a
decrease in conversion has been observed compared to the blank reaction however the changes
in terminal selectivities are still limited (1-2) and considered to be within the experimental
errors To conclude the CD covered catalysts which were prepared by the direct impregnation
method did not play an important role in increasing the terminal selectivity
204
Finally the most important studies in the thesis was the synthesis of different types of zeolite
coatings onto substrate catalysts which was the so called lsquoteabag technologyrsquo Zeolite 4A
silicalite-1 ZSM-5 zeolite XY were successfully synthesized Characterization and catalytic
evacuations were performed correspondingly with n-decane or n-hexane
Application of zeolite A coating with silica powder support did not produce a significant
increase of the C10 terminal selectivity but many catalysts show a high terminal selectivity in
the form of cracked acids This probably has some promise as it can be expected that a wide
range of terminally oxidized linear alkanes could be achieved SiO2 and MgO based catalysts
coated by a direct template-free zeolite membrane preparation method was concluded not with
the desired zeolite coating Instead an amorphous SiO2 overlayer was formed on the surface
However the coated samples do show increased activity in both liquid and gas phase reactions
In the liquid phase the coated SiO2-based catalysts showed a conversion increase by 1-2
however the terminal selectivity is not affected As the coated SiO2-based catalysts have low
surface area it seems that the activity per unit area is quite high The treated MgO based
catalysts in the gas phase reactor showed some good activity
Zeolite A coated alumina catalysts showed a C10 terminal selectivity was always below 28
with the conversion of reactions between 007 - 014 The conversion is almost equivalent
to the blank reactions However the coatings changed the product distribution (Figure 624 to
626) as compared to the blank reactions Generally the selectivity for the shortened acids
decreased especially for the hexanoic acid and heptanoic acid though the pentanoic acid
increased For the terminal position there is not much change in total however the decanoic
205
acid decreased while the selectivity for decanols increased slightly by 1 This means the
zeolite A does not work for the primary position instead it seems it works in stopping the
cracking in positions 3 and 4 and helping the decanol production in these positions Probably
the pore size of the zeolite A (around 4 Aring) is a little bit small for the CH3 groups (around 43
Aring) while the smaller group CH2 is more suitable in its pore size
Silicalite-1 coating was applied to both α- and γ-alumina sphere supports with Rh or Au metal
loaded as the active centres It can be concluded that a 6-8 microm thick continuous silicalite-1
coating layer was successfully synthesized on the 3Auγ-Al2O3 However the sample was
not found to work well as a teabag catalyst for the liquid phase oxidation of decane (Table
629) The terminal selectivity change was minimal This may due to the activity of the
silicalite-1 in the liquid phase
ZSM-5 coating was successfully achieved on the α-Al2O3 spheres although there were a few
irregularly shaped ZSM-5 crystals Coated γ-Al2O3 samples were found covered with a
relatively large quantity of fluffy nano-sized particles which are likely to be a type of silicon
dioxide as detected by the XRD ZSM-5 particles may be present as indicated by very weak
XRD peaks but probably as a minority or with a very small crystal sizes and therefore not
detected by XRD The formation of different layers on the α- and γ-Al2O3 may be because
aluminum may leach from the support under the synthesis conditions It was found that the α
and γ-Al2O3 supports clearly have an influence over the formation of coatings at their surface
Zeolite X and Y coated silica catalysts tested with n-hexane liquid phase oxidation showed
much higher terminal selectivity than the blank reaction especially with a short reaction time
206
In a 30 min reaction the terminal selectivity was 16 while the terminal selectivity for the
blank reactions was 0-9 With a longer reaction time the terminal selectivity decreased to 6-
7
Zeolite 4A coated silica spheres were also found to work in raising the terminal selectivity in
hexane liquid phase oxidation A stable 1-hexanol selectivity of gt4 was observed with a 4 h
reaction It was also observed that the synthesis time of the coating affected the reaction With
the coating synthesis time of 12 h the maximum 1-hexanol selectivity could reach 13
References
[1] JM Thomas R Raja G Sankar R G Bell Studies in Surface Science and Catalysis 130
(2000) 887
[2] R Raja G Sankar JM Thomas Angewandte Chemistry 39 (2000) 231
[3] JM Thomas R Raja G Sankar RG Bell Accounts of Chemical Research 34 (2001)
191
[4]R Raja JM Thomas Journal of Molecular Catalysis A 3 (2002) 181
[5] B Modeacuten B Zhan J Dakka J G Santiesteban E Iglesia Journal of Physical Chemistry
111 (2007) 1402
[6] B Zhan B Modeacuten J Dakka JG Santiesteban E Iglesia Journal of Catalysis 245 (2007)
316

ii
ACKNOWLEGDGMENTS
I would like to take the opportunity to thank many people who directly or otherwise made the
writing of this thesis possible
First of all I would like to thank my academic supervisors Prof Graham Hutchings and Dr
Jonathan Bartley for offering me the opportunity to pursue the research and for their warm
encouragement when I felt embarrassed and even gave up Without their generous help I would
not be able to complete this thesis
I would like to thank Johnson Matthey and Sasol for funding the collaborative project I would
like to thank my industrial supervisor Xavier Baucherel and his colleague Mike Watson for
their help from Johnson Matthey in both my research and the financial support
I would also like to thank Frans Prinsloo Nishlan Govender from Sasol The travel to South
Africa is very memorable I would like to specially thank Chris Nicolaides who unfortunately
left us forever He is so nice and friendly to me
I would like to thank Don Bethell Matt House Rhys Lloyd Tom Davies who gave me great
assistance and guidance in the study and technical analysis
I would like to thank all my lab mates from lab 076 and lab 188 especially my colleagues
Edouard Huguet and Sivaram Pradhan They are so amazing and gave me so many help They
enlightened my life these years
Outside the university I would also like to thank my family for their endless support both
financial and emotional throughout I love them
iii
ABSTRACT
This thesis describes the searching preparation characterization and catalytic evaluation of
active catalysts for the terminal selectivity of long chain linear alkanes The focus of the thesis
is the study of shape selective materials including the organic material cyclodextrins and the
inorganic material zeolite and zeolitic membranes Prepared catalysts were performed with n-
decane or n-hexane as models to produce the terminal oxidation products 1-decanol 1-hexanol
decanoic acid and hexanoic acid
Studies with the Andrews glass reactor showed a stable terminal selectivity of 5-9 in the
autoxidation of n-hexane in short time reactions A comparison between the Andrews glass
reactor and Parr stainless steel reactor showed that the autoxidation reactions can get higher
conversion but lower terminal selectivity in the stainless steel reactor than the glass reactor
Most of the metalsupport catalysts showed very low conversion and very poor terminal
selectivity Increasing the temperature leads to higher conversion but results in more cracked
products and less selectivity for oxygenated C10 products The most active catalyst was 5 wt
AuTiO2 However these catalysts did not show good terminal alcohol selectivity (lt3)
whereas the cracked acid selectivity was high (320) Cyclodextrin covered AuSiO2 catalysts
showed limited changes in terminal selectivities (1-2)
Zeolite 4A silicalite-1 ZSM-5 zeolite XY coated catalysts were successfully synthesized
with alumina and silica sphere supports The most attractive oxidation results were performed
by zeolite XY and zeolite 4A coated silica catalysts in n-hexane liquid phase oxidation
iv
especially for with short reaction time With zeolite XY membrane in a 30 min reaction the
terminal selectivity was 16 while the terminal selectivity for the blank reactions was 0-9
With longer reaction time the terminal selectivity decreased to 6-7 Zeolite 4A membrane
can produce a terminal selectivity of 13 in 4 h reactions
v
CONTENTS
Chapter 1 Introduction 1
11 Significance of the thesis 2
12 Aim of the thesis 2
13 Catalysis 3
14 Challenges in the selective oxidation 4
15 Industrial applications of long chain linear alcohols 5
16 Current manufacture of long linear alcohols in industry 6
17 Alkane oxidation in literature 8
18 Zeolites 10
181 Zeolite composition 10
182 Shape selective application of zeolite 11
183 Synthesis of the zeolite membrane 12
19 The model reactions in this research 14
110 The research branches in this project 15
1101 Supported catalyst investigations for shape selective catalysts 15
1102 Teabag technology 15
111 References 16
Chapter 2 Experimental Techniques 19
21 Introduction 20
22 Catalyst preparation 20
221 Preparation of supported metal catalysts 20
222 Preparation of zeolite and zeolitic coated catalysts 23
223 Preparation of cyclodextrin modified catalysts 25
vi
23 Catalyst characterization technique 25
231 X-ray powder diffraction 25
232 Scanning electron microscopy 27
233 Surface area method (BET) 29
234 Atomic absorption spectroscopy 30
235 X-ray photoelectron spectroscopy 31
24 Reactors used in the project 32
241 The Parr multiple stainless steel reactor system 32
242 The Andrews glass reactor system 34
25 Analysis and qualification of reaction products 35
251 Analysis by Gas Chromatography 35
252 Quantification of the products via response factor 36
2521 Use of internal standard 36
2522 Calculations of relative response factors of each compound 36
2523 Quantification and analysis of the reaction 39
26 References 41
Chapter 3 Andrews Glass Reactor 42
31 Introduction 43
32 Experimental 44
321 Apparatus and reaction 44
322 Safety operating procedure 45
323 Characterization technique 48
33 Results 48
331 Andrews glass reactor in blank hexane oxidation 48
vii
3311 Comparison between Andrews glass reactor and stainless steel reactor
49
3312 Repeat Iglesiarsquos blank reaction 51
3313 The unknown products in analysis 51
3314 Application of aqua regia as washing agent 52
3315 Time on-line reactions 53
3316 Discussion 55
332 Reaction with Mn-ZSM5 56
34 Conclusion 57
35 References 58
Chapter 4 Catalytic investigation for teabag coating 60
41 Introduction 61
42 Experimental 62
421 Metalsupport catalysts 62
422 RhRu loaded catalysts 63
43 Results 64
431 Pd Au Pt loaded supported catalysts 64
432 Higher temperature reactions 66
433 Discussion 68
434 Use of a radical scavenger 68
435 Development of the catalyst preparation method 70
436 Ru and Rh loaded catalysts 75
4361 α-phase alumina powder support 76
4362 γ-phase alumina powder support 78
4363 Loading with alumina spheres 83
44 Conclusion 85
viii
45 References 87
Chapter 5 Cyclodextrin covered catalysts 88
51 Introduction 89
52 Cyclodextrins as catalyst modifiers 91
53 Experimental 95
531 Preparation of CD covered catalysts 95
532 Catalyst testing 96
54 Results 97
541 BET analysis 97
542 Activity of CDs 98
5421 Activity of CDs under reaction conditions 98
5422 Activity of CDs with the addition of radical scavenger 100
543 CD modified AuSiO2 101
5431 The fully covered AuSiO2 101
5432 Different level of CD coverage over catalysts 102
5433 Cyclodextrin modified catalyst recycling 104
544 CD modified AuHCl treated SiO2 105
55 Conclusion 107
56 References 107
Chapter 6 Teabag Technology 109
61 Introduction 110
62 The teabag technology project 110
63 Zeolite membrane synthesis 112
631 Preparation method 112
ix
632 Supports in zeolite coating 116
633 Other factors for preparation 119
634 Deactivation 123
64 Experimental 124
641 Preparation of coated catalysts 124
6411 Zeolite A coated samples with silica powder support 125
6412 Zeolite 4A coated samples with sphere supports 126
6413 Silicalite-1 coating with sphere supports 127
6414 ZSM-5 coating with α- and -Al2O3 128
642 Reaction conditions 129
643 Characterization 130
65 Results 130
651 Zeolite A coating with powder support 130
6511 Coated SiO2 in liquid phase reaction 130
6512 Discussion 147
6513 Coated MgO in gas phase reaction 147
6514 Discussion 156
6515 Conclusion 157
652 Zeolite A coating with sphere support 158
6521 Results 159
6522 Results and discussion 161
653 Silicalite-1 coating with sphere support 162
6531 S1 coating with α-alumina spheres 162
6532 S1 coating with γ-alumina spheres 167
6533 Discussion and conclusion 172
654 ZSM-5 coating with alumina sphere support 173
x
6541 ZSM-5 coating with α-alumina spheres 173
6542 ZSM-5 coating with β-alumina spheres 182
6543 Discussion 189
655 Zeolite XY coating with silica sphere support 191
6551 Results 191
6552 Discussion 192
656 Zeolite A coating in hexane oxidation 193
66 Conclusion 196
67 References 198
Chapter 7 Conclusions 201
xi
ABBREVIATIONS
ordmC Degrees centigrade
Aring Angstrom
AAS Atomic Absorption Spectroscopy
Al2O3 Alumina
Bar Unit of Pressure
BET Brunauer Emmett Teller
cm Centimetre
EDX Energy Dispersive X-ray Spectroscopy
FID Flame Ionisation Detector
NMR Nuclear Magnetic Resonance
g Grams
GC Gas Chromatography
GC-MS Gas Chromatography Mass-Spectrometer
MgO Magnesium Oxide
m Metre
min Minute
mL Millilitre
ppm Parts Per Million
psi Pounds Per Square Inch
S1 Silicalite-1
SEM Scanning Electron Microscopy
SiO2 Silica
TEM Transmission Electron Microscopy
VMgO Vanadium-Magnesium Mixed Oxides
xii
XPS X-Ray Photoelectron Spectroscopy
XRD X-Ray Diffraction
XRF X-ray Fluorescence
ZSM-5 Zeolite Socony Mobil ndash 5
1
CHAPTER 1
Introduction
2
INTRODUCTION
11 Significance of the thesis
Organic compounds such as alcohols aldehydes ketones epoxides and acids are widely used
in everyday life and industry Therefore the production of these compounds is of key
importance in modern chemistry research and to the chemical industry There are many ways
to produce these oxygen-containing organic compounds but oxidation of saturated
hydrocarbons is one of the most significant It is widely known that there are large quantities
saturated hydrocarbons obtained from natural gas and petroleum [1] in fact in South Africa
Sasol (one of the sponsors of this thesis) produces large amount of alkanes in its Fischer
Tropsch process [2] Alkanes as a relatively environmentally friendly and low cost feedstock
are ideal for the production of those valuable organic compounds Various products can be
obtained by oxidation of alkanes In this thesis the study focused on the terminal oxidation of
long chain alkanes whose products can be used in the manufacture of plasticizers lubricants
solvents surfactants and materials for further chemical functionalization
12 Aim of the thesis
The thesis is a fundamental study into the terminal oxidation of long chain n-alkanes using n-
decane and n-hexane as model compounds to produce 1-decanol decanoic acid or 1-hexanol
and hexanoic acid (Figure 11) in liquid phase reactions There are two challenges in this study
how to enhance the activity of the reaction and how to control the regioselectivity of the
oxidation To overcome the challenges catalysis was introduced into the project The project
was collaboration between Cardiff University Johnson Matthey and Sasol
3
Figure 11 Aim of the thesis ndash terminal oxidation of decane
13 Catalysis
Catalysis is the change in rate of a chemical reaction due to the participation of a catalyst
Unlike other reagents that participate in the chemical reaction a catalyst is not consumed by
the reaction itself A catalyst may participate in multiple chemical transformations Catalysts
that speed the reaction are called positive catalysts Substances that interact with catalysts to
slow the reaction are called inhibitors (or negative catalysts) Substances that increase the
activity of catalysts are called promoters and substances that deactivate catalysts are called
catalytic poisons A catalyst does not change the thermodynamics of the reaction but simply
provides a new and easier pathway by lowering the activation energy A good catalyst must
possess both high activity and long-term stability But its single most important attribute is its
selectivity which reflects its ability to direct conversion of the reactant(s) along one specific
pathway [3]
Catalysis can be divided into three categories homogeneous catalysis heterogeneous catalysis
4
and biocatalysis Homogeneous catalysis covers all the cases where catalysts and reactants are
in the same phase while heterogeneous catalysis covers all the cases where catalysts and
reactants are in different phases Homogeneous catalysts exhibit a higher activity per unit mass
of metal than heterogeneous catalysts [4] however it is difficult to recover the catalyst In
heterogeneous catalysis there is little difficulty in separating and recycling the catalyst
Biocatalysis is a rather special case somewhere between the homogeneous and heterogeneous
catalysis In most cases biocatalysts are enzymes which are often seen as a separate catalyst
group [5]
14 Challenges in the selective oxidation of alkanes
Economic factors and technological innovations often induce changes in the chemical
feedstocks used to produce commodity organic chemicals These reasons caused alkanes to
replace acetylene in many commercial processes several decades ago Alkanes as the least
expensive and most abundant hydrocarbon resource have a very important potential role in the
chemical industry However very few selective methods are available for converting alkanes
into more valuable products Furthermore several desirable reactions utilizing alkanes are not
thermodynamically favourable at reasonable temperatures Even where alkanes are used their
transformations are often inefficient This is because alkanes are saturated and lack functional
groups Hydrocarbons can only undergo reaction after cleavage of C-H or C-C bonds In most
instances the strength of the C-H bonds involved controls the rate and selectivity of oxidation
turnovers [6 7] As a result preferential oxidation specific C-H bonds except as dictated by
their relative bond strengths remains a formidable challenge C-H bonds at terminal positions
in n-alkanes are ~13 kJmol stronger than secondary C-H bonds (eg 410 kJmol vs 397
kJmol for propane) [8] thus terminal oxidation selectivities are typically below 10 in C10-
5
alkanes unless spatial constraints imposed by the H-abstractor or by the structure of the voids
around active sites favour terminal attachment or inhibit access to secondary or tertiary
carbons
Another problem in the selective oxidation of alkanes is the initial product of alkane oxidation
is often more reactive toward the oxidant than the alkane itself Overoxidation of the initial
product will dramatically reduce the desired product yield
15 Industrial applications of long chain linear alcohols
Linear primary alcohols are amphiphiles composed of a polar part (hydroxyl group) and an
apolar part (alkane chain) The amphiphile molecules can be utilized as surfactants The limited
solubility makes them aggregate in the interface between two phases to form micelles
Therefore linear primary alcohols are good detergents They are also used in the composition
of plastics and cement where they can increase the fluidity of the material Another industrial
application of linear alcohols is that they are very important materials for further chemical
functionalization based on the large number of reactions the hydroxyl group may undergo
(Figure 12 [9]) The resulting products are important commercial intermediates
6
Figure 12 Typical examples of reactions that can undergo terminal alcohols [9]
16 Current manufacture of long linear alcohols in industry
Two basic dominating industrial-scale processes are used to manufacture linear alcohols the
Ziegler process and the oxo synthesis (hydroformylation) starting from petrochemical
feedstocks [10] The Ziegler chemistry process contains five steps hydrogenation ethylation
growth reaction oxidation and hydrolysis The starting material is ethylene (Figure 13)
Terminal Linear alcohol + Oxygen rarr Aldehyde + carboxylic acid
+ Alkali Melt rarr carboxylic acid
+ Alkali rarr Dimeric Alcohol
+ Proton rarr Ether Olefin
+ Alkyne rarr Vinyl Ether
+ Carboxylic acid rarr Easter
+ Hydrogen Halide rarr Alkyl Halide
+ AmmoniaAmine rarr Amine
+ AldehydeKetone rarr Acetal
+ Sulfide rarr Thiol
+AlcoholateH2S rarr Xanthate
+Metal rarr Metal alkoxide
7
Figure 13 The multi-step Ziegler process
Al2O3 is not recycled during the reaction so it is not a catalytic process
The second industrial route is hydroformylation also known as the oxo process (Figure 14)
The process typically is accomplished by treatment of an alkene with high pressures (10-100
atm) of carbon monoxide and hydrogen at temperatures between 40 and 200ordmC [11] Transition
metal catalysts are required It is a heterogeneous catalytic process
Al
Al(C2H5)3 + (x+y+z) C2H4 Al
(CH2CH2)xCH2CH3
(CH2CH2)yCH2CH3
(CH2CH2)zCH2CH3 Triethylalumininum Ethylene
Growth Product
(CH2CH2)xCH2CH3
(CH2CH2)yCH2CH3
(CH2CH2)zCH2CH3
Growth Product
Oxidation
Al
O(CH2CH2)xCH2CH3
Aluminum Alkoxide
O(CH2CH2)yCH2CH3
O(CH2CH2)zCH2CH3
Al
O(CH2CH2)xCH2CH3
O(CH2CH2)yCH2CH3
O(CH2CH2)xCH2CH3
+
CH3-CH2-(CH2CH2)xOH
linear Primary Alcohols
Al(OH)3 +
Aluminium
Hydroxide
CH3-CH2-(CH2CH2)yOH
CH3-CH2-(CH2CH2)zOH
3 H20
8
Figure 14 Two-step oxo processes
Both the Ziegler process and the oxo process use alkenes as the feedstocks and require multi-
step reactions A process using long chain linear alkanes as the feed would be less expensive
and more environmentally friendly
17 Alkane oxidation in literature
Literature covering long chain alkane oxidation is limited Most of the literature discussing
alkane activation relates to short chain linear alkanes (eg methane to butane) or cyclic
hydrocarbons (eg cyclohexane) in which different catalytic approaches were presented
A bio-catalytic approach has been used for the alkane oxidation It was reported that enzymes
(momo-oxygenase) can oxidize the terminal group of linear alkane with oxygen [12] The
catalytic active centre of the mono-oxygenase (Fe) is surrounded by a large protein structure
which controls the substrate to the oxidation centre
Homogeneous catalysts were also reported in the terminal selective oxidation of alkanes In the
literature in the presence of tetra-n-butylammonium salts of vanadium-containing
polyphosphomolybdates [PMo11VO40]4minus and [PMo6V5O39]
12minus n-Octane can be efficiently
oxidized by hydrogen peroxide in acetonitrile The terminal selectivity was reported to be 82
9
[13]
However due to the scope of this project only heterogeneous catalysts were available to be
coated by shape selective materials Therefore this review is focused on heterogeneous
catalysts Compared with biocatalysis and homogeneous catalysis heterogeneous catalysis is
preferred in industry because it is easier to operate and less expensive There have been some
attractive catalysts reported in the terminal oxidation of alkanes using heterogeneous catalysts
In gas phase studies Mathebula reported a dehydrogenation process to produce the terminal
alcohol using n-hexane as the reactant [14] Following this method VMgO was employed as
the catalyst for the dehydrogenation of n-hexane to the terminal hexene The conversion was
reported to be 5 with a terminal selectivity less than 2 Then hydroxylation of alkene was
applied by a two-step process using sodium perborate followed by oxidation over H2O2NaOH
to obtain the terminal alcohol
In liquid phase studies the key results were reported by Thomas for n-hexane oxidation in
liquid phase [15-21] In his study Thomas used ALPO catalysts with air as the oxidant The
terminal selectivity can be extremely high (up to 87 conversion 655 selectivity with Co-
ALPO-18) Iglesia [22] tried to reproduce Thomasrsquos results under similar experimental
conditions using Mn-ALPO catalysts However the conversion was quite low (002-005)
while the terminal selectivity was 7 only Iglesia concluded that Mn-ALPO did not lead to
any preference for terminal selectivity in contradiction with Thomasrsquo results Iglesia published
his own results using Mn-ZSM5 as the catalyst (Table 11) [23]
Unlike Thomasrsquos study Iglesia noticed the autoxidation reaction and demonstrated a clear
10
difference in the terminal selectivity in the presence of catalysts It was clear that when the
catalyst was present the terminal selectivity was initially high (24) but the selectivity
declined when conversion increased In contrast the terminal selectivity in the autoxidation was
always 7-8
Table 11 Iglesiarsquos results for oxidation of n-hexane with Mn-ZSM-5 catalysts
Time
(hours)
Conversion
()
Terminal selectivity ()
with Mn-ZSM-5
Terminal selectivity ()
Autoxidation
05 0007 24 7
25 0013 185 8
4 0047 15 8
7 01 10 7
18 Zeolites
181 Zeolite composition
Zeolites are microporous crystalline solids with well-defined structures Generally they contain
silicon aluminium and oxygen in their framework Structurally they are complex crystalline
inorganic polymers based on an infinitely extending three-dimensional four-connected
framework of AlO4 and SiO4 tetrahedra linked to each other by the sharing of oxygen ions
(Figure 15) Each AlO4 tetrahedron in the framework bears a net negative charge which is
balanced by an extra-framework cation The framework structure contains channels or
interconnected voids that are occupied by the cations and water molecules The cations are
mobile and ordinarily undergo ion exchange The water may be removed reversibly generally
by the application of heat which leaves intact a crystalline host structure permeated by the
11
micropores and voids which may amount to 50 of the crystals by volume [24]
Figure 15 The microporous molecular structure of a zeolite (ZSM-5)
18 2 Shape selective application of zeolite
Due to the very regular pore structure of molecular dimensions zeolites are well-known as a
shape selective material The maximum size of the molecular or ionic species that can enter the
pores of a zeolite is controlled by the dimensions of the channels which is usually less than 10
Aring
Zeolite shape selectivities can be distinguished into three types depending on whether pore
size limits the entrance of the reacting molecule or the departure of the product molecule or
the formation of certain transition states (Figure 16)
Reactant selectivity occurs when only parts of the reactant molecules are small enough
to diffuse through the catalyst
Product selectivity occurs when some of the products formed within the pores are too
bulky to diffuse out as observed products They are either converted to less bulky
12
molecules (eg by equilibration) or eventually deactivate the catalyst by blocking the
pores
Restricted transition state selectivity occurs when certain reactions are prevented
because the corresponding transition state would require more space than available in
the cavities Neither reactant nor potential product molecules are prevented from
diffusing through the pores Reactions requiring smaller transition states proceed
unhindered
Figure 16 The type of shape selectivities [25]
183 Synthesis of the zeolite membrane
As a well-known shape selective catalyst zeolites can be synthesized as membrane for the
purpose of separation adsorption or for the selective reaction An ideal zeolite membrane
13
combines the general advantages of inorganic membranes (temperature stability solvent
resistance) with perfect shape selectivity A continuous zeolite membrane can principally
discriminate the components of gaseous or liquid mixtures dependent on their molecular size
Several methods for the preparation of the zeolite coatings can be found in the literature
1) Slurry coating or wash-coating in which the zeolite is brought onto the support from a wash-
coat solution containing precursors of binders based on alumina zirconia silica titania or
silica-alumina The coatings are calcined to obtain bonding of the crystallites to the support
surface [26] This method yields crystal layers which have a low continuity and a limited
accessibility since they are partly covered by the macroporous wash-coating
2) Dry gel conversion in which a gel containing the alumino-silicate precursor water and
template is brought onto the support dried and subsequently crystallized by contacting with
steam at 105-150degC [27]
3) In situ coating the most widely used method recently in which the crystals are directly
grown close to or on the support either from a gel or a solution[28-41] In this way coatings
may be grown that have a high continuity and can be optimized for use as either a membrane
or a catalyst
Although typical zeolite coating synthesis can be carried out in a dry gel it is more common
today to synthesize zeolite coatings by a hydrothermal method in dilute aluminosilicate systems
in which the amorphous gel phase is not present The first so called lsquoclear solutionrsquo (or lsquoclear
to eye solutionrsquo) system that produced zeolite NaA was reported at the International Zeolite
Association (IZA) meeting in Tokyo in 1986 [28] The batch composition in it formed the
starting point of the present work in clear solution One of the advantages of the clear solution
14
is it permits the use of in situ observations using light scattering techniques to study the
synthesis[29] especially the nucleation and crystal growth processes occurring within the
solution phase
Another important factor in the zeolite membrane synthesis is the selection of support
Generally support materials should be chosen that are readily available attrition resistant and
chemically stable For the purposes of the reaction the most widely used supports were alumina
and silica More details of the literature review are presented in Chapter 6
19 The model reactions in this research
The basic idea of the project is using shape-selective materials (eg cyclodextrins and zeolites)
to realize the terminal selective oxidation of long chain alkanes In the studies n-hexane and
n-decane were selected as the models to produce the linear alcohols Cyclodextrins were
applied as an organic shape selective material whereas zeolites were used as inorganic shape
selective materials The shape selective catalysts were built by the active supported catalyst
substrate and a continuous shape-selective membrane layer composed of shape-selective
materials (eg cyclodextrin or zeolite covered catalysts) An ideal catalyst system following
the principle of the idea is shown in the Figure 17
Figure 17 The ideal shape-selective catalyst system
15
Therefore the typical reactions were three phase reactions between gaseous (oxygen) liquid
(n-hexane or n-decane) and solid catalysts which are often encountered in the chemical
industry The advantages of liquid phase reactions are the relatively lower reaction
temperatures and higher time-yields than gas phase reaction the disadvantages are the products
must be separated and purified afterwards and the stability of catalysts also needs to be
considered
110 The research branches in the project
1101 Supported catalyst investigations for shape selective catalysts
As shown in the Figure 17 the shape selective catalysts were built by the active supported
catalyst substrate and a continuous shape-selective membrane layer composed by shape-
selective materials (eg cyclodextrins or zeolites covered catalysts) Therefore the first step
of the research is to find the proper active supported catalysts
1102 Teabag technology
Teabag catalysts prepared by teabag technology is an idea that zeolite coatings work as the
teabag to control the diffusion of reactants to the active sites in a specific configuration that
only allows the oxidation of the terminal position Small aggregates of zeolite crystals as a
coating on the surface of a catalyst have improved external mass transfer characteristics and a
high internal accessibility especially in fast liquid phase and gasliquid phase reactions [42]
In the project zeolites with suitable pore size were selected so that only the wanted reactant
and product can pass through the outer coating to an oxidation catalyst underneath The catalyst
selectivity is determined by the molecules it will allow to diffusion through the zeolite coating
16
to the activate catalyst beneath In chapter 6 the synthesis and reaction tests of catalysts with
zeolite A MFI zeolite X coatings are discussed in details
111 References
[1] G Centi F Cavani F Trifiro Selective Oxidation by Heterogeneous Catalysis Kluwer
AcademicPlenum Publishers (2001) 26
[2] ME Dry Journal of Chemistry Technology and Biotechnology 77 (2002) 43
[3] Principles and practice of heterogeneous catalysis JM Thomas WJ Thomas VCH
Publishers (2005)
[4] Industrial catalysis J Hagen Wiley-VCH (2006)
[5] Catalysis concepts and green applications G Rothenberg Wiley-VCH (2008)
[6] C Batiot BK Hodnett Applied Catalysis A General 127 (1996) 179
[7] JA Labinger Journal of Molecular Catalysis A Chemical 220 (2004) 27
[8] DF McMillen KE Lewis GP Smith DM Golden Journal of Physical Chemistry 86
(1982) 709
[9] All about the fatty alcohols Condea (2000)
[10] UR Kreutzer Journal of the American Oil Chemistsrsquo Society 61 (1984) 343
[11] The Fischer-Tropsch archive httpwwwfischer-tropschorg
[12] M Baik M Newcomb RA Friesner SJ Lippard Chemical Reviews 103 (2003) 2385
[13] BR Cook TJ Reinert KS Suslick Journal of the American Chemical Society 108
(1986) 7281
[14] HB Friedrich N Govender MR Mathebula Applied Catalysis A General 297 (2006)
81
[15] JM Thomas R Raja G Sankar RG Bell Nature (1999) 227
17
[16] R Raja JM Thomas Chemical Communications (1998) 1841
[17] R Raja G Sankar JM Thomas Journal of the American Chemistry Society 121 (1999)
119
[18] JM Thomas R Raja G Sankar R G Bell Studies in Surface Science and Catalysis
130 (2000) 887
[19] R Raja G Sankar JM Thomas Angewandte Chemistry 39 (2000) 231
[20] JM Thomas R Raja G Sankar RG Bell Accounts of Chemical Research 34 (2001)
191
[21]R Raja JM Thomas Journal of Molecular Catalysis A 3 (2002) 181
[22] B Modeacuten B Zhan J Dakka J G Santiesteban E Iglesia Journal of Physical Chemistry
111 (2007) 1402
[23] B Zhan B Modeacuten J Dakka JG Santiesteban E Iglesia Journal of Catalysis 245
(2007) 316
[24] N van der Puil FM Dautzenberg H van Bekkum JC Jansen Microporous and
Mesoporous Materials 27 (1999) 95
[25] Web division of fuel chemistry American chemical society
httpwwwchemdexorgchemistry_linkamerican_chemical_society_acs_division_fuel_che
mistry
[26] ER Geus AE Jansen J Schoonman H van Bekkum Studies in Surface Science and
Catalysis Elsevier (1991)
[27] M Matsukata Chemistry Communication (1996)1441
[28] P Wenqin S Ueda and M Koizumi Proceedings of the 7th International Zeolite
Conference(Eds Y Murakami A Lijima and JW Ward) Elsevier (1986)177
[29] L Gora K Streletzky RW Thompson GDJ Phillies Zeolites 18 (1997)119
18
[30] T Cetin M Tatlier A Erdem-Senatalar U Demirler M Urgen Mircoporous and
Mesoporous Materials 47 (2001) 1
[31] O Andac SMT elli M Tatlier A Erdem-Senatalar Microporous and Mesoporous
Materials 88 (2006) 72
[32] Z Zhou J Yang Y Zhang L Chang W Sun J Wang Separation and Purification
Technology 55 (2007) 392
[33] Z Wang J Hedlund J Sterte Microporous and Mesoporous Materials 52 (2002) 191
[34] M Tatlier M Demir B Tokay A Erdem-Senatalar L Kiwi-Minsker Microporous and
Mesoporous Materials 101 (2007) 274
[35] JC Jansen JH Koegler H van Bekkum HPA Calis CM van den Bleek F Kapteijn
JA Moulijn ER Geus N van der Puil Microporous and Mesoporous Materials 21 (1998)
273
[36] H Kalipcilar A Culfaz Microporous and Mesoporous Materials 52 (2002) 39
[37] K Aoki K Kusakabe S Morooka Journal of Membrane Science 141 (1998) 197
[38] Collier Paul John Golunskin Stanislaw Edmund US Patent No0032628 2005
[39] P Collier S Golunski C Malde J Breen R Burch Journal of the American Chemitry
Society 125 (2003) 12414
[40] N Nishiyama K Ichioka D Park Y Egashira K Ueyama L Gora W Zhu F Kapteijn
JA Moulijn Industrial amp Engineering Chemistry Research 43 (2004) 1211
[41] JK Edwards BE Solsona P Landon AF Carley A Herzing CJ Kiely GJ Hutchings
Journal of Catalysis 235 (2005) 69
[42] Introduction to zeolite science and practice Herman van Bekkum New York Elsevier
Science BV (2001)
19
CHAPTER 2
Experimental
Techniques
20
EXPERIMENTAL TECHNIQUES
21 Introduction
This chapter serves to describe (i) the catalyst preparation methods (ii) the basic principles of
the characterization techniques used in this study (iii) the reactors and reaction conditions used
for catalyst testing (iv) the methods to analyse and quantify the products
22 Catalyst preparation
In this project a large number of different types of catalysts were prepared and tested including
supported metal catalysts oxide catalysts and zeolite and zeolitic membrane coated catalysts
The typical preparation methods are given in this chapter The specific preparation methods
are discussed in details in the appropriate chapters
221 Preparation of supported metal catalysts
Various supported metal catalysts were prepared by impregnation methods using different
metals and oxide or carbon supports Depending on the nature of the supports the impregnation
methods were different For powder supports an incipient wetness method was used while for
the oxide sphere supports a vacuum incipient wetness method was used
The most commonly used supports were silica and alumina powder or alumina spheres while
the most commonly used metal was gold Therefore Aualumina powder and Aualumina
sphere preparations are used as examples to introduce the typical preparation processes The
reagents for the preparation are given in Table 21
21
Table 21 Reagents for the preparation of Aualumina powder or Aualumina sphere
catalysts
Reagent Molar mass (gmol-1) Supplier Purity
HAuCl4bull3H2O 39383 Aldrich 9999
γ- alumina powder 10196 Aldrich gt99
α- alumina sphere 10196 Saint Gobian -
To prepare a 5 wt Aualumina powder catalyst by incipient wetness an aqueous solution of
HAuCl4bull3H2O was prepared by dissolving 5 g of HAuCl4bull3H2O in 50 ml distilled water 10ml
of the solution was then simultaneously added to 475 g of γ-Al2O3 powder The paste formed
was dried at 110C overnight and then calcined in static air at 400C for 3 h [1]
To prepare a 5 wt Aualumina sphere catalyst by vacuum incipient wetness an aqueous
solution of HAuCl4bull3H2O was prepared by dissolving 5 g of HAuCl4bull3H2O in 50 ml distilled
water 1 g of alumina spheres were placed into a sealed two neck round bottom flask (Figure
21) The flask was heated to 80degC using an oil bath and evacuated using a vacuum pump for
1 h 1 ml of the HAuCl4bull3H2O solution was added into the flask through a syringe The flask
was shaken until all the solution was absorbed into the spheres The spheres were then dried
at 110degC overnight calcined at 400degC for 3 h
Other supported metal catalysts were synthesized by varying the starting reagents as shown in
Table 22
22
Figure 21 Vacuum incipient wetness experimental set-up
Table 22 Summary of the supported metal catalysts prepared
Catalyst Metal Reagent Support
5 wt PdSiO2 PdCl2 Silica gel
5 wt PdTiO2 PdCl2 Titania
5 wt PtSiO2 PtCl4 Silica gel
5 wt PtTiO2 PtCl4 Titania
25-25 wt Pd-AuSiO2 PdCl2 HAuCl4bull3H2O Silica gel
3 wt RhAl2O3 RhCl3bullxH2O γ-Al2O3
3 wt RuAl2O3 RuCl3bullxH2O γ-Al2O3
5 wt AuSiO2 HAuCl4bull3H2O Silica gel
5 wt AuTiO2 HAuCl4bull3H2O Titania
5 wt AuAl2O3 HAuCl4bull3H2O γ-Al2O3
5 wt AuC60 HAuCl4bull3H2O C60
5 wt Augraphite HAuCl4bull3H2O Graphite
5 wt RhAl2O3 RhCl3bullxH2O α-Al2O3 sphere
5 wt AuAl2O3 RuCl3bullxH2O α-Al2O3 sphere
3 wt Au Al2O3 HAuCl4bull3H2O γ-Al2O3 sphere
23
222 Preparation of zeolite and zeolitic coated catalysts
Different zeolite and zeolitic materials were prepared and tested as catalysts including zeolite
4A silicalite-1 ZSM-5 and zeolite X In addition to using these materials as catalysts they
were also used as coatings for supported metal catalysts
The zeolite coated catalysts were synthesized following the method reported by Collier et al
[2 3] For example to prepare a zeolite 4A coated Aualumina catalyst the following procedure
was used 5 g of AuAl2O3 spheres were added to a 5 wt solution of the polyelectrolyte (2-
propen-1-ammonium NN-dimethyl-N-2-propenyl chloride known as magnafloc lt35)
containing dilute ammonia and stirred at room temperature for 20 min An aqueous sodium
aluminate solution (607 g sodium aluminate (Alfa Aesar) dissolved in 52 g distilled water)
was rapidly added into an aqueous sodium metasilicate solution (1551 g sodium metasilicate
(Alfa Aesar anhydrous) dissolved in 52 g distilled water) to make the zeolite precursor
solution The spheres were subsequently separated and washed with distilled water and then
added to the zeolite precursor solution The mixture containing the spheres was stirred at room
temperature for 2 h and then hydrothermally crystallized at 100degC for 24 h in a 60 ml Teflon
lined stainless steel autoclave The Teflon liner was cleaned before and after each synthesis in
NaOH solution for 24 h under the synthesis conditions Finally the zeolite coated spheres were
separated from the crystallization solution and washed with distilled water dried at 110degC and
then calcined in air at 500degC for 2 h
The silicalite-1 coated catalysts were synthesized with a silicalite-1 precursor solution which
consisted of TEOS (98 Aldrich) tetrapropylammonium hydroxide (TPAOH) (1 M solution
in water Aldrich) ethanol (EtOH Fluka) and distilled water with the molar ratios of 05
24
TPAOH 120 H2O8EtOH 2 SiO2 Approximately 10 g of catalyst sphere was immersed in 15
g of the precursor solution The crystallization was carried out under hydrothermal conditions
at 180degC for 24 h in a 60 ml stainless steel autoclave with Teflon liner The Teflon liner was
cleaned before and after each synthesis in NaOH solution for 24 h under the synthesis
conditions The coating procedure was repeated twice The products were rinsed repeatedly by
distilled water separated by filtration and dried at 90degC overnight then calcined in air at 600degC
for 5 h with a heating rate of 1degCmin [4]
The ZSM-5 coating synthesis method was adapted from the work of Deijger et al [5] in which
they investigated ZSM-5 zeolite coatings on ceramic foam supports with surface areas below
1 m2g The catalysts to be coated were cleaned by boiling in toluene for 1 h and dried overnight
at 110degC before being immersed in the zeolite precursor solution The zeolite precursor solution
was prepared by adding tetrapropylammonium hydroxide (TPAOH Aldrich 1 M solution in
water) sodium aluminate (NaAlO2 Aldrich Al 50-56) to tetraethyl orthosilicate (TEOS
Aldrich 98) in a PTFE beaker The molar ratio of the precursor solution was 1 Al2O3 40
SiO2 10 TPAOH 800 H2O The precursor solution was stirred for 10 h at room temperature
as an aging process before transferring the reaction mixture to an autoclave In all experiments
1 g of catalyst was added to the autoclave The volume of precursor solution was varied (32 ml
or 15 ml) to observe the influence of the amount of precursor Syntheses were carried out under
autogenous conditions at 160degC for 24 h in Teflon-lined 60 ml autoclaves Teflon liners were
cleaned before and after each synthesis in NaOH solution for 24 h under synthesis conditions
The coated samples and the extra synthesized powder for the same batch were washed with
deionised water and dried overnight at 110degC Finally the samples were calcined at 550degC for
12 h using a heating rate of 5degCmin
25
223 Preparation of cyclodextrin modified catalysts
Cyclodextrin (CD) modified catalysts were prepared by an impregnation method Using CD
modified AuSiO2 as an example the detailed steps of the preparation are as follows The BET
surface area of the AuSiO2 was determined Assuming CD molecules cover the catalyst
surface as a monolayer without gaps the required mass of CDs to completely cover the surface
of catalysts was calculated (eg to cover 1 g of AuSiO2 037 g of α-CDs or 035 g of β-CDs
is needed) Five times the calculated amount of CD was then dissolved in 25 ml of deionised
water which was heated to 45C with stirring 5 ml of the CD solution was added to 1 g of
AuSiO2 and the mixture heated to 45C and stirred for 30 min and then put into an oven to dry
overnight at 110oC
Figure 22 Ideal Au SiO2 surface covered by cyclodextrin molecules
23 Catalyst characterization technique
231 X-ray powder diffraction
X-ray diffraction (XRD) is a versatile non-destructive technique that reveals detailed
information about the crystallographic structure of natural and manufactured materials [6]
26
To produce a powder XRD pattern the sample must be crystalline Bombarding a suitable
target with electrons produces the X-rays When the electrons hit the target they excite
electrons which return to their normal state shell with a consequent emission of X-rays
Diffraction occurs only when Braggrsquos Law is satisfied The wavelengths of the X-rays
produced by the powdered sample and diffracted by the analysed crystal obey the Bragg
equation which links the d-spacings on the powdered sample to the angle of incident of the X-
rays on the sample (Figure 23) [7]
nλ = 2dsinθ
θ = angle between the crystal plane and the diffracted beam
λ = wavelength of incident X-rays beam
d = spacing between atomic layers in the powdered sample
n = integer
Figure 23 Braggrsquos Law of diffraction [7]
27
The data obtained shows a series of lines of varying intensities at different 2θ values obtained
as the analyser crystal turns A qualitative analysis of the sample is thus carried out The
schematic of an X-ray diffractometer is shown in Figure 24
Figure 24 Schematic of an X-ray diffractometer [8]
In this project the XRD analysis was performed using a PANalytical Xpert Pro diffraction
system with a monochromatic Cu Kα1 source operated at 40 keV and 30 mA Catalysts
analysed by XRD must be powders therefore the catalysts prepared using preformed supports
were ground into a very fine powder
232 Scanning electron microscopy
The Scanning electron microscope (SEM) is a microscope that uses electrons rather than light
to form an image The SEM has a large depth of field which allows a large amount of the
sample to be in focus at one time The SEM also produces images of high resolution which
means that closely spaced features can be examined at a high magnification Preparation of the
samples is relatively easy since most SEMs only require the sample to be conductive The
28
combination of higher magnification larger depth of focus greater resolution and ease of
sample observation makes the SEM one of the most heavily used instruments in research areas
today [9]When using the SEM a beam of electrons is generated in the electron gun which is
located at the top of the SEM column This beam is attracted through the anode condensed by
a condenser lens and focused as a very fine point on the sample by the objective lens The
electron beam hits the sample producing among others secondary and backscattered electrons
from the sample The electrons are collected by a secondary electron or a backscattered electron
detector converted to a voltage and amplified The scan coils are energized (by varying the
voltage produced by the scan generator) and create a magnetic field which deflects the beam
back and forth in a controlled pattern The varying voltage is also applied to the coils around
the neck of the cathode-ray tube (CRT) which produces a pattern of light deflected back and
forth on the surface of the CRT The pattern of deflection of the electron beam is the same as
the pattern of deflection of the spot of light on the CRT SEM must be run in vacuum This is
because if the sample is in a gas filled environment an electron beam cannot be generated or
maintained because of a high instability in the beam Gases could react with the electron source
causing it to burn out or cause electrons in the beam to ionize which produces random
discharges and leads to instability in the beam Figure 25 shows the schematic of an SEM
instrument
In this project the SEM images were taken by a Zeiss Evo-40 series scanning electron
microscope The method was widely used in the characterization of zeolite coated catalysts
The coated sphere samples were placed in the sample holder directly in the characterization
29
Figure 25 Schematic of a Scanning electron microscope [10]
233 Surface area method (BET)
Surface area is one of the key tools to characterize porous materials The BET method is the
most frequently used method to calculate the surface area It provides precise specific surface
area evaluation of materials by nitrogen multilayer adsorption measured as a function of
relative pressure using a fully automated analyser The technique encompasses external area
and pore area evaluations to determine the total specific surface area in m2g yielding important
information in studying the effects of surface porosity and particle size The concept of BET
30
theory is based on the extension of the Langmuir theory which is a theory for monolayer
molecular adsorption to multilayer adsorption with the following hypotheses (a) gas
molecules physically adsorb on a solid in layers infinitely (b) there is no interaction between
each adsorption layer and (c) the Langmuir theory can be used for each layer Therefore the
BET equation is expressed in Equation 21
1 ʋ [(P0P) - 1] = (c-1)(ʋmc) ( P P0) + 1 (ʋmc)
where P= equilibrium pressure
P0= saturation pressure of the gas
ʋ= adsorbed gas quantify
ʋm= monolayer adsorbed gas quantity
c=constant
Equation 21 The BET equation
In this project samples were analysed using the Quantachrome Autosorb-1 instrument Before
performing the analysis samples were degassed by placing a 01 g sample in a glass tube (d =
12 mm) and heating under helium for an hour at 120˚C The sample filled glass tube is then
placed into a Dewar flask containing liquid nitrogen and analysed by the machine
234 Atomic absorption spectroscopy
Atomic absorption spectroscopy (AAS) is a technique for determining the concentration of a
particular metal element in a sample The technique can be used to analyse the concentration
of over 70 different metals in a solution The technique makes use of absorption spectrometry
31
to assess the concentration of an analyte in a sample Therefore it relies heavily on the Beer-
Lambert law
In short the electrons of the atoms in the atomizer can be promoted to higher orbitals for a
short amount of time by absorbing a set quantity of energy (ie light of a given wavelength)
This amount of energy (or wavelength) is specific to a particular electron transition in a
particular element and in general each wavelength corresponds to only one element This
gives the technique its elemental selectivity
As the quantity of energy (the power) put into the flame is known and the quantity remaining
at the other side (at the detector) can be measured it is possible from the Beer-Lambert law
to calculate how many of these transitions took place and thus get a signal that is proportional
to the concentration of the element being measured A diagram of AAS is given in Figure 26
Figure 26 Diagram of AAS [11]
32
235 X-ray Photoelectron Spectroscopy
X-ray Photoelectron Spectroscopy (XPS) is a quantitative spectroscopic technique that
measures the elemental composition empirical formula chemical state and electronic state of
the elements that exist within a material XPS spectra are obtained by irradiating a material
with a beam of X-rays while simultaneously measuring the kinetic energy and number of
electrons that escape from the top 5 to 20 nm of the material being analysed Because the energy
of an X-ray with particular wavelength is known the electron binding energy of each emitted
electron can be determined by using an equation that is based on the work of Ernest Rutherford
(Equation 22)
Eb= Ep- (Ek + ɸ)
Where Eb = binding energy of the electron
Ek = kinetic energy of the electron measured
Ep = the energy of the X-ray photons being used
Φ = work function of the spectrometer (often ignored)
Equation 22 XPS equation
XPS analysis in this project was carried out with an ESCALAB 220 spectrometer using an
achromatic AlKα source and analyser pass energy of 100 eV
24 Reactors used in the project
Two types of reactors have been used in the project the Parr multiple stainless steel reactor
system and the Andrews glass reactor system
33
241 The Parr multiple stainless steel reactor system
The Parr series 5000 multiple reactor system (Figure 27) has been used for the liquid phase
oxidation of n-decane and n-hexane with oxygen It is a system with six stainless steel vessels
which can perform six reactions at different pressures and temperatures simultaneously The
volume of each vessel is 45 ml Stirring with this system was operated by a single magnetic
stirrer therefore all six vessels have the same stirring speed during a single run In the
experiments PTFE stirring seeds were the most frequently used while glass stirring seeds were
also applied in some reactions The autoclaves can be operated up to 3000 psi and 275degC [12]
The typical reactions performed with this system were always with 005 g of catalyst 10 g n-
decane or n-hexane a stirring speed of 600 rpm 15 bar O2 at different temperatures and
reaction times Before reactions the autoclave was flushed twice with O2 to remove all the air
Then the reactors were heated to the desired temperature (100C 110C 120C or 130C) for
different runtimes There was no sample tube with this reactor therefore in order to exactly
control the reaction time ice water was used to cool down the autoclave at the end of the
reaction
242 The Andrews glass reactor system
The Andrews glass reactor system (Figure 28) has been used mainly for the liquid phase
oxidation of n-hexane with oxygen The three glass reactors (887ml starter kit Andrews
Glass) were heated in separate oil baths by three separate hotplates Oxygen pressure was
controlled in each reactor It was observed there were small temperature variations for the
different reactors because of their separate heating controllers Reactors A and B were found
34
to have quicker heating rates than reactor C It always took reactor C several minutes more to
reach the temperature set point
Figure 27 Multi reactor system and control box
Figure 28 Andrews Glass Reactor System
35
The volume of each glass vessel is 120 ml Stirring with this system was always controlled to
the same stirring speed and PTFE stirring seeds and glass stirring seeds were both employed
The reactors can be operated up to 225 psi [13]
The typical reactions performed with this system were always with 005 g catalyst 25 ml n-
hexane a stirring speed of 600 rpm 3 bar O2 at different temperatures and reaction times
Before reaction the vessel was flushed twice with O2 to remove all the air Then the reactors
were heated to the desired temperature (110C 120C 130C 150C) for different runtimes
A PTFE sample tube was used and in most cases the samples were taken directly from this In
some specific cases ice water was used to cool down the reactor at the end of the reaction
25 Analysis and qualification of reaction products
251 Analysis by Gas Chromatography
The first step of reaction product analysis was through gas chromatography (GC)GC is a
common type of chromatography for separating and analysing compounds that can be
vaporized without decomposition which was suitable in this project After the oxidation of the
long chain alkane there was a mixture of various products These can be separated in the GC
as they have different boiling points The higher the boiling point of the compound the later
the retention time of the compound
Analysis were carried out using a Varian Star 3800 equipped with a Chrompack CP Wax 52CB
25 m 053 mm 20 μm capillary column and an FID detector In the analysis 02 microl sample
was injected into the GC Helium was the carrier gas employed in the system Injection
parameters on the GC used a split ratio of 101
36
To achieve the best separation the temperature programs in the GC were as follows
(i) For n-decane products
Start at 60degC hold for 7 min
Ramp at 35degCmin to 115degC hold for 12 min
Ramp at 4degCmin to 220degC hold for 1 min
Ramp at 50degCmin to 240degC hold for 2 min
(ii) For n-hexane oxidation products
Start at 35degC hold for 7 min
Ramp at 35degCmin to 220degC hold for 3 min
252 Quantification of the products via response factor
2521 Use of internal standard
To quantify the products an internal standard was added to the reaction products The internal
standard used was 124-trichlorobenzene in both n-decane and n-hexane oxidation reactions
The advantage of this standard is that it did not interfere with the reaction and it is eluted from
the column at a different retention time from the other compounds of interest (Figure 23 and
24) 015 ml of 124-trichlorobenzene was added to the reaction products mixture
2522 Calculations of relative response factors of each compound
The relative response factor (K) of each product was determined using the ratio of the areas
under the peak of a known amount of product and a constant amount of the internal standard
(124-trichlorobenzene)
37
The anticipated compounds in the product mixture (eg 2-5 decanone 1-5 decanol etc) were
used to prepare five mixtures containing known amounts of products as well as the internal
standard For example to calibrate n-decane oxidation products the first to fifth calibrated
solution should contain 10 g n-decane 1030507090 mg of each anticipated compound and
015 ml internal standard The five mixtures were injected into the GC and the area of the peaks
of the internal standard and the anticipated compounds measured The mass of the compounds
were known therefore the internal response factor can be calculated using Equation 23 The
final internal response factor was the average value from the five solutions
K = [(AreaIS) (MassAC)] [(MassIS areaAC)]
Where K = Relative Response Factor
AreaIS = Area of Internal Standard in GC
MassAC = Mass of specific anticipated compound
MassIS = Mass of internal standard
AreaAC = Area of specific anticipated compound
Equation 23 Calculation of internal standard
All the relative response factors of the known products of n-dexane and n-hecane oxidation
were calculated in this way The retention time and response factor of each reaction product
are given in Table 23 and 24
38
Table 23 Order retention time and internal response factor of each product for n-
decane reaction
Order on the
GC trace
Compounds Retention Time
(min)
Internal
Response Factor
1 n-decane 344 0498
2 54-decanone (54 one) 1181 062
3 3-decanone (3 one) 1254 059
4 2-decanone (2 one) 1345 0588
5 54-decanol (54 ol) 1626 0606
6 3-decanol (3 ol) 1694 0598
7 2-decanol (2 ol) 1802 062
8 internal standard 2044 NA
9 pentanoic acid (C5OOH) 2525 1
10 1-decanol (1 ol) 2565 0616
11 hexanoic acid (C6OOH) 2930 0904
12 heptanoic acid (C7OOH) 3269 0822
13 octanoic acid (C8OOH) 3566 0806
14 nonanoic acid (C9OOH) 3838 08
15 decanoic acid (C10OOH) 4085 0788
39
Table 24 Order retention time and internal response factor of each product for n-
hexane reaction
(The hexanal can not be separated as it has the same retention time as 2-hexanol )
2523 Quantification and analysis of the reaction
According to Table 23 and 24 all the response factors for the known compounds were
determined Hence the amount of each known compounds in the product mixture can be
calculated using Equation 24
Order on the
GC trace
Compounds Retention Time
(min)
Internal
Response Factor
1 n-hexane 0858 0894
2 3-hexanone (3 one) 875 0762
3 2-hexanone (2 one) 1012 069
4 hexanal 1012 NA
5 3-hexanol (3 ol) 1692 0684
6 2-hexanol (2 ol) 191 066
7 internal standard 23325 NA
8 1-hexanol (1 ol) 2806 0685
9 hexanoic acid (C6OOH) 4066 09125
40
MassAC = (MassIS AreaAC K) (AreaIS)
Where K = Relative Response Factor
AreaIS = Area of Internal Standard in GC
MassAC = Mass of specific anticipated compound
MassIS = Mass of internal standard
AreaAC = Area of specific anticipated compound
Equation 24 Calculation of amount of products
Then the yield conversion and selectivity of the reaction can be calculated following the
formula below
Yield of each product () =
___________K x (Area of Product AreaIS) x MassIS x100
(Mass of n-decane (10g) Molar mass of decane x Molar mass of product)
Conversion () = Sum Yield of each product = Total Yield
Product Selectivity () = Yield of each product Total Yield
Further experimental and characterisation details are discussed in the corresponding results
chapters
41
26 References
[1] JK Edwards BE Solsona P Landon AF Carley A Herzing CJ Kiely GJ Hutchings
Journal of Catalysis 236 (2005) 69
[2] P Collier S Golunski C Malde J Breen R Burch Journal of the American Chemistry
Society 125 (2003) 12414
[3] Collier Paul John Golunskin Stanislaw Edmund US Patent No0032628 2005
[4] DCVu MMiyamoto NNishiyama SIchikawa YEgashira KUeyama Microporous
and Mesporosous Materials 115 (2008) 106
[5] GBF Seijger OL Oudshoorn WEJ van Kooten JC Jansen H van Bekkum CM
van den Bleek HPA Calis Micropurous and Mesoporous Materials 39 (2000) 195
[6] PANalytical httpwwwpanalyticalcomindexcfmpid=135
[7] httpwwwesercstonybrookeduProjectJavaBragg
[8] Providing Solutions To Your Diffraction Needs Cupertino Scitag inc (1999)
[9] httpmseiastateedumicroscopyhomehtml
[10]httpwwwifw-dresdendeinstitutesikmorganisationdep-31equipmentaes-
microprobe-phi660
[11] httpwwwuniversetodaycom81974atomic-absorption-spectroscopy
[12] httpwwwparrinstcom
[13] Andrews glass website httpwwwandrewsglasscomPRV_supporttpl
42
CHAPTER 3
Andrews Glass
Reactor
43
ANDREWS GLASS REACTOR
31 Introduction
In liquid phase long chain alkane selective oxidation studies the key results were reported by
Thomas for n-hexane oxidation [1-7] In his study Thomas used ALPO catalysts with air as
the oxidant The terminal selectivity can be extremely high (up to 87 conversion 655
selectivity with Co-ALPO-18) Iglesia [8] tried to reproduce Thomasrsquos results under similar
experimental conditions using Mn-ALPO catalysts However the conversion was quite low
(002-005) while the terminal selectivity was 7 only Iglesia concluded that Mn-ALPO
did not lead to any preference for terminal selectivity in contradiction with Thomasrsquo results
Iglesia published his own results using Mn-ZSM5 as the catalyst (Table 31) [9] Unlike
Thomasrsquos study Iglesia noticed the autoxidation reaction and demonstrated a clear difference
in the terminal selectivity in the presence of catalysts It was clear that when the catalyst was
present the terminal selectivity was initially high (24) but the selectivity declined when
conversion increased In contrast the terminal selectivity in the autoxidation was always 7-8
In this project it was attempted to obtain the high level of terminal selectivity as Iglesia did
Most of the reactions performed in this project were carried out in the Parr stainless steel reactor
with or without a PTFE liner However it was noticed that Iglesia et al employed the Andrews
glass reactor in their research Hence the focus of this chapter was the comparison between the
stainless steel reactor and the Andrews glass reactor Studies using the Andrews glass reactor
were also performed
44
Table 31 Iglesiarsquos results for oxidation of n-hexane with Mn-ZSM-5 catalysts
Time
(hours)
Conversion
()
Terminal selectivity ()
with Mn-ZSM-5
Terminal selectivity ()
Autoxidation
05 0007 24 7
25 0013 185 8
4 0047 15 8
7 01 10 7
32 Experimental
321 Apparatus and reaction
The Andrews glass reactors system was set up as shown below in Figure 31 The three glass
reactors (887 ml starter kit Andrews Glass) were heated in separate oil baths by three separate
hotplates Oxygen pressure was controlled in each reactor Temperature variations were
observed for the different reactors because of their separate heating controllers Reactors A and
B were found to have quicker heating rates than reactor C It always took reactor C several
minutes more to reach the temperature set point Hexane oxidation reactions were performed
under conditions equivalent to Iglesiarsquos work [8] 25 ml hexane 3 bar oxygen 130degC for short
time reactions
45
Figure 31 Andrews Glass Reactor System
322 Safety operating procedure
To avoid dangers of operation the safety operating procedure for the reactor is given as follows
To switch instruments on
Put beakers with silicon oil on top of the hotplates Hold the wire-mesh covered glass reactors
with clamps and immerse two-thirds of the glass reactor into the silicon oil baths Switch on
the power to the hotplates Temperature and stirrer speed are controlled by and displayed on
the hotplates Pressure is displayed on a gauge on the head of the reactor and can be controlled
by inlet and outlet valves also on the reactor head The glass reactors should be handled gently
Preparing a sample in the Andrews glass reactor
Place reactants in the glass cylinder Reactants should occupy no more than two-thirds of the
available space of the cylinder The cylinder is then aligned with the head and joined The
46
rubber ring in the head of the reactor should be well fitted into the top of the glass cylinder
Hold the head and the glass cylinder securely together and then tighten the head to the glass
cylinder carefully
Controlling the stirrer speed and temperature of the reactor
The stirrer speed and temperature can be set on the hotplate The temperature detector must be
immersed into the oil bath the depth of the detector head should be kept in the same level in
the glass cylinder
Allowing gas flow into the reactor
The Andrews glass reactor set-up has inlet and outlet valves (on the head part) The inlet valve
is connected to oxygen and is opened briefly to fill the reactor to the desired pressure The
outlet valve is kept closed during a reaction but remains open at all other times Both the inlet
and outlet valves turn clockwise to close Pressure in the cylinder is maintained when the outlet
and inlet valves are closed The pressure in the gas line is limited by a regular therefore
normally the pressure in the glass line is not higher than 5 bar However to avoid any accidents
when releasing the gas into or out of the cylinder open the inlet or outlet valves is slowly
Controlling the gas flow
Open the oxygen valve on the wall The pressure inside the glass reactor is controlled by turning
the glass inlet and outlet valves in the reactor head To increase the pressure turn the inlet valve
anti-clockwise To decrease the pressure turn the outlet valve anti-clockwise The gauge in the
reactor head will show the pressure inside the reactor
47
Purging the glass reactor
Before staring any reaction it is necessary to evacuate the air present in the reactor and fill the
reactor to the desired pressure with oxygen Open the oxygen valve on wall behind the reactors
This will allow the gas to enter the glass reactor when the inlet on the reactor head is opened
Fill the reactor to the desired pressure by repeatedly briefly opening and closing in the inlet
line Then close the inlet valve and open the outlet valve on the head slowly to release the
pressure This is repeated three times after which the reactor is pressurised and the inlet and
outlet valves are closed Close the gauge on the wall behind the reactors Monitor the pressure
in the reactor for approximately 5 minutes to ensure there are no leaks
Starting a reaction
After placing the sealed glass reactors and oil baths on the hotplate put the temperature detector
to the right position (as mentioned above) Purge the reactor and pressurise to the desired
working pressure Switch on the stirrer and set the desired temperature in the digital display
connected to the hotplates
Ending a reaction
If the reaction is to be stopped for a required time switch off the hotplate then put the reactor
into ice bath for quick cooling Once cool the gas is evacuated from the reactor by slowly
opening the outlet valve on the reactor head The cylinder can then be disconnected and the
reaction mixture emptied Always allow the reactor to cool before opening it
Cleaning the autoclave
After each reaction the reactor should be thoroughly washed and cleaned to remove all traces
of the reactants As well as cleaning the glass cylinders it is also necessary to clean the stirrer
bar
48
Instrument shutdown
Specified users will normally carry out instrument shutdown
Ensure that the hotplate especially the heating is switched off when the reaction is finish The
oxygen line to the equipment must also be closed when not used for filling the reactors and the
instrument lines vented
Emergency shutdown procedure
1 Switch off electricity at the sockets
2 O2 gas supply should be shut off at the cylinder
3 If it is safe to do so (ie no visible sign of leakage from the apparatus) remove the glass
reactor(s) from the hotplate(s) (if applicable)
4 Do not allow anyone to touch the equipment or any contents of the reactor unless the person
is a trained and competent user
323 Characterization techniques
Reaction samples were analysed by gas chromatography with a CP Wax 52CB column 25 m
053 mm 20 microns using a programmed temperature ramp Each sample was injected at
least twice
33 Results
331 Andrews glass reactor in blank hexane oxidation
Hexane oxidation was carried out under the same conditions 3 bar oxygen 130degC with various
amounts of hexane 10g (the amount consistent with using the Parr stainless steel reactor) and
25ml (Iglesiarsquos reported system) for 30 min and 1 hour
49
3311 Comparison between Andrews glass reactor and stainless steel reactor
Reactions were carried out over 30 min and 1h with 10 g hexane and repeated several times at
a stir speed 3 in the hotplate The oxidation results were given in Table 32 and Table 33
Table 32 Glass reactor 130degC 3 bar O2 10 g n-hexane stir speed 3 30 min
Reactor Conv () Selectivity ()
3 one 2 one 3 ol 2 ol 1 ol oic
A 00017 29 35 9 11 15 0
B 00010 33 36 9 13 7 0
Table 33 Glass reactor 130degC 3 bar O2 10 g n-hexane stir speed 3 1 h
Reactor Conv () Selectivity ()
3 one 2 one 3 ol 2 ol 1 ol oic
A 00060 34 34 7 12 11 0
B 00050 35 36 8 11 7 0
For the longer reaction time the 1-hexanol selectivity may have decreased slightly Compared
with the stainless steel reactor results reported previously (Table 34) the conversion in the
glass reactor is lower
Table 34 Steel reactor 130degC 5 bar O2 10g n-hexane blank 600 rpm 30 min
Reactor Conv () Selectivity ()
3 one 2 one 3 ol 2 ol 1 ol oic
Stainless steel
30min 00051 20 34 13 15 18
0
50
A Further time on-line study was performed to compare the two reactors The results were
shown in Table 35 and Table 36 From the results the blank reactions gave higher conversion
but lower terminal selectivity in the stainless steel reactor than the glass reactor which indicates
the stainless steel reactor itself may have some activity in the oxidation reaction
Table 35 Hexane auto-oxidation with glass reactor (reaction conditions 130degC 3 bar
O2 25 ml n-hexane 600 rpm time-on-line)
Time
(h)
Reactor Conv() Selectivity ()
Ketones Alcohols Acid Others 1-hexanol
05 A 00001 15 0 0 85 0
1 A 00002 16 13 1 70 5
2 A 00008 14 10 0 76 5
3 A 00118 13 11 0 76 6
4 A 00223 14 11 0 75 6
Table 36 Hexane auto-oxidation with stainless steel reactor (reaction conditions 130degC
3 bar O2 25 ml n-hexane 600 rpm time-on-line)
Time
(h)
Conv
()
Selectivity ()
Ketones Alcohols Hexanoic acid Others 1-Hexanol
0 0
1 0001 72 15 0 12 0
2 0002 65 24 0 8 2
3 0008 56 24 0 20 3
4 0022 63 18 0 19 1
51
3312 Repeat Iglesiarsquos blank reaction
A few reactions were performed under conditions equivalent to Iglesiarsquos work at 130ordmC 3 bar
O2 stir speed 2 for 30 min and 1 hour however no products were detected The GC sensitivity
may also be a reason for products not being detected It should be noted that the stir speed taken
in these reactions was lower than before the change is made because it was found when
catalysts were added to the reactor at a high stir speed the stirrer bar became trapped
3313 The unknown products in analysis
In a further analysis of GC traces it was found that there were large quantities of unknown
products in the hexane oxidation (as shown in Figure 32) which were not included in the
calculated results In order to have a clear product distribution the results were calculated
including these unknown products discussed in the following section in this chapter
Figure 32 The GC trace with the unknown products (marked with )
52
GC-MS analysis was then introduced to identify the known and unknown products With a
polar column in GC-MS all the known products in hexane oxidation have been successfully
identified and a few the unknown products have been successfully analysed Table 37 showed
the possible main unknown products They are all named as lsquoothersrsquo in the following result
tables
Table 37 List of suggested unknown products
Possible main unknown Products Retention time in GC-MS
2-pentanol 2-methyl- C6H14O 368
3-pentanol 3-methyl- C6H14O 384
4-methyl-2-pentacetate C8H16O 451
Propanoic acid 703
Nonanoic acid 1843
C6H12O4 2005
3314 Application of aqua regia as washing agent
In the previous reactions aqua regia was not always used as a washing agent To check if this
can influence the reaction results reactions were carried out immediately after washing the
reactors carefully with aqua regia (Table 38) Compared with the Table 39 (without washing
with aqua regia) the selectivity did not show much difference from the previous reactions
which were not washed with aqua regia
53
Table 38 130degC 3 bar O2 25 ml n-hexane stir speed 2 single reaction (2 and 4 h)
Time
(h)
Reactor Conv() Selectivity ()
Ketones Alcohols Acid Others 1-hexanol
05 A 0010 37 25 3 35 8
1 A 0019 27 29 2 42 9
2 B 0022 13 61 2 26 9
3 A 0060 29 16 1 54 10
4 B 0064 22 15 1 60 9
Table 39 130degC 3 bar O2 25 ml n-hexane modified time-on-line set-up stir speed 2 05
ndash 5 h 015 ml 124-trichlorobenzene
Time
(h)
Reactor Conv() Selectivity ()
Ketones Alcohols Acid Others 1-hexanol
05 A 0013 39 23 3 35 8
1 A 0023 28 28 1 43 9
2 A 0037 31 20 1 48 10
3 A 0061 27 18 1 54 10
4 A 0089 21 16 1 62 9
3315 Time-on-line reactions
Hexane oxidation reactions were performed with the Andrews glass reactor system heating
from room temperature to 130degC takes 5 min to 4 h The reaction conditions were equivalent
to Iglesiarsquos work 25 ml hexane 3 bar oxygen and 130degC
54
Reactions with time-on-line modification
In order to investigate the time-on-line oxidation status during a reaction a modification was
made to one of the glass reactors The modification consists of PTFE tubing being inserted into
the reaction solution through the reactor top The flow in the tubing can be controlled by two
PTFE valves outside the reactor Therefore samples can be taken while a reaction is running
The internal standard (124-trichlorobenzene Sigma-Aldrich ge99 015 ml) was added to
the solution before reaction In this section the reactions were all carried out in modified
reactors with a time-on-line sampling port Hexane oxidation reactions were still performed
under conditions equivalent to Iglesiarsquos work 25 ml hexane 3 bar oxygen and 130degC with
varied time period Reactions were repeated two times The terminal selectivity (hexanoic acid
+ 1-hexanol) is around 5-9 (Table 310 and Table 311)
Table 310 130degC 3 bar O2 25 ml n-hexane modified time-on-line set-up stir speed 2
05 ndash 5 h 015 ml 124-trichlorobenzene
Time
(h)
Reactor Conv() Selectivity ()
Ketones Alcohols Acid Others 1-hexanol
05 A 0003 44 21 2 33 7
1 A 0018 16 13 1 70 5
2 A 0057 14 10 0 76 5
3 A 0094 13 11 0 76 6
4 A 0163 14 11 0 75 6
5 A 0247 11 11 0 78 6
55
Table 311 130degC 3 bar O2 25 ml n-hexane stir speed 2 various times 015 ml 124-
trichlorobenzene repeated
Time (h) Reactor Conv() Selectivity ()
Ketones Alcohols Acid Others 1-hexanol
05 A 0005 30 14 0 56 5
1 A 0019 15 9 1 75 5
2 A 0059 13 9 0 78 5
3 A 0101 12 10 0 78 6
4 A 0160 14 11 0 75 6
5 A 0259 10 10 0 80 6
3316 Discussion
Figure 34 showed the conversion vs selectivity in all the blank reactions in this project They
showed similar terminal selectivities to Iglesiarsquos work (Figure 35) [8-9]
Blank reactions Conv vs termianl selectivity
0
1
2
3
4
5
6
7
8
9
10
0 005 01 015 02 025 03
Conversion ()
Term
inal
Sele
cti
vit
iy (
)
56
Figure 34 Conversion vs terminal selectivity in all the blank reactions
Figure 35 Iglesiarsquos results [8-9]
332 Reaction with Mn-ZSM5 (from JM)
The Mn-ZSM5 catalyst as described in Iglesiarsquos work was provided by Johnson Matthey to
investigate the activity and selectivity under the equivalent conditions However it was found
that both the conversion and terminal selectivity was extremely low (Table 312)
The Mn-ZSM5 catalyst was activated before each reaction and then used in the reaction after
cooling down to the room temperature Therefore it is possible that the sample absorbed
moisture which could block the pore structure Hence a time-on-line test reaction was
performed to check this In the reaction shown below the Mn-ZSM5 was put into the hexane
as soon as possible after being removed from the furnace From the results (Table 313) the
hot catalyst is still not very active and shows little difference in product distribution from the
cool catalyst The results are still different from Iglesiarsquos
57
Table 312 130degC 3 bar O2 25 ml n-hexane stir speed 2 varied time 100 g Mn-ZSM5
015 ml 124-trichlorobenzene
Time (h) Reactor Conv() Selectivity ()
Ketones Alcohols Acid Others 1-hexanol
05 A 0007 15 1 0 84 0
1 A 0010 10 0 0 90 0
2 A 0015 12 1 0 87 0
3 A 0018 16 2 0 82 0
4 A 0021 18 2 0 80 0
5 A 00294 17 2 0 81 0
Table 313 130degC 3 bar O2 25 ml n-hexane stir speed 2 time-on-line 1 g Mn-ZSM5
Time (h) Reactor Conv() Selectivity ()
Ketones Alcohols Acid Others 1-hexanol
30min A 0
1h A 0
4h A 002 29 12 0 59 2
34 Conclusion
Comparison between the Andrews glass reactor and Parr stainless steel reactor showed that the
blank reactions got higher conversion but lower terminal selectivity in the stainless steel reactor
than the glass reactor which indicates the stainless steel reactor itself may have some activity
in the oxidation reaction
58
The time on-line blank reaction results showed similar terminal selectivities to Iglesiarsquos work
in autoxidation [8-9] with the terminal selectivity 5-9 However the terminal selectivity
with Mn-ZSM5 was still very low (~0) Iglesiarsquos results cannot be reproduced
Except the linear alcohol and acids calibrated and listed in the experimental section in Chapter
2 further analysis found a few unknown products after the oxidation reaction GC-MS analysis
was performed and some of the unknown products were identified as the acids and other C6
alcohols
35 References
[1] JM Thomas R Raja G Sankar RG Bell Nature (1999) 227
[2] R Raja JM Thomas Chemical Communications (1998) 1841
[3] R Raja G Sankar JM Thomas Journal of the American Chemistry Society 121
(1999) 119
[4] JM Thomas R Raja G Sankar R G Bell Studies in Surface Science and Catalysis
130 (2000) 887
[5] R Raja G Sankar JM Thomas Angewandte Chemistry 39 (2000) 231
[6] JM Thomas R Raja G Sankar RG Bell Accounts of Chemical Research 34 (2001)
191
[7]R Raja JM Thomas Journal of Molecular Catalysis A 3 (2002) 181
59
[8] B Modeacuten B Zhan J Dakka J G Santiesteban E Iglesia Journal of Physical
Chemistry 111 (2007) 1402
[9] B Zhan B Modeacuten J Dakka JG Santiesteban E Iglesia Journal of Catalysis 245
(2007) 316
60
CHAPTER 4
Catalytic
Investigation for
Teabag Coating
61
CATALYTIC INVESTIGATION
FOR TEABAG COATING
41 Introduction
The aim of the project is to realise the terminal oxidation of long chain n-alkanes for example
using n-decane and n-hexane as model compounds to produce 1-decanol decanoic acid or 1-
hexanol and hexanoic acid (Figure 41) in liquid phase reactions There are two challenges in
this study how to enhance the activity of the reaction and how to control the regioselectivity
of the oxidation To overcome the challenges various catalysts were introduced into the project
Figure 42 Aim of the thesis ndash terminal oxidation of decane
As introduced in Chapter 1 teabag technology involves two components the active supported
catalyst substrate and the shape selective coating In this chapter the focus is to find the
relatively active and selective substrate catalysts
62
42 Experimental
421 Metalsupport catalysts
A series of metalsupport catalysts were prepared in the project by the impregnation method
In the case Pd Au and Pt were employed The synthesis method is shown as below [1]
Preparation method for the 5 wt PdTiO2
i Dissolve 05 g PdCl2 in 10 ml deionized water Stir and heat at 85degC for 30 min
ii Place 19 g TiO2 in a Petri dish Dropwise add the PdCl2 solution to the Petri dish Shake
the dish until the powder and solution mix well
iii Dry the paste at 110degC for 16 h Grind the paste and then calcine at 400degC for 3 h
Preparation method for the 5 wt AuTiO2
i Prepare the HAuCl4 solution which includes 01 g Au3+
ii Place 19 g TiO2 in a beaker Dropwise add the HAuCl4 solution to the beaker Stir 30
min until the powder and solution mix well
iii Dry the paste at 110degC for 16 h Grind the paste and then calcine at 400degC for 3 h
Preparation method for the 5 wt PtTiO2
i Use 02655g H2PtCl6middot6H2O and 10g deionized water to prepare the solution which
includes 01g Pt4+
ii Place 19g TiO2 in a beaker Dropwise add the H2PtCl6 solution to the beaker Stir until
the powder and solution mix well
iii Dry the paste at 110degC overnight Grind the paste and then calcine at 500degC for 6h
Parts of the prepared catalysts were reduced in H2 To prepare the reduced catalysts the
63
catalysts were calcined in flowing H2 at 300degC for 3 h
Other supports were also employed such as activated carbon (Aldrich G60 Waterlink
Sutcliffe Carbons Activated Carbon Grade 207A Mesh 12 20) graphite SiO2
(Grace gt99 60-100 mesh) and alumina
The reaction conditions taken for the powder form catalysts usually are 200 psi O2 600 rpm
100degC110degC 10 g n-decane and 005 g catalyst
422 RhRu loaded catalysts
Synthesis of catalyst
1 wt and 3 wt Rhα-Al2O3 Rhγ-Al2O3 Ruγ-Al2O3 were prepared by the incipient
wetness method and deposition precipitation (DP) method separately The incipient wetness
method was carried out as before Taking the 1 wt Rhγ-Al2O3 as an example to prepare 1g
1 wt Rhγ-Al2O3 099 g γ-Al2O3 was dispersed in a solution of 0025 g RhCl3middotxH2O ( Alfa
Aesar) The water amount in the solution was the least amount to form a paste The paste was
dried overnight at 110degC and then calcined at 400degC for 3 h The DP preparation is carried out
as followed (taking the 3 wtRhγ-Al2O3 as an example) to prepare 1 g 3 wt Rhγ-Al2O3
099 g γ-Al2O3 was first dispersed in an aqueous solution of 0075 g RhCl3middotxH2O A quantity
of 1 M Na2CO3 was slowly added to the RuCl3 solution until the pH value of the mixture
reached 105 The suspension was then maintained at the same pH for 1 h during the
precipitation process The resulting solid was washed with deionized water several times until
no chloride ion was detected by addition of silver nitrate solution to the filtrate All the catalysts
were dried at 110degC (12 h) in air Finally they were calcined at 500degC for 5 h in air [2]
Alumina (Saint-Gobain surface area 025 m2g) spheres have been tested in this project to date
The vacuum incipient wetness method was employed in the preparation of sphere catalysts To
64
prepare 1 g catalyst 1 g alumina sphere was placed into a sealed two necked round bottom
flask The flask was heated to 80degC with an oil bath and evacuated by a vacuum pump for 1 h
The calculated amount of metal solution was added into the flask through a syringe The flask
was shaken until all the metal solution was absorbed into the spheres Then the spheres were
dried at 110degC overnight and then calcined at 400degC for 3 h
Reactions
The reaction conditions taken for the powder form catalysts usually are 15 bar O2 600 rpm
110degC 10 g n-decane and 005 g catalyst With the sphere supports different from the previous
work the reaction system has to be adjusted as single sphere is much heavier (eg the mass of
a single silica sphere 009 g) than the catalysts used in the previous reactions (005 g in each
reaction)
43 Results
431 Pd Au Pt loaded supported catalysts
The metal loaded catalysts and reduced catalysts were used in reactions under the conditions
100degC 200 psi O2 24 h 005 g catalyst and 600 rpm
65
Table 41 100degC 200 psi O2 24 h 10 g n-decane 005 g catalyst and 600 rpm
Catalyst Conv
()
Selectivity ()
54
one
3
one
2
one
54
ol
3
ol
2
ol
C5
OOH
Di-
one
C6
OOH
Di-
one
Di-
one
C7
OOH
C8
OOH
C10
OOH
PdTiO2 009 0 0 3 17 20 19 0 0 0 0 0 6 2 1
Reduced
PdTiO2 0 0 0 0 0 0 0 0 0 0 0 0 0 0 0
AuTiO2 017 0 0 0 16 2 26 0 13 0 2 2 5 3 4
AuTiO2 025 0 0 15 18 0 22 0 9 0 3 2 10 2 9
Reduced
AuTiO2 0005 0 0 0 0 0 100 0 0 0 0 0 0 0 0
PtTiO2 0 - - - - - - - - - - - - - -
PtTiO2 0 - - - - - - - - - - - - - -
Reduced
PtTiO2 0 - - - - - - - - - - - - - -
These results (Table 41) show very low conversion and are in fact lower than those for a blank
reaction (01-03) demonstrating an inhibition of some part of the reaction by the PdTiO2
With Au TiO2 it was found in the product distribution that a number of C10 ketones formed in
the reaction PdTiO2 inhibits the auto-oxidation reaction
Initial results indicated poor activities with PdTiO2 AuTiO2 and PtTiO2 for decane oxidation
in both liquid reactions at 100degC
66
432 Higher temperature reactions
With the intention of obtaining higher conversion it was decided to increase the reaction
temperature to 110degC More catalysts were prepared and tested at 100degC and 110degC The
conversion and product distribution results were shown in Table 42 and Table 43 It was still
found that none of the catalysts showed good activity at 100degC However the Au catalysts
appear to be better than others on TiO2 and SiO2 supports
Table 42 100 degC n-decane 10 g catalyst 005 g 200 psi O2 24 h
Catalyst Conv
()
Selectivity ()
54
one
3
one
2
one
54
ol
3
ol
2
ol
C5
OOH
Di-
one
C6
OOH
C7
OOH
C8
OOH
C10
OOH
Blank 030 22 13 18 7 6 10 4 11 0 6 2 1
TiO2
TiO2 010 34 22 8 10 3 8 9 7 0 0 0 0
AuTiO2 025 15 18 0 22 0 9 5 10 2 9 0 0
PtTiO2 0 - - - - - - - - - - - -
Pd-
AuTiO2 004 37 6 6 5 3 2 7 34 0 0 0 0
Carbon
Carbon 002 13 0 0 65 0 0 0 22 0 0 0 0
AuCarbon 0 - - - - - - - - - - - -
SiO2
AuSiO2 017 34 28 2 3 11 0 11 7 0 1 3 0
Au-
PdSiO2 029 17 13 9 9 11 26 5 8 0 2 1 0
67
Table 43 110degC n-decane 10 g catalyst 005 g 15 bar O2 24 h
Catalyst Conv
()
Selectivity ()
54
one
3
one
2
one
54
ol
3
ol
2
ol
C5
OOH
Di-
one
C6
OOH
C7
OOH
C8
OOH
C10
OOH
Blank 144 26 7 8 17 2 2 4 12 8 6 1 2
TiO2
TiO2 368 19 10 16 13 8 9 6 10 0 6 1 1
AuTiO2 571 24 15 4 4 2 13 7 20 1 4 2 2
Repeat
AuTiO2 288 15 13 13 11 8 11 5 8 0 7 7 1
PtTiO2 005 0 0 0 52 0 0 0 48 0 0 0 0
SiO2
SiO2 121 27 18 13 6 4 5 7 10 8 3 0 0
AuSiO2 202 27 18 21 6 2 2 5 13 2 1 2 0
AuPdSiO2 187 14 15 16 10 8 11 6 5 5 7 1 1
Al2O3
Al2O3 039 26 14 6 18 5 4 7 8 10 1 0 0
AuAl2O3 104 15 11 12 21 6 3 7 15 5 3 2 1
Carbon
AuCarbon 001 0 0 0 0 0 0 0 100 0 0 0 0
Blank reactions have been repeated and got conversions range from 144-202
68
433 Discussion
Table 44 shows the comparison of the conversions at 100degC and 110degC The increase of the
reaction temperature from 100 degC to 110 degC resulted in an increase in the conversions observed
At the temperature of 110 degC a number of catalysts showed some activity but it must also be
remembered that there is also a considerable rise in auto-oxidation through a temperature
increase Therefore a radical scavenger was introduced
Table 44 Conversion at 100degC and 110degC
Catalyst Conv at
100degC()
Conv at
110degC()
Blank 030 144
TiO2 010 368
AuTiO2 025 571 (288)
PtTiO2 0 005
AuSiO2 017 202
AuPdSiO2 029 187
AuCarbon 0 001
434 Use of a radical scavenger
In order to identify the real activity of the catalyst Tempo has been employed in the reactions
to kill the auto-oxidation by acting as a radical scavenger The TEMPO form used was
stabilized on a polymer support
69
Table 45 110degC n-decane 10 g catalyst 005 g TEMPO 0005 g 15 bar O2 24 h
Catalyst Conv
()
Selectivity ()
54
one
3
one
2
one
54
ol
3
ol
2
ol
C5
OOH
Di-
one
C6
OOH
C7
OOH
C8
OOH
C10
OOH
Blank 0 - - - - - - - - - - - -
TiO2
TiO2 011 30 13 4 9 10 22 7 5 0 0 0 0
AuTiO2 028 17 14 15 8 15 14 7 6 1 1 2 0
SiO2
SiO2 086 21 13 13 5 3 2 4 30 4 6 1 1
AuSiO2 099 21 14 18 8 7 8 5 9 4 4 4 1
Al2O3
AuAl2O3 062 15 10 17 7 12 13 5 10 5 4 1 0
Table 46 Conversions without and with TEMPO
Catalyst Conv without
TEMPO()
Conv with
TEMPO()
Blank 144 0
SiO2 121 086
AuSiO2 202 099
TiO2 368 011
AuTiO2 571288 028
AuAl2O3 104 062
70
The results show a greater drop in conversion for the TiO2 based samples than for the SiO2 and
Al2O3 samples This decrease is most marked as the TiO2 samples have the greatest conversion
without TEMPO and become those with the lowest conversion once the radical scavenger is
added The level of conversion obtained from catalytic processes still remains too low at this
stage to develop further with a coating so the search for a suitable materialconditions was
continued
435 Development of the catalyst preparation method
The impregnation method used previously within this work used a large excess of water It was
thought that this may be leading to disadvantageous distribution of metal particles both in
terms of size and distribution within the pores of the material An alternative method of
preparation using the incipient wetness method to only fill the pores of the material was
therefore used and compared to the previous method The support materials were exposed to
the same preparation conditions (acidheat treatments) so that the effects of these could be
negated Please note that from here the modified GC program and column are used to analyse
the products Table 47 reports the results from a catalyst tested by both the old and new
methods A higher conversion is reported with the new method and an increase in acid
selectivity
71
Table 47 Comparison between GC analysis methods
Catalyst Con
v
()
Selectivity ()
54
one
3
one
2
one
54
ol
3
ol
2
ol
C5
OOH
1
ol
C6
OOH
C7
OOH
C8
OOH
C9
OOH
C10
OOH
Al2O3(Old) 039 26 14 18 6 5 4 7 - 10 1 0 -
1
Al2O3(New) 069 217 150 176 60 43 74 72 14 61 90 20 06
15
Table 48 24h 110ordmC 600 rpm 15 bar Oxygen n-decane (10 g) 005 g catalyst
Catalyst Conv
()
Selectivity ()
54
one
3
one
2
one
54
ol
3
ol
2
ol
C5
OOH
1
ol
C6
OOH
C7
OOH
C8
OOH
C9
OOH
C10
OOH
TiO2 196 182 109 135 76 48 78 114 10 122 79 09 19 17
AuTiO2 343 275 127 32 96 70 52 83 09 109 112 11 05 19
SiO2 161 262 172 183 43 33 58 73 10 63 68 10 04 21
AuSiO2 218 178 135 132 54 35 68 82 11 115 125 36 05 22
Graphite 281 177 133 150 95 61 93 82 11 67 87 15 06 22
AuGrap
hite 387 145 106 110 73 48 74 87 15 111 133 67 10 22
G60 0 - - - - - - - - - - - - -
AuG60 0 - - - - - - - - - - - - -
72
Graphite was tried as the support this time and was the catalyst with the highest conversion so
far The conversion and selectivity of products are shown graphically in Figure 42 to Figure
47
Figure 42 24 h 110ordmC 600 rpm 15 bar Oxygen 005 g TiO2
Total Yield ()=196
00
50
100
150
200
250
C1
C2
C3
C4
C5
Penta
noic A
cid
Hex
anoic
Acid
Hep
tanoi
c Aci
d
Octan
oic Aci
d
nona
noic A
cid
Positions of Oxidation for C10 Products and Cracked Acids
Ketones
Alcohols
Acids
73
Figure 43 24h 110 ordmC 600 rpm 15 bar Oxygen 005 g AuTiO2
Figure 44 24h 110 ordmC 600 rpm 15 bar Oxygen 005 g SiO2
Total Yield ()=343
00
50
100
150
200
250
C1
C2
C3
C4
C5
Penta
noic A
cid
Hex
anoic
Acid
Hep
tanoi
c Aci
d
Octan
oic Aci
d
nona
noic A
cid
Positions of Oxidation for C10 Products and Cracked Acids
Ketones
Alcohols
Acids
Total Yield ()=161
00
50
100
150
200
250
300
C1
C2
C3
C4
C5
Penta
noic A
cid
Hex
anoic
Acid
Hep
tanoi
c Aci
d
Octan
oic Aci
d
nona
noic A
cid
Positions of Oxidation for C10 Products and Cracked Acids
Ketones
Alcohols
Acids
74
Figure 45 24 h 110 ordmC 600 rpm 15 bar Oxygen 005 g AuSiO2
Figure 46 24 h 110 ordmC 600 rpm 15 bar Oxygen 005 g graphite
Total Yield ()=218
00
50
100
150
200
250
C1
C2
C3
C4
C5
Penta
noic A
cid
Hex
anoic
Acid
Hep
tanoi
c Aci
d
Octan
oic Aci
d
nona
noic A
cid
Positions of Oxidation for C10 Products and Cracked Acids
Ketones
Alcohols
Acids
Total Yield ()=281
00
50
100
150
200
250
300
C1
C2
C3
C4
C5
Penta
noic A
cid
Hex
anoic
Acid
Hep
tanoi
c Aci
d
Octan
oic Aci
d
nona
noic A
cid
Positions of Oxidation for C10 Products and Cracked Acids
Ketones
Alcohols
Acids
75
Figure47 24 h 110 ordmC 600 rpm 15 bar Oxygen 005 g AuGraphite
436 Ru and Rh loaded catalysts
From the literature the α- and γ-alumina supports are two of the most widely used supports for
the preparation of RuRh catalysts and zeolite coating It should be noted that from the previous
results with gold the alumina powder support showed less activity than the titania and silica
powder supports however titania support does not suit the coating conditions therefore
several different types of alumina supports were selected and tested in this section
Total Yield ()=387
00
20
40
60
80
100
120
140
160
180
200
C1
C2
C3
C4
C5
Penta
noic A
cid
Hex
anoic
Acid
Hep
tanoi
c Aci
d
Octan
oic Aci
d
nona
noic A
cid
Positions of Oxidation for C10 Products and Cracked Acids
Ketones
Alcohols
Acids
76
4361 α-phase alumina powder support
The 5 wt RhAl2O3 used in the test was prepared by the incipient wetness method using
Al2O3 - calcined powder primarily α-phase 100-325 mesh and RhCl3middotxH2O (Rh 40 wt )
The 5 wt RhAl2O3 powder catalyst have been tested at 100degC and 110degC Table 49 shows
the results for the 6 h oxidation at 100degC The result for the blank reaction at the same
temperature was given as a comparison
Table 49 100degC 15 bar 10 g n-decane 005 g catalyst 6 h
Catalyst Conv
()
Selectivity ()
54
one
3
one
2
one
54
ol
3
ol
2
ol
1
ol
C5
OOH
C6
OOH
C7
OOH
C8
OOH
C9
OOH
C10
OOH
Blank 002 206 134 173 67 48 87 19 150 41 52 08 04
12
α-Al2O3 0008 202 135 211 84 62 104 24 145 18 15 0 0
0
5Rhα-
Al2O3 002 204 138 202 84 64 102 24 138 18 22 02 02
0
77
Table 410 110degC 15 bar 10 g n-decane 00 5g catalyst 6 h
Catalyst Conv
()
Selectivity()
54
one
3
one
2
one
54
ol
3
ol
2
ol
1
ol
C5
OOH
C6
OOH
C7
OOH
C8
OOH
C9
OOH
C10
OOH
Blank 007 287 172 232 35 24 41 10 154 22 19 02 01
0
α-Al2O3 006 222 141 195 52 39 70 13 186 43 29 04 02
01
5Rhα-
Al2O3 006 221 138 185 58 44 71 14 210 25 27 02 02
01
It is found the 5 wt RhAl2O3 did not show activity above that observed for the autoxidation
at 100degC while the product distribution between the Al2O3 with and without the addition of
5Rh is very similar At a raised temperature 110degC it is again found that there is no change
in the activity and product distribution between the autoxidation and Al2O3 with and without
the addition of 5Rh (Table 410) According to the results at 100degC and 110degC it seems that
the Rh did not help the oxidation on the Al2O3 support This may be due to the fact that the 5
wt loading of Rh is too high a concentration for the Al2O3 support A later BET analysis
showed that the surface area of this kind of Al2O3 powder is 1m2g which means the 5 wt
loading of Rh is too concentrated for the α-Al2O3 Therefore a less loading of Rh should be
tested
The reaction results with a 01 wt Rh loading at 110oC are given in Table 411 From this
table it is found that both the conversion and selectivity are quite similar between the blank α-
Al2O3 and the metal added catalyst which means the 01 wt Rhα-Al2O3 powder catalyst is
inactive The α-Al2O3 with a low surface area is not a suitable support for the project
78
Table 411 110degC 15 bar 10 g n-decane 005 g catalyst 6 h
Catalyst Conv
()
Selectivity ()
54
one
3
one
2
one
54
ol
3
ol
2
ol
1
ol
C5
OOH
C6
OOH
C7
OOH
C8
OOH
C9
OOH
C10
OOH
Blank 007 287 172 232 35 24 41 10 154 22 19 02 01
0
α-Al2O3 006 222 141 195 52 39 70 13 186 43 29 04 02
01
01Rh
α-Al2O3 006 221 138 185 58 44 71 14 210 25 27 02 02
01
4362 γ-phase alumina powder support
In order to allow a higher loading of Rh on the support the γ-Al2O3 with a surface area of 140
m2g was employed at this time A 3 wt Rh was added to the γ-Al2O3 as an initial test (Table
412) The product distribution for blank and the α-Al2O3 based catalyst reactions under the
same conditions are given as a comparison
According to Table 412 there is no difference between the blank α-Al2O3 support and the 01
wt Rh added catalyst however there is a definite increase in the activity with a 3 Rh
addition on the γ-Al2O3 As well as the conversion increase the product distribution changes ndash
compared with the blank γ-Al2O3 support the selectivity for the ketones decreased while the
cracked acids increased It is clear that the particle size and concentration of active centre on
the supports significantly influence the activity of the catalyst Therefore a further
investigation was carried out A lower loading of Rh on the same support and other catalyst
preparation technique was tried to gain a best performance
79
Table 412 110degC 15 bar 10 g n-decane 005 g catalyst 6 h
Catalyst Conv
()
Selectivity ()
54
one
3
one
2
one
54
ol
3
ol
2
ol
1
ol
C5
OOH
C6
OOH
C7
OOH
C8
OOH
C9
OOH
C10
OOH
Blank 007 287 172 232 35 24 41 10 154 22 19 02 01
0
α-Al2O3 006 222 141 195 52 39 70 13 186 43 29 04 02
01
01Rh
α-Al2O3 006 221 138 185 58 44 71 14 210 25 27 02 02
01
γ-Al2O3 003 214 138 245 90 67 125 27 68 04 05 0 0
03
3Rhγ-
Al2O3 102 155 109 131 91 57 84 13 158 101 64 14 03
21
Different loadings of Rh by different preparation technique on γ -Al2O3
1 wt and 3 wt Rhγ-Al2O3 were prepared by incipient wetness method and deposition
precipitation method respectively and the reaction results are given below
80
Table 413 110degC 15 bar 10 g n-decane 005 g catalyst 6 h (by incipient wetness
method)
Catalyst Conv
()
Selectivity ()
54
one
3
one
2
one
54
ol
3
ol
2
ol
1
ol
C5
OOH
C6
OOH
C7
OOH
C8
OOH
C9
OOH
C10
OOH
Blank 007 287 172 232 35 24 41 10 154 22 19 02 01 0
untreated
γ-Al2O3 003 214 138 245 90 67 125 27 68 04 05 0 0
03
1Rhγ-
Al2O3 062 163 113 139 73 49 77 14 177 96 70 10 02
16
3Rhγ-
Al2O3 093 155 109 131 91 57 84 13 158 101 64 14 03
21
Table 414 110degC 15 bar 10 g n-decane 005 g catalyst 6 h (by deposition precipitation
method)
Catalyst Conv
()
Selectivity ()
54
one
3
one
2
one
54
ol
3
ol
2
ol
1
ol
C5
OOH
C6
OOH
C7
OOH
C8
OOH
C9
OOH
C10
OOH
Blank 007 287 172 232 35 24 41 10 154 22 19 02 01 0
Untreated
γ-Al2O3 003 214 138 245 90 67 125 27 68 04 05 0 0
03
1Rhγ-
Al2O3 032 174 121 163 70 49 81 15 182 72 58 07 03
07
3Rhγ-
Al2O3 030 162 110 156 85 58 96 16 176 68 55 07 04
08
81
Having a cross comparison among the results a few conclusions can be drawn a) with the
incipient wetness method the different loading of Rh makes a difference in the activity
however the difference in selectivity is limited b) with the DP method the activity with
different loading can be regarded as the same within the experimental error the catalysts
prepared by DP are less active than by the incipient wetness method c) with higher Rh loading
the selectivity of ketones decreased while the internal alcohol increased in comparison with the
autoxidation untreated γ-Al2O3 and less loading of Rh catalyst but the changes between the
two different loading samples were not significant the total cracked acids selectivity does not
change for both the two preparation technique
Using the 3 wt Rhγ-Al2O3 from the same batch four parallel reactions were done to confirm
the results (Table 415) According to the table reaction 1 and reaction 2 were done when the
batch was new and the quite similar conversion and product distribution was reached however
the reaction 3 and 4 which were done days later different product distributions and similar
conversion was reached with the same loading catalyst prepared by DP method This probably
means the Rh formed by the incipient wetness method is not stable in air and became inactive
in the storage
82
Table 415 110degC 15 bar 10 g n-decane 005 g 3 wtRhγ-Al2O3 6 h (by incipient
wetness method)
Reaction Conv
()
Selectivity ()
54
one
3
one
2
one
54
ol
3
ol
2
ol
1
ol
C5
OOH
C6
OOH
C7
OOH
C8
OOH
C9
OOH
C10
OOH
1 093 155 111 136 91 57 86 12 161 94 62 13 03
21
2 102 155 109 131 91 57 84 13 158 101 64 14 03
21
3 032 176 124 171 91 59 95 13 126 65 51 10 03
15
4 041 159 114 153 94 61 96 15 137 76 61 12 04
15
Different metal on the same support
Ru is also a metal with suggested possible activity in the system Therefore the 3 wt Ruγ-
Al2O3 was prepared by the incipient wetness method and DP method as well 3 wt Rh Au
and Ru were added to γ-Al2O3 support respectively and then compared in Table 416 It looks
that by the incipient wetness prep the Rh is the most active system while the Ru is not working
The 3 wt Ruγ-Al2O3 prepared by DP method showed no activity at all
83
Table 416 110degC 15bar 10g n-decane 005g catalyst 6h (by incipient wetness method)
Catalyst Conv
()
Selectivity ()
54
one
3
one
2
one
54
ol
3
ol
2
ol
1
ol
C5
OOH
C6
OOH
C7
OOH
C8
OOH
C9
OOH
C10
OOH
γ-Al2O3 003 214 138 245 90 67 125 27 68 04 05 0 0
03
3Rhγ-
Al2O3 102 155 109 131 91 57 84 13 158 101 64 14 03
21
3Auγ-
Al2O3 036 142 102 145 97 73 120 20 139 62 84 05 03
07
3Ruγ-
Al2O3 0004 351 159 192 127 64 108 0 0 0 0 0 0
0
4363 Loading with alumina spheres
To allow the addition of zeolite coating the metal added sphere catalyst needs to be tested
With a very low surface area of the alumina sphere (diameter = 5 mm surface area = 025
m2g) only a very low loading is allowed on it or the metal on the surface would be too
concentrated to react with the alkanes Table 417 shows the reaction results with 01wt Au
and Rh added alumina spheres However it was found that such low loadings do not help the
activity the conversion with the addition of metal is even lower than the blank spheres But
the 01Rhalumina sphere can achieve a quite different product distribution ndash the selectivity
of the cracked acids is quite low
As we know a low surface sphere is better for the zeolite coating however it limits the
performance of the active centre This is an incompatible problem which needs to be solved
84
As a trial to add more active centres on the support for zeolite coating a smaller alumina sphere
was also employed This type of alumina sphere is with 1mm diameter and 203 m2g surface
area An experiment with the addition of 3 wt Au proves the active centre on it works better
than the low surface area alumina sphere (Table 418) As nobody used a high surface area
alumina support in the zeolite coating before we did not know what would happen when it is
coated A test was carried out and discussed in Chapter 6
Table 417 110 degC 15 bar 10 g n-decane 6 h 600 rpm 2 spheres (low surface area
Al2O3 sphere)
Catalyst
Conv
()
Selectivity ()
54
one
3
one
2
one
54
ol
3
ol
2
ol
1
ol
C5
OOH
C6
OOH
C7
OOH
C8
OOH
C9
OOH
C10
OOH
Untreated
Al2O3
spheres 021 207 131 168 64 45 73 18 190 49 44 03 02
06
01 Au
Al2O3
spheres 012 142 129 196 77 54 88 18 188 46 53 03 02
04
01 Rh
Al2O3
spheres 004 233 159 249 87 69 111 30 111 05 07 0 11
03
85
Table 418 110degC 15 bar 10 g n-decane 6 h 600 rpm 005 g spheres (high surface area
Al2O3 sphere)
Catalyst Conv
()
Selectivity ()
54
one
3
one
2
one
54
ol
3
ol
2
ol
1
ol
C5
OOH
C6
OOH
C7
OOH
C8
OOH
C9
OOH
C10
OOH
untreated
Al2O3
spheres 004 215 138 216 92 64 106 25 102 14 20 02 04
04
3 Au
Al2O3
spheres 026 235 148 188 54 38 60 15 158 49 44 04 01
07
44 Conclusion
Both decane and hexane oxidation have been studied as model reactions The reactions were
carried out using either a Parr stainless steel reactor or an Andrews glass reactor under a range
of conditions Various catalysts have been tested for decane oxidation at the beginning of the
project eg 5 wtAuTiO2 25 wtAu-25 wtPdSiO2 Most of the catalysts showed
very low conversion and very poor terminal selectivity Increasing the temperature leads to
higher conversion but results to more cracked products and less selectivity for oxygenated C10
products Figure 48 shows the activity of the auto-oxidation and the catalysts activity From
this figure it can be seen that the most active catalyst was 5 wt AuTiO2 However these
catalysts did not show good terminal alcohol selectivity whereas the cracked acid selectivity
was high (320) (Figure 49)
86
Figure 48 Conversion with different catalysts (reaction conditions 110oC 10 g n-
decane 005 g catalyst 15 bar O2 600 rpm stainless steel reactor)
Figure 49 Product distribution with 5 wt AuTiO2 (reaction conditions 110oC 10 g
n-decane 005 g catalyst 15 bar O2 600 rpm stainless steel reactor)
87
45 References
[1] J K Edwards B E Solsona P Landon A F Carley AHerzing CJ Kiely and GJ
Hutchings Journal of Catalysis 235 (2005) 69
[2] P Siva Sankar Reddy N Pasha MGV Chalapathi Rao N Lingaiah I Suryanarayana
PS Sai Prasad Catalysis Communications 8 (2007) 1406
88
CHAPTER 5
Cyclodextrin Covered
Catalysts
89
CYCLODEXTRIN COVERED CATALYSTS
51 Introduction
Cyclodextrins (CDs) are cyclic oligosaccharides composed of six (alpha) seven (beta) or eight
(gamma) glucopyranose units linked by α(1-4)-glycosyl bonds that have the shape of hollow
truncated cones They have a central cavity of 6-10 nm which can form complexes with various
organic compounds in aqueous solution inside their hydrophobic cavities [1] Due to their
unusual properties cyclodextrins have been widely investigated and utilized in pharmacy
biology the food industry analytical chemistry separation science and various other areas [2-
9]
Figure 53 Chemical structure of α- and β-CDs
Although the application of cyclodextrins as a shape-selective material has been widely
reported the number of reports focusing on their application to the oxidation of linear alkanes
is limited The first literature concerning alkane oxidation with cyclodextrins was published in
1972 by Lammers [10] Lammers et al proposed that α-CD derivatives can encapsulate one n-
hexane molecule in its stretched conformation in the interior of the cavity whereas β-CD
derivatives can encapsulate one n-hexane molecule in a compact coil form (but only loosely
90
bound) Based on this Otsuka published an article in 1991 on the application of CDs for the
terminal oxidation of n-hexane in a H2-O2 fuel cell [11] In 2000 Otsuka and Yamanka used
FeCl3graphite as the host cathode to study the effect of cyclodextrin additives on the selective
oxygenation at the primary carbon of n-hexane [12] They demonstrated that when n-hexane
was introduced to the cavity of the cyclodextrin the methylene CndashH bonds of n-hexane are
blocked by the walls of the cyclodextrins from an attack by the active oxygen species so
oxygenation occurs exclusively at the terminal carbons As a result they reported that when α-
and β-CDs were added to the FeCl3graphite cathode the selectivity for terminal oxygenation
increases (selectivity for 1-hexanol ~12) compared with that of the normal FeCl3graphite
cathode
Based on these studies it is clear that cyclodextrins can be an effective shape-selective material
in the hexane oxygenation reactions by the electrochemistry system However it would be
interesting to see if there is a less expensive and easier method to apply cyclodextrins to alkane
oxidation In this project the possibility of using cyclodextrins as an organic shape selective
coating over catalysts for the oxidation of long chain alkanes was investigated
The idea of using CDs as catalyst coatings is that they may allow only the primary CndashH bonds
of alkanes to interact with active oxygen species present at the catalyst surface thus forcing
oxygenation exclusively at the terminal carbon The diameters of cyclodextrin cavities are
047ndash053 nm (α-CD) 060ndash065 nm (β-CD) and 078ndash083 nm (γ-CD) The common depth
of the cavities is about 079 nm [12] The width of linear alkanes is typically 04-05 nm Due
to the molecular size of the long chain alkanes the cavities of α- and β-CDs are considered to
be more preferable for the selective oxidation of long chain alkanes Several different
91
cyclodextrin modified catalysts have been prepared and are discussed in this chapter
52 Cyclodextrins as catalyst modifiers
There are no previous studies on how to apply cyclodextrins as a direct coating material for
catalysts applied to long chain alkane oxidation However CDs have been applied as
regioselective catalysts or catalyst modifiers in various other chemical reactions [13-19]
Guy et al [13] reported some preliminary results obtained on the effects of CDs during the
ring-opening reaction of epoxides with LiN3 in aqueous media The experiment was carried out
by stirring a mixture of epoxide LiN3 and β-CD in water at room temperature They observed
an lsquoincrease in the regioselectivity of the ring-opening processrdquo A regioselectivity of 59
could be obtained for compound 2b (Scheme 51) when the reaction was performed in the
presence of β-CD compared to 86 without the use of β-CD Although a good selectivity
can be reached with the use of β-CD as a mediator a decrease in the regioselectivity was
observed as the conversion of styrene oxide was increased and after 43 hours of reaction the
selectivity had dropped to 20
Scheme 51 The ring- opening reaction of epoxides with LiN3 in aqueous media in the
presence of β-CD [14]
Reddy et al [14] reported the regioselective ring opening of epoxides to halohydrins with
hydrogen and lithium halides in the presence of β-CD using water as solvent The reaction was
92
carried out by the in situ formation of a β-CD - epoxide complex followed by the addition of
hydrogen halide or lithium halide (Scheme 52) Stirring at room temperature results in the
formation of the corresponding halohydrin without the formation of any side products or
rearrangements The CDs appeared not only to activate the epoxides but also to promote the
highly regioselective formation of halohydrins due to the formation of an inclusion complex
Scheme52 The ring opening of epoxides to halohydrins in the presence of β-CD [14]
Similar research has been reported by Sridhar et al [15] for the regioselective ring opening
synthesis of β-hydroxy selenides from benzeneselenol and epoxides (Scheme 53) The
reaction was found to proceed at room temperature in presence of β-CDs in water
Scheme 53 The ring opening synthesis of β-hydroxy selenides from benzeneselenol and
epoxides in the presence of β-CD [15]
Ravichandran [16] found that in the presence of β-CD and its derivatives the photo-Reimerndash
93
Tiemann reaction of phenols with chloroform proceeds with high selectivity for the formation
of 4-hydroxy benzaldehydes The β-CDs were reported to have two effects on the reaction
(Scheme 54) Firstly both the yield of the aldehyde and the reaction rate were enhanced
Secondly the position of formylation was altered ie the ratio of 23 (paraortho attack) was
increased The presence of β-CD showed an enhanced yield up to 74 with 824 selectivity
for the formation of 4-hydroxy benzaldehyde against a yield of up to 62 with 666
selectivity for the same compound without the presence of β-CD
Scheme 54 The formation of 4-hydroxy benzaldehydes [16]
Pattekhan and Divakar reported the regioselective acetylation of 4-t-butylcyclohexanol in the
presence of β-CD [17] The experiment was carried out with 10ndash20 times excess of acetic
anhydride At a molar ratio of 110 of 4-t-butylcyclohexanolacetic anhydride (Scheme 55)
they reported a conversion of 990 to 4-t-butylcyclohexyl acetate with a transcis ratio of
348 with very little unreacted alcohol present (transcis ratio 25) They also found that with
an increase in the concentration of β-CD (although the ester yield was less than the control) the
transcis ratio increased steadily from 346 for 101 (yield 577) to 549 for 11 eq (yield
744) of 4-t-butylcyclohexanol to β-CD However the trans ester yield was comparable to
the control (769) in the presence of 1 eq of β-CD They concluded that the results showed
that the selectivity in esterification between the trans and cis alcohols was due to inclusion
complex formations within the β-CD cavity
94
Scheme 55 4-t-butylcyclohexanol to acetic anhydride [17]
Hirai and Shiraishi [18] reported their study of regioselective carboxylation of aromatic
compounds using CDs as catalysts under mild conditions producing terephthalic acid 44rsquo-
biphenyldicarboxylic acid and 26-naphthalene-dicarboxylic acid (Scheme 56) In their
opinion it is the inclusion complex formations of β-CD with the aromatic hydrocarbon and
carbon tetrachloride in the reaction mixture that promotes the yield and selectivity of the target
dicarboxylic acids The high selectivity was ascribed to the conformation of the β-CDndasharomatic
monocarboxylate inclusion complexes
95
Scheme 56 The formation of terephthalic acid 44rsquo-biphenyldicarboxylic acid and 26-
naphthalene-dicarboxylic acid [18]
Ji et al [19] reported how the amount of β-CD can affect the oxidation of sulfides to sulfoxides
and sulfones with aqueous hydrogen peroxide in the presence of β-CD In their operation 1
mmol of β-CD was dissolved in 25 ml of deionised water at 45 oC and then the methyl phenyl
sulfide was added under stirring and hydrogen peroxide was slowly added as well They found
that a rise in the amount of β-CD strongly increases the conversion of methyl phenyl sulfide
from 56 to 93 at 45 ordmC
From the literature survey in various reactions CDs can be effective catalyst modifiers and
work at room temperature or very low reaction temperature and are easy to apply and low cost
According to this the method to create CD covered catalysts were developed as in the
Experimental section below
53 Experimental
531 Preparation of CD covered catalysts
The main method of catalyst preparation was impregnation The porous catalysts were
96
impregnated in the CDs solution to leave adsorbed CDs on the surface Using CD covered
AuSiO2 as an example the detailed steps of the preparation were as follows
1 BET surface area of the AuSiO2 determined
2 Assuming CD molecules cover the catalyst surface one by one without gaps and create a
monolayer (Figure 52) the required mass of CDs to completely cover the surface of catalysts
was calculated (eg to cover 1 g of AuSiO2 037 g of α-CDs or 035 g of β-CDs is needed)
3 The calculated amount of CDs was then dissolved in 25 ml of deionised water by heating to
45C and stirring
4 5 ml of the CDs solution was added to 1 g of AuSiO2 and the mixture heated to 45C and
stirred for 30 min and then put into an oven to dry overnight at 110ordmC
Figure 52 Ideal catalyst surface covered by cyclodextrin molecules
532 Catalyst testing
Reactions were carried out in a high-pressure stainless steel autoclave with a nominal volume
of 45 ml and a magnetic PTFE stirrer In each experiment the reaction unit was flushed once
with O2 to remove the air And then the pressure was increased to 15 bar O2 at room temperature
Normally the prepared catalysts were tested in the unit using the following conditions 15 bar
O2 600 rpm stirring speed 110degC 10 g n-decane and 005 g catalyst 16 h
97
In most cases the tested catalysts were modified following the method described in Section
531 to create fully covered catalysts However in some cases the catalysts were modified by
less than a monolayer of cyclodextrins (samples denoted 14 α-CDs covered AuSiO2 for
catalysts with a coverage of 14 monolayer) Samples were not able to be fully recycled after
reactions therefore each experiment was performed with fresh catalyst In addition some
reactions were carried out with addition of PS-TEMPO (2266-Tetramethyl-1-piperidinyloxy
provided by Johnson Matthey) as a radical scavenger
02 μl samples of the reaction mixtures were analysed after reaction using a gas chromatograph
(Varian 3380) fitted with a CP-WAX52 CB column and an FID detector An internal standard
(0150 ml 124-trichlorobenzene) was added to the product mixture to quantify the results
54 Results
541 BET analysis
The BET surface area of the catalysts covered by different amounts of cyclodextrins was
determined as shown in Table 51
Table 51 The BET surface area of the different catalysts
Catalysts Surface Area (m2g)
5 wtAuSiO2 254
14 α-CDs covered AuSiO2 222
α-CDs fully covered AuSiO2 155
14 β-CDs covered AuSiO2 189
β-CDs fully covered AuSiO2 96
It was observed that with an increasing amount of cyclodextrins the surface area of the
98
catalysts decreased For example for the α-CD series the standard AuSiO2 the specific
surface area was decreased by 12 with 14 α-CD coverage and 39 with the fully covered
AuSiO2 According to Poncheal et al [20]this reduction in surface area correlates with the
covering of the nitrogen adsorption sites by the cyclodextrin on the substrate catalyst surface
which hinders the nitrogen molecules access to the binding sites Therefore the decrease of the
surface area is an evidence of the successful loading of cyclodextrin on the surface of AuSiO2
542 Activity of CDs
5421 Activity of CDs under reaction conditions
At the beginning of the research it was important to establish the activity of CD themselves
under the reaction conditions Therefore reactions with only CD and no catalyst were carried
out Two different amounts of CDs were used (005 g and 100 g) An average of two blank
reactions (no catalysts only decane and oxygen) is also given for comparison The results were
shown in Table 52
Table 52 Activity of CDs
Catalyst Conv() Selectivity ()
C10
Ketones
C10
Alcohols
Cracked
Acids Others Terminal
Blank 066 586 66 120 236 26
005g α-CDs 030 474 63 107 355 27
100g α-CDs 011 224 126 160 489 21
005g β-CDs 032 422 75 128 374 17
100g β-CDs 017 187 131 152 530 31
Reaction conditions 16 h 110oC 15 bar O2 10 g n-decane 005 g or 100 g CDs stainless
steel reactor
99
The addition of both α- and β-CDs leads to a decrease of conversion when compared to the
blank reaction under the same conditions In the product distribution there was a definite
decrease in the selectivity to ketones and an increase in the selectivity to alcohols and acids
The unknown other products increased as well especially with 100 g of CD
In the CD structures there are a number of OH groups (Figure 51) therefore it could be
possible that the CDs are being oxidized rather than decane It has been reported that without
tethering them to a catalyst cyclodextrins can be oxidized and yield ketones and carboxylic
acids [21] It is also possible that the CDs react and produce some of the unknown products
To determine whether the cyclodextrins were stable under the reaction conditions they were
added into another solvent performing the reaction under the decane reaction conditions
Reactions were performed with α- or β-CDs (005 g) in water (10 g) keeping the other
conditions the same as for the reaction using decane (stainless steel reactor 15 bar O2 600 rpm
stirring speed 110degC 16 h) After the reaction no products were observed in the GC trace
(Figure 53) which indicates that the CDs are not reacting under the reaction conditions The
product distribution changes observed are due to modifying the catalyst
However no trend in terminal selectivity with the additions of CDs is observed (Table 55) and
the range of terminal selectivities observed is considered to be within the experimental errors
Therefore it is assumed that without a catalyst the CDs are not shape-selective catalysts for
the oxidation of decane
100
Figure 53 GC analysis β-CDs reacting with water
5422 Activity of CDs with the addition of radical scavenger
A radical scavenger ndash PS-TEMPO was added to the reaction Previously it has been shown that
that 0005 g PS-TEMPO can suppress the radical reaction in blank reactions (Chapter 4)
Therefore 0005 g PS-TEMPO was added into the reaction in order to observe the non-radical
catalytic reaction with CDs
The results are given in Table 53 It was found that the conversion decreased with the addition
of PS-Tempo For all the reactions with PS-TEMPO a 005 conversion was observed and the
selectivity of the other products increased However an increase in selectivity for alcohols and
acids was still observed when the amount of α-CDs is increased from 005 g to 100 g The
terminal selectivities were very low (around 05-08)
101
Table 53 Activity of CDs with PS-TEMPO
Catalyst Conv() Selectivity ()
C10
Ketones
C10
Alcohols
Cracked
Acids Others Terminal
005g α-CDs 030 474 63 107 355 27
With PS-
TEMPO 005 26 22 32 920 05
100 g α-CDs 011 224 126 160 489 21
With PS-
TEMPO 005 34 29 49 888 07
005g
β-CDs 032 422 75 128 374 17
With PS-
TEMPO 005 26 22 38 904 08
Reaction conditions 16 h 110oC 15 bar O2 10 g n-decane 005 g or 100 g CDs 0005 g PS-
TEMPO stainless steel reactor
543 Activity of CD modified AuSiO2
5431 The fully covered AuSiO2
In Chapter 4 it is reported that AuSiO2 is one of the best catalysts for decane oxidation
Therefore the CDs were impregnated onto AuSiO2 to prepare CD modified catalysts and the
results are shown in Table 54
It was found that the conversion was higher with the AuSiO2 without having being modified
by the addition of CDs This could be because of the CD on the surface covering some of the
active sites on the AuSiO2 leading to the decreased conversion It was also found the terminal
selectivity was increased slightly from 27 to around 32 with CDs Repeating the reaction
showed the same results although this increase is considered to be within the experimental
errors
102
Table 54 Activity of CD modified AuSiO2
Catalyst Conv() Selectivity ()
C10
Ketones
C10
Alcohols
Cracked
Acids Others Terminal
Blank 068 586 66 120 236 26
AuSiO2 100 497 106 145 252 27
005g
α-CDs 030 474 63 107 355 27
α-CD
modified
AuSiO2 053 290 167 162 382 31
005g
β-CDs 032 422 75 128 374 17
β-CD
modified
AuSiO2 070 325 173 158 344 32
Reaction conditions 16 h 110degC 15 bar O2 10 g n-decane 005 g catalyst stainless steel
reactor
5432 Different level of CD coverage over catalysts
When preparing the CD covered AuSiO2 the amount of CD needed to fully cover the surface
area of AuSiO2 was calculated However tests were performed to investigate if different levels
of coverage can affect the terminal selectivity which is also a potential way to prove if the CDs
are shape selective A quarter of the amount of CD was added to the catalyst which was tested
under the same reaction conditions as previously and the results are shown in Table 55
103
Table 55 Activity of CD modified AuSiO2
Catalyst Conv() Selectivity ()
C10
Ketones
C10
Alcohols
Cracked
Acids Others Terminal
AuSiO2 100 497 106 145 252 27
α-CD 14
covered
AuSiO2 071 291 150 179 380 29
α-CD fully
covered
AuSiO2 053 290 167 162 382 31
β-CD 14
covered
AuSiO2 050 320 160 160 360 29
β-CD fully
covered
AuSiO2 070 325 173 158 344 32
Reaction conditions 16 h 110oC 15 bar O2 10 g n-decane 005 g catalyst stainless steel
reactor
According to Table 51 it was found that different amounts of CDs lead to a different coverage
level of CDs on the catalyst surface However from Table 55 it can be seen that with different
level of CD coverage the difference between product distributions was very limited The trend
of BET surface area change and terminal selectivity change for the α-CD covered AuSiO2 is
shown in Figure 54
104
Figure 54 The trend of BET surface area change and terminal selectivity change
There was a 02-03 increase in the terminal selectivity between the 14 covered sample and
the fully covered sample Thus there is a general trend in increasing terminal selectivity with
increase CD content This increase is however also considered to be within the experimental
error Therefore from these experiments it cannot be concluded if the CDs worked as a shape-
selective coating in the reaction
5433 Cyclodextrin modified catalyst recycling
To check the stability of CDs on the modified catalysts decane oxidation reactions with α- and
β-CD covered AuSiO2 were performed then the catalysts were recycled and reused However
it should be noticed that the full repeat was impossible as there was a loss of catalyst during
the recycle and for 005 g catalyst only 002 g was recovered after recycling
105
Table 56 Reaction with recycled CD modified AuSiO2
Catalyst Conv() Selectivity ()
C10
Ketones
C10
Alcohols
Cracked
Acids Others Terminal
α-CD
covered
AuSiO2 0668 315 192 300 192 24
Recycled
α-CD
covered
AuSiO2
0100 383 191 203 210 23
β-CD
covered
AuSiO2 0556 345 161 312 172 24
Recycled
β-CD
covered
AuSiO2
0053 323 198 275 191 26
Reaction conditions 16 h 110oC 15 bar O2 10 g n-decane 005 g catalyst stainless steel
reactor
Although there was a huge decrease in the conversion the change in the terminal selectivity
was minor (Table 56) This result may indicate that the AuSiO2 was deactivated after the
reaction As no decrease in terminal selectivity was found with the recycled catalyst it is
thought that CDs still covered the catalyst after the reaction However due to the large loss of
catalysts in the recycling process and the experimental error at low conversion the results are
not clear
544 CD modified AuHCl treated SiO2
In Chapter 4 it was found that the acid treated silica support did not show a difference from
the silica support without acid treatment in terminal selectivity However it was considered
worth determining if there is any difference with the cyclodextrin coatings Therefore AuHCl
treated SiO2 was also modified with CDs and tested under the same reaction conditions (Table
106
57)
Table 57 Activity of CD covered AuHCl treated SiO2
Catalyst Conv() Selectivity ()
C10
Ketones
C10
Alcohols
Cracked
Acids Others Terminal
AuHCl
treated
SiO2 090 445 113 158 284 29
α-CD
covered 080 311 159 183 347 30
β-CD
covered 050 286 151 164 399 28
Reaction conditions 16 h 110oC 15 bar O2 10 g n-decane 005 g catalyst stainless steel
reactor
A decrease in conversion was again observed when CDs were added to the reaction The
terminal selectivity of the treated AuHCl treated SiO2 is slightly higher than the non-treated
AuSiO2 and the conversion slightly lower The difference in conversion and terminal
selectivity are both considered to be within the experimental errors With CDs on AuHCl
treated SiO2 no changes in terminal selectivity were detected in the reaction however the
conversion decreases This may be because the CDs are not selective in the reaction However
it could also be possible that the H+ remained on the surface of the Au catalyst and then reacts
with the ndashOH bond on the CDs
107
55 Conclusions
The aim of the project was to synthesize coatings onto active catalysts which can effectively
oxidize long chain alkanes in the primary position In this chapter cyclodextrins were
investigated as an organic shape-selective material to coat the AuSiO2 catalysts Addition of
CDs without the catalyst decreased the conversion but no trend in terminal selectivity was
observed With the CD covered AuSiO2 catalyst a decrease in conversion is seen compared to
the blank reaction however the changes in terminal selectivities are still limited and considered
to be within the experimental errors To conclude the CD covered catalysts which were
prepared by the direct impregnation method did not play an important role in increasing the
terminal selectivity
56 References
[1] GA Signorell TC Kaufmann W Kukulski A Engel H Remigy Journal of Structural
Biology 157 (2007) 321
[2] J Haggin Chemical Engineering News 70 (1992) 25
[3] J Szejtli Cyclodextrin Technology Kluwer Academic Publishers Dordrecht (1988)
[4] R Dagani Chemical Engineering News 71 (1993) 4
[5] H Parrot-Lopez H Galons AW Coleman J Mahuteau M Miocque Tetrahedron
Letters 33 (1992) 209
[6] DW Armstrong W Li AM Stalcup H VSecor RR Izac JI Seeman Analytical
Chemistry Acta 234 (1990) 365
[7] DW Armstrong AM Stalcup ML Hilton JD Duncan JR Faulkner S Chang Anal
Chem 62 (1990) 1610
[8] J Szejtli Cycfoakxtrin Technology Kluwer Academic Dordrecht (1988)
108
[9] ML Bender and M Komiyama Cyclodextrin Chemistry Springer Berlin (1978)
[10]JNJJ Lammers Recueil 91 (1972) 1135
[11] K Otsuka K Furuka Electrochimica Acta 37 (6) (1992) 1135
[12] K Otsuka I Yamanaka Catalysis Today 57 (2000) 71
[13] A Guy J Doussot R Garreau A Godefroy-Falguieres TetrahedronAsymmetry 3
(1992) 247
[14] MA Reddy K Surendra N Bhanumathi KR Rao Tetrahedron 58 (2000) 6003
[15] R Sridhar B Srinivas K Surendra NS Krishnaveni KR Rao Tetrahedron Letters 46
(2005) 8837
[16] R Ravichandran Journal of Molecular Catalysis A Chemical 130 (1998) 205
[17] HH Pattekhan S Divakar Journal of Molecular Catalysis A Chemical 184 (2002) 79
[18] H Hirai Y Shiraishi Reactive amp Fuctional Polymers 67 2007 1115
[19] H Ji XHu D Shi Z Li Russian Journal of Organic Chemistry 42 (7) (2006) 959
[20] A Ponchel S Abramson J Quartararo D Bormann Y Barbaux E Monflier
Microporous and Mesoporous Materials 75 (2004) 261
[21] ME Deary DM Davies Carbohydrate Research 317(1-4) (1999) 10
[22] K Otsuka I Yamanaka Catalysis Today 57 (2000) 71
109
CHAPTER 6
Teabag Technology
110
TEABAG TECHNOLOGY
61 Introduction
The aim of this research project is to realize the selective oxidation of long chain alkanes to
alcohols and acids at the terminal position Therefore various selective materials can be
considered Zeolites known as one of the most popular shape-selective catalysts is the focus
of the chapter Zeolites can be synthesized as membranes for the purpose of separation
adsorption or for the selective reaction An ideal zeolite membrane combines the general
advantages of inorganic membranes (temperature stability solvent resistance) with shape
selectivity Small aggregates of zeolite crystals as a coating on the surface of a catalyst can
improve external mass transfer characteristics especially in fast liquid phase and gasliquid
phase reactions [1] A continuous zeolite membrane can discriminate the components of
gaseous or liquid mixtures dependent on their molecular size Hence in this chapter the aim is
to utilize zeolite membrane as coatings outside the metalsupport catalysts to realise the
selectivity of the terminal long chain alkane oxidation product This technology is called teabag
technology Specifically teabag technology is an idea that zeolite coatings work as the teabag
to control the diffusion of reactants to the active sites in a specific configuration that only allows
the oxidation of the terminal position This chapter aims to find a zeolite with the suitable pore
size so that only the wanted reactant and product can pass through the outer coating to an
oxidation catalyst underneath
62 The teabag technology project
lsquoTeabag technologyrsquo was first named by Johnson Matthey (JM) which is one of the sponsors
and co-operating companies of the research project The key work in this area has been carried
111
out by Paul Collier (JM) who used zeolite A as the coating material on the catalyst (eg Pt-
FeSiO2 Pd-FeSiO2) for the CO oxidation in the presence of butane [2 3] The zeolite A
coating synthesis process they used was as follows 5 g catalyst spheres were added into a 5
wt solution of polyelectrolyte (Percol 1697 from Allied Colloids Ltd) containing dilute
ammonia to adjust the pH value between 10 and 11 The solution was stirred at room
temperature for 20 minutes Subsequently the spheres were separated from the solution and
washed with demineralized water Then the spheres were rapidly added to a zeolite gel which
was composited with a solution of 607 g sodium aluminate in 52 g demineralized water to a
solution of 1551 g sodium metasilicate in 52 g demineralized water The gel was stirred at
room temperature for 2 hours and then hydrothermally crystallized at 100˚C for 24 hours The
zeolite coated catalyst spheres were separated from the crystallization solution and washed with
demineralized water dried at 105˚C and then calcined at 500˚C for 2 hours The oxidation
experiment results showed with the coated catalyst carbon monoxide is selectively oxidized at
temperature between 150˚C and 400˚C (Figure 61)
However this technique cannot be applied in this project in exactly the same way because the
pore size of zeolite A is too small (pore size ranges from 3-45 Aring KNaA 3 Aring NaA 4 Aring
CaNaA 45 Aring) for the long chain alkane diffusion Therefore other zeolite membrane needs
to be explored to fit the long chain alkanes Considering the molecule size of hexane and decane
MFI type zeolite (including silicalite-1 and ZSM-5) zeolite X and mordernite are all possible
candidates (pore size ranges from 8-10 Aring)
112
Figure 61 CO and butane conversion comparison with the presence of zeolite A coated
catalyst
63 Zeolite membrane synthesis
In order to create a typical zeolite membrane coating for this project it is important to
understand the current research stage of zeolite membrane synthesis and the parameters that
influence the synthesis
631 Preparation method
The methods for the preparation of the zeolite coatings recorded in the literature can be
generally catalogued into three different ways
113
1) Slurry coating or wash-coating in which the zeolite is brought onto the support from a wash-
coat solution containing precursors of binders based on alumina zirconia silica titania or
silica-alumina The coatings are calcined to obtain bonding of the crystallites to the support
surface [4]
2) Dry gel conversion in which a gel containing the aluminosilicate precursor water and
template is brought onto the support dried and subsequently crystallized by contacting with
steam at 105-150ordmC [5]
3) In situ coating in which the crystals are directly grown close to or on the support either from
a gel or a solution with the hydrothermal synthesis conditions [6-21]
The disadvantage of first and second methods is that the crystal layers created in those ways
always show a low continuity and a limited accessibility therefore it is more common today
to use the in situ hydrothermal method in dilute aluminosilicate systems in which the amorphous
gel phase is not present Zeolite coatings prepared in this way have a high continuity and can
be optimized for use as either a membrane or a catalyst
The first hydrothermal method system that produced zeolite NaA was reported at the
International Zeolite Association (IZA) meeting in Tokyo in 1986 by Wenqin et al [6] The
batch composition in it formed the starting point of the present work in clear solution Another
advantage of the clear solution method is that it permits the use of in situ observations using
light scattering techniques to study the synthesis [7] especially the nucleation and crystal
growth processes occurring within the solution phase After Wenqin et al [6] published the
system almost all syntheses of zeolite A coatings were accomplished using the clear solution
system with the composition xNa2OyAl2O31SiO2200H2O where x ranges from 5 to 13 and
114
y ranges from 01 to 02
Cetin et al [8] used a small difference in their batch composition they used the aluminosilicate
solution with a composition of 10Na2OAl2O3SiO2200H2O The same ratio was also utilized
in the research of Andac et al [9] Anhydrous NaOH pellets were dissolved in deionised water
and granular sodium aluminate and sodium silicate were added to the solution Additions were
made to solutions cooled to below 27ordmC and the final reaction mixture was stirred for 15 min
at the temperature prior to the syntheses Hydrothermal crystallization was carried out in a
stainless steel reaction vessel at 60ordmC for various periods of time ranging from 1 to 10 h It was
reported that a zeolite film with a thickness of about 15 μm could be obtained after a synthesis
time of 10 h
Different compositions have also been reported in the literature for the zeolite A coatings Wang
et al [10] employed a solution with 03Na2OAl2O334SiO242 (TMA)2O 237H2O The
experiments were run at a higher temperature of 100ordmC for 24 h coatings were successfully
applied to a porous α-Al2O3 support The particle size of the zeolite crystallites was 250 nm by
SEM
As a development of the hydrothermal synthesis a seeding method was introduced into the
zeolite membrane preparation For example Sterte et al [11] synthesized mono disperse
silicalite-1 crystals and then used the crystals as seeds in the synthesis of coatings Supports
were seeded first and then zeolite membranes were grown by the hydrothermal method
described in the other methods [6-10] They showed that coatings synthesized by this method
had better adhesivity thermal stability and crystal orientation than those prepared by other
115
methodologies
In a synthesis of ZSM-5 coatings on stainless steel Tatlier et al [12] used a substrate heating
method keeping the reaction mixture at temperatures below 100ordmC while the metal plates were
heated to a temperature above 100ordmC It was demonstrated that continuous ZSM-5 coatings of
different textures with different crystal morphologies and void fractions could be formed
depending on the reaction conditions (Table 61) The mass of the coatings increased with the
substrate temperature and the duration of synthesis because of the effect of temperature on the
rate of crystallization The method was regarded to be beneficial in respect to the synthesis
duration compared to the conventional procedures
Table 61 Mass and thickness of the coatings at an oil bath temperature of 90degC
Resistance
temperature
(degC)
Synthesis
duration
(days)
Coating
mass
(mgcm2)
Actual
coating
thickness
(μm)
Equivalent
coating
thickness (μm)
Void
fraction
200 3 01a ndash ndash ndash
240 3 02a ndash ndash ndash
280 3 05 40 29 028
240 5 17 120 97 020
240 8 27 270 153 043
280 5 33 380 188 051
a The coating is not crystalline
116
632 Supports in zeolite coating
For the synthesis of zeolite coatings support materials should be chosen that are readily
available attrition resistant and chemically stable under the reaction conditions
In Table 62 various types of support are given together with their physical and chemical
properties [13]
Supports such as α-Al2O3 [9 14 15] quartz [8] and stainless steel [8 9] were reported in use
for the zeolite A coating in the literature reviewed to date And as reported in the US patent
20050032628 [2] the catalyst substrate comprises at least one platinum group metal which
are known as effective catalysts for the oxidation of a wide variety of chemical species
supported on a support material The support materials are preferably oxidized materials
including silica alumina titania and so on It is possible that preparations using these supports
could be adapted to introduce an active metal to the support before applying the zeolite coating
It was reported that the formation of a continuous coating of zeolite is not easy to achieve over
an alumina or stainless steel support using conventional hydrothermal crystallization
techniques [9 16] The surface charge of zeolites is negative at basic pH (typical zeolite
synthesis conditions) which means that there is an electrostatic barrier preventing the growth
of zeolite coatings on supports To overcome this several methods of introducing positive
charge to the supports were investigated
117
Table 62 Supports currently used in the preparation of zeolite coatings
Support Nature Surface Amount of
surface
material areaa OH- groupsb
Spheresextrudates
α-Al2O3 Hydrophobic high low
γ- Al2O3 Hydrophilic high high
Single crystal wafers
Si Hydrophilic low high
TiO2 Hydrophilic low medium
Sapphire(α-Al2O3) Hydrophobic low low
Platesdisks
Stainless steel Hydrophilic low high
Quartz Hydrophilic low high
Vitreous glass Hydrophilic low high
Pressed carbon Hydrophobic high low
Foams
α-Al2O3 Hydrophilic high low
Fibres
Carbon Hydrophobic medium low
Vegetal Hydrophilic medium medium
Inorganic Hydrophilic medium high
Inserts
Gold Hydrophobic low low
Teflon Hydrophobic low low
a Lowlt 1 m2g-1 medium 1-10 m2g-1 highgt 10m2g-1
b Lowlt 1 OH nm-2 medium 1-25 OH nm-2 highgt 25 OH nm-2
Collier et al [16] reported a method using a copolymer of acrylamide and the methyl chloride
quaternary salt of 2-(dimethylamino) ethyl acrylate The polymer species are strongly adsorbed
118
on the support by the electrostatic attraction between the quaternary ammonium groups of the
adsorbate and the oxide ions at the support surface resulting most probably in a flat
conformation The presence of excess quaternary ammonium groups imparts an overall
positive charge to the polymer-covered support surface allowing the zeolite coating to stick
Andac et al [9] reported a treatment method for stainless steel to introduce positive charge to
the surface The stainless steel plates were first boiled in toluene for 30min and then held at
60ordmC for 15 min in a mixture of H2O2(30) NH4OH(25) and H2O in a 115 ratio by volume
In this way NH4+ is attached to the support surface creating the positive charge
A typical method of preparation catalyst substrate was investigated by Nishiyama et al [17]
In the report they prepared the silicalite-1 coating with PtTiO2 by impregnation in two steps
1) Preparation of PtTiO2 particles Platinum-loaded titania catalyst was prepared by the
impregnation of spherical TiO2 particles with Pt from a solution of hydrogen
hexachloroplatinate (IV) hexahydrate The impregnation solution was prepared by dissolving
H2PtCl6middot6H2O salt in deionised water Then the slurry was dried at 120ordmC overnight and at
500ordmC for 6 h in air Reducing in hydrogen for 3 h at 300ordmC is required before utilization
2) Zeolite coating The surface of the PtTiO2 particles was positively charged by treatment in
a solution of 04 wt polyethyleneimine in deionised water Then the particles were immersed
in a 10 wt silicalite-1 solution The crystallization was carried out in the closed vessel at
180ordmC for 24h (Figure 62) After washing with deionized water and drying the product at 90ordmC
overnight it was calcined in air at 500ordmC for 6 h
119
Figure 62 Reaction vessel used for zeolite coating
633 Other factors for preparation
Some other factors that would influence the production of zeolite coating have been
investigated including the operating temperature [1 8 9] the utilization of ultrasound [1 9
18] the role of water content [14] and the aging time [5]
Temperature
The preparation of continuous zeolite coatings is related to two competing phenomena
occurring on the surface nucleation and crystal growth The thickness of the zeolite coating
may be decreased in the case where a higher number of smaller crystals growing on the unit
surface of the substrate are available In this respect temperature may be a significant factor
for the property of the coating prepared
Puil et al [1] prepared samples coated in zeolite beta by a hydrothermal method for 18 h at
155ordmC The autoclaves were then cooled to room temperature in air and the solids recovered
by filtration washed and dried at 120ordmC before the coated particles were removed by a 500
μm sieve The samples were then suspended in water and treated ultrasonically for 2-4 h to
120
remove any lsquoloosersquo crystals after which the samples were again filtered dried sieved and
calcined at 550ordmC for 12 h The ion-exchange was carried out in aqueous 01 M NH4Cl at room
temperature for 24 h followed by drying at 120ordmC and calcining at 550ordmC They reported after
calcination and ion-exchange the supported zeolite beta coatings show activity in the reaction
The activity is similar to the intrinsic activity of commercial zeolite β samples
Cetin et al [8] reported that the temperature affected the thickness of the zeolite 4A layers They
found the thickness of closed zeolite 4A layers may be decreased at relatively lower synthesis
temperatures when relatively longer synthesis times are employed They suggested the possible
reason might be that the rate of nucleation being less temperature sensitive than the rate of
crystal growth Zeolite 4A coatings of 1 and 07 μm thickness have been prepared on quartz
and stainless steel substrates respectively at 45ordmC No subsequent calcination of the material
was reported in the paper
In 2005 Andac et al [9] successfully carried out the zeolite A hydrothermal crystallization on
stainless steel plates at temperatures of 50ordmC and 60ordmC for various periods of time ranging from
2 to 15 h by using a heater and a temperature controller The experiment was carried out in an
ultrasonic water bath And then the product was filtered using a filter paper with fine mesh size
The filtrate was then refiltered through a 01 μm PVDF membrane before washing thoroughly
with deionized water and drying overnight in an oven at 65ordmC
Ultrasound
Use of ultrasound in polymer synthesis is known to be helpful in providing rate and yield
enhancements In the zeolite coating synthesis the effect of ultrasound was reported by a few
121
researchers [1 9 18] leading to a conclusion that the ultrasonic irradiation leads to acceleration
of crystallization of zeolite coating and some other benefits For example Andac et al [9]
reported that in the presence of ultrasound the thickness of the zeolite A coatings on stainless
steel plates could be decreased from about 15 μm to about 06 μm and a closed layer was
obtained after 3 h of synthesis instead of 10 h at 60ordmC The final roughness value was also
smaller for the coating prepared in the presence of ultrasound
This phenomenon is likely to be due to an increase in the nucleation rate resulting in a higher
number of particles forming on the substrate at earlier synthesis times in the presence of
ultrasound Hence with the ultrasound lower temperature and shorter times than with the
conventional preparation method can be expected
Water Content
Kalipcilar et al [14] found a relationship between the water content in the synthesis solutions
and the thickness of the coating formed They carried out the synthesis of silicalite layers on α-
Al2O3 disks with a molar batch composition of 65Na2O25SiO2xH2O69TPABr (69 g silicic
acid 79 g TPABr) by varying the water content from 500 to 2000 miles at 200ordmC They found
that the silicalite layer which was synthesized from the most concentrated batch was formed
from crystals with an average size of 100 μm and a thickness of 36 μm And the layer thickness
and average crystal size decreased to about 8 and 7 μm respectively when the batch containing
1400 miles of water was used As shown in Figure 63 the continuity of the layer and the
crystal size was improved as the water content of the batch was increased from 500 to 1136
miles and decreased on further dilution of the batch to 1400 and 2000 miles
Gavalas et al [19] investigated the effect of the batch composition on the properties of ZSM-
122
5 layers on non-porous and porous α-Al2O3 supports They found the dilution of the
crystallization solution led to a partial coverage of the surface and poor growth of the crystals
under the surface
Sterte et al [20] observed that decreasing amounts of water in the clear crystallization solution
resulted in the formation of a continuous film Thin oriented silicalite-1 films with thicknesses
in the range of 180 nm to 1 μm have been obtained by varying the contents of the reaction
mixture
Figure 63 Surface SEM images of silicalite-1 layers synthesized from the batch with a
molar composition 65Na2O25SiO2xH2O69TPABr at 200ordmC (a) 500 mol (b) 800 mol
(c) 1136 mol and (d) 1400mol
123
Calcination Rate
In an early work of preparation of MFI membranes [21] it has been recommended that
calcination of supported MFI membranes should be carried out in air at a maximum
temperature of 400ordmC with a low heating rate of 1 ordmCmin However no particular reason for
using a low rate was given
Hedlund et al [22] that thin silicalite-1 films on asymmetric α-Al2O3 can be calcined at 500ordmC
with a heatingcooling rate as high as 5ordmCmin without reducing the membrane quality They
also reported that films with different microstructure thickness and on other types of supports
may behave differently
Aging the solution
The formation of zeolite coatings and their properties such as the thickness continuity and
orientation of the crystals are related to the presence and macro-organization of a precursor
phase Based on this view preshaped zeolite coatings can be prepared
Gora et al [5] especially emphasized the effect of aging in their report for the zeolite synthesis
In the experiment the aluminosilicate gel was aged for 385h at 25 ordmC The solution was shown
to be very effective as an initiator for nucleation They found addition of even 27 of the
solution to a reaction mixture (10Na2O 02Al2O31SiO2200H2O) increased the nucleation rate
considerably which means that aging the solution could accelerate the coating speed
634 Deactivation
Deactivation is a problem for all the catalysts Due to the structure of the zeolite catalyst coking
124
is the most common reason for the deactivation However in research on a silicalite-1 coating
Nishiyama et al [17] reported that the deactivation of the coated catalyst was reduced
compared with the uncoated one They regarded the reason probably to be the protection
against poisoning impurities in the feed
64 Experimental
641 Preparation of coated catalysts
From the literature survey it can be concluded that the hydrothermal method is the most
common way to prepare zeolite coatings which was also the method taken in this project
However the hydrothermal method can be divided into several kinds of different methods
depending on the exact preparation procedure According to the coating steps the hydrothermal
method can be divided into a direct synthesis method and a secondary synthesis method (the
seeding method) according to the batch composition it can be divided into the normal method
(with template) and the template-free method Different preparation methods have been
attempted in this project as the research developed The preparation methods of coated catalysts
have been improved subsequently also with different metal active centres powdersphere
supports and zeolite membranes The tested samples in this project have been listed in Table
63
The details of synthesis and characterization for each sample are discussed in the following
sections in chronological order
125
Table 63 List of synthesized zeolite coating samples
Zeolite coating type Substrate catalyst
theoretical wt loadings
Support type
Zeolite A SiO2
HCl treated SiO2
5 wt AuSiO2
MgO
α-Al2O3
γ-Al2O3
SiO2 powder
MgO powder
SiO2 spheres
α-Al2O3 spheres
γ-Al2O3 spheres
Silicalite-1 3 wt Auγ-Al2O3 γ-Al2O3 spheres
ZSM-5 01 wt Rhα-Al2O3
01 wt Auα-Al2O3
α-Al2O3 spheres
Zeolite XY SiO2 SiO2 spheres
6411 Zeolite A coated samples with silica powder support
Powder form silica support was employed at the beginning of the coating attempts unlike many
of the literature reports of coatings where extended solids such as rod and sphere supports were
used The synthesis of 5 wt AuSiO2 has been discussed in Chapter 4 The corresponding
coated samples (coated SiO2 coated HCl SiO2 and coated AuSiO2) were prepared in two steps
Preparation the substrate catalysts
To make a comparison three kinds of substrate catalysts (SiO2 HCl treated SiO2 and 5 wt
AuSiO2 ) were coated Among them the HCl treated SiO2 and AuSiO2 were prepared with the
SiO2 support (silica powder Grace gt99 60-100 mesh) and dilute HCl solution
HAuCl4middot3H2O solution respectively by the incipient wetness method The dilute HCl solution
should be adjusted to the same pH value with the HAuCl4middot3H2O solution Using the 5 wt
AuSiO2 as an example to prepare 1 g 5 wt AuSiO2 095 g SiO2 powder was impregnated
by a solution with 01 g HAuCl4middot3H2O The samples were dried in the 110degC oven and then
calcined at 400 degC for 3 h at a heating rate of 20degC min
126
Synthesis of the zeolite A coatings
Substrate catalysts were washed with 01 M HCl in an ultrasonic bath for 20 min and then
washed again with deionised water before drying at 110degC overnight Then a zeolite solution
with the batch composition tetraethyl orthosilicate (TEOS) (Aldrich) Al2(SO4)3 (Aldrich)
NaOH H2O was made The molecular ratio is 80SiO21Al2O310Na2O1500H2O The solution
was stirred for three hours before being mixed with the substrate and placed into autoclaves
The autoclaves were heated at 180degC for 24 h Finally the products were washed in deionized
water in the ultrasonic bath and dried at 110degC overnight
At the same time in order to test if the catalysts still remain active after being treated in this
way the catalysts were treated in the same manner as the coating procedure but without the
coating solution The products with coating solution are called the lsquocoated productsrsquo while the
products without coating solution are called the lsquotreated productsrsquo in the following section
6412 Zeolite 4A coated samples with sphere supports
Silica spheres (Saint-Gobain diameter 32 mm surface area 025 m2g) and alumina (Saint-
Gobain surface area 075 m2g) spheres have been employed in the synthesis The AuSiO2
and AuAl2O3 spheres were prepared by a vacuum incipient wetness method The zeolite 4A
coatings have been synthesized following the method reported by Collier et al [2] 5 g of 5
wt AuSiO2 spheres or alumina spheres were added to a 5 wt solution of the
polyelectrolyte Two kinds of polyelectrolyte have been tested polydiallyl dimethyl
ammonium chloride and 2-propen-1-ammonium NN-dimethyl-N-2-propenyl chloride
(magnafloc lt35) containing dilute ammonia and stirred at room temperature for 20 minutes
The spheres were subsequently separated from the solution and washed with demineralized
127
water and then added to a zeolite solution which was prepared with rapid addition and stirring
The solution contained 607 g sodium aluminium oxide (Alfa Aesar) in 52 g demineralized
water to a solution of 1551 g sodium metasilicate (Alfa Aesar anhydrous) in 52 g
demineralized water The mixture containing the spheres was stirred at room temperature for
2 hours and then hydrothermally crystallized at 100degC for 24 hours Finally the zeolite-coated
spheres were separated from the crystallization solution and washed with demineralized water
dried at 105degC and then calcined in air at 500degC for 2 hours
6413 Silicalite-1 coating with sphere supports
1 wt and 3 wt Rhα-Al2O3 Rhγ-Al2O3 Ruγ-Al2O3 were prepared by the incipient
wetness method and deposition precipitation (DP) method separately The incipient wetness
method was carried out as previously reported in Chapter 4 Taking the 1 wt Rhγ-Al2O3
as an example to prepare 1 g 1 wt Rhγ-Al2O3 099 g γ-Al2O3 had a solution of 0025 g
RhCl3middotxH2O (Alfa Aesar) added The water content was predetermined and was that required
to form a paste with the alumina support The paste was dried overnight at 110degC and then
calcined at 400degC for 3 h The DP preparation was performed as follows (taking the 3
wtRhγ-Al2O3 as an example) to prepare 1 g 3 wt Rhγ-Al2O3 099 g γ-Al2O3 was first
dispersed in an aqueous solution of 0075 g RhCl3middotxH2O A quantity of 1 M Na2CO3 was slowly
added to the RuCl3 solution until the pH value of the mixture reached 105 The suspension was
then maintained at the same pH for 1 h during the precipitation process The resulting solid
was washed with deionized water several times until no chloride ion was detected by silver
nitrate solution in the filtrate All the catalysts were dried at 110degC (12 h) in air Finally they
were calcined at 500degC for 5 h in air [23] Alumina (Saint-Gobain surface area 025 m2g)
spheres have also been tested
128
The vacuum incipient wetness method was employed in the preparation of sphere catalysts To
prepare 1g catalyst 1 g alumina spheres were placed into a sealed two neck round bottom flask
The flask was heated to 80degC with an oil bath and connected to a vacuum pump for 1 h The
calculated amount of metal solution was added into the flask through a syringe The flask was
shaken until all the metal solution was absorbed into the spheres The spheres were then dried
at 110degC overnight before calcination at 400degC for 3 h
Coatings have been applied to AuAl2O3 and RhAl2O3 based spheres The silicalite-1 precursor
solution consisted of TEOS (98 Aldrich) tetraprophylammonium hydroxide (TPAOH) (1
M solution in water Aldrich) ethanol (EtOH) (Fluka) and deionized water with the molar
ratios of 05TPAOH 120H2O 8EtOH 2SiO2 Approximately 10 g of catalyst sphere was
immersed in 15 g of the precursor solution The crystallization was carried out under
hydrothermal conditions at 180degC for 24 h in a stainless steel vessel with agitation The coating
procedure was repeated twice The products were rinsed repeatedly with deionized water
separated by filtration and dried at 90degC overnight then calcined in air at 600degC for 5 h with a
heating rate of 1degCmin [24]
6414 ZSM-5 coating with α- and -Al2O3
Synthesis of ZSM-5 coatings on both α- and -Al2O3 was attempted Synthesis were carried
out in Teflon-lined 60 ml autoclaves Teflon liners were cleaned before and after each synthesis
in NaOH solution for 24 h under the synthesis conditions Supports were cleaned by boiling in
toluene for 1 h and dried overnight at 110degC before being immersed in the zeolite precursor
solution The zeolite precursor solution was prepared by adding tetrapropylammonium
hydroxide (TPAOH Aldrich 1 M solution in water) sodium aluminate (NaAlO2 Aldrich Al
129
50-56) to tetraethyl orthosilicate (TEOS Aldrich 98) in a PTFE beaker The molar ration
of the precursor solution was 1 Al2O3 40 SiO2 10 TPAOH 800 H2O
The precursor solution was stirred for 10 h at room temperature as an aging process before
filling the autoclaves In all experiments 1 g of support was added to the autoclaves The
volume of precursor solution was varied (32 ml or 15 ml) to observe the influence of the amount
of precursor Syntheses were carried out at 160degC for 24 h Then the coated samples and the
extra synthesized powder for the same batch were washed with deionized water and dried
overnight at 110degC Finally the samples were calcined at 550degC for 12 h using a heating rate
of 5degCmin
642 Reaction conditions
The reaction conditions taken for the powder form catalysts in this project usually are 15 bar
O2 600 rpm 110degC 10 g n-decane and 005 g catalyst Therefore the zeolite A coated SiO2
HCl treated SiO2 and 5 wt AuSiO2 were tested under the same conditions
With the sphere supports the reaction system was adjusted They have been tested both in
stainless steel autoclaves and the Andrews glass reactor according to Iglesiarsquos work [25] In
addition as a single sphere is much heavier (eg the mass of a single silica sphere asymp 009g)
than the catalysts used in the previous reactions (005g in each reaction) in the experiment 1
g sphere catalysts have been used in each reaction at 110degC Other conditions used in the
stainless steel reactor are the same as before 15 bar O2 60 0rpm and 10 g n-decane In the
Andrews glass reactor the conditions are 3 bar O2 600 rpm and 25 ml n-hexane
130
643 Characterization
In the coating experiments the weight of the samples before and after coating was recorded to
determine the coverage of the coatingm2 support
The uncoated and coated spheres were crushed into powders to perform XRD analysis XRD
patterns of both the supports and the coated samples were analysed by a PANanlytical Xrsquopert
MPD X-ray diffractometer with a monochromatic CuKa source at 40 KeV and 40 mA The
morphology of the coated spheres was analysed by a Zeiss Evo-40 series scanning electron
microscopy EDX mapping was carried out by the same instrument in conjunction with an
INCAx-sight EDX detector Reaction samples were analysed by gas chromatography with a
CP Wax 52CB column 25 m 053 mm 20 microns using a programmed temperature ramp
Each sample was injected at least twice
65 Results
651 Zeolite A coating with powder support
Coating of SiO2 and MgO based catalysts was attempted using the direct template-free method
in which powder form SiO2 and MgO supports were employed It is important to ascertain the
effects of treatment on the bulk catalyst Hence the lsquotreatedrsquo catalysts were tested in this section
as well As the SiO2 based catalysts works better in the liquid phase while the MgO based
catalysts proved to be more active in the gas phase the coated and treated SiO2 and MgO based
catalysts were separately tested in the corresponding phase
6511 Coated SiO2 in liquid phase reaction
The SiO2 based catalysts were analysed by the BET XRD SEMampEDX before testing in
131
reactions
BET
When studying the data on surface area (Table 64) it is quite obvious that after being coated
the surface area of the sample is dramatically reduced There is also a slight increase in the
surface area of the samples when treated but not coated SEM images have been taken to check
the morphology of the samples and to see if reasons can be ascribed for the changes in surface
area
Table 64 BET results for the SiO2 based catalysts
Catalysts Surface Area(m2 g-1)
SiO2 268
HCl SiO2 277
AuSiO2 255
Coated SiO2 14
Coated HCl SiO2 7
Coated AuSiO2 6
Treated SiO2 270
Treated HCl SiO2 286
Treated AuSiO2 315
SEM amp EDX
According to the SEM images (Figure 64) it can be seen that both the untreated catalysts and
the treated catalysts show similar morphologies under the microscope The coated samples
present a much different morphology clearly showing a roughened overlayer both attached to
the large macroscopic particles and also unattached and separate For the coated SiO2 catalyst
(Figure 64 b) it can be seen that the coating does not cover the whole surface and a large
presence of the smoother SiO2 support is visible In contrast following acid and disposition of
gold (Figure 64 e and h) the covering seems more complete although there is clearly still a
132
large amount of unattached coating present The Au particle distribution on the support is clear
shown in the BSD detector in Figure 65
(a) SiO2 (b) Coated SiO2 (c) TreatedSiO2
(d) HCl SiO2 (e) Coated HCl SiO2 (f) Treated HCl SiO2
(g) AuSiO2 (h) Coated AuSiO2 (i) Treated AuSiO2
Figure 64 Comparison of SEM Images of the SiO2 Catalysts
Each image is approximately 550 μm wide
133
Figure 65 Au particles in BSD detector
Compared with the coated catalysts it was known the surface area had been massively
decreased with the addition of the coating so it was expected that at a high magnification image
a difference should be observed This is indeed the case (Figure 66) with the untreated silica
presenting a smooth appearance while the surface of the coated samples show a large degree
of roughness It is likely that the surface area decrease is caused by the coating blocking a large
amount of the pore structure of SiO2
(a) SiO2 (b) Coated SiO2
=
Figure 66 Surface of the uncoated and coated SiO2 samples
According to the EDX results (Table 65) the treated AuSiO2 appeared to show a decrease in
the Au present which probably means that the Au was lost in the treatment (most likely in the
134
ultrasonic bath) However in the SEM image of the treated AuSiO2 sample Au particles can
still be observed (Figure 67 b) And the Au particles look less in number and smaller in size
than before treatment (Figure 67 a) Therefore it is suggested that the apparent loss of Au
might due to both the loss during the treatment and the detector limitation
The EDX results (Table 65) also show that the coating contains an amount of sodium (except
the coated SiO2) and that the coating is sufficiently thick and complete to mean that no gold is
observed from under the coating Importantly no aluminium is detected showing the formed
coating is not a zeolite but instead silica
Table 65 EDX results for SiO2 based Catalysts
Catalysts O (Weight ) Si (Weight) Other Element
(Weight)
SiO2 625 375 0
HCl SiO2 618 382 0
AuSiO2 598 362 Au 40
Coated SiO2 642 358 0
Coated HCl SiO2 638 335 Na 27
Coated AuSiO2 620 357 Na 23
Treated SiO2 610 390 0
Treated HCl SiO2 614 386 0
Treated AuSiO2 622 374 Au 04
(a)AuSiO2 (b) Treated AuSiO2
Figure 67 Au particles on the AuSiO2 and treated AuSiO2 with the BSD detector
135
XRD
Examining the bulk of the catalysts by XRD shows only two observable phases for all the
catalysts These are an amorphous silica and gold (in the relevant samplesFigure 68) There
are no changes observed by the addition of the coating which could mean it is too small to be
observed or it may be amorphous in nature The large gold particles observed in the SEM are
also confirmed by the XRD data where highly defined sharp peaks are observed
Figure 68 XRD Analysis for the SiO2 based catalysts
o - SiO2 peak x ndash Au peak
Liquid Phase Reactions
To check if the SiO2 based catalysts are still active after being treated the treated SiO2 based
catalysts were tested in reactions (Figure 69-Figure 611 Table 66-Table 68) According to
the results below after being treated in the coating procedure the catalysts still remain active
136
Figure 69 24 h 110ordmC 600 rpm 15 bar Oxygen 10 g n-decane
005 g Treated SiO2
Table 661 24 h 110ordmC 600 rpm 15 bar Oxygen 10g n-decane 005g Treated SiO2
Catalyst Conv
()
Selectivity ()
54
one
3
one
2
one
54
ol
3
ol
2
ol
1
ol
C5
OOH
C6
OOH
C7
OOH
C8
OOH
C9
OOH
C10
OOH
Treated
SiO2 128 250 160 170 64 40 59 09 90 73 52 10 01
23
C10 Terminal selectivity = 09+23 = 32
Cracked Acid selectivity = 90 + 73 + 52 + 10 + 01= 226
137
Figure 610 24 h 110ordmC 600 rpm 15 bar Oxygen 10 g n-decane
005 g Treated HCl SiO2
Table 67 24 h 110ordmC 600 rpm 15 bar Oxygen 10g n-decane 005 g Treated HCl SiO2
Catalyst Conv
()
Selectivity ()
54
one
3
one
2
one
54
ol
3
ol
2
ol
1
ol
C5
OOH
C6
OOH
C7
OOH
C8
OOH
C9
OOH
C10
OOH
Treated
HCl SiO2 204 229 150 160 73 46 65 09 97 83 51 11 02
22
C10 Terminal selectivity = 09+22 = 31
Cracked Acid selectivity = 97 + 83 + 51 + 11 + 02= 244
138
Figure 611 24 h 110ordmC 600 rpm 15 bar Oxygen 10 g n-decane
005 g Treated 5 wtAuSiO2
Table 68 24 h 110ordmC 600 rpm 15 bar Oxygen 10 g n-decane 005 g Treated
5 wt AuSiO2
Catalyst Conv
()
Selectivity ()
54
one
3
one
2
one
54
ol
3
ol
2
ol
1
ol
C5
OOH
C6
OOH
C7
OOH
C8
OOH
C9
OOH
C10
OOH
Treated
AuSiO2 179 253 156 173 62 39 63 10 85 68 55 09 03 23
C10 Terminal selectivity = 10+23 = 33
Cracked Acid selectivity = 85 + 68 + 55 + 09 + 03= 220
Then the three coated catalysts were tested and results for them are given below (Figure 612
to Figure 614 Table 69 to Table 611) And the results are compared in Table 612
139
Figure 6121 24 h 110ordmC 600 rpm 15 bar Oxygen 10g n-decane
005 g Coated SiO2
Table 69 24 h 110ordmC 600 rpm 15 bar Oxygen 10 g n-decane 005 g Coated SiO2
Catalyst Conv
()
Selectivity ()
54
one
3
one
2
one
54
ol
3
ol
2
ol
1
ol
C5
OOH
C6
OOH
C7
OOH
C8
OOH
C9
OOH
C10
OOH
Coated
SiO2 351 201 126 143 97 61 87 13 94 76 62 12 05
23
C10 Terminal selectivity = 13+23 = 36
Cracked Acid selectivity = 94 + 76 + 62 + 12 + 05= 249
140
Figure 613 24 h 110ordmC 600 rpm 15 bar Oxygen 10 g n-decane
005 g Coated HCl SiO2
Table 610 24 h 110ordmC 600 rpm 15 bar Oxygen 10 g n-decane 005 g Coated HCl
Treated SiO2
Catalyst Conv
()
Selectivity ()
54
one
3
one
2
one
54
ol
3
ol
2
ol
1
ol
C5
OOH
C6
OOH
C7
OOH
C8
OOH
C9
OOH
C10
OOH
Coated
HCl SiO2 479 196 122 143 93 60 82 13 107 84 60 14 04
21
C10 Terminal selectivity = 13+21 = 34
Cracked Acid selectivity = 107 + 84 + 60 + 14 + 04= 269
141
Figure 614 24 h 110ordmC 600 rpm 15 bar Oxygen 10 g n-decane
005 g Coated AuSiO2
Table 611 24 h 110ordmC 600 rpm 15 bar Oxygen 10 g n-decane 005 g Coated AuSiO2
Catalyst Conv
()
Selectivity ()
54
one
3
one
2
one
54
ol
3
ol
2
ol
1
ol
C5
OOH
C6
OOH
C7
OOH
C8
OOH
C9
OOH
C10
OOH
Coated
AuSiO2 471 206 117 134 94 58 83 14 107 86 61 14 04
20
C10 Terminal selectivity = 14+20 = 34
Cracked Acid selectivity = 107 + 86 +61 + 14 + 04 = 272
142
If a good zeolite coating is formed outside the catalysts the activity of the catalysts will be
limited However with the current coating the conversion became higher than before (Table
612) while the product distribution of the systems remained similar To this extent it seems
that the coating may be promoting the reaction by acting as a radical initiator The catalysts
with the highest activity (Coated HCl SiO2 and coated AuSiO2) were then tested in the
presence of TEMPO to try to scavenge the radical reaction (Figure 615 and Figure 616)
Table 612 Compare the SiO2 Based Catalysts
Catalyst Conv
()
Selectivity ()
54
one
3
one
2
one
54
ol
3
ol
2
ol
1
ol
C5
OOH
C6
OOH
C7
OOH
C8
OOH
C9
OOH
C10
OOH
SiO2 161 269 164 188 52 36 48 08 70 64 58 13 01
28
AuSiO2 242 224 145 167 55 47 70 10 87 78 67 18 02
29
Treated
SiO2 128 250 160 170 64 40 59 09 90 73 52 10 01
23
Treated
HCl SiO2 194 229 150 160 73 46 65 09 97 83 51 11 02
22
Treated
AuSiO2 179 253 156 173 62 39 63 10 85 68 55 09 03
23
Coated
SiO2 351 201 126 143 97 61 87 13 94 76 62 12 05
23
Coated
HCl SiO2 479 196 122 143 93 60 82 13 107 84 60 14 04
21
Coated
AuSiO2 471 206 117 134 94 58 83 14 107 86 61 14 04
20
143
Figure 615 24 h 110ordmC 600 rpm 15 bar Oxygen 10 g n-decane 005 g
Coated HCl SiO2 0005 g TEMP
Table 613 24 h 110ordmC 600 rpm 15 bar Oxygen 10 g n-decane 005 g Coated HCl SiO2
0005g TEMPO
Catalyst Conv
()
Selectivity ()
54
one
3
one
2
one
54
Ol
3
ol
2
ol
1
ol
C5
OOH
C6
OOH
C7
OOH
C8
OOH
C9
OOH
C10
OOH
Coated
HCl SiO2+
TEMPO 055 200 137 164 69 46 70 15 105 69 83 12 02
27
C10 Terminal selectivity = 15+27 = 42
Cracked Acid selectivity = 105 + +69 +83 + 12 + 02= 271
144
Figure 616 24 h 110ordmC 600 rpm 15 bar Oxygen 10 g n-decane 005 g Coated AuSiO2
0005 g TEMPO
Table 614 24h 110ordmC 600 rpm 15 bar Oxygen 10g n-decane 005g Coated AuSiO2
0005g TEMPO
Catalyst Conv
()
Selectivity ()
54
one
3
one
2
one
54
Ol
3
ol
2
ol
1
ol
C5
OOH
C6
OOH
C7
OOH
C8
OOH
C9
OOH
C10
OOH
Coated
AuSiO2
+TEMPO 022 173 126 180 94 62 92 14 111 53 72 06 04
14
C10 Terminal selectivity = 14 + 14 = 28
Cracked Acid selectivity = 111 + 53 + 72 + 06 + 04= 246
Only very slight differences in product distribution was found between the reactions with and
without TEMPO (Table 615) which are within experimental error It is interesting to note
though that the coated acid-treated SiO2 catalyst is the most active observed in the presence of
TEMPO compared to the previous best of 045 for AuTiO2 while pure SiO2 was inactive
145
in the presence of TEMPO This shows that either the acid treatment or the coatings are helping
to promote activity
Table 615 Compare the results with and without TEMPO
Catalyst Conv
()
Selectivity ()
54
one
3
one
2
one
54
Ol
3
ol
2
ol
1
ol
C5
OOH
C6
OOH
C7
OOH
C8
OOH
C9
OOH
C10
OOH
Coated
HCl SiO2
+TEMPO 055 200 137 164 69 46 70 15 105 69 83 12 02
27
Coated
HCl SiO2 479 196 122 143 93 60 82 13 107 84 60 14 04
21
Coated
AuSiO2+
TEMPO 022 173 126 180 94 62 92 14 111 53 72 06 04
14
Coated
AuSiO2 471 206 117 134 94 58 83 14 107 86 61 14 04
20
A time-on-line study was then carried out to further investigate the activity of the coated
samples The comparison of results was shown in Figure 617 to Figure 619The three SiO2
coated catalysts coated SiO2 coated HCl SiO2 and coated AuSiO2 have been tested time on-
line without and with TEMPO The conversion and terminal selectivity (C10 terminal
selectivity and cracked acids selectivity) without and with TEMPO are compared
146
Figure 617 Coated SiO2 and coated SiO2 with TEMPO
Figure 618 Coated HCl SiO2 and coated HCl SiO2 with TEMPO
Figure 619 Coated AuSiO2 and coated AuSiO2 with TEMPO
147
6512 Discussion
It can be seen that both conversion and selectivity for the reformation of shortened acids are
quite different between the reactions without and with TEMPO Though the conversion with
TEMPO is much reduced (as would be expected) the selectivity for shortened acids is higher
(typically ~10) than when TEMPO is not present The presence of increased selectivity for
shortened acids seems to be at the expense of C10 ketones while little difference is seen in the
C10 terminal selectivity
The results both in the presence and absence of TEMPO show a considerable induction period
with a large increase in conversion only occurring after 16 hours of time on line This is similar
to work previously reported on the autoxidation of n-decane
In the presence of TEMPO the three coated samples have little difference in both conversion
and selectivity From this it is suggested that in these reactions the activity is due to the SiO2
overlayer more than the catalyst underneath
In order to test the activity of the coating formed the coated MgO catalysts were also tested in
liquid phase under the same conditions to make a comparison
6513 Coated MgO in gas phase reaction
MgO based Catalysts were analysed and tested in gas phase reactions discussed in this section
BET
It is found in Table 616 that after being coated or treated the surface area increased The
situation is a little different from the SiO2 samples To have a good understanding of this the
148
structure of the catalyst particles are shown in the SEM images (Figure 620)
Table 616 BET results for the MgO based catalysts
SEMampEDX
According to the Figure 620 it can be found that before the treatment the blank catalysts are
in very small particles after being treated the particles maintain their original size however
some become stuck together to form large macroscopic particles (images c f i)
In a higher magnification image of the MgO without any treatment (Figure 621 a) and coated
MgO (Figure 621 b) Obviously both the size and surface properties are quite different from
SiO2 crystals And it can be clearly seen that something is covering the MgO substrate The
formed coating composition is discussed in the following XRD and XPS section
Catalysts Surface Area(m2g)
MgO 98
HCl MgO 74
AuMgO 51
Coated MgO 39
Coated HCl MgO 110
Coated AuMgO 169
Treated MgO 134
Treated HCl MgO 112
Treated AuMgO 120
149
(a) MgO (b) Coated MgO (c) Treated MgO
(d) HCl MgO (e) Coated HCl SiO2 (f) Treated HCl SiO2
(g) AuMgO (h) Coated AuMgO (i) Treated AuMgO
Figure 620 Comparison of SEM Images of MgO Based Catalysts
Each image is approximately 550 μm wide
(a) MgO (b) Coated MgO
Figure 621 SEM images of MgO and Coated MgO with a higher magnification
150
Table 617 EDX results for MgO Based Catalysts
Catalysts O
(Weight )
Mg
(Weight)
Si
(Weight)
Other Element
(Weight)
MgO 508 483 0 Ca 084
HCl MgO 465 521 0 Cl 08 Ca 06
AuMgO 485 466 0 Cl 13 Ca 08 Au 28
Coated MgO 590 59 350 0
Coated HCl
MgO
604 309 87 0
Coated AuMgO 614 222 165 0
Treated MgO 623 377 0 0
Treated HCl
MgO
628 372 0 0
Treated
AuMgO
612 358 0 Au 30
In the untreated blank catalysts some Cl and Ca are found which corresponds with impurities
in the magnesium carbonate (The starting material for the production of MgO) They disappear
in the coated and treated samples which is likely to be due to the treatment by ultrasonic bath
and washing It is clear that the OMg ratio is quite different among the original MgO based
catalysts the coated catalysts and the treated catalysts If the increase of O ratio in the coated
samples only comes from the coating formed it would not be expected that the treated samples
would also observe the O ratio increase This will be discussed with the XRD results together
below
As above the EDX analysis found the treated AuSiO2 lost some Au (Au became only 04
after being treated) but this did not occur with the treated AuMgO It is suggested that this is
due to the different surface properties ndash as shown in the SEM the SiO2 support we employed
151
has a very smooth surface It is also noticeable that again that the gold is no longer observed
once the coating has been laid down
Again no aluminium was observed after this preparation so further analysis was taken with
XPS to test if the concentration of aluminium is only in the surface region
XPS
A small amount coated MgO sample was analysed in the XPS with the elements seen below
along with their binding energies (Table 618) As is visible from the data there is a large
presence of silicon but no aluminium is observed again showing the coating to be more silica-
like in nature The low level of magnesium detected suggests that the coating is relatively thick
(gt5 nm)
Table 618 Binding Energy of the Detected Element
Detected Element Binding Energy (eV) Approximate Composition (Atom )
O 5329 543
C 2847 102
Si 1036 338
Mg 499 13
Ca ~350 05
XRD
From the XRD results (Figure 622) we can clearly distingush the MgO and Au peaks (circles
and crosses resectively) in the untreated and coated samples However for the coated and
treated catalysts there are some other peaks in the figure which are unmarked A simple search
and match on this data suggests that the treaments impossed have led to a bulk hydroxylation
and the formation of Mg(OH)2 This explains the O increase in the treated MgO samples as
seen by EDX (Table 617) Again the gold peaks observed by XRD are very sharp showing the
152
presence of relatively large gold particles and no bulk structure is found for the coating
Figure 622 XRD Analysis for MgO Based Samples
o ndashMgO x - Au
153
Coated MgO in liquid phase reaction
MgO based catalysts were tested in the liquid phase reaction as shown in Table 619
Table 619 24 h 110ordmC 600 rpm 15 bar Oxygen 10 g n-decane 005 g Catalyst
Catalyst Conv
()
Selectivity ()
54
one
3
one
2
one
54
Ol
3
ol
2
Ol
1
ol
C5
OOH
C6
OOH
C7
OOH
C8
OOH
C9
OOH
C10
OOH
MgO 162 211 145 175 71 48 85 18 67 61 86 08 04
19
HCl
MgO 040 194 119 163
10
4 73
14
3 25 44 52 56 02 12
12
AuMgO 138 215 155 200 94 65
13
7 23 26 24 36 13 06
06
Coated
MgO 165 232 150 160 85 54 74 11 74 59 56 14 06
24
Coated
HCl
MgO 060 205 156 148 87 55 78 21 113 80 31 08 03
15
Coated
AuMgO 147 206 131 141 89 56 84 15 99 82 64 08 01
24
The high conversion that was observed for the coated SiO2 based catalysts was not observed
this time This is somewhat surprising as previously it appeared that the coating was promoting
the reaction but may be explained by the different nature of the coating In the next section the
coating on the MgO samples is analysed and it can be seen that no sodium is present (Table
617) unlike the SiO2 coated samples (Table 612)
Coated MgO in Gas Phase Reaction
Both the coated and treated MgO samples have been tested in the gas phase reactions (Table
620 to Table 624)
154
Table 620 Conversions obtained with different catalysts in the gas phase reactor when
varying the CO ratio
Catalyst Temp
(degC)
CO Conv
()
Cracked Decene C10
oxygenates
COx
MgO 318 141 27 97 1 00 2
MgO 318 71 17 97 1 00 2
AuMgO 275 141 11 96 1 00 3
AuMgO 275 71 08 97 1 00 1
Table 621 N2O oxidant 141 CO 089 n-decane 133 s residence time
Catalyst Temp
(degC)
X Cracked Decene C10
alcoholketones
CO
Coated MgO 239 03 76 52 00 19
282 04 84 43 00 11
305 06 94 24 00 4
327 13 96 14 02 2
Coated Acid
MgO
211 01 52 261 00 22
253 02 59 109 00 30
275 04 57 44 00 39
295 06 91 32 00 6
Coated
AuMgO
210 09 84 13 00 15
250 25 93 06 06 6
270 22 94 07 16 4
290 32 92 12 11 5
155
Table 622 - O2 oxidant 141 CO 089 n-decane 133s residence time
Catalyst Temp
(degC)
X Cracked Decene C10
alcoholketones
CO
Coated MgO 237 02 77 63 00 16
259 06 72 25 00 26
282 09 79 25 00 19
307 15 87 14 02 11
326 25 89 08 06 9
Coated Acid
MgO
209 01 70 177 00 13
230 02 78 84 00 13
251 04 83 59 00 11
275 06 94 00 00 6
293 20 94 16 03 4
Coated
AuMgO
208 05 41 25 00 57
229 04 93 24 00 5
249 11 71 07 00 28
270 20 85 21 06 12
295 37 97 27 02 0
Table 623 N2O oxidant 141 CO 089 n-decane 133 s residence time
Catalyst Temp
(oC)
X Cracked Decene C10
alcoholketones
CO
Treated MgO 238 03 90 49 00 5
260 09 96 16 00 2
282 19 97 08 05 1
306 47 97 07 03 2
329 84 97 06 09 1
Treated acid MgO 209 01 70 217 00 8
229 03 91 50 00 4
248 08 94 18 03 4
270 24 98 06 04 1
288 65 99 05 03 1
Treated AuMgO 211 05 94 29 00 3
249 11 91 14 00 8
252 23 95 07 00 5
274 48 97 04 01 2
294 95 97 02 02 2
156
Table 624 O2 oxidant 141 CO 089 n-decane 133 s residence time
Catalyst Temp
(oC)
X Cracked Decene C10
alcoholketones
CO
Treated MgO 238 08 90 35 00 7
260 17 90 22 13 6
283 31 94 29 22 1
304 47 92 26 29 2
Treated acid MgO 208 04 81 49 00 14
228 08 85 108 09 4
247 18 87 53 25 5
266 31 87 35 30 7
286 34 90 30 39 3
Treated AuMgO 212 11 87 14 00 12
232 26 87 08 00 13
252 46 91 13 01 8
274 70 92 13 02 7
293 82 93 13 05 6
6514 Discussion
The XRD results of MgO-based catalysts were quite similar to that of the SiO2-based catalysts
in which only the peaks of SiO2 substrate were detected for the coated samples Thus it can be
concluded the coating formed in the direct template-free method is perhaps some amorphous
SiO2 which according to the SEM images covered the substrates to an extent where the gold
was no longer observed by EDX Although the coating is probably SiO2 it is unlikely the
coatings formed on the SiO2 and MgO are the same due to the quite different appearance in the
characterization and the presence of sodium is absent from those on MgO
Combining all the liquid phase reaction results above it seems that instead of a zeolite coating
some other product is produced in the procedure And according to Table 612 the product
surprisingly seemed to be more active in decane oxidation As the phenomenon did not appear
157
again with the coated MgO based catalysts two proposals may be made based on this One is
if it is the same coating the activity should be not due to the coating only the other is the
coating formed on the SiO2 and MgO supports is not the same coating - perhaps some factors
influenced the coating formation which led to a different coating formed which can be proved
in the different appearance in the characterization in XRD Further investigation on this is given
in the following gas phase section
From these gas phase reaction results it can be seen that both the coated and treated catalysts
give an increased conversion in comparison to the untreated MgO-based systems Combined
with the characterization data this increase in activity is suggested to result from the conversion
of MgO to Mg(OH)2 In terms of selectivity for C10 oxygenated products the treated samples
show the best result followed by the coated and then the untreated It should be remembered
that these catalysts were tested under long residence times which was been shown to give
lower C10 oxygenation selectivity The best results are obtained with the acid-washed and then
the treated MgO which gave 39 selectivity at 34 conversion These selectivity increases
are not as high as had been hoped for so further development of the coating is required while
attempting to preserve the substrate in an unaltered form
6515 Conclusion
Although a significant increase of the C10 terminal selectivity was not found with any of the
powder formed coated catalysts it is notable that many catalysts show a high terminal
selectivity in the form of cracked acids As the oxidation of decane is viewed as a model
reaction for terminal products this probably has some promise as we can expect that a wide
range of terminally oxidized linear alkanes could be achieved
158
In this section SiO2 and MgO based catalysts were synthesised with a zeolite coating in which
the direct template-free zeolite membrane preparation method was employed From SEM EDX
XRD and XPS data it can be concluded that with this method the desired zeolite coating was
not obtained Instead an amorphous SiO2 overlayer was formed on the surface The direct
template-free method does not seem to produce the desired coating for our powder catalysts
Especially for the SiO2 based catalysts the SiO2 membrane formed not only on the surface of
catalyst substrates but also some excess that was not tethered to the surface
The coated samples do however show increased activity in both liquid and gas phase reactions
In the liquid phase the coated SiO2 based catalysts showed a conversion increase of 1-2
however the terminal selectivity is not affected As the coated SiO2 based catalysts have low
surface area (Table 4) it seems that the activity per unit area is quite high The treated MgO
based catalysts in the gas phase reactor showed some good activity The work now needs to
move on to study a system with an ordered pore structure
652 Zeolite A Coating with sphere support
From the previous experience the final product after a successful coating is a mixture of coated
samples extra zeolite and water Therefore with the powder form of supports such as silica
and alumina it is difficult to separate the coated samples from the mixture From a wide search
in the literature the conclusion is the same zeolite coatings were reported to be synthesized on
supports with big structures eg stainless steel cell or plate alumina spheres and silica spheres
In this section zeolite 4A coatings with alumina spheres have been tested The synthesis
procedure for the catalysts is described in the experimental section
159
6521 Results
Coatings on the alumina spheres have been carried on the alumina spheres without any active
centre only The alumina spheres have also been treated by the two different polyelectrolytes
coated in the same way and then used in reactions Figure 623 shows the surface of one of the
coated alumina spheres under the SEM According to the image there is a full coverage of
zeolite on the sphere while the pore structure is still clear
The coated alumina spheres were then used in the liquid phase reaction at 100degC for 16 h to
test the selectivity The reaction product distribution is shown in Table 625 and Figure 624
to Figure 626
Figure 623 Surface of the coated alumina spheres (treated by polydiallyl dimethyl
ammonium chloride)
160
Table 625 100degC 15 bar 10 g n-decane 3 Coated Al2O3 spheres 16 h
Catalyst Conv
()
Selectivity ()
54
one
3
one
2
one
54
ol
3
ol
2
ol
1
ol
C5
OOH
C6
OOH
C7
OOH
C8
OOH
C9
OOH
C10
OOH
Blank 018 229 144 158 76 49 78 13 125 43 61 08 05
12
1 014 190 119 166
10
1 71
11
3 21 162 20 28 05 03
02
2 007 158 108 184 97 69
12
0 22 197 09 18 06 04
06
1- Treated by polydiallyl dimethyl ammonium chloride
2- Treated by magnafloc lt35
There must be some differences between different spheres both in mass and coating status To
avoid problems caused by this the reactions have been repeated to confirm the results It was
found that the conversions of the reactions were between 010- 014 for the spheres treated
by polydiallyl dimethyl ammonium chloride and 007-011 for the spheres treated by
magnafloc The C10 terminal selectivity was always below 28
Figure 624 100degC 15 bar 10 g n-decane blank reaction 16 h
161
Figure 625 100degC 15 bar 10 g n-decane 3 coated Al2O3 spheres 16 h
Figure 626 100degC 15 bar 10 g n-decane 3 coated Al2O3 spheres 16 h
6522 Discussion and conclusion
From the results with the zeolite A coatings the conversion is almost the same as blank
162
reactions However the coatings changed the product distribution (Figure 624 to 626) as
compared to the blank reactions there is a definite increase in the selectivity for decanols
Generally the selectivity for the shortened acids decreased especially for the hexanoic acid and
heptanoic acid though the pentanoic acid increased For the terminal position there is not much
change in total conversion however the decanoic acid decreased This means the zeolite A does
not work for the primary position instead it seems it works in stopping the cracking in the
position 3 and 4 and helping the decanol production in these positions Probably the pore size
of the zeolite A (around 4 Aring) is a little bit small for the CH3 groups (around 43 Aring) while the
smaller group CH2 is more suitable in its pore size
According to the above results the zeolite 4A does not work for the terminal selectivity other
zeolites with larger pore sizes should be tried such as mordenite and silicalite-1
653 Silicalite-1 coating with sphere support
In this section silicalite-1 coating was applied to two different types of sphere supports the α-
alumina sphere (diameter 5 mm) and the γ-alumina sphere (diameter 2 mm) It is well known
the α-Al2O3 is a stable support for hydrothermal synthesis while -Al2O3 has less heat
resistance However -Al2O3 has a higher surface area (210 m2g) it is therefore possible to
load more active centres on it than on α-Al2O3 (082 m2g) which is an attractive advantage
6531 S1 coating with α-alumina spheres
01 wt Rhalumina sphere and 01 wt Aualumina sphere were treated as the procedure
described in the experimental section to synthesize silicalite-1 coated catalysts
163
Characterization
XRD analysis of the uncoated and coated samples was carried out to observe if the silicalite-1
layer was successfully synthesized The results can be found in Figure 627 and Figure 628
0 10 20 30 40 50 60 70 80 90
0
10000
20000
30000
40000
50000
60000
70000
80000
90000
Inte
ns
ity
2 Thetadegree
Uncoated RhAl2O
3
Uncoated AuAl2O
3
Coated RhAl2O
3
Coated AuAl2O
3
XRD analysis for uncoatedcoated samples
Figure 627 XRD analysis for the uncoated and coated samples
From Figure 627 it is observed that the uncoated Rh and AuAl2O3 (black and red in the figure)
show exactly the same peaks which were identified as matched α-Al2O3 No metal peaks were
found probably due to the very small metal particle size In comparison with the uncoated
samples the two coated samples (green and blue in the figure) showed very similar peaks
expect a few small peaks around 23deg These small peaks were searched and matched the MFI
pattern however it is not possible to distinguish between ZSM-5 and silicalite-1 A further
investigation with a more accurate scan between the 5deg and 40deg in the XRD was carried out
164
and the results are shown in Figure 628 In Figure 628 the major peaks of MFI are marked
with a cross These peaks were found to match the MFI peaks very well However as the
ZSM5 and silicalite-1 have very similar structures we can still not identify if it is silicalite-1
through the XRD results but an ordered structure was formed with the substrate catalysts
0 5 10 15 20 25 30 35 40 45
0
1000
2000
3000
4000
5000
6000
xxx
x
x
xxxx
x
Inte
ns
ity
2 Thetadegree
Coated RhAl2O
3
Coated AuAl2O
3
Further XRD analysis for coated Rh and AuAl2O
3 samples
Figure 628 Further XRD analysis for the coated samples
(x ndash MFI peaks o - α-Al2O3 peaks)
Table 626 shows the surface area change before and after coating Figure 629 shows the
morphology of the uncoated and coated spheres At the same magnification it was found that
after being coated the surface of catalyst spheres was covered by visible cubic particles which
are probably the accumulated silicalite-1 particles
165
Table 626 Surface area of the uncoated and coated catalysts
Catalyst Surface Area (m2g)
01 wt Rhα- Al2O3 spheres 1
Coated 01 wt Rhα- Al2O3 spheres 43
01 wt Auα- Al2O3 spheres 1
Coated 01 wt Auα- Al2O3 spheres 48
(a) 01 wt Auα-Al2O3 sphere
(b) Coated 01 wt Auα-Al2O3 sphere
Figure 629 Surface morphology of the uncoated and coated catalysts
166
Reaction
Although through the XRD results we cannot tell if the formed zeolitic material is ZSM5 or
silicalite-1 it is highly possible it is silicalite-1 as in the precursor there is no Al source the
only Al in this system comes from the alumina support which should be unable to dissolve in
the zeolitic material synthesis procedure Therefore in the following part we assume it is
silicalite-1 coated catalysts formed and call it the lsquoS1 coatedrsquo samples
The S1 coated samples were tested in the liquid phase reactions with n-decane at 110degC with
6h reactions The corresponding results are given in the Table 627
Table 627 110degC 15 bar 10 g n-decane 6 h 600 rpm 2 spheres Catalyst Conv
()
Selectivity ()
54
one
3
one
2 one 54
ol
3
ol
2
ol
1
ol
C5
OOH
C6
OOH
C7
OOH
C8
OOH
C9
OOH
C10
OOH
01
RhAl2O3
spheres 004 238 151 223 65 48 82 14 143 17 16 0 02
02
Coated
01
Rh Al2O3
spheres 012 244 162 215 51 35 58 13 136 36 36 03 10
02
01
Au Al2O3
spheres 012 142 129 196 77 54 88 18 188 46 53 03 02
04
Coated
01
Au Al2O3
spheres 016 269 176 241 53 33 51 11 70 43 41 03 01
09
From the results in the Table 627 it is difficult to gain much understanding of the performance
of the S1 coatings in the selective oxidation Comparing the conversions in Table 627 it can
be observed that both the samples with coatings obtained a higher conversion than those
without coating The two coated samples demonstrate a similar conversion which might be
167
caused by the coatings themselves instead of being caused from the active centres in the
substrate catalysts This may be due to the coated samples used in this trial having low activity
(as described earlier) therefore the activity of the coatings cannot be covered In comparison
with the decanone and decanol products it can be found that when without coatings the
selectivity for the decanone and decanols are very different for the Rh and Au catalysts
however after being coated the selectivity for these two kinds of products became similar to
each other This is further evidence that the activities performed observed in these two reactions
were caused by the coatings themselves However on the two different catalysts the coatings
which were analysed as the same type of coating in the XRD analysis showed different acid
selectivity especially for pentanoic acid and decanoic acid
6532 S1 coating with γ-alumina spheres
It is well known the α-Al2O3 is a stable support for hydrothermal synthesis while -Al2O3 has
less heat resistance However -Al2O3 has a higher surface area (210 m2g) it is therefore
possible to load more active centres on it than on α-Al2O3 (082 m2g) which is an attractive
advantage In this section the same coating synthesis procedure was again applied to the 3 wt
Au loaded smaller size γ-alumina spheres (diameter 2 mm) which have a surface area of 210
m2g Table 628 shows the surface area change before and after coating while Figure 630
shows the surface morphology of the uncoated and coated spheres Similar to the coating with
the α-Al2O3 sphere it was found that after being coated the surface of catalyst spheres was
covered by cubic particles which should be the accumulated silicalite-1 particles Further
characterization by SEM and EDX has been performed to check if the coating layers are
continuous and to determine their thickness (Figure 631 to Figure 633)
168
SEM and EDX mappings analyses were performed for the coated samples which indicated the
thickness of the silicalite-1 layer of approximately 6-8 m (Figure 631) In the mapping
images the silicon appears to be continuously distributed as a circle around the cross section of
the sphere (Figure 633)
Table 628 Surface area of the catalysts with and without coating
Catalyst Surface Area (m2g)
γ-Al2O3 spheres 210
3 Auγ-Al2O3 spheres 184
Coated 3 Auγ-Al2O3 spheres 124
169
(a) 3 wt Auγ-alumina sphere
(b) Coated 3 wt Auγ-alumina sphere
Figure 630 Surface morphology of the uncoated and coated catalysts
170
(a) The edge of 1 mm 01 AuAl2O3 (mag= 32 KX)
(b) The edge of coated samples in higher magnification (mag =1147 KX)
Figure 631 SEM images of the cross section of the S1 uncoated and coated 3 wt
Au-Al2O3 spheres
171
Figure 632 The edge of the coated samples in BSD detector
EDX analysis Au wt = 22
(a)An overall SEM image (b) Al (c) Si
(d) O (e) Au
Figure 633 EDX Mapping the cross section of the S-1 uncoated and coated 3
wtAu-Al2O3 spheres
172
Reaction
3 wt Auγ-Al2O3 catalysts before and after coating were used in the reactions for a 6 h run
as shown in Table 629
Table 629 110degC 15 bar 10 g n-decane 6 h 600 rpm 005 g catalysts (with γ-Al2O3
sphere)
Catalyst Conv
()
Selectivity ()
54
one
3
one
2
one
54
ol
3
ol
2
ol
1
ol
C5
OOH
C6
OOH
C7
OOH
C8
OOH
C9
OOH
C10
OOH
3
AuAl2O3
spheres 026 235 148 188 54 38 60 15 158 49 44 04 01
07
Coated
3
AuAl2O3
spheres 014 168 115 174 98 71 113 19 93 47 78 06 04
11
6533 Discussion and conclusion
The product distribution with the coated 3 wt Au γ-alumina spheres (Table 629) is different
from the results with the relatively bigger α-alumina spheres (Table 627) which probably
means the performance of this coated catalyst is not only the performance of the coating but
also that of the underneath catalyst This time the coating lowers the activity of the catalyst
with a small increase the terminal selectivity (though further experiments are needed to see if
this is within experimental error) in comparison with the uncoated catalyst the selectivity for
ketones goes down and for the decanols and acids all go up except the pentanoic acid again
However for the C10 terminal position the increase is minimal
Summarizing the section it can be concluded a 6-8 m thick continuous silicalite-1 coating
layer was successfully synthesized on the 3 wtAu-Al2O3 However the sample was not
found to work well as a teabag catalyst for the liquid phase oxidation of decane (Table 629)
173
which may due to the activity of the silicalite-1 in the liquid phase Therefore other zeolite
materials which are not active themselves in the liquid phase would be useful as coatings in
this study As reported in Iglesiarsquos work and our previous research the H+ form of the zeolite
is not active for the liquid phase reaction therefore zeolite A and ZSM-5 can be considered
possible options in the project Given the pore size requirement for the decane molecules it is
suggested that ZSM-5 should be the better option However the silicalite-1 coatings could still
be useful materials to test in the gas phase where silicalite-1 is not active
654 ZSM-5 coating with alumina sphere support
The synthesis of ZSM-5 coatings was carried out only with the alumina supports without any
metal loadings Experiments have been performed with both α- and -Al2O3 To develop the
optimized amount of the zeolite precursor solution for the hydrothermal synthesis different
volumes of solution with exactly the same molar composition have been used (32 ml and 15
ml) The results are shown below in sections for α- and -Al2O3 respectively
6541 ZSM-5 coating with α-Al2O3 spheres
With 32 ml zeolite precursor solution
Coverage of the coating was calculated by the weight of the coating per surface area of the
support (082 m2g) which was 00694 gm2 for this 32 ml zeolite precursor solution synthesis
as shown in Table 630 below However this is only a rough estimate as the weight change
might be slightly affected by deposition of non-crystalline material
Table 630 Coverage of the coating on the α-Al2O3 support (32 ml solution)
Support
Weight before
coated (g)
Weight after
coated (g)
Coverage
(gm2)
α-Al2O3 10491 11060 00694
174
With the normal scan by the XRD (Figure 634) it was found that the intensity of the coated
sample is much less than uncoated one this may be due to the coating or some crystallinity
may be lost during the synthesis Small ZSM-5 peaks are found in the diffractogram of the
coated α-Al2O3
10 20 30 40 50 60 70 80
0
5000
10000
15000
20000
25000
30000
35000
40000
45000
50000
55000
60000
65000
70000
75000
after
Normal Scan -Al2O
3 before and after coating
Inte
nsity
2 Thetadegree
before
after
(Intensity10)Z
Figure 634 Normal Scan α-Al2O3 before and after coating
z = likely ZSM-5 peaks
175
A low angle XRD scan for the coated samples showed more intense ZSM-5 peaks (Figure
635)
0 10 20 30 40 50 60
0
200
400
600
800
1000
1200
ZZ
Inte
nsity
2 Thetadegree
after coating
-Al2O
3
Low Angle Scan coated -Al2O
3
Z
Figure 635 Low angle scan coated α-Al2O3
The coated α-Al2O3 under the SEM showed that the morphology of the surface was not
homogeneous Some of the surface was covered with faceted micron-sized agglomerates while
other parts of the surface were covered by the deposition of nano-sized particles (Figure 636
and Figure 637)
EDX element mappings of the complete coated sphere and cross-sections of the coated sphere
were performed In Figure 638 as an example 638(a) is the original whole coated α-Al2O3
sphere 638(b) (c) and (d) are the distribution of Al Si and O respectively in the blue green
and white colour 638(e) is the mixture image of 638(b) (c) and (d) The mapping images of
the cross sections especially in Figure 639(c) showed the elements to be distributed as we
176
expected for a layer with a silicon circle around the edge of the sphere However from the
mixture image (Figure 38(e)) the elements do not appear to be distributed uniformly
Figure 636 Faceted micron-sized and nano-sized particles on the surface
Figure 637 Nano-sized particles
177
(a)An overall SEM image (b) Al (c) Si
(d) O (e) Mix
Figure 638 Mapping for a whole coated α-Al2O3 sphere
(a)A cross-section image (b) Al (c) Si
(d) O (e) Mix
Figure 639 Mapping for the cross-section of a coated α-Al2O3 sphere
With 15 ml zeolite precursor solution
The hydrothermal synthesis procedure was exactly the same as for the samples shown above
but with less zeolite precursor solution 15 ml The coverage of the coating with 15 ml zeolite
precursor solution was calculated again as before It was found that the coverage was 00693
178
gm2 (Table 631) Compared to the amount for the 32 ml solution synthesis (00694 gm2) the
coverage level was exactly the same This showed that the ability of spheres to load coatings
is limited and in both the two syntheses the maximum loading was reached
Table 631 Coverage of the coating on the α-Al2O3 support (15ml solution)
Support
Weight before
coated (g)
Weight after
coated (g)
Coverage
(gm2)
α-Al2O3 10486 11054 00693
With a low angle scan of the coated samples by XRD the main peaks of ZSM-5 are still visible
(Figure 640) which is similar to the 32 ml solution
0 10 20 30 40 50 60
0
400
800
1200
1600
2000
ZZ
Uncoated -Al2O
3
Inte
nsity
2 Thetadegree
Coated -Al2O
3
Low Angle Scan -Al2O
3 before and after coating
Z
Figure 640 Low angle scan α-Al2O3 before and after coating
In Figure 641 and Figure 642(a) there are clearly three different morphologies fluffy nano-
179
sized particles large faceted micron-sized particles and smaller micro-sized particles the larger
faceted micron-sized particles were also found in the results of the 32 ml solution synthesis It
appears as though the supports were fully covered However the thickness of the layer is
difficult to identify as in Figure 642(b)
The EDX element mapping showed a homogeneous silicon distribution over the support sphere
(Figure 643 (c)) However the mixture image did not show the element distribution to be
uniform (as for the 32 ml solution) this may due to the different particles having differing
compositions
Figure 641 Surface of the α-Al2O3 (mag = 130KX)
180
(a) Surface of the coated α-Al2O3 with a higher magnification (mag = 1178)
(b) Cross-section of the coated α-Al2O3 (mag = 16KX)
Figure 642 Morpology of the coated α-Al2O3 (mag = 130KX)
181
(a)An overall SEM image (b) Al (c) Si
(d) O (e) Mix
Figure 643 Mapping of a whole coated α-Al2O3 sphere
(a)A cross-section image (b) Al (c) Si
(d) O (e) Mix
Figure 644 Mapping of the cross-section of a coated α-Al2O3 sphere
According to the above characterization the ZSM-5 coating was successfully achieved on the
α-Al2O3 spheres although there were a few irregularly shaped faced micron sized particles
The next stage is to try to synthesize small crystals and a thinner layer ZSM-5
182
6542 ZSM-5 coating with -Al2O3 spheres
With 32 ml zeolite precursor solution
The coverage level of the coating was unable to be calculated as some of the support spheres
were found to be crushed after the hydrothermal synthesis This may be because the -Al2O3
heat resistance was reduced under the atmospheric conditions inside the autoclave However
in the previous synthesis of silicalite-1 layer (180degC) it was found that the 3 Au-Al2O3 was
much more stable as compared the blank -Al2O3 spheres used in the ZSM-5 synthesis (160degC)
In the XRD low angle scan no ZSM-5 peaks were found (Figure 645) This may be due to
the coating not forming or a thin coating layer which cannot be detected by XRD
0 10 20 30 40 50 60
0
400
800
1200
1600
2000
2400
2800
3200
after
before
Inte
nsity
2Thetadegree
Low Angle Scan -Al2O
3 before and after coating
Figure 2 Low angle scan -Al2O3 before and after coating
From the same autoclave the extra ZSM-5 powder was calcined separately with good heating
rate control and identified as ZSM-5 (Figure 646)
183
0 10 20 30 40 50 60
0
2000
4000
6000
8000
10000
12000
14000
16000
Inte
nsity
2 Thetadegree
Low Angle Scan the extra ZSM-5 in the autoclave
Figure 646 Low angle scan the extra ZSM-5 powders in the same batch with -Al2O3
The SEM images further confirmed there are no visible layers on the -Al2O3 surface It is
possible that a very thin layer or particles was synthesized that is below the detection limits of
the SEM therefore catalytic results are required to see if there is any change in product
distribution as compared with the un-treated -Al2O3 In Figure 647(b) residues of carbon
from the template are detected In the mapping images it looks as though the silicon distribution
is not a circle (Figure 648) however this could be an artefact due to the cutting of the spheres
in the sample preparation for the SEM scan
184
(a)
(b)
Figure 647 SEM images of the surface of coated -Al2O3
185
(a)A cross-section image (b) Al (c) Si
(d) O (e) Mix
Figure 648 Cross-section of a coated -Al2O3 sphere
With 15 ml zeolite precursor solution
The hydrothermal synthesis procedure was performed as for the samples shown above but
with a less zeolite precursor solution 15 ml
The coverage level of the coating was again unable to be calculated Low angle XRD revealed
the coated sample to be different from the 32 ml solution Several peaks in the measured
diffractogram (Figure 649) are similar to the main peaks of ZSM-5 (marked with lsquoorsquo)
however the main peaks (marked with lsquoxrsquo) in this are more likely to be from silicon dioxide
However the extra powder from the α- and - batches is similar and both are identified as ZSM-
5 after calcination (Figure 650) Combining all the XRD analyses it is reasonable to conclude
that -Al2O3 itself has an influence on the synthesis of coatings at its surface
186
0 10 20 30 40 50 60
0
400
800
1200
1600
2000
2400
2800
xxxx
x
ooCoated -Al
2O
3
Low Angle Scan -Al2O
3 before and after coating
Inte
nsity
2 Thetadegree
Uncoated -Al2O
3
o
x
Figure 649 Low angle scan uncoated and coated -Al2O3 surface
o ndash likely to be ZSM-5 x ndash might be silicon dioxide peaks
0 10 20 30 40 50 60
0
400
800
1200
1600
2000
2400
2800
3200Low Angle Scan the extra ZSM-5 in - and - batch
with -Al2O
3
Inte
nsity
2 Thetadegree
with -Al2O
3
Figure 650 Low angle scan the extra powders with α- and - batch
In the SEM images below (Figure 651) it is observed the coverage on the surface does not
look like the regular ZSM-5 particles The thick fluffy coating is probably silicon dioxide as
187
indicated from the more intense XRD peaks Silicon dioxide might not have the same desired
shape selectivity or radical scavenger properties as a zeolite
Figure 651 Surface of the coated γ-Al2O3
Figure 652 the cross-section of the coated γ-Al2O3
188
The element mapping (Figure 653 and Figure 654) below showed a homogeneous silicon
distribution both on the whole sphere and the cross-section images
(a)An overall SEM image (b) Al (c) Si
(d) O (e) Mix
Figure 653 Mapping of a whole coated -Al2O3 sphere
(a)A cross-section image (b) Al (c) Si
(d) O (e) Mix
Figure 654 Mapping of the cross-section of a coated -Al2O3 sphere
The two extra powders made from 15 ml precursor solutions (α- and -Al2O3) were observed
and found to be different as well (Figure 655) in the α-Al2O3 batch there are faceted micron-
189
sized particles while in the -Al2O3 batch the morphology looked the same as the coated -
Al2O3 surface
From all of the analyses of the coated -Al2O3 there is a large quantity of fluffy layers found
which are likely to be a kind of silicon dioxide The catalytic application of coated -Al2O3
may not be successful because of it Therefore it might not be a good option to use -Al2O3 for
the ZSM-5 coating
6543 Discussion
According to the above characterization the ZSM-5 coating was successfully achieved on the
α-Al2O3 spheres although there were a few irregularly shaped ZSM-5 crystals Coated γ-Al2O3
samples were found covered with a relatively large quantity of fluffy nano-sized particles
which are likely to be a type of silicon dioxide as detected by the XRD ZSM-5 particles may
be present as indicated by very weak XRD peaks but probably as a minority or with a very
small crystal sizes and therefore not detected by XRD The formation of different layers on the
α- and γ-Al2O3 may be because aluminum may leach from the support under the synthesis
conditions People reportedly to coat the γ-Al2O3 with a thin layer of mesoporous silica [26]
which will reduce the risk of crack formation due to stress under the synthesis conditions The
α and γ-Al2O3 supports clearly have an influence over the formation of coatings at their surface
190
(a) From the α-batch
(b) From the -batch
Figure 655 the morphology of the extra powders from the α-Al2O3 and -Al2O3 batches
191
655 Zeolite XY coating with silica spheres
6551 Results
The zeolite XY coated silica samples were characterized by XRF and XRD (provided by JM)
XRF results (Table 633) showed the silica to alumina ratio in the coated silica spheres and
zeolite powder from batch 1 and 2 The XRD results identified the samples as quartz and
cristabolite sample 2 as faujasite crystallite size 473 nm sample 3 as quartz and sample 4 as
faujasite crystallite size 508 nm
Table 633 XRF analysis results
Sample 1 Sample 2 Sample 3 Sample 4
Si content 4047 1864 4026 1850
Al content 263 1341 328 1339
Na content 079 1123 138 1113
Calculated Si content 00144 00066 00143 00066
Calculated Al content 00005 00025 00006 00025
Silica to alumina ratio 2956 267 2358 265
Sample 1 - Silica spheres from batch 1
Sample 2 - Zeolite powder from batch 1
Sample 3 - Silica spheres from batch 2
Sample 4 - Zeolite powder from batch 2
The two batches of zeolite XY coated silica spheres were tested in the hexane oxidation with
short (30 min) and longer (4 h) reaction times respectively The results were given in Table
634 As a comparison according to Table 635 the terminal selectivity in a blank reaction in
the same reaction time was 0 (30 min) and 4 (4 h)
192
Table 634 Zeolite X coated silica 130degC 3 bar O2 25 ml n-hexane 600 rpm
Reaction
Time
Conv
()
Selectivity ()
Ketones Alcohols Hexanoic acid Others 1-hexanol
Batch 1
30 min 003 43 42 0 19 16
4 h 029 17 20 0 63 6
Batch 2
30 min 004 36 40 0 22 13
4 h 060 11 21 0 68 7
Table 635 Blank reactions 130degC 3 bar O2 25 ml n-hexane 600 rpm single reaction
Reaction
Time
(h)
Conv
()
Selectivity ()
Ketones Alcohols Hexanoic acid Others 1-hexanol
05 0
4 0074 23 17 0 60 4
6552 Discussion
Comparing Table 634 with Table 635 it was found that the terminal selectivity was much
higher than the blank reaction especially for short reaction times In a 30 min reaction the
terminal selectivity was 16 with batch 1 which was even higher than the highest terminal
selectivity reported before (up to 13 ) with the zeolite A coated silica With a longer reaction
time while the terminal selectivity decreased to 6-7 the conversion was highly increased
The zeolite XY coated silica sample was active and selective which indicates the zeolite XY
coating works in the hexane oxidation
193
656 Zeolite A in hexane oxidation
In section 651 and 652 it was concluded that with 4Aring pore size zeolite A was not applicable
for the decane molecule to pass through However it is still worth trying in the smaller hexane
molecule oxidation In this section coated samples with different synthesis times or amounts
of supports were tested for hexane oxidation in the liquid phase For comparison some of the
silica spheres were treated at the same pH and then calcined The results of all the reactions are
given below in Table 636
Table 636 130degC 3 bar O2 25 ml n-hexane stir speed 2 single reaction (4 h) SiO2
spheres and 24 h1 g zeolite A coated SiO2 spheres
Catalyst Reactor Conv() Selectivity ()
Ketones Alcohols Acid Others 1-hexanol
silica C 038 20 13 0 67 5
Bases
treated
silica B 052 13 17 0 70 5
8 h
1g silica B 070 15 15 0 70 4
8 h
3g silica C 053 14 15 0 71 6
12 h
1g silica B 013 31 22 0 47 13
12 h
3g silica C 024 24 18 0 58 10
24 h1 g
silica B 061 14 12 1 73 4
From the above table the 12 h1 g batch shows some promise for terminal selectivity And
compared to the reaction result with only the silica sphere it appears that the conversion with
the coated sample was lower than with the silica spheres only This is equivalent to the teabag
technology principle Therefore the synthesis was repeated several times and tested again All
194
the results are given in Table 637
Table 637 130degC 3 bar O2 25 ml n-hexane stir speed 2 single reaction (4 h) SiO2
spheres and zeolite-A coated SiO2 spheres
Catalyst Reactor Conv() Selectivity ()
Ketones Alcohols Hexanoic
acid
Others 1-hexanol
Batch 1 B 026 17 14 1 68 7
Batch 2 B 013 31 22 0 47 13
Batch 3 B 011 28 23 0 49 11
Batch 4 B 046 12 13 0 75 5
Batch 5 B 050 10 12 0 78 5
It was found that some of the batches showed an interesting terminal selectivity Some of the
batches were analysed with XRD to check the structure of the samples From Figure 656 it
can be seen that the intensity ratios of first two major peaks are different for the three samples
Figure 657 is a standard XRD pattern for the zeolite A structure however our products appear
to have a additional peak at lower 2 Theta which does not seem to be from the zeolite A structure
all the other peaks observed are also present in the zeoltie A structure The source of the first
strong peak is unknown However the ratio between the first and second peak changed in the
three batches It is notable that the batch 3 which showed 11 terminal selectivity has a quite
different 1st2nd peak ratio from the others
195
0 10 20 30 40 50 60
0
500
1000
1500
2000
2500
3000
3500
4000
4500
5000
5500
Inte
nsity
2 Thetadegree
batch 5
batch 4
batch 3
Figure 656 XRD analysis for three batches of 12 h synthesized zeolite A powder
Figure 657 The standard XRD pattern of zeolite A [27]
8
OOH
196
66 Conclusions
This chapter showed the most focused work in this research in which different types of zeolites
and zeolitic material coatings were synthesized onto substrate catalysts including zeolite 4A
silicalite-1 ZSM-5 zeolite XY Characterization and catalytic tests were performed
correspondingly with n-decane or n-hexane
Application of zeolite A coating with silica powder support did not produce a significant
increase of the C10 terminal selectivity but many catalysts show a high terminal selectivity in
the form of cracked acids This probably has some promise as it can be expected that a wide
range of terminally oxidized linear alkanes could be achieved SiO2 and MgO based catalysts
coated by a direct template-free zeolite membrane preparation method was concluded not with
the desired zeolite coating Instead an amorphous SiO2 overlayer was formed on the surface
However the coated samples do show increased activity in both liquid and gas phase reactions
In the liquid phase the coated SiO2 based catalysts showed a conversion increase by 1-2
however the terminal selectivity is not affected As the coated SiO2-based catalysts have low
surface area (Table 4) it seems that the activity per unit area is quite high The treated MgO-
based catalysts in the gas phase reactor showed some good activity
Zeolite A coated alumina catalysts showed a C10 terminal selectivity always below 28 with
the conversion of reactions between 007 - 014 The conversion is almost equivalent to the
blank reactions However the coatings changed the product distribution (Figure 624 to 626)
as compared to the blank reactions Generally the selectivity for the shortened acids decreased
especially for the hexanoic acid and heptanoic acid though the pentanoic acid increased For
the terminal position there is not much change in total however the decanoic acid decreased
197
while the selectivity for decanols increased slightly by 1 This means that the zeolite A does
not work for the primary position instead it seems it works in stopping the cracking in the
position 3 and 4 and helping decanol production in these positions Probably the pore size of
the zeolite A (around 4 Aring) is a little bit small for the CH3 groups (around 43 Aring) while the
smaller group CH2 is more suitable in its pore size
Silicalite-1 coating was applied to both α- and γ-alumina sphere supports with Rh or Au metal
loaded as the active centres It can be concluded that a 6-8 microm thick continuous silicalite-1
coating layer was successfully synthesized on the 3Auγ-Al2O3 However the sample was
not found to work well as a teabag catalyst for the liquid phase oxidation of decane (Table
629) The terminal selectivity change was minimal This may due to the activity of the
silicalite-1 in the liquid phase
ZSM-5 coating was successfully achieved on the α-Al2O3 spheres although there were a few
irregularly shaped ZSM-5 crystals Coated γ-Al2O3 samples were found covered with a
relatively large quantity of fluffy nano-sized particles which are likely to be a type of silicon
dioxide as detected by the XRD ZSM-5 particles may be present as indicated by very weak
XRD peaks but probably as a minority or with a very small crystal sizes and therefore not
detected by XRD The formation of different layers on the α- and γ-Al2O3 may be because
aluminum may leach from the support under the synthesis conditions It was found that the α
and γ-Al2O3 supports clearly have an influence over the formation of coatings at their surface
Zeolite X and Y coated silica catalysts tested with n-hexane liquid phase oxidation showed
much higher terminal selectivity than the blank reaction especially with a short reaction time
198
In a 30 min reaction the terminal selectivity was 16 while the terminal selectivity for the
blank reactions was 0-9 With a longer reaction time the terminal selectivity decreased to 6-
7
Zeolite 4A coated silica spheres were also found to work in raising the terminal selectivity in
hexane liquid phase oxidation A stable 1-hexanol selectivity of gt4 was observed with 4 h
reaction It was also observed that the synthesis time of the coating affected the reaction With
a coating synthesis time of 12 h the maximum 1-hexanol selectivity could reach 13
67 References
[1] N van der Puil FM Dautzenberg H van Bekkum JC Jansen Microporous and
Mesoporous Materials 27 (1999) 95
[2] Collier Paul John Golunskin Stanislaw Edmund US Patent No0032628 2005
[3] RN Devi FC Meunier T Le Goaziou C Hardarcre PJ Collier SE Golunski LF
Gladden MD Mantle Journal of Physical Chemistry C 112(29) (2008) 10968
[4] ER Geus AE Jansen J Schoonman H van Bekkum Catalysis and Adsorption by
Zeolites Studies in Surface Science and Catalysis vol65 Elsevier Amsterdam ( 1991) 451
[5] M Matsukata Chemical Communications (1996) 1441
[6] P Wenqin SUeda and MKoizumi Proceedings of the 7th International Zeolite Conference
(Eds Y Murakami A Lijima and JWWard) Elsevier Tokyo (1986) 177
[7] L Gora K Streletzky RW Thompson GDJ Phillies Zeolites 18 (1997) 119
[8] T Cetin M Tatlier A Erdem-Senatalar U Demirler M Urgen Mircoporous and
Mesoporous Materials 47 (2001) 1
199
[9] O Andac SM Telli M Tatlier A Erdem-Senatalar Microporous and Mesoporous
Materials 88 (2006) 72
[10] Z Zhou J Yang Y Zhang L Chang W Sun J Wang Separation and Purification
Technology 55 (2007) 392
[11] Z Wang J Hedlund J Sterte Microporous and Mesoporous Materials 52 (2002) 191
[12] M Tatlier MDemir BTokay AErdem-Senatalar LKiwi-Minsker Microporous and
Mesoporous Materials 101 (2007) 274
[13] JC Jansen JH Koegler H van Bekkum HPA Calis CM van den Bleek F Kapteijn
JA Moulijn ER Geus N van der Puil Microporous and Mesoporous Materials 21 (1998)
213
[14] H Kalipcilar A Culfaz Microporous and Mesoporous Materials 52 (2002) 39
[15] K Aoki K KusakabeSMorooka Journal of Membrane Science 141 (1998) 197
[16] P Collier S Golunski C Malde J Breen R Burch Journal of the American Chemistry
Society 125 (2003) 12414
[17] N Nishiyama K Ichioka D Park Y Egashira K Ueyama L Gora W Zhu F Kapteijn
JA Moulijn Industrial Engineering Chemistry Research 43 (2004) 1211
[18] J Park BC Kim SS Park HC Park Journal of Materials Science Letters 20 (2001)
531
[19] Y Yan ME Davis GR Gavalas Industrial Engineering Chemistry Research 34 (1995)
1652
[20] BJ Schoeman A Erdem-Senatalar J Hedlund J Sterte Zeolites 19 (1997) 21
[21] ER Genus Hvan Bekkum Zeolites 15(4) (1995) 333
[22] F Jareman C Andersson J Hedlund Microporous and Mesoporous Materials 79 (2005)
1
200
[23] P Siva Sankar Reddy N Pasha MGV Chalapathi Rao N Lingaiah I Suryanarayana
PS Sai Prasad Catalysis Communications 8 (2007) 1406
[24] DC Vu M Miyamoto N Nishiyama S Ichikawa Y Egashira K Ueyama
Microporous and Mesporosous Materials 115 (2008) 106
[25] B Modeacuten B Zhan J Dakka J G Santiesteban E Iglesia Journal of Physical
Chemistry 111 (2007) 1402
[26] MR Othman SC Tan S Bhatia Microporous and Mesoporous Materials
121 (2009) 138
[27] Web database of zeolites httpwwwiza-structureorgdatabases
201
CHAPTER 7
Conclusions
202
CONCLUSIONS
This thesis describes the searching preparation characterization and catalytic evaluation of
active catalysts for the terminal selectivity of long chain linear alkanes The focus of the thesis
is the preparation characterization and catalytic evaluation of the shape-selective materials
including the organic material cyclodextrins and the inorganic materials zeolite and zeolitic
membranes Prepared catalysts were performed with n-decane or n-hexane as models to
produce the terminal products 1-decanol 1-hexanol decanoic acid and hexanoic acid The
conclusions of the research to date were summarized as follows
Firstly the studies with the Andrews glass reactor were presented for the purpose of reproducing
the best selective results available in the literature published by Thomas [1-4] and Iglesia [5 6]
for the oxidation of n-hexane in liquid phase However Thomas et al did not calculate the
autoxidation with the ALPO catalysts Iglesiarsquos work was more crucial in this area The time
on-line blank reaction results showed similar terminal selectivities to Iglesiarsquos work in
autoxidation with the terminal selectivity stable at 5-9 However the terminal selectivity
with Mn-ZSM5 was still very low (~0) Iglesiarsquos high terminal selectivity with Mn-ZSM5
could not be reproduced
A comparison between the Andrews glass reactor and the Parr stainless steel reactor showed
that the autoxidation reactions performed higher conversion but lower terminal selectivity in
the stainless steel reactor than the glass reactor which indicates the stainless steel reactor itself
may have some activity in the oxidation reaction
203
Various catalysts have been evaluated for decane oxidation in the project eg 5 wt AuTiO2
25 wt Au - 25 wt PdSiO2 Most of the catalysts showed very low conversion and very
poor terminal selectivity Increasing the temperature leads to higher conversion but results in
more cracked products and less selectivity for oxygenated C10 products Figure 71 showed the
activity of the auto-oxidation and the activity of a range of catalysts It was found that the most
active catalyst was 5 wt AuTiO2 However these catalysts did not show good terminal
alcohol selectivity (lt3) whereas the cracked acid selectivity was high (320)
Figure 71 ndash Conversion with different catalysts (reaction conditions 110oC 10 g n-
decane 005 g catalyst 15 bar O2 600 rpm stainless steel reactor)
Cyclodextrins were investigated as an organic shape-selective material to coat the AuSiO2
catalysts in Chapter 5 Addition of CDs alone without the catalyst decreased the conversion
but no trend in terminal selectivity was observed With the CD covered AuSiO2 catalyst a
decrease in conversion has been observed compared to the blank reaction however the changes
in terminal selectivities are still limited (1-2) and considered to be within the experimental
errors To conclude the CD covered catalysts which were prepared by the direct impregnation
method did not play an important role in increasing the terminal selectivity
204
Finally the most important studies in the thesis was the synthesis of different types of zeolite
coatings onto substrate catalysts which was the so called lsquoteabag technologyrsquo Zeolite 4A
silicalite-1 ZSM-5 zeolite XY were successfully synthesized Characterization and catalytic
evacuations were performed correspondingly with n-decane or n-hexane
Application of zeolite A coating with silica powder support did not produce a significant
increase of the C10 terminal selectivity but many catalysts show a high terminal selectivity in
the form of cracked acids This probably has some promise as it can be expected that a wide
range of terminally oxidized linear alkanes could be achieved SiO2 and MgO based catalysts
coated by a direct template-free zeolite membrane preparation method was concluded not with
the desired zeolite coating Instead an amorphous SiO2 overlayer was formed on the surface
However the coated samples do show increased activity in both liquid and gas phase reactions
In the liquid phase the coated SiO2-based catalysts showed a conversion increase by 1-2
however the terminal selectivity is not affected As the coated SiO2-based catalysts have low
surface area it seems that the activity per unit area is quite high The treated MgO based
catalysts in the gas phase reactor showed some good activity
Zeolite A coated alumina catalysts showed a C10 terminal selectivity was always below 28
with the conversion of reactions between 007 - 014 The conversion is almost equivalent
to the blank reactions However the coatings changed the product distribution (Figure 624 to
626) as compared to the blank reactions Generally the selectivity for the shortened acids
decreased especially for the hexanoic acid and heptanoic acid though the pentanoic acid
increased For the terminal position there is not much change in total however the decanoic
205
acid decreased while the selectivity for decanols increased slightly by 1 This means the
zeolite A does not work for the primary position instead it seems it works in stopping the
cracking in positions 3 and 4 and helping the decanol production in these positions Probably
the pore size of the zeolite A (around 4 Aring) is a little bit small for the CH3 groups (around 43
Aring) while the smaller group CH2 is more suitable in its pore size
Silicalite-1 coating was applied to both α- and γ-alumina sphere supports with Rh or Au metal
loaded as the active centres It can be concluded that a 6-8 microm thick continuous silicalite-1
coating layer was successfully synthesized on the 3Auγ-Al2O3 However the sample was
not found to work well as a teabag catalyst for the liquid phase oxidation of decane (Table
629) The terminal selectivity change was minimal This may due to the activity of the
silicalite-1 in the liquid phase
ZSM-5 coating was successfully achieved on the α-Al2O3 spheres although there were a few
irregularly shaped ZSM-5 crystals Coated γ-Al2O3 samples were found covered with a
relatively large quantity of fluffy nano-sized particles which are likely to be a type of silicon
dioxide as detected by the XRD ZSM-5 particles may be present as indicated by very weak
XRD peaks but probably as a minority or with a very small crystal sizes and therefore not
detected by XRD The formation of different layers on the α- and γ-Al2O3 may be because
aluminum may leach from the support under the synthesis conditions It was found that the α
and γ-Al2O3 supports clearly have an influence over the formation of coatings at their surface
Zeolite X and Y coated silica catalysts tested with n-hexane liquid phase oxidation showed
much higher terminal selectivity than the blank reaction especially with a short reaction time
206
In a 30 min reaction the terminal selectivity was 16 while the terminal selectivity for the
blank reactions was 0-9 With a longer reaction time the terminal selectivity decreased to 6-
7
Zeolite 4A coated silica spheres were also found to work in raising the terminal selectivity in
hexane liquid phase oxidation A stable 1-hexanol selectivity of gt4 was observed with a 4 h
reaction It was also observed that the synthesis time of the coating affected the reaction With
the coating synthesis time of 12 h the maximum 1-hexanol selectivity could reach 13
References
[1] JM Thomas R Raja G Sankar R G Bell Studies in Surface Science and Catalysis 130
(2000) 887
[2] R Raja G Sankar JM Thomas Angewandte Chemistry 39 (2000) 231
[3] JM Thomas R Raja G Sankar RG Bell Accounts of Chemical Research 34 (2001)
191
[4]R Raja JM Thomas Journal of Molecular Catalysis A 3 (2002) 181
[5] B Modeacuten B Zhan J Dakka J G Santiesteban E Iglesia Journal of Physical Chemistry
111 (2007) 1402
[6] B Zhan B Modeacuten J Dakka JG Santiesteban E Iglesia Journal of Catalysis 245 (2007)
316

v
CONTENTS
Chapter 1 Introduction 1
11 Significance of the thesis 2
12 Aim of the thesis 2
13 Catalysis 3
14 Challenges in the selective oxidation 4
15 Industrial applications of long chain linear alcohols 5
16 Current manufacture of long linear alcohols in industry 6
17 Alkane oxidation in literature 8
18 Zeolites 10
181 Zeolite composition 10
182 Shape selective application of zeolite 11
183 Synthesis of the zeolite membrane 12
19 The model reactions in this research 14
110 The research branches in this project 15
1101 Supported catalyst investigations for shape selective catalysts 15
1102 Teabag technology 15
111 References 16
Chapter 2 Experimental Techniques 19
21 Introduction 20
22 Catalyst preparation 20
221 Preparation of supported metal catalysts 20
222 Preparation of zeolite and zeolitic coated catalysts 23
223 Preparation of cyclodextrin modified catalysts 25
vi
23 Catalyst characterization technique 25
231 X-ray powder diffraction 25
232 Scanning electron microscopy 27
233 Surface area method (BET) 29
234 Atomic absorption spectroscopy 30
235 X-ray photoelectron spectroscopy 31
24 Reactors used in the project 32
241 The Parr multiple stainless steel reactor system 32
242 The Andrews glass reactor system 34
25 Analysis and qualification of reaction products 35
251 Analysis by Gas Chromatography 35
252 Quantification of the products via response factor 36
2521 Use of internal standard 36
2522 Calculations of relative response factors of each compound 36
2523 Quantification and analysis of the reaction 39
26 References 41
Chapter 3 Andrews Glass Reactor 42
31 Introduction 43
32 Experimental 44
321 Apparatus and reaction 44
322 Safety operating procedure 45
323 Characterization technique 48
33 Results 48
331 Andrews glass reactor in blank hexane oxidation 48
vii
3311 Comparison between Andrews glass reactor and stainless steel reactor
49
3312 Repeat Iglesiarsquos blank reaction 51
3313 The unknown products in analysis 51
3314 Application of aqua regia as washing agent 52
3315 Time on-line reactions 53
3316 Discussion 55
332 Reaction with Mn-ZSM5 56
34 Conclusion 57
35 References 58
Chapter 4 Catalytic investigation for teabag coating 60
41 Introduction 61
42 Experimental 62
421 Metalsupport catalysts 62
422 RhRu loaded catalysts 63
43 Results 64
431 Pd Au Pt loaded supported catalysts 64
432 Higher temperature reactions 66
433 Discussion 68
434 Use of a radical scavenger 68
435 Development of the catalyst preparation method 70
436 Ru and Rh loaded catalysts 75
4361 α-phase alumina powder support 76
4362 γ-phase alumina powder support 78
4363 Loading with alumina spheres 83
44 Conclusion 85
viii
45 References 87
Chapter 5 Cyclodextrin covered catalysts 88
51 Introduction 89
52 Cyclodextrins as catalyst modifiers 91
53 Experimental 95
531 Preparation of CD covered catalysts 95
532 Catalyst testing 96
54 Results 97
541 BET analysis 97
542 Activity of CDs 98
5421 Activity of CDs under reaction conditions 98
5422 Activity of CDs with the addition of radical scavenger 100
543 CD modified AuSiO2 101
5431 The fully covered AuSiO2 101
5432 Different level of CD coverage over catalysts 102
5433 Cyclodextrin modified catalyst recycling 104
544 CD modified AuHCl treated SiO2 105
55 Conclusion 107
56 References 107
Chapter 6 Teabag Technology 109
61 Introduction 110
62 The teabag technology project 110
63 Zeolite membrane synthesis 112
631 Preparation method 112
ix
632 Supports in zeolite coating 116
633 Other factors for preparation 119
634 Deactivation 123
64 Experimental 124
641 Preparation of coated catalysts 124
6411 Zeolite A coated samples with silica powder support 125
6412 Zeolite 4A coated samples with sphere supports 126
6413 Silicalite-1 coating with sphere supports 127
6414 ZSM-5 coating with α- and -Al2O3 128
642 Reaction conditions 129
643 Characterization 130
65 Results 130
651 Zeolite A coating with powder support 130
6511 Coated SiO2 in liquid phase reaction 130
6512 Discussion 147
6513 Coated MgO in gas phase reaction 147
6514 Discussion 156
6515 Conclusion 157
652 Zeolite A coating with sphere support 158
6521 Results 159
6522 Results and discussion 161
653 Silicalite-1 coating with sphere support 162
6531 S1 coating with α-alumina spheres 162
6532 S1 coating with γ-alumina spheres 167
6533 Discussion and conclusion 172
654 ZSM-5 coating with alumina sphere support 173
x
6541 ZSM-5 coating with α-alumina spheres 173
6542 ZSM-5 coating with β-alumina spheres 182
6543 Discussion 189
655 Zeolite XY coating with silica sphere support 191
6551 Results 191
6552 Discussion 192
656 Zeolite A coating in hexane oxidation 193
66 Conclusion 196
67 References 198
Chapter 7 Conclusions 201
xi
ABBREVIATIONS
ordmC Degrees centigrade
Aring Angstrom
AAS Atomic Absorption Spectroscopy
Al2O3 Alumina
Bar Unit of Pressure
BET Brunauer Emmett Teller
cm Centimetre
EDX Energy Dispersive X-ray Spectroscopy
FID Flame Ionisation Detector
NMR Nuclear Magnetic Resonance
g Grams
GC Gas Chromatography
GC-MS Gas Chromatography Mass-Spectrometer
MgO Magnesium Oxide
m Metre
min Minute
mL Millilitre
ppm Parts Per Million
psi Pounds Per Square Inch
S1 Silicalite-1
SEM Scanning Electron Microscopy
SiO2 Silica
TEM Transmission Electron Microscopy
VMgO Vanadium-Magnesium Mixed Oxides
xii
XPS X-Ray Photoelectron Spectroscopy
XRD X-Ray Diffraction
XRF X-ray Fluorescence
ZSM-5 Zeolite Socony Mobil ndash 5
1
CHAPTER 1
Introduction
2
INTRODUCTION
11 Significance of the thesis
Organic compounds such as alcohols aldehydes ketones epoxides and acids are widely used
in everyday life and industry Therefore the production of these compounds is of key
importance in modern chemistry research and to the chemical industry There are many ways
to produce these oxygen-containing organic compounds but oxidation of saturated
hydrocarbons is one of the most significant It is widely known that there are large quantities
saturated hydrocarbons obtained from natural gas and petroleum [1] in fact in South Africa
Sasol (one of the sponsors of this thesis) produces large amount of alkanes in its Fischer
Tropsch process [2] Alkanes as a relatively environmentally friendly and low cost feedstock
are ideal for the production of those valuable organic compounds Various products can be
obtained by oxidation of alkanes In this thesis the study focused on the terminal oxidation of
long chain alkanes whose products can be used in the manufacture of plasticizers lubricants
solvents surfactants and materials for further chemical functionalization
12 Aim of the thesis
The thesis is a fundamental study into the terminal oxidation of long chain n-alkanes using n-
decane and n-hexane as model compounds to produce 1-decanol decanoic acid or 1-hexanol
and hexanoic acid (Figure 11) in liquid phase reactions There are two challenges in this study
how to enhance the activity of the reaction and how to control the regioselectivity of the
oxidation To overcome the challenges catalysis was introduced into the project The project
was collaboration between Cardiff University Johnson Matthey and Sasol
3
Figure 11 Aim of the thesis ndash terminal oxidation of decane
13 Catalysis
Catalysis is the change in rate of a chemical reaction due to the participation of a catalyst
Unlike other reagents that participate in the chemical reaction a catalyst is not consumed by
the reaction itself A catalyst may participate in multiple chemical transformations Catalysts
that speed the reaction are called positive catalysts Substances that interact with catalysts to
slow the reaction are called inhibitors (or negative catalysts) Substances that increase the
activity of catalysts are called promoters and substances that deactivate catalysts are called
catalytic poisons A catalyst does not change the thermodynamics of the reaction but simply
provides a new and easier pathway by lowering the activation energy A good catalyst must
possess both high activity and long-term stability But its single most important attribute is its
selectivity which reflects its ability to direct conversion of the reactant(s) along one specific
pathway [3]
Catalysis can be divided into three categories homogeneous catalysis heterogeneous catalysis
4
and biocatalysis Homogeneous catalysis covers all the cases where catalysts and reactants are
in the same phase while heterogeneous catalysis covers all the cases where catalysts and
reactants are in different phases Homogeneous catalysts exhibit a higher activity per unit mass
of metal than heterogeneous catalysts [4] however it is difficult to recover the catalyst In
heterogeneous catalysis there is little difficulty in separating and recycling the catalyst
Biocatalysis is a rather special case somewhere between the homogeneous and heterogeneous
catalysis In most cases biocatalysts are enzymes which are often seen as a separate catalyst
group [5]
14 Challenges in the selective oxidation of alkanes
Economic factors and technological innovations often induce changes in the chemical
feedstocks used to produce commodity organic chemicals These reasons caused alkanes to
replace acetylene in many commercial processes several decades ago Alkanes as the least
expensive and most abundant hydrocarbon resource have a very important potential role in the
chemical industry However very few selective methods are available for converting alkanes
into more valuable products Furthermore several desirable reactions utilizing alkanes are not
thermodynamically favourable at reasonable temperatures Even where alkanes are used their
transformations are often inefficient This is because alkanes are saturated and lack functional
groups Hydrocarbons can only undergo reaction after cleavage of C-H or C-C bonds In most
instances the strength of the C-H bonds involved controls the rate and selectivity of oxidation
turnovers [6 7] As a result preferential oxidation specific C-H bonds except as dictated by
their relative bond strengths remains a formidable challenge C-H bonds at terminal positions
in n-alkanes are ~13 kJmol stronger than secondary C-H bonds (eg 410 kJmol vs 397
kJmol for propane) [8] thus terminal oxidation selectivities are typically below 10 in C10-
5
alkanes unless spatial constraints imposed by the H-abstractor or by the structure of the voids
around active sites favour terminal attachment or inhibit access to secondary or tertiary
carbons
Another problem in the selective oxidation of alkanes is the initial product of alkane oxidation
is often more reactive toward the oxidant than the alkane itself Overoxidation of the initial
product will dramatically reduce the desired product yield
15 Industrial applications of long chain linear alcohols
Linear primary alcohols are amphiphiles composed of a polar part (hydroxyl group) and an
apolar part (alkane chain) The amphiphile molecules can be utilized as surfactants The limited
solubility makes them aggregate in the interface between two phases to form micelles
Therefore linear primary alcohols are good detergents They are also used in the composition
of plastics and cement where they can increase the fluidity of the material Another industrial
application of linear alcohols is that they are very important materials for further chemical
functionalization based on the large number of reactions the hydroxyl group may undergo
(Figure 12 [9]) The resulting products are important commercial intermediates
6
Figure 12 Typical examples of reactions that can undergo terminal alcohols [9]
16 Current manufacture of long linear alcohols in industry
Two basic dominating industrial-scale processes are used to manufacture linear alcohols the
Ziegler process and the oxo synthesis (hydroformylation) starting from petrochemical
feedstocks [10] The Ziegler chemistry process contains five steps hydrogenation ethylation
growth reaction oxidation and hydrolysis The starting material is ethylene (Figure 13)
Terminal Linear alcohol + Oxygen rarr Aldehyde + carboxylic acid
+ Alkali Melt rarr carboxylic acid
+ Alkali rarr Dimeric Alcohol
+ Proton rarr Ether Olefin
+ Alkyne rarr Vinyl Ether
+ Carboxylic acid rarr Easter
+ Hydrogen Halide rarr Alkyl Halide
+ AmmoniaAmine rarr Amine
+ AldehydeKetone rarr Acetal
+ Sulfide rarr Thiol
+AlcoholateH2S rarr Xanthate
+Metal rarr Metal alkoxide
7
Figure 13 The multi-step Ziegler process
Al2O3 is not recycled during the reaction so it is not a catalytic process
The second industrial route is hydroformylation also known as the oxo process (Figure 14)
The process typically is accomplished by treatment of an alkene with high pressures (10-100
atm) of carbon monoxide and hydrogen at temperatures between 40 and 200ordmC [11] Transition
metal catalysts are required It is a heterogeneous catalytic process
Al
Al(C2H5)3 + (x+y+z) C2H4 Al
(CH2CH2)xCH2CH3
(CH2CH2)yCH2CH3
(CH2CH2)zCH2CH3 Triethylalumininum Ethylene
Growth Product
(CH2CH2)xCH2CH3
(CH2CH2)yCH2CH3
(CH2CH2)zCH2CH3
Growth Product
Oxidation
Al
O(CH2CH2)xCH2CH3
Aluminum Alkoxide
O(CH2CH2)yCH2CH3
O(CH2CH2)zCH2CH3
Al
O(CH2CH2)xCH2CH3
O(CH2CH2)yCH2CH3
O(CH2CH2)xCH2CH3
+
CH3-CH2-(CH2CH2)xOH
linear Primary Alcohols
Al(OH)3 +
Aluminium
Hydroxide
CH3-CH2-(CH2CH2)yOH
CH3-CH2-(CH2CH2)zOH
3 H20
8
Figure 14 Two-step oxo processes
Both the Ziegler process and the oxo process use alkenes as the feedstocks and require multi-
step reactions A process using long chain linear alkanes as the feed would be less expensive
and more environmentally friendly
17 Alkane oxidation in literature
Literature covering long chain alkane oxidation is limited Most of the literature discussing
alkane activation relates to short chain linear alkanes (eg methane to butane) or cyclic
hydrocarbons (eg cyclohexane) in which different catalytic approaches were presented
A bio-catalytic approach has been used for the alkane oxidation It was reported that enzymes
(momo-oxygenase) can oxidize the terminal group of linear alkane with oxygen [12] The
catalytic active centre of the mono-oxygenase (Fe) is surrounded by a large protein structure
which controls the substrate to the oxidation centre
Homogeneous catalysts were also reported in the terminal selective oxidation of alkanes In the
literature in the presence of tetra-n-butylammonium salts of vanadium-containing
polyphosphomolybdates [PMo11VO40]4minus and [PMo6V5O39]
12minus n-Octane can be efficiently
oxidized by hydrogen peroxide in acetonitrile The terminal selectivity was reported to be 82
9
[13]
However due to the scope of this project only heterogeneous catalysts were available to be
coated by shape selective materials Therefore this review is focused on heterogeneous
catalysts Compared with biocatalysis and homogeneous catalysis heterogeneous catalysis is
preferred in industry because it is easier to operate and less expensive There have been some
attractive catalysts reported in the terminal oxidation of alkanes using heterogeneous catalysts
In gas phase studies Mathebula reported a dehydrogenation process to produce the terminal
alcohol using n-hexane as the reactant [14] Following this method VMgO was employed as
the catalyst for the dehydrogenation of n-hexane to the terminal hexene The conversion was
reported to be 5 with a terminal selectivity less than 2 Then hydroxylation of alkene was
applied by a two-step process using sodium perborate followed by oxidation over H2O2NaOH
to obtain the terminal alcohol
In liquid phase studies the key results were reported by Thomas for n-hexane oxidation in
liquid phase [15-21] In his study Thomas used ALPO catalysts with air as the oxidant The
terminal selectivity can be extremely high (up to 87 conversion 655 selectivity with Co-
ALPO-18) Iglesia [22] tried to reproduce Thomasrsquos results under similar experimental
conditions using Mn-ALPO catalysts However the conversion was quite low (002-005)
while the terminal selectivity was 7 only Iglesia concluded that Mn-ALPO did not lead to
any preference for terminal selectivity in contradiction with Thomasrsquo results Iglesia published
his own results using Mn-ZSM5 as the catalyst (Table 11) [23]
Unlike Thomasrsquos study Iglesia noticed the autoxidation reaction and demonstrated a clear
10
difference in the terminal selectivity in the presence of catalysts It was clear that when the
catalyst was present the terminal selectivity was initially high (24) but the selectivity
declined when conversion increased In contrast the terminal selectivity in the autoxidation was
always 7-8
Table 11 Iglesiarsquos results for oxidation of n-hexane with Mn-ZSM-5 catalysts
Time
(hours)
Conversion
()
Terminal selectivity ()
with Mn-ZSM-5
Terminal selectivity ()
Autoxidation
05 0007 24 7
25 0013 185 8
4 0047 15 8
7 01 10 7
18 Zeolites
181 Zeolite composition
Zeolites are microporous crystalline solids with well-defined structures Generally they contain
silicon aluminium and oxygen in their framework Structurally they are complex crystalline
inorganic polymers based on an infinitely extending three-dimensional four-connected
framework of AlO4 and SiO4 tetrahedra linked to each other by the sharing of oxygen ions
(Figure 15) Each AlO4 tetrahedron in the framework bears a net negative charge which is
balanced by an extra-framework cation The framework structure contains channels or
interconnected voids that are occupied by the cations and water molecules The cations are
mobile and ordinarily undergo ion exchange The water may be removed reversibly generally
by the application of heat which leaves intact a crystalline host structure permeated by the
11
micropores and voids which may amount to 50 of the crystals by volume [24]
Figure 15 The microporous molecular structure of a zeolite (ZSM-5)
18 2 Shape selective application of zeolite
Due to the very regular pore structure of molecular dimensions zeolites are well-known as a
shape selective material The maximum size of the molecular or ionic species that can enter the
pores of a zeolite is controlled by the dimensions of the channels which is usually less than 10
Aring
Zeolite shape selectivities can be distinguished into three types depending on whether pore
size limits the entrance of the reacting molecule or the departure of the product molecule or
the formation of certain transition states (Figure 16)
Reactant selectivity occurs when only parts of the reactant molecules are small enough
to diffuse through the catalyst
Product selectivity occurs when some of the products formed within the pores are too
bulky to diffuse out as observed products They are either converted to less bulky
12
molecules (eg by equilibration) or eventually deactivate the catalyst by blocking the
pores
Restricted transition state selectivity occurs when certain reactions are prevented
because the corresponding transition state would require more space than available in
the cavities Neither reactant nor potential product molecules are prevented from
diffusing through the pores Reactions requiring smaller transition states proceed
unhindered
Figure 16 The type of shape selectivities [25]
183 Synthesis of the zeolite membrane
As a well-known shape selective catalyst zeolites can be synthesized as membrane for the
purpose of separation adsorption or for the selective reaction An ideal zeolite membrane
13
combines the general advantages of inorganic membranes (temperature stability solvent
resistance) with perfect shape selectivity A continuous zeolite membrane can principally
discriminate the components of gaseous or liquid mixtures dependent on their molecular size
Several methods for the preparation of the zeolite coatings can be found in the literature
1) Slurry coating or wash-coating in which the zeolite is brought onto the support from a wash-
coat solution containing precursors of binders based on alumina zirconia silica titania or
silica-alumina The coatings are calcined to obtain bonding of the crystallites to the support
surface [26] This method yields crystal layers which have a low continuity and a limited
accessibility since they are partly covered by the macroporous wash-coating
2) Dry gel conversion in which a gel containing the alumino-silicate precursor water and
template is brought onto the support dried and subsequently crystallized by contacting with
steam at 105-150degC [27]
3) In situ coating the most widely used method recently in which the crystals are directly
grown close to or on the support either from a gel or a solution[28-41] In this way coatings
may be grown that have a high continuity and can be optimized for use as either a membrane
or a catalyst
Although typical zeolite coating synthesis can be carried out in a dry gel it is more common
today to synthesize zeolite coatings by a hydrothermal method in dilute aluminosilicate systems
in which the amorphous gel phase is not present The first so called lsquoclear solutionrsquo (or lsquoclear
to eye solutionrsquo) system that produced zeolite NaA was reported at the International Zeolite
Association (IZA) meeting in Tokyo in 1986 [28] The batch composition in it formed the
starting point of the present work in clear solution One of the advantages of the clear solution
14
is it permits the use of in situ observations using light scattering techniques to study the
synthesis[29] especially the nucleation and crystal growth processes occurring within the
solution phase
Another important factor in the zeolite membrane synthesis is the selection of support
Generally support materials should be chosen that are readily available attrition resistant and
chemically stable For the purposes of the reaction the most widely used supports were alumina
and silica More details of the literature review are presented in Chapter 6
19 The model reactions in this research
The basic idea of the project is using shape-selective materials (eg cyclodextrins and zeolites)
to realize the terminal selective oxidation of long chain alkanes In the studies n-hexane and
n-decane were selected as the models to produce the linear alcohols Cyclodextrins were
applied as an organic shape selective material whereas zeolites were used as inorganic shape
selective materials The shape selective catalysts were built by the active supported catalyst
substrate and a continuous shape-selective membrane layer composed of shape-selective
materials (eg cyclodextrin or zeolite covered catalysts) An ideal catalyst system following
the principle of the idea is shown in the Figure 17
Figure 17 The ideal shape-selective catalyst system
15
Therefore the typical reactions were three phase reactions between gaseous (oxygen) liquid
(n-hexane or n-decane) and solid catalysts which are often encountered in the chemical
industry The advantages of liquid phase reactions are the relatively lower reaction
temperatures and higher time-yields than gas phase reaction the disadvantages are the products
must be separated and purified afterwards and the stability of catalysts also needs to be
considered
110 The research branches in the project
1101 Supported catalyst investigations for shape selective catalysts
As shown in the Figure 17 the shape selective catalysts were built by the active supported
catalyst substrate and a continuous shape-selective membrane layer composed by shape-
selective materials (eg cyclodextrins or zeolites covered catalysts) Therefore the first step
of the research is to find the proper active supported catalysts
1102 Teabag technology
Teabag catalysts prepared by teabag technology is an idea that zeolite coatings work as the
teabag to control the diffusion of reactants to the active sites in a specific configuration that
only allows the oxidation of the terminal position Small aggregates of zeolite crystals as a
coating on the surface of a catalyst have improved external mass transfer characteristics and a
high internal accessibility especially in fast liquid phase and gasliquid phase reactions [42]
In the project zeolites with suitable pore size were selected so that only the wanted reactant
and product can pass through the outer coating to an oxidation catalyst underneath The catalyst
selectivity is determined by the molecules it will allow to diffusion through the zeolite coating
16
to the activate catalyst beneath In chapter 6 the synthesis and reaction tests of catalysts with
zeolite A MFI zeolite X coatings are discussed in details
111 References
[1] G Centi F Cavani F Trifiro Selective Oxidation by Heterogeneous Catalysis Kluwer
AcademicPlenum Publishers (2001) 26
[2] ME Dry Journal of Chemistry Technology and Biotechnology 77 (2002) 43
[3] Principles and practice of heterogeneous catalysis JM Thomas WJ Thomas VCH
Publishers (2005)
[4] Industrial catalysis J Hagen Wiley-VCH (2006)
[5] Catalysis concepts and green applications G Rothenberg Wiley-VCH (2008)
[6] C Batiot BK Hodnett Applied Catalysis A General 127 (1996) 179
[7] JA Labinger Journal of Molecular Catalysis A Chemical 220 (2004) 27
[8] DF McMillen KE Lewis GP Smith DM Golden Journal of Physical Chemistry 86
(1982) 709
[9] All about the fatty alcohols Condea (2000)
[10] UR Kreutzer Journal of the American Oil Chemistsrsquo Society 61 (1984) 343
[11] The Fischer-Tropsch archive httpwwwfischer-tropschorg
[12] M Baik M Newcomb RA Friesner SJ Lippard Chemical Reviews 103 (2003) 2385
[13] BR Cook TJ Reinert KS Suslick Journal of the American Chemical Society 108
(1986) 7281
[14] HB Friedrich N Govender MR Mathebula Applied Catalysis A General 297 (2006)
81
[15] JM Thomas R Raja G Sankar RG Bell Nature (1999) 227
17
[16] R Raja JM Thomas Chemical Communications (1998) 1841
[17] R Raja G Sankar JM Thomas Journal of the American Chemistry Society 121 (1999)
119
[18] JM Thomas R Raja G Sankar R G Bell Studies in Surface Science and Catalysis
130 (2000) 887
[19] R Raja G Sankar JM Thomas Angewandte Chemistry 39 (2000) 231
[20] JM Thomas R Raja G Sankar RG Bell Accounts of Chemical Research 34 (2001)
191
[21]R Raja JM Thomas Journal of Molecular Catalysis A 3 (2002) 181
[22] B Modeacuten B Zhan J Dakka J G Santiesteban E Iglesia Journal of Physical Chemistry
111 (2007) 1402
[23] B Zhan B Modeacuten J Dakka JG Santiesteban E Iglesia Journal of Catalysis 245
(2007) 316
[24] N van der Puil FM Dautzenberg H van Bekkum JC Jansen Microporous and
Mesoporous Materials 27 (1999) 95
[25] Web division of fuel chemistry American chemical society
httpwwwchemdexorgchemistry_linkamerican_chemical_society_acs_division_fuel_che
mistry
[26] ER Geus AE Jansen J Schoonman H van Bekkum Studies in Surface Science and
Catalysis Elsevier (1991)
[27] M Matsukata Chemistry Communication (1996)1441
[28] P Wenqin S Ueda and M Koizumi Proceedings of the 7th International Zeolite
Conference(Eds Y Murakami A Lijima and JW Ward) Elsevier (1986)177
[29] L Gora K Streletzky RW Thompson GDJ Phillies Zeolites 18 (1997)119
18
[30] T Cetin M Tatlier A Erdem-Senatalar U Demirler M Urgen Mircoporous and
Mesoporous Materials 47 (2001) 1
[31] O Andac SMT elli M Tatlier A Erdem-Senatalar Microporous and Mesoporous
Materials 88 (2006) 72
[32] Z Zhou J Yang Y Zhang L Chang W Sun J Wang Separation and Purification
Technology 55 (2007) 392
[33] Z Wang J Hedlund J Sterte Microporous and Mesoporous Materials 52 (2002) 191
[34] M Tatlier M Demir B Tokay A Erdem-Senatalar L Kiwi-Minsker Microporous and
Mesoporous Materials 101 (2007) 274
[35] JC Jansen JH Koegler H van Bekkum HPA Calis CM van den Bleek F Kapteijn
JA Moulijn ER Geus N van der Puil Microporous and Mesoporous Materials 21 (1998)
273
[36] H Kalipcilar A Culfaz Microporous and Mesoporous Materials 52 (2002) 39
[37] K Aoki K Kusakabe S Morooka Journal of Membrane Science 141 (1998) 197
[38] Collier Paul John Golunskin Stanislaw Edmund US Patent No0032628 2005
[39] P Collier S Golunski C Malde J Breen R Burch Journal of the American Chemitry
Society 125 (2003) 12414
[40] N Nishiyama K Ichioka D Park Y Egashira K Ueyama L Gora W Zhu F Kapteijn
JA Moulijn Industrial amp Engineering Chemistry Research 43 (2004) 1211
[41] JK Edwards BE Solsona P Landon AF Carley A Herzing CJ Kiely GJ Hutchings
Journal of Catalysis 235 (2005) 69
[42] Introduction to zeolite science and practice Herman van Bekkum New York Elsevier
Science BV (2001)
19
CHAPTER 2
Experimental
Techniques
20
EXPERIMENTAL TECHNIQUES
21 Introduction
This chapter serves to describe (i) the catalyst preparation methods (ii) the basic principles of
the characterization techniques used in this study (iii) the reactors and reaction conditions used
for catalyst testing (iv) the methods to analyse and quantify the products
22 Catalyst preparation
In this project a large number of different types of catalysts were prepared and tested including
supported metal catalysts oxide catalysts and zeolite and zeolitic membrane coated catalysts
The typical preparation methods are given in this chapter The specific preparation methods
are discussed in details in the appropriate chapters
221 Preparation of supported metal catalysts
Various supported metal catalysts were prepared by impregnation methods using different
metals and oxide or carbon supports Depending on the nature of the supports the impregnation
methods were different For powder supports an incipient wetness method was used while for
the oxide sphere supports a vacuum incipient wetness method was used
The most commonly used supports were silica and alumina powder or alumina spheres while
the most commonly used metal was gold Therefore Aualumina powder and Aualumina
sphere preparations are used as examples to introduce the typical preparation processes The
reagents for the preparation are given in Table 21
21
Table 21 Reagents for the preparation of Aualumina powder or Aualumina sphere
catalysts
Reagent Molar mass (gmol-1) Supplier Purity
HAuCl4bull3H2O 39383 Aldrich 9999
γ- alumina powder 10196 Aldrich gt99
α- alumina sphere 10196 Saint Gobian -
To prepare a 5 wt Aualumina powder catalyst by incipient wetness an aqueous solution of
HAuCl4bull3H2O was prepared by dissolving 5 g of HAuCl4bull3H2O in 50 ml distilled water 10ml
of the solution was then simultaneously added to 475 g of γ-Al2O3 powder The paste formed
was dried at 110C overnight and then calcined in static air at 400C for 3 h [1]
To prepare a 5 wt Aualumina sphere catalyst by vacuum incipient wetness an aqueous
solution of HAuCl4bull3H2O was prepared by dissolving 5 g of HAuCl4bull3H2O in 50 ml distilled
water 1 g of alumina spheres were placed into a sealed two neck round bottom flask (Figure
21) The flask was heated to 80degC using an oil bath and evacuated using a vacuum pump for
1 h 1 ml of the HAuCl4bull3H2O solution was added into the flask through a syringe The flask
was shaken until all the solution was absorbed into the spheres The spheres were then dried
at 110degC overnight calcined at 400degC for 3 h
Other supported metal catalysts were synthesized by varying the starting reagents as shown in
Table 22
22
Figure 21 Vacuum incipient wetness experimental set-up
Table 22 Summary of the supported metal catalysts prepared
Catalyst Metal Reagent Support
5 wt PdSiO2 PdCl2 Silica gel
5 wt PdTiO2 PdCl2 Titania
5 wt PtSiO2 PtCl4 Silica gel
5 wt PtTiO2 PtCl4 Titania
25-25 wt Pd-AuSiO2 PdCl2 HAuCl4bull3H2O Silica gel
3 wt RhAl2O3 RhCl3bullxH2O γ-Al2O3
3 wt RuAl2O3 RuCl3bullxH2O γ-Al2O3
5 wt AuSiO2 HAuCl4bull3H2O Silica gel
5 wt AuTiO2 HAuCl4bull3H2O Titania
5 wt AuAl2O3 HAuCl4bull3H2O γ-Al2O3
5 wt AuC60 HAuCl4bull3H2O C60
5 wt Augraphite HAuCl4bull3H2O Graphite
5 wt RhAl2O3 RhCl3bullxH2O α-Al2O3 sphere
5 wt AuAl2O3 RuCl3bullxH2O α-Al2O3 sphere
3 wt Au Al2O3 HAuCl4bull3H2O γ-Al2O3 sphere
23
222 Preparation of zeolite and zeolitic coated catalysts
Different zeolite and zeolitic materials were prepared and tested as catalysts including zeolite
4A silicalite-1 ZSM-5 and zeolite X In addition to using these materials as catalysts they
were also used as coatings for supported metal catalysts
The zeolite coated catalysts were synthesized following the method reported by Collier et al
[2 3] For example to prepare a zeolite 4A coated Aualumina catalyst the following procedure
was used 5 g of AuAl2O3 spheres were added to a 5 wt solution of the polyelectrolyte (2-
propen-1-ammonium NN-dimethyl-N-2-propenyl chloride known as magnafloc lt35)
containing dilute ammonia and stirred at room temperature for 20 min An aqueous sodium
aluminate solution (607 g sodium aluminate (Alfa Aesar) dissolved in 52 g distilled water)
was rapidly added into an aqueous sodium metasilicate solution (1551 g sodium metasilicate
(Alfa Aesar anhydrous) dissolved in 52 g distilled water) to make the zeolite precursor
solution The spheres were subsequently separated and washed with distilled water and then
added to the zeolite precursor solution The mixture containing the spheres was stirred at room
temperature for 2 h and then hydrothermally crystallized at 100degC for 24 h in a 60 ml Teflon
lined stainless steel autoclave The Teflon liner was cleaned before and after each synthesis in
NaOH solution for 24 h under the synthesis conditions Finally the zeolite coated spheres were
separated from the crystallization solution and washed with distilled water dried at 110degC and
then calcined in air at 500degC for 2 h
The silicalite-1 coated catalysts were synthesized with a silicalite-1 precursor solution which
consisted of TEOS (98 Aldrich) tetrapropylammonium hydroxide (TPAOH) (1 M solution
in water Aldrich) ethanol (EtOH Fluka) and distilled water with the molar ratios of 05
24
TPAOH 120 H2O8EtOH 2 SiO2 Approximately 10 g of catalyst sphere was immersed in 15
g of the precursor solution The crystallization was carried out under hydrothermal conditions
at 180degC for 24 h in a 60 ml stainless steel autoclave with Teflon liner The Teflon liner was
cleaned before and after each synthesis in NaOH solution for 24 h under the synthesis
conditions The coating procedure was repeated twice The products were rinsed repeatedly by
distilled water separated by filtration and dried at 90degC overnight then calcined in air at 600degC
for 5 h with a heating rate of 1degCmin [4]
The ZSM-5 coating synthesis method was adapted from the work of Deijger et al [5] in which
they investigated ZSM-5 zeolite coatings on ceramic foam supports with surface areas below
1 m2g The catalysts to be coated were cleaned by boiling in toluene for 1 h and dried overnight
at 110degC before being immersed in the zeolite precursor solution The zeolite precursor solution
was prepared by adding tetrapropylammonium hydroxide (TPAOH Aldrich 1 M solution in
water) sodium aluminate (NaAlO2 Aldrich Al 50-56) to tetraethyl orthosilicate (TEOS
Aldrich 98) in a PTFE beaker The molar ratio of the precursor solution was 1 Al2O3 40
SiO2 10 TPAOH 800 H2O The precursor solution was stirred for 10 h at room temperature
as an aging process before transferring the reaction mixture to an autoclave In all experiments
1 g of catalyst was added to the autoclave The volume of precursor solution was varied (32 ml
or 15 ml) to observe the influence of the amount of precursor Syntheses were carried out under
autogenous conditions at 160degC for 24 h in Teflon-lined 60 ml autoclaves Teflon liners were
cleaned before and after each synthesis in NaOH solution for 24 h under synthesis conditions
The coated samples and the extra synthesized powder for the same batch were washed with
deionised water and dried overnight at 110degC Finally the samples were calcined at 550degC for
12 h using a heating rate of 5degCmin
25
223 Preparation of cyclodextrin modified catalysts
Cyclodextrin (CD) modified catalysts were prepared by an impregnation method Using CD
modified AuSiO2 as an example the detailed steps of the preparation are as follows The BET
surface area of the AuSiO2 was determined Assuming CD molecules cover the catalyst
surface as a monolayer without gaps the required mass of CDs to completely cover the surface
of catalysts was calculated (eg to cover 1 g of AuSiO2 037 g of α-CDs or 035 g of β-CDs
is needed) Five times the calculated amount of CD was then dissolved in 25 ml of deionised
water which was heated to 45C with stirring 5 ml of the CD solution was added to 1 g of
AuSiO2 and the mixture heated to 45C and stirred for 30 min and then put into an oven to dry
overnight at 110oC
Figure 22 Ideal Au SiO2 surface covered by cyclodextrin molecules
23 Catalyst characterization technique
231 X-ray powder diffraction
X-ray diffraction (XRD) is a versatile non-destructive technique that reveals detailed
information about the crystallographic structure of natural and manufactured materials [6]
26
To produce a powder XRD pattern the sample must be crystalline Bombarding a suitable
target with electrons produces the X-rays When the electrons hit the target they excite
electrons which return to their normal state shell with a consequent emission of X-rays
Diffraction occurs only when Braggrsquos Law is satisfied The wavelengths of the X-rays
produced by the powdered sample and diffracted by the analysed crystal obey the Bragg
equation which links the d-spacings on the powdered sample to the angle of incident of the X-
rays on the sample (Figure 23) [7]
nλ = 2dsinθ
θ = angle between the crystal plane and the diffracted beam
λ = wavelength of incident X-rays beam
d = spacing between atomic layers in the powdered sample
n = integer
Figure 23 Braggrsquos Law of diffraction [7]
27
The data obtained shows a series of lines of varying intensities at different 2θ values obtained
as the analyser crystal turns A qualitative analysis of the sample is thus carried out The
schematic of an X-ray diffractometer is shown in Figure 24
Figure 24 Schematic of an X-ray diffractometer [8]
In this project the XRD analysis was performed using a PANalytical Xpert Pro diffraction
system with a monochromatic Cu Kα1 source operated at 40 keV and 30 mA Catalysts
analysed by XRD must be powders therefore the catalysts prepared using preformed supports
were ground into a very fine powder
232 Scanning electron microscopy
The Scanning electron microscope (SEM) is a microscope that uses electrons rather than light
to form an image The SEM has a large depth of field which allows a large amount of the
sample to be in focus at one time The SEM also produces images of high resolution which
means that closely spaced features can be examined at a high magnification Preparation of the
samples is relatively easy since most SEMs only require the sample to be conductive The
28
combination of higher magnification larger depth of focus greater resolution and ease of
sample observation makes the SEM one of the most heavily used instruments in research areas
today [9]When using the SEM a beam of electrons is generated in the electron gun which is
located at the top of the SEM column This beam is attracted through the anode condensed by
a condenser lens and focused as a very fine point on the sample by the objective lens The
electron beam hits the sample producing among others secondary and backscattered electrons
from the sample The electrons are collected by a secondary electron or a backscattered electron
detector converted to a voltage and amplified The scan coils are energized (by varying the
voltage produced by the scan generator) and create a magnetic field which deflects the beam
back and forth in a controlled pattern The varying voltage is also applied to the coils around
the neck of the cathode-ray tube (CRT) which produces a pattern of light deflected back and
forth on the surface of the CRT The pattern of deflection of the electron beam is the same as
the pattern of deflection of the spot of light on the CRT SEM must be run in vacuum This is
because if the sample is in a gas filled environment an electron beam cannot be generated or
maintained because of a high instability in the beam Gases could react with the electron source
causing it to burn out or cause electrons in the beam to ionize which produces random
discharges and leads to instability in the beam Figure 25 shows the schematic of an SEM
instrument
In this project the SEM images were taken by a Zeiss Evo-40 series scanning electron
microscope The method was widely used in the characterization of zeolite coated catalysts
The coated sphere samples were placed in the sample holder directly in the characterization
29
Figure 25 Schematic of a Scanning electron microscope [10]
233 Surface area method (BET)
Surface area is one of the key tools to characterize porous materials The BET method is the
most frequently used method to calculate the surface area It provides precise specific surface
area evaluation of materials by nitrogen multilayer adsorption measured as a function of
relative pressure using a fully automated analyser The technique encompasses external area
and pore area evaluations to determine the total specific surface area in m2g yielding important
information in studying the effects of surface porosity and particle size The concept of BET
30
theory is based on the extension of the Langmuir theory which is a theory for monolayer
molecular adsorption to multilayer adsorption with the following hypotheses (a) gas
molecules physically adsorb on a solid in layers infinitely (b) there is no interaction between
each adsorption layer and (c) the Langmuir theory can be used for each layer Therefore the
BET equation is expressed in Equation 21
1 ʋ [(P0P) - 1] = (c-1)(ʋmc) ( P P0) + 1 (ʋmc)
where P= equilibrium pressure
P0= saturation pressure of the gas
ʋ= adsorbed gas quantify
ʋm= monolayer adsorbed gas quantity
c=constant
Equation 21 The BET equation
In this project samples were analysed using the Quantachrome Autosorb-1 instrument Before
performing the analysis samples were degassed by placing a 01 g sample in a glass tube (d =
12 mm) and heating under helium for an hour at 120˚C The sample filled glass tube is then
placed into a Dewar flask containing liquid nitrogen and analysed by the machine
234 Atomic absorption spectroscopy
Atomic absorption spectroscopy (AAS) is a technique for determining the concentration of a
particular metal element in a sample The technique can be used to analyse the concentration
of over 70 different metals in a solution The technique makes use of absorption spectrometry
31
to assess the concentration of an analyte in a sample Therefore it relies heavily on the Beer-
Lambert law
In short the electrons of the atoms in the atomizer can be promoted to higher orbitals for a
short amount of time by absorbing a set quantity of energy (ie light of a given wavelength)
This amount of energy (or wavelength) is specific to a particular electron transition in a
particular element and in general each wavelength corresponds to only one element This
gives the technique its elemental selectivity
As the quantity of energy (the power) put into the flame is known and the quantity remaining
at the other side (at the detector) can be measured it is possible from the Beer-Lambert law
to calculate how many of these transitions took place and thus get a signal that is proportional
to the concentration of the element being measured A diagram of AAS is given in Figure 26
Figure 26 Diagram of AAS [11]
32
235 X-ray Photoelectron Spectroscopy
X-ray Photoelectron Spectroscopy (XPS) is a quantitative spectroscopic technique that
measures the elemental composition empirical formula chemical state and electronic state of
the elements that exist within a material XPS spectra are obtained by irradiating a material
with a beam of X-rays while simultaneously measuring the kinetic energy and number of
electrons that escape from the top 5 to 20 nm of the material being analysed Because the energy
of an X-ray with particular wavelength is known the electron binding energy of each emitted
electron can be determined by using an equation that is based on the work of Ernest Rutherford
(Equation 22)
Eb= Ep- (Ek + ɸ)
Where Eb = binding energy of the electron
Ek = kinetic energy of the electron measured
Ep = the energy of the X-ray photons being used
Φ = work function of the spectrometer (often ignored)
Equation 22 XPS equation
XPS analysis in this project was carried out with an ESCALAB 220 spectrometer using an
achromatic AlKα source and analyser pass energy of 100 eV
24 Reactors used in the project
Two types of reactors have been used in the project the Parr multiple stainless steel reactor
system and the Andrews glass reactor system
33
241 The Parr multiple stainless steel reactor system
The Parr series 5000 multiple reactor system (Figure 27) has been used for the liquid phase
oxidation of n-decane and n-hexane with oxygen It is a system with six stainless steel vessels
which can perform six reactions at different pressures and temperatures simultaneously The
volume of each vessel is 45 ml Stirring with this system was operated by a single magnetic
stirrer therefore all six vessels have the same stirring speed during a single run In the
experiments PTFE stirring seeds were the most frequently used while glass stirring seeds were
also applied in some reactions The autoclaves can be operated up to 3000 psi and 275degC [12]
The typical reactions performed with this system were always with 005 g of catalyst 10 g n-
decane or n-hexane a stirring speed of 600 rpm 15 bar O2 at different temperatures and
reaction times Before reactions the autoclave was flushed twice with O2 to remove all the air
Then the reactors were heated to the desired temperature (100C 110C 120C or 130C) for
different runtimes There was no sample tube with this reactor therefore in order to exactly
control the reaction time ice water was used to cool down the autoclave at the end of the
reaction
242 The Andrews glass reactor system
The Andrews glass reactor system (Figure 28) has been used mainly for the liquid phase
oxidation of n-hexane with oxygen The three glass reactors (887ml starter kit Andrews
Glass) were heated in separate oil baths by three separate hotplates Oxygen pressure was
controlled in each reactor It was observed there were small temperature variations for the
different reactors because of their separate heating controllers Reactors A and B were found
34
to have quicker heating rates than reactor C It always took reactor C several minutes more to
reach the temperature set point
Figure 27 Multi reactor system and control box
Figure 28 Andrews Glass Reactor System
35
The volume of each glass vessel is 120 ml Stirring with this system was always controlled to
the same stirring speed and PTFE stirring seeds and glass stirring seeds were both employed
The reactors can be operated up to 225 psi [13]
The typical reactions performed with this system were always with 005 g catalyst 25 ml n-
hexane a stirring speed of 600 rpm 3 bar O2 at different temperatures and reaction times
Before reaction the vessel was flushed twice with O2 to remove all the air Then the reactors
were heated to the desired temperature (110C 120C 130C 150C) for different runtimes
A PTFE sample tube was used and in most cases the samples were taken directly from this In
some specific cases ice water was used to cool down the reactor at the end of the reaction
25 Analysis and qualification of reaction products
251 Analysis by Gas Chromatography
The first step of reaction product analysis was through gas chromatography (GC)GC is a
common type of chromatography for separating and analysing compounds that can be
vaporized without decomposition which was suitable in this project After the oxidation of the
long chain alkane there was a mixture of various products These can be separated in the GC
as they have different boiling points The higher the boiling point of the compound the later
the retention time of the compound
Analysis were carried out using a Varian Star 3800 equipped with a Chrompack CP Wax 52CB
25 m 053 mm 20 μm capillary column and an FID detector In the analysis 02 microl sample
was injected into the GC Helium was the carrier gas employed in the system Injection
parameters on the GC used a split ratio of 101
36
To achieve the best separation the temperature programs in the GC were as follows
(i) For n-decane products
Start at 60degC hold for 7 min
Ramp at 35degCmin to 115degC hold for 12 min
Ramp at 4degCmin to 220degC hold for 1 min
Ramp at 50degCmin to 240degC hold for 2 min
(ii) For n-hexane oxidation products
Start at 35degC hold for 7 min
Ramp at 35degCmin to 220degC hold for 3 min
252 Quantification of the products via response factor
2521 Use of internal standard
To quantify the products an internal standard was added to the reaction products The internal
standard used was 124-trichlorobenzene in both n-decane and n-hexane oxidation reactions
The advantage of this standard is that it did not interfere with the reaction and it is eluted from
the column at a different retention time from the other compounds of interest (Figure 23 and
24) 015 ml of 124-trichlorobenzene was added to the reaction products mixture
2522 Calculations of relative response factors of each compound
The relative response factor (K) of each product was determined using the ratio of the areas
under the peak of a known amount of product and a constant amount of the internal standard
(124-trichlorobenzene)
37
The anticipated compounds in the product mixture (eg 2-5 decanone 1-5 decanol etc) were
used to prepare five mixtures containing known amounts of products as well as the internal
standard For example to calibrate n-decane oxidation products the first to fifth calibrated
solution should contain 10 g n-decane 1030507090 mg of each anticipated compound and
015 ml internal standard The five mixtures were injected into the GC and the area of the peaks
of the internal standard and the anticipated compounds measured The mass of the compounds
were known therefore the internal response factor can be calculated using Equation 23 The
final internal response factor was the average value from the five solutions
K = [(AreaIS) (MassAC)] [(MassIS areaAC)]
Where K = Relative Response Factor
AreaIS = Area of Internal Standard in GC
MassAC = Mass of specific anticipated compound
MassIS = Mass of internal standard
AreaAC = Area of specific anticipated compound
Equation 23 Calculation of internal standard
All the relative response factors of the known products of n-dexane and n-hecane oxidation
were calculated in this way The retention time and response factor of each reaction product
are given in Table 23 and 24
38
Table 23 Order retention time and internal response factor of each product for n-
decane reaction
Order on the
GC trace
Compounds Retention Time
(min)
Internal
Response Factor
1 n-decane 344 0498
2 54-decanone (54 one) 1181 062
3 3-decanone (3 one) 1254 059
4 2-decanone (2 one) 1345 0588
5 54-decanol (54 ol) 1626 0606
6 3-decanol (3 ol) 1694 0598
7 2-decanol (2 ol) 1802 062
8 internal standard 2044 NA
9 pentanoic acid (C5OOH) 2525 1
10 1-decanol (1 ol) 2565 0616
11 hexanoic acid (C6OOH) 2930 0904
12 heptanoic acid (C7OOH) 3269 0822
13 octanoic acid (C8OOH) 3566 0806
14 nonanoic acid (C9OOH) 3838 08
15 decanoic acid (C10OOH) 4085 0788
39
Table 24 Order retention time and internal response factor of each product for n-
hexane reaction
(The hexanal can not be separated as it has the same retention time as 2-hexanol )
2523 Quantification and analysis of the reaction
According to Table 23 and 24 all the response factors for the known compounds were
determined Hence the amount of each known compounds in the product mixture can be
calculated using Equation 24
Order on the
GC trace
Compounds Retention Time
(min)
Internal
Response Factor
1 n-hexane 0858 0894
2 3-hexanone (3 one) 875 0762
3 2-hexanone (2 one) 1012 069
4 hexanal 1012 NA
5 3-hexanol (3 ol) 1692 0684
6 2-hexanol (2 ol) 191 066
7 internal standard 23325 NA
8 1-hexanol (1 ol) 2806 0685
9 hexanoic acid (C6OOH) 4066 09125
40
MassAC = (MassIS AreaAC K) (AreaIS)
Where K = Relative Response Factor
AreaIS = Area of Internal Standard in GC
MassAC = Mass of specific anticipated compound
MassIS = Mass of internal standard
AreaAC = Area of specific anticipated compound
Equation 24 Calculation of amount of products
Then the yield conversion and selectivity of the reaction can be calculated following the
formula below
Yield of each product () =
___________K x (Area of Product AreaIS) x MassIS x100
(Mass of n-decane (10g) Molar mass of decane x Molar mass of product)
Conversion () = Sum Yield of each product = Total Yield
Product Selectivity () = Yield of each product Total Yield
Further experimental and characterisation details are discussed in the corresponding results
chapters
41
26 References
[1] JK Edwards BE Solsona P Landon AF Carley A Herzing CJ Kiely GJ Hutchings
Journal of Catalysis 236 (2005) 69
[2] P Collier S Golunski C Malde J Breen R Burch Journal of the American Chemistry
Society 125 (2003) 12414
[3] Collier Paul John Golunskin Stanislaw Edmund US Patent No0032628 2005
[4] DCVu MMiyamoto NNishiyama SIchikawa YEgashira KUeyama Microporous
and Mesporosous Materials 115 (2008) 106
[5] GBF Seijger OL Oudshoorn WEJ van Kooten JC Jansen H van Bekkum CM
van den Bleek HPA Calis Micropurous and Mesoporous Materials 39 (2000) 195
[6] PANalytical httpwwwpanalyticalcomindexcfmpid=135
[7] httpwwwesercstonybrookeduProjectJavaBragg
[8] Providing Solutions To Your Diffraction Needs Cupertino Scitag inc (1999)
[9] httpmseiastateedumicroscopyhomehtml
[10]httpwwwifw-dresdendeinstitutesikmorganisationdep-31equipmentaes-
microprobe-phi660
[11] httpwwwuniversetodaycom81974atomic-absorption-spectroscopy
[12] httpwwwparrinstcom
[13] Andrews glass website httpwwwandrewsglasscomPRV_supporttpl
42
CHAPTER 3
Andrews Glass
Reactor
43
ANDREWS GLASS REACTOR
31 Introduction
In liquid phase long chain alkane selective oxidation studies the key results were reported by
Thomas for n-hexane oxidation [1-7] In his study Thomas used ALPO catalysts with air as
the oxidant The terminal selectivity can be extremely high (up to 87 conversion 655
selectivity with Co-ALPO-18) Iglesia [8] tried to reproduce Thomasrsquos results under similar
experimental conditions using Mn-ALPO catalysts However the conversion was quite low
(002-005) while the terminal selectivity was 7 only Iglesia concluded that Mn-ALPO
did not lead to any preference for terminal selectivity in contradiction with Thomasrsquo results
Iglesia published his own results using Mn-ZSM5 as the catalyst (Table 31) [9] Unlike
Thomasrsquos study Iglesia noticed the autoxidation reaction and demonstrated a clear difference
in the terminal selectivity in the presence of catalysts It was clear that when the catalyst was
present the terminal selectivity was initially high (24) but the selectivity declined when
conversion increased In contrast the terminal selectivity in the autoxidation was always 7-8
In this project it was attempted to obtain the high level of terminal selectivity as Iglesia did
Most of the reactions performed in this project were carried out in the Parr stainless steel reactor
with or without a PTFE liner However it was noticed that Iglesia et al employed the Andrews
glass reactor in their research Hence the focus of this chapter was the comparison between the
stainless steel reactor and the Andrews glass reactor Studies using the Andrews glass reactor
were also performed
44
Table 31 Iglesiarsquos results for oxidation of n-hexane with Mn-ZSM-5 catalysts
Time
(hours)
Conversion
()
Terminal selectivity ()
with Mn-ZSM-5
Terminal selectivity ()
Autoxidation
05 0007 24 7
25 0013 185 8
4 0047 15 8
7 01 10 7
32 Experimental
321 Apparatus and reaction
The Andrews glass reactors system was set up as shown below in Figure 31 The three glass
reactors (887 ml starter kit Andrews Glass) were heated in separate oil baths by three separate
hotplates Oxygen pressure was controlled in each reactor Temperature variations were
observed for the different reactors because of their separate heating controllers Reactors A and
B were found to have quicker heating rates than reactor C It always took reactor C several
minutes more to reach the temperature set point Hexane oxidation reactions were performed
under conditions equivalent to Iglesiarsquos work [8] 25 ml hexane 3 bar oxygen 130degC for short
time reactions
45
Figure 31 Andrews Glass Reactor System
322 Safety operating procedure
To avoid dangers of operation the safety operating procedure for the reactor is given as follows
To switch instruments on
Put beakers with silicon oil on top of the hotplates Hold the wire-mesh covered glass reactors
with clamps and immerse two-thirds of the glass reactor into the silicon oil baths Switch on
the power to the hotplates Temperature and stirrer speed are controlled by and displayed on
the hotplates Pressure is displayed on a gauge on the head of the reactor and can be controlled
by inlet and outlet valves also on the reactor head The glass reactors should be handled gently
Preparing a sample in the Andrews glass reactor
Place reactants in the glass cylinder Reactants should occupy no more than two-thirds of the
available space of the cylinder The cylinder is then aligned with the head and joined The
46
rubber ring in the head of the reactor should be well fitted into the top of the glass cylinder
Hold the head and the glass cylinder securely together and then tighten the head to the glass
cylinder carefully
Controlling the stirrer speed and temperature of the reactor
The stirrer speed and temperature can be set on the hotplate The temperature detector must be
immersed into the oil bath the depth of the detector head should be kept in the same level in
the glass cylinder
Allowing gas flow into the reactor
The Andrews glass reactor set-up has inlet and outlet valves (on the head part) The inlet valve
is connected to oxygen and is opened briefly to fill the reactor to the desired pressure The
outlet valve is kept closed during a reaction but remains open at all other times Both the inlet
and outlet valves turn clockwise to close Pressure in the cylinder is maintained when the outlet
and inlet valves are closed The pressure in the gas line is limited by a regular therefore
normally the pressure in the glass line is not higher than 5 bar However to avoid any accidents
when releasing the gas into or out of the cylinder open the inlet or outlet valves is slowly
Controlling the gas flow
Open the oxygen valve on the wall The pressure inside the glass reactor is controlled by turning
the glass inlet and outlet valves in the reactor head To increase the pressure turn the inlet valve
anti-clockwise To decrease the pressure turn the outlet valve anti-clockwise The gauge in the
reactor head will show the pressure inside the reactor
47
Purging the glass reactor
Before staring any reaction it is necessary to evacuate the air present in the reactor and fill the
reactor to the desired pressure with oxygen Open the oxygen valve on wall behind the reactors
This will allow the gas to enter the glass reactor when the inlet on the reactor head is opened
Fill the reactor to the desired pressure by repeatedly briefly opening and closing in the inlet
line Then close the inlet valve and open the outlet valve on the head slowly to release the
pressure This is repeated three times after which the reactor is pressurised and the inlet and
outlet valves are closed Close the gauge on the wall behind the reactors Monitor the pressure
in the reactor for approximately 5 minutes to ensure there are no leaks
Starting a reaction
After placing the sealed glass reactors and oil baths on the hotplate put the temperature detector
to the right position (as mentioned above) Purge the reactor and pressurise to the desired
working pressure Switch on the stirrer and set the desired temperature in the digital display
connected to the hotplates
Ending a reaction
If the reaction is to be stopped for a required time switch off the hotplate then put the reactor
into ice bath for quick cooling Once cool the gas is evacuated from the reactor by slowly
opening the outlet valve on the reactor head The cylinder can then be disconnected and the
reaction mixture emptied Always allow the reactor to cool before opening it
Cleaning the autoclave
After each reaction the reactor should be thoroughly washed and cleaned to remove all traces
of the reactants As well as cleaning the glass cylinders it is also necessary to clean the stirrer
bar
48
Instrument shutdown
Specified users will normally carry out instrument shutdown
Ensure that the hotplate especially the heating is switched off when the reaction is finish The
oxygen line to the equipment must also be closed when not used for filling the reactors and the
instrument lines vented
Emergency shutdown procedure
1 Switch off electricity at the sockets
2 O2 gas supply should be shut off at the cylinder
3 If it is safe to do so (ie no visible sign of leakage from the apparatus) remove the glass
reactor(s) from the hotplate(s) (if applicable)
4 Do not allow anyone to touch the equipment or any contents of the reactor unless the person
is a trained and competent user
323 Characterization techniques
Reaction samples were analysed by gas chromatography with a CP Wax 52CB column 25 m
053 mm 20 microns using a programmed temperature ramp Each sample was injected at
least twice
33 Results
331 Andrews glass reactor in blank hexane oxidation
Hexane oxidation was carried out under the same conditions 3 bar oxygen 130degC with various
amounts of hexane 10g (the amount consistent with using the Parr stainless steel reactor) and
25ml (Iglesiarsquos reported system) for 30 min and 1 hour
49
3311 Comparison between Andrews glass reactor and stainless steel reactor
Reactions were carried out over 30 min and 1h with 10 g hexane and repeated several times at
a stir speed 3 in the hotplate The oxidation results were given in Table 32 and Table 33
Table 32 Glass reactor 130degC 3 bar O2 10 g n-hexane stir speed 3 30 min
Reactor Conv () Selectivity ()
3 one 2 one 3 ol 2 ol 1 ol oic
A 00017 29 35 9 11 15 0
B 00010 33 36 9 13 7 0
Table 33 Glass reactor 130degC 3 bar O2 10 g n-hexane stir speed 3 1 h
Reactor Conv () Selectivity ()
3 one 2 one 3 ol 2 ol 1 ol oic
A 00060 34 34 7 12 11 0
B 00050 35 36 8 11 7 0
For the longer reaction time the 1-hexanol selectivity may have decreased slightly Compared
with the stainless steel reactor results reported previously (Table 34) the conversion in the
glass reactor is lower
Table 34 Steel reactor 130degC 5 bar O2 10g n-hexane blank 600 rpm 30 min
Reactor Conv () Selectivity ()
3 one 2 one 3 ol 2 ol 1 ol oic
Stainless steel
30min 00051 20 34 13 15 18
0
50
A Further time on-line study was performed to compare the two reactors The results were
shown in Table 35 and Table 36 From the results the blank reactions gave higher conversion
but lower terminal selectivity in the stainless steel reactor than the glass reactor which indicates
the stainless steel reactor itself may have some activity in the oxidation reaction
Table 35 Hexane auto-oxidation with glass reactor (reaction conditions 130degC 3 bar
O2 25 ml n-hexane 600 rpm time-on-line)
Time
(h)
Reactor Conv() Selectivity ()
Ketones Alcohols Acid Others 1-hexanol
05 A 00001 15 0 0 85 0
1 A 00002 16 13 1 70 5
2 A 00008 14 10 0 76 5
3 A 00118 13 11 0 76 6
4 A 00223 14 11 0 75 6
Table 36 Hexane auto-oxidation with stainless steel reactor (reaction conditions 130degC
3 bar O2 25 ml n-hexane 600 rpm time-on-line)
Time
(h)
Conv
()
Selectivity ()
Ketones Alcohols Hexanoic acid Others 1-Hexanol
0 0
1 0001 72 15 0 12 0
2 0002 65 24 0 8 2
3 0008 56 24 0 20 3
4 0022 63 18 0 19 1
51
3312 Repeat Iglesiarsquos blank reaction
A few reactions were performed under conditions equivalent to Iglesiarsquos work at 130ordmC 3 bar
O2 stir speed 2 for 30 min and 1 hour however no products were detected The GC sensitivity
may also be a reason for products not being detected It should be noted that the stir speed taken
in these reactions was lower than before the change is made because it was found when
catalysts were added to the reactor at a high stir speed the stirrer bar became trapped
3313 The unknown products in analysis
In a further analysis of GC traces it was found that there were large quantities of unknown
products in the hexane oxidation (as shown in Figure 32) which were not included in the
calculated results In order to have a clear product distribution the results were calculated
including these unknown products discussed in the following section in this chapter
Figure 32 The GC trace with the unknown products (marked with )
52
GC-MS analysis was then introduced to identify the known and unknown products With a
polar column in GC-MS all the known products in hexane oxidation have been successfully
identified and a few the unknown products have been successfully analysed Table 37 showed
the possible main unknown products They are all named as lsquoothersrsquo in the following result
tables
Table 37 List of suggested unknown products
Possible main unknown Products Retention time in GC-MS
2-pentanol 2-methyl- C6H14O 368
3-pentanol 3-methyl- C6H14O 384
4-methyl-2-pentacetate C8H16O 451
Propanoic acid 703
Nonanoic acid 1843
C6H12O4 2005
3314 Application of aqua regia as washing agent
In the previous reactions aqua regia was not always used as a washing agent To check if this
can influence the reaction results reactions were carried out immediately after washing the
reactors carefully with aqua regia (Table 38) Compared with the Table 39 (without washing
with aqua regia) the selectivity did not show much difference from the previous reactions
which were not washed with aqua regia
53
Table 38 130degC 3 bar O2 25 ml n-hexane stir speed 2 single reaction (2 and 4 h)
Time
(h)
Reactor Conv() Selectivity ()
Ketones Alcohols Acid Others 1-hexanol
05 A 0010 37 25 3 35 8
1 A 0019 27 29 2 42 9
2 B 0022 13 61 2 26 9
3 A 0060 29 16 1 54 10
4 B 0064 22 15 1 60 9
Table 39 130degC 3 bar O2 25 ml n-hexane modified time-on-line set-up stir speed 2 05
ndash 5 h 015 ml 124-trichlorobenzene
Time
(h)
Reactor Conv() Selectivity ()
Ketones Alcohols Acid Others 1-hexanol
05 A 0013 39 23 3 35 8
1 A 0023 28 28 1 43 9
2 A 0037 31 20 1 48 10
3 A 0061 27 18 1 54 10
4 A 0089 21 16 1 62 9
3315 Time-on-line reactions
Hexane oxidation reactions were performed with the Andrews glass reactor system heating
from room temperature to 130degC takes 5 min to 4 h The reaction conditions were equivalent
to Iglesiarsquos work 25 ml hexane 3 bar oxygen and 130degC
54
Reactions with time-on-line modification
In order to investigate the time-on-line oxidation status during a reaction a modification was
made to one of the glass reactors The modification consists of PTFE tubing being inserted into
the reaction solution through the reactor top The flow in the tubing can be controlled by two
PTFE valves outside the reactor Therefore samples can be taken while a reaction is running
The internal standard (124-trichlorobenzene Sigma-Aldrich ge99 015 ml) was added to
the solution before reaction In this section the reactions were all carried out in modified
reactors with a time-on-line sampling port Hexane oxidation reactions were still performed
under conditions equivalent to Iglesiarsquos work 25 ml hexane 3 bar oxygen and 130degC with
varied time period Reactions were repeated two times The terminal selectivity (hexanoic acid
+ 1-hexanol) is around 5-9 (Table 310 and Table 311)
Table 310 130degC 3 bar O2 25 ml n-hexane modified time-on-line set-up stir speed 2
05 ndash 5 h 015 ml 124-trichlorobenzene
Time
(h)
Reactor Conv() Selectivity ()
Ketones Alcohols Acid Others 1-hexanol
05 A 0003 44 21 2 33 7
1 A 0018 16 13 1 70 5
2 A 0057 14 10 0 76 5
3 A 0094 13 11 0 76 6
4 A 0163 14 11 0 75 6
5 A 0247 11 11 0 78 6
55
Table 311 130degC 3 bar O2 25 ml n-hexane stir speed 2 various times 015 ml 124-
trichlorobenzene repeated
Time (h) Reactor Conv() Selectivity ()
Ketones Alcohols Acid Others 1-hexanol
05 A 0005 30 14 0 56 5
1 A 0019 15 9 1 75 5
2 A 0059 13 9 0 78 5
3 A 0101 12 10 0 78 6
4 A 0160 14 11 0 75 6
5 A 0259 10 10 0 80 6
3316 Discussion
Figure 34 showed the conversion vs selectivity in all the blank reactions in this project They
showed similar terminal selectivities to Iglesiarsquos work (Figure 35) [8-9]
Blank reactions Conv vs termianl selectivity
0
1
2
3
4
5
6
7
8
9
10
0 005 01 015 02 025 03
Conversion ()
Term
inal
Sele
cti
vit
iy (
)
56
Figure 34 Conversion vs terminal selectivity in all the blank reactions
Figure 35 Iglesiarsquos results [8-9]
332 Reaction with Mn-ZSM5 (from JM)
The Mn-ZSM5 catalyst as described in Iglesiarsquos work was provided by Johnson Matthey to
investigate the activity and selectivity under the equivalent conditions However it was found
that both the conversion and terminal selectivity was extremely low (Table 312)
The Mn-ZSM5 catalyst was activated before each reaction and then used in the reaction after
cooling down to the room temperature Therefore it is possible that the sample absorbed
moisture which could block the pore structure Hence a time-on-line test reaction was
performed to check this In the reaction shown below the Mn-ZSM5 was put into the hexane
as soon as possible after being removed from the furnace From the results (Table 313) the
hot catalyst is still not very active and shows little difference in product distribution from the
cool catalyst The results are still different from Iglesiarsquos
57
Table 312 130degC 3 bar O2 25 ml n-hexane stir speed 2 varied time 100 g Mn-ZSM5
015 ml 124-trichlorobenzene
Time (h) Reactor Conv() Selectivity ()
Ketones Alcohols Acid Others 1-hexanol
05 A 0007 15 1 0 84 0
1 A 0010 10 0 0 90 0
2 A 0015 12 1 0 87 0
3 A 0018 16 2 0 82 0
4 A 0021 18 2 0 80 0
5 A 00294 17 2 0 81 0
Table 313 130degC 3 bar O2 25 ml n-hexane stir speed 2 time-on-line 1 g Mn-ZSM5
Time (h) Reactor Conv() Selectivity ()
Ketones Alcohols Acid Others 1-hexanol
30min A 0
1h A 0
4h A 002 29 12 0 59 2
34 Conclusion
Comparison between the Andrews glass reactor and Parr stainless steel reactor showed that the
blank reactions got higher conversion but lower terminal selectivity in the stainless steel reactor
than the glass reactor which indicates the stainless steel reactor itself may have some activity
in the oxidation reaction
58
The time on-line blank reaction results showed similar terminal selectivities to Iglesiarsquos work
in autoxidation [8-9] with the terminal selectivity 5-9 However the terminal selectivity
with Mn-ZSM5 was still very low (~0) Iglesiarsquos results cannot be reproduced
Except the linear alcohol and acids calibrated and listed in the experimental section in Chapter
2 further analysis found a few unknown products after the oxidation reaction GC-MS analysis
was performed and some of the unknown products were identified as the acids and other C6
alcohols
35 References
[1] JM Thomas R Raja G Sankar RG Bell Nature (1999) 227
[2] R Raja JM Thomas Chemical Communications (1998) 1841
[3] R Raja G Sankar JM Thomas Journal of the American Chemistry Society 121
(1999) 119
[4] JM Thomas R Raja G Sankar R G Bell Studies in Surface Science and Catalysis
130 (2000) 887
[5] R Raja G Sankar JM Thomas Angewandte Chemistry 39 (2000) 231
[6] JM Thomas R Raja G Sankar RG Bell Accounts of Chemical Research 34 (2001)
191
[7]R Raja JM Thomas Journal of Molecular Catalysis A 3 (2002) 181
59
[8] B Modeacuten B Zhan J Dakka J G Santiesteban E Iglesia Journal of Physical
Chemistry 111 (2007) 1402
[9] B Zhan B Modeacuten J Dakka JG Santiesteban E Iglesia Journal of Catalysis 245
(2007) 316
60
CHAPTER 4
Catalytic
Investigation for
Teabag Coating
61
CATALYTIC INVESTIGATION
FOR TEABAG COATING
41 Introduction
The aim of the project is to realise the terminal oxidation of long chain n-alkanes for example
using n-decane and n-hexane as model compounds to produce 1-decanol decanoic acid or 1-
hexanol and hexanoic acid (Figure 41) in liquid phase reactions There are two challenges in
this study how to enhance the activity of the reaction and how to control the regioselectivity
of the oxidation To overcome the challenges various catalysts were introduced into the project
Figure 42 Aim of the thesis ndash terminal oxidation of decane
As introduced in Chapter 1 teabag technology involves two components the active supported
catalyst substrate and the shape selective coating In this chapter the focus is to find the
relatively active and selective substrate catalysts
62
42 Experimental
421 Metalsupport catalysts
A series of metalsupport catalysts were prepared in the project by the impregnation method
In the case Pd Au and Pt were employed The synthesis method is shown as below [1]
Preparation method for the 5 wt PdTiO2
i Dissolve 05 g PdCl2 in 10 ml deionized water Stir and heat at 85degC for 30 min
ii Place 19 g TiO2 in a Petri dish Dropwise add the PdCl2 solution to the Petri dish Shake
the dish until the powder and solution mix well
iii Dry the paste at 110degC for 16 h Grind the paste and then calcine at 400degC for 3 h
Preparation method for the 5 wt AuTiO2
i Prepare the HAuCl4 solution which includes 01 g Au3+
ii Place 19 g TiO2 in a beaker Dropwise add the HAuCl4 solution to the beaker Stir 30
min until the powder and solution mix well
iii Dry the paste at 110degC for 16 h Grind the paste and then calcine at 400degC for 3 h
Preparation method for the 5 wt PtTiO2
i Use 02655g H2PtCl6middot6H2O and 10g deionized water to prepare the solution which
includes 01g Pt4+
ii Place 19g TiO2 in a beaker Dropwise add the H2PtCl6 solution to the beaker Stir until
the powder and solution mix well
iii Dry the paste at 110degC overnight Grind the paste and then calcine at 500degC for 6h
Parts of the prepared catalysts were reduced in H2 To prepare the reduced catalysts the
63
catalysts were calcined in flowing H2 at 300degC for 3 h
Other supports were also employed such as activated carbon (Aldrich G60 Waterlink
Sutcliffe Carbons Activated Carbon Grade 207A Mesh 12 20) graphite SiO2
(Grace gt99 60-100 mesh) and alumina
The reaction conditions taken for the powder form catalysts usually are 200 psi O2 600 rpm
100degC110degC 10 g n-decane and 005 g catalyst
422 RhRu loaded catalysts
Synthesis of catalyst
1 wt and 3 wt Rhα-Al2O3 Rhγ-Al2O3 Ruγ-Al2O3 were prepared by the incipient
wetness method and deposition precipitation (DP) method separately The incipient wetness
method was carried out as before Taking the 1 wt Rhγ-Al2O3 as an example to prepare 1g
1 wt Rhγ-Al2O3 099 g γ-Al2O3 was dispersed in a solution of 0025 g RhCl3middotxH2O ( Alfa
Aesar) The water amount in the solution was the least amount to form a paste The paste was
dried overnight at 110degC and then calcined at 400degC for 3 h The DP preparation is carried out
as followed (taking the 3 wtRhγ-Al2O3 as an example) to prepare 1 g 3 wt Rhγ-Al2O3
099 g γ-Al2O3 was first dispersed in an aqueous solution of 0075 g RhCl3middotxH2O A quantity
of 1 M Na2CO3 was slowly added to the RuCl3 solution until the pH value of the mixture
reached 105 The suspension was then maintained at the same pH for 1 h during the
precipitation process The resulting solid was washed with deionized water several times until
no chloride ion was detected by addition of silver nitrate solution to the filtrate All the catalysts
were dried at 110degC (12 h) in air Finally they were calcined at 500degC for 5 h in air [2]
Alumina (Saint-Gobain surface area 025 m2g) spheres have been tested in this project to date
The vacuum incipient wetness method was employed in the preparation of sphere catalysts To
64
prepare 1 g catalyst 1 g alumina sphere was placed into a sealed two necked round bottom
flask The flask was heated to 80degC with an oil bath and evacuated by a vacuum pump for 1 h
The calculated amount of metal solution was added into the flask through a syringe The flask
was shaken until all the metal solution was absorbed into the spheres Then the spheres were
dried at 110degC overnight and then calcined at 400degC for 3 h
Reactions
The reaction conditions taken for the powder form catalysts usually are 15 bar O2 600 rpm
110degC 10 g n-decane and 005 g catalyst With the sphere supports different from the previous
work the reaction system has to be adjusted as single sphere is much heavier (eg the mass of
a single silica sphere 009 g) than the catalysts used in the previous reactions (005 g in each
reaction)
43 Results
431 Pd Au Pt loaded supported catalysts
The metal loaded catalysts and reduced catalysts were used in reactions under the conditions
100degC 200 psi O2 24 h 005 g catalyst and 600 rpm
65
Table 41 100degC 200 psi O2 24 h 10 g n-decane 005 g catalyst and 600 rpm
Catalyst Conv
()
Selectivity ()
54
one
3
one
2
one
54
ol
3
ol
2
ol
C5
OOH
Di-
one
C6
OOH
Di-
one
Di-
one
C7
OOH
C8
OOH
C10
OOH
PdTiO2 009 0 0 3 17 20 19 0 0 0 0 0 6 2 1
Reduced
PdTiO2 0 0 0 0 0 0 0 0 0 0 0 0 0 0 0
AuTiO2 017 0 0 0 16 2 26 0 13 0 2 2 5 3 4
AuTiO2 025 0 0 15 18 0 22 0 9 0 3 2 10 2 9
Reduced
AuTiO2 0005 0 0 0 0 0 100 0 0 0 0 0 0 0 0
PtTiO2 0 - - - - - - - - - - - - - -
PtTiO2 0 - - - - - - - - - - - - - -
Reduced
PtTiO2 0 - - - - - - - - - - - - - -
These results (Table 41) show very low conversion and are in fact lower than those for a blank
reaction (01-03) demonstrating an inhibition of some part of the reaction by the PdTiO2
With Au TiO2 it was found in the product distribution that a number of C10 ketones formed in
the reaction PdTiO2 inhibits the auto-oxidation reaction
Initial results indicated poor activities with PdTiO2 AuTiO2 and PtTiO2 for decane oxidation
in both liquid reactions at 100degC
66
432 Higher temperature reactions
With the intention of obtaining higher conversion it was decided to increase the reaction
temperature to 110degC More catalysts were prepared and tested at 100degC and 110degC The
conversion and product distribution results were shown in Table 42 and Table 43 It was still
found that none of the catalysts showed good activity at 100degC However the Au catalysts
appear to be better than others on TiO2 and SiO2 supports
Table 42 100 degC n-decane 10 g catalyst 005 g 200 psi O2 24 h
Catalyst Conv
()
Selectivity ()
54
one
3
one
2
one
54
ol
3
ol
2
ol
C5
OOH
Di-
one
C6
OOH
C7
OOH
C8
OOH
C10
OOH
Blank 030 22 13 18 7 6 10 4 11 0 6 2 1
TiO2
TiO2 010 34 22 8 10 3 8 9 7 0 0 0 0
AuTiO2 025 15 18 0 22 0 9 5 10 2 9 0 0
PtTiO2 0 - - - - - - - - - - - -
Pd-
AuTiO2 004 37 6 6 5 3 2 7 34 0 0 0 0
Carbon
Carbon 002 13 0 0 65 0 0 0 22 0 0 0 0
AuCarbon 0 - - - - - - - - - - - -
SiO2
AuSiO2 017 34 28 2 3 11 0 11 7 0 1 3 0
Au-
PdSiO2 029 17 13 9 9 11 26 5 8 0 2 1 0
67
Table 43 110degC n-decane 10 g catalyst 005 g 15 bar O2 24 h
Catalyst Conv
()
Selectivity ()
54
one
3
one
2
one
54
ol
3
ol
2
ol
C5
OOH
Di-
one
C6
OOH
C7
OOH
C8
OOH
C10
OOH
Blank 144 26 7 8 17 2 2 4 12 8 6 1 2
TiO2
TiO2 368 19 10 16 13 8 9 6 10 0 6 1 1
AuTiO2 571 24 15 4 4 2 13 7 20 1 4 2 2
Repeat
AuTiO2 288 15 13 13 11 8 11 5 8 0 7 7 1
PtTiO2 005 0 0 0 52 0 0 0 48 0 0 0 0
SiO2
SiO2 121 27 18 13 6 4 5 7 10 8 3 0 0
AuSiO2 202 27 18 21 6 2 2 5 13 2 1 2 0
AuPdSiO2 187 14 15 16 10 8 11 6 5 5 7 1 1
Al2O3
Al2O3 039 26 14 6 18 5 4 7 8 10 1 0 0
AuAl2O3 104 15 11 12 21 6 3 7 15 5 3 2 1
Carbon
AuCarbon 001 0 0 0 0 0 0 0 100 0 0 0 0
Blank reactions have been repeated and got conversions range from 144-202
68
433 Discussion
Table 44 shows the comparison of the conversions at 100degC and 110degC The increase of the
reaction temperature from 100 degC to 110 degC resulted in an increase in the conversions observed
At the temperature of 110 degC a number of catalysts showed some activity but it must also be
remembered that there is also a considerable rise in auto-oxidation through a temperature
increase Therefore a radical scavenger was introduced
Table 44 Conversion at 100degC and 110degC
Catalyst Conv at
100degC()
Conv at
110degC()
Blank 030 144
TiO2 010 368
AuTiO2 025 571 (288)
PtTiO2 0 005
AuSiO2 017 202
AuPdSiO2 029 187
AuCarbon 0 001
434 Use of a radical scavenger
In order to identify the real activity of the catalyst Tempo has been employed in the reactions
to kill the auto-oxidation by acting as a radical scavenger The TEMPO form used was
stabilized on a polymer support
69
Table 45 110degC n-decane 10 g catalyst 005 g TEMPO 0005 g 15 bar O2 24 h
Catalyst Conv
()
Selectivity ()
54
one
3
one
2
one
54
ol
3
ol
2
ol
C5
OOH
Di-
one
C6
OOH
C7
OOH
C8
OOH
C10
OOH
Blank 0 - - - - - - - - - - - -
TiO2
TiO2 011 30 13 4 9 10 22 7 5 0 0 0 0
AuTiO2 028 17 14 15 8 15 14 7 6 1 1 2 0
SiO2
SiO2 086 21 13 13 5 3 2 4 30 4 6 1 1
AuSiO2 099 21 14 18 8 7 8 5 9 4 4 4 1
Al2O3
AuAl2O3 062 15 10 17 7 12 13 5 10 5 4 1 0
Table 46 Conversions without and with TEMPO
Catalyst Conv without
TEMPO()
Conv with
TEMPO()
Blank 144 0
SiO2 121 086
AuSiO2 202 099
TiO2 368 011
AuTiO2 571288 028
AuAl2O3 104 062
70
The results show a greater drop in conversion for the TiO2 based samples than for the SiO2 and
Al2O3 samples This decrease is most marked as the TiO2 samples have the greatest conversion
without TEMPO and become those with the lowest conversion once the radical scavenger is
added The level of conversion obtained from catalytic processes still remains too low at this
stage to develop further with a coating so the search for a suitable materialconditions was
continued
435 Development of the catalyst preparation method
The impregnation method used previously within this work used a large excess of water It was
thought that this may be leading to disadvantageous distribution of metal particles both in
terms of size and distribution within the pores of the material An alternative method of
preparation using the incipient wetness method to only fill the pores of the material was
therefore used and compared to the previous method The support materials were exposed to
the same preparation conditions (acidheat treatments) so that the effects of these could be
negated Please note that from here the modified GC program and column are used to analyse
the products Table 47 reports the results from a catalyst tested by both the old and new
methods A higher conversion is reported with the new method and an increase in acid
selectivity
71
Table 47 Comparison between GC analysis methods
Catalyst Con
v
()
Selectivity ()
54
one
3
one
2
one
54
ol
3
ol
2
ol
C5
OOH
1
ol
C6
OOH
C7
OOH
C8
OOH
C9
OOH
C10
OOH
Al2O3(Old) 039 26 14 18 6 5 4 7 - 10 1 0 -
1
Al2O3(New) 069 217 150 176 60 43 74 72 14 61 90 20 06
15
Table 48 24h 110ordmC 600 rpm 15 bar Oxygen n-decane (10 g) 005 g catalyst
Catalyst Conv
()
Selectivity ()
54
one
3
one
2
one
54
ol
3
ol
2
ol
C5
OOH
1
ol
C6
OOH
C7
OOH
C8
OOH
C9
OOH
C10
OOH
TiO2 196 182 109 135 76 48 78 114 10 122 79 09 19 17
AuTiO2 343 275 127 32 96 70 52 83 09 109 112 11 05 19
SiO2 161 262 172 183 43 33 58 73 10 63 68 10 04 21
AuSiO2 218 178 135 132 54 35 68 82 11 115 125 36 05 22
Graphite 281 177 133 150 95 61 93 82 11 67 87 15 06 22
AuGrap
hite 387 145 106 110 73 48 74 87 15 111 133 67 10 22
G60 0 - - - - - - - - - - - - -
AuG60 0 - - - - - - - - - - - - -
72
Graphite was tried as the support this time and was the catalyst with the highest conversion so
far The conversion and selectivity of products are shown graphically in Figure 42 to Figure
47
Figure 42 24 h 110ordmC 600 rpm 15 bar Oxygen 005 g TiO2
Total Yield ()=196
00
50
100
150
200
250
C1
C2
C3
C4
C5
Penta
noic A
cid
Hex
anoic
Acid
Hep
tanoi
c Aci
d
Octan
oic Aci
d
nona
noic A
cid
Positions of Oxidation for C10 Products and Cracked Acids
Ketones
Alcohols
Acids
73
Figure 43 24h 110 ordmC 600 rpm 15 bar Oxygen 005 g AuTiO2
Figure 44 24h 110 ordmC 600 rpm 15 bar Oxygen 005 g SiO2
Total Yield ()=343
00
50
100
150
200
250
C1
C2
C3
C4
C5
Penta
noic A
cid
Hex
anoic
Acid
Hep
tanoi
c Aci
d
Octan
oic Aci
d
nona
noic A
cid
Positions of Oxidation for C10 Products and Cracked Acids
Ketones
Alcohols
Acids
Total Yield ()=161
00
50
100
150
200
250
300
C1
C2
C3
C4
C5
Penta
noic A
cid
Hex
anoic
Acid
Hep
tanoi
c Aci
d
Octan
oic Aci
d
nona
noic A
cid
Positions of Oxidation for C10 Products and Cracked Acids
Ketones
Alcohols
Acids
74
Figure 45 24 h 110 ordmC 600 rpm 15 bar Oxygen 005 g AuSiO2
Figure 46 24 h 110 ordmC 600 rpm 15 bar Oxygen 005 g graphite
Total Yield ()=218
00
50
100
150
200
250
C1
C2
C3
C4
C5
Penta
noic A
cid
Hex
anoic
Acid
Hep
tanoi
c Aci
d
Octan
oic Aci
d
nona
noic A
cid
Positions of Oxidation for C10 Products and Cracked Acids
Ketones
Alcohols
Acids
Total Yield ()=281
00
50
100
150
200
250
300
C1
C2
C3
C4
C5
Penta
noic A
cid
Hex
anoic
Acid
Hep
tanoi
c Aci
d
Octan
oic Aci
d
nona
noic A
cid
Positions of Oxidation for C10 Products and Cracked Acids
Ketones
Alcohols
Acids
75
Figure47 24 h 110 ordmC 600 rpm 15 bar Oxygen 005 g AuGraphite
436 Ru and Rh loaded catalysts
From the literature the α- and γ-alumina supports are two of the most widely used supports for
the preparation of RuRh catalysts and zeolite coating It should be noted that from the previous
results with gold the alumina powder support showed less activity than the titania and silica
powder supports however titania support does not suit the coating conditions therefore
several different types of alumina supports were selected and tested in this section
Total Yield ()=387
00
20
40
60
80
100
120
140
160
180
200
C1
C2
C3
C4
C5
Penta
noic A
cid
Hex
anoic
Acid
Hep
tanoi
c Aci
d
Octan
oic Aci
d
nona
noic A
cid
Positions of Oxidation for C10 Products and Cracked Acids
Ketones
Alcohols
Acids
76
4361 α-phase alumina powder support
The 5 wt RhAl2O3 used in the test was prepared by the incipient wetness method using
Al2O3 - calcined powder primarily α-phase 100-325 mesh and RhCl3middotxH2O (Rh 40 wt )
The 5 wt RhAl2O3 powder catalyst have been tested at 100degC and 110degC Table 49 shows
the results for the 6 h oxidation at 100degC The result for the blank reaction at the same
temperature was given as a comparison
Table 49 100degC 15 bar 10 g n-decane 005 g catalyst 6 h
Catalyst Conv
()
Selectivity ()
54
one
3
one
2
one
54
ol
3
ol
2
ol
1
ol
C5
OOH
C6
OOH
C7
OOH
C8
OOH
C9
OOH
C10
OOH
Blank 002 206 134 173 67 48 87 19 150 41 52 08 04
12
α-Al2O3 0008 202 135 211 84 62 104 24 145 18 15 0 0
0
5Rhα-
Al2O3 002 204 138 202 84 64 102 24 138 18 22 02 02
0
77
Table 410 110degC 15 bar 10 g n-decane 00 5g catalyst 6 h
Catalyst Conv
()
Selectivity()
54
one
3
one
2
one
54
ol
3
ol
2
ol
1
ol
C5
OOH
C6
OOH
C7
OOH
C8
OOH
C9
OOH
C10
OOH
Blank 007 287 172 232 35 24 41 10 154 22 19 02 01
0
α-Al2O3 006 222 141 195 52 39 70 13 186 43 29 04 02
01
5Rhα-
Al2O3 006 221 138 185 58 44 71 14 210 25 27 02 02
01
It is found the 5 wt RhAl2O3 did not show activity above that observed for the autoxidation
at 100degC while the product distribution between the Al2O3 with and without the addition of
5Rh is very similar At a raised temperature 110degC it is again found that there is no change
in the activity and product distribution between the autoxidation and Al2O3 with and without
the addition of 5Rh (Table 410) According to the results at 100degC and 110degC it seems that
the Rh did not help the oxidation on the Al2O3 support This may be due to the fact that the 5
wt loading of Rh is too high a concentration for the Al2O3 support A later BET analysis
showed that the surface area of this kind of Al2O3 powder is 1m2g which means the 5 wt
loading of Rh is too concentrated for the α-Al2O3 Therefore a less loading of Rh should be
tested
The reaction results with a 01 wt Rh loading at 110oC are given in Table 411 From this
table it is found that both the conversion and selectivity are quite similar between the blank α-
Al2O3 and the metal added catalyst which means the 01 wt Rhα-Al2O3 powder catalyst is
inactive The α-Al2O3 with a low surface area is not a suitable support for the project
78
Table 411 110degC 15 bar 10 g n-decane 005 g catalyst 6 h
Catalyst Conv
()
Selectivity ()
54
one
3
one
2
one
54
ol
3
ol
2
ol
1
ol
C5
OOH
C6
OOH
C7
OOH
C8
OOH
C9
OOH
C10
OOH
Blank 007 287 172 232 35 24 41 10 154 22 19 02 01
0
α-Al2O3 006 222 141 195 52 39 70 13 186 43 29 04 02
01
01Rh
α-Al2O3 006 221 138 185 58 44 71 14 210 25 27 02 02
01
4362 γ-phase alumina powder support
In order to allow a higher loading of Rh on the support the γ-Al2O3 with a surface area of 140
m2g was employed at this time A 3 wt Rh was added to the γ-Al2O3 as an initial test (Table
412) The product distribution for blank and the α-Al2O3 based catalyst reactions under the
same conditions are given as a comparison
According to Table 412 there is no difference between the blank α-Al2O3 support and the 01
wt Rh added catalyst however there is a definite increase in the activity with a 3 Rh
addition on the γ-Al2O3 As well as the conversion increase the product distribution changes ndash
compared with the blank γ-Al2O3 support the selectivity for the ketones decreased while the
cracked acids increased It is clear that the particle size and concentration of active centre on
the supports significantly influence the activity of the catalyst Therefore a further
investigation was carried out A lower loading of Rh on the same support and other catalyst
preparation technique was tried to gain a best performance
79
Table 412 110degC 15 bar 10 g n-decane 005 g catalyst 6 h
Catalyst Conv
()
Selectivity ()
54
one
3
one
2
one
54
ol
3
ol
2
ol
1
ol
C5
OOH
C6
OOH
C7
OOH
C8
OOH
C9
OOH
C10
OOH
Blank 007 287 172 232 35 24 41 10 154 22 19 02 01
0
α-Al2O3 006 222 141 195 52 39 70 13 186 43 29 04 02
01
01Rh
α-Al2O3 006 221 138 185 58 44 71 14 210 25 27 02 02
01
γ-Al2O3 003 214 138 245 90 67 125 27 68 04 05 0 0
03
3Rhγ-
Al2O3 102 155 109 131 91 57 84 13 158 101 64 14 03
21
Different loadings of Rh by different preparation technique on γ -Al2O3
1 wt and 3 wt Rhγ-Al2O3 were prepared by incipient wetness method and deposition
precipitation method respectively and the reaction results are given below
80
Table 413 110degC 15 bar 10 g n-decane 005 g catalyst 6 h (by incipient wetness
method)
Catalyst Conv
()
Selectivity ()
54
one
3
one
2
one
54
ol
3
ol
2
ol
1
ol
C5
OOH
C6
OOH
C7
OOH
C8
OOH
C9
OOH
C10
OOH
Blank 007 287 172 232 35 24 41 10 154 22 19 02 01 0
untreated
γ-Al2O3 003 214 138 245 90 67 125 27 68 04 05 0 0
03
1Rhγ-
Al2O3 062 163 113 139 73 49 77 14 177 96 70 10 02
16
3Rhγ-
Al2O3 093 155 109 131 91 57 84 13 158 101 64 14 03
21
Table 414 110degC 15 bar 10 g n-decane 005 g catalyst 6 h (by deposition precipitation
method)
Catalyst Conv
()
Selectivity ()
54
one
3
one
2
one
54
ol
3
ol
2
ol
1
ol
C5
OOH
C6
OOH
C7
OOH
C8
OOH
C9
OOH
C10
OOH
Blank 007 287 172 232 35 24 41 10 154 22 19 02 01 0
Untreated
γ-Al2O3 003 214 138 245 90 67 125 27 68 04 05 0 0
03
1Rhγ-
Al2O3 032 174 121 163 70 49 81 15 182 72 58 07 03
07
3Rhγ-
Al2O3 030 162 110 156 85 58 96 16 176 68 55 07 04
08
81
Having a cross comparison among the results a few conclusions can be drawn a) with the
incipient wetness method the different loading of Rh makes a difference in the activity
however the difference in selectivity is limited b) with the DP method the activity with
different loading can be regarded as the same within the experimental error the catalysts
prepared by DP are less active than by the incipient wetness method c) with higher Rh loading
the selectivity of ketones decreased while the internal alcohol increased in comparison with the
autoxidation untreated γ-Al2O3 and less loading of Rh catalyst but the changes between the
two different loading samples were not significant the total cracked acids selectivity does not
change for both the two preparation technique
Using the 3 wt Rhγ-Al2O3 from the same batch four parallel reactions were done to confirm
the results (Table 415) According to the table reaction 1 and reaction 2 were done when the
batch was new and the quite similar conversion and product distribution was reached however
the reaction 3 and 4 which were done days later different product distributions and similar
conversion was reached with the same loading catalyst prepared by DP method This probably
means the Rh formed by the incipient wetness method is not stable in air and became inactive
in the storage
82
Table 415 110degC 15 bar 10 g n-decane 005 g 3 wtRhγ-Al2O3 6 h (by incipient
wetness method)
Reaction Conv
()
Selectivity ()
54
one
3
one
2
one
54
ol
3
ol
2
ol
1
ol
C5
OOH
C6
OOH
C7
OOH
C8
OOH
C9
OOH
C10
OOH
1 093 155 111 136 91 57 86 12 161 94 62 13 03
21
2 102 155 109 131 91 57 84 13 158 101 64 14 03
21
3 032 176 124 171 91 59 95 13 126 65 51 10 03
15
4 041 159 114 153 94 61 96 15 137 76 61 12 04
15
Different metal on the same support
Ru is also a metal with suggested possible activity in the system Therefore the 3 wt Ruγ-
Al2O3 was prepared by the incipient wetness method and DP method as well 3 wt Rh Au
and Ru were added to γ-Al2O3 support respectively and then compared in Table 416 It looks
that by the incipient wetness prep the Rh is the most active system while the Ru is not working
The 3 wt Ruγ-Al2O3 prepared by DP method showed no activity at all
83
Table 416 110degC 15bar 10g n-decane 005g catalyst 6h (by incipient wetness method)
Catalyst Conv
()
Selectivity ()
54
one
3
one
2
one
54
ol
3
ol
2
ol
1
ol
C5
OOH
C6
OOH
C7
OOH
C8
OOH
C9
OOH
C10
OOH
γ-Al2O3 003 214 138 245 90 67 125 27 68 04 05 0 0
03
3Rhγ-
Al2O3 102 155 109 131 91 57 84 13 158 101 64 14 03
21
3Auγ-
Al2O3 036 142 102 145 97 73 120 20 139 62 84 05 03
07
3Ruγ-
Al2O3 0004 351 159 192 127 64 108 0 0 0 0 0 0
0
4363 Loading with alumina spheres
To allow the addition of zeolite coating the metal added sphere catalyst needs to be tested
With a very low surface area of the alumina sphere (diameter = 5 mm surface area = 025
m2g) only a very low loading is allowed on it or the metal on the surface would be too
concentrated to react with the alkanes Table 417 shows the reaction results with 01wt Au
and Rh added alumina spheres However it was found that such low loadings do not help the
activity the conversion with the addition of metal is even lower than the blank spheres But
the 01Rhalumina sphere can achieve a quite different product distribution ndash the selectivity
of the cracked acids is quite low
As we know a low surface sphere is better for the zeolite coating however it limits the
performance of the active centre This is an incompatible problem which needs to be solved
84
As a trial to add more active centres on the support for zeolite coating a smaller alumina sphere
was also employed This type of alumina sphere is with 1mm diameter and 203 m2g surface
area An experiment with the addition of 3 wt Au proves the active centre on it works better
than the low surface area alumina sphere (Table 418) As nobody used a high surface area
alumina support in the zeolite coating before we did not know what would happen when it is
coated A test was carried out and discussed in Chapter 6
Table 417 110 degC 15 bar 10 g n-decane 6 h 600 rpm 2 spheres (low surface area
Al2O3 sphere)
Catalyst
Conv
()
Selectivity ()
54
one
3
one
2
one
54
ol
3
ol
2
ol
1
ol
C5
OOH
C6
OOH
C7
OOH
C8
OOH
C9
OOH
C10
OOH
Untreated
Al2O3
spheres 021 207 131 168 64 45 73 18 190 49 44 03 02
06
01 Au
Al2O3
spheres 012 142 129 196 77 54 88 18 188 46 53 03 02
04
01 Rh
Al2O3
spheres 004 233 159 249 87 69 111 30 111 05 07 0 11
03
85
Table 418 110degC 15 bar 10 g n-decane 6 h 600 rpm 005 g spheres (high surface area
Al2O3 sphere)
Catalyst Conv
()
Selectivity ()
54
one
3
one
2
one
54
ol
3
ol
2
ol
1
ol
C5
OOH
C6
OOH
C7
OOH
C8
OOH
C9
OOH
C10
OOH
untreated
Al2O3
spheres 004 215 138 216 92 64 106 25 102 14 20 02 04
04
3 Au
Al2O3
spheres 026 235 148 188 54 38 60 15 158 49 44 04 01
07
44 Conclusion
Both decane and hexane oxidation have been studied as model reactions The reactions were
carried out using either a Parr stainless steel reactor or an Andrews glass reactor under a range
of conditions Various catalysts have been tested for decane oxidation at the beginning of the
project eg 5 wtAuTiO2 25 wtAu-25 wtPdSiO2 Most of the catalysts showed
very low conversion and very poor terminal selectivity Increasing the temperature leads to
higher conversion but results to more cracked products and less selectivity for oxygenated C10
products Figure 48 shows the activity of the auto-oxidation and the catalysts activity From
this figure it can be seen that the most active catalyst was 5 wt AuTiO2 However these
catalysts did not show good terminal alcohol selectivity whereas the cracked acid selectivity
was high (320) (Figure 49)
86
Figure 48 Conversion with different catalysts (reaction conditions 110oC 10 g n-
decane 005 g catalyst 15 bar O2 600 rpm stainless steel reactor)
Figure 49 Product distribution with 5 wt AuTiO2 (reaction conditions 110oC 10 g
n-decane 005 g catalyst 15 bar O2 600 rpm stainless steel reactor)
87
45 References
[1] J K Edwards B E Solsona P Landon A F Carley AHerzing CJ Kiely and GJ
Hutchings Journal of Catalysis 235 (2005) 69
[2] P Siva Sankar Reddy N Pasha MGV Chalapathi Rao N Lingaiah I Suryanarayana
PS Sai Prasad Catalysis Communications 8 (2007) 1406
88
CHAPTER 5
Cyclodextrin Covered
Catalysts
89
CYCLODEXTRIN COVERED CATALYSTS
51 Introduction
Cyclodextrins (CDs) are cyclic oligosaccharides composed of six (alpha) seven (beta) or eight
(gamma) glucopyranose units linked by α(1-4)-glycosyl bonds that have the shape of hollow
truncated cones They have a central cavity of 6-10 nm which can form complexes with various
organic compounds in aqueous solution inside their hydrophobic cavities [1] Due to their
unusual properties cyclodextrins have been widely investigated and utilized in pharmacy
biology the food industry analytical chemistry separation science and various other areas [2-
9]
Figure 53 Chemical structure of α- and β-CDs
Although the application of cyclodextrins as a shape-selective material has been widely
reported the number of reports focusing on their application to the oxidation of linear alkanes
is limited The first literature concerning alkane oxidation with cyclodextrins was published in
1972 by Lammers [10] Lammers et al proposed that α-CD derivatives can encapsulate one n-
hexane molecule in its stretched conformation in the interior of the cavity whereas β-CD
derivatives can encapsulate one n-hexane molecule in a compact coil form (but only loosely
90
bound) Based on this Otsuka published an article in 1991 on the application of CDs for the
terminal oxidation of n-hexane in a H2-O2 fuel cell [11] In 2000 Otsuka and Yamanka used
FeCl3graphite as the host cathode to study the effect of cyclodextrin additives on the selective
oxygenation at the primary carbon of n-hexane [12] They demonstrated that when n-hexane
was introduced to the cavity of the cyclodextrin the methylene CndashH bonds of n-hexane are
blocked by the walls of the cyclodextrins from an attack by the active oxygen species so
oxygenation occurs exclusively at the terminal carbons As a result they reported that when α-
and β-CDs were added to the FeCl3graphite cathode the selectivity for terminal oxygenation
increases (selectivity for 1-hexanol ~12) compared with that of the normal FeCl3graphite
cathode
Based on these studies it is clear that cyclodextrins can be an effective shape-selective material
in the hexane oxygenation reactions by the electrochemistry system However it would be
interesting to see if there is a less expensive and easier method to apply cyclodextrins to alkane
oxidation In this project the possibility of using cyclodextrins as an organic shape selective
coating over catalysts for the oxidation of long chain alkanes was investigated
The idea of using CDs as catalyst coatings is that they may allow only the primary CndashH bonds
of alkanes to interact with active oxygen species present at the catalyst surface thus forcing
oxygenation exclusively at the terminal carbon The diameters of cyclodextrin cavities are
047ndash053 nm (α-CD) 060ndash065 nm (β-CD) and 078ndash083 nm (γ-CD) The common depth
of the cavities is about 079 nm [12] The width of linear alkanes is typically 04-05 nm Due
to the molecular size of the long chain alkanes the cavities of α- and β-CDs are considered to
be more preferable for the selective oxidation of long chain alkanes Several different
91
cyclodextrin modified catalysts have been prepared and are discussed in this chapter
52 Cyclodextrins as catalyst modifiers
There are no previous studies on how to apply cyclodextrins as a direct coating material for
catalysts applied to long chain alkane oxidation However CDs have been applied as
regioselective catalysts or catalyst modifiers in various other chemical reactions [13-19]
Guy et al [13] reported some preliminary results obtained on the effects of CDs during the
ring-opening reaction of epoxides with LiN3 in aqueous media The experiment was carried out
by stirring a mixture of epoxide LiN3 and β-CD in water at room temperature They observed
an lsquoincrease in the regioselectivity of the ring-opening processrdquo A regioselectivity of 59
could be obtained for compound 2b (Scheme 51) when the reaction was performed in the
presence of β-CD compared to 86 without the use of β-CD Although a good selectivity
can be reached with the use of β-CD as a mediator a decrease in the regioselectivity was
observed as the conversion of styrene oxide was increased and after 43 hours of reaction the
selectivity had dropped to 20
Scheme 51 The ring- opening reaction of epoxides with LiN3 in aqueous media in the
presence of β-CD [14]
Reddy et al [14] reported the regioselective ring opening of epoxides to halohydrins with
hydrogen and lithium halides in the presence of β-CD using water as solvent The reaction was
92
carried out by the in situ formation of a β-CD - epoxide complex followed by the addition of
hydrogen halide or lithium halide (Scheme 52) Stirring at room temperature results in the
formation of the corresponding halohydrin without the formation of any side products or
rearrangements The CDs appeared not only to activate the epoxides but also to promote the
highly regioselective formation of halohydrins due to the formation of an inclusion complex
Scheme52 The ring opening of epoxides to halohydrins in the presence of β-CD [14]
Similar research has been reported by Sridhar et al [15] for the regioselective ring opening
synthesis of β-hydroxy selenides from benzeneselenol and epoxides (Scheme 53) The
reaction was found to proceed at room temperature in presence of β-CDs in water
Scheme 53 The ring opening synthesis of β-hydroxy selenides from benzeneselenol and
epoxides in the presence of β-CD [15]
Ravichandran [16] found that in the presence of β-CD and its derivatives the photo-Reimerndash
93
Tiemann reaction of phenols with chloroform proceeds with high selectivity for the formation
of 4-hydroxy benzaldehydes The β-CDs were reported to have two effects on the reaction
(Scheme 54) Firstly both the yield of the aldehyde and the reaction rate were enhanced
Secondly the position of formylation was altered ie the ratio of 23 (paraortho attack) was
increased The presence of β-CD showed an enhanced yield up to 74 with 824 selectivity
for the formation of 4-hydroxy benzaldehyde against a yield of up to 62 with 666
selectivity for the same compound without the presence of β-CD
Scheme 54 The formation of 4-hydroxy benzaldehydes [16]
Pattekhan and Divakar reported the regioselective acetylation of 4-t-butylcyclohexanol in the
presence of β-CD [17] The experiment was carried out with 10ndash20 times excess of acetic
anhydride At a molar ratio of 110 of 4-t-butylcyclohexanolacetic anhydride (Scheme 55)
they reported a conversion of 990 to 4-t-butylcyclohexyl acetate with a transcis ratio of
348 with very little unreacted alcohol present (transcis ratio 25) They also found that with
an increase in the concentration of β-CD (although the ester yield was less than the control) the
transcis ratio increased steadily from 346 for 101 (yield 577) to 549 for 11 eq (yield
744) of 4-t-butylcyclohexanol to β-CD However the trans ester yield was comparable to
the control (769) in the presence of 1 eq of β-CD They concluded that the results showed
that the selectivity in esterification between the trans and cis alcohols was due to inclusion
complex formations within the β-CD cavity
94
Scheme 55 4-t-butylcyclohexanol to acetic anhydride [17]
Hirai and Shiraishi [18] reported their study of regioselective carboxylation of aromatic
compounds using CDs as catalysts under mild conditions producing terephthalic acid 44rsquo-
biphenyldicarboxylic acid and 26-naphthalene-dicarboxylic acid (Scheme 56) In their
opinion it is the inclusion complex formations of β-CD with the aromatic hydrocarbon and
carbon tetrachloride in the reaction mixture that promotes the yield and selectivity of the target
dicarboxylic acids The high selectivity was ascribed to the conformation of the β-CDndasharomatic
monocarboxylate inclusion complexes
95
Scheme 56 The formation of terephthalic acid 44rsquo-biphenyldicarboxylic acid and 26-
naphthalene-dicarboxylic acid [18]
Ji et al [19] reported how the amount of β-CD can affect the oxidation of sulfides to sulfoxides
and sulfones with aqueous hydrogen peroxide in the presence of β-CD In their operation 1
mmol of β-CD was dissolved in 25 ml of deionised water at 45 oC and then the methyl phenyl
sulfide was added under stirring and hydrogen peroxide was slowly added as well They found
that a rise in the amount of β-CD strongly increases the conversion of methyl phenyl sulfide
from 56 to 93 at 45 ordmC
From the literature survey in various reactions CDs can be effective catalyst modifiers and
work at room temperature or very low reaction temperature and are easy to apply and low cost
According to this the method to create CD covered catalysts were developed as in the
Experimental section below
53 Experimental
531 Preparation of CD covered catalysts
The main method of catalyst preparation was impregnation The porous catalysts were
96
impregnated in the CDs solution to leave adsorbed CDs on the surface Using CD covered
AuSiO2 as an example the detailed steps of the preparation were as follows
1 BET surface area of the AuSiO2 determined
2 Assuming CD molecules cover the catalyst surface one by one without gaps and create a
monolayer (Figure 52) the required mass of CDs to completely cover the surface of catalysts
was calculated (eg to cover 1 g of AuSiO2 037 g of α-CDs or 035 g of β-CDs is needed)
3 The calculated amount of CDs was then dissolved in 25 ml of deionised water by heating to
45C and stirring
4 5 ml of the CDs solution was added to 1 g of AuSiO2 and the mixture heated to 45C and
stirred for 30 min and then put into an oven to dry overnight at 110ordmC
Figure 52 Ideal catalyst surface covered by cyclodextrin molecules
532 Catalyst testing
Reactions were carried out in a high-pressure stainless steel autoclave with a nominal volume
of 45 ml and a magnetic PTFE stirrer In each experiment the reaction unit was flushed once
with O2 to remove the air And then the pressure was increased to 15 bar O2 at room temperature
Normally the prepared catalysts were tested in the unit using the following conditions 15 bar
O2 600 rpm stirring speed 110degC 10 g n-decane and 005 g catalyst 16 h
97
In most cases the tested catalysts were modified following the method described in Section
531 to create fully covered catalysts However in some cases the catalysts were modified by
less than a monolayer of cyclodextrins (samples denoted 14 α-CDs covered AuSiO2 for
catalysts with a coverage of 14 monolayer) Samples were not able to be fully recycled after
reactions therefore each experiment was performed with fresh catalyst In addition some
reactions were carried out with addition of PS-TEMPO (2266-Tetramethyl-1-piperidinyloxy
provided by Johnson Matthey) as a radical scavenger
02 μl samples of the reaction mixtures were analysed after reaction using a gas chromatograph
(Varian 3380) fitted with a CP-WAX52 CB column and an FID detector An internal standard
(0150 ml 124-trichlorobenzene) was added to the product mixture to quantify the results
54 Results
541 BET analysis
The BET surface area of the catalysts covered by different amounts of cyclodextrins was
determined as shown in Table 51
Table 51 The BET surface area of the different catalysts
Catalysts Surface Area (m2g)
5 wtAuSiO2 254
14 α-CDs covered AuSiO2 222
α-CDs fully covered AuSiO2 155
14 β-CDs covered AuSiO2 189
β-CDs fully covered AuSiO2 96
It was observed that with an increasing amount of cyclodextrins the surface area of the
98
catalysts decreased For example for the α-CD series the standard AuSiO2 the specific
surface area was decreased by 12 with 14 α-CD coverage and 39 with the fully covered
AuSiO2 According to Poncheal et al [20]this reduction in surface area correlates with the
covering of the nitrogen adsorption sites by the cyclodextrin on the substrate catalyst surface
which hinders the nitrogen molecules access to the binding sites Therefore the decrease of the
surface area is an evidence of the successful loading of cyclodextrin on the surface of AuSiO2
542 Activity of CDs
5421 Activity of CDs under reaction conditions
At the beginning of the research it was important to establish the activity of CD themselves
under the reaction conditions Therefore reactions with only CD and no catalyst were carried
out Two different amounts of CDs were used (005 g and 100 g) An average of two blank
reactions (no catalysts only decane and oxygen) is also given for comparison The results were
shown in Table 52
Table 52 Activity of CDs
Catalyst Conv() Selectivity ()
C10
Ketones
C10
Alcohols
Cracked
Acids Others Terminal
Blank 066 586 66 120 236 26
005g α-CDs 030 474 63 107 355 27
100g α-CDs 011 224 126 160 489 21
005g β-CDs 032 422 75 128 374 17
100g β-CDs 017 187 131 152 530 31
Reaction conditions 16 h 110oC 15 bar O2 10 g n-decane 005 g or 100 g CDs stainless
steel reactor
99
The addition of both α- and β-CDs leads to a decrease of conversion when compared to the
blank reaction under the same conditions In the product distribution there was a definite
decrease in the selectivity to ketones and an increase in the selectivity to alcohols and acids
The unknown other products increased as well especially with 100 g of CD
In the CD structures there are a number of OH groups (Figure 51) therefore it could be
possible that the CDs are being oxidized rather than decane It has been reported that without
tethering them to a catalyst cyclodextrins can be oxidized and yield ketones and carboxylic
acids [21] It is also possible that the CDs react and produce some of the unknown products
To determine whether the cyclodextrins were stable under the reaction conditions they were
added into another solvent performing the reaction under the decane reaction conditions
Reactions were performed with α- or β-CDs (005 g) in water (10 g) keeping the other
conditions the same as for the reaction using decane (stainless steel reactor 15 bar O2 600 rpm
stirring speed 110degC 16 h) After the reaction no products were observed in the GC trace
(Figure 53) which indicates that the CDs are not reacting under the reaction conditions The
product distribution changes observed are due to modifying the catalyst
However no trend in terminal selectivity with the additions of CDs is observed (Table 55) and
the range of terminal selectivities observed is considered to be within the experimental errors
Therefore it is assumed that without a catalyst the CDs are not shape-selective catalysts for
the oxidation of decane
100
Figure 53 GC analysis β-CDs reacting with water
5422 Activity of CDs with the addition of radical scavenger
A radical scavenger ndash PS-TEMPO was added to the reaction Previously it has been shown that
that 0005 g PS-TEMPO can suppress the radical reaction in blank reactions (Chapter 4)
Therefore 0005 g PS-TEMPO was added into the reaction in order to observe the non-radical
catalytic reaction with CDs
The results are given in Table 53 It was found that the conversion decreased with the addition
of PS-Tempo For all the reactions with PS-TEMPO a 005 conversion was observed and the
selectivity of the other products increased However an increase in selectivity for alcohols and
acids was still observed when the amount of α-CDs is increased from 005 g to 100 g The
terminal selectivities were very low (around 05-08)
101
Table 53 Activity of CDs with PS-TEMPO
Catalyst Conv() Selectivity ()
C10
Ketones
C10
Alcohols
Cracked
Acids Others Terminal
005g α-CDs 030 474 63 107 355 27
With PS-
TEMPO 005 26 22 32 920 05
100 g α-CDs 011 224 126 160 489 21
With PS-
TEMPO 005 34 29 49 888 07
005g
β-CDs 032 422 75 128 374 17
With PS-
TEMPO 005 26 22 38 904 08
Reaction conditions 16 h 110oC 15 bar O2 10 g n-decane 005 g or 100 g CDs 0005 g PS-
TEMPO stainless steel reactor
543 Activity of CD modified AuSiO2
5431 The fully covered AuSiO2
In Chapter 4 it is reported that AuSiO2 is one of the best catalysts for decane oxidation
Therefore the CDs were impregnated onto AuSiO2 to prepare CD modified catalysts and the
results are shown in Table 54
It was found that the conversion was higher with the AuSiO2 without having being modified
by the addition of CDs This could be because of the CD on the surface covering some of the
active sites on the AuSiO2 leading to the decreased conversion It was also found the terminal
selectivity was increased slightly from 27 to around 32 with CDs Repeating the reaction
showed the same results although this increase is considered to be within the experimental
errors
102
Table 54 Activity of CD modified AuSiO2
Catalyst Conv() Selectivity ()
C10
Ketones
C10
Alcohols
Cracked
Acids Others Terminal
Blank 068 586 66 120 236 26
AuSiO2 100 497 106 145 252 27
005g
α-CDs 030 474 63 107 355 27
α-CD
modified
AuSiO2 053 290 167 162 382 31
005g
β-CDs 032 422 75 128 374 17
β-CD
modified
AuSiO2 070 325 173 158 344 32
Reaction conditions 16 h 110degC 15 bar O2 10 g n-decane 005 g catalyst stainless steel
reactor
5432 Different level of CD coverage over catalysts
When preparing the CD covered AuSiO2 the amount of CD needed to fully cover the surface
area of AuSiO2 was calculated However tests were performed to investigate if different levels
of coverage can affect the terminal selectivity which is also a potential way to prove if the CDs
are shape selective A quarter of the amount of CD was added to the catalyst which was tested
under the same reaction conditions as previously and the results are shown in Table 55
103
Table 55 Activity of CD modified AuSiO2
Catalyst Conv() Selectivity ()
C10
Ketones
C10
Alcohols
Cracked
Acids Others Terminal
AuSiO2 100 497 106 145 252 27
α-CD 14
covered
AuSiO2 071 291 150 179 380 29
α-CD fully
covered
AuSiO2 053 290 167 162 382 31
β-CD 14
covered
AuSiO2 050 320 160 160 360 29
β-CD fully
covered
AuSiO2 070 325 173 158 344 32
Reaction conditions 16 h 110oC 15 bar O2 10 g n-decane 005 g catalyst stainless steel
reactor
According to Table 51 it was found that different amounts of CDs lead to a different coverage
level of CDs on the catalyst surface However from Table 55 it can be seen that with different
level of CD coverage the difference between product distributions was very limited The trend
of BET surface area change and terminal selectivity change for the α-CD covered AuSiO2 is
shown in Figure 54
104
Figure 54 The trend of BET surface area change and terminal selectivity change
There was a 02-03 increase in the terminal selectivity between the 14 covered sample and
the fully covered sample Thus there is a general trend in increasing terminal selectivity with
increase CD content This increase is however also considered to be within the experimental
error Therefore from these experiments it cannot be concluded if the CDs worked as a shape-
selective coating in the reaction
5433 Cyclodextrin modified catalyst recycling
To check the stability of CDs on the modified catalysts decane oxidation reactions with α- and
β-CD covered AuSiO2 were performed then the catalysts were recycled and reused However
it should be noticed that the full repeat was impossible as there was a loss of catalyst during
the recycle and for 005 g catalyst only 002 g was recovered after recycling
105
Table 56 Reaction with recycled CD modified AuSiO2
Catalyst Conv() Selectivity ()
C10
Ketones
C10
Alcohols
Cracked
Acids Others Terminal
α-CD
covered
AuSiO2 0668 315 192 300 192 24
Recycled
α-CD
covered
AuSiO2
0100 383 191 203 210 23
β-CD
covered
AuSiO2 0556 345 161 312 172 24
Recycled
β-CD
covered
AuSiO2
0053 323 198 275 191 26
Reaction conditions 16 h 110oC 15 bar O2 10 g n-decane 005 g catalyst stainless steel
reactor
Although there was a huge decrease in the conversion the change in the terminal selectivity
was minor (Table 56) This result may indicate that the AuSiO2 was deactivated after the
reaction As no decrease in terminal selectivity was found with the recycled catalyst it is
thought that CDs still covered the catalyst after the reaction However due to the large loss of
catalysts in the recycling process and the experimental error at low conversion the results are
not clear
544 CD modified AuHCl treated SiO2
In Chapter 4 it was found that the acid treated silica support did not show a difference from
the silica support without acid treatment in terminal selectivity However it was considered
worth determining if there is any difference with the cyclodextrin coatings Therefore AuHCl
treated SiO2 was also modified with CDs and tested under the same reaction conditions (Table
106
57)
Table 57 Activity of CD covered AuHCl treated SiO2
Catalyst Conv() Selectivity ()
C10
Ketones
C10
Alcohols
Cracked
Acids Others Terminal
AuHCl
treated
SiO2 090 445 113 158 284 29
α-CD
covered 080 311 159 183 347 30
β-CD
covered 050 286 151 164 399 28
Reaction conditions 16 h 110oC 15 bar O2 10 g n-decane 005 g catalyst stainless steel
reactor
A decrease in conversion was again observed when CDs were added to the reaction The
terminal selectivity of the treated AuHCl treated SiO2 is slightly higher than the non-treated
AuSiO2 and the conversion slightly lower The difference in conversion and terminal
selectivity are both considered to be within the experimental errors With CDs on AuHCl
treated SiO2 no changes in terminal selectivity were detected in the reaction however the
conversion decreases This may be because the CDs are not selective in the reaction However
it could also be possible that the H+ remained on the surface of the Au catalyst and then reacts
with the ndashOH bond on the CDs
107
55 Conclusions
The aim of the project was to synthesize coatings onto active catalysts which can effectively
oxidize long chain alkanes in the primary position In this chapter cyclodextrins were
investigated as an organic shape-selective material to coat the AuSiO2 catalysts Addition of
CDs without the catalyst decreased the conversion but no trend in terminal selectivity was
observed With the CD covered AuSiO2 catalyst a decrease in conversion is seen compared to
the blank reaction however the changes in terminal selectivities are still limited and considered
to be within the experimental errors To conclude the CD covered catalysts which were
prepared by the direct impregnation method did not play an important role in increasing the
terminal selectivity
56 References
[1] GA Signorell TC Kaufmann W Kukulski A Engel H Remigy Journal of Structural
Biology 157 (2007) 321
[2] J Haggin Chemical Engineering News 70 (1992) 25
[3] J Szejtli Cyclodextrin Technology Kluwer Academic Publishers Dordrecht (1988)
[4] R Dagani Chemical Engineering News 71 (1993) 4
[5] H Parrot-Lopez H Galons AW Coleman J Mahuteau M Miocque Tetrahedron
Letters 33 (1992) 209
[6] DW Armstrong W Li AM Stalcup H VSecor RR Izac JI Seeman Analytical
Chemistry Acta 234 (1990) 365
[7] DW Armstrong AM Stalcup ML Hilton JD Duncan JR Faulkner S Chang Anal
Chem 62 (1990) 1610
[8] J Szejtli Cycfoakxtrin Technology Kluwer Academic Dordrecht (1988)
108
[9] ML Bender and M Komiyama Cyclodextrin Chemistry Springer Berlin (1978)
[10]JNJJ Lammers Recueil 91 (1972) 1135
[11] K Otsuka K Furuka Electrochimica Acta 37 (6) (1992) 1135
[12] K Otsuka I Yamanaka Catalysis Today 57 (2000) 71
[13] A Guy J Doussot R Garreau A Godefroy-Falguieres TetrahedronAsymmetry 3
(1992) 247
[14] MA Reddy K Surendra N Bhanumathi KR Rao Tetrahedron 58 (2000) 6003
[15] R Sridhar B Srinivas K Surendra NS Krishnaveni KR Rao Tetrahedron Letters 46
(2005) 8837
[16] R Ravichandran Journal of Molecular Catalysis A Chemical 130 (1998) 205
[17] HH Pattekhan S Divakar Journal of Molecular Catalysis A Chemical 184 (2002) 79
[18] H Hirai Y Shiraishi Reactive amp Fuctional Polymers 67 2007 1115
[19] H Ji XHu D Shi Z Li Russian Journal of Organic Chemistry 42 (7) (2006) 959
[20] A Ponchel S Abramson J Quartararo D Bormann Y Barbaux E Monflier
Microporous and Mesoporous Materials 75 (2004) 261
[21] ME Deary DM Davies Carbohydrate Research 317(1-4) (1999) 10
[22] K Otsuka I Yamanaka Catalysis Today 57 (2000) 71
109
CHAPTER 6
Teabag Technology
110
TEABAG TECHNOLOGY
61 Introduction
The aim of this research project is to realize the selective oxidation of long chain alkanes to
alcohols and acids at the terminal position Therefore various selective materials can be
considered Zeolites known as one of the most popular shape-selective catalysts is the focus
of the chapter Zeolites can be synthesized as membranes for the purpose of separation
adsorption or for the selective reaction An ideal zeolite membrane combines the general
advantages of inorganic membranes (temperature stability solvent resistance) with shape
selectivity Small aggregates of zeolite crystals as a coating on the surface of a catalyst can
improve external mass transfer characteristics especially in fast liquid phase and gasliquid
phase reactions [1] A continuous zeolite membrane can discriminate the components of
gaseous or liquid mixtures dependent on their molecular size Hence in this chapter the aim is
to utilize zeolite membrane as coatings outside the metalsupport catalysts to realise the
selectivity of the terminal long chain alkane oxidation product This technology is called teabag
technology Specifically teabag technology is an idea that zeolite coatings work as the teabag
to control the diffusion of reactants to the active sites in a specific configuration that only allows
the oxidation of the terminal position This chapter aims to find a zeolite with the suitable pore
size so that only the wanted reactant and product can pass through the outer coating to an
oxidation catalyst underneath
62 The teabag technology project
lsquoTeabag technologyrsquo was first named by Johnson Matthey (JM) which is one of the sponsors
and co-operating companies of the research project The key work in this area has been carried
111
out by Paul Collier (JM) who used zeolite A as the coating material on the catalyst (eg Pt-
FeSiO2 Pd-FeSiO2) for the CO oxidation in the presence of butane [2 3] The zeolite A
coating synthesis process they used was as follows 5 g catalyst spheres were added into a 5
wt solution of polyelectrolyte (Percol 1697 from Allied Colloids Ltd) containing dilute
ammonia to adjust the pH value between 10 and 11 The solution was stirred at room
temperature for 20 minutes Subsequently the spheres were separated from the solution and
washed with demineralized water Then the spheres were rapidly added to a zeolite gel which
was composited with a solution of 607 g sodium aluminate in 52 g demineralized water to a
solution of 1551 g sodium metasilicate in 52 g demineralized water The gel was stirred at
room temperature for 2 hours and then hydrothermally crystallized at 100˚C for 24 hours The
zeolite coated catalyst spheres were separated from the crystallization solution and washed with
demineralized water dried at 105˚C and then calcined at 500˚C for 2 hours The oxidation
experiment results showed with the coated catalyst carbon monoxide is selectively oxidized at
temperature between 150˚C and 400˚C (Figure 61)
However this technique cannot be applied in this project in exactly the same way because the
pore size of zeolite A is too small (pore size ranges from 3-45 Aring KNaA 3 Aring NaA 4 Aring
CaNaA 45 Aring) for the long chain alkane diffusion Therefore other zeolite membrane needs
to be explored to fit the long chain alkanes Considering the molecule size of hexane and decane
MFI type zeolite (including silicalite-1 and ZSM-5) zeolite X and mordernite are all possible
candidates (pore size ranges from 8-10 Aring)
112
Figure 61 CO and butane conversion comparison with the presence of zeolite A coated
catalyst
63 Zeolite membrane synthesis
In order to create a typical zeolite membrane coating for this project it is important to
understand the current research stage of zeolite membrane synthesis and the parameters that
influence the synthesis
631 Preparation method
The methods for the preparation of the zeolite coatings recorded in the literature can be
generally catalogued into three different ways
113
1) Slurry coating or wash-coating in which the zeolite is brought onto the support from a wash-
coat solution containing precursors of binders based on alumina zirconia silica titania or
silica-alumina The coatings are calcined to obtain bonding of the crystallites to the support
surface [4]
2) Dry gel conversion in which a gel containing the aluminosilicate precursor water and
template is brought onto the support dried and subsequently crystallized by contacting with
steam at 105-150ordmC [5]
3) In situ coating in which the crystals are directly grown close to or on the support either from
a gel or a solution with the hydrothermal synthesis conditions [6-21]
The disadvantage of first and second methods is that the crystal layers created in those ways
always show a low continuity and a limited accessibility therefore it is more common today
to use the in situ hydrothermal method in dilute aluminosilicate systems in which the amorphous
gel phase is not present Zeolite coatings prepared in this way have a high continuity and can
be optimized for use as either a membrane or a catalyst
The first hydrothermal method system that produced zeolite NaA was reported at the
International Zeolite Association (IZA) meeting in Tokyo in 1986 by Wenqin et al [6] The
batch composition in it formed the starting point of the present work in clear solution Another
advantage of the clear solution method is that it permits the use of in situ observations using
light scattering techniques to study the synthesis [7] especially the nucleation and crystal
growth processes occurring within the solution phase After Wenqin et al [6] published the
system almost all syntheses of zeolite A coatings were accomplished using the clear solution
system with the composition xNa2OyAl2O31SiO2200H2O where x ranges from 5 to 13 and
114
y ranges from 01 to 02
Cetin et al [8] used a small difference in their batch composition they used the aluminosilicate
solution with a composition of 10Na2OAl2O3SiO2200H2O The same ratio was also utilized
in the research of Andac et al [9] Anhydrous NaOH pellets were dissolved in deionised water
and granular sodium aluminate and sodium silicate were added to the solution Additions were
made to solutions cooled to below 27ordmC and the final reaction mixture was stirred for 15 min
at the temperature prior to the syntheses Hydrothermal crystallization was carried out in a
stainless steel reaction vessel at 60ordmC for various periods of time ranging from 1 to 10 h It was
reported that a zeolite film with a thickness of about 15 μm could be obtained after a synthesis
time of 10 h
Different compositions have also been reported in the literature for the zeolite A coatings Wang
et al [10] employed a solution with 03Na2OAl2O334SiO242 (TMA)2O 237H2O The
experiments were run at a higher temperature of 100ordmC for 24 h coatings were successfully
applied to a porous α-Al2O3 support The particle size of the zeolite crystallites was 250 nm by
SEM
As a development of the hydrothermal synthesis a seeding method was introduced into the
zeolite membrane preparation For example Sterte et al [11] synthesized mono disperse
silicalite-1 crystals and then used the crystals as seeds in the synthesis of coatings Supports
were seeded first and then zeolite membranes were grown by the hydrothermal method
described in the other methods [6-10] They showed that coatings synthesized by this method
had better adhesivity thermal stability and crystal orientation than those prepared by other
115
methodologies
In a synthesis of ZSM-5 coatings on stainless steel Tatlier et al [12] used a substrate heating
method keeping the reaction mixture at temperatures below 100ordmC while the metal plates were
heated to a temperature above 100ordmC It was demonstrated that continuous ZSM-5 coatings of
different textures with different crystal morphologies and void fractions could be formed
depending on the reaction conditions (Table 61) The mass of the coatings increased with the
substrate temperature and the duration of synthesis because of the effect of temperature on the
rate of crystallization The method was regarded to be beneficial in respect to the synthesis
duration compared to the conventional procedures
Table 61 Mass and thickness of the coatings at an oil bath temperature of 90degC
Resistance
temperature
(degC)
Synthesis
duration
(days)
Coating
mass
(mgcm2)
Actual
coating
thickness
(μm)
Equivalent
coating
thickness (μm)
Void
fraction
200 3 01a ndash ndash ndash
240 3 02a ndash ndash ndash
280 3 05 40 29 028
240 5 17 120 97 020
240 8 27 270 153 043
280 5 33 380 188 051
a The coating is not crystalline
116
632 Supports in zeolite coating
For the synthesis of zeolite coatings support materials should be chosen that are readily
available attrition resistant and chemically stable under the reaction conditions
In Table 62 various types of support are given together with their physical and chemical
properties [13]
Supports such as α-Al2O3 [9 14 15] quartz [8] and stainless steel [8 9] were reported in use
for the zeolite A coating in the literature reviewed to date And as reported in the US patent
20050032628 [2] the catalyst substrate comprises at least one platinum group metal which
are known as effective catalysts for the oxidation of a wide variety of chemical species
supported on a support material The support materials are preferably oxidized materials
including silica alumina titania and so on It is possible that preparations using these supports
could be adapted to introduce an active metal to the support before applying the zeolite coating
It was reported that the formation of a continuous coating of zeolite is not easy to achieve over
an alumina or stainless steel support using conventional hydrothermal crystallization
techniques [9 16] The surface charge of zeolites is negative at basic pH (typical zeolite
synthesis conditions) which means that there is an electrostatic barrier preventing the growth
of zeolite coatings on supports To overcome this several methods of introducing positive
charge to the supports were investigated
117
Table 62 Supports currently used in the preparation of zeolite coatings
Support Nature Surface Amount of
surface
material areaa OH- groupsb
Spheresextrudates
α-Al2O3 Hydrophobic high low
γ- Al2O3 Hydrophilic high high
Single crystal wafers
Si Hydrophilic low high
TiO2 Hydrophilic low medium
Sapphire(α-Al2O3) Hydrophobic low low
Platesdisks
Stainless steel Hydrophilic low high
Quartz Hydrophilic low high
Vitreous glass Hydrophilic low high
Pressed carbon Hydrophobic high low
Foams
α-Al2O3 Hydrophilic high low
Fibres
Carbon Hydrophobic medium low
Vegetal Hydrophilic medium medium
Inorganic Hydrophilic medium high
Inserts
Gold Hydrophobic low low
Teflon Hydrophobic low low
a Lowlt 1 m2g-1 medium 1-10 m2g-1 highgt 10m2g-1
b Lowlt 1 OH nm-2 medium 1-25 OH nm-2 highgt 25 OH nm-2
Collier et al [16] reported a method using a copolymer of acrylamide and the methyl chloride
quaternary salt of 2-(dimethylamino) ethyl acrylate The polymer species are strongly adsorbed
118
on the support by the electrostatic attraction between the quaternary ammonium groups of the
adsorbate and the oxide ions at the support surface resulting most probably in a flat
conformation The presence of excess quaternary ammonium groups imparts an overall
positive charge to the polymer-covered support surface allowing the zeolite coating to stick
Andac et al [9] reported a treatment method for stainless steel to introduce positive charge to
the surface The stainless steel plates were first boiled in toluene for 30min and then held at
60ordmC for 15 min in a mixture of H2O2(30) NH4OH(25) and H2O in a 115 ratio by volume
In this way NH4+ is attached to the support surface creating the positive charge
A typical method of preparation catalyst substrate was investigated by Nishiyama et al [17]
In the report they prepared the silicalite-1 coating with PtTiO2 by impregnation in two steps
1) Preparation of PtTiO2 particles Platinum-loaded titania catalyst was prepared by the
impregnation of spherical TiO2 particles with Pt from a solution of hydrogen
hexachloroplatinate (IV) hexahydrate The impregnation solution was prepared by dissolving
H2PtCl6middot6H2O salt in deionised water Then the slurry was dried at 120ordmC overnight and at
500ordmC for 6 h in air Reducing in hydrogen for 3 h at 300ordmC is required before utilization
2) Zeolite coating The surface of the PtTiO2 particles was positively charged by treatment in
a solution of 04 wt polyethyleneimine in deionised water Then the particles were immersed
in a 10 wt silicalite-1 solution The crystallization was carried out in the closed vessel at
180ordmC for 24h (Figure 62) After washing with deionized water and drying the product at 90ordmC
overnight it was calcined in air at 500ordmC for 6 h
119
Figure 62 Reaction vessel used for zeolite coating
633 Other factors for preparation
Some other factors that would influence the production of zeolite coating have been
investigated including the operating temperature [1 8 9] the utilization of ultrasound [1 9
18] the role of water content [14] and the aging time [5]
Temperature
The preparation of continuous zeolite coatings is related to two competing phenomena
occurring on the surface nucleation and crystal growth The thickness of the zeolite coating
may be decreased in the case where a higher number of smaller crystals growing on the unit
surface of the substrate are available In this respect temperature may be a significant factor
for the property of the coating prepared
Puil et al [1] prepared samples coated in zeolite beta by a hydrothermal method for 18 h at
155ordmC The autoclaves were then cooled to room temperature in air and the solids recovered
by filtration washed and dried at 120ordmC before the coated particles were removed by a 500
μm sieve The samples were then suspended in water and treated ultrasonically for 2-4 h to
120
remove any lsquoloosersquo crystals after which the samples were again filtered dried sieved and
calcined at 550ordmC for 12 h The ion-exchange was carried out in aqueous 01 M NH4Cl at room
temperature for 24 h followed by drying at 120ordmC and calcining at 550ordmC They reported after
calcination and ion-exchange the supported zeolite beta coatings show activity in the reaction
The activity is similar to the intrinsic activity of commercial zeolite β samples
Cetin et al [8] reported that the temperature affected the thickness of the zeolite 4A layers They
found the thickness of closed zeolite 4A layers may be decreased at relatively lower synthesis
temperatures when relatively longer synthesis times are employed They suggested the possible
reason might be that the rate of nucleation being less temperature sensitive than the rate of
crystal growth Zeolite 4A coatings of 1 and 07 μm thickness have been prepared on quartz
and stainless steel substrates respectively at 45ordmC No subsequent calcination of the material
was reported in the paper
In 2005 Andac et al [9] successfully carried out the zeolite A hydrothermal crystallization on
stainless steel plates at temperatures of 50ordmC and 60ordmC for various periods of time ranging from
2 to 15 h by using a heater and a temperature controller The experiment was carried out in an
ultrasonic water bath And then the product was filtered using a filter paper with fine mesh size
The filtrate was then refiltered through a 01 μm PVDF membrane before washing thoroughly
with deionized water and drying overnight in an oven at 65ordmC
Ultrasound
Use of ultrasound in polymer synthesis is known to be helpful in providing rate and yield
enhancements In the zeolite coating synthesis the effect of ultrasound was reported by a few
121
researchers [1 9 18] leading to a conclusion that the ultrasonic irradiation leads to acceleration
of crystallization of zeolite coating and some other benefits For example Andac et al [9]
reported that in the presence of ultrasound the thickness of the zeolite A coatings on stainless
steel plates could be decreased from about 15 μm to about 06 μm and a closed layer was
obtained after 3 h of synthesis instead of 10 h at 60ordmC The final roughness value was also
smaller for the coating prepared in the presence of ultrasound
This phenomenon is likely to be due to an increase in the nucleation rate resulting in a higher
number of particles forming on the substrate at earlier synthesis times in the presence of
ultrasound Hence with the ultrasound lower temperature and shorter times than with the
conventional preparation method can be expected
Water Content
Kalipcilar et al [14] found a relationship between the water content in the synthesis solutions
and the thickness of the coating formed They carried out the synthesis of silicalite layers on α-
Al2O3 disks with a molar batch composition of 65Na2O25SiO2xH2O69TPABr (69 g silicic
acid 79 g TPABr) by varying the water content from 500 to 2000 miles at 200ordmC They found
that the silicalite layer which was synthesized from the most concentrated batch was formed
from crystals with an average size of 100 μm and a thickness of 36 μm And the layer thickness
and average crystal size decreased to about 8 and 7 μm respectively when the batch containing
1400 miles of water was used As shown in Figure 63 the continuity of the layer and the
crystal size was improved as the water content of the batch was increased from 500 to 1136
miles and decreased on further dilution of the batch to 1400 and 2000 miles
Gavalas et al [19] investigated the effect of the batch composition on the properties of ZSM-
122
5 layers on non-porous and porous α-Al2O3 supports They found the dilution of the
crystallization solution led to a partial coverage of the surface and poor growth of the crystals
under the surface
Sterte et al [20] observed that decreasing amounts of water in the clear crystallization solution
resulted in the formation of a continuous film Thin oriented silicalite-1 films with thicknesses
in the range of 180 nm to 1 μm have been obtained by varying the contents of the reaction
mixture
Figure 63 Surface SEM images of silicalite-1 layers synthesized from the batch with a
molar composition 65Na2O25SiO2xH2O69TPABr at 200ordmC (a) 500 mol (b) 800 mol
(c) 1136 mol and (d) 1400mol
123
Calcination Rate
In an early work of preparation of MFI membranes [21] it has been recommended that
calcination of supported MFI membranes should be carried out in air at a maximum
temperature of 400ordmC with a low heating rate of 1 ordmCmin However no particular reason for
using a low rate was given
Hedlund et al [22] that thin silicalite-1 films on asymmetric α-Al2O3 can be calcined at 500ordmC
with a heatingcooling rate as high as 5ordmCmin without reducing the membrane quality They
also reported that films with different microstructure thickness and on other types of supports
may behave differently
Aging the solution
The formation of zeolite coatings and their properties such as the thickness continuity and
orientation of the crystals are related to the presence and macro-organization of a precursor
phase Based on this view preshaped zeolite coatings can be prepared
Gora et al [5] especially emphasized the effect of aging in their report for the zeolite synthesis
In the experiment the aluminosilicate gel was aged for 385h at 25 ordmC The solution was shown
to be very effective as an initiator for nucleation They found addition of even 27 of the
solution to a reaction mixture (10Na2O 02Al2O31SiO2200H2O) increased the nucleation rate
considerably which means that aging the solution could accelerate the coating speed
634 Deactivation
Deactivation is a problem for all the catalysts Due to the structure of the zeolite catalyst coking
124
is the most common reason for the deactivation However in research on a silicalite-1 coating
Nishiyama et al [17] reported that the deactivation of the coated catalyst was reduced
compared with the uncoated one They regarded the reason probably to be the protection
against poisoning impurities in the feed
64 Experimental
641 Preparation of coated catalysts
From the literature survey it can be concluded that the hydrothermal method is the most
common way to prepare zeolite coatings which was also the method taken in this project
However the hydrothermal method can be divided into several kinds of different methods
depending on the exact preparation procedure According to the coating steps the hydrothermal
method can be divided into a direct synthesis method and a secondary synthesis method (the
seeding method) according to the batch composition it can be divided into the normal method
(with template) and the template-free method Different preparation methods have been
attempted in this project as the research developed The preparation methods of coated catalysts
have been improved subsequently also with different metal active centres powdersphere
supports and zeolite membranes The tested samples in this project have been listed in Table
63
The details of synthesis and characterization for each sample are discussed in the following
sections in chronological order
125
Table 63 List of synthesized zeolite coating samples
Zeolite coating type Substrate catalyst
theoretical wt loadings
Support type
Zeolite A SiO2
HCl treated SiO2
5 wt AuSiO2
MgO
α-Al2O3
γ-Al2O3
SiO2 powder
MgO powder
SiO2 spheres
α-Al2O3 spheres
γ-Al2O3 spheres
Silicalite-1 3 wt Auγ-Al2O3 γ-Al2O3 spheres
ZSM-5 01 wt Rhα-Al2O3
01 wt Auα-Al2O3
α-Al2O3 spheres
Zeolite XY SiO2 SiO2 spheres
6411 Zeolite A coated samples with silica powder support
Powder form silica support was employed at the beginning of the coating attempts unlike many
of the literature reports of coatings where extended solids such as rod and sphere supports were
used The synthesis of 5 wt AuSiO2 has been discussed in Chapter 4 The corresponding
coated samples (coated SiO2 coated HCl SiO2 and coated AuSiO2) were prepared in two steps
Preparation the substrate catalysts
To make a comparison three kinds of substrate catalysts (SiO2 HCl treated SiO2 and 5 wt
AuSiO2 ) were coated Among them the HCl treated SiO2 and AuSiO2 were prepared with the
SiO2 support (silica powder Grace gt99 60-100 mesh) and dilute HCl solution
HAuCl4middot3H2O solution respectively by the incipient wetness method The dilute HCl solution
should be adjusted to the same pH value with the HAuCl4middot3H2O solution Using the 5 wt
AuSiO2 as an example to prepare 1 g 5 wt AuSiO2 095 g SiO2 powder was impregnated
by a solution with 01 g HAuCl4middot3H2O The samples were dried in the 110degC oven and then
calcined at 400 degC for 3 h at a heating rate of 20degC min
126
Synthesis of the zeolite A coatings
Substrate catalysts were washed with 01 M HCl in an ultrasonic bath for 20 min and then
washed again with deionised water before drying at 110degC overnight Then a zeolite solution
with the batch composition tetraethyl orthosilicate (TEOS) (Aldrich) Al2(SO4)3 (Aldrich)
NaOH H2O was made The molecular ratio is 80SiO21Al2O310Na2O1500H2O The solution
was stirred for three hours before being mixed with the substrate and placed into autoclaves
The autoclaves were heated at 180degC for 24 h Finally the products were washed in deionized
water in the ultrasonic bath and dried at 110degC overnight
At the same time in order to test if the catalysts still remain active after being treated in this
way the catalysts were treated in the same manner as the coating procedure but without the
coating solution The products with coating solution are called the lsquocoated productsrsquo while the
products without coating solution are called the lsquotreated productsrsquo in the following section
6412 Zeolite 4A coated samples with sphere supports
Silica spheres (Saint-Gobain diameter 32 mm surface area 025 m2g) and alumina (Saint-
Gobain surface area 075 m2g) spheres have been employed in the synthesis The AuSiO2
and AuAl2O3 spheres were prepared by a vacuum incipient wetness method The zeolite 4A
coatings have been synthesized following the method reported by Collier et al [2] 5 g of 5
wt AuSiO2 spheres or alumina spheres were added to a 5 wt solution of the
polyelectrolyte Two kinds of polyelectrolyte have been tested polydiallyl dimethyl
ammonium chloride and 2-propen-1-ammonium NN-dimethyl-N-2-propenyl chloride
(magnafloc lt35) containing dilute ammonia and stirred at room temperature for 20 minutes
The spheres were subsequently separated from the solution and washed with demineralized
127
water and then added to a zeolite solution which was prepared with rapid addition and stirring
The solution contained 607 g sodium aluminium oxide (Alfa Aesar) in 52 g demineralized
water to a solution of 1551 g sodium metasilicate (Alfa Aesar anhydrous) in 52 g
demineralized water The mixture containing the spheres was stirred at room temperature for
2 hours and then hydrothermally crystallized at 100degC for 24 hours Finally the zeolite-coated
spheres were separated from the crystallization solution and washed with demineralized water
dried at 105degC and then calcined in air at 500degC for 2 hours
6413 Silicalite-1 coating with sphere supports
1 wt and 3 wt Rhα-Al2O3 Rhγ-Al2O3 Ruγ-Al2O3 were prepared by the incipient
wetness method and deposition precipitation (DP) method separately The incipient wetness
method was carried out as previously reported in Chapter 4 Taking the 1 wt Rhγ-Al2O3
as an example to prepare 1 g 1 wt Rhγ-Al2O3 099 g γ-Al2O3 had a solution of 0025 g
RhCl3middotxH2O (Alfa Aesar) added The water content was predetermined and was that required
to form a paste with the alumina support The paste was dried overnight at 110degC and then
calcined at 400degC for 3 h The DP preparation was performed as follows (taking the 3
wtRhγ-Al2O3 as an example) to prepare 1 g 3 wt Rhγ-Al2O3 099 g γ-Al2O3 was first
dispersed in an aqueous solution of 0075 g RhCl3middotxH2O A quantity of 1 M Na2CO3 was slowly
added to the RuCl3 solution until the pH value of the mixture reached 105 The suspension was
then maintained at the same pH for 1 h during the precipitation process The resulting solid
was washed with deionized water several times until no chloride ion was detected by silver
nitrate solution in the filtrate All the catalysts were dried at 110degC (12 h) in air Finally they
were calcined at 500degC for 5 h in air [23] Alumina (Saint-Gobain surface area 025 m2g)
spheres have also been tested
128
The vacuum incipient wetness method was employed in the preparation of sphere catalysts To
prepare 1g catalyst 1 g alumina spheres were placed into a sealed two neck round bottom flask
The flask was heated to 80degC with an oil bath and connected to a vacuum pump for 1 h The
calculated amount of metal solution was added into the flask through a syringe The flask was
shaken until all the metal solution was absorbed into the spheres The spheres were then dried
at 110degC overnight before calcination at 400degC for 3 h
Coatings have been applied to AuAl2O3 and RhAl2O3 based spheres The silicalite-1 precursor
solution consisted of TEOS (98 Aldrich) tetraprophylammonium hydroxide (TPAOH) (1
M solution in water Aldrich) ethanol (EtOH) (Fluka) and deionized water with the molar
ratios of 05TPAOH 120H2O 8EtOH 2SiO2 Approximately 10 g of catalyst sphere was
immersed in 15 g of the precursor solution The crystallization was carried out under
hydrothermal conditions at 180degC for 24 h in a stainless steel vessel with agitation The coating
procedure was repeated twice The products were rinsed repeatedly with deionized water
separated by filtration and dried at 90degC overnight then calcined in air at 600degC for 5 h with a
heating rate of 1degCmin [24]
6414 ZSM-5 coating with α- and -Al2O3
Synthesis of ZSM-5 coatings on both α- and -Al2O3 was attempted Synthesis were carried
out in Teflon-lined 60 ml autoclaves Teflon liners were cleaned before and after each synthesis
in NaOH solution for 24 h under the synthesis conditions Supports were cleaned by boiling in
toluene for 1 h and dried overnight at 110degC before being immersed in the zeolite precursor
solution The zeolite precursor solution was prepared by adding tetrapropylammonium
hydroxide (TPAOH Aldrich 1 M solution in water) sodium aluminate (NaAlO2 Aldrich Al
129
50-56) to tetraethyl orthosilicate (TEOS Aldrich 98) in a PTFE beaker The molar ration
of the precursor solution was 1 Al2O3 40 SiO2 10 TPAOH 800 H2O
The precursor solution was stirred for 10 h at room temperature as an aging process before
filling the autoclaves In all experiments 1 g of support was added to the autoclaves The
volume of precursor solution was varied (32 ml or 15 ml) to observe the influence of the amount
of precursor Syntheses were carried out at 160degC for 24 h Then the coated samples and the
extra synthesized powder for the same batch were washed with deionized water and dried
overnight at 110degC Finally the samples were calcined at 550degC for 12 h using a heating rate
of 5degCmin
642 Reaction conditions
The reaction conditions taken for the powder form catalysts in this project usually are 15 bar
O2 600 rpm 110degC 10 g n-decane and 005 g catalyst Therefore the zeolite A coated SiO2
HCl treated SiO2 and 5 wt AuSiO2 were tested under the same conditions
With the sphere supports the reaction system was adjusted They have been tested both in
stainless steel autoclaves and the Andrews glass reactor according to Iglesiarsquos work [25] In
addition as a single sphere is much heavier (eg the mass of a single silica sphere asymp 009g)
than the catalysts used in the previous reactions (005g in each reaction) in the experiment 1
g sphere catalysts have been used in each reaction at 110degC Other conditions used in the
stainless steel reactor are the same as before 15 bar O2 60 0rpm and 10 g n-decane In the
Andrews glass reactor the conditions are 3 bar O2 600 rpm and 25 ml n-hexane
130
643 Characterization
In the coating experiments the weight of the samples before and after coating was recorded to
determine the coverage of the coatingm2 support
The uncoated and coated spheres were crushed into powders to perform XRD analysis XRD
patterns of both the supports and the coated samples were analysed by a PANanlytical Xrsquopert
MPD X-ray diffractometer with a monochromatic CuKa source at 40 KeV and 40 mA The
morphology of the coated spheres was analysed by a Zeiss Evo-40 series scanning electron
microscopy EDX mapping was carried out by the same instrument in conjunction with an
INCAx-sight EDX detector Reaction samples were analysed by gas chromatography with a
CP Wax 52CB column 25 m 053 mm 20 microns using a programmed temperature ramp
Each sample was injected at least twice
65 Results
651 Zeolite A coating with powder support
Coating of SiO2 and MgO based catalysts was attempted using the direct template-free method
in which powder form SiO2 and MgO supports were employed It is important to ascertain the
effects of treatment on the bulk catalyst Hence the lsquotreatedrsquo catalysts were tested in this section
as well As the SiO2 based catalysts works better in the liquid phase while the MgO based
catalysts proved to be more active in the gas phase the coated and treated SiO2 and MgO based
catalysts were separately tested in the corresponding phase
6511 Coated SiO2 in liquid phase reaction
The SiO2 based catalysts were analysed by the BET XRD SEMampEDX before testing in
131
reactions
BET
When studying the data on surface area (Table 64) it is quite obvious that after being coated
the surface area of the sample is dramatically reduced There is also a slight increase in the
surface area of the samples when treated but not coated SEM images have been taken to check
the morphology of the samples and to see if reasons can be ascribed for the changes in surface
area
Table 64 BET results for the SiO2 based catalysts
Catalysts Surface Area(m2 g-1)
SiO2 268
HCl SiO2 277
AuSiO2 255
Coated SiO2 14
Coated HCl SiO2 7
Coated AuSiO2 6
Treated SiO2 270
Treated HCl SiO2 286
Treated AuSiO2 315
SEM amp EDX
According to the SEM images (Figure 64) it can be seen that both the untreated catalysts and
the treated catalysts show similar morphologies under the microscope The coated samples
present a much different morphology clearly showing a roughened overlayer both attached to
the large macroscopic particles and also unattached and separate For the coated SiO2 catalyst
(Figure 64 b) it can be seen that the coating does not cover the whole surface and a large
presence of the smoother SiO2 support is visible In contrast following acid and disposition of
gold (Figure 64 e and h) the covering seems more complete although there is clearly still a
132
large amount of unattached coating present The Au particle distribution on the support is clear
shown in the BSD detector in Figure 65
(a) SiO2 (b) Coated SiO2 (c) TreatedSiO2
(d) HCl SiO2 (e) Coated HCl SiO2 (f) Treated HCl SiO2
(g) AuSiO2 (h) Coated AuSiO2 (i) Treated AuSiO2
Figure 64 Comparison of SEM Images of the SiO2 Catalysts
Each image is approximately 550 μm wide
133
Figure 65 Au particles in BSD detector
Compared with the coated catalysts it was known the surface area had been massively
decreased with the addition of the coating so it was expected that at a high magnification image
a difference should be observed This is indeed the case (Figure 66) with the untreated silica
presenting a smooth appearance while the surface of the coated samples show a large degree
of roughness It is likely that the surface area decrease is caused by the coating blocking a large
amount of the pore structure of SiO2
(a) SiO2 (b) Coated SiO2
=
Figure 66 Surface of the uncoated and coated SiO2 samples
According to the EDX results (Table 65) the treated AuSiO2 appeared to show a decrease in
the Au present which probably means that the Au was lost in the treatment (most likely in the
134
ultrasonic bath) However in the SEM image of the treated AuSiO2 sample Au particles can
still be observed (Figure 67 b) And the Au particles look less in number and smaller in size
than before treatment (Figure 67 a) Therefore it is suggested that the apparent loss of Au
might due to both the loss during the treatment and the detector limitation
The EDX results (Table 65) also show that the coating contains an amount of sodium (except
the coated SiO2) and that the coating is sufficiently thick and complete to mean that no gold is
observed from under the coating Importantly no aluminium is detected showing the formed
coating is not a zeolite but instead silica
Table 65 EDX results for SiO2 based Catalysts
Catalysts O (Weight ) Si (Weight) Other Element
(Weight)
SiO2 625 375 0
HCl SiO2 618 382 0
AuSiO2 598 362 Au 40
Coated SiO2 642 358 0
Coated HCl SiO2 638 335 Na 27
Coated AuSiO2 620 357 Na 23
Treated SiO2 610 390 0
Treated HCl SiO2 614 386 0
Treated AuSiO2 622 374 Au 04
(a)AuSiO2 (b) Treated AuSiO2
Figure 67 Au particles on the AuSiO2 and treated AuSiO2 with the BSD detector
135
XRD
Examining the bulk of the catalysts by XRD shows only two observable phases for all the
catalysts These are an amorphous silica and gold (in the relevant samplesFigure 68) There
are no changes observed by the addition of the coating which could mean it is too small to be
observed or it may be amorphous in nature The large gold particles observed in the SEM are
also confirmed by the XRD data where highly defined sharp peaks are observed
Figure 68 XRD Analysis for the SiO2 based catalysts
o - SiO2 peak x ndash Au peak
Liquid Phase Reactions
To check if the SiO2 based catalysts are still active after being treated the treated SiO2 based
catalysts were tested in reactions (Figure 69-Figure 611 Table 66-Table 68) According to
the results below after being treated in the coating procedure the catalysts still remain active
136
Figure 69 24 h 110ordmC 600 rpm 15 bar Oxygen 10 g n-decane
005 g Treated SiO2
Table 661 24 h 110ordmC 600 rpm 15 bar Oxygen 10g n-decane 005g Treated SiO2
Catalyst Conv
()
Selectivity ()
54
one
3
one
2
one
54
ol
3
ol
2
ol
1
ol
C5
OOH
C6
OOH
C7
OOH
C8
OOH
C9
OOH
C10
OOH
Treated
SiO2 128 250 160 170 64 40 59 09 90 73 52 10 01
23
C10 Terminal selectivity = 09+23 = 32
Cracked Acid selectivity = 90 + 73 + 52 + 10 + 01= 226
137
Figure 610 24 h 110ordmC 600 rpm 15 bar Oxygen 10 g n-decane
005 g Treated HCl SiO2
Table 67 24 h 110ordmC 600 rpm 15 bar Oxygen 10g n-decane 005 g Treated HCl SiO2
Catalyst Conv
()
Selectivity ()
54
one
3
one
2
one
54
ol
3
ol
2
ol
1
ol
C5
OOH
C6
OOH
C7
OOH
C8
OOH
C9
OOH
C10
OOH
Treated
HCl SiO2 204 229 150 160 73 46 65 09 97 83 51 11 02
22
C10 Terminal selectivity = 09+22 = 31
Cracked Acid selectivity = 97 + 83 + 51 + 11 + 02= 244
138
Figure 611 24 h 110ordmC 600 rpm 15 bar Oxygen 10 g n-decane
005 g Treated 5 wtAuSiO2
Table 68 24 h 110ordmC 600 rpm 15 bar Oxygen 10 g n-decane 005 g Treated
5 wt AuSiO2
Catalyst Conv
()
Selectivity ()
54
one
3
one
2
one
54
ol
3
ol
2
ol
1
ol
C5
OOH
C6
OOH
C7
OOH
C8
OOH
C9
OOH
C10
OOH
Treated
AuSiO2 179 253 156 173 62 39 63 10 85 68 55 09 03 23
C10 Terminal selectivity = 10+23 = 33
Cracked Acid selectivity = 85 + 68 + 55 + 09 + 03= 220
Then the three coated catalysts were tested and results for them are given below (Figure 612
to Figure 614 Table 69 to Table 611) And the results are compared in Table 612
139
Figure 6121 24 h 110ordmC 600 rpm 15 bar Oxygen 10g n-decane
005 g Coated SiO2
Table 69 24 h 110ordmC 600 rpm 15 bar Oxygen 10 g n-decane 005 g Coated SiO2
Catalyst Conv
()
Selectivity ()
54
one
3
one
2
one
54
ol
3
ol
2
ol
1
ol
C5
OOH
C6
OOH
C7
OOH
C8
OOH
C9
OOH
C10
OOH
Coated
SiO2 351 201 126 143 97 61 87 13 94 76 62 12 05
23
C10 Terminal selectivity = 13+23 = 36
Cracked Acid selectivity = 94 + 76 + 62 + 12 + 05= 249
140
Figure 613 24 h 110ordmC 600 rpm 15 bar Oxygen 10 g n-decane
005 g Coated HCl SiO2
Table 610 24 h 110ordmC 600 rpm 15 bar Oxygen 10 g n-decane 005 g Coated HCl
Treated SiO2
Catalyst Conv
()
Selectivity ()
54
one
3
one
2
one
54
ol
3
ol
2
ol
1
ol
C5
OOH
C6
OOH
C7
OOH
C8
OOH
C9
OOH
C10
OOH
Coated
HCl SiO2 479 196 122 143 93 60 82 13 107 84 60 14 04
21
C10 Terminal selectivity = 13+21 = 34
Cracked Acid selectivity = 107 + 84 + 60 + 14 + 04= 269
141
Figure 614 24 h 110ordmC 600 rpm 15 bar Oxygen 10 g n-decane
005 g Coated AuSiO2
Table 611 24 h 110ordmC 600 rpm 15 bar Oxygen 10 g n-decane 005 g Coated AuSiO2
Catalyst Conv
()
Selectivity ()
54
one
3
one
2
one
54
ol
3
ol
2
ol
1
ol
C5
OOH
C6
OOH
C7
OOH
C8
OOH
C9
OOH
C10
OOH
Coated
AuSiO2 471 206 117 134 94 58 83 14 107 86 61 14 04
20
C10 Terminal selectivity = 14+20 = 34
Cracked Acid selectivity = 107 + 86 +61 + 14 + 04 = 272
142
If a good zeolite coating is formed outside the catalysts the activity of the catalysts will be
limited However with the current coating the conversion became higher than before (Table
612) while the product distribution of the systems remained similar To this extent it seems
that the coating may be promoting the reaction by acting as a radical initiator The catalysts
with the highest activity (Coated HCl SiO2 and coated AuSiO2) were then tested in the
presence of TEMPO to try to scavenge the radical reaction (Figure 615 and Figure 616)
Table 612 Compare the SiO2 Based Catalysts
Catalyst Conv
()
Selectivity ()
54
one
3
one
2
one
54
ol
3
ol
2
ol
1
ol
C5
OOH
C6
OOH
C7
OOH
C8
OOH
C9
OOH
C10
OOH
SiO2 161 269 164 188 52 36 48 08 70 64 58 13 01
28
AuSiO2 242 224 145 167 55 47 70 10 87 78 67 18 02
29
Treated
SiO2 128 250 160 170 64 40 59 09 90 73 52 10 01
23
Treated
HCl SiO2 194 229 150 160 73 46 65 09 97 83 51 11 02
22
Treated
AuSiO2 179 253 156 173 62 39 63 10 85 68 55 09 03
23
Coated
SiO2 351 201 126 143 97 61 87 13 94 76 62 12 05
23
Coated
HCl SiO2 479 196 122 143 93 60 82 13 107 84 60 14 04
21
Coated
AuSiO2 471 206 117 134 94 58 83 14 107 86 61 14 04
20
143
Figure 615 24 h 110ordmC 600 rpm 15 bar Oxygen 10 g n-decane 005 g
Coated HCl SiO2 0005 g TEMP
Table 613 24 h 110ordmC 600 rpm 15 bar Oxygen 10 g n-decane 005 g Coated HCl SiO2
0005g TEMPO
Catalyst Conv
()
Selectivity ()
54
one
3
one
2
one
54
Ol
3
ol
2
ol
1
ol
C5
OOH
C6
OOH
C7
OOH
C8
OOH
C9
OOH
C10
OOH
Coated
HCl SiO2+
TEMPO 055 200 137 164 69 46 70 15 105 69 83 12 02
27
C10 Terminal selectivity = 15+27 = 42
Cracked Acid selectivity = 105 + +69 +83 + 12 + 02= 271
144
Figure 616 24 h 110ordmC 600 rpm 15 bar Oxygen 10 g n-decane 005 g Coated AuSiO2
0005 g TEMPO
Table 614 24h 110ordmC 600 rpm 15 bar Oxygen 10g n-decane 005g Coated AuSiO2
0005g TEMPO
Catalyst Conv
()
Selectivity ()
54
one
3
one
2
one
54
Ol
3
ol
2
ol
1
ol
C5
OOH
C6
OOH
C7
OOH
C8
OOH
C9
OOH
C10
OOH
Coated
AuSiO2
+TEMPO 022 173 126 180 94 62 92 14 111 53 72 06 04
14
C10 Terminal selectivity = 14 + 14 = 28
Cracked Acid selectivity = 111 + 53 + 72 + 06 + 04= 246
Only very slight differences in product distribution was found between the reactions with and
without TEMPO (Table 615) which are within experimental error It is interesting to note
though that the coated acid-treated SiO2 catalyst is the most active observed in the presence of
TEMPO compared to the previous best of 045 for AuTiO2 while pure SiO2 was inactive
145
in the presence of TEMPO This shows that either the acid treatment or the coatings are helping
to promote activity
Table 615 Compare the results with and without TEMPO
Catalyst Conv
()
Selectivity ()
54
one
3
one
2
one
54
Ol
3
ol
2
ol
1
ol
C5
OOH
C6
OOH
C7
OOH
C8
OOH
C9
OOH
C10
OOH
Coated
HCl SiO2
+TEMPO 055 200 137 164 69 46 70 15 105 69 83 12 02
27
Coated
HCl SiO2 479 196 122 143 93 60 82 13 107 84 60 14 04
21
Coated
AuSiO2+
TEMPO 022 173 126 180 94 62 92 14 111 53 72 06 04
14
Coated
AuSiO2 471 206 117 134 94 58 83 14 107 86 61 14 04
20
A time-on-line study was then carried out to further investigate the activity of the coated
samples The comparison of results was shown in Figure 617 to Figure 619The three SiO2
coated catalysts coated SiO2 coated HCl SiO2 and coated AuSiO2 have been tested time on-
line without and with TEMPO The conversion and terminal selectivity (C10 terminal
selectivity and cracked acids selectivity) without and with TEMPO are compared
146
Figure 617 Coated SiO2 and coated SiO2 with TEMPO
Figure 618 Coated HCl SiO2 and coated HCl SiO2 with TEMPO
Figure 619 Coated AuSiO2 and coated AuSiO2 with TEMPO
147
6512 Discussion
It can be seen that both conversion and selectivity for the reformation of shortened acids are
quite different between the reactions without and with TEMPO Though the conversion with
TEMPO is much reduced (as would be expected) the selectivity for shortened acids is higher
(typically ~10) than when TEMPO is not present The presence of increased selectivity for
shortened acids seems to be at the expense of C10 ketones while little difference is seen in the
C10 terminal selectivity
The results both in the presence and absence of TEMPO show a considerable induction period
with a large increase in conversion only occurring after 16 hours of time on line This is similar
to work previously reported on the autoxidation of n-decane
In the presence of TEMPO the three coated samples have little difference in both conversion
and selectivity From this it is suggested that in these reactions the activity is due to the SiO2
overlayer more than the catalyst underneath
In order to test the activity of the coating formed the coated MgO catalysts were also tested in
liquid phase under the same conditions to make a comparison
6513 Coated MgO in gas phase reaction
MgO based Catalysts were analysed and tested in gas phase reactions discussed in this section
BET
It is found in Table 616 that after being coated or treated the surface area increased The
situation is a little different from the SiO2 samples To have a good understanding of this the
148
structure of the catalyst particles are shown in the SEM images (Figure 620)
Table 616 BET results for the MgO based catalysts
SEMampEDX
According to the Figure 620 it can be found that before the treatment the blank catalysts are
in very small particles after being treated the particles maintain their original size however
some become stuck together to form large macroscopic particles (images c f i)
In a higher magnification image of the MgO without any treatment (Figure 621 a) and coated
MgO (Figure 621 b) Obviously both the size and surface properties are quite different from
SiO2 crystals And it can be clearly seen that something is covering the MgO substrate The
formed coating composition is discussed in the following XRD and XPS section
Catalysts Surface Area(m2g)
MgO 98
HCl MgO 74
AuMgO 51
Coated MgO 39
Coated HCl MgO 110
Coated AuMgO 169
Treated MgO 134
Treated HCl MgO 112
Treated AuMgO 120
149
(a) MgO (b) Coated MgO (c) Treated MgO
(d) HCl MgO (e) Coated HCl SiO2 (f) Treated HCl SiO2
(g) AuMgO (h) Coated AuMgO (i) Treated AuMgO
Figure 620 Comparison of SEM Images of MgO Based Catalysts
Each image is approximately 550 μm wide
(a) MgO (b) Coated MgO
Figure 621 SEM images of MgO and Coated MgO with a higher magnification
150
Table 617 EDX results for MgO Based Catalysts
Catalysts O
(Weight )
Mg
(Weight)
Si
(Weight)
Other Element
(Weight)
MgO 508 483 0 Ca 084
HCl MgO 465 521 0 Cl 08 Ca 06
AuMgO 485 466 0 Cl 13 Ca 08 Au 28
Coated MgO 590 59 350 0
Coated HCl
MgO
604 309 87 0
Coated AuMgO 614 222 165 0
Treated MgO 623 377 0 0
Treated HCl
MgO
628 372 0 0
Treated
AuMgO
612 358 0 Au 30
In the untreated blank catalysts some Cl and Ca are found which corresponds with impurities
in the magnesium carbonate (The starting material for the production of MgO) They disappear
in the coated and treated samples which is likely to be due to the treatment by ultrasonic bath
and washing It is clear that the OMg ratio is quite different among the original MgO based
catalysts the coated catalysts and the treated catalysts If the increase of O ratio in the coated
samples only comes from the coating formed it would not be expected that the treated samples
would also observe the O ratio increase This will be discussed with the XRD results together
below
As above the EDX analysis found the treated AuSiO2 lost some Au (Au became only 04
after being treated) but this did not occur with the treated AuMgO It is suggested that this is
due to the different surface properties ndash as shown in the SEM the SiO2 support we employed
151
has a very smooth surface It is also noticeable that again that the gold is no longer observed
once the coating has been laid down
Again no aluminium was observed after this preparation so further analysis was taken with
XPS to test if the concentration of aluminium is only in the surface region
XPS
A small amount coated MgO sample was analysed in the XPS with the elements seen below
along with their binding energies (Table 618) As is visible from the data there is a large
presence of silicon but no aluminium is observed again showing the coating to be more silica-
like in nature The low level of magnesium detected suggests that the coating is relatively thick
(gt5 nm)
Table 618 Binding Energy of the Detected Element
Detected Element Binding Energy (eV) Approximate Composition (Atom )
O 5329 543
C 2847 102
Si 1036 338
Mg 499 13
Ca ~350 05
XRD
From the XRD results (Figure 622) we can clearly distingush the MgO and Au peaks (circles
and crosses resectively) in the untreated and coated samples However for the coated and
treated catalysts there are some other peaks in the figure which are unmarked A simple search
and match on this data suggests that the treaments impossed have led to a bulk hydroxylation
and the formation of Mg(OH)2 This explains the O increase in the treated MgO samples as
seen by EDX (Table 617) Again the gold peaks observed by XRD are very sharp showing the
152
presence of relatively large gold particles and no bulk structure is found for the coating
Figure 622 XRD Analysis for MgO Based Samples
o ndashMgO x - Au
153
Coated MgO in liquid phase reaction
MgO based catalysts were tested in the liquid phase reaction as shown in Table 619
Table 619 24 h 110ordmC 600 rpm 15 bar Oxygen 10 g n-decane 005 g Catalyst
Catalyst Conv
()
Selectivity ()
54
one
3
one
2
one
54
Ol
3
ol
2
Ol
1
ol
C5
OOH
C6
OOH
C7
OOH
C8
OOH
C9
OOH
C10
OOH
MgO 162 211 145 175 71 48 85 18 67 61 86 08 04
19
HCl
MgO 040 194 119 163
10
4 73
14
3 25 44 52 56 02 12
12
AuMgO 138 215 155 200 94 65
13
7 23 26 24 36 13 06
06
Coated
MgO 165 232 150 160 85 54 74 11 74 59 56 14 06
24
Coated
HCl
MgO 060 205 156 148 87 55 78 21 113 80 31 08 03
15
Coated
AuMgO 147 206 131 141 89 56 84 15 99 82 64 08 01
24
The high conversion that was observed for the coated SiO2 based catalysts was not observed
this time This is somewhat surprising as previously it appeared that the coating was promoting
the reaction but may be explained by the different nature of the coating In the next section the
coating on the MgO samples is analysed and it can be seen that no sodium is present (Table
617) unlike the SiO2 coated samples (Table 612)
Coated MgO in Gas Phase Reaction
Both the coated and treated MgO samples have been tested in the gas phase reactions (Table
620 to Table 624)
154
Table 620 Conversions obtained with different catalysts in the gas phase reactor when
varying the CO ratio
Catalyst Temp
(degC)
CO Conv
()
Cracked Decene C10
oxygenates
COx
MgO 318 141 27 97 1 00 2
MgO 318 71 17 97 1 00 2
AuMgO 275 141 11 96 1 00 3
AuMgO 275 71 08 97 1 00 1
Table 621 N2O oxidant 141 CO 089 n-decane 133 s residence time
Catalyst Temp
(degC)
X Cracked Decene C10
alcoholketones
CO
Coated MgO 239 03 76 52 00 19
282 04 84 43 00 11
305 06 94 24 00 4
327 13 96 14 02 2
Coated Acid
MgO
211 01 52 261 00 22
253 02 59 109 00 30
275 04 57 44 00 39
295 06 91 32 00 6
Coated
AuMgO
210 09 84 13 00 15
250 25 93 06 06 6
270 22 94 07 16 4
290 32 92 12 11 5
155
Table 622 - O2 oxidant 141 CO 089 n-decane 133s residence time
Catalyst Temp
(degC)
X Cracked Decene C10
alcoholketones
CO
Coated MgO 237 02 77 63 00 16
259 06 72 25 00 26
282 09 79 25 00 19
307 15 87 14 02 11
326 25 89 08 06 9
Coated Acid
MgO
209 01 70 177 00 13
230 02 78 84 00 13
251 04 83 59 00 11
275 06 94 00 00 6
293 20 94 16 03 4
Coated
AuMgO
208 05 41 25 00 57
229 04 93 24 00 5
249 11 71 07 00 28
270 20 85 21 06 12
295 37 97 27 02 0
Table 623 N2O oxidant 141 CO 089 n-decane 133 s residence time
Catalyst Temp
(oC)
X Cracked Decene C10
alcoholketones
CO
Treated MgO 238 03 90 49 00 5
260 09 96 16 00 2
282 19 97 08 05 1
306 47 97 07 03 2
329 84 97 06 09 1
Treated acid MgO 209 01 70 217 00 8
229 03 91 50 00 4
248 08 94 18 03 4
270 24 98 06 04 1
288 65 99 05 03 1
Treated AuMgO 211 05 94 29 00 3
249 11 91 14 00 8
252 23 95 07 00 5
274 48 97 04 01 2
294 95 97 02 02 2
156
Table 624 O2 oxidant 141 CO 089 n-decane 133 s residence time
Catalyst Temp
(oC)
X Cracked Decene C10
alcoholketones
CO
Treated MgO 238 08 90 35 00 7
260 17 90 22 13 6
283 31 94 29 22 1
304 47 92 26 29 2
Treated acid MgO 208 04 81 49 00 14
228 08 85 108 09 4
247 18 87 53 25 5
266 31 87 35 30 7
286 34 90 30 39 3
Treated AuMgO 212 11 87 14 00 12
232 26 87 08 00 13
252 46 91 13 01 8
274 70 92 13 02 7
293 82 93 13 05 6
6514 Discussion
The XRD results of MgO-based catalysts were quite similar to that of the SiO2-based catalysts
in which only the peaks of SiO2 substrate were detected for the coated samples Thus it can be
concluded the coating formed in the direct template-free method is perhaps some amorphous
SiO2 which according to the SEM images covered the substrates to an extent where the gold
was no longer observed by EDX Although the coating is probably SiO2 it is unlikely the
coatings formed on the SiO2 and MgO are the same due to the quite different appearance in the
characterization and the presence of sodium is absent from those on MgO
Combining all the liquid phase reaction results above it seems that instead of a zeolite coating
some other product is produced in the procedure And according to Table 612 the product
surprisingly seemed to be more active in decane oxidation As the phenomenon did not appear
157
again with the coated MgO based catalysts two proposals may be made based on this One is
if it is the same coating the activity should be not due to the coating only the other is the
coating formed on the SiO2 and MgO supports is not the same coating - perhaps some factors
influenced the coating formation which led to a different coating formed which can be proved
in the different appearance in the characterization in XRD Further investigation on this is given
in the following gas phase section
From these gas phase reaction results it can be seen that both the coated and treated catalysts
give an increased conversion in comparison to the untreated MgO-based systems Combined
with the characterization data this increase in activity is suggested to result from the conversion
of MgO to Mg(OH)2 In terms of selectivity for C10 oxygenated products the treated samples
show the best result followed by the coated and then the untreated It should be remembered
that these catalysts were tested under long residence times which was been shown to give
lower C10 oxygenation selectivity The best results are obtained with the acid-washed and then
the treated MgO which gave 39 selectivity at 34 conversion These selectivity increases
are not as high as had been hoped for so further development of the coating is required while
attempting to preserve the substrate in an unaltered form
6515 Conclusion
Although a significant increase of the C10 terminal selectivity was not found with any of the
powder formed coated catalysts it is notable that many catalysts show a high terminal
selectivity in the form of cracked acids As the oxidation of decane is viewed as a model
reaction for terminal products this probably has some promise as we can expect that a wide
range of terminally oxidized linear alkanes could be achieved
158
In this section SiO2 and MgO based catalysts were synthesised with a zeolite coating in which
the direct template-free zeolite membrane preparation method was employed From SEM EDX
XRD and XPS data it can be concluded that with this method the desired zeolite coating was
not obtained Instead an amorphous SiO2 overlayer was formed on the surface The direct
template-free method does not seem to produce the desired coating for our powder catalysts
Especially for the SiO2 based catalysts the SiO2 membrane formed not only on the surface of
catalyst substrates but also some excess that was not tethered to the surface
The coated samples do however show increased activity in both liquid and gas phase reactions
In the liquid phase the coated SiO2 based catalysts showed a conversion increase of 1-2
however the terminal selectivity is not affected As the coated SiO2 based catalysts have low
surface area (Table 4) it seems that the activity per unit area is quite high The treated MgO
based catalysts in the gas phase reactor showed some good activity The work now needs to
move on to study a system with an ordered pore structure
652 Zeolite A Coating with sphere support
From the previous experience the final product after a successful coating is a mixture of coated
samples extra zeolite and water Therefore with the powder form of supports such as silica
and alumina it is difficult to separate the coated samples from the mixture From a wide search
in the literature the conclusion is the same zeolite coatings were reported to be synthesized on
supports with big structures eg stainless steel cell or plate alumina spheres and silica spheres
In this section zeolite 4A coatings with alumina spheres have been tested The synthesis
procedure for the catalysts is described in the experimental section
159
6521 Results
Coatings on the alumina spheres have been carried on the alumina spheres without any active
centre only The alumina spheres have also been treated by the two different polyelectrolytes
coated in the same way and then used in reactions Figure 623 shows the surface of one of the
coated alumina spheres under the SEM According to the image there is a full coverage of
zeolite on the sphere while the pore structure is still clear
The coated alumina spheres were then used in the liquid phase reaction at 100degC for 16 h to
test the selectivity The reaction product distribution is shown in Table 625 and Figure 624
to Figure 626
Figure 623 Surface of the coated alumina spheres (treated by polydiallyl dimethyl
ammonium chloride)
160
Table 625 100degC 15 bar 10 g n-decane 3 Coated Al2O3 spheres 16 h
Catalyst Conv
()
Selectivity ()
54
one
3
one
2
one
54
ol
3
ol
2
ol
1
ol
C5
OOH
C6
OOH
C7
OOH
C8
OOH
C9
OOH
C10
OOH
Blank 018 229 144 158 76 49 78 13 125 43 61 08 05
12
1 014 190 119 166
10
1 71
11
3 21 162 20 28 05 03
02
2 007 158 108 184 97 69
12
0 22 197 09 18 06 04
06
1- Treated by polydiallyl dimethyl ammonium chloride
2- Treated by magnafloc lt35
There must be some differences between different spheres both in mass and coating status To
avoid problems caused by this the reactions have been repeated to confirm the results It was
found that the conversions of the reactions were between 010- 014 for the spheres treated
by polydiallyl dimethyl ammonium chloride and 007-011 for the spheres treated by
magnafloc The C10 terminal selectivity was always below 28
Figure 624 100degC 15 bar 10 g n-decane blank reaction 16 h
161
Figure 625 100degC 15 bar 10 g n-decane 3 coated Al2O3 spheres 16 h
Figure 626 100degC 15 bar 10 g n-decane 3 coated Al2O3 spheres 16 h
6522 Discussion and conclusion
From the results with the zeolite A coatings the conversion is almost the same as blank
162
reactions However the coatings changed the product distribution (Figure 624 to 626) as
compared to the blank reactions there is a definite increase in the selectivity for decanols
Generally the selectivity for the shortened acids decreased especially for the hexanoic acid and
heptanoic acid though the pentanoic acid increased For the terminal position there is not much
change in total conversion however the decanoic acid decreased This means the zeolite A does
not work for the primary position instead it seems it works in stopping the cracking in the
position 3 and 4 and helping the decanol production in these positions Probably the pore size
of the zeolite A (around 4 Aring) is a little bit small for the CH3 groups (around 43 Aring) while the
smaller group CH2 is more suitable in its pore size
According to the above results the zeolite 4A does not work for the terminal selectivity other
zeolites with larger pore sizes should be tried such as mordenite and silicalite-1
653 Silicalite-1 coating with sphere support
In this section silicalite-1 coating was applied to two different types of sphere supports the α-
alumina sphere (diameter 5 mm) and the γ-alumina sphere (diameter 2 mm) It is well known
the α-Al2O3 is a stable support for hydrothermal synthesis while -Al2O3 has less heat
resistance However -Al2O3 has a higher surface area (210 m2g) it is therefore possible to
load more active centres on it than on α-Al2O3 (082 m2g) which is an attractive advantage
6531 S1 coating with α-alumina spheres
01 wt Rhalumina sphere and 01 wt Aualumina sphere were treated as the procedure
described in the experimental section to synthesize silicalite-1 coated catalysts
163
Characterization
XRD analysis of the uncoated and coated samples was carried out to observe if the silicalite-1
layer was successfully synthesized The results can be found in Figure 627 and Figure 628
0 10 20 30 40 50 60 70 80 90
0
10000
20000
30000
40000
50000
60000
70000
80000
90000
Inte
ns
ity
2 Thetadegree
Uncoated RhAl2O
3
Uncoated AuAl2O
3
Coated RhAl2O
3
Coated AuAl2O
3
XRD analysis for uncoatedcoated samples
Figure 627 XRD analysis for the uncoated and coated samples
From Figure 627 it is observed that the uncoated Rh and AuAl2O3 (black and red in the figure)
show exactly the same peaks which were identified as matched α-Al2O3 No metal peaks were
found probably due to the very small metal particle size In comparison with the uncoated
samples the two coated samples (green and blue in the figure) showed very similar peaks
expect a few small peaks around 23deg These small peaks were searched and matched the MFI
pattern however it is not possible to distinguish between ZSM-5 and silicalite-1 A further
investigation with a more accurate scan between the 5deg and 40deg in the XRD was carried out
164
and the results are shown in Figure 628 In Figure 628 the major peaks of MFI are marked
with a cross These peaks were found to match the MFI peaks very well However as the
ZSM5 and silicalite-1 have very similar structures we can still not identify if it is silicalite-1
through the XRD results but an ordered structure was formed with the substrate catalysts
0 5 10 15 20 25 30 35 40 45
0
1000
2000
3000
4000
5000
6000
xxx
x
x
xxxx
x
Inte
ns
ity
2 Thetadegree
Coated RhAl2O
3
Coated AuAl2O
3
Further XRD analysis for coated Rh and AuAl2O
3 samples
Figure 628 Further XRD analysis for the coated samples
(x ndash MFI peaks o - α-Al2O3 peaks)
Table 626 shows the surface area change before and after coating Figure 629 shows the
morphology of the uncoated and coated spheres At the same magnification it was found that
after being coated the surface of catalyst spheres was covered by visible cubic particles which
are probably the accumulated silicalite-1 particles
165
Table 626 Surface area of the uncoated and coated catalysts
Catalyst Surface Area (m2g)
01 wt Rhα- Al2O3 spheres 1
Coated 01 wt Rhα- Al2O3 spheres 43
01 wt Auα- Al2O3 spheres 1
Coated 01 wt Auα- Al2O3 spheres 48
(a) 01 wt Auα-Al2O3 sphere
(b) Coated 01 wt Auα-Al2O3 sphere
Figure 629 Surface morphology of the uncoated and coated catalysts
166
Reaction
Although through the XRD results we cannot tell if the formed zeolitic material is ZSM5 or
silicalite-1 it is highly possible it is silicalite-1 as in the precursor there is no Al source the
only Al in this system comes from the alumina support which should be unable to dissolve in
the zeolitic material synthesis procedure Therefore in the following part we assume it is
silicalite-1 coated catalysts formed and call it the lsquoS1 coatedrsquo samples
The S1 coated samples were tested in the liquid phase reactions with n-decane at 110degC with
6h reactions The corresponding results are given in the Table 627
Table 627 110degC 15 bar 10 g n-decane 6 h 600 rpm 2 spheres Catalyst Conv
()
Selectivity ()
54
one
3
one
2 one 54
ol
3
ol
2
ol
1
ol
C5
OOH
C6
OOH
C7
OOH
C8
OOH
C9
OOH
C10
OOH
01
RhAl2O3
spheres 004 238 151 223 65 48 82 14 143 17 16 0 02
02
Coated
01
Rh Al2O3
spheres 012 244 162 215 51 35 58 13 136 36 36 03 10
02
01
Au Al2O3
spheres 012 142 129 196 77 54 88 18 188 46 53 03 02
04
Coated
01
Au Al2O3
spheres 016 269 176 241 53 33 51 11 70 43 41 03 01
09
From the results in the Table 627 it is difficult to gain much understanding of the performance
of the S1 coatings in the selective oxidation Comparing the conversions in Table 627 it can
be observed that both the samples with coatings obtained a higher conversion than those
without coating The two coated samples demonstrate a similar conversion which might be
167
caused by the coatings themselves instead of being caused from the active centres in the
substrate catalysts This may be due to the coated samples used in this trial having low activity
(as described earlier) therefore the activity of the coatings cannot be covered In comparison
with the decanone and decanol products it can be found that when without coatings the
selectivity for the decanone and decanols are very different for the Rh and Au catalysts
however after being coated the selectivity for these two kinds of products became similar to
each other This is further evidence that the activities performed observed in these two reactions
were caused by the coatings themselves However on the two different catalysts the coatings
which were analysed as the same type of coating in the XRD analysis showed different acid
selectivity especially for pentanoic acid and decanoic acid
6532 S1 coating with γ-alumina spheres
It is well known the α-Al2O3 is a stable support for hydrothermal synthesis while -Al2O3 has
less heat resistance However -Al2O3 has a higher surface area (210 m2g) it is therefore
possible to load more active centres on it than on α-Al2O3 (082 m2g) which is an attractive
advantage In this section the same coating synthesis procedure was again applied to the 3 wt
Au loaded smaller size γ-alumina spheres (diameter 2 mm) which have a surface area of 210
m2g Table 628 shows the surface area change before and after coating while Figure 630
shows the surface morphology of the uncoated and coated spheres Similar to the coating with
the α-Al2O3 sphere it was found that after being coated the surface of catalyst spheres was
covered by cubic particles which should be the accumulated silicalite-1 particles Further
characterization by SEM and EDX has been performed to check if the coating layers are
continuous and to determine their thickness (Figure 631 to Figure 633)
168
SEM and EDX mappings analyses were performed for the coated samples which indicated the
thickness of the silicalite-1 layer of approximately 6-8 m (Figure 631) In the mapping
images the silicon appears to be continuously distributed as a circle around the cross section of
the sphere (Figure 633)
Table 628 Surface area of the catalysts with and without coating
Catalyst Surface Area (m2g)
γ-Al2O3 spheres 210
3 Auγ-Al2O3 spheres 184
Coated 3 Auγ-Al2O3 spheres 124
169
(a) 3 wt Auγ-alumina sphere
(b) Coated 3 wt Auγ-alumina sphere
Figure 630 Surface morphology of the uncoated and coated catalysts
170
(a) The edge of 1 mm 01 AuAl2O3 (mag= 32 KX)
(b) The edge of coated samples in higher magnification (mag =1147 KX)
Figure 631 SEM images of the cross section of the S1 uncoated and coated 3 wt
Au-Al2O3 spheres
171
Figure 632 The edge of the coated samples in BSD detector
EDX analysis Au wt = 22
(a)An overall SEM image (b) Al (c) Si
(d) O (e) Au
Figure 633 EDX Mapping the cross section of the S-1 uncoated and coated 3
wtAu-Al2O3 spheres
172
Reaction
3 wt Auγ-Al2O3 catalysts before and after coating were used in the reactions for a 6 h run
as shown in Table 629
Table 629 110degC 15 bar 10 g n-decane 6 h 600 rpm 005 g catalysts (with γ-Al2O3
sphere)
Catalyst Conv
()
Selectivity ()
54
one
3
one
2
one
54
ol
3
ol
2
ol
1
ol
C5
OOH
C6
OOH
C7
OOH
C8
OOH
C9
OOH
C10
OOH
3
AuAl2O3
spheres 026 235 148 188 54 38 60 15 158 49 44 04 01
07
Coated
3
AuAl2O3
spheres 014 168 115 174 98 71 113 19 93 47 78 06 04
11
6533 Discussion and conclusion
The product distribution with the coated 3 wt Au γ-alumina spheres (Table 629) is different
from the results with the relatively bigger α-alumina spheres (Table 627) which probably
means the performance of this coated catalyst is not only the performance of the coating but
also that of the underneath catalyst This time the coating lowers the activity of the catalyst
with a small increase the terminal selectivity (though further experiments are needed to see if
this is within experimental error) in comparison with the uncoated catalyst the selectivity for
ketones goes down and for the decanols and acids all go up except the pentanoic acid again
However for the C10 terminal position the increase is minimal
Summarizing the section it can be concluded a 6-8 m thick continuous silicalite-1 coating
layer was successfully synthesized on the 3 wtAu-Al2O3 However the sample was not
found to work well as a teabag catalyst for the liquid phase oxidation of decane (Table 629)
173
which may due to the activity of the silicalite-1 in the liquid phase Therefore other zeolite
materials which are not active themselves in the liquid phase would be useful as coatings in
this study As reported in Iglesiarsquos work and our previous research the H+ form of the zeolite
is not active for the liquid phase reaction therefore zeolite A and ZSM-5 can be considered
possible options in the project Given the pore size requirement for the decane molecules it is
suggested that ZSM-5 should be the better option However the silicalite-1 coatings could still
be useful materials to test in the gas phase where silicalite-1 is not active
654 ZSM-5 coating with alumina sphere support
The synthesis of ZSM-5 coatings was carried out only with the alumina supports without any
metal loadings Experiments have been performed with both α- and -Al2O3 To develop the
optimized amount of the zeolite precursor solution for the hydrothermal synthesis different
volumes of solution with exactly the same molar composition have been used (32 ml and 15
ml) The results are shown below in sections for α- and -Al2O3 respectively
6541 ZSM-5 coating with α-Al2O3 spheres
With 32 ml zeolite precursor solution
Coverage of the coating was calculated by the weight of the coating per surface area of the
support (082 m2g) which was 00694 gm2 for this 32 ml zeolite precursor solution synthesis
as shown in Table 630 below However this is only a rough estimate as the weight change
might be slightly affected by deposition of non-crystalline material
Table 630 Coverage of the coating on the α-Al2O3 support (32 ml solution)
Support
Weight before
coated (g)
Weight after
coated (g)
Coverage
(gm2)
α-Al2O3 10491 11060 00694
174
With the normal scan by the XRD (Figure 634) it was found that the intensity of the coated
sample is much less than uncoated one this may be due to the coating or some crystallinity
may be lost during the synthesis Small ZSM-5 peaks are found in the diffractogram of the
coated α-Al2O3
10 20 30 40 50 60 70 80
0
5000
10000
15000
20000
25000
30000
35000
40000
45000
50000
55000
60000
65000
70000
75000
after
Normal Scan -Al2O
3 before and after coating
Inte
nsity
2 Thetadegree
before
after
(Intensity10)Z
Figure 634 Normal Scan α-Al2O3 before and after coating
z = likely ZSM-5 peaks
175
A low angle XRD scan for the coated samples showed more intense ZSM-5 peaks (Figure
635)
0 10 20 30 40 50 60
0
200
400
600
800
1000
1200
ZZ
Inte
nsity
2 Thetadegree
after coating
-Al2O
3
Low Angle Scan coated -Al2O
3
Z
Figure 635 Low angle scan coated α-Al2O3
The coated α-Al2O3 under the SEM showed that the morphology of the surface was not
homogeneous Some of the surface was covered with faceted micron-sized agglomerates while
other parts of the surface were covered by the deposition of nano-sized particles (Figure 636
and Figure 637)
EDX element mappings of the complete coated sphere and cross-sections of the coated sphere
were performed In Figure 638 as an example 638(a) is the original whole coated α-Al2O3
sphere 638(b) (c) and (d) are the distribution of Al Si and O respectively in the blue green
and white colour 638(e) is the mixture image of 638(b) (c) and (d) The mapping images of
the cross sections especially in Figure 639(c) showed the elements to be distributed as we
176
expected for a layer with a silicon circle around the edge of the sphere However from the
mixture image (Figure 38(e)) the elements do not appear to be distributed uniformly
Figure 636 Faceted micron-sized and nano-sized particles on the surface
Figure 637 Nano-sized particles
177
(a)An overall SEM image (b) Al (c) Si
(d) O (e) Mix
Figure 638 Mapping for a whole coated α-Al2O3 sphere
(a)A cross-section image (b) Al (c) Si
(d) O (e) Mix
Figure 639 Mapping for the cross-section of a coated α-Al2O3 sphere
With 15 ml zeolite precursor solution
The hydrothermal synthesis procedure was exactly the same as for the samples shown above
but with less zeolite precursor solution 15 ml The coverage of the coating with 15 ml zeolite
precursor solution was calculated again as before It was found that the coverage was 00693
178
gm2 (Table 631) Compared to the amount for the 32 ml solution synthesis (00694 gm2) the
coverage level was exactly the same This showed that the ability of spheres to load coatings
is limited and in both the two syntheses the maximum loading was reached
Table 631 Coverage of the coating on the α-Al2O3 support (15ml solution)
Support
Weight before
coated (g)
Weight after
coated (g)
Coverage
(gm2)
α-Al2O3 10486 11054 00693
With a low angle scan of the coated samples by XRD the main peaks of ZSM-5 are still visible
(Figure 640) which is similar to the 32 ml solution
0 10 20 30 40 50 60
0
400
800
1200
1600
2000
ZZ
Uncoated -Al2O
3
Inte
nsity
2 Thetadegree
Coated -Al2O
3
Low Angle Scan -Al2O
3 before and after coating
Z
Figure 640 Low angle scan α-Al2O3 before and after coating
In Figure 641 and Figure 642(a) there are clearly three different morphologies fluffy nano-
179
sized particles large faceted micron-sized particles and smaller micro-sized particles the larger
faceted micron-sized particles were also found in the results of the 32 ml solution synthesis It
appears as though the supports were fully covered However the thickness of the layer is
difficult to identify as in Figure 642(b)
The EDX element mapping showed a homogeneous silicon distribution over the support sphere
(Figure 643 (c)) However the mixture image did not show the element distribution to be
uniform (as for the 32 ml solution) this may due to the different particles having differing
compositions
Figure 641 Surface of the α-Al2O3 (mag = 130KX)
180
(a) Surface of the coated α-Al2O3 with a higher magnification (mag = 1178)
(b) Cross-section of the coated α-Al2O3 (mag = 16KX)
Figure 642 Morpology of the coated α-Al2O3 (mag = 130KX)
181
(a)An overall SEM image (b) Al (c) Si
(d) O (e) Mix
Figure 643 Mapping of a whole coated α-Al2O3 sphere
(a)A cross-section image (b) Al (c) Si
(d) O (e) Mix
Figure 644 Mapping of the cross-section of a coated α-Al2O3 sphere
According to the above characterization the ZSM-5 coating was successfully achieved on the
α-Al2O3 spheres although there were a few irregularly shaped faced micron sized particles
The next stage is to try to synthesize small crystals and a thinner layer ZSM-5
182
6542 ZSM-5 coating with -Al2O3 spheres
With 32 ml zeolite precursor solution
The coverage level of the coating was unable to be calculated as some of the support spheres
were found to be crushed after the hydrothermal synthesis This may be because the -Al2O3
heat resistance was reduced under the atmospheric conditions inside the autoclave However
in the previous synthesis of silicalite-1 layer (180degC) it was found that the 3 Au-Al2O3 was
much more stable as compared the blank -Al2O3 spheres used in the ZSM-5 synthesis (160degC)
In the XRD low angle scan no ZSM-5 peaks were found (Figure 645) This may be due to
the coating not forming or a thin coating layer which cannot be detected by XRD
0 10 20 30 40 50 60
0
400
800
1200
1600
2000
2400
2800
3200
after
before
Inte
nsity
2Thetadegree
Low Angle Scan -Al2O
3 before and after coating
Figure 2 Low angle scan -Al2O3 before and after coating
From the same autoclave the extra ZSM-5 powder was calcined separately with good heating
rate control and identified as ZSM-5 (Figure 646)
183
0 10 20 30 40 50 60
0
2000
4000
6000
8000
10000
12000
14000
16000
Inte
nsity
2 Thetadegree
Low Angle Scan the extra ZSM-5 in the autoclave
Figure 646 Low angle scan the extra ZSM-5 powders in the same batch with -Al2O3
The SEM images further confirmed there are no visible layers on the -Al2O3 surface It is
possible that a very thin layer or particles was synthesized that is below the detection limits of
the SEM therefore catalytic results are required to see if there is any change in product
distribution as compared with the un-treated -Al2O3 In Figure 647(b) residues of carbon
from the template are detected In the mapping images it looks as though the silicon distribution
is not a circle (Figure 648) however this could be an artefact due to the cutting of the spheres
in the sample preparation for the SEM scan
184
(a)
(b)
Figure 647 SEM images of the surface of coated -Al2O3
185
(a)A cross-section image (b) Al (c) Si
(d) O (e) Mix
Figure 648 Cross-section of a coated -Al2O3 sphere
With 15 ml zeolite precursor solution
The hydrothermal synthesis procedure was performed as for the samples shown above but
with a less zeolite precursor solution 15 ml
The coverage level of the coating was again unable to be calculated Low angle XRD revealed
the coated sample to be different from the 32 ml solution Several peaks in the measured
diffractogram (Figure 649) are similar to the main peaks of ZSM-5 (marked with lsquoorsquo)
however the main peaks (marked with lsquoxrsquo) in this are more likely to be from silicon dioxide
However the extra powder from the α- and - batches is similar and both are identified as ZSM-
5 after calcination (Figure 650) Combining all the XRD analyses it is reasonable to conclude
that -Al2O3 itself has an influence on the synthesis of coatings at its surface
186
0 10 20 30 40 50 60
0
400
800
1200
1600
2000
2400
2800
xxxx
x
ooCoated -Al
2O
3
Low Angle Scan -Al2O
3 before and after coating
Inte
nsity
2 Thetadegree
Uncoated -Al2O
3
o
x
Figure 649 Low angle scan uncoated and coated -Al2O3 surface
o ndash likely to be ZSM-5 x ndash might be silicon dioxide peaks
0 10 20 30 40 50 60
0
400
800
1200
1600
2000
2400
2800
3200Low Angle Scan the extra ZSM-5 in - and - batch
with -Al2O
3
Inte
nsity
2 Thetadegree
with -Al2O
3
Figure 650 Low angle scan the extra powders with α- and - batch
In the SEM images below (Figure 651) it is observed the coverage on the surface does not
look like the regular ZSM-5 particles The thick fluffy coating is probably silicon dioxide as
187
indicated from the more intense XRD peaks Silicon dioxide might not have the same desired
shape selectivity or radical scavenger properties as a zeolite
Figure 651 Surface of the coated γ-Al2O3
Figure 652 the cross-section of the coated γ-Al2O3
188
The element mapping (Figure 653 and Figure 654) below showed a homogeneous silicon
distribution both on the whole sphere and the cross-section images
(a)An overall SEM image (b) Al (c) Si
(d) O (e) Mix
Figure 653 Mapping of a whole coated -Al2O3 sphere
(a)A cross-section image (b) Al (c) Si
(d) O (e) Mix
Figure 654 Mapping of the cross-section of a coated -Al2O3 sphere
The two extra powders made from 15 ml precursor solutions (α- and -Al2O3) were observed
and found to be different as well (Figure 655) in the α-Al2O3 batch there are faceted micron-
189
sized particles while in the -Al2O3 batch the morphology looked the same as the coated -
Al2O3 surface
From all of the analyses of the coated -Al2O3 there is a large quantity of fluffy layers found
which are likely to be a kind of silicon dioxide The catalytic application of coated -Al2O3
may not be successful because of it Therefore it might not be a good option to use -Al2O3 for
the ZSM-5 coating
6543 Discussion
According to the above characterization the ZSM-5 coating was successfully achieved on the
α-Al2O3 spheres although there were a few irregularly shaped ZSM-5 crystals Coated γ-Al2O3
samples were found covered with a relatively large quantity of fluffy nano-sized particles
which are likely to be a type of silicon dioxide as detected by the XRD ZSM-5 particles may
be present as indicated by very weak XRD peaks but probably as a minority or with a very
small crystal sizes and therefore not detected by XRD The formation of different layers on the
α- and γ-Al2O3 may be because aluminum may leach from the support under the synthesis
conditions People reportedly to coat the γ-Al2O3 with a thin layer of mesoporous silica [26]
which will reduce the risk of crack formation due to stress under the synthesis conditions The
α and γ-Al2O3 supports clearly have an influence over the formation of coatings at their surface
190
(a) From the α-batch
(b) From the -batch
Figure 655 the morphology of the extra powders from the α-Al2O3 and -Al2O3 batches
191
655 Zeolite XY coating with silica spheres
6551 Results
The zeolite XY coated silica samples were characterized by XRF and XRD (provided by JM)
XRF results (Table 633) showed the silica to alumina ratio in the coated silica spheres and
zeolite powder from batch 1 and 2 The XRD results identified the samples as quartz and
cristabolite sample 2 as faujasite crystallite size 473 nm sample 3 as quartz and sample 4 as
faujasite crystallite size 508 nm
Table 633 XRF analysis results
Sample 1 Sample 2 Sample 3 Sample 4
Si content 4047 1864 4026 1850
Al content 263 1341 328 1339
Na content 079 1123 138 1113
Calculated Si content 00144 00066 00143 00066
Calculated Al content 00005 00025 00006 00025
Silica to alumina ratio 2956 267 2358 265
Sample 1 - Silica spheres from batch 1
Sample 2 - Zeolite powder from batch 1
Sample 3 - Silica spheres from batch 2
Sample 4 - Zeolite powder from batch 2
The two batches of zeolite XY coated silica spheres were tested in the hexane oxidation with
short (30 min) and longer (4 h) reaction times respectively The results were given in Table
634 As a comparison according to Table 635 the terminal selectivity in a blank reaction in
the same reaction time was 0 (30 min) and 4 (4 h)
192
Table 634 Zeolite X coated silica 130degC 3 bar O2 25 ml n-hexane 600 rpm
Reaction
Time
Conv
()
Selectivity ()
Ketones Alcohols Hexanoic acid Others 1-hexanol
Batch 1
30 min 003 43 42 0 19 16
4 h 029 17 20 0 63 6
Batch 2
30 min 004 36 40 0 22 13
4 h 060 11 21 0 68 7
Table 635 Blank reactions 130degC 3 bar O2 25 ml n-hexane 600 rpm single reaction
Reaction
Time
(h)
Conv
()
Selectivity ()
Ketones Alcohols Hexanoic acid Others 1-hexanol
05 0
4 0074 23 17 0 60 4
6552 Discussion
Comparing Table 634 with Table 635 it was found that the terminal selectivity was much
higher than the blank reaction especially for short reaction times In a 30 min reaction the
terminal selectivity was 16 with batch 1 which was even higher than the highest terminal
selectivity reported before (up to 13 ) with the zeolite A coated silica With a longer reaction
time while the terminal selectivity decreased to 6-7 the conversion was highly increased
The zeolite XY coated silica sample was active and selective which indicates the zeolite XY
coating works in the hexane oxidation
193
656 Zeolite A in hexane oxidation
In section 651 and 652 it was concluded that with 4Aring pore size zeolite A was not applicable
for the decane molecule to pass through However it is still worth trying in the smaller hexane
molecule oxidation In this section coated samples with different synthesis times or amounts
of supports were tested for hexane oxidation in the liquid phase For comparison some of the
silica spheres were treated at the same pH and then calcined The results of all the reactions are
given below in Table 636
Table 636 130degC 3 bar O2 25 ml n-hexane stir speed 2 single reaction (4 h) SiO2
spheres and 24 h1 g zeolite A coated SiO2 spheres
Catalyst Reactor Conv() Selectivity ()
Ketones Alcohols Acid Others 1-hexanol
silica C 038 20 13 0 67 5
Bases
treated
silica B 052 13 17 0 70 5
8 h
1g silica B 070 15 15 0 70 4
8 h
3g silica C 053 14 15 0 71 6
12 h
1g silica B 013 31 22 0 47 13
12 h
3g silica C 024 24 18 0 58 10
24 h1 g
silica B 061 14 12 1 73 4
From the above table the 12 h1 g batch shows some promise for terminal selectivity And
compared to the reaction result with only the silica sphere it appears that the conversion with
the coated sample was lower than with the silica spheres only This is equivalent to the teabag
technology principle Therefore the synthesis was repeated several times and tested again All
194
the results are given in Table 637
Table 637 130degC 3 bar O2 25 ml n-hexane stir speed 2 single reaction (4 h) SiO2
spheres and zeolite-A coated SiO2 spheres
Catalyst Reactor Conv() Selectivity ()
Ketones Alcohols Hexanoic
acid
Others 1-hexanol
Batch 1 B 026 17 14 1 68 7
Batch 2 B 013 31 22 0 47 13
Batch 3 B 011 28 23 0 49 11
Batch 4 B 046 12 13 0 75 5
Batch 5 B 050 10 12 0 78 5
It was found that some of the batches showed an interesting terminal selectivity Some of the
batches were analysed with XRD to check the structure of the samples From Figure 656 it
can be seen that the intensity ratios of first two major peaks are different for the three samples
Figure 657 is a standard XRD pattern for the zeolite A structure however our products appear
to have a additional peak at lower 2 Theta which does not seem to be from the zeolite A structure
all the other peaks observed are also present in the zeoltie A structure The source of the first
strong peak is unknown However the ratio between the first and second peak changed in the
three batches It is notable that the batch 3 which showed 11 terminal selectivity has a quite
different 1st2nd peak ratio from the others
195
0 10 20 30 40 50 60
0
500
1000
1500
2000
2500
3000
3500
4000
4500
5000
5500
Inte
nsity
2 Thetadegree
batch 5
batch 4
batch 3
Figure 656 XRD analysis for three batches of 12 h synthesized zeolite A powder
Figure 657 The standard XRD pattern of zeolite A [27]
8
OOH
196
66 Conclusions
This chapter showed the most focused work in this research in which different types of zeolites
and zeolitic material coatings were synthesized onto substrate catalysts including zeolite 4A
silicalite-1 ZSM-5 zeolite XY Characterization and catalytic tests were performed
correspondingly with n-decane or n-hexane
Application of zeolite A coating with silica powder support did not produce a significant
increase of the C10 terminal selectivity but many catalysts show a high terminal selectivity in
the form of cracked acids This probably has some promise as it can be expected that a wide
range of terminally oxidized linear alkanes could be achieved SiO2 and MgO based catalysts
coated by a direct template-free zeolite membrane preparation method was concluded not with
the desired zeolite coating Instead an amorphous SiO2 overlayer was formed on the surface
However the coated samples do show increased activity in both liquid and gas phase reactions
In the liquid phase the coated SiO2 based catalysts showed a conversion increase by 1-2
however the terminal selectivity is not affected As the coated SiO2-based catalysts have low
surface area (Table 4) it seems that the activity per unit area is quite high The treated MgO-
based catalysts in the gas phase reactor showed some good activity
Zeolite A coated alumina catalysts showed a C10 terminal selectivity always below 28 with
the conversion of reactions between 007 - 014 The conversion is almost equivalent to the
blank reactions However the coatings changed the product distribution (Figure 624 to 626)
as compared to the blank reactions Generally the selectivity for the shortened acids decreased
especially for the hexanoic acid and heptanoic acid though the pentanoic acid increased For
the terminal position there is not much change in total however the decanoic acid decreased
197
while the selectivity for decanols increased slightly by 1 This means that the zeolite A does
not work for the primary position instead it seems it works in stopping the cracking in the
position 3 and 4 and helping decanol production in these positions Probably the pore size of
the zeolite A (around 4 Aring) is a little bit small for the CH3 groups (around 43 Aring) while the
smaller group CH2 is more suitable in its pore size
Silicalite-1 coating was applied to both α- and γ-alumina sphere supports with Rh or Au metal
loaded as the active centres It can be concluded that a 6-8 microm thick continuous silicalite-1
coating layer was successfully synthesized on the 3Auγ-Al2O3 However the sample was
not found to work well as a teabag catalyst for the liquid phase oxidation of decane (Table
629) The terminal selectivity change was minimal This may due to the activity of the
silicalite-1 in the liquid phase
ZSM-5 coating was successfully achieved on the α-Al2O3 spheres although there were a few
irregularly shaped ZSM-5 crystals Coated γ-Al2O3 samples were found covered with a
relatively large quantity of fluffy nano-sized particles which are likely to be a type of silicon
dioxide as detected by the XRD ZSM-5 particles may be present as indicated by very weak
XRD peaks but probably as a minority or with a very small crystal sizes and therefore not
detected by XRD The formation of different layers on the α- and γ-Al2O3 may be because
aluminum may leach from the support under the synthesis conditions It was found that the α
and γ-Al2O3 supports clearly have an influence over the formation of coatings at their surface
Zeolite X and Y coated silica catalysts tested with n-hexane liquid phase oxidation showed
much higher terminal selectivity than the blank reaction especially with a short reaction time
198
In a 30 min reaction the terminal selectivity was 16 while the terminal selectivity for the
blank reactions was 0-9 With a longer reaction time the terminal selectivity decreased to 6-
7
Zeolite 4A coated silica spheres were also found to work in raising the terminal selectivity in
hexane liquid phase oxidation A stable 1-hexanol selectivity of gt4 was observed with 4 h
reaction It was also observed that the synthesis time of the coating affected the reaction With
a coating synthesis time of 12 h the maximum 1-hexanol selectivity could reach 13
67 References
[1] N van der Puil FM Dautzenberg H van Bekkum JC Jansen Microporous and
Mesoporous Materials 27 (1999) 95
[2] Collier Paul John Golunskin Stanislaw Edmund US Patent No0032628 2005
[3] RN Devi FC Meunier T Le Goaziou C Hardarcre PJ Collier SE Golunski LF
Gladden MD Mantle Journal of Physical Chemistry C 112(29) (2008) 10968
[4] ER Geus AE Jansen J Schoonman H van Bekkum Catalysis and Adsorption by
Zeolites Studies in Surface Science and Catalysis vol65 Elsevier Amsterdam ( 1991) 451
[5] M Matsukata Chemical Communications (1996) 1441
[6] P Wenqin SUeda and MKoizumi Proceedings of the 7th International Zeolite Conference
(Eds Y Murakami A Lijima and JWWard) Elsevier Tokyo (1986) 177
[7] L Gora K Streletzky RW Thompson GDJ Phillies Zeolites 18 (1997) 119
[8] T Cetin M Tatlier A Erdem-Senatalar U Demirler M Urgen Mircoporous and
Mesoporous Materials 47 (2001) 1
199
[9] O Andac SM Telli M Tatlier A Erdem-Senatalar Microporous and Mesoporous
Materials 88 (2006) 72
[10] Z Zhou J Yang Y Zhang L Chang W Sun J Wang Separation and Purification
Technology 55 (2007) 392
[11] Z Wang J Hedlund J Sterte Microporous and Mesoporous Materials 52 (2002) 191
[12] M Tatlier MDemir BTokay AErdem-Senatalar LKiwi-Minsker Microporous and
Mesoporous Materials 101 (2007) 274
[13] JC Jansen JH Koegler H van Bekkum HPA Calis CM van den Bleek F Kapteijn
JA Moulijn ER Geus N van der Puil Microporous and Mesoporous Materials 21 (1998)
213
[14] H Kalipcilar A Culfaz Microporous and Mesoporous Materials 52 (2002) 39
[15] K Aoki K KusakabeSMorooka Journal of Membrane Science 141 (1998) 197
[16] P Collier S Golunski C Malde J Breen R Burch Journal of the American Chemistry
Society 125 (2003) 12414
[17] N Nishiyama K Ichioka D Park Y Egashira K Ueyama L Gora W Zhu F Kapteijn
JA Moulijn Industrial Engineering Chemistry Research 43 (2004) 1211
[18] J Park BC Kim SS Park HC Park Journal of Materials Science Letters 20 (2001)
531
[19] Y Yan ME Davis GR Gavalas Industrial Engineering Chemistry Research 34 (1995)
1652
[20] BJ Schoeman A Erdem-Senatalar J Hedlund J Sterte Zeolites 19 (1997) 21
[21] ER Genus Hvan Bekkum Zeolites 15(4) (1995) 333
[22] F Jareman C Andersson J Hedlund Microporous and Mesoporous Materials 79 (2005)
1
200
[23] P Siva Sankar Reddy N Pasha MGV Chalapathi Rao N Lingaiah I Suryanarayana
PS Sai Prasad Catalysis Communications 8 (2007) 1406
[24] DC Vu M Miyamoto N Nishiyama S Ichikawa Y Egashira K Ueyama
Microporous and Mesporosous Materials 115 (2008) 106
[25] B Modeacuten B Zhan J Dakka J G Santiesteban E Iglesia Journal of Physical
Chemistry 111 (2007) 1402
[26] MR Othman SC Tan S Bhatia Microporous and Mesoporous Materials
121 (2009) 138
[27] Web database of zeolites httpwwwiza-structureorgdatabases
201
CHAPTER 7
Conclusions
202
CONCLUSIONS
This thesis describes the searching preparation characterization and catalytic evaluation of
active catalysts for the terminal selectivity of long chain linear alkanes The focus of the thesis
is the preparation characterization and catalytic evaluation of the shape-selective materials
including the organic material cyclodextrins and the inorganic materials zeolite and zeolitic
membranes Prepared catalysts were performed with n-decane or n-hexane as models to
produce the terminal products 1-decanol 1-hexanol decanoic acid and hexanoic acid The
conclusions of the research to date were summarized as follows
Firstly the studies with the Andrews glass reactor were presented for the purpose of reproducing
the best selective results available in the literature published by Thomas [1-4] and Iglesia [5 6]
for the oxidation of n-hexane in liquid phase However Thomas et al did not calculate the
autoxidation with the ALPO catalysts Iglesiarsquos work was more crucial in this area The time
on-line blank reaction results showed similar terminal selectivities to Iglesiarsquos work in
autoxidation with the terminal selectivity stable at 5-9 However the terminal selectivity
with Mn-ZSM5 was still very low (~0) Iglesiarsquos high terminal selectivity with Mn-ZSM5
could not be reproduced
A comparison between the Andrews glass reactor and the Parr stainless steel reactor showed
that the autoxidation reactions performed higher conversion but lower terminal selectivity in
the stainless steel reactor than the glass reactor which indicates the stainless steel reactor itself
may have some activity in the oxidation reaction
203
Various catalysts have been evaluated for decane oxidation in the project eg 5 wt AuTiO2
25 wt Au - 25 wt PdSiO2 Most of the catalysts showed very low conversion and very
poor terminal selectivity Increasing the temperature leads to higher conversion but results in
more cracked products and less selectivity for oxygenated C10 products Figure 71 showed the
activity of the auto-oxidation and the activity of a range of catalysts It was found that the most
active catalyst was 5 wt AuTiO2 However these catalysts did not show good terminal
alcohol selectivity (lt3) whereas the cracked acid selectivity was high (320)
Figure 71 ndash Conversion with different catalysts (reaction conditions 110oC 10 g n-
decane 005 g catalyst 15 bar O2 600 rpm stainless steel reactor)
Cyclodextrins were investigated as an organic shape-selective material to coat the AuSiO2
catalysts in Chapter 5 Addition of CDs alone without the catalyst decreased the conversion
but no trend in terminal selectivity was observed With the CD covered AuSiO2 catalyst a
decrease in conversion has been observed compared to the blank reaction however the changes
in terminal selectivities are still limited (1-2) and considered to be within the experimental
errors To conclude the CD covered catalysts which were prepared by the direct impregnation
method did not play an important role in increasing the terminal selectivity
204
Finally the most important studies in the thesis was the synthesis of different types of zeolite
coatings onto substrate catalysts which was the so called lsquoteabag technologyrsquo Zeolite 4A
silicalite-1 ZSM-5 zeolite XY were successfully synthesized Characterization and catalytic
evacuations were performed correspondingly with n-decane or n-hexane
Application of zeolite A coating with silica powder support did not produce a significant
increase of the C10 terminal selectivity but many catalysts show a high terminal selectivity in
the form of cracked acids This probably has some promise as it can be expected that a wide
range of terminally oxidized linear alkanes could be achieved SiO2 and MgO based catalysts
coated by a direct template-free zeolite membrane preparation method was concluded not with
the desired zeolite coating Instead an amorphous SiO2 overlayer was formed on the surface
However the coated samples do show increased activity in both liquid and gas phase reactions
In the liquid phase the coated SiO2-based catalysts showed a conversion increase by 1-2
however the terminal selectivity is not affected As the coated SiO2-based catalysts have low
surface area it seems that the activity per unit area is quite high The treated MgO based
catalysts in the gas phase reactor showed some good activity
Zeolite A coated alumina catalysts showed a C10 terminal selectivity was always below 28
with the conversion of reactions between 007 - 014 The conversion is almost equivalent
to the blank reactions However the coatings changed the product distribution (Figure 624 to
626) as compared to the blank reactions Generally the selectivity for the shortened acids
decreased especially for the hexanoic acid and heptanoic acid though the pentanoic acid
increased For the terminal position there is not much change in total however the decanoic
205
acid decreased while the selectivity for decanols increased slightly by 1 This means the
zeolite A does not work for the primary position instead it seems it works in stopping the
cracking in positions 3 and 4 and helping the decanol production in these positions Probably
the pore size of the zeolite A (around 4 Aring) is a little bit small for the CH3 groups (around 43
Aring) while the smaller group CH2 is more suitable in its pore size
Silicalite-1 coating was applied to both α- and γ-alumina sphere supports with Rh or Au metal
loaded as the active centres It can be concluded that a 6-8 microm thick continuous silicalite-1
coating layer was successfully synthesized on the 3Auγ-Al2O3 However the sample was
not found to work well as a teabag catalyst for the liquid phase oxidation of decane (Table
629) The terminal selectivity change was minimal This may due to the activity of the
silicalite-1 in the liquid phase
ZSM-5 coating was successfully achieved on the α-Al2O3 spheres although there were a few
irregularly shaped ZSM-5 crystals Coated γ-Al2O3 samples were found covered with a
relatively large quantity of fluffy nano-sized particles which are likely to be a type of silicon
dioxide as detected by the XRD ZSM-5 particles may be present as indicated by very weak
XRD peaks but probably as a minority or with a very small crystal sizes and therefore not
detected by XRD The formation of different layers on the α- and γ-Al2O3 may be because
aluminum may leach from the support under the synthesis conditions It was found that the α
and γ-Al2O3 supports clearly have an influence over the formation of coatings at their surface
Zeolite X and Y coated silica catalysts tested with n-hexane liquid phase oxidation showed
much higher terminal selectivity than the blank reaction especially with a short reaction time
206
In a 30 min reaction the terminal selectivity was 16 while the terminal selectivity for the
blank reactions was 0-9 With a longer reaction time the terminal selectivity decreased to 6-
7
Zeolite 4A coated silica spheres were also found to work in raising the terminal selectivity in
hexane liquid phase oxidation A stable 1-hexanol selectivity of gt4 was observed with a 4 h
reaction It was also observed that the synthesis time of the coating affected the reaction With
the coating synthesis time of 12 h the maximum 1-hexanol selectivity could reach 13
References
[1] JM Thomas R Raja G Sankar R G Bell Studies in Surface Science and Catalysis 130
(2000) 887
[2] R Raja G Sankar JM Thomas Angewandte Chemistry 39 (2000) 231
[3] JM Thomas R Raja G Sankar RG Bell Accounts of Chemical Research 34 (2001)
191
[4]R Raja JM Thomas Journal of Molecular Catalysis A 3 (2002) 181
[5] B Modeacuten B Zhan J Dakka J G Santiesteban E Iglesia Journal of Physical Chemistry
111 (2007) 1402
[6] B Zhan B Modeacuten J Dakka JG Santiesteban E Iglesia Journal of Catalysis 245 (2007)
316