Tea Annual Report 2018 RA Program - Rainforest AllianceTea Annual Report 2018 - RA Program...
25
Tea Annual Report 2018 RA Program May 2019
Transcript of Tea Annual Report 2018 RA Program - Rainforest AllianceTea Annual Report 2018 - RA Program...

Tea Annual Report 2018
RA Program
May 2019

2
Introduction
The main goal of this report is to present the scope and scale of the RA tea program
in 2018 – calendar year. The report is written in order to inform our stakeholders and is
part of our commitment to transparency.
The report focuses on the key indicators related to:
o Program reach: RA tea production and multi-certification of this production
o Market uptake: sales of RA tea
This report is part of the Rainforest Alliance monitoring and evaluation system. Most of
the data in this report is collected via our traceability systems.
We do our best to make sure that all of the information in this report is accurate and
reliable, but as much of the data is collected by third parties, we are aware that
there may be some shortcomings.
We look forward to receiving your feedback. For more information, please contact
the Farm & Supply Chain Intelligence Department at [email protected]
Tea Annual Report 2018 - RA Program

Reach RA tea program
Estimated production
Multi-certification
Global Sales
Supply and Demand trend

Reach RA Tea program
Tea Annual Report 2018 - RA Program

5
Geographical reach
Latin AmericaArgentina
Ecuador AfricaEthiopia
Kenya
Malawi
Mozambique
Rwanda
Tanzania
Uganda
Zimbabwe
Asia-PacificAustralia
Bangladesh
China
India
Indonesia
Japan
Nepal
Sri Lanka
Turkey
Viet Nam
In 2018, 427 Certificate Holders in 20 different countries across the globe are part
of the RA Tea Program

Program reach
▪ 8 % increase in Certificate Holders (from 397 to 427)▪ 0.10 % decrease in the number of producers (Similar numbers between 2017 and 2018)
+ 8%+ 8%
Tea Annual Report 2018 - RA Program6
Producers represents the number of individual farmers included in the scope of a certificate.
Certificate Holders refers to the number of certificates. Each certificate could be made of multiple individual farmers.
Production Ha is the Certified production area of the Certificate scope
Area (ha) Number of certificate holders Number of producers
Relative change
2017-2018:- 0.1%

8%Relative growth 2017-2018
8%Relative growth 2017-2018
7
Program reach
# certificate holders
427# producers
878,182Area (hectare)
593,481
▪ 8 % increase in Certificate Holders (from 397 to 427)▪ 0.10 % decrease in the number of producers (Similar numbers between 2017 and 2018)
0.1%Relative growth 2017-2018
Producers represents the number of individual farmers included in the scope of a certificate.
Certificate Holders refers to the number of certificates. Each certificate could be made of multiple individual farmers.
Production Ha is the Certified production area of the Certificate scopeTea Annual Report 2018 - RA Program

8
Number of producers per country
Others includes : Zimbabwe, Nepal, Argentina, Uganda, Japan, Taiwan, Bangladesh, Ethiopia, Australia, Ecuador, Mozambique
▪ On December 31st 2018, no valid certificates in Burundi, which explains the decrease▪ In Sri Lanka, 3 important groups (13.681 producers in total) had their certificate cancelled
Relative change
(2017-2018)
Tea Annual Report 2018 - RA Program
+7% -100% 8% 4% -1% 6% 12% -42% 15% -26% 0% 53%
9
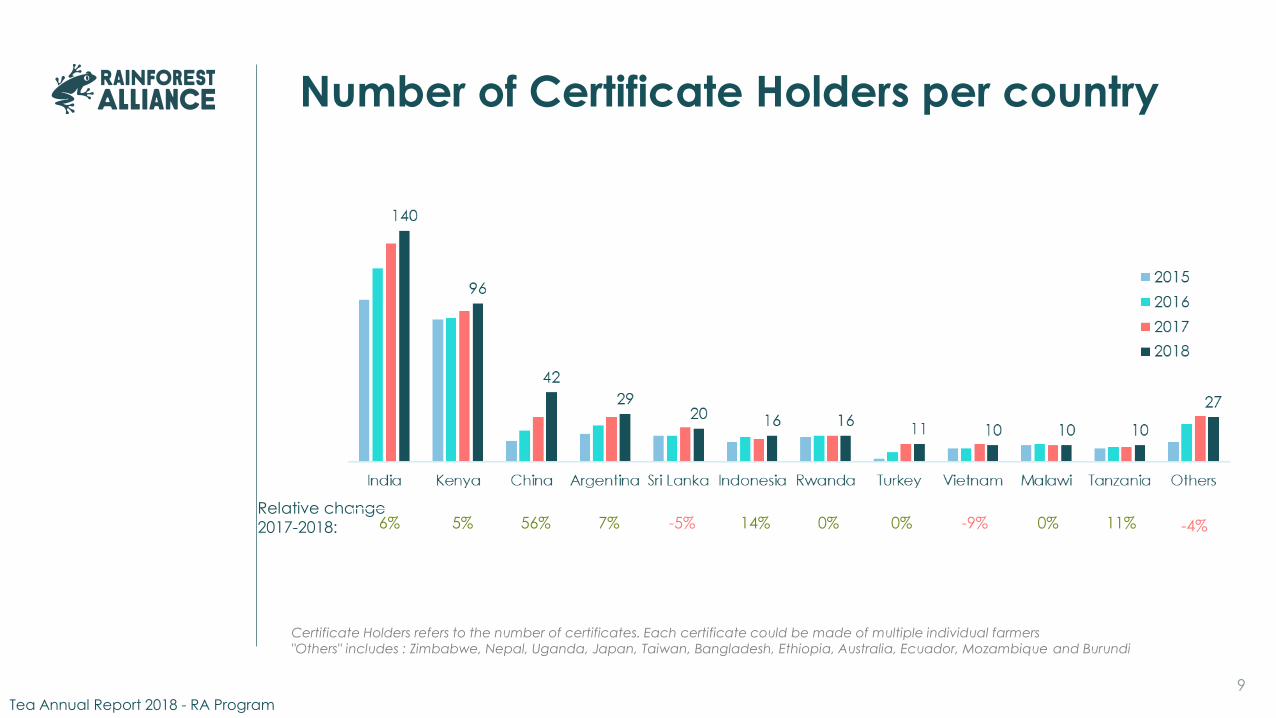
Number of Certificate Holders per country
Relative change
2017-2018:
Tea Annual Report 2018 - RA Program
6% 5% 56% 7% -5% 14% 0% 0% -9% 0% 11% -4%
Certificate Holders refers to the number of certificates. Each certificate could be made of multiple individual farmers
"Others" includes : Zimbabwe, Nepal, Uganda, Japan, Taiwan, Bangladesh, Ethiopia, Australia, Ecuador, Mozambique and Burundi

10
Number of Certificate Holders Other countries
Relative change
2017-2018:
Tea Annual Report 2018 - RA Program
17% 25% 33% 0% 0% 0% 0% 0% 0% 0% -100%
Certificate Holders refers to the number of certificates. Each certificate could be made of multiple individual farmers

Producer’s estimated production
Tea Annual Report 2018 - RA Program
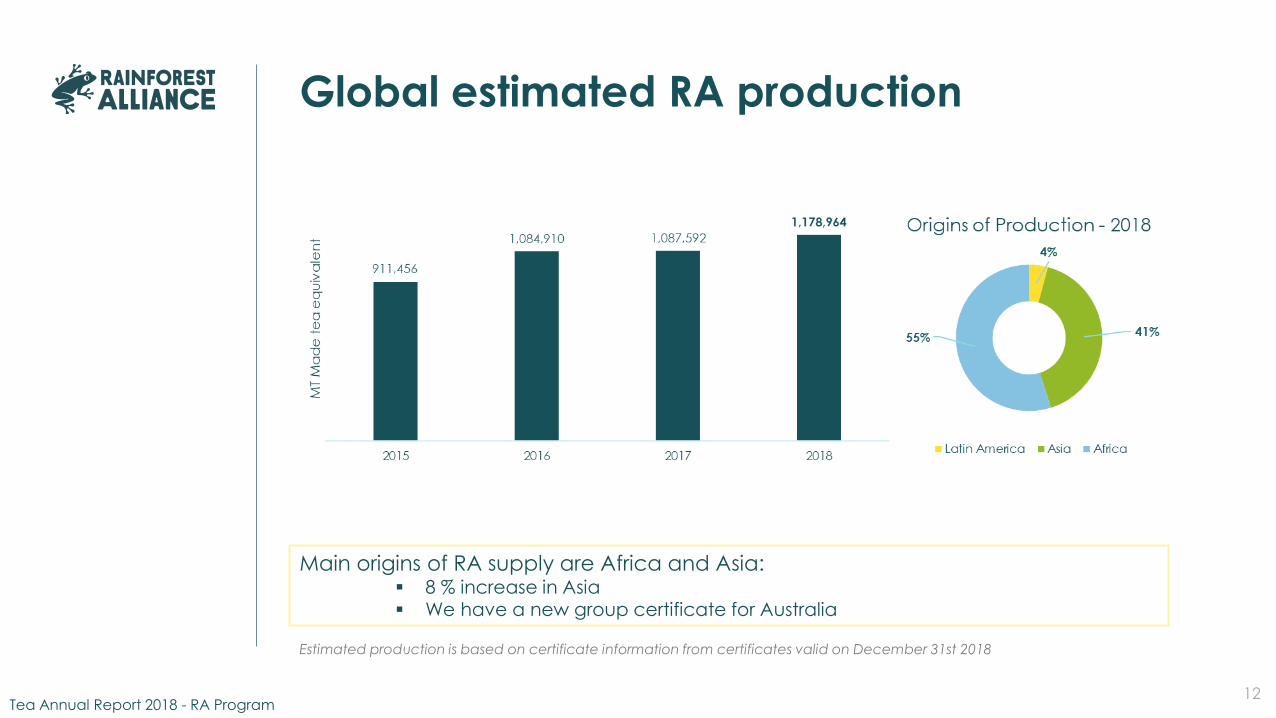
Global estimated RA production
Estimated production is based on certificate information from certificates valid on December 31st 2018
Main origins of RA supply are Africa and Asia:▪ 8 % increase in Asia▪ We have a new group certificate for Australia
Tea Annual Report 2018 - RA Program12

Estimated production per country
Others includes: Vietnam, Zimbabwe, Bangladesh, Burundi, Ethiopia, Ecuador, Japan, Mozambique, Australia, Nepal and Taiwan
Estimated production is based on certificate information from certificates valid on December 31st 2018
Relative change
2017-2018:
Tea Annual Report 2018 - RA Program13
12% 5% 8% -14% 5% 7% 85% 2% 21% 17% 32% -10%
▪ Decrease in Sri Lanka due to cancellation of 3 certificates

Estimated production per country
Others includes: Vietnam, Zimbabwe, Bangladesh, Burundi, Ethiopia, Ecuador, Japan, Mozambique, Australia, Nepal and Taiwan
Estimated production is based on certificate information from certificates valid on December 31st 2018
Tea Annual Report 2018 - RA Program14
▪ Decrease in Sri Lanka due to cancellation of 3 certificates

Multi-certification
Tea Annual Report 2018 - RA Program

Multi-certification
17Tea Annual Report 2018 - RA Program
Multi-certified represents the number of Rainforest Alliance Tea certificate holders that were also certified for one or more of the following schemes: Fairtrade; UTZ; Organic are included in the analysis.Other certifications include: ISO (2004, 2200, 9001, 2008, 14000, 14001) , ETP, Halal, HACCP, Trustea, SAS, SNI, OSHA, Occupational Helat & Safety, VietGap
• Combination with UTZ still the most common

Global sales
Tea Annual Report 2018 - RA Program
19
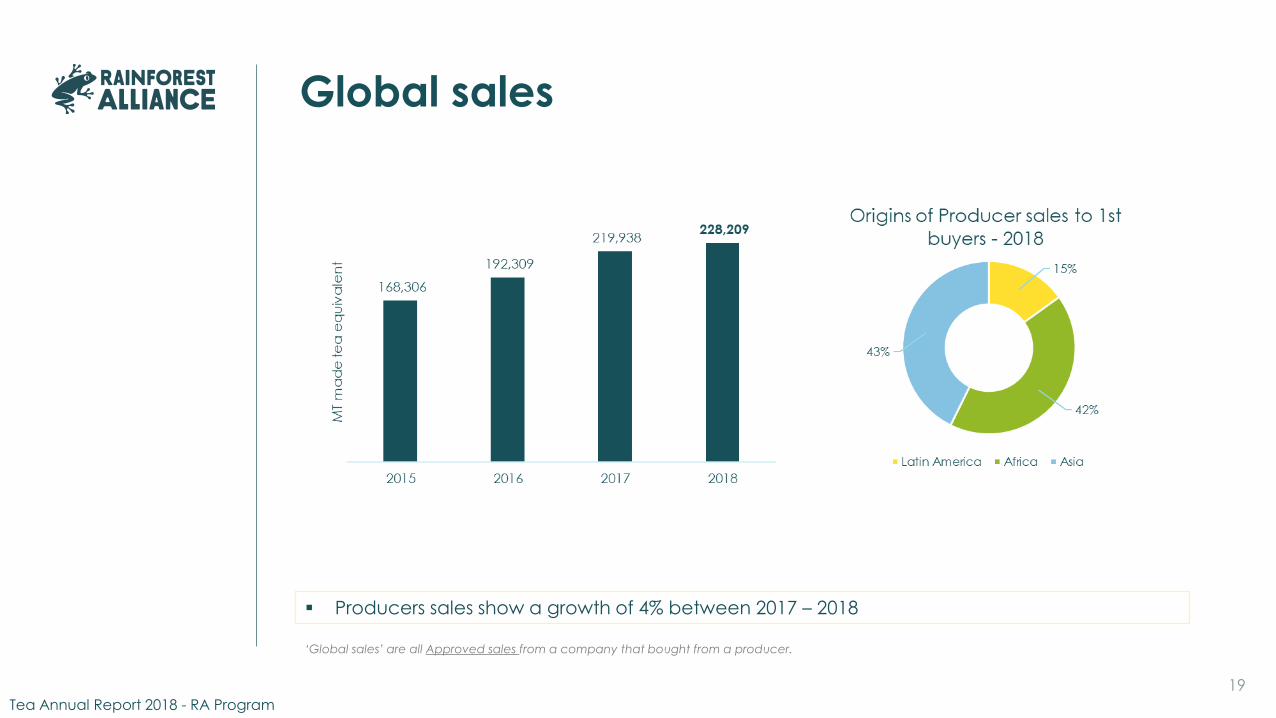
Global sales
▪ Producers sales show a growth of 4% between 2017 – 2018
‘Global sales’ are all Approved sales from a company that bought from a producer.
Tea Annual Report 2018 - RA Program

*Others includes: Bangladesh,Burundi,South Africa,Japan,Ethiopia,Australia,Taiwan,Mozambique,Ecuador,Nepal.‘Global sales’ are all approved sales from a company that bought from a producer.*Volumes include only made tea
Global sales
Relative
change
2017-2018:
20Tea Annual Report 2018 - RA Program
23% 14% 23% -20% 85% -9% -16% -44% 75% -53% 4% -10% 16% 78%

*Others includes: Bangladesh,Burundi,South Africa,Japan,Ethiopia,Australia,Taiwan,Mozambique,Ecuador,Nepal.‘Global sales’ are all approved sales from a company that bought from a producer.*Volumes include only made tea
Global sales
21Tea Annual Report 2018 - RA Program

Supply and Demand trend
Tea Annual Report 2018 - RA Program

Supply-demand trend
27Tea Annual Report 2018 - RA Program
% of estimated production sold as RA

Supply-demand trend by region
28Tea Annual Report 2018 - RA Program

rainforest-alliance.orgDe Ruyterkade 6
1013 AA, Amsterdam,
The Netherlands
233 Broadway, 28th Floor
New York, NY 10279
USA