TDWI Self-Service Analytics Maturity Model Guide...2 TDWI RESEARCH TDWI Self-Service Analytics...
21
TDWI Self-Service Analytics Maturity Model Guide Interpreting Your Assessment Score 2017 By Fern Halper
Transcript of TDWI Self-Service Analytics Maturity Model Guide...2 TDWI RESEARCH TDWI Self-Service Analytics...

TDWI Self-Service Analytics Maturity
Model GuideInterpreting Your Assessment Score
2017
By Fern Halper

Research Sponsors
Research Sponsors

tdwi.org 1
TDWI RESEARCH
© 2017 by TDWI, a division of 1105 Media, Inc. All rights reserved. Reproductions in whole or in part are prohibited except by written permission. Email requests or feedback to [email protected].
Product and company names mentioned herein may be trademarks and/or registered trademarks of their respective companies. Inclusion of a vendor, product, or service in TDWI research does not constitute an endorsement by TDWI or its management. Sponsorship of a publication should not be construed as an endorsement of the sponsor organization or validation of its claims.
This report is based on independent research and represents TDWI’s findings; reader experience may differ. The information contained in this report was obtained from sources believed to be reliable at the time of publication. Features and specifications can and do change frequently; readers are encouraged to visit vendor websites for updated information. TDWI shall not be liable for any omissions or errors in the information in this report.
By Fern Halper
Table of ContentsTable of Contents 1
About the Author 2
About TDWI Research 2
Sponsors 2
Foreword from the Author 3
What Is Self-Service Analytics and Why Is It Important? 4
Trends in Self-Service Analytics 4
Value of a Self-Service Maturity Model 6
Model Dimensions 6
Stages of Maturity 8
Stage One: Analytics Stagnation and Isolation 8
Stage Two: Business Self-Service Emerges 9
The Inflection Point 10
Stage Three: Collaboration Expands 12
Stage Four: Maturity Builds 13
Stage Five: Culture of Insight and Action 14
Evaluating Benchmark Scores 15
Scoring 15
Interpretation 16
Summary 17
TDWI Self-Service Analytics Maturity Model GuideInterpreting Your Assessment Score
2017

2 TDWI RESEARCH
TDWI Self-Service Analytics Maturity Model Guide
About the AuthorFERN HALPER is vice president and senior director of TDWI Research for advanced analytics. She is well known in the analytics community, having been published hundreds of times on data mining and information technology over the past 20 years. Halper is also coauthor of several Dummies books on cloud computing and big data. She focuses on advanced analytics, including predictive analytics, text and social media analysis, machine learning, AI, cognitive computing, and big data analytics approaches. She has been a partner at industry analyst firm Hurwitz & Associates and a lead data analyst for Bell Labs. Her Ph.D. is from Texas A&M University. You can reach her by email ([email protected]), on Twitter (twitter.com/fhalper), and on LinkedIn (linkedin.com/in/fbhalper).
About TDWI ResearchTDWI Research provides research and advice for data professionals worldwide. TDWI Research focuses exclusively on data management and analytics issues and teams up with industry thought leaders and practitioners to deliver both broad and deep understanding of the business and technical challenges surrounding the deployment and use of data management and analytics solutions. TDWI Research offers in-depth research reports, commentary, inquiry services, and topical conferences as well as strategic planning services to user and vendor organizations.
SponsorsMicroStrategy sponsored the research for this TDWI Guide and its accompanying Interactive Assessment Tool.

tdwi.org 3
Foreword
Foreword from the Author Organizations are excited about self-service analytics—to help reduce time to insight, react to changing business conditions, better understand customers, improve operational efficiencies, and more. Most people think of visual analytics—discovering insights using visualizations to explore data from different perspectives—when they think of self-service analytics. However, self-service has evolved to include other aspects of the analytics life cycle, such as preparing data and automating the building of predictive models. Vendors are working on making their tools ever easier to use—providing intuitive graphical interfaces and intelligence inside the software to help guide even nontechnical users to insight more rapidly.
TDWI research indicates that although a majority of organizations have adopted visual analytics for use by BI and other analytics professionals, the technology may not have spread widely within these companies. In other words, the use of self-service by business users is not yet pervasive. However, many seek democratization of analytics because of the advantages it can provide, particularly in lessening time to value and helping those in an organization gain insight.
Of course, analytics maturity of any kind is more than adoption. Analytics maturity is about the evolution of an organization to integrate, manage, and leverage all relevant internal and external data sources into key decision points. Likewise, self-service analytics maturity is not just about the technology. It also includes the cultural and organizational processes that enable companies to become more data-driven. This includes having organizational structures as well as processes in place for a wide range of users to manage, govern, and utilize the data and analysis.
TDWI is well known for its maturity models and assessment tools. In early 2014, we created a big data maturity model to help organizations understand how their big data and big data analytics deployments compared with those of their peers and how they could advance with analytics. The next year we created an analytics maturity model. We followed that up with two readiness assessments: one for Internet of Things readiness and the other for Hadoop readiness.
We are excited to offer a maturity model and this guide for self-service analytics because it is such an important market trend. We trust you’ll find it useful.
Fern Halper, VP and Senior Director for Advanced Analytics, TDWI Research

4 TDWI RESEARCH
TDWI Self-Service Analytics Maturity Model Guide
What Is Self-Service Analytics and Why Is It Important?There is a revolution happening in analytics and that is the move towards self-service. TDWI research indicates strong interest in self-service business intelligence (BI), analytics, and data preparation solutions. For instance, as far back as 2013, close to 80 percent of respondents in a TDWI survey said it is important to implement analytics solutions that do not require significant IT involvement. Companies are still very interested in this today. Self-service analytics technologies are an important trend for democratizing BI and analytics, which is about giving more users better tools for interacting with and analyzing data. Companies want to evolve their analytics strategies beyond spreadsheets or simple dashboards; many seek to build a broad “analytics culture” in which analysis plays an important role in decisions and is fundamental to business collaboration.
Organizations in nearly every industry realize that they need to be more analytical to compete effectively. Self-service analytics is an important part of this trend. Self-service analytics, in many ways, is an outgrowth of the frustration that business analysts and users have felt in dealing with traditional BI tools such as static dashboards and predefined reports. Many users are interested in exploring data on their own to reach their own conclusions, without having to rely on IT or some other group to do it for them. Self-service provides these business analysts and business users with more flexibility and agility to do so. Rather than simply consuming data, business analysts and users can access and prepare data, ask questions, find patterns in data, and more. With self-service, business users do not rely on IT for data and analysis, but IT has the transparency to monitor, maintain, and update the data infrastructure for the analysis. Self-service technologies are playing an important role in enabling users to develop more sophisticated analytics and execute analysis themselves, with IT’s blessing, help in governance, and guidance—in the background.
Trends in Self-Service Analytics Self-service has become an important trend across many aspects of the analytics life cycle. Vendors are helping to drive this trend by providing tools that are easy to use for various personas in the organization—including the business analyst, the business user, and even statisticians who prefer a nice graphical user interface to coding or writing in a scripting language. Popular areas for self-service include data preparation, data analysis, and advanced analysis such as predictive analysis.
• SELF-SERVICE DATA PREPARATION. Self-service data preparation covers a range of processes that begin with ingestion of raw data and continue through dealing with data quality, integrating disparate data, and transforming it to make it useful for analysis. Traditionally, users spend a lot of time preparing data—combining spreadsheets and trying to clean them up, asking IT for data, or trying to access defined data structures from BI tools. In a recent TDWI survey, close to 75 percent of respondents spent more than 40 percent of their time on a BI project preparing data. This hinders productivity and increases time to insight. Leading self-service data preparation solutions provide easier-to-use, graphical interfaces for selecting data sources to analyze, blending the data, and automating processes, such as data quality or data joins.
• SELF-SERVICE VISUAL ANALYTICS. Data visualization is about presenting data through graphical representations such as dashboards, charts, scatterplots, geospatial maps, and animated effects. Leading self-service visual discovery tools come with libraries of visualization types to fit different requirements, enabling users to easily apply them, often through familiar drag-and-drop interfaces. Digging into data and examining data relationships enables users to examine
Self-service analytics has become an
important trend across the analytics life cycle.

tdwi.org 5
What Is Self-Service Analytics and Why Is It Important?
data from different perspectives and answer their “why” questions. Data visualization is important to this flexibility of analysis. It allows users to slice and dice and to visualize their data in multiple ways in order to provide insights.
• AUTOMATED MODEL BUILDING. Because data scientists and statisticians are often in short supply and business analysts often know the right questions to ask, many vendors are offering tools that help business analysts and even business users construct predictive models. In some tools, all the user needs to do is to supply the target or outcome variables of interest, along with the attributes that they believe are predictive. The software picks the best model. Some tools even generate derived attributes such as popular ratios to use as model input. A number of these tools provide details about the statistics/math used; some do not. Although early in adoption, this is a growing trend.
Also contributing to this self-service trend are solutions where advanced technologies, such as machine learning, are embedded into the software. These tools perform tasks such as suggesting visualizations, identifying data quality issues, and automating models. For instance, some newer tools use machine learning and other techniques to automatically provide analyses such as what is trending, leading and lagging indicators, outliers, and so on. In other words, they can provide users with insights for questions they may not have thought to ask.
Persona-driven solutions are also becoming more common. Here, there may be multiple user interfaces in an analytics platform or software package geared towards multiple user groups. These include business users, business analysts, data scientists, and data engineers. The business user might have an easy-to-use GUI to enable them to visualize and analyze information. Business analysts might similarly make use of a visual interface but also have the option to write SQL or use an automated model-building feature. Likewise, data scientists might use both a visual interface and a programming language interface, perhaps in a notebook environment that enables them to use open source tools and run a model in real time. The self-service solution addresses multiple personas, but theoretically, all can make use of the same underlying data structures.
Other important trends in this space include cloud computing and big data. The cloud enables organizations to spin up systems faster and respond to immediate business demand for data and analytics. Organizations can subscribe to cloud-based self-service solutions with speed and, depending on their data needs, achieve rapid time to value. Additionally, as organizations confront an ever-increasing amount of data, they want to analyze it. This big data includes “new” forms of data such as text data from social media or geospatial data such as location. Big data has contributed to the need for more self-service solutions including big data visualization solutions and text analytics solutions.
The upshot is that organizations are moving in the direction of self-service—from ingestion to data preparation to analytics—with the ultimate goal of using analytics to help drive decision making and action. Often, multiple users want the flexibility to be able to analyze this data themselves, even as it becomes more sophisticated.
Cloud computing and big data are also important in this space.

6 TDWI RESEARCH
TDWI Self-Service Analytics Maturity Model Guide
Value of a Self-Service Maturity ModelTDWI research indicates that visual analytics tools are in use in the majority of organizations. However, as previously mentioned, mostly BI and analytics teams make use of these tools; they are not widely employed by business users. Of course, not everyone in a company needs to perform self-service analysis. Many organizations feel that these tools provide value to certain parts of their business—and they do. To increase the role of data and analytics in decision making, organizations need to bridge the gap between technical and nontechnical users.
The TDWI Self-Service Analytics Maturity Model can help guide business and IT professionals on their self-service analytics journey. It provides a framework for companies to understand where they are, where they’ve been, and where they still need to go in their self-service deployments. The model can also provide guidance for companies at the beginning of the process by helping them understand best practices used by companies that are more mature in their deployments.
The model consists of five stages of maturity and an inflection point. These are illustrated in Figure 1 and described in more detail in the next section.
Figure 1. The five stages of self-service maturity.
A great feature of TDWI maturity models
and assessments is the interactive
benchmark feature.
The TDWI Self-Service Analytics Maturity Model also includes an assessment. This online survey consists of 43 questions across five categories (described in the next section) that form the dimensions of the maturity model. A great feature of TDWI maturity models and assessments is the interactive benchmark feature. At the end of the survey, you will be able to quantify the maturity of your deployment in an objective way by comparing your scores against those in other industries as well as your own. This will help you understand your progress and identify what it will take to get to the next level of maturity. This guide is designed to help you understand the phases of maturity in self-service analytics as well as help you interpret your benchmarking scores.
Model DimensionsThere are five primary dimensions in the TDWI Self-Service Analytics Maturity Model as well as a number of subcategories that are used to quantify capabilities (see Figure 2).
• ORGANIZATION. To what extent does the organizational strategy, culture, leadership, and funding support a successful self-service analytics program? Are analytics widespread and used in everyday decisions?
• DATA MANAGEMENT. Self-service should provide data that is trustworthy while still providing flexibility to the organization. How well does the company manage its data in support of self-
Culture of Insight and
ActionMaturity BuildsCollaboration
Expands
Business Self-Service
Emerges
Inflection PointSTAGE ONE STAGE TWO STAGE THREE STAGE FOUR STAGE FIVE
Stagnation and Isolation

tdwi.org 7
What Is Self-Service Analytics and Why Is It Important?
service analytics? How does the organization deal with data quality and processing issues as well as data preparation, integration, and access?
• INFRASTRUCTURE. Data is a key component of any analytics initiative. How advanced and coherent is the data architecture in support of a self-service analytics initiative? To what extent does the infrastructure support flexible self-service analytics for all parts of the company and potential users? Can it meet performance demands? Does it make use of newer technologies to support requirements?
• ANALYTICS. What is the scope of self-service analytics and what are users outside of business analysts, IT, and other quantitative staff able to do with it? This includes the kinds of analytics utilized and how the analytics are delivered in the organization. It also includes training.
• GOVERNANCE. How coherent is the company’s data governance strategy in support of its self-service analytics program? Is the company able to manage users’ data discovery and analytical explorations effectively without applying too many restrictions and getting in the way of their pursuit of insight? Are policies in place? Is someone in charge?
Figure 2: TDWI Self-Service Analytics Maturity Model framework.
Organizational Maturity
Infrastructure Maturity
Data Managment
Maturity
Analytics Maturity
Governance Maturity
Leadership PoliciesScopeTeamData Access
Strategy StructuresDeliveryTechnologyData Preparation
Reach ComplianceTrainingArchitectureData Integration
Impact StewardshipSkillsPer formanceData Quality
Culture Security and privacy
PRIMARY CRITERIA
QUESTIONS THAT QUANTIFY CAPABILITIES

8 TDWI RESEARCH
TDWI Self-Service Analytics Maturity Model Guide
Stages of MaturityStage One: Analytics Stagnation and Isolation
In this stage, leadership does not stress analytics and lags behind in terms of building a data-centric strategy. Users are primarily working with spreadsheets and reports. There is not a lot of sophistication in terms of what users can do with these reports; they are set up for data consumption. Here, IT can provide data dumps for users, who mostly move the data into spreadsheets unless they have requisitioned tools on their own.
Some typical characteristics in this stage include:
• DATA MANAGEMENT. IT may believe that it has some sort of data management strategy—perhaps a data warehouse or data marts that they use for reporting—but this data is not easily accessible to the business. Typically, the data is structured only and feeds reports or dashboards. On the business side, organizations are asking IT for data or reports. If the business has its own data sources for a business activity, they are typically siloed for analysis, which is done by bringing spreadsheets together. It can be a long undertaking to assemble a data set for analysis.
• ANALYTICS. In the isolation stage, the spreadsheet typically rules. Most of the analysis is slicing and dicing. Dashboards may be developed in a spreadsheet and emailed to those “who need to know.” Online dashboards exist but are typically static and developed by IT or a business analyst. However, in many organizations, employees are getting tired of not having access to data to make decisions. They want analytics tools so they can answer important business questions. They do not want to rely on IT because it takes too long to get at the data.
• GOVERNANCE. Although IT feels that it has control over the data, it is not meeting governance needs because business is typically not involved in governance. Centralized governance and stewardship of the data is loose, and there is no real effort to apply metadata, etc., to improve it.
This stage is not sustainable, as organizations will ultimately realize that they can’t run their businesses without better analysis and without the business having access to data to perform more flexible kinds of analysis. It is important to move out of this stage of maturity. Typically, a business leader emerges, either to begin to work with IT (who may also be reaching out to the business) or to start a shadow analytics effort (see Stage Two). It may also be possible that a group of business users comes together to drive the effort from the bottom up. These users typically start to use freeware or other inexpensive tools to show the value that self-service analytics can provide.
In Stage One, spreadsheets typically
rule. The data is structured and IT controls it. Online
dashboards are static and there is no collaboration or real
governance.
Culture of Insight and
ActionMaturity BuildsCollaboration
Expands
Business Self-Service
Emerges
Stagnation and Isolation
Inflection PointSTAGE ONE STAGE TWO STAGE THREE STAGE FOUR STAGE FIVE
tdwi.org 9
Stages of Maturity
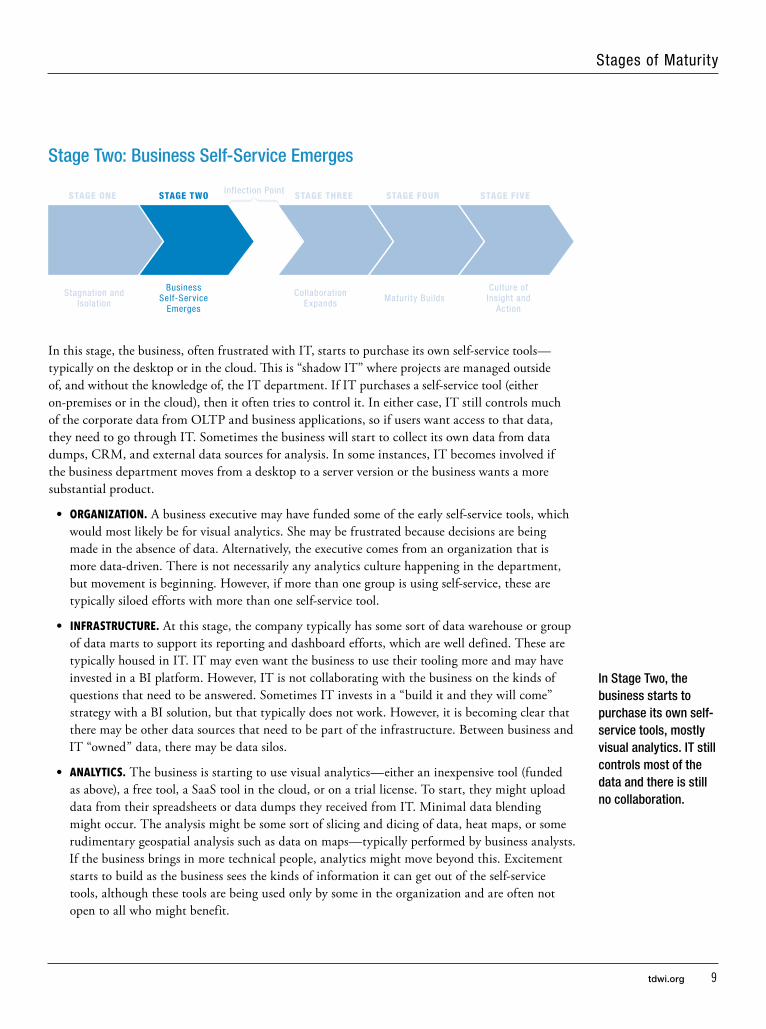
Stage Two: Business Self-Service Emerges
In this stage, the business, often frustrated with IT, starts to purchase its own self-service tools—typically on the desktop or in the cloud. This is “shadow IT” where projects are managed outside of, and without the knowledge of, the IT department. If IT purchases a self-service tool (either on-premises or in the cloud), then it often tries to control it. In either case, IT still controls much of the corporate data from OLTP and business applications, so if users want access to that data, they need to go through IT. Sometimes the business will start to collect its own data from data dumps, CRM, and external data sources for analysis. In some instances, IT becomes involved if the business department moves from a desktop to a server version or the business wants a more substantial product.
• ORGANIZATION. A business executive may have funded some of the early self-service tools, which would most likely be for visual analytics. She may be frustrated because decisions are being made in the absence of data. Alternatively, the executive comes from an organization that is more data-driven. There is not necessarily any analytics culture happening in the department, but movement is beginning. However, if more than one group is using self-service, these are typically siloed efforts with more than one self-service tool.
• INFRASTRUCTURE. At this stage, the company typically has some sort of data warehouse or group of data marts to support its reporting and dashboard efforts, which are well defined. These are typically housed in IT. IT may even want the business to use their tooling more and may have invested in a BI platform. However, IT is not collaborating with the business on the kinds of questions that need to be answered. Sometimes IT invests in a “build it and they will come” strategy with a BI solution, but that typically does not work. However, it is becoming clear that there may be other data sources that need to be part of the infrastructure. Between business and IT “owned” data, there may be data silos.
• ANALYTICS. The business is starting to use visual analytics—either an inexpensive tool (funded as above), a free tool, a SaaS tool in the cloud, or on a trial license. To start, they might upload data from their spreadsheets or data dumps they received from IT. Minimal data blending might occur. The analysis might be some sort of slicing and dicing of data, heat maps, or some rudimentary geospatial analysis such as data on maps—typically performed by business analysts. If the business brings in more technical people, analytics might move beyond this. Excitement starts to build as the business sees the kinds of information it can get out of the self-service tools, although these tools are being used only by some in the organization and are often not open to all who might benefit.
In Stage Two, the business starts to purchase its own self-service tools, mostly visual analytics. IT still controls most of the data and there is still no collaboration.
Culture of Insight and
ActionMaturity BuildsCollaboration
Expands
Business Self-Service
Emerges
Stagnation and Isolation
Inflection PointSTAGE ONE STAGE TWO STAGE THREE STAGE FOUR STAGE FIVE

10 TDWI RESEARCH
TDWI Self-Service Analytics Maturity Model Guide
• GOVERNANCE. At this stage, there may start to be concerns about data quality and consistency among business users as well as IT, as they realize that the data isn’t being governed properly. This is a situation created by shadow IT—too many analytics silos and potentially haphazard use of data. This starts to create the same situation as too many spreadsheets. It will be important for IT and the business to come together, identify some team members, and get the governance process off the ground. This can involve setting some policies as well as appointing a data steward.
Again, this stage is sustainable for only so long. As the organization starts to build up its self-service analytics efforts and brings in more data, it will realize that it makes sense to bring in IT. It is important that organizations at this stage of maturity start to build bridges between IT and the business. In order to move a self-service analytics effort forward, collaboration will be essential. In a good collaboration, IT provides the data infrastructure that supports data discovery activities. IT may also support the self-service analytics tools as the analytics environment becomes more sophisticated. IT and the business work closely together, helping business to learn the tools.
The Inflection Point
It should be clear by now that a sign of self-service immaturity is if the business has no future plans to involve IT or vice-versa.
At some point, business and IT realize that it makes more sense to work together than separately. This typically happens when the business has had some success with their projects and wants to expand to more users with more or better data and possibly into more departments. This might occur when business needs more funding, as IT often controls data-related budgets. Alternatively, the business may have grown its implementation but realizes that it needs IT to step in and fix or manage it. In any case, as pointed out above, this is when collaboration starts.
Once organizations move past the inflection point they start to build maturity across numerous areas that are needed for self-service analytics to grow. Beyond simply slicing and dicing data and creating nice visualizations, organizations begin to use self-service analytics and advanced analytics to drive decision making and action in a consistent and believable way.
A number of strategies and processes begin to change as the organization moves past the inflection point and matures to a culture of insight.
Culture of Insight and
ActionMaturity BuildsCollaboration
Expands
Business Self-Service
Emerges
Stagnation and Isolation
Inflection PointSTAGE ONE STAGE TWO STAGE THREE STAGE FOUR STAGE FIVE

tdwi.org 11
Stages of Maturity
• ORGANIZATION. The organization starts to become more analytically driven and may organize to execute in that way. For instance, it might build out a center of excellence (CoE) that includes a cross-functional team to help disseminate knowledge and train others. Change management is on the minds of many because although tools might be available, people will have to want to use them and be able to use them well.
• DATA MANAGEMENT. Although data from spreadsheets or one or two data sources might be enough to get self-service off the ground, typically organizations will begin to look beyond these data sources. This will include other internal data as well as external data such as social media, text data, or other third-party data. The organization begins to realize that these new kinds of data and big data can help drive insights. Self-service users will want to include them in their analyses. Eventually, these organizations might implement a platform outside of their data warehouse, which might include a data lake for data exploration and analysis. Here IT and business collaboration is important to determine what goes into the lake and how it is managed, both separately and as part of a broader architecture.
• ANALYTICS. There is a move to bring analytics to more people in the organization. This includes business users as well as business analysts. As an organization becomes more mature, a number of things can happen. First, as the organization moves through the stages of maturity, business analysts might start to use big data and more advanced self-service analytics, such as automated predictive analytics. Some in departments such as marketing may use other analytics as well, such as social media or text analytics tools. Tools might become more persona-driven. Second, more technical users—such as statisticians and data scientists—who do not like a scripting interface might also make use of the tools for data and big data exploration or more advanced analytics. These people can also check to make sure any model built using automated model building tools makes sense before it is put into production.
Training also starts to become more important as organizations become more mature. Although those with a nose for data and analytics might be utilizing some tools with some rudimentary data-blending capabilities, most users need guidance in both implementing the solutions and working with data and analytics—especially when it comes to data preparation or more advanced analysis. Some might be able to work the tool but not perform analysis well. Some will not be able to work the tools. Some are not critical thinkers to begin with. As self-service tools start to permeate the organization, companies will need to be prepared to train users. For example, in a recent TDWI Best Practices Report on data preparation, less than 20 percent of business users are blending, consolidating, or creating calculated fields themselves. Most leave this to IT or work with IT collaboratively to do this.1
• DATA GOVERNANCE. Consistency of data, data quality, and data integration become more important as organizations move through the stages of maturity. Data sourcing and lineage are important here, and companies begin to recognize the importance of standardization. As they become more mature, they start to take note of the number of different analytics tools in the organization and come together to strategize on how to work together. This, in turn, can lead to cost savings and tool consolidation.
At the inflection point, collaboration begins and maturity starts to build.
1 For more information, see the 2016 TDWI Best Practices Report: Improving Data Preparation for Business Analytics, online at tdwi.org/bpreports.

12 TDWI RESEARCH
TDWI Self-Service Analytics Maturity Model Guide
These changes in maturity happen in the more advanced stages, outlined below.
Stage Three: Collaboration Expands
By this stage, the business is starting to work collaboratively with IT and an expansion strategy begins to give users access to data. IT might deal with issues such as licenses, performance, data access, and architecture for the data warehouse. They might create sandboxes to help users explore the data to see what is valuable, and then work together to set up applications. They are working on data-related issues. The goal here is to make self-service work better and be sustainable—not for IT to control self-service.
• DATA MANAGEMENT. During this stage, IT may begin to standardize the data for use by the business. This is not meant to be a control issue. Rather, the idea is for everyone to be working with high-quality data with common metadata. Locking up data in individual user or departmental silos is considered a negative in this phase, and the company is actively seeking to consolidate silos or employ data federation and virtualization to unify views of data from across all components of the data infrastructure—often as part of the data preparation process. IT may use agile or agile-like methods as a major collaboration point.
• ANALYTICS. Training is important here. As already stated, easier use does not mean that training is not necessary. Often the most important training is not on using tool features and functions but building skills to work with data and apply it to business decisions. Additionally, more users want to prepare data and advance the kinds of analytics they do. This might include predictive analytics or analyzing disparate data types, such as social media data. Some organizations might build a team that is part of the chief data or chief analytics officer’s organization. Others have a CoE that might provide expertise and training to those looking for it. Analytics delivery occurs on multiple devices, including mobile.
• GOVERNANCE. A company at this stage of maturity understands that analytics, for all its benefits, can be a liability waiting to happen, especially if data from external sources is part of the equation. A company at this stage should be concerned with answering questions such as: Whose data was it? Whose data is it? Where is it going? How long will it last? The organization starts to put a governance team together that includes business as well as IT.
Collaboration is really the first major phase in becoming mature with self-service analytics. Business and IT will need to determine how to work together. Planning questions will address responsibilities as well as rollout. IT will need to put the right architecture in place to enable standardization of data. A unified data management platform will become especially important as the organization matures further and begins to deal with big data.
In Stage Three, an expansion
strategy begins. IT starts to deal with data architecture
and software in collaboration with the
business. Training becomes important for data preparation and visual analytics.
A CoE may be formed and collaborative data
governance begins.
Culture of Insight and
ActionMaturity BuildsCollaboration
Expands
Business Self-Service
Emerges
Stagnation and Isolation
Inflection PointSTAGE ONE STAGE TWO STAGE THREE STAGE FOUR STAGE FIVE

tdwi.org 13
Stages of Maturity
On the organizational front, a critical key to success involves thinking about change management. This will include evangelizing the concepts and value associated with self-service analytics so that business users understand that these tools are available to them and not just to business analysts. Some companies publicize results through online newsletters or other sources in order to start to get people excited about the possibilities. Others play up proofs of concept.
Of course, this will involve a solid training plan as well. For example, some companies set up training sessions that lead towards certification, which may involve a CoE with a cross-functional team. Other organizations provide tool doctors, lunch and learns, or office hours to help answer technology questions around both data preparation and data visualization. Some organizations look externally for training. There are many different ways to approach training, but the important thing is to do it—it will be key to building maturity and seeing results.
Stage Four: Maturity Builds
In this phase, users are becoming more mature with self-service analytics. They are working with more data sources and doing deeper analytics. Here, the organization is better at aligning technologies with use cases. In other words, if they have nontechnical users who primarily need data visualization for reports and data consumption, they set that up. If they have users in operations who need alerts, quick views, and so on, they set that up with more real-time data. If they have users who are conducting data discovery and who want to do more advanced analytics based on what they have discovered, they set that up.
• ORGANIZATION. At this stage of maturity, IT is now making it easy for business. IT understands that business users know what metrics and KPIs they need and what data sources they need, and IT tries to make them available so that business doesn’t need to go outside corporate-sponsored tools. Here, there is a conscious effort to set up a culture where decisions are more data-driven (or data-informed). That means that leadership emphasizes numerical results and insights to drive decisions, which percolates through different parts of the organization. The organization’s actions are data-driven, based on their analytics. Often, by this point, an organization has set up a CoE that helps to disseminate knowledge and keeps ahead of the curve in terms of analytics sophistication.
• INFRASTRUCTURE. In this stage of maturity, a range of technologies might be used, including Hadoop and appliances or a data warehouse, both on premises and in the cloud. The organization is prepared to handle a growing number of data sources and is prepared to add more on short notice. The infrastructure is meant to scale to support high volumes and diversity of data. The information architecture is unified in a way that underpins analytics. The company is thinking in terms of multiplatform data architecture that encourages innovation
In Stage Four, organizations become more mature, perform deeper self-service analytics, and become more data-driven. Technology is often persona-driven and disparate data is analyzed.
Culture of Insight and
ActionMaturity BuildsCollaboration
Expands
Business Self-Service
Emerges
Stagnation and Isolation
Inflection PointSTAGE ONE STAGE TWO STAGE THREE STAGE FOUR STAGE FIVE
14 TDWI RESEARCH
TDWI Self-Service Analytics Maturity Model Guide
and enables users to explore new types of data on a variety of platforms for analysis, including a data warehouse, a data lake, and the cloud.
• ANALYTICS. At this point, analytics should be operationalized as part of a business decision-making process. In the earlier stages of maturity, this might include interactive dashboards. Here, more business users have access and are using visual analytics on multiple devices. They are collaborative in their analysis and results are shared and iterated on with others. Additionally, different kinds of data are analyzed—including unstructured data and geospatial data—and this data can be accessed by those who need it. Data science teams, including business analysts using self-service advanced analytics, might be part of the CoE. Tools are often persona-driven, with different interfaces for different users. For instance, a business user might require a wizard-based interface, but a data scientist might want an interface that allows him or her to write scripts or connect to open source libraries.
• GOVERNANCE. As the organization introduces more data sources, it will need new best practices and more people to help it become a success. Governance is a people and process issue that will be sorted out in this stage. Governance includes data governance as well as process governance. For instance, at this point, organizations may be making use of more advanced analytics, such as predictive analytics, often in a self-service fashion. Data scientists or other experts might act as control points for models built by business analysts in the organization (using automated modeling tools) before these models go into production.
Self-service analytics is an evolution and this stage of maturity is a good one. However, some organizations are able to take this further, to build a culture of insight and action. This often requires time and success with self-service analytics projects. It requires commitment from the organization around technology and process in infrastructure, data management, and governance.
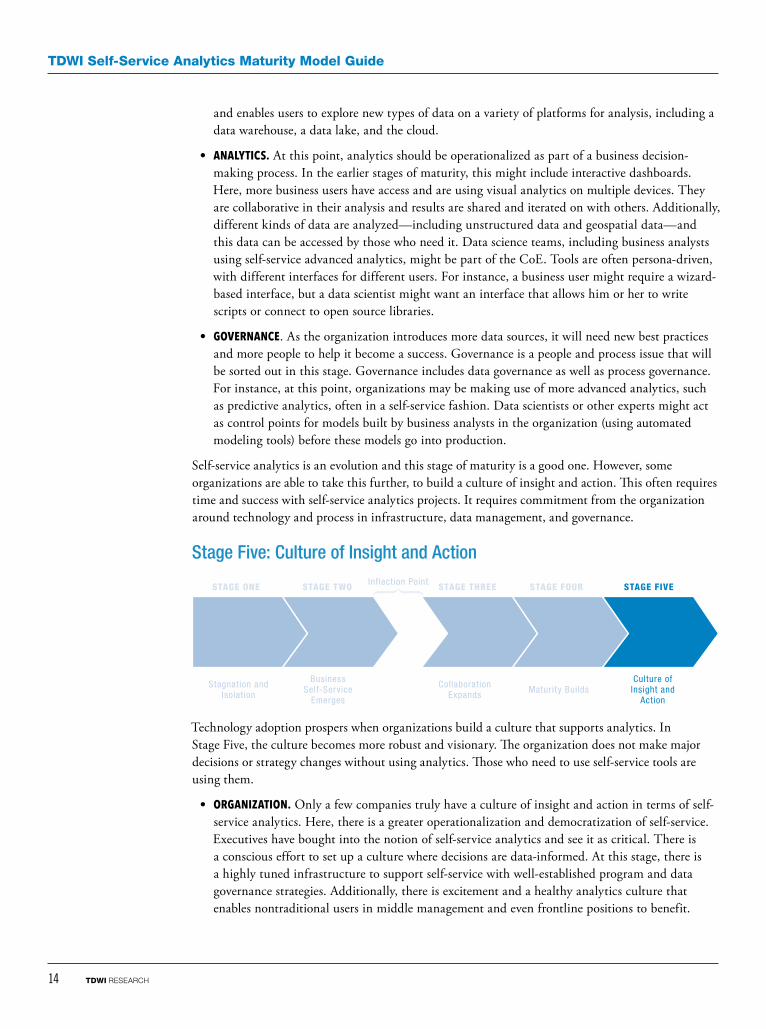
Stage Five: Culture of Insight and Action
Technology adoption prospers when organizations build a culture that supports analytics. In Stage Five, the culture becomes more robust and visionary. The organization does not make major decisions or strategy changes without using analytics. Those who need to use self-service tools are using them.
• ORGANIZATION. Only a few companies truly have a culture of insight and action in terms of self-service analytics. Here, there is a greater operationalization and democratization of self-service. Executives have bought into the notion of self-service analytics and see it as critical. There is a conscious effort to set up a culture where decisions are data-informed. At this stage, there is a highly tuned infrastructure to support self-service with well-established program and data governance strategies. Additionally, there is excitement and a healthy analytics culture that enables nontraditional users in middle management and even frontline positions to benefit.
Culture of Insight and
ActionMaturity BuildsCollaboration
Expands
Business Self-Service
Emerges
Stagnation and Isolation
Inflection PointSTAGE ONE STAGE TWO STAGE THREE STAGE FOUR STAGE FIVE

tdwi.org 15
• INFRASTRUCTURE AND DATA MANAGEMENT. Managing complexity is key to self-service maturity. Companies at this stage have deployed a coherent analytics infrastructure that is fully operational. Part of the infrastructure includes the ability to integrate new sources of data for analytics, whether they are internal or external to the company. The infrastructure uses what has worked in the past, including a data warehouse, and may leverage newer technology such as commercial Hadoop and enterprise NoSQL databases. The cloud is also typically used by more mature organizations, usually in a hybrid fashion. Governance is well established and self-service options are deployed with oversight from a well-managed data access strategy.
• ANALYTICS. At this stage, the time to insight has been reduced and analytics is a way of daily life within these organizations, whether it is creating or consuming the analytics. These organizations are using self-service analytics to visualize and discover patterns in data, including big data. They are analyzing disparate kinds of data using a range of tools. A range of tools can be used because a governance framework has been established that allows people to access any data source with any analytics tool. Additionally, advanced analytics is performed using persona-driven tools, and there is a good control process in place to put models created by automated predictive analytics tools into production.
Evaluating Benchmark ScoresThe benchmark survey has 43 questions across the five categories that form the dimensions of the TDWI Self-Service Analytics Maturity Model (see Figure 2).
These dimensions should now seem familiar because they are the same categories we have been referencing throughout this guide. These factors and others are used to explore relationships in the data to help determine best practices for self-service analytics.
Of course, organizations can be at different stages of maturity in each of these five categories, and most are.
ScoringThe questions are either provided singly or grouped together in a matrix. Questions may be weighted differently depending on their relative importance. Each dimension has a potential high score of 20 points. Because organizations can be at different levels of maturity in the five dimensions, we score each section separately as well as provide an overall score. There are also questions that are not scored but rather used for best-practices guidance.
The output of the assessment is a score in each dimension and an average total score. We also provide comparisons with companies of the same size and industry.
Stages of Maturity
In Stage Five, there is a culture of insight and action. The infrastructure supports multiple data types and a healthy analytics culture uses results to drive decisions.

16 TDWI RESEARCH
TDWI Self-Service Analytics Maturity Model Guide
InterpretationOnce you complete the survey, a report-based interface will show how your responses compare to those of your peers. The breakdown of scores for each dimension is as follows:
For instance, if you receive a score of 11 in the organization dimension of the assessment, you are in the Collaboration Expands stage for that dimension. You should expect to see different scores for each dimension. Self-service analytics programs don’t necessarily evolve at the same rate across all the dimensions. For example, your company might be more advanced in terms of bringing data sources together than it is in analyzing them or governing this data.
When you complete the assessment, you might see scores similar to this:
Total Score: 7.8 (i.e., the average)
This means that you are more mature in your data management but less mature in the other areas.
SCORE PER DIMENSION STAGE
4 or less 1: Stagnation and Isolation
5-10 2: Business Self-service Emerges
11–15 3: Collaboration Expands
16–19 4: Maturity Builds
20 5: Culture of Insight and Action
DIMENSION SCORE STAGE
Organization 10 Business Self-Service Emerges
Infrastructure 7 Business Self-Service Emerges
Data Management 11 Collaboration Expands
Analytics 4 Stagnation and Isolation
Governance 7 Business Self-Service Emerges

tdwi.org 17
SummaryThe TDWI Self-Service Analytics Maturity Assessment provides a quick way for organizations to assess their maturity in self-service analytics and compare themselves in an objective way against others with self-service analytics initiatives. The assessment is based on the TDWI Self-Service Analytics Maturity Model, which consists of five maturity stages with an inflection point between stages two and three.
The assessment serves as a relatively coarse measure of your analytics maturity. It consists of 43 questions across five categories; this merely touches the surface of the complexities involved in building out a complete self-service program. To gauge precisely where you are, you may also choose to work with an independent source to validate your progress.
Evaluating Benchmark Scores

18 TDWI RESEARCH
TDWI Self-Service Analytics Maturity Model Guide
MicroStrategy
https://www.microstrategy.com
From enterprise reporting to pixel-perfect dashboards, mobile apps, and data discovery for business users, MicroStrategy gives organizations the full breadth of capabilities they need to transform their data into real-world intelligence The platform delivers the ability to standardize end-to-end BI needs by combining ease-of-use and self-service with enterprise governance, security, scalability, and performance Business teams can leverage MicroStrategy to be self-sufficient in accessing, blending, enriching, preparing, analyzing, and sharing insights on their own, while also offering easy workflows to publish dashboards into the system of record semantic model, making it possible to establish governance Learn more about MicroStrategy’s self-service capabilities or try the free MicroStrategy Desktop to build dashboards in minutes MicroStrategy (NASDAQ: MSTR) is a worldwide leader in enterprise analyticsand mobility software A pioneer in the BI and analytics space, MicroStrategydelivers innovative software that empowers people to make better decisionsand transform the way they do business We provide our enterprise customerswith world-class software and expert services so they can deploy uniqueintelligence applications To learn more, visit MicroStrategy online and follow uson Facebook and Twitter
Research Sponsor

555 S Renton Village Place, Ste. 700
Renton, WA 98057-3295
T 425.277.9126
F 425.687.2842
E [email protected] tdwi.org
TDWI Research provides research and advice for data professionals worldwide. TDWI Research focuses exclusively on data management and analytics issues and teams up with industry thought leaders and practitioners to deliver both broad and deep understanding of the business and technical challenges surrounding the deployment and use of data management and analytics solutions. TDWI Research offers in-depth research reports, commentary, inquiry services, and topical conferences as well as strategic planning services to user and vendor organizations.