TCU Quarterly Report - tcu.gov.hk · (b) TCU Quarterly Report No. 2 of 2015 should be submitted to...
35
QUARTERLY REPORT No. 3 of 2015 by the TRANSPORT COMPLAINTS UNIT of the TRANSPORT ADVISORY COMMITTEE for the period 1 July 2015 – 30 September 2015 Transport Complaints Unit 20/F East Wing Central Government Offices 2 Tim Mei Avenue Tamar Hong Kong. Hotline : 2889 9999 Faxline No. : 2577 1858 Website : www.info.gov.hk/tcu E-mail : [email protected]
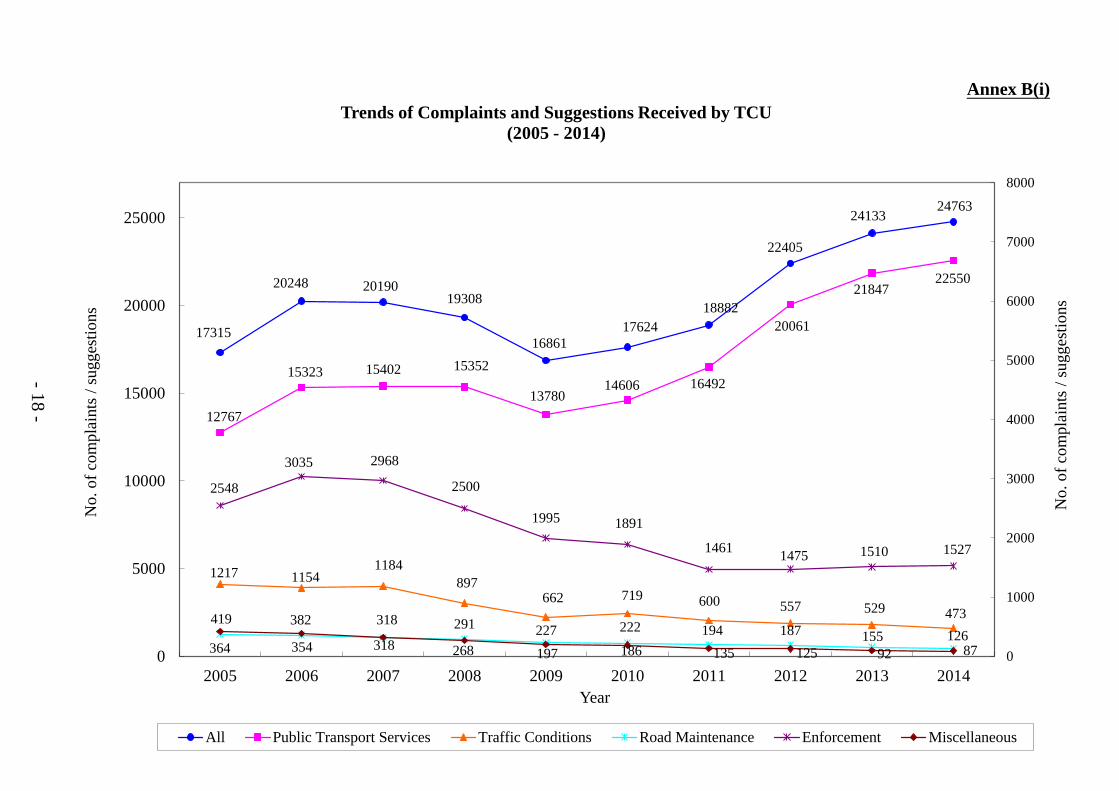
Transcript of TCU Quarterly Report - tcu.gov.hk · (b) TCU Quarterly Report No. 2 of 2015 should be submitted to...
QUARTERLY REPORT No. 3 of 2015
by the
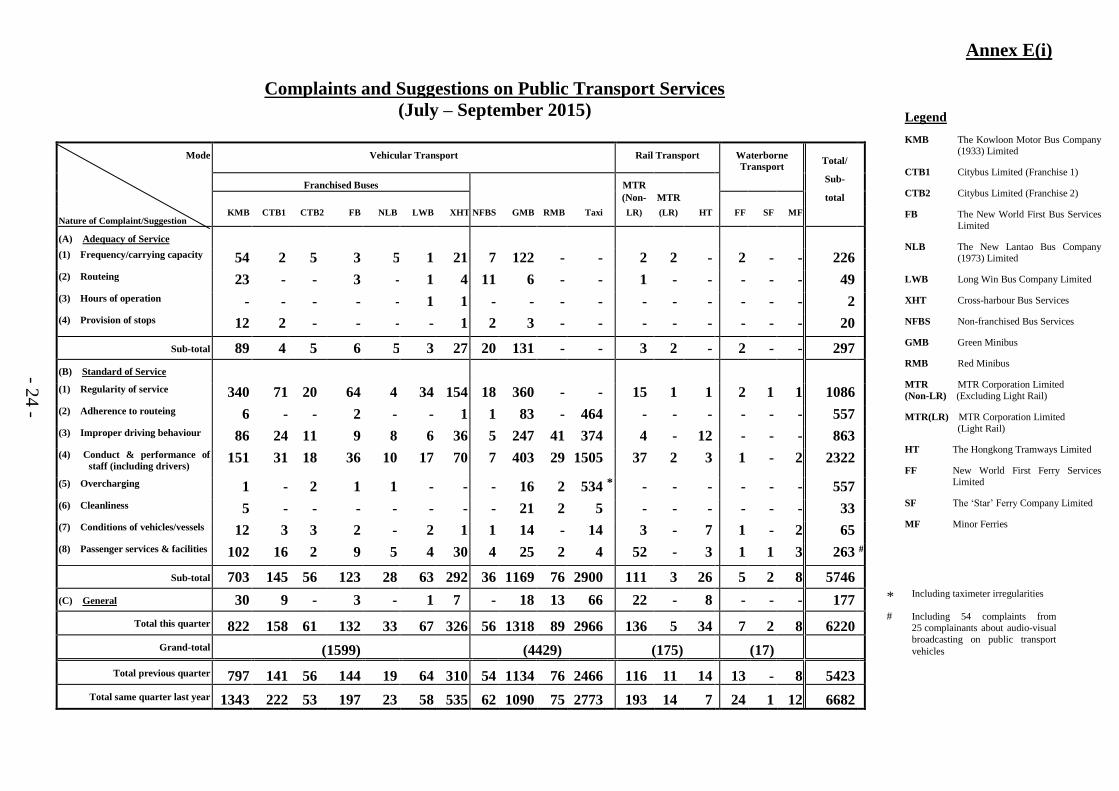
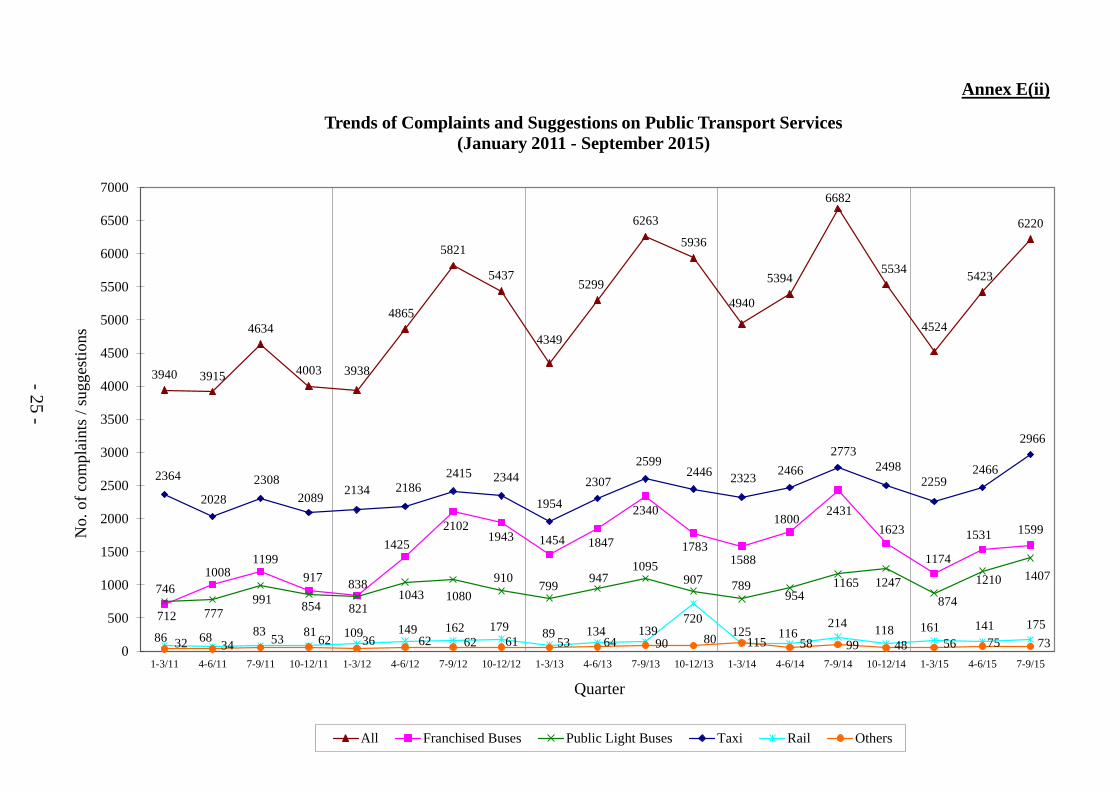
TRANSPORT COMPLAINTS UNIT
of the
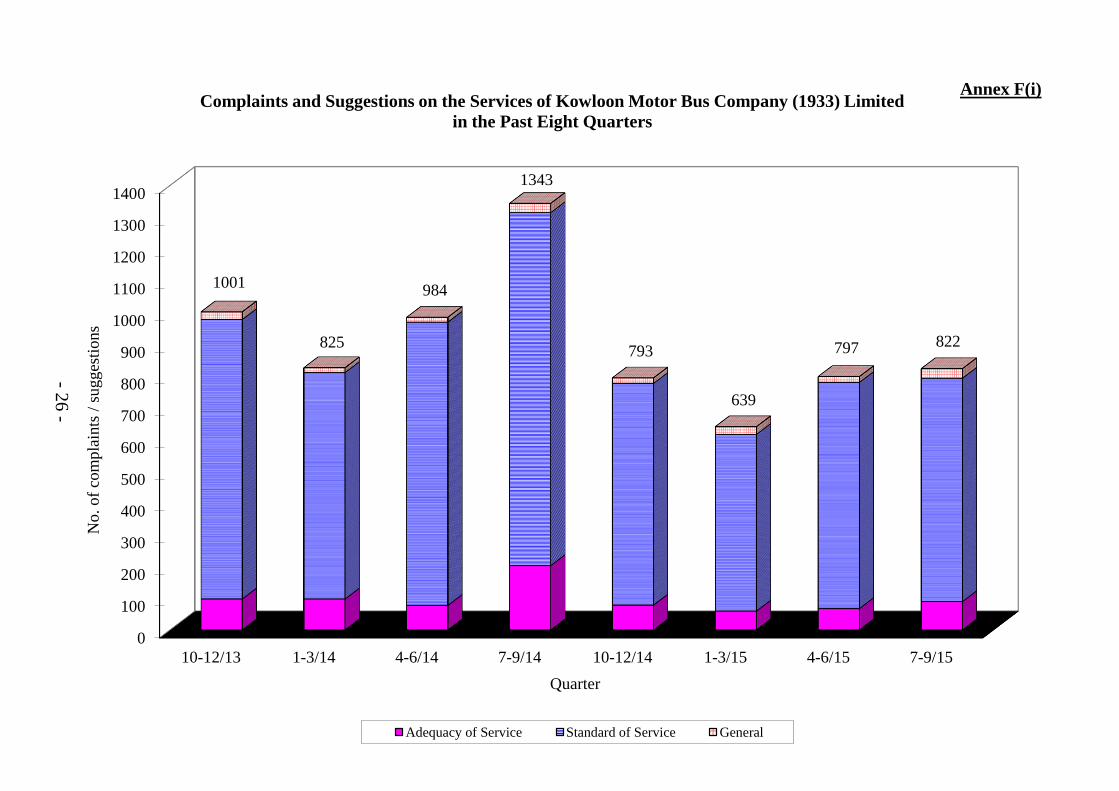
TRANSPORT ADVISORY COMMITTEE
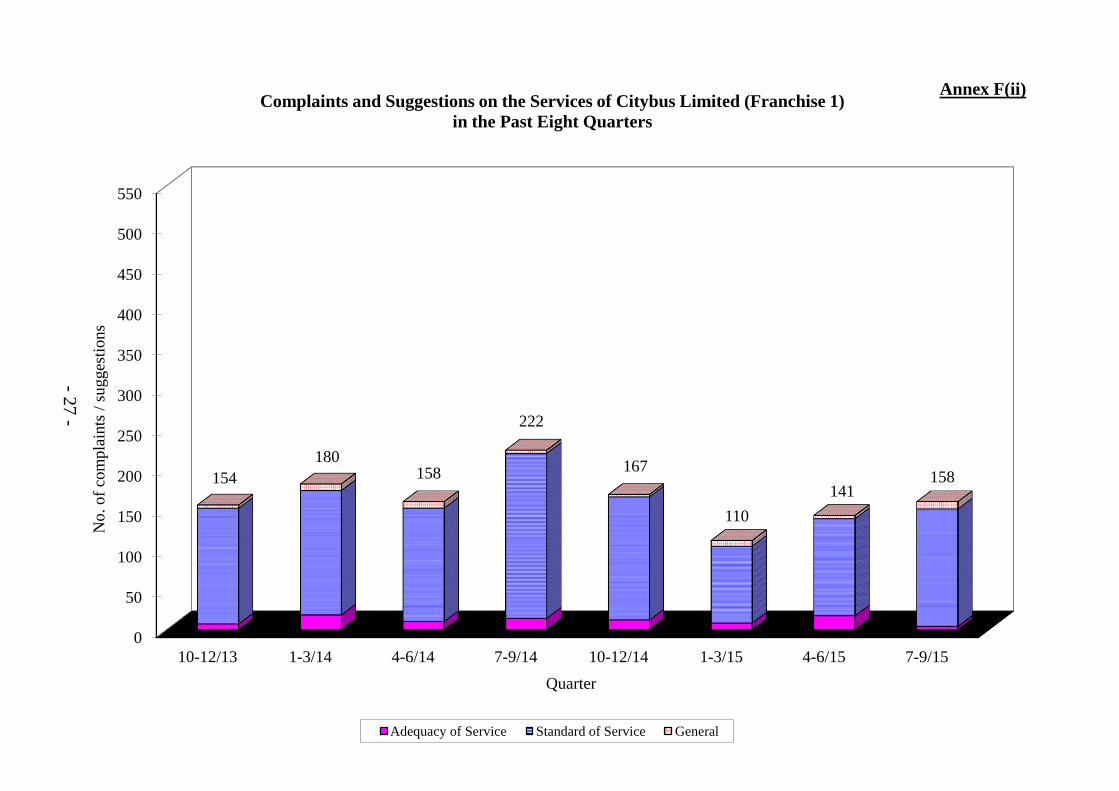
for the period
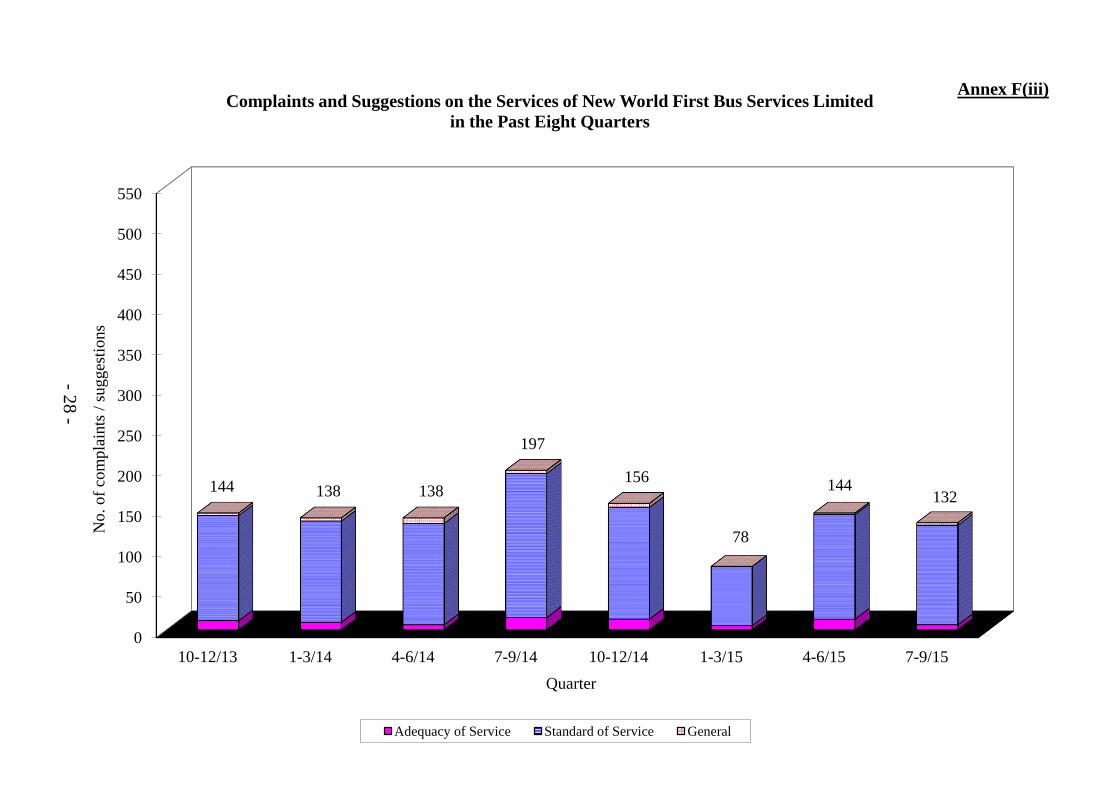
1 July 2015 – 30 September 2015
Transport Complaints Unit
20/F East Wing
Central Government Offices
2 Tim Mei Avenue
Tamar
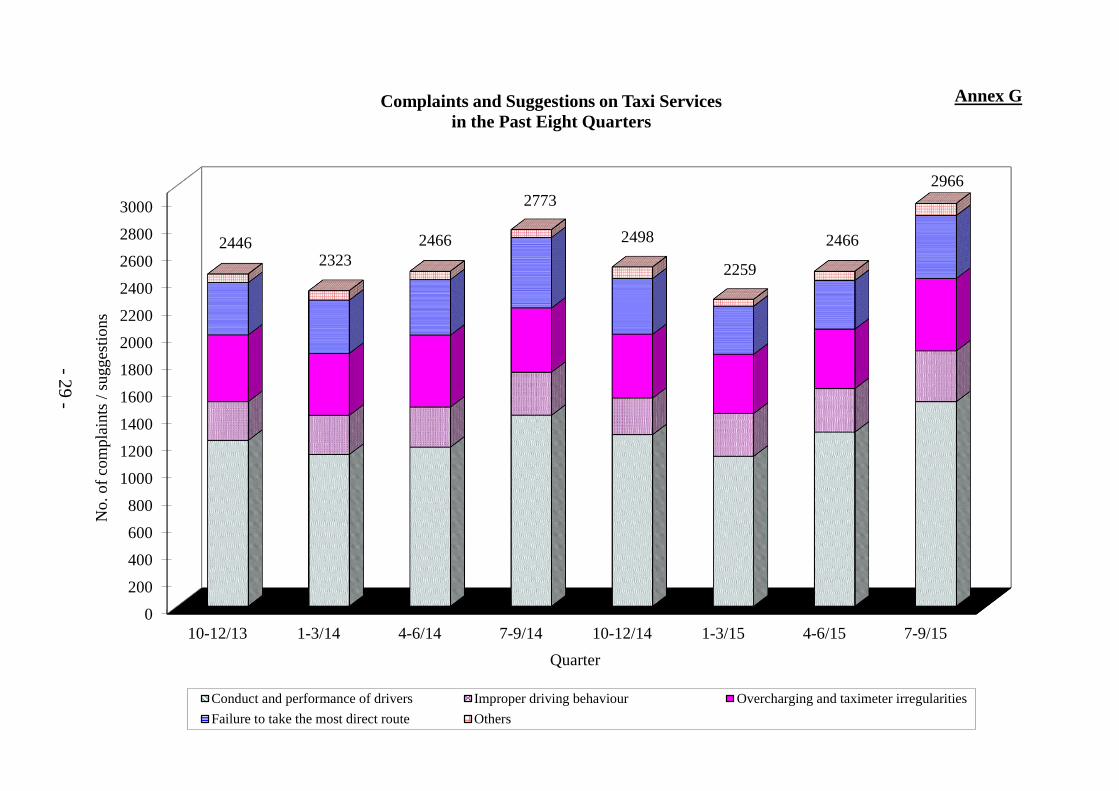
Hong Kong.
Hotline : 2889 9999
Faxline No. : 2577 1858
Website : www.info.gov.hk/tcu
E-mail : [email protected]

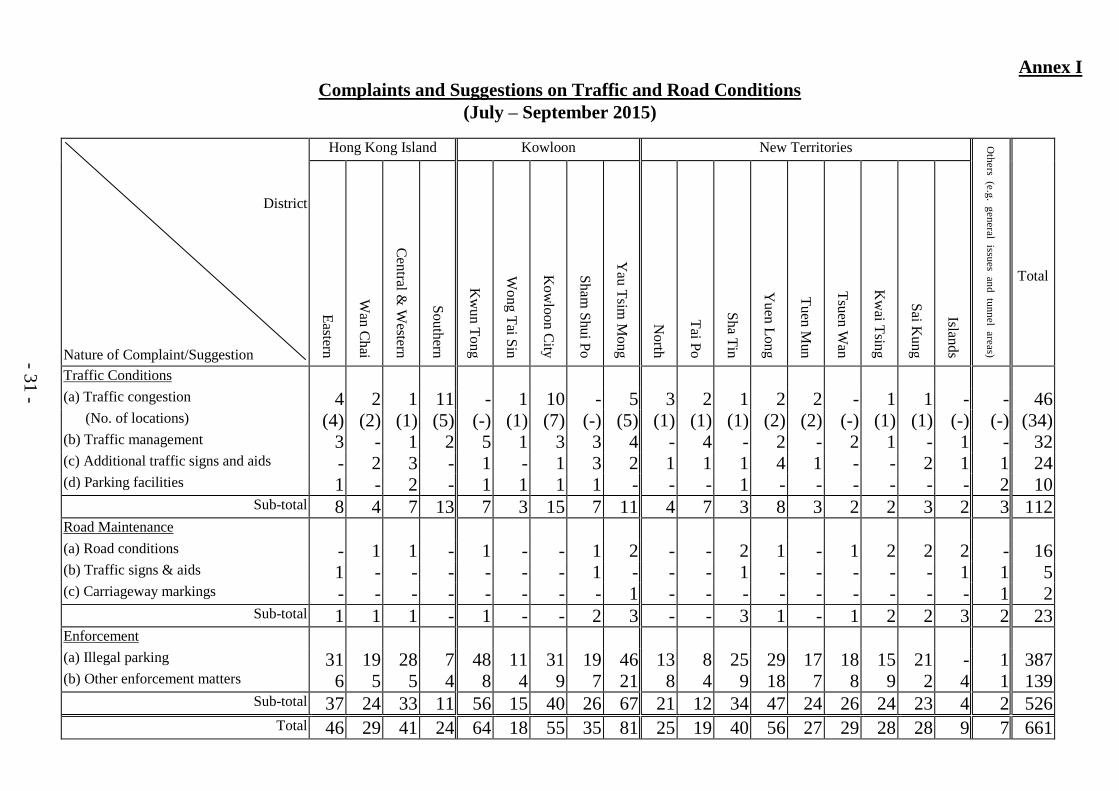
- 2 -
CONTENTS
Chapter Page
1 Major Areas of Complaints and Suggestions 3-8
2 Major Events and Noteworthy Cases 9-11
3 Feature Article 12-15
LIST OF ANNEXES
Annex
A Complaints and Suggestions Received by TCU 16-17
B Trends of Complaints and Suggestions Received by TCU 18-19
C Summary of Results of Investigations into Complaints and
Suggestions
20-21
D Public Suggestions Taken on Board by Relevant
Government Departments/Public Transport Operators
22-23
E Complaints and Suggestions on Public Transport Services 24-25
F Complaints and Suggestions on the Services of Kowloon
Motor Bus, Citybus (Franchise 1) and New World First
Bus in the Past Eight Quarters
26-28
G Complaints and Suggestions on Taxi Services in the Past
Eight Quarters
29
H Breakdown of Complaints and Suggestions on Taxi
Services
30
I Complaints and Suggestions on Traffic and Road
Conditions
31
J Complaints and Suggestions on MTR Services (excluding
Light Rail)
32
K Complaints and Suggestions on Light Rail Services 33
L Complaints and Suggestions on Tram Services 34
M How to Make Suggestions and Complaints to the Transport
Complaints Unit
35
- 3 -
Chapter 1 Major Areas of Complaints and Suggestions
This is the third quarterly report for 2015 covering the period from
1 July to 30 September 2015.
Yearly and Quarterly Trends
2. During the quarter, the Transport Complaints Unit (TCU) received
6 915 complaints and suggestions, including 61 pure suggestions, from
6 286 persons. About 51% (3 186) of these persons lodged their
complaints/suggestions by e-mail, fax or mail and the remaining 49% (3 100) by
telephone. The number of cases represents an increase of 12.6% as compared
with 6 140 cases in the previous quarter and a decrease of 5.8% as compared
with 7 342 cases in the same quarter last year. A breakdown of all the
complaints and suggestions received during the quarter is at Annex A.
3. A graph showing the trends of complaints and suggestions received
by TCU in the past ten years (2005-2014) is at Annex B(i). Another graph
showing the trends of complaints and suggestions received, by quarter, since
2011 is at Annex B(ii).
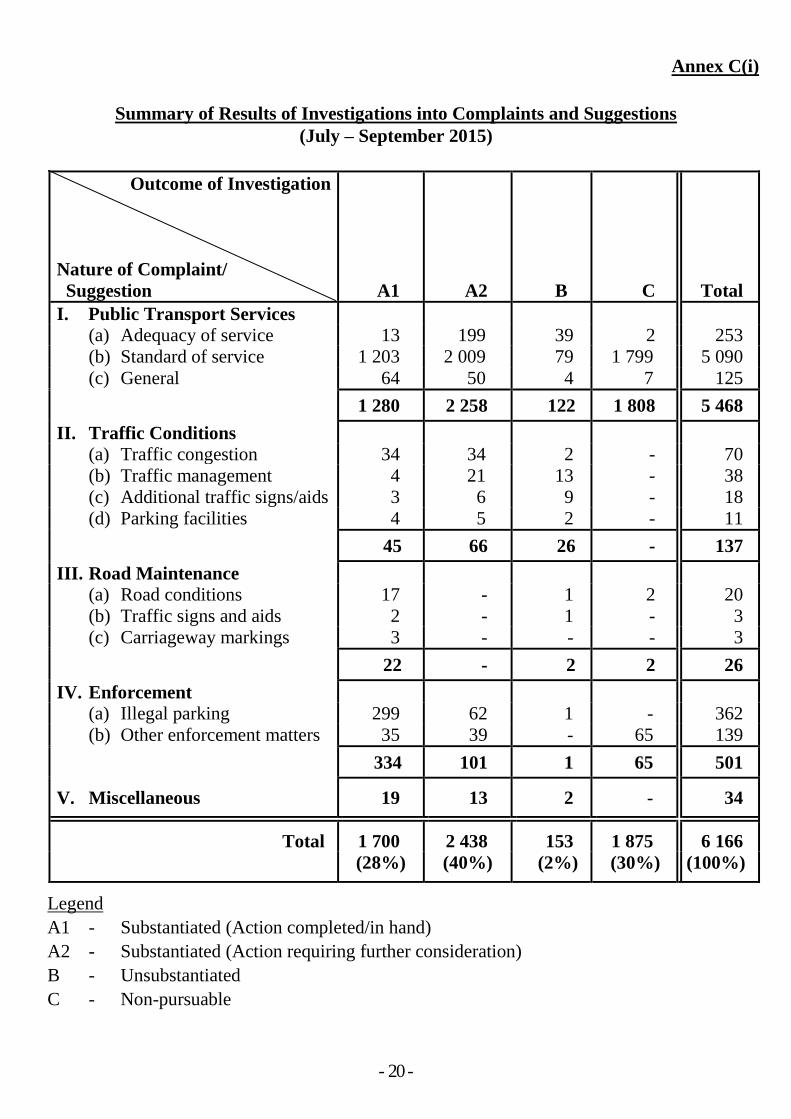
4. During the current quarter, investigations into 6 166 cases (including
some outstanding cases from previous quarters) were completed. Of these,
4 138 cases (68%) were found to be substantiated, 153 cases (2%)
unsubstantiated, and the remaining 1 875 cases (30%) not pursuable due to lack
of evidence. A summary of the results of investigations is at Annex C.
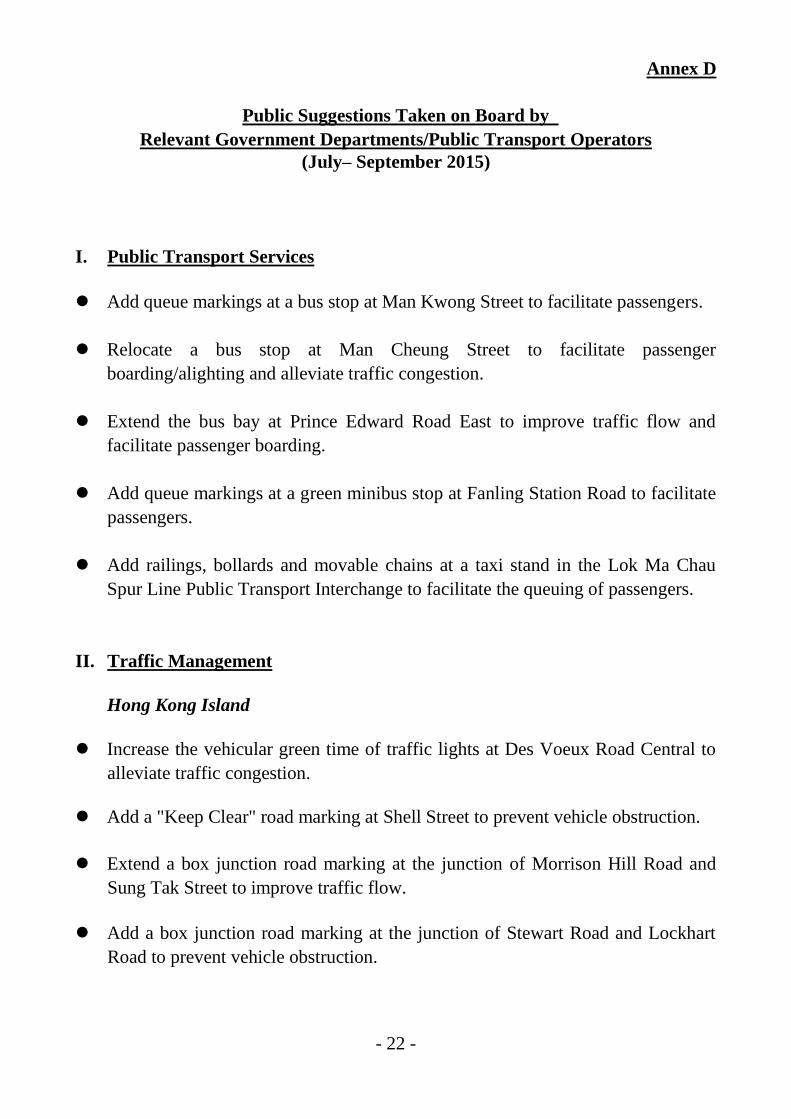
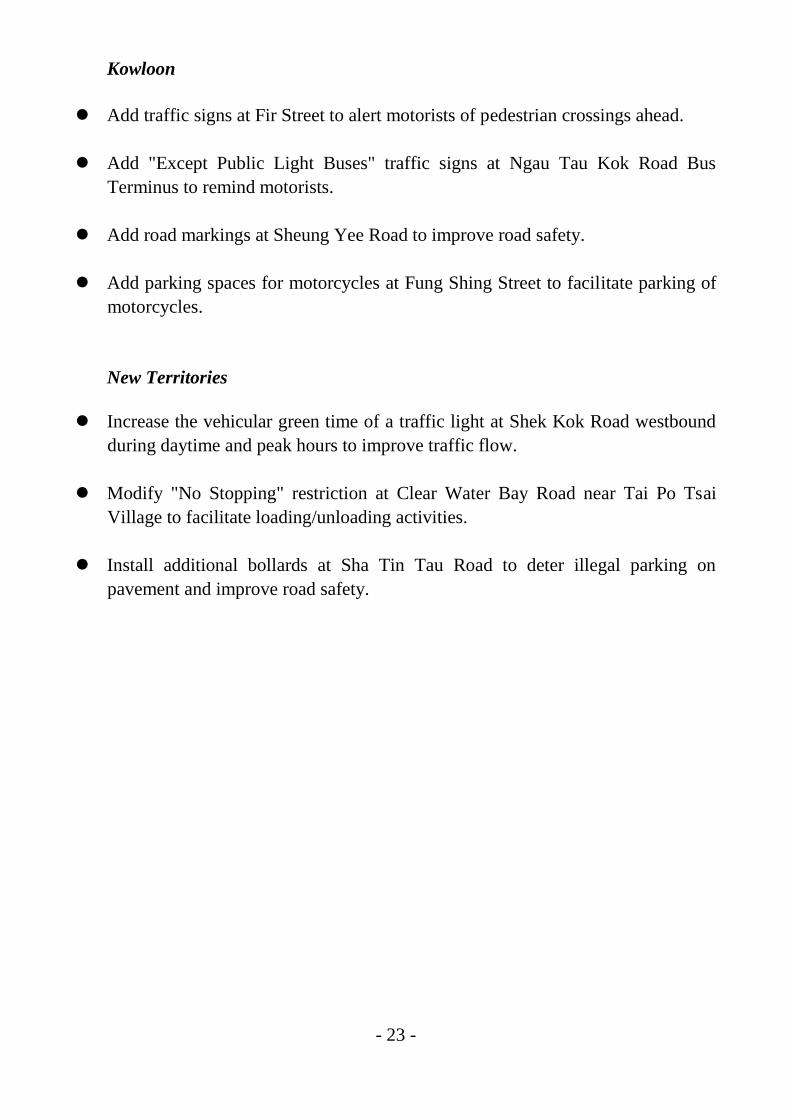
5. During the same period, relevant government departments and public
transport operators took on board 16 suggestions made by members of the public
who gave proposals to enhance public transport services and improve traffic
conditions. A summary of the cases is at Annex D. The Chairman of the
TCU Sub-Committee has issued appreciation letters to the proponents of these
suggestions who provided their contact details.

- 4 -
Public Transport Services
6. Complaints and suggestions on public transport services accounted
for 6 220 cases, which represents an increase of 14.7% as compared with the
previous quarter and a decrease of 6.9% as compared with the same quarter last
year. A breakdown of the complaints and suggestions received during the
quarter is at Annex E(i). A graph showing the trends of complaints and
suggestions received, by quarter, since 2011 is at Annex E(ii).
Franchised Bus Services
7. A total of 1 599 complaints and suggestions on franchised bus
services were received during the quarter, which represents an increase of 4.4%
as compared with the previous quarter and a decrease of 34.2% as compared
with the same quarter last year. The decrease in the number of cases received
as compared with the same quarter last year was mainly due to fewer complaints
about regularity of services.
8. There were 822 cases on the services of the KMB, as compared with
797 cases in the previous quarter and 1 343 cases in the same quarter last year.
Among the 822 cases, 89 (or 10.8%) were about the adequacy of service and 703
(or 85.5%) were about the standard of service.
9. There were 158 cases on the services of Citybus Limited (Franchise 1)
(CTB1), as compared with 141 cases in the previous quarter and 222 cases in the
same quarter last year. Among the 158 cases, 4 (or 2.5%) were about the
adequacy of service while 145 (or 91.8%) were about the standard of service.
10. There were 132 cases on the services of the New World First Bus
Services Limited (NWFB), as compared with 144 cases in the previous quarter
and 197 cases in the same quarter last year. Of the 132 cases, 6 (or 4.5%) were
about the adequacy of service and 123 (or 93.2%) were about the standard of
service.
11. Comparisons of the complaints/suggestions related to KMB, CTB1
and NWFB in the past eight quarters are at Annex F.
- 5 -
Non-Franchised Bus Services
12. There were 56 complaints and suggestions on non-franchised
bus services (e.g. residents’ services, feeder bus services operated by
MTR Corporation Limited (MTRCL)). Corresponding figures for the previous
quarter and the same quarter last year were 54 and 62 respectively.
Public Light Bus Services
13. A total of 1 407 complaints and suggestions on public light bus
(PLB) services were received in this quarter, which represents an increase of
16.3% as compared with the previous quarter and an increase of 20.8% as
compared with the same quarter last year. All these cases were referred to the
Transport Department (TD) or the Police for action.
14. Of the PLB cases received, 93.7% or 1 318 cases were on green
minibus (GMB) services. The number of cases received in the previous quarter
and the same quarter last year were 1 134 and 1 090 respectively. Among the
1 318 cases, 131 (or 9.9%) were about the adequacy of service and 1 169
(or 88.7%) were about the standard of service.
15. The remaining 6.3% or 89 cases were on the services provided by red
minibuses (RMB). The number of cases received in the previous quarter and
the same quarter last year were 76 and 75 respectively.
Taxi Services
16. A total of 2 966 cases on taxi services were received in this quarter,
which represents an increase of 20.3% as compared with the previous quarter
and an increase of 7% as compared with the same quarter last year. A
comparison of the complaints and suggestions on taxi services in the past eight
quarters is at Annex G.
- 6 -
17. Of the 2 966 cases received, 2 877 (97%) were related to taxi driver
malpractice, as compared with 2 399 such cases (97%) in the previous quarter.
Complaints about driver malpractice included drivers behaving other than in a
civil and orderly manner, refusing hire, improper driving behaviour,
overcharging, taximeter irregularities and failure to take the most direct and
practicable route, etc. A detailed breakdown of the nature of complaints and
suggestions on taxi services is at Annex H. Reports on taxi driver malpractice
were referred to the Police for further investigation if the complainants agreed to
be court witnesses. During the quarter, a total of 577 such cases (20%) were
referred to the Police.
18. During the quarter, the Police reported the latest developments on
521 cases previously referred to them. These cases are categorised as follows -
No. of Cases Percentage
(a) Summonsed 52 (34) 10 (9)
(b) Withdrawn by complainants 349 (278) 67 (72)
(c) Evidence considered
insufficient by the Police for
further processing
120 (75) 23 (19)
521 (387) 100 (100)
(Note : Figures for the previous quarter are in brackets.)
It is noted that 90% of these cases could not be further pursued because of
withdrawal by complainants or insufficient evidence.
Rail Services
19. A total of 175 complaints and suggestions on rail services were
received. Corresponding figures for the previous quarter and the same quarter
last year were 141 and 214 respectively. Of the 175 cases, 141 were on the
services of MTRCL.
- 7 -
Ferry Services
20. There were 17 complaints and suggestions on ferry services in this
quarter. Corresponding figures for the previous quarter and the same quarter
last year were 21 and 37 respectively.
Traffic Conditions
21. There were 46 complaints recorded in this quarter about traffic
congestion, as compared with 66 cases in the previous quarter and 71 cases in
the same quarter last year. Congestion was reported to have occurred at a total
of 34 locations throughout the territory, as illustrated below -
Number of
Complaints
Number of
Locations
Hong Kong Island 18 (20) 12 (15)
Kowloon 16 (21) 13 (19)
New Territories 12 (25) 9 (20)
Others - (-) - (-)
Total 46 (66) 34 (54)
(Note : Figures for the previous quarter are in brackets.)
22. Based on the number of complaints received, districts most affected
by traffic congestion were Southern (11 cases), Kowloon City (10 cases) and
Yau Tsim Mong (five cases). The number of complaints and suggestions on
traffic and road conditions broken down by district is at Annex I.
23. Complaints about traffic congestion were mainly attributable to
vehicle obstruction and traffic engineering matters (e.g. traffic light phasing,
traffic lane arrangements and restricted zones) and road works.
24. There were 32 complaints and suggestions on traffic management
and 24 requests for additional traffic signs and aids in this quarter. As a
comparison, there were 38 and 23 such cases in the previous quarter, and 41 and
17 in the same quarter last year.
- 8 -
25. Complaints about traffic congestion and suggestions to improve
traffic management, including the addition of traffic signs and aids, were
referred to the relevant government departments for consideration.
Road Maintenance
26. During the quarter, there were 23 complaints about road maintenance,
as compared with 26 cases in the previous quarter and 43 cases in the same
quarter last year. Among the 23 cases, 16 were related to road conditions.
27. Districts which attracted relatively more complaints about road
maintenance were Yau Tsim Mong, Islands and Sha Tin (three cases each).
Enforcement
28. There were 526 complaints about traffic regulations enforcement in
this quarter, which represents an increase of 1.3% when compared with the
previous quarter and an increase of 18.5% when compared with the same quarter
last year. They were mainly requests for action against illegal parking and
prolonged waiting causing obstruction. All these cases were referred to the
Police for action.

- 9 -
Chapter 2 Major Events and Noteworthy Cases
Transport Complaints Unit Sub-Committee Meeting
In the third quarter of 2015, the following matters were reported to
the Transport Complaints Unit (TCU) Sub-Committee -
(a) complaints and suggestions on taxi services;
(b) complaints about traffic congestion;
(c) complaints about improper driving behaviour of public transport
drivers; and
(d) TCU Quarterly Report No. 2 of 2015.
2. Members noted and agreed that -
(a) complaints and suggestions about taxi services, traffic congestion and
improper driving behaviour of public transport drivers should be
closely monitored; and
(b) TCU Quarterly Report No. 2 of 2015 should be submitted to the
Transport Advisory Committee.
Concern about the adequacy of designated priority seats on franchised
buses
3. In July 2015, a member of the public approached TCU to express her
concern about the adequacy of designated priority seats on franchised buses.
4. Transport Department (TD) advised that designated priority seats
were provided near the exit doors on franchised buses. Markings were shown on
the seats, e.g. on the headrest, so as to make them easily identified. Besides,
bus operators appealed to passengers to offer seats to people in need through
various channels, such as “Notes to Passengers” displayed in the bus
compartment, video clips broadcast via the audio-visual broadcasting system on
board and sound tracks played through the bus stop announcement system.

- 10 -
5. To further promote the culture of courtesy and caring on public
transport, TD produced the announcement of public interest “Take Care of
People in Need - Offer Priority Seats”. The Department would continue to
encourage bus operators to enhance publicity, and suggestions of increasing the
number of priority seats would be referred to the operators for consideration
taking into account operational situation and compartment configuration.
6. The member of the public was informed of TD’s reply and raised no
further comment.
Suggestion to relocate bus stops near the junction of Nathan Road and
Boundary Street
7. A member of the public suggested relocating the bus stops at Nathan
Road northbound near the junction with Boundary Street/Cheung Sha Wan
Road/Tai Po Road. He observed that vehicles travelling along Nathan Road
northbound would need to use the left lane to enter Cheung Sha Wan Road. As
there were a few bus stops located at Nathan Road near the said junction, very
often buses at the bus stops on the left lane made it difficult for vehicles using
the left lane in time to enter Cheung Sha Wan Road. He wondered if the bus
stops could be moved away from the junction towards the south.
8. TD was invited to consider the suggestion. The Department pointed
out that actually there was no restriction to mandate motorists using the left lane
of Nathan Road northbound for entering Cheung Sha Wan Road. Instead, the
middle lane could also be used for the purpose. Moreover, the relocation of the
bus stops as suggested would place them near the intersection with Playing Field
Road. This might adversely affect the traffic flow of vehicles leaving the
one-lane-one way Playing Field Road and turning left to Nathan Road
northbound.
9. TD’s reply was conveyed to the member of the public, who made no
further comment.
- 11 -
Concern about the safety of pedestrian at the intersection of Fleming Road
and Lockhart Road
10. A complainant raised the concern about the safety of pedestrian at the
intersection of Fleming Road and Lockhart Road. He noticed that only
vehicular traffic lights were installed at the crossroad without pedestrian signals.
When vehicular red signal directed vehicles to stop for one direction, another
vehicular green signal would be on to allow vehicles from the other direction
passing through the crossroad. As traffic was often busy at the said intersection,
the lack of pedestrian signal providing clear guidance for pedestrians crossing
the roads would pose safety issues. The complainant observed that
vehicle-pedestrian conflict was not uncommon there.
11. The case was referred to TD for investigation. TD noted that
cautionary crossings, namely crossing places indicated by road studs without
provision of separate pedestrian signals, were in place at the intersection
concerned. Pedestrians have no right-of-way privilege but are encouraged to
cross when the red signals have stopped vehicular traffic. TD had already
reviewed the traffic conditions at the intersection. Having taken into account
the impact on the traffic flow and the need of pedestrians, the department
advised that it had already commissioned the Highways Department to conduct
works for converting the cautionary crossings for the east/westbound traffic at
the junction to signalized crossings. The works were expected to commence in
the 2nd quarter of 2016.
12. The complainant was informed of TD’s plan for converting the
cautionary crossings for the east/westbound traffic at the junction to signalized
crossings and raised no other comments.
- 12 -
Chapter 3 Feature Article
Complaints and Suggestions on Rail Services
Background
Railways are the backbone of Hong Kong’s public transport system.
In 2014, they carried more than 1.9 billion passenger journeys, which accounted
for over 40% of all trips made on public transport each day. Hong Kong’s
railway network comprises the Mass Transit Railway (MTR) lines, Airport
Express and Light Rail. The average daily passenger trips of the railway
network increased from 4.87 million in 2013 to 5.08 million in 2014, which
represents an increase of 4.3%.
2. Tram services carried about 66 million passenger journeys in 2014.
It accounted for about 1.5% of all public transport journeys each day.
Statistics on Complaints and Suggestions
3. The trend of complaints and suggestions on rail services in the past
five years is as follows –
Year No. of Complaints Difference
2010 331 -
2011 318 -3.9%
2012 599 +88.4%
2013 1 082 +80.6%
2014 563 -48.0%
4. A total of 477 complaints and suggestions on rail services were
received during the period from January to September 2015. This represents an
increase of 7.2% when compared with 445 cases received in the same period last
year. An analysis of the complaints and suggestions received is given in the
following paragraphs.

- 13 -
MTR Services
5. The trend of complaints and suggestions on services of MTRCL
(excluding Light Rail) in the past five years is as follows –
Year
No. of
Complaints/Suggestions
Difference
2010 273 -
2011 259 -5.1%
2012 385 +48.6%
2013 930 +141.6%
2014 465 -50.0%
6. A total of 364 complaints/suggestions on services of MTRCL
(excluding Light Rail) were received during the period from January to
September 2015. This represents a decrease of 1.6% when compared with 370
cases received in the same period last year. A breakdown of the complaints
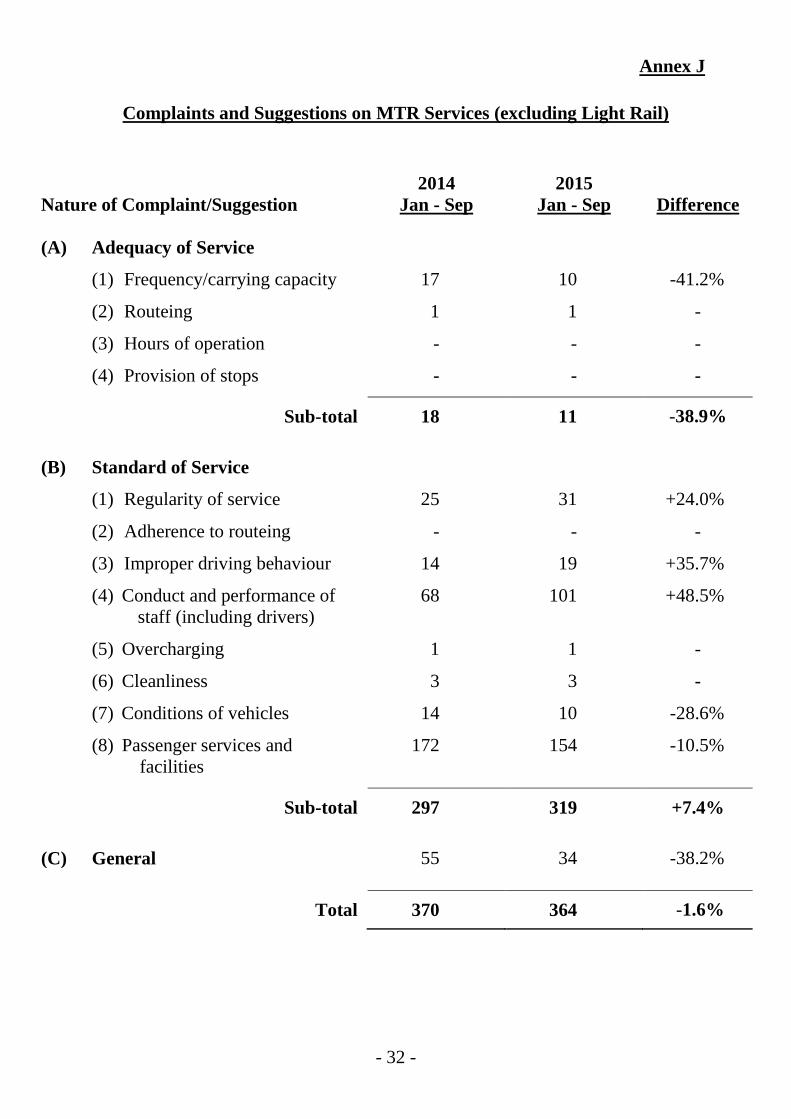
and suggestions received is at Annex J. Among the 364 cases, 154 (or 42%)
were about passenger services and facilities, such as nuisance due to video
broadcasting and inadequate notice/announcement during service disruption,
while 101 (or 28%) were about conduct and performance of staff.
Light Rail Services
7. The trend of complaints and suggestions on Light Rail services in the
past five years is as follows –
Year
No. of
Complaints/Suggestions
Difference
2010 37 -
2011 39 +5.4%
2012 54 +38.5%
2013 54 -
2014 42 -22.2%
- 14 -
8. A total of 31 complaints/suggestions on Light Rail services were
received during the period from January to September 2015. This represents a
decrease of 8.8% when compared with 34 cases received in the same period last
year. Among the different categories of cases, frequency and carrying capacity
and passenger services and facilities attracted relatively more complaints. A
breakdown of the complaints and suggestions received is at Annex K.
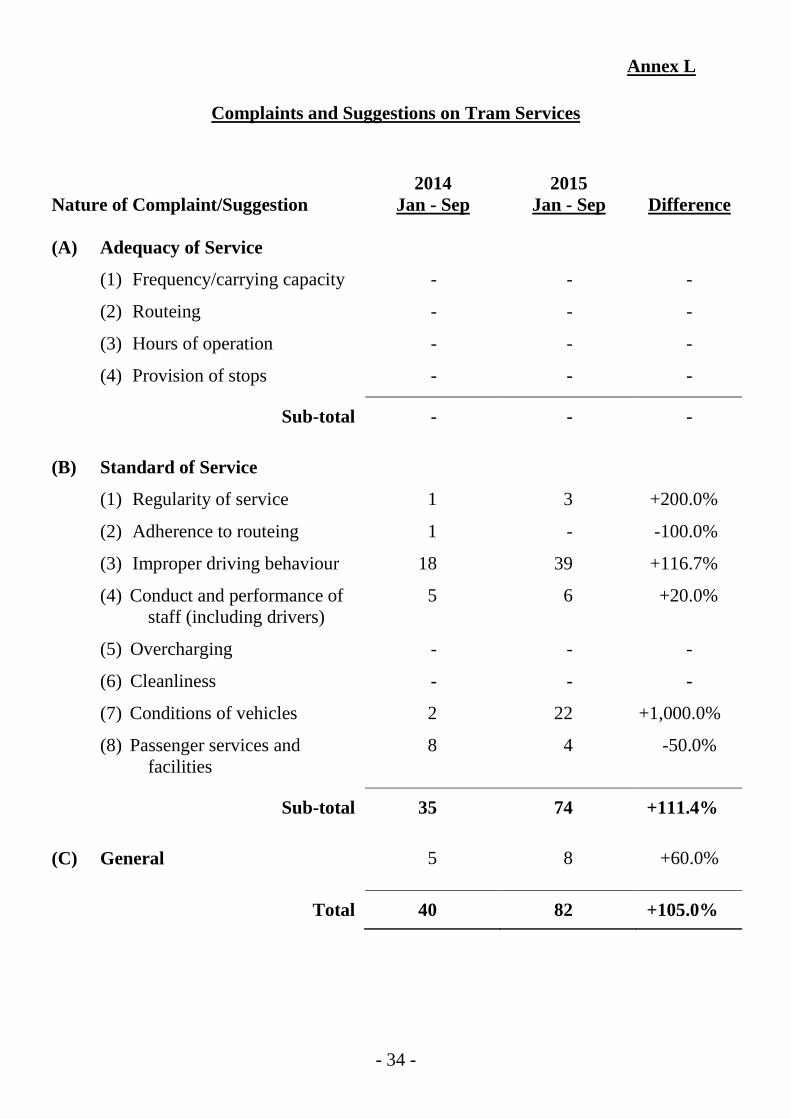
Tram Services
9. The trend of complaints and suggestions on tram services in the past
five years is as follows –
Year
No. of
Complaints/Suggestions
Difference
2010 21 -
2011 19 -9.5%
2012 160 +742.1%
2013 97 -39.4%
2014 55 -43.3%
10. A total of 82 complaints/suggestions on tram services were received
during the period from January to September 2015, as compared with 40 cases
received in the same period last year. This represents an increase of 105%.
The cases received were mainly about improper driving behaviour and condition
of vehicle. A breakdown of the complaints and suggestions received is at
Annex L
Measures to Improve the Situation
11. For MTR services, to improve the services provided to passengers
during rail service disruption, MTRCL has enhanced information dissemination
during rail incident through MTR’s website and its mobile app “Traffic News”
and strengthening the manpower of its Customer Service Rapid Response Unit
for providing assistances to passengers. MTRCL would also monitor the
performance of the on-train video broadcasting and make appropriate adjustment

- 15 -
when required. Regarding conduct and performance of staff, MTRCL would
continue to reinforce the customer service training for frontline staff to uplift
their service competency. It was noted that a sizable number of complaints
were made in connection with passengers carrying oversized musical
instruments and sports equipment being prohibited from travelling on the MTR.
About this, MTRCL is conducting a review of the size limit on personal objects
allowed in the MTR network and a trial scheme on carriage of oversized musical
instruments has been launched since November this year.
12. For Light Rail services, MTRCL has enhanced the frequencies of some
Light Rail routes since March 2015 to better catering for passengers demand in
various periods.
13. For tram services, about 60% of the complaints were about the noise
created by tramcars near the junction of King's Road and Mount Parker Road.
Hong Kong Tramways Limited has informed their drivers to drive slowly and
conducted rail grinding and welding at the concerned location in response to the
complaints.
14. TD will continue to closely monitor the level of rail services provided,
the achievement of performance requirements and the effectiveness of
contingency transport arrangements during rail service disruption, and work with
MTRCL and Hong Kong Tramways Limited to explore further improvement
measures if necessary.
15. TCU would continue to closely monitor and follow up on complaints
and suggestions on rail services.

Annex A(i)
Complaints and Suggestions Received by TCU
Nature of Complaint/Suggestion
Same quarter
last year
(1.7.14-30.9.14)
Previous
quarter
(1.4.15-30.6.15)
Current
quarter
(1.7.15-30.9.15)
I. Public Transport Services
(a) Adequacy of service 448 [20] 258 [22] 297 [20]
(b) Standard of service 6 066 [4] 5 041 [7] 5 746 [4]
(c) General 168 [9] 124 [4] 177 [11]
6 682 [33] (90%) 5 423 [33] (88%) 6 220 [35] (90%)
II. Traffic Conditions
(a) Traffic congestion 71 [1] 66 [3] 46 [1]
(b) Traffic management 41 [6] 38 [10] 32 [8]
(c) Additional traffic signs and aids 17 [4] 23 [3] 24 [11]
(d) Parking facilities 19 9 [2] 10 [3]
148 [11] (2%) 136 [18] (2%) 112 [23] (1%)
III. Road Maintenance
(a) Road conditions 26 20 16
(b) Traffic signs and aids 16 3 5
(c) Carriageway markings 1 3 2
43 (1%) 26 (1%) 23 (1%)
IV. Enforcement
(a) Illegal parking 306 368 387 [1]
(b) Other enforcement matters 138 151 [1] 139
444 (6%) 519 [1] (8%) 526 [1] (7%)
V. Miscellaneous 25 [2] (1%) 36 [1] (1%) 34 [2] (1%)
Total 7 342 [46] (100%) 6 140 [53] (100%) 6 915 [61] (100%)
Notes : (1) Figures in square brackets are the number of pure suggestions received in the quarter.
The figures have been included in the overall number of cases received.
(2) Percentage figures in brackets represent the proportion of a category of complaints/
suggestions to the total number of cases received in the quarter.
- 16 -

0
1000
2000
3000
4000
5000
6000
7000
10-12/13 1-3/14 4-6/14 7-9/14 10-12/14 1-3/15 4-6/15 7-9/15
6490
5424
5885
7342
6112
5142
6140
6915
No
. o
f co
mp
lain
ts /
su
gg
esti
on
s .
.
Quarter
Complaints and Suggestions Received by TCU
Public Transport Services Traffic Conditions Road Maintenance Enforcement Miscellaneous
Annex A(ii)
-1
6 -
- 17
-
17315
20248 2019019308
16861
17624
18882
22405
2413324763
12767
15323 15402 15352
1378014606 16492
20061
2184722550
1217 11541184
897662 719 600 557 529 473
364 354 318
291 227 222 194 187 155 126
2548
3035 2968
2500
1995 1891
14611475 1510 1527
419 382 318
268 197 186 135 125 92 87 0
1000
2000
3000
4000
5000
6000
7000
8000
0
5000
10000
15000
20000
25000
2005 2006 2007 2008 2009 2010 2011 2012 2013 2014
No
. o
f co
mpla
ints
/ s
ugg
esti
on
s
No.
of
com
pla
ints
/ s
ugges
tions
..
Year
Trends of Complaints and Suggestions Received by TCU
(2005 - 2014)
All Public Transport Services Traffic Conditions Road Maintenance Enforcement Miscellaneous
Annex B(i)
-1
7 -
- 18
-

44804462
5251
4689 4501
5403
6445
6056
4834
5890
6919
6490
5424
5885
7342
6112
5142
6140
6915
3940 3915
4634
4003 3938
4865
5821
5437
4349
5299
6263
5936
4940
5394
6682
5534
4524
5423
6220
138 149 167146 119 121
168 149 127 126170
106 100 93
148132
96136 112
4832
56 58 38 49 48 5229 35
5239 16 41 43 26 23
26 23
316340 353
452
372335
375 393
306
409 410385
342 343
444398
467519 526
38 26 41 30 34 33 33 25 23 21 24 24 26 14 25 22 3236 34
0
200
400
600
800
1000
1200
1400
1600
1800
0
1000
2000
3000
4000
5000
6000
7000
8000
1-3/11 4-6/11 7-9/11 10-12/11 1-3/12 4-6/12 7-9/12 10-12/12 1-3/13 4-6/13 7-9/13 10-12/13 1-3/14 4-6/14 7-9/14 10-12/14 1-3/15 4-6/15 7-9/15
No
. o
f co
mp
lain
ts /
su
gg
esti
on
s .
.
No
. o
f co
mp
lain
ts /
su
gg
esti
on
s .
.
Quarter
All Public Transport Services Traffic Conditions Road Maintenance Enforcement Miscellaneous
Trends of Complaints and Suggestions Received by TCU
(January 2011 - September 2015)
Annex B(ii)
-1
8 -
- 19
-
Annex C(i)
Summary of Results of Investigations into Complaints and Suggestions
(July – September 2015)
Outcome of Investigation
Nature of Complaint/
Suggestion
A1
A2
B
C
Total
I. Public Transport Services
(a) Adequacy of service 13 199 39 2 253
(b) Standard of service 1 203 2 009 79 1 799 5 090
(c) General 64 50 4 7 125
1 280 2 258 122 1 808 5 468
II. Traffic Conditions
(a) Traffic congestion 34 34 2 - 70
(b) Traffic management 4 21 13 - 38
(c) Additional traffic signs/aids 3 6 9 - 18
(d) Parking facilities 4 5 2 - 11
45 66 26 - 137
III. Road Maintenance
(a) Road conditions 17 - 1 2 20
(b) Traffic signs and aids 2 - 1 - 3
(c) Carriageway markings 3 - - - 3
22 - 2 2 26
IV. Enforcement
(a) Illegal parking 299 62 1 - 362
(b) Other enforcement matters 35 39 - 65 139
334 101 1 65 501
V. Miscellaneous 19 13 2 - 34
Total 1 700 2 438 153 1 875 6 166
(28%) (40%) (2%) (30%) (100%)
Legend
A1 - Substantiated (Action completed/in hand)
A2 - Substantiated (Action requiring further consideration)
B - Unsubstantiated
C - Non-pursuable
- 20 -

Annex C(ii)
Summary of Results of Investigations into
Complaints and Suggestions on Public Transport Services
(July – September 2015)
Outcome of Investigation
Mode of Transport
A1
A2
B
C
Total
The Kowloon Motor Bus Company (1933) Limited
308 441 30 7 786
Citybus Limited (Franchise 1) 39 76 18 1 134
Citybus Limited (Franchise 2) 12 34 5 - 51
The New World First Bus Services
Limited 26 84 16 5 131
The New Lantao Bus Company
(1973) Limited 11 7 1 - 19
Long Win Bus Company Limited 25 31 2 - 58
Cross-harbour Bus Services 83 207 19 3 312
Non-franchised Bus Services 13 27 - 1 41
Green Minibus 624 431 17 26 1 098
Red Minibus 56 15 1 7 79
Taxi 43 823 - 1 755 2 621
MTR Corporation Limited (Excluding Light Rail)
29 59 10 3 101
MTR Corporation Limited
(Light Rail)
3 5 3 - 11
The Hongkong Tramways Limited 5 4 - - 9
New World First Ferry Services Limited
2 10 - - 12
The “Star” Ferry Company Limited - - - - -
Minor Ferries 1 4 - - 5
Total 1 280
(24%)
2 258
(41%)
122
(2%)
1 808
(33%)
5 468
(100%)
Legend
A1 - Substantiated (Action completed/in hand)
A2 - Substantiated (Action requiring further consideration)
B - Unsubstantiated
C - Non-pursuable
- 21 -
Annex D
Public Suggestions Taken on Board by
Relevant Government Departments/Public Transport Operators
(July– September 2015)
I. Public Transport Services
Add queue markings at a bus stop at Man Kwong Street to facilitate passengers.
Relocate a bus stop at Man Cheung Street to facilitate passenger
boarding/alighting and alleviate traffic congestion.
Extend the bus bay at Prince Edward Road East to improve traffic flow and
facilitate passenger boarding.
Add queue markings at a green minibus stop at Fanling Station Road to facilitate
passengers.
Add railings, bollards and movable chains at a taxi stand in the Lok Ma Chau
Spur Line Public Transport Interchange to facilitate the queuing of passengers.
II. Traffic Management
Hong Kong Island
Increase the vehicular green time of traffic lights at Des Voeux Road Central to
alleviate traffic congestion.
Add a "Keep Clear" road marking at Shell Street to prevent vehicle obstruction.
Extend a box junction road marking at the junction of Morrison Hill Road and
Sung Tak Street to improve traffic flow.
Add a box junction road marking at the junction of Stewart Road and Lockhart
Road to prevent vehicle obstruction.
- 22 -
Kowloon
Add traffic signs at Fir Street to alert motorists of pedestrian crossings ahead.
Add "Except Public Light Buses" traffic signs at Ngau Tau Kok Road Bus
Terminus to remind motorists.
Add road markings at Sheung Yee Road to improve road safety.
Add parking spaces for motorcycles at Fung Shing Street to facilitate parking of
motorcycles.
New Territories
Increase the vehicular green time of a traffic light at Shek Kok Road westbound
during daytime and peak hours to improve traffic flow.
Modify "No Stopping" restriction at Clear Water Bay Road near Tai Po Tsai
Village to facilitate loading/unloading activities.
Install additional bollards at Sha Tin Tau Road to deter illegal parking on
pavement and improve road safety.
]
- 23 -
Complaints and Suggestions on Public Transport Services
(July – September 2015)
Mode Vehicular Transport Rail Transport Waterborne
Transport
Total/
Franchised Buses
MTR
Sub-
(Non- MTR total
Nature of Complaint/Suggestion KMB CTB1 CTB2 FB NLB LWB XHT NFBS GMB RMB Taxi LR) (LR) HT FF SF MF
(A) Adequacy of Service
(1) Frequency/carrying capacity 54 2 5 3 5 1 21 7 122 - - 2 2 - 2 - - 226
(2) Routeing 23 - - 3 - 1 4 11 6 - - 1 - - - - - 49
(3) Hours of operation - - - - - 1 1 - - - - - - - - - - 2
(4) Provision of stops 12 2 - - - - 1 2 3 - - - - - - - - 20
Sub-total 89 4 5 6 5 3 27 20 131 - - 3 2 - 2 - - 297
(B) Standard of Service
(1) Regularity of service 340 71 20 64 4 34 154 18 360 - - 15 1 1 2 1 1 1086
(2) Adherence to routeing 6 - - 2 - - 1 1 83 - 464 - - - - - - 557
(3) Improper driving behaviour 86 24 11 9 8 6 36 5 247 41 374 4 - 12 - - - 863
(4) Conduct & performance of
staff (including drivers) 151 31 18 36 10 17 70 7 403 29 1505 37 2 3 1 - 2 2322
(5) Overcharging 1 - 2 1 1 - - - 16 2 534 * - - - - - - 557
(6) Cleanliness 5 - - - - - - - 21 2 5 - - - - - - 33
(7) Conditions of vehicles/vessels 12 3 3 2 - 2 1 1 14 - 14 3 - 7 1 - 2 65
(8) Passenger services & facilities 102 16 2 9 5 4 30 4 25 2 4 52 - 3 1 1 3 263 #
Sub-total 703 145 56 123 28 63 292 36 1169 76 2900 111 3 26 5 2 8 5746
(C) General 30 9 - 3 - 1 7 - 18 13 66 22 - 8 - - - 177
Total this quarter 822 158 61 132 33 67 326 56 1318 89 2966 136 5 34 7 2 8 6220
Grand-total (1599) (4429) (175) (17)
Total previous quarter 797 141 56 144 19 64 310 54 1134 76 2466 116 11 14 13 - 8 5423
Total same quarter last year 1343 222 53 197 23 58 535 62 1090 75 2773 193 14 7 24 1 12 6682
DRAFT
(Internal Reference)
Legend
KMB The Kowloon Motor Bus Company (1933) Limited
CTB1 Citybus Limited (Franchise 1)
CTB2 Citybus Limited (Franchise 2)
FB The New World First Bus Services
Limited
NLB The New Lantao Bus Company (1973) Limited
LWB Long Win Bus Company Limited
XHT Cross-harbour Bus Services
NFBS Non-franchised Bus Services
GMB Green Minibus
RMB Red Minibus
MTR MTR Corporation Limited
(Non-LR) (Excluding Light Rail)
MTR(LR) MTR Corporation Limited
(Light Rail)
HT The Hongkong Tramways Limited
FF New World First Ferry Services
Limited
SF The ‘Star’ Ferry Company Limited
MF Minor Ferries
Annex E(i)
- 30 -
- 24
-
*
#
Including taximeter irregularities
Including 54 complaints from
25 complainants about audio-visual
broadcasting on public transport
vehicles
3940 3915
4634
4003 3938
4865
5821
5437
4349
5299
6263
5936
4940
5394
6682
5534
4524
5423
6220
712
10081199
917838
1425
21021943 1454 1847
2340
17831588
18002431
1623
1174
1531 1599
746
777991
854 8211043 1080
910799
9471095
907789
9541165 1247
874
1210 1407
2364
2028
2308
20892134 2186
2415 2344
1954
2307
25992446
23232466
2773
2498
22592466
2966
86 6883 81 109 149 162 179
89 134 139720
115116
214118 161 141 175
32 3453 62 36 62 62 61 53 64 90 80
12558 99 48 56 75 73
0
500
1000
1500
2000
2500
3000
3500
4000
4500
5000
5500
6000
6500
7000
1-3/11 4-6/11 7-9/11 10-12/11 1-3/12 4-6/12 7-9/12 10-12/12 1-3/13 4-6/13 7-9/13 10-12/13 1-3/14 4-6/14 7-9/14 10-12/14 1-3/15 4-6/15 7-9/15
No
. o
f co
mp
lain
ts /
su
gg
esti
on
s .
.
Quarter
Trends of Complaints and Suggestions on Public Transport Services
(January 2011 - September 2015)
All Franchised Buses Public Light Buses Taxi Rail Others
Annex E(ii)
-2
5 -
- 25
-
0
100
200
300
400
500
600
700
800
900
1000
1100
1200
1300
1400
10-12/13 1-3/14 4-6/14 7-9/14 10-12/14 1-3/15 4-6/15 7-9/15
1001
825
984
1343
793
639
797 822
No.
of
com
pla
ints
/ s
ugges
tions
..
Quarter
Complaints and Suggestions on the Services of Kowloon Motor Bus Company (1933) Limited
in the Past Eight Quarters
Adequacy of Service Standard of Service General
Annex F(i)
-2
6 -
- 26
-
0
50
100
150
200
250
300
350
400
450
500
550
10-12/13 1-3/14 4-6/14 7-9/14 10-12/14 1-3/15 4-6/15 7-9/15
154
180158
222
167
110
141158
No.
of
com
pla
ints
/ s
ugges
tions
..
Quarter
Complaints and Suggestions on the Services of Citybus Limited (Franchise 1)
in the Past Eight Quarters
Adequacy of Service Standard of Service General
Annex F(ii)
-2
7 -
- 27
-
0
50
100
150
200
250
300
350
400
450
500
550
10-12/13 1-3/14 4-6/14 7-9/14 10-12/14 1-3/15 4-6/15 7-9/15
144 138 138
197
156
78
144 132
No.
of
com
pla
ints
/ s
ugges
tions
..
Quarter
Complaints and Suggestions on the Services of New World First Bus Services Limited
in the Past Eight Quarters
Adequacy of Service Standard of Service General
Annex F(iii)
-2
8 -
- 28
-
0
200
400
600
800
1000
1200
1400
1600
1800
2000
2200
2400
2600
2800
3000
10-12/13 1-3/14 4-6/14 7-9/14 10-12/14 1-3/15 4-6/15 7-9/15
2446 2323
2466
2773
2498
2259
2466
2966
No
. o
f co
mp
lain
ts /
su
gg
esti
on
s .
.
Quarter
Complaints and Suggestions on Taxi Services
in the Past Eight Quarters
Conduct and performance of drivers Improper driving behaviour Overcharging and taximeter irregularities
Failure to take the most direct route Others
Annex G
-2
9 -
- 29
-

Annex H
Breakdown of Complaints and Suggestions on Taxi Services
Nature of Complaint/Suggestion
Same quarter
last year
(1.7.14-30.9.14)
Previous
quarter
(1.4.15-30.6.15)
Current
quarter
(1.7.15-30.9.15)
(a) Conduct and performance of drivers
(i) Behaving other than in a
civil & orderly manner
544 465 523
(ii) Refusing hire 730 675 829
(iii) Soliciting passengers 1 6 3
(iv) Refusing to drive to
destination
116 125 130
(v) Failure to display driver
identity plate
11 10 16
(vi) Failure to display driver
identity plate properly
3 - 4
Sub-total 1 405 1 281 1 505
(b) Improper driving behaviour 317 320 374
(c) Overcharging 394 377 446
(d) Taximeter irregularities 80 62 88
(e) Failure to take the most direct
route
519 359 464
(f) Others* 58 67 89
Total 2 773 2 466 2 966
* These complaints/suggestions are mainly related to taxi obstruction and conditions of
vehicles.
- 30 -
Annex I
Complaints and Suggestions on Traffic and Road Conditions
(July – September 2015)
Hong Kong Island Kowloon New Territories Oth
ers
(e.g
. g
en
era
l issu
es
and
tu
nn
el
are
as)
Total
District
Nature of Complaint/Suggestion
Eastern
Wan
Chai
Cen
tral & W
estern
South
ern
Kw
un T
ong
Wong T
ai Sin
Kow
loon C
ity
Sham
Shui P
o
Yau
Tsim
Mong
North
Tai P
o
Sha T
in
Yuen
Long
Tuen
Mun
Tsu
en W
an
Kw
ai Tsin
g
Sai K
ung
Islands
Traffic Conditions (a) Traffic congestion 4 2 1 11 - 1 10 - 5 3 2 1 2 2 - 1 1 - - 46
(No. of locations) (4) (2) (1) (5) (-) (1) (7) (-) (5) (1) (1) (1) (2) (2) (-) (1) (1) (-) (-) (34) (b) Traffic management 3 - 1 2 5 1 3 3 4 - 4 - 2 - 2 1 - 1 - 32 (c) Additional traffic signs and aids - 2 3 - 1 - 1 3 2 1 1 1 4 1 - - 2 1 1 24 (d) Parking facilities 1 - 2 - 1 1 1 1 - - - 1 - - - - - - 2 10
Sub-total 8 4 7 13 7 3 15 7 11 4 7 3 8 3 2 2 3 2 3 112 Road Maintenance (a) Road conditions - 1 1 - 1 - - 1 2 - - 2 1 - 1 2 2 2 - 16 (b) Traffic signs & aids 1 - - - - - - 1 - - - 1 - - - - - 1 1 5 (c) Carriageway markings - - - - - - - - 1 - - - - - - - - - 1 2
Sub-total 1 1 1 - 1 - - 2 3 - - 3 1 - 1 2 2 3 2 23 Enforcement (a) Illegal parking 31 19 28 7 48 11 31 19 46 13 8 25 29 17 18 15 21 - 1 387 (b) Other enforcement matters 6 5 5 4 8 4 9 7 21 8 4 9 18 7 8 9 2 4 1 139
Sub-total 37 24 33 11 56 15 40 26 67 21 12 34 47 24 26 24 23 4 2 526 Total 46 29 41 24 64 18 55 35 81 25 19 40 56 27 29 28 28 9 7 661
- 2
- 31
-
Annex J
Complaints and Suggestions on MTR Services (excluding Light Rail)
Nature of Complaint/Suggestion
2014
Jan - Sep
2015
Jan - Sep
Difference
(A) Adequacy of Service
(1) Frequency/carrying capacity 17 17 10 -41.2%
(2) Routeing 1 1 1 -
(3) Hours of operation - - - -
(4) Provision of stops - - - -
Sub-total 18 18 11 -38.9%
(B) Standard of Service
(1) Regularity of service 25 25 31 +24.0%
(2) Adherence to routeing - - - -
(3) Improper driving behaviour 14 14 19 +35.7%
(4) Conduct and performance of
staff (including drivers)
68 68 101 +48.5%
(5) Overcharging 1 1 1 -
(6) Cleanliness 3 3 3 -
(7) Conditions of vehicles 14 14 10 -28.6%
(8) Passenger services and
facilities
172 172 154 -10.5%
Sub-total 297 297 319 +7.4%
(C) General 55 55 34 -38.2%
Total 370 370 364 -1.6%
- 32 -

Annex K
Complaints and Suggestions on Light Rail Services
Nature of Complaint/Suggestion
2014
Jan - Sep
2015
Jan - Sep
Difference
(A) Adequacy of Service
(1) Frequency/carrying capacity 8 8 -
(2) Routeing - - -
(3) Hours of operation - 1 -
(4) Provision of stops - - -
Sub-total 8 9 +12.5%
(B) Standard of Service
(1) Regularity of service 5 3 -40.0%
(2) Adherence to routeing - - -
(3) Improper driving behaviour 6 4 -33.3%
(4) Conduct and performance of
staff (including drivers)
2 4 +100.0%
(5) Overcharging - - -
(6) Cleanliness 2 - -100.0%
(7) Conditions of vehicles 1 - -100.0%
(8) Passenger services and
facilities
4 6 +50.0%
Sub-total 20 17 -15.0%
(C) General 6 5 -16.7%
Total 34 31 -8.8%
- 33 -
Annex L
Complaints and Suggestions on Tram Services
Nature of Complaint/Suggestion
2014
Jan - Sep
2015
Jan - Sep
Difference
(A) Adequacy of Service
(1) Frequency/carrying capacity - - -
(2) Routeing - - -
(3) Hours of operation - - -
(4) Provision of stops - - -
Sub-total - - -
(B) Standard of Service
(1) Regularity of service 1 3 +200.0%
(2) Adherence to routeing 1 - -100.0%
(3) Improper driving behaviour 18 39 +116.7%
(4) Conduct and performance of
staff (including drivers)
5 6 +20.0%
(5) Overcharging - - -
(6) Cleanliness - - -
(7) Conditions of vehicles 2 22 +1,000.0%
(8) Passenger services and
facilities
8 4 -50.0%
Sub-total 35 74 +111.4%
(C) General 5 8 +60.0%
Total 40 82 +105.0%
- 34 -

Annex M
How to Make Suggestions and Complaints
to the Transport Complaints Unit
Members of the public may contact the Transport Complaints Unit
(TCU) by phone if they have any suggestions or complaints to make about
transport matters. The TCU hotline at 2889 9999 is manned during office hours
and a voice mail service is provided outside office hours.
Alternatively, they may fill in the appropriate forms (Transport
Complaint Form and Taxi Complaint Form) and post them to P.O. Box 12430,
G.P.O. These forms are obtainable from the District Offices and the Transport
Department.
They may also write to the Executive Secretary of the TCU at the
following address -
Transport Complaints Unit
20/F East Wing
Central Government Offices
2 Tim Mei Avenue
Tamar
Hong Kong.
The TCU has a faxline 2577 1858, an e-mail address [email protected]
and a website www.info.gov.hk/tcu, through which the public may send their
suggestions or complaints to the Unit.
- 35 -