
t)BLUE TRACTOR - SEC.gov | HOME · t)blue tractor cannot be sugar coated by the qualitative...
19
t) BLU E T RACTOR November 29, 2017 Brent J. Fields Secretary U.S. Securities and Exchange Commission 100 F Street, NE Washington DC 20549-1090 RE: Notice of Designation of a Longer Period for Commission Action on a Proposed Rule Change to Adopt a New NYSE Arca Equities Rule 8.900 and to List and Trade Shares of the Royce Pennsylvania ETF, Royce Premier ETF, and Royce Total Return ETF under Proposed NYSE Arca Equities Rule 8.900 (Release No. 34-81977; File No. SR-NYSEArca-2017-36) Dear Mr. Fields, On behalf of Blue Tractor Group, LLC (“Blue Tractor”) I am again pleased to provide the U.S. Securities and Exchange Commission (the “Commission”) with comments regarding the Commission’s October 30, 2017 notice (the “Notice”) designating a longer period whether to approve or disapprove the rule change application submitted on April 14, 2017 by NYSE Arca, Inc. (the “Exchange”). 1, 2 This comment letter complements the two letters I submitted to the Commission on July 18, 2017 and October 31, 2017. 3 Please note that this letter contains an updated statistical report from Dr. Anthony Hayter from the University of Denver – see attached Exhibit One. Fundamental to my comments is the intellectual property developed by Precidian Investments LLC (“Precidian”) that underpin the three exchange traded funds (the “ETF Funds”) sub-advised by Royce & 4, 5, 6 Associates, LP (“Royce”) that the Exchange proposes to list and trade. As importantly, this letter references the memorandum published by the Commission’s Division of Economic Risk and Analysis on November 16, 2017 entitled “Inferring Non-Transparent ETF Portfolio Holdings” (“DERA” and the “DERA Memorandum”). 7 Of note, the DERA Memorandum validates that the Precidian ETF structure can be reverse engineered by a variety of statistical and optimization techniques. It is a fact that reverse engineering a non-transparent portfolio is an exercise in statistics and data analysis. Whether it is or is not possible to reverse engineer the Precidian ETF structure is a quantitative issue that 1 See https://www.sec.gov/rules/sro/nysearca/2017/34-81977.pdf (Release No. 34-81977; File No. SR-NYSEArca-2017-36) 2 As background, I am the founder of Blue Tractor Group, LLC, which on July 31, 2017 filed a third amended and restated application for exemptive relief with the Commission for the Shielded Alpha℠ ETF structure. I am a graduate of the University of London (mathematics) in England and have worked and consulted for over 30 years in both England and United States for many financial institutions, primarily developing and constructing quantitative models related to alpha generation and risk management. I am the sole inventor of the methods and ideas underpinning the Shielded Alpha℠ ETF structure, which is a completely different concept to the non-transparent exchange traded fund structures proposed by Precidian and others that are currently being reviewed by the Commission. 3 See https://www.sec.gov/comments/sr-nysearca-2017-36/nysearca201736.htm (see the two letters from Terence W. Norman) 4 See https://www.nyse.com/publicdocs/nyse/markets/nyse-arca/rule-filings/filings/2017/NYSEArca-2017-36,%20Re-file.pdf (Release No. 30- 80553; File No. SR-NYSEArca-2017-36) 5 https://www.roycefunds.com/ 6 https://www.sec.gov/Archives/edgar/data/1701878/000114420417018966/v463050_n1a.htm 7 https://www.sec.gov/comments/sr-nysearca-2017-36/nysearca201736.htm#studies (see SEC Staff Studies and Reports) Blue Tractor Group, LLC | 57 West 57 th Street, 4 th Floor, New York, NY 10019 | (212) 847-1370 | bluetractorgroup.com
Transcript of t)BLUE TRACTOR - SEC.gov | HOME · t)blue tractor cannot be sugar coated by the qualitative...
t)BLUE TRACTOR
November 29 2017
Brent J Fields
Secretary
US Securities and Exchange Commission
100 F Street NE
Washington DC 20549-1090
RE Notice of Designation of a Longer Period for Commission Action on a Proposed Rule Change to
Adopt a New NYSE Arca Equities Rule 8900 and to List and Trade Shares of the Royce
Pennsylvania ETF Royce Premier ETF and Royce Total Return ETF under Proposed NYSE Arca
Equities Rule 8900 (Release No 34-81977 File No SR-NYSEArca-2017-36)
Dear Mr Fields
On behalf of Blue Tractor Group LLC (ldquoBlue Tractorrdquo) I am again pleased to provide the US Securities and
Exchange Commission (the ldquoCommissionrdquo) with comments regarding the Commissionrsquos October 30 2017
notice (the ldquoNoticerdquo) designating a longer period whether to approve or disapprove the rule change
application submitted on April 14 2017 by NYSE Arca Inc (the ldquoExchangerdquo) 1 2
This comment letter complements the two letters I submitted to the Commission on July 18 2017 and
October 31 2017 3 Please note that this letter contains an updated statistical report from Dr Anthony
Hayter from the University of Denver ndash see attached Exhibit One
Fundamental to my comments is the intellectual property developed by Precidian Investments LLC
(ldquoPrecidianrdquo) that underpin the three exchange traded funds (the ldquoETF Fundsrdquo) sub-advised by Royce amp 4 5 6Associates LP (ldquoRoycerdquo) that the Exchange proposes to list and trade
As importantly this letter references the memorandum published by the Commissionrsquos Division of Economic Risk and Analysis on November 16 2017 entitled ldquoInferring Non-Transparent ETF Portfolio
Holdingsrdquo (ldquoDERArdquo and the ldquoDERA Memorandumrdquo) 7 Of note the DERA Memorandum validates that the
Precidian ETF structure can be reverse engineered by a variety of statistical and optimization techniques
It is a fact that reverse engineering a non-transparent portfolio is an exercise in statistics and data analysis
Whether it is or is not possible to reverse engineer the Precidian ETF structure is a quantitative issue that
1 See httpswwwsecgovrulessronysearca201734-81977pdf (Release No 34-81977 File No SR-NYSEArca-2017-36) 2 As background I am the founder of Blue Tractor Group LLC which on July 31 2017 filed a third amended and restated application for exemptive relief with the Commission for the Shielded Alpha ETF structure I am a graduate of the University of London (mathematics) in England and have worked and consulted for over 30 years in both England and United States for many financial institutions primarily developing and constructing quantitative models related to alpha generation and risk management I am the sole inventor of the methods and ideas underpinning the Shielded Alpha ETF structure which is a completely different concept to the non-transparent exchange traded fund structures proposed by Precidian and others that are currently being reviewed by the Commission 3 See httpswwwsecgovcommentssr-nysearca-2017-36nysearca201736htm (see the two letters from Terence W Norman) 4 See httpswwwnysecompublicdocsnysemarketsnyse-arcarule-filingsfilings2017NYSEArca-2017-3620Re-filepdf (Release No 30-80553 File No SR-NYSEArca-2017-36) 5 httpswwwroycefundscom 6 httpswwwsecgovArchivesedgardata1701878000114420417018966v463050_n1ahtm 7 httpswwwsecgovcommentssr-nysearca-2017-36nysearca201736htmstudies (see SEC Staff Studies and Reports)
Blue Tractor Group LLC | 57 West 57th Street 4th Floor New York NY 10019 | (212) 847-1370 | bluetractorgroupcom
t)BLUE TRACTOR
cannot be sugar coated by the qualitative protests by Messrs McCabe and Criscitello in their letters to
the Commission 8 - mathematics is the only arbiter to prove or disprove the issue
On that note it remains perplexing that Precidian or its consultants havenrsquot to date presented additional
quantitative evidence to counter the claims made in my July 18 2017 and October 31 2017 letters
If Precidian still firmly believe it is lsquohighly unlikelyrsquo that their structure can be reverse engineered then
they must present detailed mathematical evidence to counter my specific examples and they should not
be allowed to generalize simply by referencing the discredited studies prepared by Drs Cooper and
Glosten
No doubt Precidian has again privately approached the Commission in an attempt to assuage concerns
about reverse engineering and resulting predatory front running While Precidian has demonstrated little
interest in public discourse I would respectfully suggest that any new statistical evidence they present be
released by the Commission into the public domain so that it can be peer reviewed to confirm or refute
any claims contained within
Peer review by Blue Tractor and DERA of the studies prepared by Drs Cooper and Glosten provided a vital
counter balance to the now wholly discredited claim and belief of Precidian that their ETF structure cannot
be reverse engineered
So to summarize
1 Precidian continues to rely on the analyses prepared by Drs Cooper and Glosten that are now
discredited
2 To date Precidian is unable to present mathematical evidence that refutes the concerns raised in
my two previous letters (and accompany reports by Dr Hayter)
3 Precidian says that the concerns raised by Blue Tractor emanate from a lsquofinancial conflict of
interestrsquo and lsquoan attempt to stifle innovationrsquo rather than recognize that the mathematics they
have relied on are fundamentally flawed
4 Since Precidianrsquos core argument on reverse engineering has been shown to be false then what
confidence can the Commission have in the veracity of other major claims they have made
including predatory front running efficient markets arbitrage hedging and the like (see public
comment letters listing these issues from Simon Goulet and Gary Gastineau 9) and
5 Furthermore DERA has now provided independent confirmatory analysis that the Precidian ETF
structure can be reverse engineered (see ldquoDERA Memorandumrdquo section)
8 See httpswwwsecgovcommentssr-nysearca-2017-36nysearca201736htm (see letters from Messrs Criscitello and McCabe) 9 See httpswwwsecgovcommentssr-nysearca-2017-36nysearca201736htm (see letters from Simon Goulet amp Gary Gastineau)
2 | P a g e
t)BLUE TRACTOR
DERA Memorandum
The November 16 2017 DERA Memorandum fully supports the concerns I document in my July 18 2017
and October 31 2017 letters that Precidianrsquos lsquostylised methodologyrsquo for the verified intra-day indicative
value (ldquoVIIVrdquo) is highly vulnerable to reverse engineering 10
DERArsquos most telling observations were on pages 3 through 6 where they
1 Question Dr Cooper and Dr Glostenrsquos formulation of the reverse engineering problem
2 Question the statistical methods employed by Dr Cooper and Dr Glosten and
3 Question Dr Cooper and Dr Glostenrsquos conclusions
In stark contrast the DERA Memorandum states on page 6 that ldquoHayter estimates the correct regression
specification in levelshelliprdquo and then concludes with the statement ldquohellipthe two-pass aspect of his regression
approach is an example of an alternative estimation technique that potentially improves upon the
standard OLS and LASSO estimationshelliprdquo
The DERA Memorandum then presents a clever approach that poses an ordinary least squares problem
as a quadratic program (ldquoQP-OLSrdquo)
The bottom line is that in contrast to Drs Cooper and Glosten both DERA and Dr Hayter have
demonstrated how to correctly formulate the problem of reverse engineering the Precidian ETF structure
and then present methods to do so
Additional key observations in the DERA Memorandum include
1 By limiting the number of stocks in a fund and the fundrsquos investable universe reverse
engineering is made easier
2 The success of reverse engineering is dependent upon both correct formulation of the
regression problem and the method used
3 The success of an attempt to reverse engineer is dependent upon the number of observations
available
a For a small stock universe a single dayrsquos observations may be sufficient b For a larger stock universe multi-day observation may be required and
c As the expected number of fund holdings increase in both small and larger stock
universes while the problem of reverse engineering becomes more complex it does not
become intractable
4 Affirmation that just because one party is unable to undertake reverse engineering it does not
follow that another party will be unable to do so and
10 I note that the DERA Memorandum refers only to the analysis from Dr Hayter contained in my July 18 2017 letter
3 | P a g e
t)BLUE TRACTOR
5 That initial successful iterations in a reverse engineering problem should be considered the
lower bound of what is achievable Indeed DERA states on page 6 of their memorandum that
ldquoAny success in reverse-engineering the portfolio weights should therefore be considered a lower
bound [emphasis added] on what is possiblerdquo
The DERA Memorandum puts to rest any doubt that Precidianrsquos lsquostylized methodologyrsquo for VIIV cannot be
reverse engineered The claim by Messrs McCabe and Criscitello that their structure is immune to reverse
engineering is patently false
To that end an active mutual fund manager considering using the Precidian ETF structure is by default
considering utilizing a transparent active ETF structure
However insofar that it will be lsquotransparentrsquo to predatory traders it will not trade efficiently for investors like currently approved transparent actively managed ETFs do because itrsquos use of a third-party structure
to facilitate creation arbitrage and hedging means it will be less efficient in both the primary and
secondary markets In that light better for the active mutual fund manager to simply opt for todayrsquos transparent active ETF structures already granted exemptive relief by the Commission
Finally from the work undertaken by DERA and Dr Hayter a basic lsquorecipersquo for reverse engineering is now in the public domain
1 Determine the size of the stock universe
2 Overestimate the number of stocks expected in the fund (readily available from quarterly
disclosures)
3 Determine if single or multi-day observations are needed
4 Mathematically formulate the problem correctly
5 Incorporate additional information gleaned from the fundrsquos SAI or other public sources into the math eg fund turnover sector constraints etc
6 Run ldquoartificial simulationsrsquo to fine tune the method using real data from the fundrsquos previously disclosed portfolio information and
7 Once the portfolio is ldquocrackedrdquo monitor over many trading days to detect the fund managerrsquos strategy and habits and when actual trades occur
I would also note that if an ETF fund using the Precidian structure also has a lsquomirrorrsquo mutual fund then both funds are at risk of predatory front running
Please refer to attached Exhibit One of this letter for an in-depth review of the DERA Memorandum by Dr
Hayter along with a further improved method for reverse engineering
4 | P a g e
t)BLUE TRACTOR
Front Running
The traders with the quantitative skill set to reverse engineer are of course the same traders who will then
bring their talents to predatory front running
Who are they They are the traders and strategists that work for hedge funds proprietary trading desks
and specialty trading houses both domestically and off-shore These traders combine capital markets
savvy with graduate and doctorate level degrees in computer sciences physics and mathematics 11 These
firms usually have unlimited computer resources at their disposal and their compensation models
motivate traders to take risk and be aggressive
The techniques outlined in the DERA Memorandum and by Dr Hayter are trivial to these mathematically
gifted individuals
So once the portfolio has been ldquocrackedrdquo these traders will then develop techniques to take maximum advantage of the fundrsquos trading patterns and strategy Time is on the predatory tradersrsquo side ndash once the
portfolio becomes visible they can sit back and fine tune their strategies before entering the market
unobserved by the fund They do not need to trade every day in front of the fund they will do so only
when profitable
The DERA Memorandum and the work by Dr Hayter clearly demonstrate that no fund using the Precidian
ETF structure regardless of the size of the fund or investable universe can be certain that their
undisclosed portfolio hasnrsquot been subject to reverse engineering and that lsquoalpharsquo is being skimmed by a predatory trader
I say this with tongue in cheek but a prospectus for funds using the Precidian ETF structure would have to
include under the risk section language to the effect that ldquoThese funds are extremely vulnerable to
predatory front-running which could negatively impact investor returnsrdquo
Conclusion
Precidian lists in Mr Criscitellorsquos October 11 2017 letter a long list of potential investor benefits under a
non-transparent ETF structure 12 Ironically what they donrsquot document is evidence that investors want a retrogressive non-transparent investment structure If the benefits Mr Criscitello lists can be accrued in
a much more transparent structure why would anyone want to invest in a non-transparent lsquoblack boxrsquo Indeed the success of the ETF market is built on the foundation of transparency Why would approval of
a wholly opaque non-transparent ETF be innovative
Blue Tractor would always encourage the Commission to permit novel products that improve investor
choice fulfill a real product demand enhance market efficiency and capital formation overcome known
financial obstacles through real innovation while always maintaining the spirit and integrity of existing
federal securities laws that promote lsquofair marketsrsquo and provide investor protection This last condition is
inviolable
11 httpswwwnytimescom20160223businessdealbooka-new-breed-of-trader-on-wall-street-coders-with-a-phdhtml (Note this article is for reference only and no explicit or implicit suggestion is made that any of the firms or individuals profiled are assumed to undertake predatory trading activities) 12 Note that Mr Criscitello cannot claim that the Precidian ETF structure would accrue all these benefits since it can be readily reverse engineered and will have inefficient primary and secondary markets as described in letters Simon Goulet and others submitted to the Commission
5 | P a g e
t)BLUE TRACTOR
Some market observers maintain that the Commission should approve every application it receives for
novel ETF structures and lsquoshould stand back and let the market decidersquo winners and losers Interesting thought and so long as an application for a novel structure clearly meets the legal spirit of federal
securities law to promote both lsquofair marketsrsquo and investor protection that could indeed be a viable
approach
However to recap the Precidian ETF structure does not solve any investor demand for non-transparent
products it will do nothing to enhance market efficiency it does not overcome any financial obstacles
since it is highly vulnerable to reverse engineering (and therefore front-running) and the asymmetric
disclosure of confidential portfolio information to privileged third parties clearly runs a foul of existing
federal securities law Therefore the Precidian ETF structure cannot be viewed with the same lens as
novel product applications that do meet all of these conditions
Moreover there is now confirmatory evidence from DERA that the Precidian ETF structure can be reverse
engineered
For these reasons the Exchangersquos rule change application should be disapproved
Thank you in advance for your consideration of my commentary I welcome any questions the
Commission may have as a result and can be reached at
Sincerely
Terence W Norman
Founder
Blue Tractor Group LLC
6 | P a g e
t)BLUE TRACTOR
HayterStatisticscom
November 261 2017
Notes on the November 16m 2017 Memorandum from the Division of Economic and Risk Analysis entitled
Inferring Non-Transparent ETF Portfolio Holdings
1 Overview
These notes provide some comments on the November 16th 2017 Memorandum from the Division of Economic and Risk Analysis (DERA) of the US Securities and Exchange Commission entitled Infening Non-Transparent ETF Portfolio Holdings
The DERA Memorandum provides a generally perceptive and well thoughtshyout discussion of the problem of reverse engineering a portfolio The DERA Memorandum considers the analyses presented in several repo1ts on this subject and also presents some original simulation results of their own The DERA Memorandum comes across as being a fair and unbiased assessment of the situation
It is interesting to note that in the DERA Memorandum the problem is specified in exactly the same way that I specified it in my initial rep01t The Reverse Engineering of Portfolio Compositions July 171 2017 The equation in the middle of page 1 of the DERA Memorandum is exactly identical to equation (1) on page 9 of my report with exactly the same weights which sum to one
The imp01tance of setting up the problem conectly in the first place cannot be overstated This is essential to the development of an algorithm that will successfully achieve reverse engineering It should be pointed out that neither Ricky Cooper nor Lawrence Glosten provided this equation in their work and they did not demonstrate that they had specified the problem conectly
1
EXHIBIT ONE
7 | P a g e
t)BLUE TRACTOR
Obviously a failed attempt at reverse engineering using a misspecified approach does not provide any illumination on the prospects of successfully achieving reverse engineering using a properly specified approach
2 REO Analysis
The REO approach is interesting in that it is based upon reh1rns from one time increment to the next (using 10 second increments in this case) rather than being based on price levels However as the DERA Memorandum explains this does not allow the precise estimation of what we are actually looking for Consequently this approach adds unnecessmy difficulty and noise to the problem
I agree with the DERA Memorandum that Over multiple days weight estimates based on returns will under-perform estimates based on price levels
3 Ricky Coopers Analysis
I agree with the discussion in the DERA Memorandum concerning how the problem is set up In the Cooper analysis the problem is poorly set up so that it is estimating the wrong thing with weights that do not sum to one
I agree with the DERA Memorandum that this analysis and inte1pretation has not fully accounting for the effects of scaling and I agree with the DERA Memorandum that there are inherent difficulties with regressing on unscaled prices (as in the Cooper analysis) rather than on scaled prices so that there are flaws in the operation and inte1pretation of the Cooper analysis
4 Lawrence Glostens Analysis
I agree with the DERA Memorandum that for the pmpose of reverse engineering an ETF s p01tfolio holdings small prediction e1rnrs are not the primmy objective and that with respect to LASSO it is not obvious a priori that it should outperfonn OLS In fact I think that there are clearly limitations to taking any off-the-shelf package and applying it to the problem of reverse engineering a p01tfolio Much more success is attainable with the development of an algorithm specifically for the reverse engineering problem at hand
2
8 | P a g e
t)BLUE TRACTOR
Again I agree with the discussion in the DERA Memorandum concerning how the problem is set up Again as the DERA Memorandum explains Because the regressors are not scaled the regression produces estimates of the number of shares of each security held These are quantities which do not sum to one
I think that the DERA Memorandum makes an impo11ant point in stating that Therefore it is possible that other LASSO implementations could achieve more accurate estimates of pmtfolio holdings This is a recognition that any failed attempt at reverse engineering does not prove that all attempts must fail
The DERA Memorandum confinns this by also stating that Finally Glosten s finding that OLS and LASSO are unable to accurately recover po1tfolio holdings for a larger universe of available pmtfolio securities (the Russell 1000) does not rule out the possibility that other techniques might perfo1111 better on stock tmiverses of the same size
5 Blue Tractors Analysis
This section of the DERA Memorandum comments on my initial repolt The Reverse Engineering of Po1tfolio Compositions July 17th 2017 However I issued a supplemental repmt on October 19th 2017 which is not refened to in the DERA Memorandum
The supplemental report considered more challenging scenarios than were considered in the initial repmt and it provided fuither analyses to confom that the reverse engineering of a po1tfolio is achievable with a substantial degree of accuracy
Specifically the differences between the analyses contained in the supplemental repmt and in my initial repmt are
bull Whereas the initial report only considered reporting of prices at time points IS -seconds apart which provides 1560 time points throughout a complete trading day in the supplemental repmt the repmting of prices at time points I-second apa1t is considered which provides 23 400 time points throughout a complete trading day
bull Whereas the initial report considered a universe of k = 100 potential stocks in the supplemental repmt the more challenging scenario of a universe of k = 1000 potential stocks is considered The reverse engineering of
3
9 | P a g e
t)BLUE TRACTOR
po1tfolios consisting of both 130 and 80 stocks out of this universe of k = 1000 potential stocks is demonstrated
bull Finally the implementation of more sophisticated multi -day reverse engineering methodologies is demonstrated in the supplemental report which more closely model how a serious attempt at reverse engineering would be made in practice
While it is conect that my analysis uses a single average conelation value across the simulated stock universe as pointed out in the DERA Memorandum I actually present worst-case average and best-case scenarios for the stock variabilities and correlations in an attempt to encompass real scenarios
I note the recognition in the DERA Memorandum (Hayter estimates the corTect regression specification) of the importance of setting up the problem corTectly
As the DERA Memorandum notes Hayter uses a two-pass approach the above regression is estimated any stocks with statistically insignificant coefficients are removed from the 1miverse and the regression is re-estimated and Nonetheless the two-pass aspect of his regression approach is an example of an alternative estimation technique that potentially improves upon the standard OLS and LASSO estimations above I think this illustrates the advantages that can accrue from an algoritlun designed specifically for the reverse engineering problem at hand
In fact the second stage of my approach is more of an optimization approach ( constrained quadratic minimization problem) similar to the teclmique mentioned on page 8 of the DERA Memorandum (posing the least-squares problem as a quadratic program) Again rather than taking any off-the-shelf package and applying it to the problem of reverse engineering a portfolio this illustrates that more success is attainable with the development of an algorithm specifically for the reverse engineering problem at hand
As the DERA Memorandum notes Hayter shows that with 5 days of data he can reverse engineer portfolios in this small universe to a very high degree of accuracy his weights are only off by an average of 0000776 relative to the true po1tfolio weight of 0025 exhibit very few fa lse-positives and never exclude a stock that is in the trne po1tfolio This demonstrated successful reverse
4
10 | P a g e
t)BLUE TRACTOR
engineering in this scenario with what I would consider a relatively simple and naive algorithm
The DERA Memorandum also notes With only one day of data and 15 second VIIV increments the results are less accurate but this is much less data than the one second increments that Precidian s ETF structure would provide and On a larger universe with 1 second data the results would probably lie somewhere in between these two extremes I agree with these comments if the relatively simple and naive algorithm used in my initial rep011 were adopted However the more sophisticated multi-day reverse engineering methodologies illustrated in my supplemental repmt demonstrated successful reverse engineering for these more challenging scenarios
I think it is also important to stress that as pointed out in my reports in practice it would be expected that expe1ts with knowledge of the specific stocks involved with some prior historical inf01mation about the p01tfolio and with an understanding of prevailing market conditions for example would be able to fineshytune any methodology in order to substantially improve its performance
6 DERA Simulations
The DERA Memorandum contains an imp01tant observation Any success in reverse-engineering the p01tfolio weights should therefore be considered a lower bound on what is possible Similarly if an attempt at reverse engineering is made which turns out to be unsuccessful then this in no way shows that reverse engineering cannot be done It should not be forgotten that all of the analyses of reverse engineering that have been perfonned so far only provide a lower bound on what a detennined approach at reverse engineering could achieve
The DERA simulations provide fmther useful insights into the reverse engineering problem and since like REO they are using rehirns which is not the best specification and which adds difficulty and noise to the problem it is clear that their results could be improved upon
I agree with the findings of the DERA simulations that
bull the effectiveness of reverse engineering decreases as the size of the universe increases
5
11 | P a g e
t)BLUE TRACTOR
bull funds that invest in a larger fraction of the universe are harder to reverse engineer
bull algorithms perform better with more observations relative to the universe size
Finally I like the ingenuity and insight that DERA was able to improve estimation results using the fact that each enor te1111 ct is a result of rounding to the nearest pe1my so $-0005 lt ct lt $0005 for all t so that they find benefit by posing the least-squares problem as a quadratic program This illustrates the fact that an ingenious and detennined protagonist will be able to fine-tune any methodology in order to substantially improve its perfonnance
7 New Results
Tables 11 -23 present new simulation results that demonstrate a new improved algorithm for conducting reverse engineering The tables presented here are updated versions of Tables 11 -23 contained within my supplemental report of October 1911 2017
A po1tfolio of 130 stocks out of a potential universe of 1000 stocks is considered with a scaled pmtfolio price of 50 (Tables 11 -13) and 30 (Tables 21 -23) and with the repmting of prices at time points I -second apart In all cases in addition to the scaling of the portfolio price shielding of the pmtfolio is achieved by rounding the pmtfolio price to r = 2 decimal places (in other words to the nearest penny) Fmthennore as discussed in my supplemental report three scenarios of the daily stock volatilities er d and conelations p are considered
The results presented here use an improved version of the sophisticated multi-day reverse engineering methodology illustrated in my supplemental repo1t Specifically similarly to the approach discussed and adopted in the DERA simulations a quadratic progra1mning minimization algorithm with constraints was implemented which makes full use of the fact that the weights are positive and sum to one and which can also make use of the known bounds on the enors as pointed out by DERA
I have used metrics which I think most clearly demonstrate the effectiveness of the reverse engineering namely
bull umber of stocks inc01Tectly excluded from the estimated portfolio
6
12 | P a g e
t)BLUE TRACTOR
bull Average absolute difference between true weight and estimated weight for the 130 stocks in the portfolio
bull Number of stocks incorrectly included in the estimated portfolio bull Sum of estimated weights for stocks inco1Tectly included in the estimated
po1tfolio
For completeness I have also included the standard Pearson co1Telation coefficient and the Spearman rank correlation coefficient between the tme weights and the estimated weights
The results presented in Tables 11-23 clearly show the success of the reverse engineering and they also have a substantial improvement over the results presented in my supplemental repo1t This illustrates the important point that there is always the potential to provide a new insight that can lead to the improvement of a reverse engineering methodology simply by formulating the algorithm slightly differently
Anthony Hayter PhD
HayterStatisticscom
November 261 2017
7
13 | P a g e
t)BLUE TRACTOR
Table 11
Un iverse of k = 1000 potent ial stocks Portfolio initia lly conta ins 130 stocks with equa l weights 1130
Init ial sca led value of a portfol io share= 50 Portfol io share price rounded to r=2 decimal places
1-second reporting 23400 values pe r day)
Worst-case scenario for dai ly volati lity and correlations crd = 00137 and p = 055 1
Table entries are average va lues based on M = 10 simulat ions
Average absolut e Sum of estimated Pearson
Spearman Num ber of stocks difference Number of stocks
we ights for stocks correlat ion rank
incorrect ly between t rue incorrectly correlat ion
excluded from weight and includ ed in incorrect ly between t rue
between t rue included in weight s and
the est imated est ima ted w eight t he est imated the esti mated est imat ed
weights and portfolio fo r the 130 stocks portfolio
portfolio weights est imated
in t he portfolio weight s
Portfo lio weights unchanged
Day 1 19 00015 40 00165 096 098
Day 2 00 00010 0 1 00003 098 100
Day 3 00 00009 00 00000 099 100
Day4 00 00008 00 00000 099 100
Day 5 00 00007 00 00000 099 100
Day 6 00 00006 00 00000 099 100
Day 7 00 00005 00 00000 100 100
Day8 00 00005 00 00000 100 100
Day9 00 00005 00 00000 100 100
Day 10 00 00005 00 00000 100 100
Portfolio weights change day to day
Day 1 10 00015 33 00138 098 096
Day 2 00 00010 02 00007 100 098
Day 3 00 00008 00 00000 100 099
Day4 00 00007 00 00000 100 099
Day 5 00 00007 00 00000 100 099
Day6 00 00006 00 00000 100 099
Day 7 00 00006 00 00000 100 099
Day8 00 00006 00 00000 100 100
Day9 00 00005 00 00000 100 100
Day 10 00 00005 00 00000 100 100
8
14 | P a g e
t)BLUE TRACTOR
Table 12
Un iverse of k = 1000 potential stocks Portfol io initia lly conta ins 130 stocks w ith equal weights 1130
Init ial sca led va lue of a portfolio sha re = 50 Portfolio share price rounded to r=2 decimal places
1-second reporting (23400 values per day)
Average scena rio for daily volatility and correlations ltTd = 00173 and p = 0278
Table entries are average va lues based on M = 10 simulations
Average absolut e Sum of estimated Pearson
Spearman Number of st ocks difference Number of stocks
we ight s for stocks correlati on rank
incorrect ly between t rue incorrectly correlat ion
excluded from weight and included in incorrect ly between true
bet ween t rue included in weights and
t he est imated est imated weight t he est imated the est imated est imated
weight s and
portfolio for t he 130 stocks portfolio portfolio weights
est imated
in t he portfolio weight s
Portfol io weights unchanged
Day 1 0 00009 0 00000 099 100
Day 2 0 00006 0 00000 099 100
Day 3 0 00005 0 00000 100 100
Day4 0 00004 0 00000 100 100
Day 5 0 00004 0 00000 100 100
Day6 0 00004 0 00000 100 100
Day 7 0 00003 0 00000 100 100
Day8 0 00003 0 00000 100 100
Day9 0 00003 0 00000 100 100
Day 10 0 00003 0 00000 100 100
Portfolio weights change day to day
Day 1 0 00009 0 00000 099 100
Day 2 0 00006 0 00000 099 100
Day 3 0 00005 0 00000 100 100
Day4 0 00005 0 00000 100 100
Day 5 0 00004 0 00000 100 100
Day6 0 00004 0 00000 100 100
Day 7 0 00004 0 00000 100 100
Day8 0 00004 0 00000 100 100
Day9 0 00004 0 00000 100 100
Day 10 0 00004 0 00000 100 100
9
15 | P a g e
t)BLUE TRACTOR
Table 13
Universe of k = 1000 potential stocks Portfolio initially conta ins 130 stocks with equa l weights 1130
Initial scaled value of a portfolio share= 50 Portfol io share price rounded to r=2 deci ma l places
1-second reporting (23400 values per da y)
Best-case scena rio for da ily volatility and correlations ltTd = 00237 and p = 0181
Table entries are average values based on M = 10 simulations
Average absolut e Sum of estimated Pearson
Spearman Number of stocks difference Number of stocks
weights for stocks correlati on ran k
incorrectly betw een t rue incorrectly corre lat ion
excluded from weight and included in incorrectly betw een t rue
bet ween true included in weights and
t he est imated est ima ted weight t he estimated t he est imated est imated
weights and
portfolio for th e 130 stocks portfolio portfolio weights
est imated
in t he portfo lio weight s
Portfolio weights unchanged
Day 1 0 00006 0 00000 100 100
Day 2 0 00004 0 00000 100 100
Day 3 0 00003 0 00000 100 100
Day4 0 00003 0 00000 100 100
Day 5 0 00003 0 00000 100 100
Day6 0 00002 0 00000 100 100
Day7 0 00002 0 00000 100 100
Day8 0 00002 0 00000 100 100
Day9 0 00002 0 00000 100 100
Day 10 0 00002 0 00000 100 100
Portfolio weights change day to day
Day 1 0 00006 0 00000 100 100
Day 2 0 00004 0 00000 100 100
Day 3 0 00003 0 00000 100 100
Day4 0 00003 0 00000 100 100
Day 5 0 00003 0 00000 100 100
Day 6 0 00003 0 00000 100 100
Day 7 0 00003 0 00000 100 100
Day8 0 00003 0 00000 100 100
Day 9 0 00003 0 00000 100 100
Day 10 0 00003 0 00000 100 100
10
16 | P a g e
t)BLUE TRACTOR
Table 21
Un iverse of k = 1000 potential stocks Portfolio initially conta ins 130 stocks w ith equa l weights 1130
Initia l sca led value of a portfo lio share = 30 Portfolio sha re pr ice rounded to r=2 decima l places
1-second reporting (23400 values per day)
Worst-case scenario for daily volatility and correlations ltTd = 00137 and p = 0551
Table entries are average va lues based on M = 10 simulations
Average absolut e Sum of estimated Pearson
Spearma n Number of stocks difference Number of st ocks
we ight s for stocks correlat ion rank
incorrect ly between t rue incorrectly correlat ion
excluded from weight and included in incorrectly between true
between t rue included in we ights and
t he estima ted estimated weight the estimated the est imated est imated
weights and portfo lio fo r t he 130 stocks portfolio
portfolio weights est imated
in the portfolio weights
Portfolio weights unchanged
Day 1 364 00039 366 02052 071 069
Day2 199 00032 152 0070 1 083 085
Day3 83 00023 92 00387 091 093
Day4 57 00020 43 00163 093 096
Day 5 54 00019 09 00032 094 097
Day6 08 00015 07 00026 096 099
Day7 11 00014 02 00007 097 099
Day 8 21 00014 00 00000 097 099
Day9 03 00013 01 00003 098 100
Day 10 0 1 00012 00 00000 098 100
Portfolio weights change day to day
Day 1 353 00039 356 01993 071 070
Day2 192 00032 118 00548 084 087
Day3 77 00022 95 00398 091 093
Day4 4 1 00019 34 0014 1 094 097
Day 5 50 00019 15 00056 094 097
Day6 12 00015 18 00067 096 098
Day7 13 00015 05 00018 097 099
Day8 21 00015 02 00006 097 099
Day9 02 00013 03 00010 098 099
Day 10 02 00012 01 00003 098 099
11
17 | P a g e
t)BLUE TRACTOR
Table 22
Universe of k = 1000 potential stocks Portfolio initially contains 130 stocks with equal weights 1130
Init ial scaled value of a portfolio share = 30 Portfolio share price rounded to r=2 decimal places
1-second repo rt ing (23400 values per day)
Average scenario for da ily volatility and correlat ions ltTd = 00173 and p = 0278
Table entries are average values based on M = 10 simulations
Average absolut e Sum of est imated Pearson
Spearman Number of stocks difference Number of stocks
weight s for stocks correlat ion rank
incorrectly between t rue incorrectly correlat ion
excluded from weight an d included in incorrect ly between t rue
bet ween t rue included in w eight s and
t he est imated est imated weight t he estimat ed th e est imated est imated
weights and
portfolio fo r t he 130 stocks portfolio portfolio weights
est imated
in the portfolio weight s
Portfo lio weights unchanged
Day 1 139 00026 131 00629 087 089
Day 2 34 00017 27 00100 095 097
Day 3 10 00014 06 00022 097 099
Day4 0 1 00012 01 00003 098 100
Day 5 00 00010 00 00000 098 100
Day6 00 00009 00 00000 099 100
Day 7 00 00009 00 00000 099 100
Day 8 00 00008 00 00000 099 100
Day9 00 00008 00 00000 099 100
Day 10 00 00007 00 00000 099 100
Portfol io we ights change day to day
Day 1 140 00025 128 00636 087 089
Day 2 18 00017 34 00132 095 098
Day 3 06 00014 09 00032 097 099
Day4 00 00012 02 00007 098 100
Day 5 00 00010 00 00000 098 100
Day6 00 00010 00 00000 099 100
Day 7 00 00009 00 00000 099 100
Day8 00 00008 00 00000 099 100
Day9 00 00008 00 00000 099 100
Day 10 00 00008 00 00000 099 100
12
18 | P a g e
t)BLUE TRACTOR
Table 23
Un iverse of k = 1000 potential stocks Portfol io initia lly conta ins 130 stocks w ith equal weights 1130
In it ial sca led value of a portfolio sha re = 30 Portfolio sha re pri ce rounded to r=2 decima l places
1-second reporting (23400 values pe r day)
Best-case scena rio for daily volat ility and correlations ltTd = 00237 and p = 0181
Table entries are average va lues based on M = 10 simulations
Average absolut e Sum of est imated Pea rson
Spearman Number of st ocks difference Number of stocks
we ights for st ocks correlati on ran k
incorrectly between t rue incorrectly correlat ion
excluded from weight and included in incorrect ly between t ru e
bet ween true included in we ights and
t he est imated est imated weight the estimat ed t he est imated est imated
weights and
portfo lio for the 130 st ocks portfol io portfo lio weights
est imated
in the portfolio w eights
Portfolio weights unchanged
Day 1 10 00014 24 00097 097 098
Day 2 00 00009 0 1 00003 099 100
Day 3 00 00008 00 00000 099 100
Day 4 00 00007 00 00000 099 100
Day 5 00 00006 00 00000 099 100
Day6 00 00006 00 00000 100 100
Day 7 00 00005 00 00000 100 100
Day8 00 00005 00 00000 100 100
Day9 00 00005 00 00000 100 100
Day 10 00 00004 00 00000 100 100
Portfolio weights change day to day
Day 1 07 00014 17 00070 097 099
Day 2 00 00010 0 1 00003 099 100
Day 3 00 00008 00 00000 099 100
Day 4 00 00007 00 00000 099 100
Day 5 00 00006 00 00000 099 100
Day6 00 00006 00 00000 099 100
Day 7 00 00006 00 00000 100 100
Day8 00 00005 00 00000 100 100
Day9 00 00005 00 00000 100 100
DaylO 00 00005 00 00000 100 100
13
19 | P a g e

t)BLUE TRACTOR
5 That initial successful iterations in a reverse engineering problem should be considered the
lower bound of what is achievable Indeed DERA states on page 6 of their memorandum that
ldquoAny success in reverse-engineering the portfolio weights should therefore be considered a lower
bound [emphasis added] on what is possiblerdquo
The DERA Memorandum puts to rest any doubt that Precidianrsquos lsquostylized methodologyrsquo for VIIV cannot be
reverse engineered The claim by Messrs McCabe and Criscitello that their structure is immune to reverse
engineering is patently false
To that end an active mutual fund manager considering using the Precidian ETF structure is by default
considering utilizing a transparent active ETF structure
However insofar that it will be lsquotransparentrsquo to predatory traders it will not trade efficiently for investors like currently approved transparent actively managed ETFs do because itrsquos use of a third-party structure
to facilitate creation arbitrage and hedging means it will be less efficient in both the primary and
secondary markets In that light better for the active mutual fund manager to simply opt for todayrsquos transparent active ETF structures already granted exemptive relief by the Commission
Finally from the work undertaken by DERA and Dr Hayter a basic lsquorecipersquo for reverse engineering is now in the public domain
1 Determine the size of the stock universe
2 Overestimate the number of stocks expected in the fund (readily available from quarterly
disclosures)
3 Determine if single or multi-day observations are needed
4 Mathematically formulate the problem correctly
5 Incorporate additional information gleaned from the fundrsquos SAI or other public sources into the math eg fund turnover sector constraints etc
6 Run ldquoartificial simulationsrsquo to fine tune the method using real data from the fundrsquos previously disclosed portfolio information and
7 Once the portfolio is ldquocrackedrdquo monitor over many trading days to detect the fund managerrsquos strategy and habits and when actual trades occur
I would also note that if an ETF fund using the Precidian structure also has a lsquomirrorrsquo mutual fund then both funds are at risk of predatory front running
Please refer to attached Exhibit One of this letter for an in-depth review of the DERA Memorandum by Dr
Hayter along with a further improved method for reverse engineering
4 | P a g e
t)BLUE TRACTOR
Front Running
The traders with the quantitative skill set to reverse engineer are of course the same traders who will then
bring their talents to predatory front running
Who are they They are the traders and strategists that work for hedge funds proprietary trading desks
and specialty trading houses both domestically and off-shore These traders combine capital markets
savvy with graduate and doctorate level degrees in computer sciences physics and mathematics 11 These
firms usually have unlimited computer resources at their disposal and their compensation models
motivate traders to take risk and be aggressive
The techniques outlined in the DERA Memorandum and by Dr Hayter are trivial to these mathematically
gifted individuals
So once the portfolio has been ldquocrackedrdquo these traders will then develop techniques to take maximum advantage of the fundrsquos trading patterns and strategy Time is on the predatory tradersrsquo side ndash once the
portfolio becomes visible they can sit back and fine tune their strategies before entering the market
unobserved by the fund They do not need to trade every day in front of the fund they will do so only
when profitable
The DERA Memorandum and the work by Dr Hayter clearly demonstrate that no fund using the Precidian
ETF structure regardless of the size of the fund or investable universe can be certain that their
undisclosed portfolio hasnrsquot been subject to reverse engineering and that lsquoalpharsquo is being skimmed by a predatory trader
I say this with tongue in cheek but a prospectus for funds using the Precidian ETF structure would have to
include under the risk section language to the effect that ldquoThese funds are extremely vulnerable to
predatory front-running which could negatively impact investor returnsrdquo
Conclusion
Precidian lists in Mr Criscitellorsquos October 11 2017 letter a long list of potential investor benefits under a
non-transparent ETF structure 12 Ironically what they donrsquot document is evidence that investors want a retrogressive non-transparent investment structure If the benefits Mr Criscitello lists can be accrued in
a much more transparent structure why would anyone want to invest in a non-transparent lsquoblack boxrsquo Indeed the success of the ETF market is built on the foundation of transparency Why would approval of
a wholly opaque non-transparent ETF be innovative
Blue Tractor would always encourage the Commission to permit novel products that improve investor
choice fulfill a real product demand enhance market efficiency and capital formation overcome known
financial obstacles through real innovation while always maintaining the spirit and integrity of existing
federal securities laws that promote lsquofair marketsrsquo and provide investor protection This last condition is
inviolable
11 httpswwwnytimescom20160223businessdealbooka-new-breed-of-trader-on-wall-street-coders-with-a-phdhtml (Note this article is for reference only and no explicit or implicit suggestion is made that any of the firms or individuals profiled are assumed to undertake predatory trading activities) 12 Note that Mr Criscitello cannot claim that the Precidian ETF structure would accrue all these benefits since it can be readily reverse engineered and will have inefficient primary and secondary markets as described in letters Simon Goulet and others submitted to the Commission
5 | P a g e
t)BLUE TRACTOR
Some market observers maintain that the Commission should approve every application it receives for
novel ETF structures and lsquoshould stand back and let the market decidersquo winners and losers Interesting thought and so long as an application for a novel structure clearly meets the legal spirit of federal
securities law to promote both lsquofair marketsrsquo and investor protection that could indeed be a viable
approach
However to recap the Precidian ETF structure does not solve any investor demand for non-transparent
products it will do nothing to enhance market efficiency it does not overcome any financial obstacles
since it is highly vulnerable to reverse engineering (and therefore front-running) and the asymmetric
disclosure of confidential portfolio information to privileged third parties clearly runs a foul of existing
federal securities law Therefore the Precidian ETF structure cannot be viewed with the same lens as
novel product applications that do meet all of these conditions
Moreover there is now confirmatory evidence from DERA that the Precidian ETF structure can be reverse
engineered
For these reasons the Exchangersquos rule change application should be disapproved
Thank you in advance for your consideration of my commentary I welcome any questions the
Commission may have as a result and can be reached at
Sincerely
Terence W Norman
Founder
Blue Tractor Group LLC
6 | P a g e
t)BLUE TRACTOR
HayterStatisticscom
November 261 2017
Notes on the November 16m 2017 Memorandum from the Division of Economic and Risk Analysis entitled
Inferring Non-Transparent ETF Portfolio Holdings
1 Overview
These notes provide some comments on the November 16th 2017 Memorandum from the Division of Economic and Risk Analysis (DERA) of the US Securities and Exchange Commission entitled Infening Non-Transparent ETF Portfolio Holdings
The DERA Memorandum provides a generally perceptive and well thoughtshyout discussion of the problem of reverse engineering a portfolio The DERA Memorandum considers the analyses presented in several repo1ts on this subject and also presents some original simulation results of their own The DERA Memorandum comes across as being a fair and unbiased assessment of the situation
It is interesting to note that in the DERA Memorandum the problem is specified in exactly the same way that I specified it in my initial rep01t The Reverse Engineering of Portfolio Compositions July 171 2017 The equation in the middle of page 1 of the DERA Memorandum is exactly identical to equation (1) on page 9 of my report with exactly the same weights which sum to one
The imp01tance of setting up the problem conectly in the first place cannot be overstated This is essential to the development of an algorithm that will successfully achieve reverse engineering It should be pointed out that neither Ricky Cooper nor Lawrence Glosten provided this equation in their work and they did not demonstrate that they had specified the problem conectly
1
EXHIBIT ONE
7 | P a g e
t)BLUE TRACTOR
Obviously a failed attempt at reverse engineering using a misspecified approach does not provide any illumination on the prospects of successfully achieving reverse engineering using a properly specified approach
2 REO Analysis
The REO approach is interesting in that it is based upon reh1rns from one time increment to the next (using 10 second increments in this case) rather than being based on price levels However as the DERA Memorandum explains this does not allow the precise estimation of what we are actually looking for Consequently this approach adds unnecessmy difficulty and noise to the problem
I agree with the DERA Memorandum that Over multiple days weight estimates based on returns will under-perform estimates based on price levels
3 Ricky Coopers Analysis
I agree with the discussion in the DERA Memorandum concerning how the problem is set up In the Cooper analysis the problem is poorly set up so that it is estimating the wrong thing with weights that do not sum to one
I agree with the DERA Memorandum that this analysis and inte1pretation has not fully accounting for the effects of scaling and I agree with the DERA Memorandum that there are inherent difficulties with regressing on unscaled prices (as in the Cooper analysis) rather than on scaled prices so that there are flaws in the operation and inte1pretation of the Cooper analysis
4 Lawrence Glostens Analysis
I agree with the DERA Memorandum that for the pmpose of reverse engineering an ETF s p01tfolio holdings small prediction e1rnrs are not the primmy objective and that with respect to LASSO it is not obvious a priori that it should outperfonn OLS In fact I think that there are clearly limitations to taking any off-the-shelf package and applying it to the problem of reverse engineering a p01tfolio Much more success is attainable with the development of an algorithm specifically for the reverse engineering problem at hand
2
8 | P a g e
t)BLUE TRACTOR
Again I agree with the discussion in the DERA Memorandum concerning how the problem is set up Again as the DERA Memorandum explains Because the regressors are not scaled the regression produces estimates of the number of shares of each security held These are quantities which do not sum to one
I think that the DERA Memorandum makes an impo11ant point in stating that Therefore it is possible that other LASSO implementations could achieve more accurate estimates of pmtfolio holdings This is a recognition that any failed attempt at reverse engineering does not prove that all attempts must fail
The DERA Memorandum confinns this by also stating that Finally Glosten s finding that OLS and LASSO are unable to accurately recover po1tfolio holdings for a larger universe of available pmtfolio securities (the Russell 1000) does not rule out the possibility that other techniques might perfo1111 better on stock tmiverses of the same size
5 Blue Tractors Analysis
This section of the DERA Memorandum comments on my initial repolt The Reverse Engineering of Po1tfolio Compositions July 17th 2017 However I issued a supplemental repmt on October 19th 2017 which is not refened to in the DERA Memorandum
The supplemental report considered more challenging scenarios than were considered in the initial repmt and it provided fuither analyses to confom that the reverse engineering of a po1tfolio is achievable with a substantial degree of accuracy
Specifically the differences between the analyses contained in the supplemental repmt and in my initial repmt are
bull Whereas the initial report only considered reporting of prices at time points IS -seconds apart which provides 1560 time points throughout a complete trading day in the supplemental repmt the repmting of prices at time points I-second apa1t is considered which provides 23 400 time points throughout a complete trading day
bull Whereas the initial report considered a universe of k = 100 potential stocks in the supplemental repmt the more challenging scenario of a universe of k = 1000 potential stocks is considered The reverse engineering of
3
9 | P a g e
t)BLUE TRACTOR
po1tfolios consisting of both 130 and 80 stocks out of this universe of k = 1000 potential stocks is demonstrated
bull Finally the implementation of more sophisticated multi -day reverse engineering methodologies is demonstrated in the supplemental report which more closely model how a serious attempt at reverse engineering would be made in practice
While it is conect that my analysis uses a single average conelation value across the simulated stock universe as pointed out in the DERA Memorandum I actually present worst-case average and best-case scenarios for the stock variabilities and correlations in an attempt to encompass real scenarios
I note the recognition in the DERA Memorandum (Hayter estimates the corTect regression specification) of the importance of setting up the problem corTectly
As the DERA Memorandum notes Hayter uses a two-pass approach the above regression is estimated any stocks with statistically insignificant coefficients are removed from the 1miverse and the regression is re-estimated and Nonetheless the two-pass aspect of his regression approach is an example of an alternative estimation technique that potentially improves upon the standard OLS and LASSO estimations above I think this illustrates the advantages that can accrue from an algoritlun designed specifically for the reverse engineering problem at hand
In fact the second stage of my approach is more of an optimization approach ( constrained quadratic minimization problem) similar to the teclmique mentioned on page 8 of the DERA Memorandum (posing the least-squares problem as a quadratic program) Again rather than taking any off-the-shelf package and applying it to the problem of reverse engineering a portfolio this illustrates that more success is attainable with the development of an algorithm specifically for the reverse engineering problem at hand
As the DERA Memorandum notes Hayter shows that with 5 days of data he can reverse engineer portfolios in this small universe to a very high degree of accuracy his weights are only off by an average of 0000776 relative to the true po1tfolio weight of 0025 exhibit very few fa lse-positives and never exclude a stock that is in the trne po1tfolio This demonstrated successful reverse
4
10 | P a g e
t)BLUE TRACTOR
engineering in this scenario with what I would consider a relatively simple and naive algorithm
The DERA Memorandum also notes With only one day of data and 15 second VIIV increments the results are less accurate but this is much less data than the one second increments that Precidian s ETF structure would provide and On a larger universe with 1 second data the results would probably lie somewhere in between these two extremes I agree with these comments if the relatively simple and naive algorithm used in my initial rep011 were adopted However the more sophisticated multi-day reverse engineering methodologies illustrated in my supplemental repmt demonstrated successful reverse engineering for these more challenging scenarios
I think it is also important to stress that as pointed out in my reports in practice it would be expected that expe1ts with knowledge of the specific stocks involved with some prior historical inf01mation about the p01tfolio and with an understanding of prevailing market conditions for example would be able to fineshytune any methodology in order to substantially improve its performance
6 DERA Simulations
The DERA Memorandum contains an imp01tant observation Any success in reverse-engineering the p01tfolio weights should therefore be considered a lower bound on what is possible Similarly if an attempt at reverse engineering is made which turns out to be unsuccessful then this in no way shows that reverse engineering cannot be done It should not be forgotten that all of the analyses of reverse engineering that have been perfonned so far only provide a lower bound on what a detennined approach at reverse engineering could achieve
The DERA simulations provide fmther useful insights into the reverse engineering problem and since like REO they are using rehirns which is not the best specification and which adds difficulty and noise to the problem it is clear that their results could be improved upon
I agree with the findings of the DERA simulations that
bull the effectiveness of reverse engineering decreases as the size of the universe increases
5
11 | P a g e
t)BLUE TRACTOR
bull funds that invest in a larger fraction of the universe are harder to reverse engineer
bull algorithms perform better with more observations relative to the universe size
Finally I like the ingenuity and insight that DERA was able to improve estimation results using the fact that each enor te1111 ct is a result of rounding to the nearest pe1my so $-0005 lt ct lt $0005 for all t so that they find benefit by posing the least-squares problem as a quadratic program This illustrates the fact that an ingenious and detennined protagonist will be able to fine-tune any methodology in order to substantially improve its perfonnance
7 New Results
Tables 11 -23 present new simulation results that demonstrate a new improved algorithm for conducting reverse engineering The tables presented here are updated versions of Tables 11 -23 contained within my supplemental report of October 1911 2017
A po1tfolio of 130 stocks out of a potential universe of 1000 stocks is considered with a scaled pmtfolio price of 50 (Tables 11 -13) and 30 (Tables 21 -23) and with the repmting of prices at time points I -second apart In all cases in addition to the scaling of the portfolio price shielding of the pmtfolio is achieved by rounding the pmtfolio price to r = 2 decimal places (in other words to the nearest penny) Fmthennore as discussed in my supplemental report three scenarios of the daily stock volatilities er d and conelations p are considered
The results presented here use an improved version of the sophisticated multi-day reverse engineering methodology illustrated in my supplemental repo1t Specifically similarly to the approach discussed and adopted in the DERA simulations a quadratic progra1mning minimization algorithm with constraints was implemented which makes full use of the fact that the weights are positive and sum to one and which can also make use of the known bounds on the enors as pointed out by DERA
I have used metrics which I think most clearly demonstrate the effectiveness of the reverse engineering namely
bull umber of stocks inc01Tectly excluded from the estimated portfolio
6
12 | P a g e
t)BLUE TRACTOR
bull Average absolute difference between true weight and estimated weight for the 130 stocks in the portfolio
bull Number of stocks incorrectly included in the estimated portfolio bull Sum of estimated weights for stocks inco1Tectly included in the estimated
po1tfolio
For completeness I have also included the standard Pearson co1Telation coefficient and the Spearman rank correlation coefficient between the tme weights and the estimated weights
The results presented in Tables 11-23 clearly show the success of the reverse engineering and they also have a substantial improvement over the results presented in my supplemental repo1t This illustrates the important point that there is always the potential to provide a new insight that can lead to the improvement of a reverse engineering methodology simply by formulating the algorithm slightly differently
Anthony Hayter PhD
HayterStatisticscom
November 261 2017
7
13 | P a g e
t)BLUE TRACTOR
Table 11
Un iverse of k = 1000 potent ial stocks Portfolio initia lly conta ins 130 stocks with equa l weights 1130
Init ial sca led value of a portfol io share= 50 Portfol io share price rounded to r=2 decimal places
1-second reporting 23400 values pe r day)
Worst-case scenario for dai ly volati lity and correlations crd = 00137 and p = 055 1
Table entries are average va lues based on M = 10 simulat ions
Average absolut e Sum of estimated Pearson
Spearman Num ber of stocks difference Number of stocks
we ights for stocks correlat ion rank
incorrect ly between t rue incorrectly correlat ion
excluded from weight and includ ed in incorrect ly between t rue
between t rue included in weight s and
the est imated est ima ted w eight t he est imated the esti mated est imat ed
weights and portfolio fo r the 130 stocks portfolio
portfolio weights est imated
in t he portfolio weight s
Portfo lio weights unchanged
Day 1 19 00015 40 00165 096 098
Day 2 00 00010 0 1 00003 098 100
Day 3 00 00009 00 00000 099 100
Day4 00 00008 00 00000 099 100
Day 5 00 00007 00 00000 099 100
Day 6 00 00006 00 00000 099 100
Day 7 00 00005 00 00000 100 100
Day8 00 00005 00 00000 100 100
Day9 00 00005 00 00000 100 100
Day 10 00 00005 00 00000 100 100
Portfolio weights change day to day
Day 1 10 00015 33 00138 098 096
Day 2 00 00010 02 00007 100 098
Day 3 00 00008 00 00000 100 099
Day4 00 00007 00 00000 100 099
Day 5 00 00007 00 00000 100 099
Day6 00 00006 00 00000 100 099
Day 7 00 00006 00 00000 100 099
Day8 00 00006 00 00000 100 100
Day9 00 00005 00 00000 100 100
Day 10 00 00005 00 00000 100 100
8
14 | P a g e
t)BLUE TRACTOR
Table 12
Un iverse of k = 1000 potential stocks Portfol io initia lly conta ins 130 stocks w ith equal weights 1130
Init ial sca led va lue of a portfolio sha re = 50 Portfolio share price rounded to r=2 decimal places
1-second reporting (23400 values per day)
Average scena rio for daily volatility and correlations ltTd = 00173 and p = 0278
Table entries are average va lues based on M = 10 simulations
Average absolut e Sum of estimated Pearson
Spearman Number of st ocks difference Number of stocks
we ight s for stocks correlati on rank
incorrect ly between t rue incorrectly correlat ion
excluded from weight and included in incorrect ly between true
bet ween t rue included in weights and
t he est imated est imated weight t he est imated the est imated est imated
weight s and
portfolio for t he 130 stocks portfolio portfolio weights
est imated
in t he portfolio weight s
Portfol io weights unchanged
Day 1 0 00009 0 00000 099 100
Day 2 0 00006 0 00000 099 100
Day 3 0 00005 0 00000 100 100
Day4 0 00004 0 00000 100 100
Day 5 0 00004 0 00000 100 100
Day6 0 00004 0 00000 100 100
Day 7 0 00003 0 00000 100 100
Day8 0 00003 0 00000 100 100
Day9 0 00003 0 00000 100 100
Day 10 0 00003 0 00000 100 100
Portfolio weights change day to day
Day 1 0 00009 0 00000 099 100
Day 2 0 00006 0 00000 099 100
Day 3 0 00005 0 00000 100 100
Day4 0 00005 0 00000 100 100
Day 5 0 00004 0 00000 100 100
Day6 0 00004 0 00000 100 100
Day 7 0 00004 0 00000 100 100
Day8 0 00004 0 00000 100 100
Day9 0 00004 0 00000 100 100
Day 10 0 00004 0 00000 100 100
9
15 | P a g e
t)BLUE TRACTOR
Table 13
Universe of k = 1000 potential stocks Portfolio initially conta ins 130 stocks with equa l weights 1130
Initial scaled value of a portfolio share= 50 Portfol io share price rounded to r=2 deci ma l places
1-second reporting (23400 values per da y)
Best-case scena rio for da ily volatility and correlations ltTd = 00237 and p = 0181
Table entries are average values based on M = 10 simulations
Average absolut e Sum of estimated Pearson
Spearman Number of stocks difference Number of stocks
weights for stocks correlati on ran k
incorrectly betw een t rue incorrectly corre lat ion
excluded from weight and included in incorrectly betw een t rue
bet ween true included in weights and
t he est imated est ima ted weight t he estimated t he est imated est imated
weights and
portfolio for th e 130 stocks portfolio portfolio weights
est imated
in t he portfo lio weight s
Portfolio weights unchanged
Day 1 0 00006 0 00000 100 100
Day 2 0 00004 0 00000 100 100
Day 3 0 00003 0 00000 100 100
Day4 0 00003 0 00000 100 100
Day 5 0 00003 0 00000 100 100
Day6 0 00002 0 00000 100 100
Day7 0 00002 0 00000 100 100
Day8 0 00002 0 00000 100 100
Day9 0 00002 0 00000 100 100
Day 10 0 00002 0 00000 100 100
Portfolio weights change day to day
Day 1 0 00006 0 00000 100 100
Day 2 0 00004 0 00000 100 100
Day 3 0 00003 0 00000 100 100
Day4 0 00003 0 00000 100 100
Day 5 0 00003 0 00000 100 100
Day 6 0 00003 0 00000 100 100
Day 7 0 00003 0 00000 100 100
Day8 0 00003 0 00000 100 100
Day 9 0 00003 0 00000 100 100
Day 10 0 00003 0 00000 100 100
10
16 | P a g e
t)BLUE TRACTOR
Table 21
Un iverse of k = 1000 potential stocks Portfolio initially conta ins 130 stocks w ith equa l weights 1130
Initia l sca led value of a portfo lio share = 30 Portfolio sha re pr ice rounded to r=2 decima l places
1-second reporting (23400 values per day)
Worst-case scenario for daily volatility and correlations ltTd = 00137 and p = 0551
Table entries are average va lues based on M = 10 simulations
Average absolut e Sum of estimated Pearson
Spearma n Number of stocks difference Number of st ocks
we ight s for stocks correlat ion rank
incorrect ly between t rue incorrectly correlat ion
excluded from weight and included in incorrectly between true
between t rue included in we ights and
t he estima ted estimated weight the estimated the est imated est imated
weights and portfo lio fo r t he 130 stocks portfolio
portfolio weights est imated
in the portfolio weights
Portfolio weights unchanged
Day 1 364 00039 366 02052 071 069
Day2 199 00032 152 0070 1 083 085
Day3 83 00023 92 00387 091 093
Day4 57 00020 43 00163 093 096
Day 5 54 00019 09 00032 094 097
Day6 08 00015 07 00026 096 099
Day7 11 00014 02 00007 097 099
Day 8 21 00014 00 00000 097 099
Day9 03 00013 01 00003 098 100
Day 10 0 1 00012 00 00000 098 100
Portfolio weights change day to day
Day 1 353 00039 356 01993 071 070
Day2 192 00032 118 00548 084 087
Day3 77 00022 95 00398 091 093
Day4 4 1 00019 34 0014 1 094 097
Day 5 50 00019 15 00056 094 097
Day6 12 00015 18 00067 096 098
Day7 13 00015 05 00018 097 099
Day8 21 00015 02 00006 097 099
Day9 02 00013 03 00010 098 099
Day 10 02 00012 01 00003 098 099
11
17 | P a g e
t)BLUE TRACTOR
Table 22
Universe of k = 1000 potential stocks Portfolio initially contains 130 stocks with equal weights 1130
Init ial scaled value of a portfolio share = 30 Portfolio share price rounded to r=2 decimal places
1-second repo rt ing (23400 values per day)
Average scenario for da ily volatility and correlat ions ltTd = 00173 and p = 0278
Table entries are average values based on M = 10 simulations
Average absolut e Sum of est imated Pearson
Spearman Number of stocks difference Number of stocks
weight s for stocks correlat ion rank
incorrectly between t rue incorrectly correlat ion
excluded from weight an d included in incorrect ly between t rue
bet ween t rue included in w eight s and
t he est imated est imated weight t he estimat ed th e est imated est imated
weights and
portfolio fo r t he 130 stocks portfolio portfolio weights
est imated
in the portfolio weight s
Portfo lio weights unchanged
Day 1 139 00026 131 00629 087 089
Day 2 34 00017 27 00100 095 097
Day 3 10 00014 06 00022 097 099
Day4 0 1 00012 01 00003 098 100
Day 5 00 00010 00 00000 098 100
Day6 00 00009 00 00000 099 100
Day 7 00 00009 00 00000 099 100
Day 8 00 00008 00 00000 099 100
Day9 00 00008 00 00000 099 100
Day 10 00 00007 00 00000 099 100
Portfol io we ights change day to day
Day 1 140 00025 128 00636 087 089
Day 2 18 00017 34 00132 095 098
Day 3 06 00014 09 00032 097 099
Day4 00 00012 02 00007 098 100
Day 5 00 00010 00 00000 098 100
Day6 00 00010 00 00000 099 100
Day 7 00 00009 00 00000 099 100
Day8 00 00008 00 00000 099 100
Day9 00 00008 00 00000 099 100
Day 10 00 00008 00 00000 099 100
12
18 | P a g e
t)BLUE TRACTOR
Table 23
Un iverse of k = 1000 potential stocks Portfol io initia lly conta ins 130 stocks w ith equal weights 1130
In it ial sca led value of a portfolio sha re = 30 Portfolio sha re pri ce rounded to r=2 decima l places
1-second reporting (23400 values pe r day)
Best-case scena rio for daily volat ility and correlations ltTd = 00237 and p = 0181
Table entries are average va lues based on M = 10 simulations
Average absolut e Sum of est imated Pea rson
Spearman Number of st ocks difference Number of stocks
we ights for st ocks correlati on ran k
incorrectly between t rue incorrectly correlat ion
excluded from weight and included in incorrect ly between t ru e
bet ween true included in we ights and
t he est imated est imated weight the estimat ed t he est imated est imated
weights and
portfo lio for the 130 st ocks portfol io portfo lio weights
est imated
in the portfolio w eights
Portfolio weights unchanged
Day 1 10 00014 24 00097 097 098
Day 2 00 00009 0 1 00003 099 100
Day 3 00 00008 00 00000 099 100
Day 4 00 00007 00 00000 099 100
Day 5 00 00006 00 00000 099 100
Day6 00 00006 00 00000 100 100
Day 7 00 00005 00 00000 100 100
Day8 00 00005 00 00000 100 100
Day9 00 00005 00 00000 100 100
Day 10 00 00004 00 00000 100 100
Portfolio weights change day to day
Day 1 07 00014 17 00070 097 099
Day 2 00 00010 0 1 00003 099 100
Day 3 00 00008 00 00000 099 100
Day 4 00 00007 00 00000 099 100
Day 5 00 00006 00 00000 099 100
Day6 00 00006 00 00000 099 100
Day 7 00 00006 00 00000 100 100
Day8 00 00005 00 00000 100 100
Day9 00 00005 00 00000 100 100
DaylO 00 00005 00 00000 100 100
13
19 | P a g e
t)BLUE TRACTOR
Front Running
The traders with the quantitative skill set to reverse engineer are of course the same traders who will then
bring their talents to predatory front running
Who are they They are the traders and strategists that work for hedge funds proprietary trading desks
and specialty trading houses both domestically and off-shore These traders combine capital markets
savvy with graduate and doctorate level degrees in computer sciences physics and mathematics 11 These
firms usually have unlimited computer resources at their disposal and their compensation models
motivate traders to take risk and be aggressive
The techniques outlined in the DERA Memorandum and by Dr Hayter are trivial to these mathematically
gifted individuals
So once the portfolio has been ldquocrackedrdquo these traders will then develop techniques to take maximum advantage of the fundrsquos trading patterns and strategy Time is on the predatory tradersrsquo side ndash once the
portfolio becomes visible they can sit back and fine tune their strategies before entering the market
unobserved by the fund They do not need to trade every day in front of the fund they will do so only
when profitable
The DERA Memorandum and the work by Dr Hayter clearly demonstrate that no fund using the Precidian
ETF structure regardless of the size of the fund or investable universe can be certain that their
undisclosed portfolio hasnrsquot been subject to reverse engineering and that lsquoalpharsquo is being skimmed by a predatory trader
I say this with tongue in cheek but a prospectus for funds using the Precidian ETF structure would have to
include under the risk section language to the effect that ldquoThese funds are extremely vulnerable to
predatory front-running which could negatively impact investor returnsrdquo
Conclusion
Precidian lists in Mr Criscitellorsquos October 11 2017 letter a long list of potential investor benefits under a
non-transparent ETF structure 12 Ironically what they donrsquot document is evidence that investors want a retrogressive non-transparent investment structure If the benefits Mr Criscitello lists can be accrued in
a much more transparent structure why would anyone want to invest in a non-transparent lsquoblack boxrsquo Indeed the success of the ETF market is built on the foundation of transparency Why would approval of
a wholly opaque non-transparent ETF be innovative
Blue Tractor would always encourage the Commission to permit novel products that improve investor
choice fulfill a real product demand enhance market efficiency and capital formation overcome known
financial obstacles through real innovation while always maintaining the spirit and integrity of existing
federal securities laws that promote lsquofair marketsrsquo and provide investor protection This last condition is
inviolable
11 httpswwwnytimescom20160223businessdealbooka-new-breed-of-trader-on-wall-street-coders-with-a-phdhtml (Note this article is for reference only and no explicit or implicit suggestion is made that any of the firms or individuals profiled are assumed to undertake predatory trading activities) 12 Note that Mr Criscitello cannot claim that the Precidian ETF structure would accrue all these benefits since it can be readily reverse engineered and will have inefficient primary and secondary markets as described in letters Simon Goulet and others submitted to the Commission
5 | P a g e
t)BLUE TRACTOR
Some market observers maintain that the Commission should approve every application it receives for
novel ETF structures and lsquoshould stand back and let the market decidersquo winners and losers Interesting thought and so long as an application for a novel structure clearly meets the legal spirit of federal
securities law to promote both lsquofair marketsrsquo and investor protection that could indeed be a viable
approach
However to recap the Precidian ETF structure does not solve any investor demand for non-transparent
products it will do nothing to enhance market efficiency it does not overcome any financial obstacles
since it is highly vulnerable to reverse engineering (and therefore front-running) and the asymmetric
disclosure of confidential portfolio information to privileged third parties clearly runs a foul of existing
federal securities law Therefore the Precidian ETF structure cannot be viewed with the same lens as
novel product applications that do meet all of these conditions
Moreover there is now confirmatory evidence from DERA that the Precidian ETF structure can be reverse
engineered
For these reasons the Exchangersquos rule change application should be disapproved
Thank you in advance for your consideration of my commentary I welcome any questions the
Commission may have as a result and can be reached at
Sincerely
Terence W Norman
Founder
Blue Tractor Group LLC
6 | P a g e
t)BLUE TRACTOR
HayterStatisticscom
November 261 2017
Notes on the November 16m 2017 Memorandum from the Division of Economic and Risk Analysis entitled
Inferring Non-Transparent ETF Portfolio Holdings
1 Overview
These notes provide some comments on the November 16th 2017 Memorandum from the Division of Economic and Risk Analysis (DERA) of the US Securities and Exchange Commission entitled Infening Non-Transparent ETF Portfolio Holdings
The DERA Memorandum provides a generally perceptive and well thoughtshyout discussion of the problem of reverse engineering a portfolio The DERA Memorandum considers the analyses presented in several repo1ts on this subject and also presents some original simulation results of their own The DERA Memorandum comes across as being a fair and unbiased assessment of the situation
It is interesting to note that in the DERA Memorandum the problem is specified in exactly the same way that I specified it in my initial rep01t The Reverse Engineering of Portfolio Compositions July 171 2017 The equation in the middle of page 1 of the DERA Memorandum is exactly identical to equation (1) on page 9 of my report with exactly the same weights which sum to one
The imp01tance of setting up the problem conectly in the first place cannot be overstated This is essential to the development of an algorithm that will successfully achieve reverse engineering It should be pointed out that neither Ricky Cooper nor Lawrence Glosten provided this equation in their work and they did not demonstrate that they had specified the problem conectly
1
EXHIBIT ONE
7 | P a g e
t)BLUE TRACTOR
Obviously a failed attempt at reverse engineering using a misspecified approach does not provide any illumination on the prospects of successfully achieving reverse engineering using a properly specified approach
2 REO Analysis
The REO approach is interesting in that it is based upon reh1rns from one time increment to the next (using 10 second increments in this case) rather than being based on price levels However as the DERA Memorandum explains this does not allow the precise estimation of what we are actually looking for Consequently this approach adds unnecessmy difficulty and noise to the problem
I agree with the DERA Memorandum that Over multiple days weight estimates based on returns will under-perform estimates based on price levels
3 Ricky Coopers Analysis
I agree with the discussion in the DERA Memorandum concerning how the problem is set up In the Cooper analysis the problem is poorly set up so that it is estimating the wrong thing with weights that do not sum to one
I agree with the DERA Memorandum that this analysis and inte1pretation has not fully accounting for the effects of scaling and I agree with the DERA Memorandum that there are inherent difficulties with regressing on unscaled prices (as in the Cooper analysis) rather than on scaled prices so that there are flaws in the operation and inte1pretation of the Cooper analysis
4 Lawrence Glostens Analysis
I agree with the DERA Memorandum that for the pmpose of reverse engineering an ETF s p01tfolio holdings small prediction e1rnrs are not the primmy objective and that with respect to LASSO it is not obvious a priori that it should outperfonn OLS In fact I think that there are clearly limitations to taking any off-the-shelf package and applying it to the problem of reverse engineering a p01tfolio Much more success is attainable with the development of an algorithm specifically for the reverse engineering problem at hand
2
8 | P a g e
t)BLUE TRACTOR
Again I agree with the discussion in the DERA Memorandum concerning how the problem is set up Again as the DERA Memorandum explains Because the regressors are not scaled the regression produces estimates of the number of shares of each security held These are quantities which do not sum to one
I think that the DERA Memorandum makes an impo11ant point in stating that Therefore it is possible that other LASSO implementations could achieve more accurate estimates of pmtfolio holdings This is a recognition that any failed attempt at reverse engineering does not prove that all attempts must fail
The DERA Memorandum confinns this by also stating that Finally Glosten s finding that OLS and LASSO are unable to accurately recover po1tfolio holdings for a larger universe of available pmtfolio securities (the Russell 1000) does not rule out the possibility that other techniques might perfo1111 better on stock tmiverses of the same size
5 Blue Tractors Analysis
This section of the DERA Memorandum comments on my initial repolt The Reverse Engineering of Po1tfolio Compositions July 17th 2017 However I issued a supplemental repmt on October 19th 2017 which is not refened to in the DERA Memorandum
The supplemental report considered more challenging scenarios than were considered in the initial repmt and it provided fuither analyses to confom that the reverse engineering of a po1tfolio is achievable with a substantial degree of accuracy
Specifically the differences between the analyses contained in the supplemental repmt and in my initial repmt are
bull Whereas the initial report only considered reporting of prices at time points IS -seconds apart which provides 1560 time points throughout a complete trading day in the supplemental repmt the repmting of prices at time points I-second apa1t is considered which provides 23 400 time points throughout a complete trading day
bull Whereas the initial report considered a universe of k = 100 potential stocks in the supplemental repmt the more challenging scenario of a universe of k = 1000 potential stocks is considered The reverse engineering of
3
9 | P a g e
t)BLUE TRACTOR
po1tfolios consisting of both 130 and 80 stocks out of this universe of k = 1000 potential stocks is demonstrated
bull Finally the implementation of more sophisticated multi -day reverse engineering methodologies is demonstrated in the supplemental report which more closely model how a serious attempt at reverse engineering would be made in practice
While it is conect that my analysis uses a single average conelation value across the simulated stock universe as pointed out in the DERA Memorandum I actually present worst-case average and best-case scenarios for the stock variabilities and correlations in an attempt to encompass real scenarios
I note the recognition in the DERA Memorandum (Hayter estimates the corTect regression specification) of the importance of setting up the problem corTectly
As the DERA Memorandum notes Hayter uses a two-pass approach the above regression is estimated any stocks with statistically insignificant coefficients are removed from the 1miverse and the regression is re-estimated and Nonetheless the two-pass aspect of his regression approach is an example of an alternative estimation technique that potentially improves upon the standard OLS and LASSO estimations above I think this illustrates the advantages that can accrue from an algoritlun designed specifically for the reverse engineering problem at hand
In fact the second stage of my approach is more of an optimization approach ( constrained quadratic minimization problem) similar to the teclmique mentioned on page 8 of the DERA Memorandum (posing the least-squares problem as a quadratic program) Again rather than taking any off-the-shelf package and applying it to the problem of reverse engineering a portfolio this illustrates that more success is attainable with the development of an algorithm specifically for the reverse engineering problem at hand
As the DERA Memorandum notes Hayter shows that with 5 days of data he can reverse engineer portfolios in this small universe to a very high degree of accuracy his weights are only off by an average of 0000776 relative to the true po1tfolio weight of 0025 exhibit very few fa lse-positives and never exclude a stock that is in the trne po1tfolio This demonstrated successful reverse
4
10 | P a g e
t)BLUE TRACTOR
engineering in this scenario with what I would consider a relatively simple and naive algorithm
The DERA Memorandum also notes With only one day of data and 15 second VIIV increments the results are less accurate but this is much less data than the one second increments that Precidian s ETF structure would provide and On a larger universe with 1 second data the results would probably lie somewhere in between these two extremes I agree with these comments if the relatively simple and naive algorithm used in my initial rep011 were adopted However the more sophisticated multi-day reverse engineering methodologies illustrated in my supplemental repmt demonstrated successful reverse engineering for these more challenging scenarios
I think it is also important to stress that as pointed out in my reports in practice it would be expected that expe1ts with knowledge of the specific stocks involved with some prior historical inf01mation about the p01tfolio and with an understanding of prevailing market conditions for example would be able to fineshytune any methodology in order to substantially improve its performance
6 DERA Simulations
The DERA Memorandum contains an imp01tant observation Any success in reverse-engineering the p01tfolio weights should therefore be considered a lower bound on what is possible Similarly if an attempt at reverse engineering is made which turns out to be unsuccessful then this in no way shows that reverse engineering cannot be done It should not be forgotten that all of the analyses of reverse engineering that have been perfonned so far only provide a lower bound on what a detennined approach at reverse engineering could achieve
The DERA simulations provide fmther useful insights into the reverse engineering problem and since like REO they are using rehirns which is not the best specification and which adds difficulty and noise to the problem it is clear that their results could be improved upon
I agree with the findings of the DERA simulations that
bull the effectiveness of reverse engineering decreases as the size of the universe increases
5
11 | P a g e
t)BLUE TRACTOR
bull funds that invest in a larger fraction of the universe are harder to reverse engineer
bull algorithms perform better with more observations relative to the universe size
Finally I like the ingenuity and insight that DERA was able to improve estimation results using the fact that each enor te1111 ct is a result of rounding to the nearest pe1my so $-0005 lt ct lt $0005 for all t so that they find benefit by posing the least-squares problem as a quadratic program This illustrates the fact that an ingenious and detennined protagonist will be able to fine-tune any methodology in order to substantially improve its perfonnance
7 New Results
Tables 11 -23 present new simulation results that demonstrate a new improved algorithm for conducting reverse engineering The tables presented here are updated versions of Tables 11 -23 contained within my supplemental report of October 1911 2017
A po1tfolio of 130 stocks out of a potential universe of 1000 stocks is considered with a scaled pmtfolio price of 50 (Tables 11 -13) and 30 (Tables 21 -23) and with the repmting of prices at time points I -second apart In all cases in addition to the scaling of the portfolio price shielding of the pmtfolio is achieved by rounding the pmtfolio price to r = 2 decimal places (in other words to the nearest penny) Fmthennore as discussed in my supplemental report three scenarios of the daily stock volatilities er d and conelations p are considered
The results presented here use an improved version of the sophisticated multi-day reverse engineering methodology illustrated in my supplemental repo1t Specifically similarly to the approach discussed and adopted in the DERA simulations a quadratic progra1mning minimization algorithm with constraints was implemented which makes full use of the fact that the weights are positive and sum to one and which can also make use of the known bounds on the enors as pointed out by DERA
I have used metrics which I think most clearly demonstrate the effectiveness of the reverse engineering namely
bull umber of stocks inc01Tectly excluded from the estimated portfolio
6
12 | P a g e
t)BLUE TRACTOR
bull Average absolute difference between true weight and estimated weight for the 130 stocks in the portfolio
bull Number of stocks incorrectly included in the estimated portfolio bull Sum of estimated weights for stocks inco1Tectly included in the estimated
po1tfolio
For completeness I have also included the standard Pearson co1Telation coefficient and the Spearman rank correlation coefficient between the tme weights and the estimated weights
The results presented in Tables 11-23 clearly show the success of the reverse engineering and they also have a substantial improvement over the results presented in my supplemental repo1t This illustrates the important point that there is always the potential to provide a new insight that can lead to the improvement of a reverse engineering methodology simply by formulating the algorithm slightly differently
Anthony Hayter PhD
HayterStatisticscom
November 261 2017
7
13 | P a g e
t)BLUE TRACTOR
Table 11
Un iverse of k = 1000 potent ial stocks Portfolio initia lly conta ins 130 stocks with equa l weights 1130
Init ial sca led value of a portfol io share= 50 Portfol io share price rounded to r=2 decimal places
1-second reporting 23400 values pe r day)
Worst-case scenario for dai ly volati lity and correlations crd = 00137 and p = 055 1
Table entries are average va lues based on M = 10 simulat ions
Average absolut e Sum of estimated Pearson
Spearman Num ber of stocks difference Number of stocks
we ights for stocks correlat ion rank
incorrect ly between t rue incorrectly correlat ion
excluded from weight and includ ed in incorrect ly between t rue
between t rue included in weight s and
the est imated est ima ted w eight t he est imated the esti mated est imat ed
weights and portfolio fo r the 130 stocks portfolio
portfolio weights est imated
in t he portfolio weight s
Portfo lio weights unchanged
Day 1 19 00015 40 00165 096 098
Day 2 00 00010 0 1 00003 098 100
Day 3 00 00009 00 00000 099 100
Day4 00 00008 00 00000 099 100
Day 5 00 00007 00 00000 099 100
Day 6 00 00006 00 00000 099 100
Day 7 00 00005 00 00000 100 100
Day8 00 00005 00 00000 100 100
Day9 00 00005 00 00000 100 100
Day 10 00 00005 00 00000 100 100
Portfolio weights change day to day
Day 1 10 00015 33 00138 098 096
Day 2 00 00010 02 00007 100 098
Day 3 00 00008 00 00000 100 099
Day4 00 00007 00 00000 100 099
Day 5 00 00007 00 00000 100 099
Day6 00 00006 00 00000 100 099
Day 7 00 00006 00 00000 100 099
Day8 00 00006 00 00000 100 100
Day9 00 00005 00 00000 100 100
Day 10 00 00005 00 00000 100 100
8
14 | P a g e
t)BLUE TRACTOR
Table 12
Un iverse of k = 1000 potential stocks Portfol io initia lly conta ins 130 stocks w ith equal weights 1130
Init ial sca led va lue of a portfolio sha re = 50 Portfolio share price rounded to r=2 decimal places
1-second reporting (23400 values per day)
Average scena rio for daily volatility and correlations ltTd = 00173 and p = 0278
Table entries are average va lues based on M = 10 simulations
Average absolut e Sum of estimated Pearson
Spearman Number of st ocks difference Number of stocks
we ight s for stocks correlati on rank
incorrect ly between t rue incorrectly correlat ion
excluded from weight and included in incorrect ly between true
bet ween t rue included in weights and
t he est imated est imated weight t he est imated the est imated est imated
weight s and
portfolio for t he 130 stocks portfolio portfolio weights
est imated
in t he portfolio weight s
Portfol io weights unchanged
Day 1 0 00009 0 00000 099 100
Day 2 0 00006 0 00000 099 100
Day 3 0 00005 0 00000 100 100
Day4 0 00004 0 00000 100 100
Day 5 0 00004 0 00000 100 100
Day6 0 00004 0 00000 100 100
Day 7 0 00003 0 00000 100 100
Day8 0 00003 0 00000 100 100
Day9 0 00003 0 00000 100 100
Day 10 0 00003 0 00000 100 100
Portfolio weights change day to day
Day 1 0 00009 0 00000 099 100
Day 2 0 00006 0 00000 099 100
Day 3 0 00005 0 00000 100 100
Day4 0 00005 0 00000 100 100
Day 5 0 00004 0 00000 100 100
Day6 0 00004 0 00000 100 100
Day 7 0 00004 0 00000 100 100
Day8 0 00004 0 00000 100 100
Day9 0 00004 0 00000 100 100
Day 10 0 00004 0 00000 100 100
9
15 | P a g e
t)BLUE TRACTOR
Table 13
Universe of k = 1000 potential stocks Portfolio initially conta ins 130 stocks with equa l weights 1130
Initial scaled value of a portfolio share= 50 Portfol io share price rounded to r=2 deci ma l places
1-second reporting (23400 values per da y)
Best-case scena rio for da ily volatility and correlations ltTd = 00237 and p = 0181
Table entries are average values based on M = 10 simulations
Average absolut e Sum of estimated Pearson
Spearman Number of stocks difference Number of stocks
weights for stocks correlati on ran k
incorrectly betw een t rue incorrectly corre lat ion
excluded from weight and included in incorrectly betw een t rue
bet ween true included in weights and
t he est imated est ima ted weight t he estimated t he est imated est imated
weights and
portfolio for th e 130 stocks portfolio portfolio weights
est imated
in t he portfo lio weight s
Portfolio weights unchanged
Day 1 0 00006 0 00000 100 100
Day 2 0 00004 0 00000 100 100
Day 3 0 00003 0 00000 100 100
Day4 0 00003 0 00000 100 100
Day 5 0 00003 0 00000 100 100
Day6 0 00002 0 00000 100 100
Day7 0 00002 0 00000 100 100
Day8 0 00002 0 00000 100 100
Day9 0 00002 0 00000 100 100
Day 10 0 00002 0 00000 100 100
Portfolio weights change day to day
Day 1 0 00006 0 00000 100 100
Day 2 0 00004 0 00000 100 100
Day 3 0 00003 0 00000 100 100
Day4 0 00003 0 00000 100 100
Day 5 0 00003 0 00000 100 100
Day 6 0 00003 0 00000 100 100
Day 7 0 00003 0 00000 100 100
Day8 0 00003 0 00000 100 100
Day 9 0 00003 0 00000 100 100
Day 10 0 00003 0 00000 100 100
10
16 | P a g e
t)BLUE TRACTOR
Table 21
Un iverse of k = 1000 potential stocks Portfolio initially conta ins 130 stocks w ith equa l weights 1130
Initia l sca led value of a portfo lio share = 30 Portfolio sha re pr ice rounded to r=2 decima l places
1-second reporting (23400 values per day)
Worst-case scenario for daily volatility and correlations ltTd = 00137 and p = 0551
Table entries are average va lues based on M = 10 simulations
Average absolut e Sum of estimated Pearson
Spearma n Number of stocks difference Number of st ocks
we ight s for stocks correlat ion rank
incorrect ly between t rue incorrectly correlat ion
excluded from weight and included in incorrectly between true
between t rue included in we ights and
t he estima ted estimated weight the estimated the est imated est imated
weights and portfo lio fo r t he 130 stocks portfolio
portfolio weights est imated
in the portfolio weights
Portfolio weights unchanged
Day 1 364 00039 366 02052 071 069
Day2 199 00032 152 0070 1 083 085
Day3 83 00023 92 00387 091 093
Day4 57 00020 43 00163 093 096
Day 5 54 00019 09 00032 094 097
Day6 08 00015 07 00026 096 099
Day7 11 00014 02 00007 097 099
Day 8 21 00014 00 00000 097 099
Day9 03 00013 01 00003 098 100
Day 10 0 1 00012 00 00000 098 100
Portfolio weights change day to day
Day 1 353 00039 356 01993 071 070
Day2 192 00032 118 00548 084 087
Day3 77 00022 95 00398 091 093
Day4 4 1 00019 34 0014 1 094 097
Day 5 50 00019 15 00056 094 097
Day6 12 00015 18 00067 096 098
Day7 13 00015 05 00018 097 099
Day8 21 00015 02 00006 097 099
Day9 02 00013 03 00010 098 099
Day 10 02 00012 01 00003 098 099
11
17 | P a g e
t)BLUE TRACTOR
Table 22
Universe of k = 1000 potential stocks Portfolio initially contains 130 stocks with equal weights 1130
Init ial scaled value of a portfolio share = 30 Portfolio share price rounded to r=2 decimal places
1-second repo rt ing (23400 values per day)
Average scenario for da ily volatility and correlat ions ltTd = 00173 and p = 0278
Table entries are average values based on M = 10 simulations
Average absolut e Sum of est imated Pearson
Spearman Number of stocks difference Number of stocks
weight s for stocks correlat ion rank
incorrectly between t rue incorrectly correlat ion
excluded from weight an d included in incorrect ly between t rue
bet ween t rue included in w eight s and
t he est imated est imated weight t he estimat ed th e est imated est imated
weights and
portfolio fo r t he 130 stocks portfolio portfolio weights
est imated
in the portfolio weight s
Portfo lio weights unchanged
Day 1 139 00026 131 00629 087 089
Day 2 34 00017 27 00100 095 097
Day 3 10 00014 06 00022 097 099
Day4 0 1 00012 01 00003 098 100
Day 5 00 00010 00 00000 098 100
Day6 00 00009 00 00000 099 100
Day 7 00 00009 00 00000 099 100
Day 8 00 00008 00 00000 099 100
Day9 00 00008 00 00000 099 100
Day 10 00 00007 00 00000 099 100
Portfol io we ights change day to day
Day 1 140 00025 128 00636 087 089
Day 2 18 00017 34 00132 095 098
Day 3 06 00014 09 00032 097 099
Day4 00 00012 02 00007 098 100
Day 5 00 00010 00 00000 098 100
Day6 00 00010 00 00000 099 100
Day 7 00 00009 00 00000 099 100
Day8 00 00008 00 00000 099 100
Day9 00 00008 00 00000 099 100
Day 10 00 00008 00 00000 099 100
12
18 | P a g e
t)BLUE TRACTOR
Table 23
Un iverse of k = 1000 potential stocks Portfol io initia lly conta ins 130 stocks w ith equal weights 1130
In it ial sca led value of a portfolio sha re = 30 Portfolio sha re pri ce rounded to r=2 decima l places
1-second reporting (23400 values pe r day)
Best-case scena rio for daily volat ility and correlations ltTd = 00237 and p = 0181
Table entries are average va lues based on M = 10 simulations
Average absolut e Sum of est imated Pea rson
Spearman Number of st ocks difference Number of stocks
we ights for st ocks correlati on ran k
incorrectly between t rue incorrectly correlat ion
excluded from weight and included in incorrect ly between t ru e
bet ween true included in we ights and
t he est imated est imated weight the estimat ed t he est imated est imated
weights and
portfo lio for the 130 st ocks portfol io portfo lio weights
est imated
in the portfolio w eights
Portfolio weights unchanged
Day 1 10 00014 24 00097 097 098
Day 2 00 00009 0 1 00003 099 100
Day 3 00 00008 00 00000 099 100
Day 4 00 00007 00 00000 099 100
Day 5 00 00006 00 00000 099 100
Day6 00 00006 00 00000 100 100
Day 7 00 00005 00 00000 100 100
Day8 00 00005 00 00000 100 100
Day9 00 00005 00 00000 100 100
Day 10 00 00004 00 00000 100 100
Portfolio weights change day to day
Day 1 07 00014 17 00070 097 099
Day 2 00 00010 0 1 00003 099 100
Day 3 00 00008 00 00000 099 100
Day 4 00 00007 00 00000 099 100
Day 5 00 00006 00 00000 099 100
Day6 00 00006 00 00000 099 100
Day 7 00 00006 00 00000 100 100
Day8 00 00005 00 00000 100 100
Day9 00 00005 00 00000 100 100
DaylO 00 00005 00 00000 100 100
13
19 | P a g e

t)BLUE TRACTOR
HayterStatisticscom
November 261 2017
Notes on the November 16m 2017 Memorandum from the Division of Economic and Risk Analysis entitled
Inferring Non-Transparent ETF Portfolio Holdings
1 Overview
These notes provide some comments on the November 16th 2017 Memorandum from the Division of Economic and Risk Analysis (DERA) of the US Securities and Exchange Commission entitled Infening Non-Transparent ETF Portfolio Holdings
The DERA Memorandum provides a generally perceptive and well thoughtshyout discussion of the problem of reverse engineering a portfolio The DERA Memorandum considers the analyses presented in several repo1ts on this subject and also presents some original simulation results of their own The DERA Memorandum comes across as being a fair and unbiased assessment of the situation
It is interesting to note that in the DERA Memorandum the problem is specified in exactly the same way that I specified it in my initial rep01t The Reverse Engineering of Portfolio Compositions July 171 2017 The equation in the middle of page 1 of the DERA Memorandum is exactly identical to equation (1) on page 9 of my report with exactly the same weights which sum to one
The imp01tance of setting up the problem conectly in the first place cannot be overstated This is essential to the development of an algorithm that will successfully achieve reverse engineering It should be pointed out that neither Ricky Cooper nor Lawrence Glosten provided this equation in their work and they did not demonstrate that they had specified the problem conectly
1
EXHIBIT ONE
7 | P a g e
t)BLUE TRACTOR
Obviously a failed attempt at reverse engineering using a misspecified approach does not provide any illumination on the prospects of successfully achieving reverse engineering using a properly specified approach
2 REO Analysis
The REO approach is interesting in that it is based upon reh1rns from one time increment to the next (using 10 second increments in this case) rather than being based on price levels However as the DERA Memorandum explains this does not allow the precise estimation of what we are actually looking for Consequently this approach adds unnecessmy difficulty and noise to the problem
I agree with the DERA Memorandum that Over multiple days weight estimates based on returns will under-perform estimates based on price levels
3 Ricky Coopers Analysis
I agree with the discussion in the DERA Memorandum concerning how the problem is set up In the Cooper analysis the problem is poorly set up so that it is estimating the wrong thing with weights that do not sum to one
I agree with the DERA Memorandum that this analysis and inte1pretation has not fully accounting for the effects of scaling and I agree with the DERA Memorandum that there are inherent difficulties with regressing on unscaled prices (as in the Cooper analysis) rather than on scaled prices so that there are flaws in the operation and inte1pretation of the Cooper analysis
4 Lawrence Glostens Analysis
I agree with the DERA Memorandum that for the pmpose of reverse engineering an ETF s p01tfolio holdings small prediction e1rnrs are not the primmy objective and that with respect to LASSO it is not obvious a priori that it should outperfonn OLS In fact I think that there are clearly limitations to taking any off-the-shelf package and applying it to the problem of reverse engineering a p01tfolio Much more success is attainable with the development of an algorithm specifically for the reverse engineering problem at hand
2
8 | P a g e
t)BLUE TRACTOR
Again I agree with the discussion in the DERA Memorandum concerning how the problem is set up Again as the DERA Memorandum explains Because the regressors are not scaled the regression produces estimates of the number of shares of each security held These are quantities which do not sum to one
I think that the DERA Memorandum makes an impo11ant point in stating that Therefore it is possible that other LASSO implementations could achieve more accurate estimates of pmtfolio holdings This is a recognition that any failed attempt at reverse engineering does not prove that all attempts must fail
The DERA Memorandum confinns this by also stating that Finally Glosten s finding that OLS and LASSO are unable to accurately recover po1tfolio holdings for a larger universe of available pmtfolio securities (the Russell 1000) does not rule out the possibility that other techniques might perfo1111 better on stock tmiverses of the same size
5 Blue Tractors Analysis
This section of the DERA Memorandum comments on my initial repolt The Reverse Engineering of Po1tfolio Compositions July 17th 2017 However I issued a supplemental repmt on October 19th 2017 which is not refened to in the DERA Memorandum
The supplemental report considered more challenging scenarios than were considered in the initial repmt and it provided fuither analyses to confom that the reverse engineering of a po1tfolio is achievable with a substantial degree of accuracy
Specifically the differences between the analyses contained in the supplemental repmt and in my initial repmt are
bull Whereas the initial report only considered reporting of prices at time points IS -seconds apart which provides 1560 time points throughout a complete trading day in the supplemental repmt the repmting of prices at time points I-second apa1t is considered which provides 23 400 time points throughout a complete trading day
bull Whereas the initial report considered a universe of k = 100 potential stocks in the supplemental repmt the more challenging scenario of a universe of k = 1000 potential stocks is considered The reverse engineering of
3
9 | P a g e
t)BLUE TRACTOR
po1tfolios consisting of both 130 and 80 stocks out of this universe of k = 1000 potential stocks is demonstrated
bull Finally the implementation of more sophisticated multi -day reverse engineering methodologies is demonstrated in the supplemental report which more closely model how a serious attempt at reverse engineering would be made in practice
While it is conect that my analysis uses a single average conelation value across the simulated stock universe as pointed out in the DERA Memorandum I actually present worst-case average and best-case scenarios for the stock variabilities and correlations in an attempt to encompass real scenarios
I note the recognition in the DERA Memorandum (Hayter estimates the corTect regression specification) of the importance of setting up the problem corTectly
As the DERA Memorandum notes Hayter uses a two-pass approach the above regression is estimated any stocks with statistically insignificant coefficients are removed from the 1miverse and the regression is re-estimated and Nonetheless the two-pass aspect of his regression approach is an example of an alternative estimation technique that potentially improves upon the standard OLS and LASSO estimations above I think this illustrates the advantages that can accrue from an algoritlun designed specifically for the reverse engineering problem at hand
In fact the second stage of my approach is more of an optimization approach ( constrained quadratic minimization problem) similar to the teclmique mentioned on page 8 of the DERA Memorandum (posing the least-squares problem as a quadratic program) Again rather than taking any off-the-shelf package and applying it to the problem of reverse engineering a portfolio this illustrates that more success is attainable with the development of an algorithm specifically for the reverse engineering problem at hand
As the DERA Memorandum notes Hayter shows that with 5 days of data he can reverse engineer portfolios in this small universe to a very high degree of accuracy his weights are only off by an average of 0000776 relative to the true po1tfolio weight of 0025 exhibit very few fa lse-positives and never exclude a stock that is in the trne po1tfolio This demonstrated successful reverse
4
10 | P a g e
t)BLUE TRACTOR
engineering in this scenario with what I would consider a relatively simple and naive algorithm
The DERA Memorandum also notes With only one day of data and 15 second VIIV increments the results are less accurate but this is much less data than the one second increments that Precidian s ETF structure would provide and On a larger universe with 1 second data the results would probably lie somewhere in between these two extremes I agree with these comments if the relatively simple and naive algorithm used in my initial rep011 were adopted However the more sophisticated multi-day reverse engineering methodologies illustrated in my supplemental repmt demonstrated successful reverse engineering for these more challenging scenarios
I think it is also important to stress that as pointed out in my reports in practice it would be expected that expe1ts with knowledge of the specific stocks involved with some prior historical inf01mation about the p01tfolio and with an understanding of prevailing market conditions for example would be able to fineshytune any methodology in order to substantially improve its performance
6 DERA Simulations
The DERA Memorandum contains an imp01tant observation Any success in reverse-engineering the p01tfolio weights should therefore be considered a lower bound on what is possible Similarly if an attempt at reverse engineering is made which turns out to be unsuccessful then this in no way shows that reverse engineering cannot be done It should not be forgotten that all of the analyses of reverse engineering that have been perfonned so far only provide a lower bound on what a detennined approach at reverse engineering could achieve
The DERA simulations provide fmther useful insights into the reverse engineering problem and since like REO they are using rehirns which is not the best specification and which adds difficulty and noise to the problem it is clear that their results could be improved upon
I agree with the findings of the DERA simulations that
bull the effectiveness of reverse engineering decreases as the size of the universe increases
5
11 | P a g e
t)BLUE TRACTOR
bull funds that invest in a larger fraction of the universe are harder to reverse engineer
bull algorithms perform better with more observations relative to the universe size
Finally I like the ingenuity and insight that DERA was able to improve estimation results using the fact that each enor te1111 ct is a result of rounding to the nearest pe1my so $-0005 lt ct lt $0005 for all t so that they find benefit by posing the least-squares problem as a quadratic program This illustrates the fact that an ingenious and detennined protagonist will be able to fine-tune any methodology in order to substantially improve its perfonnance
7 New Results
Tables 11 -23 present new simulation results that demonstrate a new improved algorithm for conducting reverse engineering The tables presented here are updated versions of Tables 11 -23 contained within my supplemental report of October 1911 2017
A po1tfolio of 130 stocks out of a potential universe of 1000 stocks is considered with a scaled pmtfolio price of 50 (Tables 11 -13) and 30 (Tables 21 -23) and with the repmting of prices at time points I -second apart In all cases in addition to the scaling of the portfolio price shielding of the pmtfolio is achieved by rounding the pmtfolio price to r = 2 decimal places (in other words to the nearest penny) Fmthennore as discussed in my supplemental report three scenarios of the daily stock volatilities er d and conelations p are considered
The results presented here use an improved version of the sophisticated multi-day reverse engineering methodology illustrated in my supplemental repo1t Specifically similarly to the approach discussed and adopted in the DERA simulations a quadratic progra1mning minimization algorithm with constraints was implemented which makes full use of the fact that the weights are positive and sum to one and which can also make use of the known bounds on the enors as pointed out by DERA
I have used metrics which I think most clearly demonstrate the effectiveness of the reverse engineering namely
bull umber of stocks inc01Tectly excluded from the estimated portfolio
6
12 | P a g e
t)BLUE TRACTOR
bull Average absolute difference between true weight and estimated weight for the 130 stocks in the portfolio
bull Number of stocks incorrectly included in the estimated portfolio bull Sum of estimated weights for stocks inco1Tectly included in the estimated
po1tfolio
For completeness I have also included the standard Pearson co1Telation coefficient and the Spearman rank correlation coefficient between the tme weights and the estimated weights
The results presented in Tables 11-23 clearly show the success of the reverse engineering and they also have a substantial improvement over the results presented in my supplemental repo1t This illustrates the important point that there is always the potential to provide a new insight that can lead to the improvement of a reverse engineering methodology simply by formulating the algorithm slightly differently
Anthony Hayter PhD
HayterStatisticscom
November 261 2017
7
13 | P a g e
t)BLUE TRACTOR
Table 11
Un iverse of k = 1000 potent ial stocks Portfolio initia lly conta ins 130 stocks with equa l weights 1130
Init ial sca led value of a portfol io share= 50 Portfol io share price rounded to r=2 decimal places
1-second reporting 23400 values pe r day)
Worst-case scenario for dai ly volati lity and correlations crd = 00137 and p = 055 1
Table entries are average va lues based on M = 10 simulat ions
Average absolut e Sum of estimated Pearson
Spearman Num ber of stocks difference Number of stocks
we ights for stocks correlat ion rank
incorrect ly between t rue incorrectly correlat ion
excluded from weight and includ ed in incorrect ly between t rue
between t rue included in weight s and
the est imated est ima ted w eight t he est imated the esti mated est imat ed
weights and portfolio fo r the 130 stocks portfolio
portfolio weights est imated
in t he portfolio weight s
Portfo lio weights unchanged
Day 1 19 00015 40 00165 096 098
Day 2 00 00010 0 1 00003 098 100
Day 3 00 00009 00 00000 099 100
Day4 00 00008 00 00000 099 100
Day 5 00 00007 00 00000 099 100
Day 6 00 00006 00 00000 099 100
Day 7 00 00005 00 00000 100 100
Day8 00 00005 00 00000 100 100
Day9 00 00005 00 00000 100 100
Day 10 00 00005 00 00000 100 100
Portfolio weights change day to day
Day 1 10 00015 33 00138 098 096
Day 2 00 00010 02 00007 100 098
Day 3 00 00008 00 00000 100 099
Day4 00 00007 00 00000 100 099
Day 5 00 00007 00 00000 100 099
Day6 00 00006 00 00000 100 099
Day 7 00 00006 00 00000 100 099
Day8 00 00006 00 00000 100 100
Day9 00 00005 00 00000 100 100
Day 10 00 00005 00 00000 100 100
8
14 | P a g e
t)BLUE TRACTOR
Table 12
Un iverse of k = 1000 potential stocks Portfol io initia lly conta ins 130 stocks w ith equal weights 1130
Init ial sca led va lue of a portfolio sha re = 50 Portfolio share price rounded to r=2 decimal places
1-second reporting (23400 values per day)
Average scena rio for daily volatility and correlations ltTd = 00173 and p = 0278
Table entries are average va lues based on M = 10 simulations
Average absolut e Sum of estimated Pearson
Spearman Number of st ocks difference Number of stocks
we ight s for stocks correlati on rank
incorrect ly between t rue incorrectly correlat ion
excluded from weight and included in incorrect ly between true
bet ween t rue included in weights and
t he est imated est imated weight t he est imated the est imated est imated
weight s and
portfolio for t he 130 stocks portfolio portfolio weights
est imated
in t he portfolio weight s
Portfol io weights unchanged
Day 1 0 00009 0 00000 099 100
Day 2 0 00006 0 00000 099 100
Day 3 0 00005 0 00000 100 100
Day4 0 00004 0 00000 100 100
Day 5 0 00004 0 00000 100 100
Day6 0 00004 0 00000 100 100
Day 7 0 00003 0 00000 100 100
Day8 0 00003 0 00000 100 100
Day9 0 00003 0 00000 100 100
Day 10 0 00003 0 00000 100 100
Portfolio weights change day to day
Day 1 0 00009 0 00000 099 100
Day 2 0 00006 0 00000 099 100
Day 3 0 00005 0 00000 100 100
Day4 0 00005 0 00000 100 100
Day 5 0 00004 0 00000 100 100
Day6 0 00004 0 00000 100 100
Day 7 0 00004 0 00000 100 100
Day8 0 00004 0 00000 100 100
Day9 0 00004 0 00000 100 100
Day 10 0 00004 0 00000 100 100
9
15 | P a g e
t)BLUE TRACTOR
Table 13
Universe of k = 1000 potential stocks Portfolio initially conta ins 130 stocks with equa l weights 1130
Initial scaled value of a portfolio share= 50 Portfol io share price rounded to r=2 deci ma l places
1-second reporting (23400 values per da y)
Best-case scena rio for da ily volatility and correlations ltTd = 00237 and p = 0181
Table entries are average values based on M = 10 simulations
Average absolut e Sum of estimated Pearson
Spearman Number of stocks difference Number of stocks
weights for stocks correlati on ran k
incorrectly betw een t rue incorrectly corre lat ion
excluded from weight and included in incorrectly betw een t rue
bet ween true included in weights and
t he est imated est ima ted weight t he estimated t he est imated est imated
weights and
portfolio for th e 130 stocks portfolio portfolio weights
est imated
in t he portfo lio weight s
Portfolio weights unchanged
Day 1 0 00006 0 00000 100 100
Day 2 0 00004 0 00000 100 100
Day 3 0 00003 0 00000 100 100
Day4 0 00003 0 00000 100 100
Day 5 0 00003 0 00000 100 100
Day6 0 00002 0 00000 100 100
Day7 0 00002 0 00000 100 100
Day8 0 00002 0 00000 100 100
Day9 0 00002 0 00000 100 100
Day 10 0 00002 0 00000 100 100
Portfolio weights change day to day
Day 1 0 00006 0 00000 100 100
Day 2 0 00004 0 00000 100 100
Day 3 0 00003 0 00000 100 100
Day4 0 00003 0 00000 100 100
Day 5 0 00003 0 00000 100 100
Day 6 0 00003 0 00000 100 100
Day 7 0 00003 0 00000 100 100
Day8 0 00003 0 00000 100 100
Day 9 0 00003 0 00000 100 100
Day 10 0 00003 0 00000 100 100
10
16 | P a g e
t)BLUE TRACTOR
Table 21
Un iverse of k = 1000 potential stocks Portfolio initially conta ins 130 stocks w ith equa l weights 1130
Initia l sca led value of a portfo lio share = 30 Portfolio sha re pr ice rounded to r=2 decima l places
1-second reporting (23400 values per day)
Worst-case scenario for daily volatility and correlations ltTd = 00137 and p = 0551
Table entries are average va lues based on M = 10 simulations
Average absolut e Sum of estimated Pearson
Spearma n Number of stocks difference Number of st ocks
we ight s for stocks correlat ion rank
incorrect ly between t rue incorrectly correlat ion
excluded from weight and included in incorrectly between true
between t rue included in we ights and
t he estima ted estimated weight the estimated the est imated est imated
weights and portfo lio fo r t he 130 stocks portfolio
portfolio weights est imated
in the portfolio weights
Portfolio weights unchanged
Day 1 364 00039 366 02052 071 069
Day2 199 00032 152 0070 1 083 085
Day3 83 00023 92 00387 091 093
Day4 57 00020 43 00163 093 096
Day 5 54 00019 09 00032 094 097
Day6 08 00015 07 00026 096 099
Day7 11 00014 02 00007 097 099
Day 8 21 00014 00 00000 097 099
Day9 03 00013 01 00003 098 100
Day 10 0 1 00012 00 00000 098 100
Portfolio weights change day to day
Day 1 353 00039 356 01993 071 070
Day2 192 00032 118 00548 084 087
Day3 77 00022 95 00398 091 093
Day4 4 1 00019 34 0014 1 094 097
Day 5 50 00019 15 00056 094 097
Day6 12 00015 18 00067 096 098
Day7 13 00015 05 00018 097 099
Day8 21 00015 02 00006 097 099
Day9 02 00013 03 00010 098 099
Day 10 02 00012 01 00003 098 099
11
17 | P a g e
t)BLUE TRACTOR
Table 22
Universe of k = 1000 potential stocks Portfolio initially contains 130 stocks with equal weights 1130
Init ial scaled value of a portfolio share = 30 Portfolio share price rounded to r=2 decimal places
1-second repo rt ing (23400 values per day)
Average scenario for da ily volatility and correlat ions ltTd = 00173 and p = 0278
Table entries are average values based on M = 10 simulations
Average absolut e Sum of est imated Pearson
Spearman Number of stocks difference Number of stocks
weight s for stocks correlat ion rank
incorrectly between t rue incorrectly correlat ion
excluded from weight an d included in incorrect ly between t rue
bet ween t rue included in w eight s and
t he est imated est imated weight t he estimat ed th e est imated est imated
weights and
portfolio fo r t he 130 stocks portfolio portfolio weights
est imated
in the portfolio weight s
Portfo lio weights unchanged
Day 1 139 00026 131 00629 087 089
Day 2 34 00017 27 00100 095 097
Day 3 10 00014 06 00022 097 099
Day4 0 1 00012 01 00003 098 100
Day 5 00 00010 00 00000 098 100
Day6 00 00009 00 00000 099 100
Day 7 00 00009 00 00000 099 100
Day 8 00 00008 00 00000 099 100
Day9 00 00008 00 00000 099 100
Day 10 00 00007 00 00000 099 100
Portfol io we ights change day to day
Day 1 140 00025 128 00636 087 089
Day 2 18 00017 34 00132 095 098
Day 3 06 00014 09 00032 097 099
Day4 00 00012 02 00007 098 100
Day 5 00 00010 00 00000 098 100
Day6 00 00010 00 00000 099 100
Day 7 00 00009 00 00000 099 100
Day8 00 00008 00 00000 099 100
Day9 00 00008 00 00000 099 100
Day 10 00 00008 00 00000 099 100
12
18 | P a g e
t)BLUE TRACTOR
Table 23
Un iverse of k = 1000 potential stocks Portfol io initia lly conta ins 130 stocks w ith equal weights 1130
In it ial sca led value of a portfolio sha re = 30 Portfolio sha re pri ce rounded to r=2 decima l places
1-second reporting (23400 values pe r day)
Best-case scena rio for daily volat ility and correlations ltTd = 00237 and p = 0181
Table entries are average va lues based on M = 10 simulations
Average absolut e Sum of est imated Pea rson
Spearman Number of st ocks difference Number of stocks
we ights for st ocks correlati on ran k
incorrectly between t rue incorrectly correlat ion
excluded from weight and included in incorrect ly between t ru e
bet ween true included in we ights and
t he est imated est imated weight the estimat ed t he est imated est imated
weights and
portfo lio for the 130 st ocks portfol io portfo lio weights
est imated
in the portfolio w eights
Portfolio weights unchanged
Day 1 10 00014 24 00097 097 098
Day 2 00 00009 0 1 00003 099 100
Day 3 00 00008 00 00000 099 100
Day 4 00 00007 00 00000 099 100
Day 5 00 00006 00 00000 099 100
Day6 00 00006 00 00000 100 100
Day 7 00 00005 00 00000 100 100
Day8 00 00005 00 00000 100 100
Day9 00 00005 00 00000 100 100
Day 10 00 00004 00 00000 100 100
Portfolio weights change day to day
Day 1 07 00014 17 00070 097 099
Day 2 00 00010 0 1 00003 099 100
Day 3 00 00008 00 00000 099 100
Day 4 00 00007 00 00000 099 100
Day 5 00 00006 00 00000 099 100
Day6 00 00006 00 00000 099 100
Day 7 00 00006 00 00000 100 100
Day8 00 00005 00 00000 100 100
Day9 00 00005 00 00000 100 100
DaylO 00 00005 00 00000 100 100
13
19 | P a g e

t)BLUE TRACTOR
Again I agree with the discussion in the DERA Memorandum concerning how the problem is set up Again as the DERA Memorandum explains Because the regressors are not scaled the regression produces estimates of the number of shares of each security held These are quantities which do not sum to one
I think that the DERA Memorandum makes an impo11ant point in stating that Therefore it is possible that other LASSO implementations could achieve more accurate estimates of pmtfolio holdings This is a recognition that any failed attempt at reverse engineering does not prove that all attempts must fail
The DERA Memorandum confinns this by also stating that Finally Glosten s finding that OLS and LASSO are unable to accurately recover po1tfolio holdings for a larger universe of available pmtfolio securities (the Russell 1000) does not rule out the possibility that other techniques might perfo1111 better on stock tmiverses of the same size
5 Blue Tractors Analysis
This section of the DERA Memorandum comments on my initial repolt The Reverse Engineering of Po1tfolio Compositions July 17th 2017 However I issued a supplemental repmt on October 19th 2017 which is not refened to in the DERA Memorandum
The supplemental report considered more challenging scenarios than were considered in the initial repmt and it provided fuither analyses to confom that the reverse engineering of a po1tfolio is achievable with a substantial degree of accuracy
Specifically the differences between the analyses contained in the supplemental repmt and in my initial repmt are
bull Whereas the initial report only considered reporting of prices at time points IS -seconds apart which provides 1560 time points throughout a complete trading day in the supplemental repmt the repmting of prices at time points I-second apa1t is considered which provides 23 400 time points throughout a complete trading day
bull Whereas the initial report considered a universe of k = 100 potential stocks in the supplemental repmt the more challenging scenario of a universe of k = 1000 potential stocks is considered The reverse engineering of
3
9 | P a g e
t)BLUE TRACTOR
po1tfolios consisting of both 130 and 80 stocks out of this universe of k = 1000 potential stocks is demonstrated
bull Finally the implementation of more sophisticated multi -day reverse engineering methodologies is demonstrated in the supplemental report which more closely model how a serious attempt at reverse engineering would be made in practice
While it is conect that my analysis uses a single average conelation value across the simulated stock universe as pointed out in the DERA Memorandum I actually present worst-case average and best-case scenarios for the stock variabilities and correlations in an attempt to encompass real scenarios
I note the recognition in the DERA Memorandum (Hayter estimates the corTect regression specification) of the importance of setting up the problem corTectly
As the DERA Memorandum notes Hayter uses a two-pass approach the above regression is estimated any stocks with statistically insignificant coefficients are removed from the 1miverse and the regression is re-estimated and Nonetheless the two-pass aspect of his regression approach is an example of an alternative estimation technique that potentially improves upon the standard OLS and LASSO estimations above I think this illustrates the advantages that can accrue from an algoritlun designed specifically for the reverse engineering problem at hand
In fact the second stage of my approach is more of an optimization approach ( constrained quadratic minimization problem) similar to the teclmique mentioned on page 8 of the DERA Memorandum (posing the least-squares problem as a quadratic program) Again rather than taking any off-the-shelf package and applying it to the problem of reverse engineering a portfolio this illustrates that more success is attainable with the development of an algorithm specifically for the reverse engineering problem at hand
As the DERA Memorandum notes Hayter shows that with 5 days of data he can reverse engineer portfolios in this small universe to a very high degree of accuracy his weights are only off by an average of 0000776 relative to the true po1tfolio weight of 0025 exhibit very few fa lse-positives and never exclude a stock that is in the trne po1tfolio This demonstrated successful reverse
4
10 | P a g e
t)BLUE TRACTOR
engineering in this scenario with what I would consider a relatively simple and naive algorithm
The DERA Memorandum also notes With only one day of data and 15 second VIIV increments the results are less accurate but this is much less data than the one second increments that Precidian s ETF structure would provide and On a larger universe with 1 second data the results would probably lie somewhere in between these two extremes I agree with these comments if the relatively simple and naive algorithm used in my initial rep011 were adopted However the more sophisticated multi-day reverse engineering methodologies illustrated in my supplemental repmt demonstrated successful reverse engineering for these more challenging scenarios
I think it is also important to stress that as pointed out in my reports in practice it would be expected that expe1ts with knowledge of the specific stocks involved with some prior historical inf01mation about the p01tfolio and with an understanding of prevailing market conditions for example would be able to fineshytune any methodology in order to substantially improve its performance
6 DERA Simulations
The DERA Memorandum contains an imp01tant observation Any success in reverse-engineering the p01tfolio weights should therefore be considered a lower bound on what is possible Similarly if an attempt at reverse engineering is made which turns out to be unsuccessful then this in no way shows that reverse engineering cannot be done It should not be forgotten that all of the analyses of reverse engineering that have been perfonned so far only provide a lower bound on what a detennined approach at reverse engineering could achieve
The DERA simulations provide fmther useful insights into the reverse engineering problem and since like REO they are using rehirns which is not the best specification and which adds difficulty and noise to the problem it is clear that their results could be improved upon
I agree with the findings of the DERA simulations that
bull the effectiveness of reverse engineering decreases as the size of the universe increases
5
11 | P a g e
t)BLUE TRACTOR
bull funds that invest in a larger fraction of the universe are harder to reverse engineer
bull algorithms perform better with more observations relative to the universe size
Finally I like the ingenuity and insight that DERA was able to improve estimation results using the fact that each enor te1111 ct is a result of rounding to the nearest pe1my so $-0005 lt ct lt $0005 for all t so that they find benefit by posing the least-squares problem as a quadratic program This illustrates the fact that an ingenious and detennined protagonist will be able to fine-tune any methodology in order to substantially improve its perfonnance
7 New Results
Tables 11 -23 present new simulation results that demonstrate a new improved algorithm for conducting reverse engineering The tables presented here are updated versions of Tables 11 -23 contained within my supplemental report of October 1911 2017
A po1tfolio of 130 stocks out of a potential universe of 1000 stocks is considered with a scaled pmtfolio price of 50 (Tables 11 -13) and 30 (Tables 21 -23) and with the repmting of prices at time points I -second apart In all cases in addition to the scaling of the portfolio price shielding of the pmtfolio is achieved by rounding the pmtfolio price to r = 2 decimal places (in other words to the nearest penny) Fmthennore as discussed in my supplemental report three scenarios of the daily stock volatilities er d and conelations p are considered
The results presented here use an improved version of the sophisticated multi-day reverse engineering methodology illustrated in my supplemental repo1t Specifically similarly to the approach discussed and adopted in the DERA simulations a quadratic progra1mning minimization algorithm with constraints was implemented which makes full use of the fact that the weights are positive and sum to one and which can also make use of the known bounds on the enors as pointed out by DERA
I have used metrics which I think most clearly demonstrate the effectiveness of the reverse engineering namely
bull umber of stocks inc01Tectly excluded from the estimated portfolio
6
12 | P a g e
t)BLUE TRACTOR
bull Average absolute difference between true weight and estimated weight for the 130 stocks in the portfolio
bull Number of stocks incorrectly included in the estimated portfolio bull Sum of estimated weights for stocks inco1Tectly included in the estimated
po1tfolio
For completeness I have also included the standard Pearson co1Telation coefficient and the Spearman rank correlation coefficient between the tme weights and the estimated weights
The results presented in Tables 11-23 clearly show the success of the reverse engineering and they also have a substantial improvement over the results presented in my supplemental repo1t This illustrates the important point that there is always the potential to provide a new insight that can lead to the improvement of a reverse engineering methodology simply by formulating the algorithm slightly differently
Anthony Hayter PhD
HayterStatisticscom
November 261 2017
7
13 | P a g e
t)BLUE TRACTOR
Table 11
Un iverse of k = 1000 potent ial stocks Portfolio initia lly conta ins 130 stocks with equa l weights 1130
Init ial sca led value of a portfol io share= 50 Portfol io share price rounded to r=2 decimal places
1-second reporting 23400 values pe r day)
Worst-case scenario for dai ly volati lity and correlations crd = 00137 and p = 055 1
Table entries are average va lues based on M = 10 simulat ions
Average absolut e Sum of estimated Pearson
Spearman Num ber of stocks difference Number of stocks
we ights for stocks correlat ion rank
incorrect ly between t rue incorrectly correlat ion
excluded from weight and includ ed in incorrect ly between t rue
between t rue included in weight s and
the est imated est ima ted w eight t he est imated the esti mated est imat ed
weights and portfolio fo r the 130 stocks portfolio
portfolio weights est imated
in t he portfolio weight s
Portfo lio weights unchanged
Day 1 19 00015 40 00165 096 098
Day 2 00 00010 0 1 00003 098 100
Day 3 00 00009 00 00000 099 100
Day4 00 00008 00 00000 099 100
Day 5 00 00007 00 00000 099 100
Day 6 00 00006 00 00000 099 100
Day 7 00 00005 00 00000 100 100
Day8 00 00005 00 00000 100 100
Day9 00 00005 00 00000 100 100
Day 10 00 00005 00 00000 100 100
Portfolio weights change day to day
Day 1 10 00015 33 00138 098 096
Day 2 00 00010 02 00007 100 098
Day 3 00 00008 00 00000 100 099
Day4 00 00007 00 00000 100 099
Day 5 00 00007 00 00000 100 099
Day6 00 00006 00 00000 100 099
Day 7 00 00006 00 00000 100 099
Day8 00 00006 00 00000 100 100
Day9 00 00005 00 00000 100 100
Day 10 00 00005 00 00000 100 100
8
14 | P a g e
t)BLUE TRACTOR
Table 12
Un iverse of k = 1000 potential stocks Portfol io initia lly conta ins 130 stocks w ith equal weights 1130
Init ial sca led va lue of a portfolio sha re = 50 Portfolio share price rounded to r=2 decimal places
1-second reporting (23400 values per day)
Average scena rio for daily volatility and correlations ltTd = 00173 and p = 0278
Table entries are average va lues based on M = 10 simulations
Average absolut e Sum of estimated Pearson
Spearman Number of st ocks difference Number of stocks
we ight s for stocks correlati on rank
incorrect ly between t rue incorrectly correlat ion
excluded from weight and included in incorrect ly between true
bet ween t rue included in weights and
t he est imated est imated weight t he est imated the est imated est imated
weight s and
portfolio for t he 130 stocks portfolio portfolio weights
est imated
in t he portfolio weight s
Portfol io weights unchanged
Day 1 0 00009 0 00000 099 100
Day 2 0 00006 0 00000 099 100
Day 3 0 00005 0 00000 100 100
Day4 0 00004 0 00000 100 100
Day 5 0 00004 0 00000 100 100
Day6 0 00004 0 00000 100 100
Day 7 0 00003 0 00000 100 100
Day8 0 00003 0 00000 100 100
Day9 0 00003 0 00000 100 100
Day 10 0 00003 0 00000 100 100
Portfolio weights change day to day
Day 1 0 00009 0 00000 099 100
Day 2 0 00006 0 00000 099 100
Day 3 0 00005 0 00000 100 100
Day4 0 00005 0 00000 100 100
Day 5 0 00004 0 00000 100 100
Day6 0 00004 0 00000 100 100
Day 7 0 00004 0 00000 100 100
Day8 0 00004 0 00000 100 100
Day9 0 00004 0 00000 100 100
Day 10 0 00004 0 00000 100 100
9
15 | P a g e
t)BLUE TRACTOR
Table 13
Universe of k = 1000 potential stocks Portfolio initially conta ins 130 stocks with equa l weights 1130
Initial scaled value of a portfolio share= 50 Portfol io share price rounded to r=2 deci ma l places
1-second reporting (23400 values per da y)
Best-case scena rio for da ily volatility and correlations ltTd = 00237 and p = 0181
Table entries are average values based on M = 10 simulations
Average absolut e Sum of estimated Pearson
Spearman Number of stocks difference Number of stocks
weights for stocks correlati on ran k
incorrectly betw een t rue incorrectly corre lat ion
excluded from weight and included in incorrectly betw een t rue
bet ween true included in weights and
t he est imated est ima ted weight t he estimated t he est imated est imated
weights and
portfolio for th e 130 stocks portfolio portfolio weights
est imated
in t he portfo lio weight s
Portfolio weights unchanged
Day 1 0 00006 0 00000 100 100
Day 2 0 00004 0 00000 100 100
Day 3 0 00003 0 00000 100 100
Day4 0 00003 0 00000 100 100
Day 5 0 00003 0 00000 100 100
Day6 0 00002 0 00000 100 100
Day7 0 00002 0 00000 100 100
Day8 0 00002 0 00000 100 100
Day9 0 00002 0 00000 100 100
Day 10 0 00002 0 00000 100 100
Portfolio weights change day to day
Day 1 0 00006 0 00000 100 100
Day 2 0 00004 0 00000 100 100
Day 3 0 00003 0 00000 100 100
Day4 0 00003 0 00000 100 100
Day 5 0 00003 0 00000 100 100
Day 6 0 00003 0 00000 100 100
Day 7 0 00003 0 00000 100 100
Day8 0 00003 0 00000 100 100
Day 9 0 00003 0 00000 100 100
Day 10 0 00003 0 00000 100 100
10
16 | P a g e
t)BLUE TRACTOR
Table 21
Un iverse of k = 1000 potential stocks Portfolio initially conta ins 130 stocks w ith equa l weights 1130
Initia l sca led value of a portfo lio share = 30 Portfolio sha re pr ice rounded to r=2 decima l places
1-second reporting (23400 values per day)
Worst-case scenario for daily volatility and correlations ltTd = 00137 and p = 0551
Table entries are average va lues based on M = 10 simulations
Average absolut e Sum of estimated Pearson
Spearma n Number of stocks difference Number of st ocks
we ight s for stocks correlat ion rank
incorrect ly between t rue incorrectly correlat ion
excluded from weight and included in incorrectly between true
between t rue included in we ights and
t he estima ted estimated weight the estimated the est imated est imated
weights and portfo lio fo r t he 130 stocks portfolio
portfolio weights est imated
in the portfolio weights
Portfolio weights unchanged
Day 1 364 00039 366 02052 071 069
Day2 199 00032 152 0070 1 083 085
Day3 83 00023 92 00387 091 093
Day4 57 00020 43 00163 093 096
Day 5 54 00019 09 00032 094 097
Day6 08 00015 07 00026 096 099
Day7 11 00014 02 00007 097 099
Day 8 21 00014 00 00000 097 099
Day9 03 00013 01 00003 098 100
Day 10 0 1 00012 00 00000 098 100
Portfolio weights change day to day
Day 1 353 00039 356 01993 071 070
Day2 192 00032 118 00548 084 087
Day3 77 00022 95 00398 091 093
Day4 4 1 00019 34 0014 1 094 097
Day 5 50 00019 15 00056 094 097
Day6 12 00015 18 00067 096 098
Day7 13 00015 05 00018 097 099
Day8 21 00015 02 00006 097 099
Day9 02 00013 03 00010 098 099
Day 10 02 00012 01 00003 098 099
11
17 | P a g e
t)BLUE TRACTOR
Table 22
Universe of k = 1000 potential stocks Portfolio initially contains 130 stocks with equal weights 1130
Init ial scaled value of a portfolio share = 30 Portfolio share price rounded to r=2 decimal places
1-second repo rt ing (23400 values per day)
Average scenario for da ily volatility and correlat ions ltTd = 00173 and p = 0278
Table entries are average values based on M = 10 simulations
Average absolut e Sum of est imated Pearson
Spearman Number of stocks difference Number of stocks
weight s for stocks correlat ion rank
incorrectly between t rue incorrectly correlat ion
excluded from weight an d included in incorrect ly between t rue
bet ween t rue included in w eight s and
t he est imated est imated weight t he estimat ed th e est imated est imated
weights and
portfolio fo r t he 130 stocks portfolio portfolio weights
est imated
in the portfolio weight s
Portfo lio weights unchanged
Day 1 139 00026 131 00629 087 089
Day 2 34 00017 27 00100 095 097
Day 3 10 00014 06 00022 097 099
Day4 0 1 00012 01 00003 098 100
Day 5 00 00010 00 00000 098 100
Day6 00 00009 00 00000 099 100
Day 7 00 00009 00 00000 099 100
Day 8 00 00008 00 00000 099 100
Day9 00 00008 00 00000 099 100
Day 10 00 00007 00 00000 099 100
Portfol io we ights change day to day
Day 1 140 00025 128 00636 087 089
Day 2 18 00017 34 00132 095 098
Day 3 06 00014 09 00032 097 099
Day4 00 00012 02 00007 098 100
Day 5 00 00010 00 00000 098 100
Day6 00 00010 00 00000 099 100
Day 7 00 00009 00 00000 099 100
Day8 00 00008 00 00000 099 100
Day9 00 00008 00 00000 099 100
Day 10 00 00008 00 00000 099 100
12
18 | P a g e
t)BLUE TRACTOR
Table 23
Un iverse of k = 1000 potential stocks Portfol io initia lly conta ins 130 stocks w ith equal weights 1130
In it ial sca led value of a portfolio sha re = 30 Portfolio sha re pri ce rounded to r=2 decima l places
1-second reporting (23400 values pe r day)
Best-case scena rio for daily volat ility and correlations ltTd = 00237 and p = 0181
Table entries are average va lues based on M = 10 simulations
Average absolut e Sum of est imated Pea rson
Spearman Number of st ocks difference Number of stocks
we ights for st ocks correlati on ran k
incorrectly between t rue incorrectly correlat ion
excluded from weight and included in incorrect ly between t ru e
bet ween true included in we ights and
t he est imated est imated weight the estimat ed t he est imated est imated
weights and
portfo lio for the 130 st ocks portfol io portfo lio weights
est imated
in the portfolio w eights
Portfolio weights unchanged
Day 1 10 00014 24 00097 097 098
Day 2 00 00009 0 1 00003 099 100
Day 3 00 00008 00 00000 099 100
Day 4 00 00007 00 00000 099 100
Day 5 00 00006 00 00000 099 100
Day6 00 00006 00 00000 100 100
Day 7 00 00005 00 00000 100 100
Day8 00 00005 00 00000 100 100
Day9 00 00005 00 00000 100 100
Day 10 00 00004 00 00000 100 100
Portfolio weights change day to day
Day 1 07 00014 17 00070 097 099
Day 2 00 00010 0 1 00003 099 100
Day 3 00 00008 00 00000 099 100
Day 4 00 00007 00 00000 099 100
Day 5 00 00006 00 00000 099 100
Day6 00 00006 00 00000 099 100
Day 7 00 00006 00 00000 100 100
Day8 00 00005 00 00000 100 100
Day9 00 00005 00 00000 100 100
DaylO 00 00005 00 00000 100 100
13
19 | P a g e
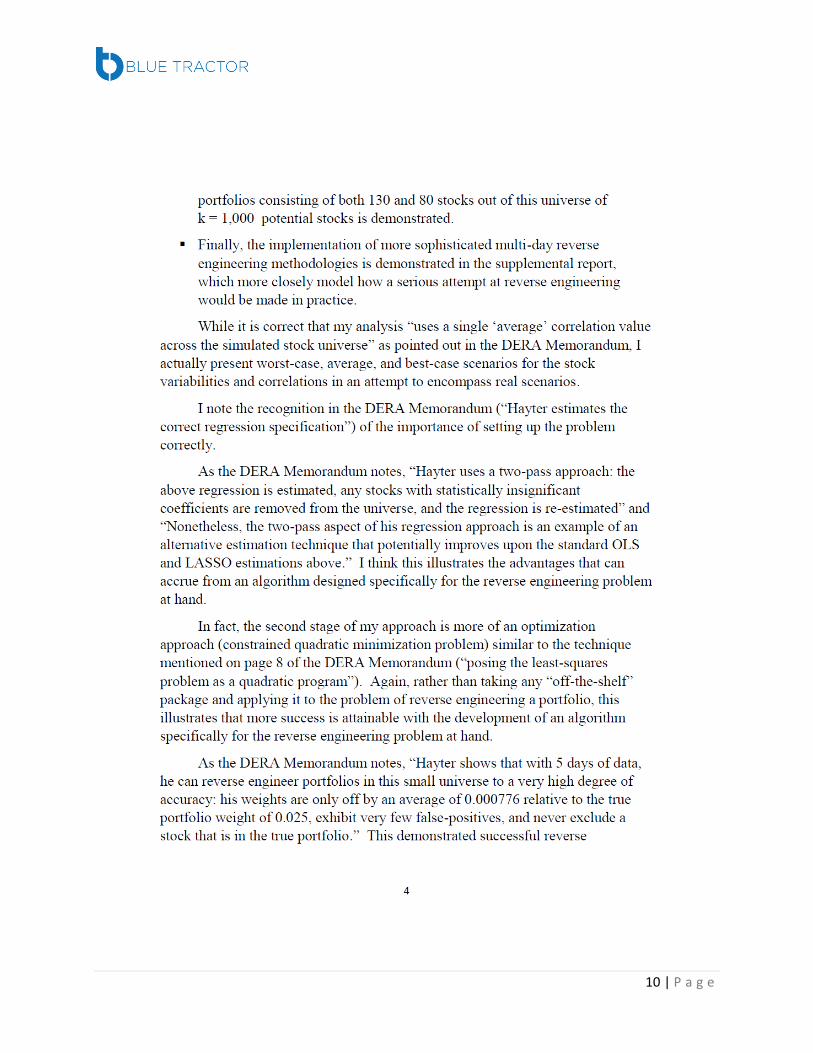
t)BLUE TRACTOR
Table 23
Un iverse of k = 1000 potential stocks Portfol io initia lly conta ins 130 stocks w ith equal weights 1130
In it ial sca led value of a portfolio sha re = 30 Portfolio sha re pri ce rounded to r=2 decima l places
1-second reporting (23400 values pe r day)
Best-case scena rio for daily volat ility and correlations ltTd = 00237 and p = 0181
Table entries are average va lues based on M = 10 simulations
Average absolut e Sum of est imated Pea rson
Spearman Number of st ocks difference Number of stocks
we ights for st ocks correlati on ran k
incorrectly between t rue incorrectly correlat ion
excluded from weight and included in incorrect ly between t ru e
bet ween true included in we ights and
t he est imated est imated weight the estimat ed t he est imated est imated
weights and
portfo lio for the 130 st ocks portfol io portfo lio weights
est imated
in the portfolio w eights
Portfolio weights unchanged
Day 1 10 00014 24 00097 097 098
Day 2 00 00009 0 1 00003 099 100
Day 3 00 00008 00 00000 099 100
Day 4 00 00007 00 00000 099 100
Day 5 00 00006 00 00000 099 100
Day6 00 00006 00 00000 100 100
Day 7 00 00005 00 00000 100 100
Day8 00 00005 00 00000 100 100
Day9 00 00005 00 00000 100 100
Day 10 00 00004 00 00000 100 100
Portfolio weights change day to day
Day 1 07 00014 17 00070 097 099
Day 2 00 00010 0 1 00003 099 100
Day 3 00 00008 00 00000 099 100
Day 4 00 00007 00 00000 099 100
Day 5 00 00006 00 00000 099 100
Day6 00 00006 00 00000 099 100
Day 7 00 00006 00 00000 100 100
Day8 00 00005 00 00000 100 100
Day9 00 00005 00 00000 100 100
DaylO 00 00005 00 00000 100 100
13
19 | P a g e