Taxation in Latin America From words and data to policy action · PDF fileCosta Rica Chile...
21
Taxation in Latin America From words and data to policy action Angel Melguizo OECD Development Centre Wilson Center – Latin American Programme Washington DC, April 20 2017
Transcript of Taxation in Latin America From words and data to policy action · PDF fileCosta Rica Chile...

Taxation in Latin AmericaFrom words and datato policy action
Angel MelguizoOECD Development Centre
Wilson Center – Latin American ProgrammeWashington DC, April 20 2017
Open data for better policies

Revenue Statistics and Taxing Wages in LAC
• Detailed, internationally comparable data on tax revenues and labour tax laws (including a simulator by income and family composition) in 20+ Latin American and Caribbean (LAC) economies
• Based on OECD Revenue Statistics and OECD Taxing Wages methodologies, but adapted to Latin America
• Joint projects with the Economic Commission for Latin America and the Caribbean (ECLAC) , the Inter-American Centre for Tax Administrations (CIAT), and Inter-American Development Bank (IDB)

LAC countries continued their convergence
process towards OECD taxation levels, despite the
economic slowdown
Total tax revenues in LAC and OECD, 1990-2015(Percentage of GDP)
0
5
10
15
20
25
30
35
1990 91 92 93 94 1995 96 97 98 99 2000 01 02 03 04 2005 06 07 08 09 2010 11 12 13 14 2015
Difference B-A LAC (24) (A) OECD (35) (B)
Source: OECD/ECLAC/CIAT/IDB (2017), Revenue Statistics in Latin America and the Caribbean

Wide national variations exist across LAC
countries (‘Americas Latinas’)
Total tax revenues in LAC countries and OECD, 2015(Percentage of GDP)
0 5 10 15 20 25 30 35 40
OECD
LAC
Guatemala
Dominican Republic
Panama
Peru
El Salvador
Mexico
Paraguay
The Bahamas
Chile
Colombia
Nicaragua
Venezuela
Ecuador
Honduras
Costa Rica
Bolivia
Jamaica
Belize
Uruguay
Trinidad and Tobago
Barbados
Brazil
Argentina
Cuba
Source: OECD/ECLAC/CIAT/IDB (2017), Revenue Statistics in Latin America and the Caribbean

Tax structures continue to be based on indirect tax
receipts (VAT and other taxes on consumption)
Tax revenue composition in LAC and OECD, 2015(Percentage of GPD and total tax revenues)
1. Represents a group of 24 Latin American and Caribbean countries . Chile and Mexico are also part of the OECD (35) group.2. Represents the unweighted average for OECD member countries in the year 2014.Source: OECD/ECLAC/CIAT/IDB (2017), Revenue Statistics in Latin America and the Caribbean
6.2 p.p. (27%)
3.8 p.p.(16%)
0.8 p.p.(4%)
11.2 p.p.(49%)
0.9 p.p, (4%)
Taxes on income and profits Social security contributions Property
Taxes on goods and services Other taxes
11.5 p.p.(34%)
9.1 p.p.(27%)
1.9 p.p.(5%)
11.0 p.p. (32%)
0.7 p.p. (2%)
LAC (24)1 OECD (35)2

Despite recent increases, personal income tax
collection continues to be low (vs CIT)
Personal and Corporate income tax revenues in LAC and OECD, 2015(Percentage of GDP)
Note: the share on taxes on income and the share on taxes on profits may not add up to the total share on taxes on incomes and profits due to unallocable revenue. Only countries that could allocate 75% or more of revenue of taxes on incomes and profits into the sub categories taxes on income and taxes on profits are shown in the figure above.
Source: OECD/ECLAC/CIAT/IDB (2017), Revenue Statistics in Latin America and the Caribbean
0 3 6 9 12 15
LAC
OECD
The Bahamas
Bolivia
Paraguay
Guatemala
Dominican Republic
Colombia
Costa Rica
Chile
Panama
Peru
Honduras
Belize
Cuba
Brazil
El Salvador
Uruguay
Argentina
Mexico
Jamaica
Trinidad and Tobago
Barbados
PIT CIT

Fiscal revenues from non-renewable natural
resources are (too?) important sources of revenue
Fiscal revenues from non-renewable natural resources, 2015(in billions of dollars and percentage of GDP)
0 10 20 30 40 50 60 70
Jamaica
Suriname
Dominican Republic
Trinidad and Tobago
Peru
Chile
Bolivia
Ecuador
Colombia
Argentina
Venezuela
Brazil
Mexico6.1
As % of GDP
1.4
6.7
1.7
2.7
6.3
10.9
1.3
1.3
7.7
0.3
0.9
0.2

From data to policy action (I)
• Given the economic slowdown and weak commodity prices, a no-policy change scenario suggests that tax revenues will notincrease. Key to ensure the financing of education, infrastructure andsocial programmes.
• Tax reforms have to come, hand in hand, with improvements in their management. Latin American governments need to strive for more efficient, transparent and innovative services
• In focus – tax reform and labour markets

Source: IDB (2015), Sistema de Indicadores de Mercado Laboral y Seguridad Social (SIMS)
Informality is pervasive, also within the emerging
middle class. Could tax reform help?
Labour informality in Latin America(Percentage of workers contributing to pensions, 2013)
85%
64%
42%
0%
10%
20%
30%
40%
50%
60%
70%
80%
90%
100%
GTM HND PER PRY NIC BOL COL ECU SLV MEX PAN DOM ARG VEN BRA URY CRI CHL
Quintil 1 Promedio Q2 - Q4 Quintil 5 Promedio ALC Q1 Promedio ALC Q2-Q4 Promedio ALC Q5
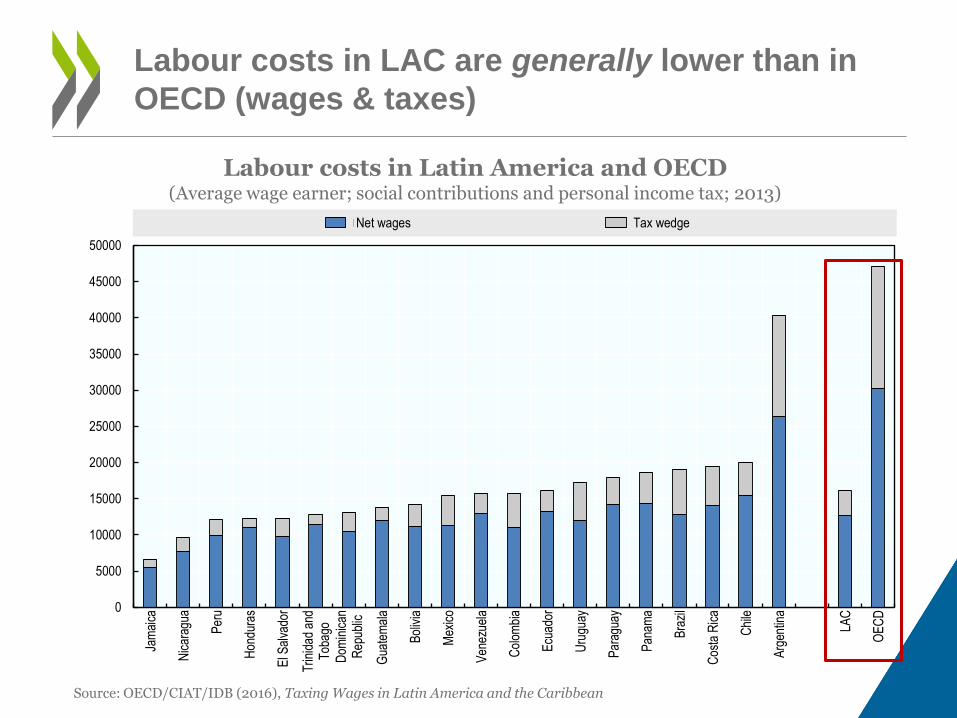
Labour costs in LAC are generally lower than in
OECD (wages & taxes)
Labour costs in Latin America and OECD(Average wage earner; social contributions and personal income tax; 2013)
0
5000
10000
15000
20000
25000
30000
35000
40000
45000
50000
Jam
aica
Nic
arag
ua
Per
u
Hon
dura
s
El S
alva
dor
Trin
idad
and
Tob
ago
Dom
inic
anR
epub
lic
Gua
tem
ala
Bol
ivia
Mex
ico
Ven
ezue
la
Col
ombi
a
Ecu
ador
Uru
guay
Par
agua
y
Pan
ama
Bra
zil
Cos
ta R
ica
Chi
le
Arg
entin
a
LAC
OE
CD
Net wages Tax wedge
Source: OECD/CIAT/IDB (2016), Taxing Wages in Latin America and the Caribbean

Labour costs are relatively low due to low taxes on
wages (22% vs 36%)…
Source: OECD/CIAT/IDB (2016), Taxing Wages in Latin America and the Caribbean

… explained by the personal income tax (average
formal worker is exempted)
Source: OECD/CIAT/IDB (2016), Taxing Wages in Latin America and the Caribbean

Personal income tax only taxes the top deciles…
Single worker, no children Married couple, two children
Tax wedge by level of income in Latin America(Percentage of labour costs, 2013)
-5
0
5
10
15
20
25
30
1 2 3 4 5 6 7 8 9 10
Deciles de ingreso
Transferencias monetarias Impuesto a la renta CSS empleado CSS empleador
-10
-5
0
5
10
15
20
25
30
1 2 3 4 5 6 7 8 9 10
Deciles de ingreso
Transferencias monetarias Impuesto a la renta CSS empleado CSS empleador
Source: OECD/CIAT/IDB (2016), Taxing Wages in Latin America and the Caribbean
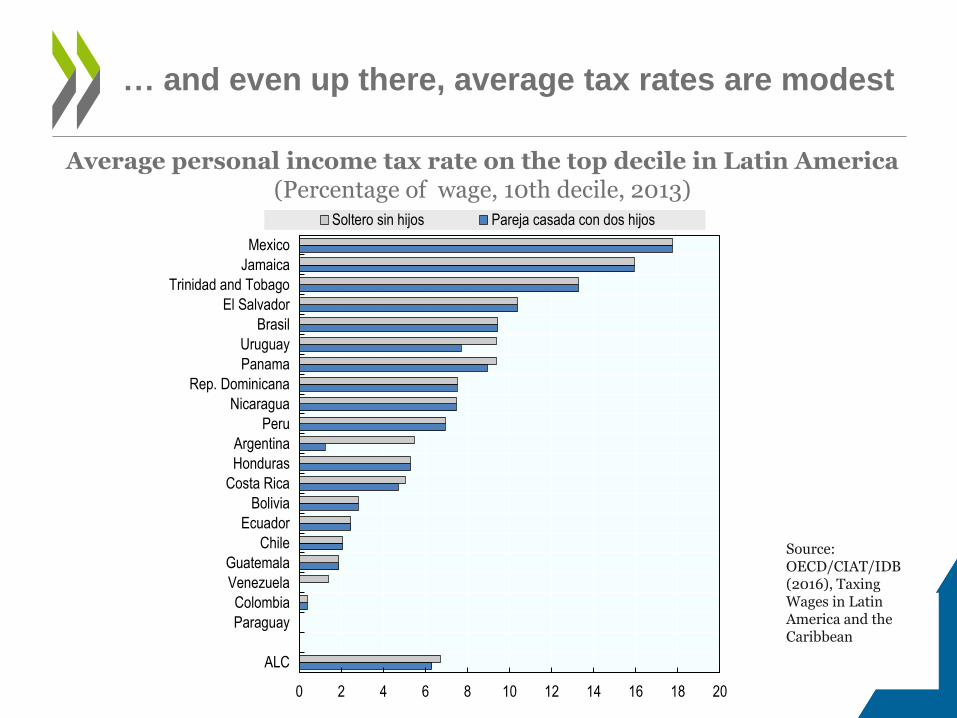
… and even up there, average tax rates are modest
Average personal income tax rate on the top decile in Latin America(Percentage of wage, 10th decile, 2013)
0 2 4 6 8 10 12 14 16 18 20
ALC
Paraguay
Colombia
Venezuela
Guatemala
Chile
Ecuador
Bolivia
Costa Rica
Honduras
Argentina
Peru
Nicaragua
Rep. Dominicana
Panama
Uruguay
Brasil
El Salvador
Trinidad and Tobago
Jamaica
Mexico
Soltero sin hijos Pareja casada con dos hijos
Source: OECD/CIAT/IDB (2016), Taxing Wages in Latin America and the Caribbean

0% 5% 10% 15% 20% 25% 30%
OECD
LAC
Chile
Honduras
Trinidad y Tobago
Peru
Guatemala
Ecuador
Jamaica
Bolivia
Venezuela
El Salvador
Panamá
Paraguay
Dominican Rep
Nicaragua
Uruguay
Mexico
Costa Rica
Argentina
Colombia
Brazil
Employer contributions are alike in LAC and OECD
Employer social contributions in Latin America and OECD(Average wage earner; % labour costs; 2013)

What about those who are informal? Calculating
(tax) costs of formalisation
0%
20%
40%
60%
80%
100%
0%
20%
40%
60%
80%
100%
D1 D2 D3 D4 D5 D6 D7 D8 D9 D10
Tasa de informalidad Costo teórico de formalización
Informality and theoretical tax costs of formalisation in LAC(Average LAC wage earner by income decile; % wages; 2013)
Source: OECD/CIAT/IDB (2016), Taxing Wages in Latin America and the Caribbean
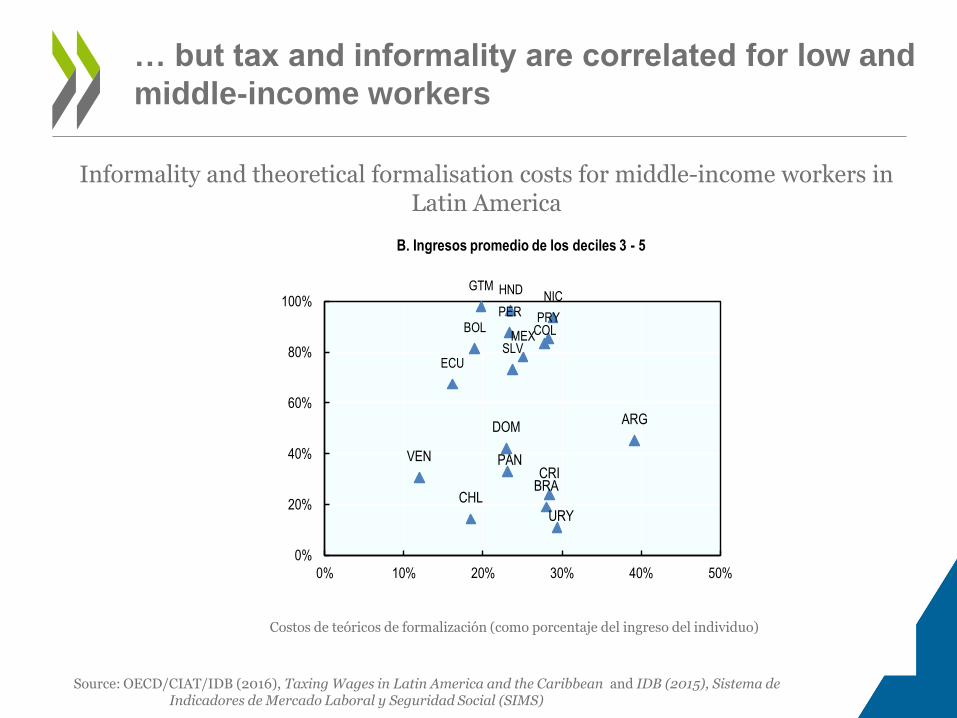
… but tax and informality are correlated for low and
middle-income workers
Costos de teóricos de formalización (como porcentaje del ingreso del individuo)
Informality and theoretical formalisation costs for middle-income workers in Latin America
URY
CHLBRACRI
VEN PAN
DOMARG
ECUSLV
MEXBOL COL
PRYPERNIC
HNDGTM
0%
20%
40%
60%
80%
100%
0% 10% 20% 30% 40% 50%
B. Ingresos promedio de los deciles 3 - 5
Source: OECD/CIAT/IDB (2016), Taxing Wages in Latin America and the Caribbean and IDB (2015), Sistema de Indicadores de Mercado Laboral y Seguridad Social (SIMS)

From data to policy action (and II)
• Boosting good jobs (protected & productive) should be a centralelement of the policy (also fiscal) agenda
• Personal income tax can be strengthen (revising minimumexempted) and made more progressive (tax deductions, rates?)
• Revision of non-wage labour costs – notably for low- and low-middleincome workers should be evaluated. Progressive subsidies on socialcontributions?
From data and words to policy action
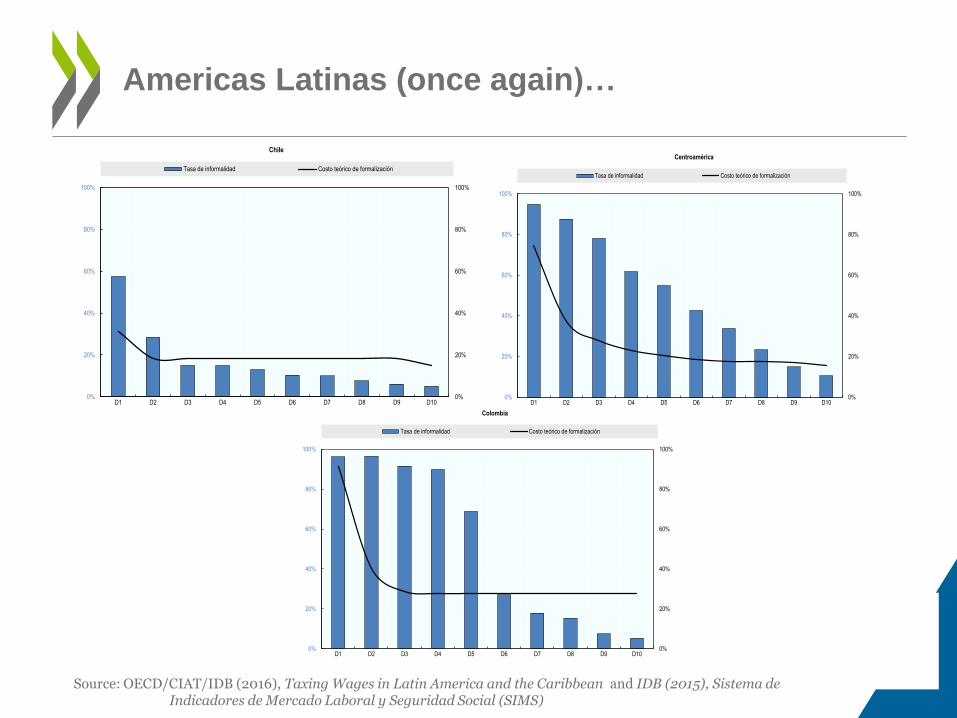
Americas Latinas (once again)…
Source: OECD/CIAT/IDB (2016), Taxing Wages in Latin America and the Caribbean and IDB (2015), Sistema de Indicadores de Mercado Laboral y Seguridad Social (SIMS)
0%
20%
40%
60%
80%
100%
0%
20%
40%
60%
80%
100%
D1 D2 D3 D4 D5 D6 D7 D8 D9 D10
Chile
Tasa de informalidad Costo teórico de formalización
0%
20%
40%
60%
80%
100%
0%
20%
40%
60%
80%
100%
D1 D2 D3 D4 D5 D6 D7 D8 D9 D10
Centroamérica
Tasa de informalidad Costo teórico de formalización
0%
20%
40%
60%
80%
100%
0%
20%
40%
60%
80%
100%
D1 D2 D3 D4 D5 D6 D7 D8 D9 D10
Colombia
Tasa de informalidad Costo teórico de formalización