Tax pass-through in the European beer market
29
7626 2019 April 2019 Tax pass-through in the European beer market Aria Ardalan, Sebastian G. Kessing
Transcript of Tax pass-through in the European beer market

7626 2019
April 2019
Tax pass-through in the European beer market Aria Ardalan, Sebastian G. Kessing

Impressum:
CESifo Working Papers ISSN 2364-1428 (electronic version) Publisher and distributor: Munich Society for the Promotion of Economic Research - CESifo GmbH The international platform of Ludwigs-Maximilians University’s Center for Economic Studies and the ifo Institute Poschingerstr. 5, 81679 Munich, Germany Telephone +49 (0)89 2180-2740, Telefax +49 (0)89 2180-17845, email [email protected] Editor: Clemens Fuest www.cesifo-group.org/wp
An electronic version of the paper may be downloaded · from the SSRN website: www.SSRN.com · from the RePEc website: www.RePEc.org · from the CESifo website: www.CESifo-group.org/wp

CESifo Working Paper No. 7626 Category 1: Public Finance
Tax pass-through in the European beer market
Abstract
We study the pass-through of indirect taxes on beer prices in the European Union (EU). Exploiting the variation of value added tax rates, beer excise tax rates, and beer prices in a panel of monthly data from 1996 to 2016 of all current 28 EU member states, we estimate the tax pass-through of specific beer excise taxes and ad valorem value added taxes (VAT). VAT is under-shifted at a rate of approximately 70%. Specific excise taxes are almost fully shifted to prices in the EU, but, in contrast to the empirical findings for the US, there is no evidence of over-shifting. The difference between the two tax pass-through rates points towards the importance of imperfect competition in the European beer market. Excise tax increases are passed through faster and at a higher rate than excise tax decreases.
JEL-Codes: H220, H230.
Keywords: tax incidence, pass-through, VAT, excise taxes, EU, beer.
Aria Ardalan University of Siegen / Germany
Sebastian G. Kessing University of Siegen / Germany [email protected]
April 15, 2019 We would like to thank David Agrawal, William Hoyt, David Wildasin, participants of the 73rd annual congress of the IIPF (2017) and seminar participants at the University of Kentucky, and an anonymous referee for their helpful comments. The usual disclaimer applies.

1 Introduction
All 28 member states of the European Union (EU) levy specific excise taxes aswell as value added taxes (VAT) on the consumption of beer. This parallelsthe practice in many other countries that also apply a mix of specific and advalorem taxes on beer.1 This commonly observed tax pattern can be attributedto the externalities and internalities associated with the consumption of alcoholicbeverages, the relatively inelastic demand for beer, and the administrative ease oflevying such taxes. The present analysis investigates the pass-through of specificexcise taxes and of the VAT to beer prices in the 28 EU member states over thetime period from 1996 to 2016.
Our study provides several contributions. First, we provide evidence of pass-through rates of indirect taxes on beer in the EU. While there is substantialevidence regarding the pass-through rates of alcoholic beverages in the UnitedStates (US), including beer, the European evidence is sparse and, where it exists,only relates to the level of individual member states. Moreover, Kenkel (2005),Shrestha and Markowitz (2016), and Young and Bielińska-Kwapisz (2002) havefound a substantial degree of over-shifting of beer excise taxes in the US. Thisraises the question whether such over-shifting is also present in the EU. Our resultsindicate that this is not the case, since we find that specific excise taxes on beerare almost fully shifted to beer prices in our sample.2
Second, we compare pass-through rates of specific excise taxes and of advalorem value added taxes on beer prices. Under perfect competition, theorypredicts that the pass-through of specific and ad valorem taxes should be equal,while under imperfect competition they typically differ (Keen (1998), Myles (1996),Anderson, De Palma and Kreider (2001a), Delipalla and Keen (1992)). Thesetheoretical approaches conclude that the pass-through rates of specific taxes shouldexceed those of ad valorem taxes under imperfect competition. Intuitively, with ad
1Some countries also levy ad valorem excise taxes either instead of, or in addition to, specificexcise taxes, as well as general consumption ad valorem taxes, such as the VAT or general salestaxes. In the EU this is not the case. As laid down in the Council Directive 92/83/EEC allEU member states should tax beer using specific excise taxes only, and refrain from ad valoremexcise taxes.
2Theoretical approaches that allow for imperfect competition can explain such over-shifting,see Weyl and Fabinger (2013). More recently, Agrawal and Hoyt (2018) have developed a perfectcompetition framework which also allows, under certain considerations such as small markets,overshifting of indirect taxes.
2

valorem taxes the government receives a share of firms’ gross revenue. Thus, eachfirm has to share the benefits of its ability to affect prices with the government.This reduces firms’ incentives to increase prices in comparison to the case ofspecific taxes, which in turn results in lower pass-through rates. As a corollary, advalorem taxes Pareto-dominate specific excise taxes under imperfect competition,see Denicolò and Matteuzzi (2000), Anderson, De Palma and Kreider (2001a) andAnderson, De Palma and Kreider (2001b). For the same amount of governmentrevenues, prices are set at a lower level with ad valorem taxes implying higherconsumer surplus.3 However, excise taxes may have an advantage if the tax isthought to be corrective and the excise directly targets the externality, such asalcohol content, see Bonnet and Réquillart (2013). Such considerations are lessimportant in the case of beer since alcohol content is closely related to the quantityof beer itself.
Finally, the third contribution of our study relates to our empirical strategy.We employ a panel of beer price indices and tax rates of the various EU memberstates in our analysis. This approach is similar to incidence studies in the USconsidering cities and states, see Evans, Ringel and Stech (1999), Besley andRosen (1999) Harding, Leibtag and Lovenheim (2012), Shrestha and Markowitz(2016), Kopczuk et al. (2016), and Young and Bielińska-Kwapisz (2002). We arguethat this strategy can also be employed to estimate pass-through rates in Europe.This approach is in contrast with most of the existing empirical literature onEuropean countries, where tax pass-through rates have been estimated exploitingthe time variation of within-country data. Carbonnier (2013) and Bonnet andRéquillart (2013) study the case of excise taxes and VAT reforms in France, whileBergman and Hansen (2016) provide evidence of the excise tax pass-through usingDanish data, and Benzarti et al. (2017) discuss the Finish case of VAT changes.Our identification strategy is instead based on the assumption that, at least sincethe implementation of European Single Market on January 1st, 1993, input andproduct markets have become substantially integrated across EU member states.Accordingly, we focus on price developments in member states where taxes change
3Note that these theory findings can potentially be reversed, if firms have multiple products,see Hamilton (2009). Given that many consumption goods, including beer, are primarily sold viamulti-product retailers, the potential difference between specific and ad valorem tax pass-throughrates even under imperfect competition may be considered ambiguous a priori, and needs to beassessed empirically.
3

relative to other member state where taxes remain constant.4
In comparison to the US, beer markets of EU member states were traditionallymore segmented at the consumer level, in particular with respect to the leadingbrands that dominate in each market. However, Fertő and Podruzsik (2016)document that member states’ exports and imports have been growing dynamically,with the value of member states’ imports and exports roughly doubling from 2000to 2010. Moreover, several member states (Czech Republic, Denmark, Germany,Ireland, The Netherlands) have been important beer exporters for a long time,whereas other member states (Greece, Italy, Spain, Sweden, United Kingdom) aremajor importers of beer. Moreover, market concentration on average is high andsimilar to the US (the exception being Germany, with a beer market characterizedby fierce competition between regional, national, and international breweries). In2013, the market share of the leading brewery ranged from 6.21% in Germanyto 73.95% in Slovenia, with an unweighted EU average of approximately 37%(Loretz and Oberhofer (2016)). In the US, the leading firm had a market share of45.6% in the same year (Marketrealist (2015)). As a consequence of large scalecross-border mergers and acquisitions in the beer industry over the last 25 years,key market players are often the same across member states, even though theymay sell different brands in different member states.5 As regards the demandside, Fogarty (2010) provides an overview of estimated elasticities of the demandfor beer in various countries, including many EU member states. He concludesthat little support exists for the idea that demand for alcoholic beverages variesfundamentally across countries, with only wine, but not beer, potentially beingan exception. Finally, due to the Single Market, breweries’ input markets havebeen fully integrated since 1993.
Our analysis finds that excises taxes are almost fully shifted to beer prices,whereas ad valorem taxes (VAT) are shifted at a substantially lower rate ofapproximately 70%. These findings are robust to different specifications of ourestimations. The difference suggests that imperfect competition plays a role in
4Note that we do not discuss and compare the salience of different taxes, similar to Chetty,Looney and Kroft (2009), since it is unlikely that salience plays an important role in theEuropean context. Unlike in the U.S., prices in Europe are always labeled tax inclusive for theconsumer, i.e., neither the tax component nor the net price are indicated.
5In 2013, Carlsberg A/S was the biggest brewing company in five member states, SAB Milleralso in five (In 2015 SAB Miller was taken over by Anheuser Busch InBev, which was the biggestbrewing company in one member state in 2013.), Heineken NV in four, and Molson CoorsBrewing Co in three, see Loretz and Oberhofer (2016).
4

the European beer market, even though over-shifting does not occur. Excise taxincreases are passed through faster and at a higher rate than excise tax decreases.
Our study relates to several strands of literature. The empirical analysisof indirect tax pass-through has been addressed by a number of studies overrecent years, see Bergman and Hansen (2016) for a comprehensive overview. Twoimportant reference points for our analysis are the contributions of Young andBielińska-Kwapisz (2002) and Shrestha and Markowitz (2016) who both considerexcise tax pass-through to beer prices in the US. Both studies find substantialover-shifting to prices. Shrestha and Markowitz (2016) conclude that a 10-centincrease in beer taxes translates into a 17 cents increase in the retail prices.
Using European data, Benedek et al. (2015) estimate the VAT pass-throughfor a group of commodities based on a panel of 17 selected EU member statesover the period 1999 to 2013. Their results imply different effects for differentVAT rates. For the standard rate, the accumulated effect of a tax change showsfull-shifting. However, pass-through rates for reduced rates were only around 30%,and even zero for reclassifications. We also use a panel approach, but focus on thedifferences between specific and ad valorem taxes. In contrast to Benedek et al.(2015), we find that in the beer market, where the standard rate applies, the VATpass-through rate is substantially below unity.
The next section sets out the conceptual framework. In Section 3 we describeour data and display the evolution of beer prices, beer consumption, the tax events,and macroeconomic conditions in selected member states. We then provide ourempirical approach and the estimation results in Section 4. Section 5 presentsseveral robustness checks and extensions, and Section 6 discusses the results andprovides conclusions.
2 The framework
In general, the consumer price of beer P is given by P = (q(t, τ) + t)(1 + τ),where t is the excise tax, τ indicates the value added tax rate, and q = q(t, τ) isthe producer price, which itself is a function of both tax rates. Our conceptualapproach takes this dependency into account, and also disentangles the role of thedifferent taxes. To investigate the impact of tax changes on consumer prices, werely on the approach introduced in Carbonnier (2013). This allows us to derive the
5

equations to be estimated in the case of VAT and specific excise taxes, respectively.We first discuss the VAT case and then consider excise taxes. In Section 4, weadditionally consider a joint equation that includes both taxes.
2.1 Value added taxation
Define φ to be the consumer’s share of the burden of an ad valorem tax. Itrepresents the ratio of the tax-inclusive price variations with respect to VATchanges to the consumer price variation for constant producer prices
φ ≡∂P∂τ
∂P∂τ
∣∣∣q=const
=∂q∂τ
(1 + τ) + q + t
q + t= 1 + 1 + τ
q + t
∂q
∂τ. (1)
Full pass-through of the VAT implies φ = 1, and φ = 0 represents no shifting. Wedefine q0 as the hypothetical producer price that would prevail without any taxes.Furthermore, two proxy parameters m and n are defined so that
P = (q0 +mt)(1 + nτ) (2)
Since we do not observe these proxy variables n and m, we need to determinethe relationship between them and the pass-through rate φ. From (2) we have∂P∂τ
= n(q0 +mt). In addition, since q = P1+τ − t, we have ∂q
∂τ= ∂P
∂τ
(1
1+τ
)− P
(1+τ)2 .Plugging these into (1), rearranging the relationship between φ and n, and applyingq + t = P
1+τ and q0 +mt = P1+nτ generates
φ =(
P
1 + nτ
)n(1 + τ)
P= n(1 + τ)
1 + nτ. (3)
Equation (3) plays a key role in estimating VAT pass-through. Defining theoperator δi(τ) ≡ τi − τ0, where τi is the VAT rate in period i and τ0 is the VATrate in the base period, and applying it to the natural logarithm of equation (2)gives lnPi = ln(q0
i +mti) + ln (1 + nτ0 + nτi − nτ0)). Further rearranging yields
lnPi = ln(1 + nτ0) + ln(q0i +mti) + ln
(1 + nδi(τ)
1 + nτ0
). (4)
Since nδi(τ)1+nτ0
is small compared to one, the Taylor expansion of ln(1 + nδi(τ)
1+nτ0
)in
equation (4) will be n1+nτ0
δi(τ) so that
6

lnPi = ln(1 + nτ0)︸ ︷︷ ︸term1
+ ln(q0i +mti)︸ ︷︷ ︸term2
+ n
1 + nτ0δi(τ)︸ ︷︷ ︸
term3
. (5)
This is the baseline for our VAT pass-through estimations. Term 1 in equation(5) is a constant term while term 2 comprises determinants of producer pricesincluding the excise tax. Term 3 is the tax-shifting term and its coefficient,according to equation (3), will be used to derive the VAT pass-through.
2.2 Excise taxes
Consider now the case of an excise tax. Starting again from P = (q(t, τ)+t)(1+τ),we define η as the consumer’s share of burden from the excise tax
η ≡∂P∂t
∂P∂t
∣∣∣q=const
= 1 + ∂q
∂t. (6)
In addition, it holds that q = P1+τ − t, so that ∂q
∂t=
∂P∂t
1+τ − 1. According to equation(2) we have ∂P
∂t= m(1+nτ). Together with equation (6) this gives the relationship
between our measure of excise tax pass-through and the proxy variables
η = m(1 + nτ)1 + τ
. (7)
Subsequently, with t0 changing to t1, given equation (2), ∆t can be written as∆t = 1
m
(P1−P01+nτ −∆q
). Further rearranging generates the relationship between an
excise tax change and the corresponding price change
∆P = m(1 + nτ)∆t︸ ︷︷ ︸term1
+ (1 + nτ)∆q︸ ︷︷ ︸term2
. (8)
This is the second baseline for our estimation. In equation (8), term 1 representsour tax shifting term and term 2 includes all other controls. The coefficient ofterm 1, according to equation (7), determines the excise tax pass-through.
7

-20
24
6
1995 2000 2005 2010 2015year
ΔP ΔP_eu
-.1-.05
0.05
1995 2000 2005 2010 2015year
Δlog(C) Δlog(C_eu)
-.05
0.0
5.1
1995 2000 2005 2010 2015year
GDP growth Unemployment rateInflation rate
Czech Republic (CZ)
-50
510
1995 2000 2005 2010 2015year
ΔP ΔP_eu
-.1-.05
0.05
1995 2000 2005 2010 2015year
Δlog(C) Δlog(C_eu)
-.05
0.0
5.1
1995 2000 2005 2010 2015year
GDP growth Unemployment rateInflation rate
Denmark (DK)
-20
24
1995 2000 2005 2010 2015year
ΔP ΔP_eu
-.06
-.04
-.02
0.02
1995 2000 2005 2010 2015year
Δlog(C) Δlog(C_eu)
-.05
0.0
5.1
.15
1995 2000 2005 2010 2015year
GDP growth Unemployment rateInflation rate
Germany (DE)
02
46
8
1995 2000 2005 2010 2015year
ΔP ΔP_eu
Beer price
-.1-.05
0.05
.1
1995 2000 2005 2010 2015year
Δlog(C) Δlog(C_eu)
Beer consumption per capita
-.05
0.0
5.1
.15
.2
1995 2000 2005 2010 2015year
GDP growth Unemployment rateInflation rate
Macroeconomic variables
Poland (PL)
Figure 1: Beer prices, consumption, and macroeconomic variables.Notes: Left panel: change in yearly beer price (in member state and the EU average). Middlepanel: growth rate of beer consumption per capita. Right panel: macroeconomic variables. Solidvertical lines indicate tax increases (VAT or excise) and dashed vertical line show tax decreases(VAT or excise). Excise tax changes are, increase: CZ (2010), DK (2012 and 2013), PL (2009),and decrease: DK (2013). VAT changes are, increase: CZ (2010 and 2013), DE (1998 and 2007),PL (2011), and decrease: CZ (2004).
8

3 Data
We employ a monthly dataset from Jan-1996 to July-2016 which is comprised ofVAT standard rates, beer excise taxes, macroeconomic variables, and memberstate level price indices (HICP hereafter), harmonized at the European level.Eurostat is the main source for all our price series.6 Aside from beer prices, we useprice indices of transport and energy as controls to account for possible variationsof producer prices. Moreover, we use inflation, GDP growth and unemploymentas further macroeconomic controls.7 Table 1 provides summary statistics of ourdata as well information on the tax rate changes.
The webpage of the European Commission’s Directorate-General Taxationand Customs Union offers detailed information on the evolution of VAT standardrates together with the respective dates of change for each member state.8 Excisetax data and the corresponding historical tables are retrieved from the samesource. Dates of tax changes are partly exploited according to the historicaltables of excise duties but, unfortunately, in many cases this information is notindicated in the table, especially during the 1990s. To overcome this issue, and tocapture the correct month of change for each country, we additionally compilethis information from the Reform Database of the European Commission. For thefew cases where neither of the two sources offer the required information, the startof the corresponding calendar year is considered as the time of the tax change.Finally, we re-scale all the excise tax rates so that these rates in each memberstate correspond to the price index of the same member state, see the Appendixfor details.
Figure 1 displays the behavior of key variables over our sample period for fourselected EU member states. For each of these, we provide three panels. The firstpanel displays the development of beer prices in the respective country and in theEU. We plot prices in first differences in line with our theoretical and empiricalapproach. The second panel shows the growth rate of per capita consumption inthe member state and in the EU. The consumption data is at the annual frequencylevel and only starts from 2003, so that 2004 is the first observation for the growth
6ec.europa.eu/eurostat7The macroeconomic variables are taken from the Federal Reserve Economic Data (FRED).
GDP growth and unemployment rate are of quarterly frequency.8ec.europa.eu/taxation_customs/business
9

Table 1: Summary statistics and the number of tax ratesVariable Mean Std. Dev. Min. Max. N
Beer(HICP) 83.393 14.56 5.2 112.4 6585VAT rate 20.015 3.019 8 27 6842GDP growth(%) 0.218 4.546 -41.184 27.02 6635Unemployment rate(%) 0.09 0.044 0.017 0.279 6306Inflation rate (%) 0.29 1.782 -4.049 123.091 6853Transport(HICP) 84.298 17.709 2.03 116.88 6880Energy(HICP) 77.408 23.267 6.59 127.12 6556Number of tax changes Increases DecreasesTotalVAT 50 13 63Excise tax 101 9 110
Notes: The upper panel presents summary statistics of our sample of 28 EU countries from Jan-1996 to July-2016. The lower panel provides information regarding tax rate changes within thesecountries in the sample period. The reference year for all our price indices is 2015 (2015=100).GDP growth and unemployment are originally quarterly data.
rates.9 Finally, the last panel provides the macroeconomic conditions in terms ofGDP growth, inflation, and the unemployment rate in each country. Moreover,in each of the three panels we indicate tax increases by a solid vertical line, andtax decreases by a dashed vertical line. Further details about the nature of thetax changes are provided directly in the caption of Figure 1. The displayed dataindicate that, in the absence of tax changes, beer prices and beer consumption ofindividual member states and the entire EU move broadly together. Following taxincreases, prices increase relative to the EU and consumption decreases relative tothe EU. Finally, the evidence regarding the relationship between macroeconomicconditions and tax changes is somewhat inconclusive from these graphs. We assessthe latter aspect in Section 5.
4 Empirical analysis and results
Based on equations (5) and (8), we estimate VAT and excise tax pass-throughon beer prices. However, before estimating equation (5) all our series are testedfor the presence of a unit root to avoid spurious regressions. Applying the Im-Pesaran-Shin test (Im, Pesaran and Shin (2003)) indicates that our dependentvariable as well as the other price indices used as controls are highly persistentand non-stationary in levels. Therefore, we carry out the regression for the VAT
9The data is compiled from various issues of The Brewers of Europe (2016).
10

pass-through in first differences. The estimated equation is
∆ln(Pci) = αc + αi + αt + γ1∆lnXci + γ2Mci +k∑
j=−kβτj ∆τ jci + εci, (9)
where i and c refer to the month and member state, respectively. Moreover, αcand αi correspond to member states (not necessarily included) and time fixedeffects, and αt is a vector of dummies indicating changes in excise taxes. The set ofcost controls, Xci, comprises the indices of energy and transport cost. The macrocontrols, Mci, are GDP growth, inflation and unemployment. The coefficients tobe estimated are γ1, γ2 and βτj . Moreover, k is the number of leads and lags forthe tax change term. Thus, ∆τ j denotes the change in the VAT rate j periodsago (or ahead if j is negative). With k = 1, estimation of equation (9) provides avalue for βτ ≡ ∑1
j=−1 βτj , which is the coefficient of the entire tax-shifting term.
We consider a single lead and a single lag here, since the complete effect of thetax change may not occur contamporaneously within the same period.10 We areinterested in the VAT pass-through φ from equation (1), i.e. the consumers’ shareof the tax burden. Based on (3), it holds that φ
1+τ0= n
1+nτ0. Comparing this term
to the coefficient of our tax-shifting term in (9), the estimated pass-through is
φ̂ = β̂τ (1 + τ̄0), (10)
where τ̄0 is the average of τ0 in all member states, i.e. the average VAT rate atthe beginning of our sample period, and β̂τ is calculated from the estimation ofequation (9). Finally, comparing equations (5) and (9), note that using the firstdifferences is fully in line with our theoretical framework. For the first difference∆[
n1+nτ0
δ(τi)]
= n1+nτ0
[δ(τi)− δ(τi−1)]. Subtracting the tax rate τ0 yields the newtax shifting term n
1+nτ0∆(τi).
Similarly structured to equation (9), but directly based on (8), we estimatethe following equation for the excise tax pass-through,
∆Pci = αc + αi + ατ + γ1∆Xci + γ2Mci +k∑
j=−kβtj∆t
jci + εci, (11)
where αc and αi again capture country and time fixed effects, respectively. Inaddition, ατ is a vector of dummy variables to capture the impact of VAT rate
10We discuss extensions to several leads and lags further below.
11

changes. Potential controls are again the price indices of transport and energy ineach member state in first differences, ∆Xci, as well as the macro controls, Mci,comprising GDP growth, inflation and the unemployment rate, and γ1, γ2 and βt
are the coefficients to be estimated, and k is the number of leads and lags for thetax change term. With k = 1, βt ≡ ∑1
j=−1 βtj is the coefficient of our tax-shifting
term. Given equation (7), the coefficient of ∆t corresponds to η(1 + τ), so that
η̂ = β̂t
1 + τ̄(12)
indicates the consumers’ share of the excise burden, where τ̄ is the average VATrate across all periods and member states.
Equations (9) and (11) are created following the framework laid out in Section2, and changes in the respective other tax are dummied out to address potentialomitted variable bias. Additionally, given that ∆log(P ) ≈ %∆P , we estimate thefollowing regression that includes both taxes
∆Pci = αc + αi + γ1∆Xci + γ2Mci +k∑
j=−kβτj ∆τ jci +
k∑j=−k
βtj∆tjci + εci, (13)
and we compare the corresponding results to those from equations (9) and (11).11
Subsequently, we extend our regressions (9), (11), and (13) by including 12periods of lead and lag for the tax change, turning our approach into an eventstudy design. The inclusion of lead terms allows us to observe potential pre-trends.In addition, all of the lead and lag terms are interacted with the magnitude ofthe tax change, following the suggested procedure by Sandler and Sandler (2014)for events with different treatment intensity. Sub-figures a and b in Figure 2correspond to equations (9) and (11). Additionally, sub-figure c depicts the eventstudy graph related to equation (13). The month prior to the event is set as thereference period in all of these graphs.
The event study sub-graphs in Figure 2 show that, for excise tax changes,the effects are concentrated in the first two months in which the tax change isimplemented. For VAT changes, which are substantially less frequent, the effects
11We also extend equation (9) for the inclusion of both tax rates. The results (not reported)are very similar to those from estimating (13).
12

-0.50
0.00
0.50
1.00
1.50
Estim
ated e
ffect
-10 -5 0 5 10months to tax change
(a) Excise tax (equation 9)
-0.50
0.00
0.50
1.00
1.50
Estim
ated e
ffect
-10 -5 0 5 10months to tax change
(b) VAT (equation 11)
-0.50
0.00
0.50
1.00
1.50
Estim
ated e
ffect
-10 -5 0 5 10months to tax change
(c) Excise tax and VAT (equation 13)Figure 2: Event study graphs.Notes: Sub-figure (a) shows the event study for excise tax changes with twelve leads and lags.Sub-figure (b) displays the event study for VAT changes. Sub-figure (c) corresponds to the eventstudy with changes in both tax rates. All estimations include time and member state-fixedeffects as well as cost controls. Estimations corresponding to (a) and (b) also include dummiesfor changes in the other tax. The dashed lines indicate 95% confidence intervals and the verticallines in t = 0 show the month when the tax change occurs. Source: authors’ calculations.
13

are also concentrated in these first two months. Additionally, there are somepreceding price increases, which are marginally significant (the price change threemonth before the tax change, in particular). More generally, there is no sign ofsystematic differences more than four months before the tax events.
Table 2 summarizes our results of estimating different forms of equation (9).The dependent variable is the first-differenced natural logarithm of beer prices(HICP-beer). Standard errors are clustered at the member state level. Notethat, in line with our notation above, the subscript −1 corresponds to the monthafter the tax change. As discussed in Section 2, and according to equation(10), our estimated VAT pass-through φ̂ is computed according to the estimatedcoefficients of the tax shifting term in (9), which are provided in the last row.Since the variables are first-differenced, we also consider an alternative version of(9) without member states fixed effects. Columns 6, 7 and 9 in Table 2 indicatethe corresponding results, which are very similar to the estimates with memberstates fixed effects.12
The comparison of the contemporaneous VAT pass-through, in Columns 5and 7 of Table 2, to the pass-through computed by including lead and lag terms,in Columns 4 and 6, again shows that the full effect of a tax reform does notoccur instantaneously. The total VAT pass-through rate, taking the previous,the following, and the month in which the tax change occurs into account, isapproximately 70%. But the contemporaneous pass-through, according to Column5, only implies a pass-through rate of around 40% to beer prices. The computedvalues of pass-through indicate under-shifting of beer prices with respect to VATchanges in the EU.13
Table 3 presents the results of estimating different forms of equation (11) forthe pass-through of excise taxes where the dependent variable is the beer HICP infirst differences. The standard errors are again clustered at the member state level.Based on equation (12) our measure of excise tax pass-through η̂ is computedaccording to the estimated coefficients of the tax shifting term in (11), which
12Using member states fixed effects, which imply member state-specific trends, corresponds tothe diverse medium term macroeconomic developments across member states.
13This conclusion also holds if we add further leads and lags of the tax rate change to theregression in Column 4. More specifically, considering a 1 year time horizon around the monthof the tax rate change (6 leads and 6 lags of the tax rate change) as well as considering a 2 yeartime horizon around the month of the tax rate change (12 leads and 12 lags of the tax ratechange) result in a cumulative VAT pass-through rate of 0.51 and 0.44, respectively.
14

Table 2: VAT pass-through in the European Union
(1) (2) (3) (4) (5) (6) (7) (8) (9)∆ln(P ) ∆ln(P ) ∆ln(P ) ∆ln(P ) ∆ln(P ) ∆ln(P ) ∆ln(P ) ∆ln(P ) ∆ln(P )
∆ VAT 0.380*** 0.338*** 0.341*** 0.344*** 0.344*** 0.347*** 0.348*** 0.323*** 0.317***(0.102) (0.0891) (0.0865) (0.0887) (0.0888) (0.0878) (0.0880) (0.0846) (0.0828)
∆ VAT−1 0.130* 0.132* 0.162** 0.164** 0.163** 0.173** 0.166**(0.0716) (0.0709) (0.0611) (0.0605) (0.0600) (0.0628) (0.0617)
∆ VAT+1 0.0204 0.0509 0.0789 0.0798 0.0807 0.0909 0.0868(0.0577) (0.0553) (0.0617) (0.0610) (0.0600) (0.0629) (0.0613)
macro controls yes yes
cost controls yes yes yes yes yes yes
excise tax D. yes yes yes yes yes yes yes
time f.e. yes yes yes yes yes yes yes yes
country f.e. yes yes yes yes yes yes
adj. R2 0.001 0.013 0.192 0.192 0.190 0.192 0.190 0.203 0.201
φ̂EU 0.631 0.620 0.693 0.700 0.409 0.703 0.414 0.699 0.678
Notes: Robust standard errors in parentheses clustered at the member state level. In allregressions, the dependent variable is the first-differenced beer HICP in logs. φ is our measureof tax pass-through and reflects the consumer’s share of burden for ad valorem tax and iscomputed according to φ = β̂3(1 + τ̄0) with τ̄0 = 19.12%. Cost controls are the price indices oftransport and energy. Macroeconomic controls are GDP growth, inflation, and unemployment.The coefficients of inflation and unemployment are statistically significant in (8) and (9) with apositive sign and a negative sign, respectively. The subscript −1 corresponds to the month afterthe tax change. ∗ p < 0.10,∗∗ p < 0.05, ∗∗∗ p < 0.01
are indicated in the last row. The τ̄ used in the calculation is the VAT averageacross all periods and member states. Similar to our VAT analysis, we allow fora single period of lead and lag of the tax change since the effect may not occurinstantaneously. Moreover, we again estimate equation (11) without member statefixed effects. The corresponding results, which are very similar, are shown inColumns 5, 6 and 8 of Table 3.
The comparison of the contemporaneous excise tax pass-through, in Columns 5and 7 of Table 3, to the pass-through computed by including lead and lag terms inColumns 4 and 6, again shows that the effect of a tax reform does not only occurinstantaneously. Namely, a one unit increase in the excise tax rate, according
15

Table 3: Excise tax pass-through across the European Union
(1) (2) (3) (4) (5) (6) (7) (8) (9)∆P ∆P ∆P ∆P ∆P ∆P ∆P ∆P ∆P
∆ Excise 0.977*** 0.941*** 0.930*** 0.933*** 0.931*** 0.931*** 0.930*** 0.927*** 0.924***(0.135) (0.122) (0.121) (0.122) (0.122) (0.122) (0.122) (0.118) (0.117)
∆ Excise−1 0.128** 0.124* 0.121* 0.122* 0.121* 0.115* 0.113*(0.0608) (0.0600) (0.0602) (0.0602) (0.0589) (0.0609) (0.0593)
∆ Excise+1 0.00474 0.0133 0.00997 0.0115 0.0109 0.0158 0.0150(0.0162) (0.0136) (0.0117) (0.0121) (0.0121) (0.0130) (0.0128)
macro controls yes yes
cost controls yes yes yes yes yes yes
VAT D. yes yes yes yes yes yes yes
time f.e. yes yes yes yes yes yes yes yes
country f.e. yes yes yes yes yes yes
adj. R2 0.136 0.158 0.164 0.164 0.161 0.164 0.161 0.173 0.172
η̂EU 0.925 0.899 0.885 0.889 0.776 0.887 0.775 0.881 0.876
Notes: Robust standard errors in parentheses clustered at the member state level. In allregressions the dependent variable is the first-differenced beer HICP. η̂ is our measure of taxpass-through, η̂ = β̂3
′
1+τ̄ with τ̄ = 20.016%. Cost controls are the price indices of transportand energy. Macroeconomic controls include GDP growth, unemployment, and inflation. Thecoefficients of inflation and unemployment are statistically significant in (8) with a positive signand a negative sign, respectively. In (9) the coefficient of inflation is positive and significant.The subscript −1 corresponds to the month after the tax change. ∗ p < 0.10, ∗∗ p < 0.05, ∗∗∗
p < 0.01
to Column 4, increases prices by around 90 percent while the contemporaneouspass-through according to Column 5, implies a 77 percent increase in beer prices.14
Overall, the values of η̂ under different specifications in Table 3 indicate thatexcise taxes are almost fully-shifted to prices.
Table 4 shows the results of estimating equation (13), where both of thetax rates are included. In all joint estimations the VAT pass-through rates areconsistently lower than those of specific excise tax rates, and they are under-shifted to prices.15 This is also in line with the graphical evidence from Figure
14The inclusion of up to 6 or 12 leads and lags in the regression corresponding to Column 4,does not alter this conclusion, as doing so results in a cumulative excise tax pass-through of0.86 and 1.06, respectively.
15A post-estimation F-test on the estimated coefficients of VAT and excise taxes in our
16

Table 4: Tax pass-through across the European Union
(1) (2) (3) (4) (5) (6) (7) (8)∆P ∆P ∆P ∆P ∆P ∆P ∆P ∆P
∆ Excise 0.976*** 0.941*** 0.943*** 0.940*** 0.942*** 0.940*** 0.937*** 0.935***(0.135) (0.122) (0.122) (0.122) (0.122) (0.122) (0.118) (0.118)
∆ VAT 0.416*** 0.379*** 0.394*** 0.398*** 0.397*** 0.401*** 0.363*** 0.359***(0.0738) (0.0537) (0.0639) (0.0649) (0.0634) (0.0645) (0.0628) (0.0608)
∆ VAT+1 0.0223 0.0510 0.0564 0.0590 0.0683 0.0694(0.0561) (0.0577) (0.0571) (0.0567) (0.0603) (0.0585)
∆ VAT−1 0.159* 0.181** 0.186** 0.189** 0.196** 0.195**(0.0780) (0.0751) (0.0772) (0.0769) (0.0798) (0.0789)
∆ Excise−1 0.124* 0.120* 0.121* 0.120* 0.113* 0.112*(0.0609) (0.0600) (0.0600) (0.0587) (0.0606) (0.0591)
∆ Excise+1 0.00837 0.0162 0.0177 0.0171 0.0217 0.0208(0.0175) (0.0153) (0.0156) (0.0148) (0.0165) (0.0155)
macro controls yes yes
cost controls yes yes yes yes yes yes
time f.e. yes yes yes yes yes yes yes
country f.e. yes yes yes yes yes
adj. R2 0.142 0.163 0.163 0.160 0.163 0.160 0.172 0.171
φ̂EU 0.711 0.727 0.758 0.474 0.768 0.477 0.747 0.742
η̂EU 0.924 0.898 0.902 0.784 0.900 0.784 0.892 0.889
Notes: Robust standard errors in parentheses clustered at the member state level. The dependentvariable is the first-differenced beer HICP. φ and η are the pass-through rates of VAT andexcise taxes, respectively. Their calculation follows the same procedures as in Tables 2 and3. Cost controls are the price indices of transport and energy. The coefficients of inflationand unemployment are statistically significant in (8) with a positive sign and a negative sign,respectively. In (9) the coefficient of inflation is positive and significant. The subscript −1corresponds to the month after the tax change. ∗ p < 0.10, ∗∗ p < 0.05, ∗∗∗ p < 0.01
2. Finally, the inclusion of macroeconomic controls hardly changes the estimatedpass-through rates of VAT and excise taxes in all specifications, as is evident fromTables 2, 3, and 4. The substantial difference between the excise tax and VATpass-through rates continues to hold.
encompassing specification (Column 3 of Table 4) rejects the hypothesis that these are equal atthe one percent level.
17
5 Robustness and Extensions
To assess the robustness of our results we carry out several additional checks.These alternative estimates concern the inclusion of further controls as wellas restrictions of our sample. The first approach aims at minimizing omittedvariable bias, the second addresses potential concerns about the validity of usingthe EU member states as counterfactuals for each other. In particular, marketintegration may not have been very close between certain member states. Thus,price developments may have been rather different in individual member statesdue to market fragmentation even in the absence of tax changes.
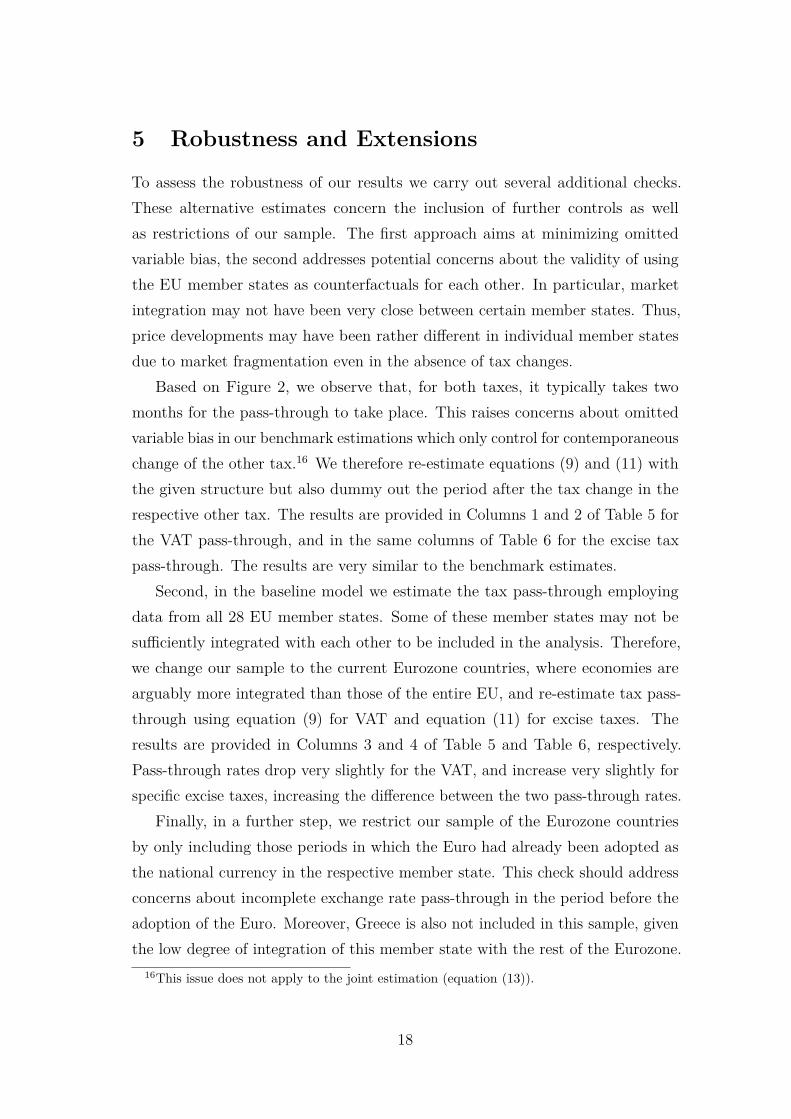
Based on Figure 2, we observe that, for both taxes, it typically takes twomonths for the pass-through to take place. This raises concerns about omittedvariable bias in our benchmark estimations which only control for contemporaneouschange of the other tax.16 We therefore re-estimate equations (9) and (11) withthe given structure but also dummy out the period after the tax change in therespective other tax. The results are provided in Columns 1 and 2 of Table 5 forthe VAT pass-through, and in the same columns of Table 6 for the excise taxpass-through. The results are very similar to the benchmark estimates.
Second, in the baseline model we estimate the tax pass-through employingdata from all 28 EU member states. Some of these member states may not besufficiently integrated with each other to be included in the analysis. Therefore,we change our sample to the current Eurozone countries, where economies arearguably more integrated than those of the entire EU, and re-estimate tax pass-through using equation (9) for VAT and equation (11) for excise taxes. Theresults are provided in Columns 3 and 4 of Table 5 and Table 6, respectively.Pass-through rates drop very slightly for the VAT, and increase very slightly forspecific excise taxes, increasing the difference between the two pass-through rates.
Finally, in a further step, we restrict our sample of the Eurozone countriesby only including those periods in which the Euro had already been adopted asthe national currency in the respective member state. This check should addressconcerns about incomplete exchange rate pass-through in the period before theadoption of the Euro. Moreover, Greece is also not included in this sample, giventhe low degree of integration of this member state with the rest of the Eurozone.
16This issue does not apply to the joint estimation (equation (13)).
18

Table 5: Robustness check for VAT pass-through
(1) (2) (3) (4) (5) (6)∆ln(P ) ∆ln(P ) ∆ln(P ) ∆ln(P ) ∆ln(P ) ∆ln(P )
∆VAT 0.344∗∗∗ 0.345∗∗∗ 0.298∗∗ 0.297∗∗ 0.300∗ 0.304∗∗
(0.0919) (0.0922) (0.128) (0.128) (0.144) (0.144)
∆VAT−1 0.143∗ 0.208∗ 0.0551(0.0739) (0.118) (0.0984)
∆VAT+1 0.0796 0.0519 -0.0836(0.0620) (0.0949) (0.0649)
cost controls yes yes yes yes yes yes
excise tax dummies yes yes yes yes yes yes
time f.e. yes yes yes yes yes yes
country f.e. yes yes yes yes yes yes
adj. R2 0.192 0.192 0.186 0.184 0.220 0.220
φ̂ 0.674 0.410 0.658 0.350 0.322 0.361
Notes: Robust standard errors in parentheses clustered at the member state level. The dependentvariable is the first-differenced beer HICP in logs. φ is the ad valorem tax pass-through measure,φ̂ = β̂3(1 + τ̄0) with τ̄0 equal to 19.12% for regressions 1 and 2, 17.95% for regressions 3 and 4,and 18.84% for regressions 5 and 6. Cost controls are the price indices of transport and energy.The subscript −1 corresponds to the month after the tax change. ∗p < 0.10, ∗∗ p < 0.05, ∗∗∗
p < 0.01
We display the corresponding results in Columns 5 and 6 of Table 5 and Table6, respectively. The VAT pass-through is even lower in this case, and the pass-through of specific excise taxes is again slightly higher than in the benchmark. Tosum up, all additional estimates point at the robustness of our results.
We now turn to two further aspects, the asymmetry of tax pass-through, andthe times in which tax changes occur, respectively. First, tax increases may bepassed-through at a different rate or speed relative to tax decreases. Table 7provides some mixed results for the VAT case. For the estimation using only thecontemporaneous tax changes shown in Column 1, only the tax increase coefficientis significant, and it is substantially larger than the insignificant coefficient ofVAT reductions. However, for the estimations using an additional lead and anadditional lag, the results look somewhat different. The overall effect appears
19

Table 6: Robustness check for excise tax pass-through
(1) (2) (3) (4) (5) (6)∆P ∆P ∆P ∆P ∆P ∆P
∆Excise 0.931∗∗∗ 0.930∗∗∗ 1.034∗∗∗ 1.032∗∗∗ 1.029∗∗∗ 1.028∗∗∗
(0.122) (0.122) (0.142) (0.143) (0.169) (0.171)
∆Excise−1 0.120∗ 0.122 0.144(0.0618) (0.0856) (0.0854)
∆Excise+1 0.0113 0.0287 0.0265(0.0121) (0.0203) (0.0279)
cost controls yes yes yes yes yes yes
excise tax dummies yes yes yes yes yes yes
time f.e. yes yes yes yes yes yes
country f.e. yes yes yes yes yes yes
adj. R2 0.163 0.161 0.155 0.153 0.193 0.190
η̂ 0.89 0.78 1.00 0.86 1.00 0.87
Notes: Robust standard errors in parentheses clustered at the member state level. The dependentvariable is the first-differenced beer HICP. η is the excise tax pass-through measure, η̂ = β̂3
′
1+τ̄with τ̄ equal to 20.016% for regressions 1 and 2, 19.03% for regression 3 and 4, and 19.38% forregressions 5 and 6. Cost controls are the price indices of transport and energy. The subscript−1 corresponds to the month after the tax change. ∗p < 0.10, ∗∗ p < 0.05, ∗∗∗ p < 0.01
larger for the VAT decreases, and, in the case of the tax decreases, the lead andthe lag are both significant, but the coefficient of the contemporaneous tax changeis not. Table 8 provides more conclusive evidence for the case of excise taxes.These are passed-through at a slightly higher rate in case of tax increases relativeto decreases. Moreover, the pass-through of increases is faster, occurring withinthe same month of the tax change, whereas the pass-through of tax decreases isspread out over the contemporaneous and the following month.
As a final point, we investigate whether tax changes occur at specific times.It is usually assumed in the tax pass-through literature that tax changes areexogenous. However, it may be argued that VAT or excise tax changes occur atparticular instances. Both, excise taxes or VAT may be increased to balance thegovernment budget, which, particularly in Europe with its relatively high levelof welfare state provisions, is often driven by the dynamics of social spending.
20

Negative and positive tax changes
Table 7: VAT
(1) (2) (3)∆log(P ) ∆log(P ) ∆log(P )
∆ VAT + 0.384*** 0.384*** 0.385***(0.110) (0.110) (0.107)
∆ VAT ++1 -0.0198 -0.0211
(0.0527) (0.0517)
∆ VAT +−1 0.137** 0.137**
(0.0635) (0.0625)
∆ VAT − 0.0865 0.0896 0.110(0.197) (0.195) (0.182)
∆ VAT −+1 0.347* 0.354*
(0.193) (0.198)
∆ VAT −−1 0.244** 0.242**
(0.101) (0.103)
country f.e. yes yestime f.e. yes yes yes
cost controls yes yes yesexcise tax D. yes yes yes
adj. R2 0.190 0.193 0.193
φ̂+EU 0.457 0.597 0.596
φ̂−EU 0.103 0.810 0.841
Table 8: Excise tax
(1) (2) (3)∆P ∆P ∆P
∆ Excise + 0.990*** 0.993*** 0.988***(0.147) (0.146) (0.145)
∆ Excise ++1 0.0117 0.00772
(0.0186) (0.0192)
∆ Excise +−1 0.161 0.154
(0.0978) (0.0964)
∆ Excise − 0.851*** 0.852*** 0.855***(0.200) (0.200) (0.200)
∆ Excise −+1 0.0125 0.0161
(0.0214) (0.0221)
∆ Excise −−1 0.0792*** 0.0827***
(0.0271) (0.0279)
country f.e. yes yestime f.e. yes yes yes
cost controls yes yes yesVAT D. yes yes yes
adj. R2 0.162 0.164 0.164
η̂+EU 0.824 0.971 0.957
η̂−EU 0.709 0.786 0.794
Notes: Robust standard errors in parentheses clustered at the member state level. The subscript−1 corresponds to the month after the tax change. ∗ p < 0.10,∗∗ p < 0.05, ∗∗∗ p < 0.01
The latter typically arises in economic downturns, which by themselves mayattenuate price dynamics. Similarly, VAT or excise tax reductions may be usedas counter-cyclical policy instruments to jump-start the economy in an economicslump. Thus, if the VAT changes were to occur at different times relative to theexcise tax changes, this could bias the estimations and potentially explain thedifferent pass-through rates, as well as the different findings for tax increasesand decreases. Table 9 shows the result of regressing changes in the VAT andexcise tax rates on GDP growth, inflation, and unemployment. These regressionsinclude season-year fixed effects, since tax changes are more likely to occur duringparticular times of the year. Neither for the VAT nor the excise tax changes, the
21
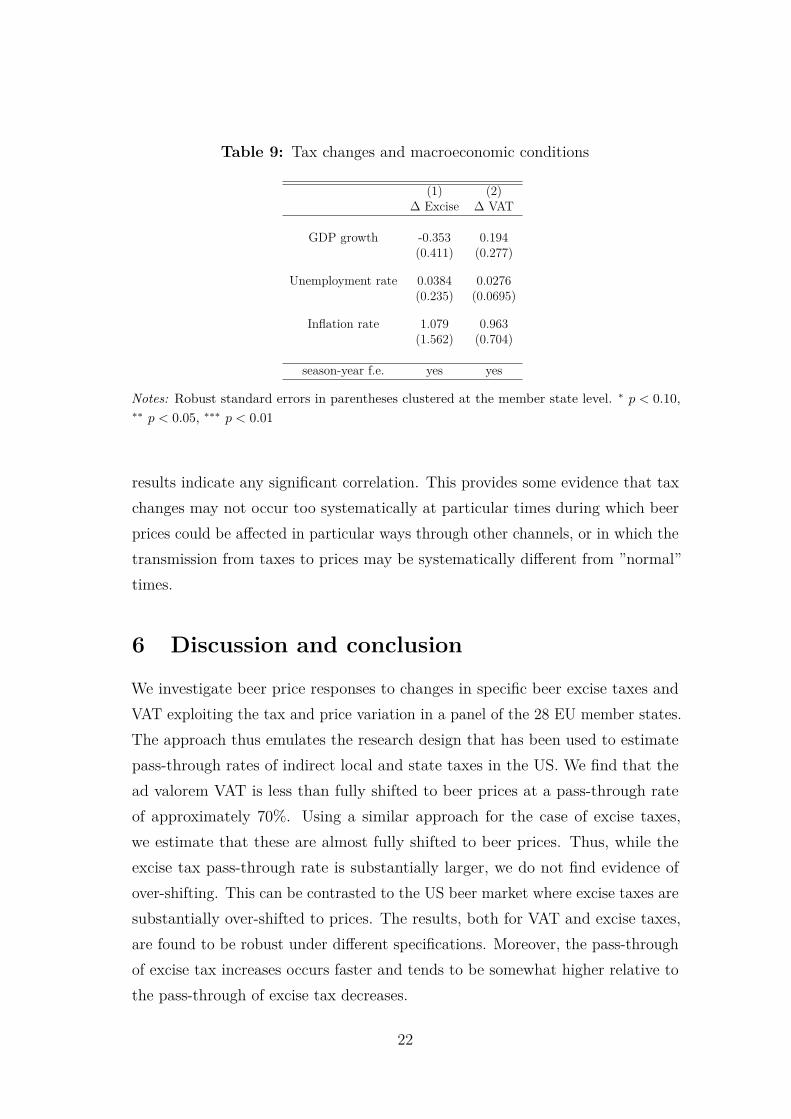
Table 9: Tax changes and macroeconomic conditions
(1) (2)∆ Excise ∆ VAT
GDP growth -0.353 0.194(0.411) (0.277)
Unemployment rate 0.0384 0.0276(0.235) (0.0695)
Inflation rate 1.079 0.963(1.562) (0.704)
season-year f.e. yes yes
Notes: Robust standard errors in parentheses clustered at the member state level. ∗ p < 0.10,∗∗ p < 0.05, ∗∗∗ p < 0.01
results indicate any significant correlation. This provides some evidence that taxchanges may not occur too systematically at particular times during which beerprices could be affected in particular ways through other channels, or in which thetransmission from taxes to prices may be systematically different from ”normal”times.
6 Discussion and conclusion
We investigate beer price responses to changes in specific beer excise taxes andVAT exploiting the tax and price variation in a panel of the 28 EU member states.The approach thus emulates the research design that has been used to estimatepass-through rates of indirect local and state taxes in the US. We find that thead valorem VAT is less than fully shifted to beer prices at a pass-through rateof approximately 70%. Using a similar approach for the case of excise taxes,we estimate that these are almost fully shifted to beer prices. Thus, while theexcise tax pass-through rate is substantially larger, we do not find evidence ofover-shifting. This can be contrasted to the US beer market where excise taxes aresubstantially over-shifted to prices. The results, both for VAT and excise taxes,are found to be robust under different specifications. Moreover, the pass-throughof excise tax increases occurs faster and tends to be somewhat higher relative tothe pass-through of excise tax decreases.
22

In our analysis we have compared the pass-through of ad-valorem VAT to thespecific excise taxes on beer. It is important to realize that these taxes not onlydiffer along the ad valorem versus specific tax dimension, but also with respectto the consumption goods for which they apply. An increase in VAT also affectsother products, whereas an increase in beer excise taxes only affects other goodsindirectly. In general, it should be easier to pass-on the tax increase to consumersin a situation where other consumption goods, including important substitutes,also experience a tax increase. However, it could be that monetary policy is notsufficiently accommodating to the VAT increase, so that part of the VAT increaseis pushed back to workers. This could be an alternative explanation of the lowerVAT pass-through rates observed, besides imperfect competition.
Our findings of differential pass-through rates of specific and ad valoremtaxes can thus, with some caveats, be interpreted in the sense that imperfectcompetition plays an important role in the European beer market.17 This is inline with the relatively high market concentration in many European countries.Moreover, concentration is, on average, lower than in the US, which can explain thesomewhat lower excise tax pass-through rates. From a policy perspective, relyingmore heavily on ad valorem taxes may therefore be able to generate substantialwelfare gains. Welfare could be increased by a policy that replaced specific excisetaxes by ad valorem taxes such that consumption levels remain unchanged. Thiscan raise higher tax revenues without reducing consumer surplus and withoutcompromising public health concerns or other negative externalities originatingfrom alcohol consumption.
Compliance with Ethical Standards
Conflict of interest: Aria Ardalan declares that he has no conflict of interest.Sebastian Georg Kessing declares that he has no conflict of interest. Ethicalapproval: This article does not contain any studies with human participants oranimals performed by any of the authors.
17In addition to the presented results we also estimated an equation where we interacted themarket share of the largest firm in 2013 as provided by Loretz and Oberhofer (2016) with thetax changes. However, the coefficient of interest did not turn out significant. These results could,however, be just due to the particular, potentially ill-suited, concentration measure, or due tothe fact that we did not have access to a time-varying concentration measure.
23

ReferencesAgrawal, David and William Hoyt. 2018. “Tax Incidence in a Multi-Product World:
Theoretical Foundations and Empirical Implications.” University of Kentucky workingpaper .
Anderson, Simon P, Andre De Palma and Brent Kreider. 2001a. “The efficiency ofindirect taxes under imperfect competition.” Journal of Public Economics 81(2):231–251.
Anderson, Simon P, Andre De Palma and Brent Kreider. 2001b. “Tax incidence indifferentiated product oligopoly.” Journal of Public Economics 81(2):173–192.
Benedek, Dora, Ruud A De Mooij, Michael Keen and Philippe Wingender. 2015.“Estimating VAT Pass Through.”.
Benzarti, Youssef, Dorian Carloni, Jarkko Harju and Tuomas Kosonen. 2017. “Whatgoes up may not come down: asymmetric incidence of value-added taxes.” NationalBureau of Economic Research .
Bergman, U Michael and Niels Lynggård Hansen. 2016. “Excise Tax Pass-Through andMenu Costs: The Danish Evidence.”.
Besley, Timothy J and Harvey S Rosen. 1999. “Sales taxes and prices: An empiricalanalysis.” National Tax Journal 52(2):157.
Bonnet, Céline and Vincent Réquillart. 2013. “Tax incidence with strategic firms in thesoft drink market.” Journal of Public Economics 106:77–88.
Carbonnier, Clément. 2013. “Pass-through of Per Unit and ad Valorem ConsumptionTaxes: Evidence from Alcoholic Beverages in France.” The BE Journal of EconomicAnalysis & Policy 13(2):837–863.
Chetty, Raj, Adam Looney and Kory Kroft. 2009. “Salience and taxation: Theory andevidence.” American economic review 99(4):1145–77.
Delipalla, Sofia and Michael Keen. 1992. “The comparison between ad valorem andspecific taxation under imperfect competition.” Journal of Public Economics 49(3):351–367.
Denicolò, Vincenzo and Massimo Matteuzzi. 2000. “Specific and ad valorem taxation inasymmetric Cournot oligopolies.” International Tax and Public Finance 7(3):335–342.
24

European Commission, EUROSTAT. 2011. “Harmonized Indices of Consumer Prices atConstant Tax Rates Reference Methodology.”.
Evans, William N, Jeanne S Ringel and Diana Stech. 1999. “Tobacco taxes and publicpolicy to discourage smoking.” Tax policy and the economy 13:1–55.
Fertő, Imre and Szilárd Podruzsik. 2016. Intra-industry Trade in the Beer Industrywithin the Enlarged European Union. In Brewing, Beer and Pubs. Springer pp. 74–96.
Fogarty, James. 2010. “The demand for beer, wine and spirits: a survey of the literature.”Journal of Economic Surveys 24(3):428–478.
Hamilton, Stephen F. 2009. “Excise taxes with multiproduct transactions.” The AmericanEconomic Review 99(1):458–471.
Harding, Matthew, Ephraim Leibtag and Michael F Lovenheim. 2012. “The hetero-geneous geographic and socioeconomic incidence of cigarette taxes: Evidence fromNielsen Homescan Data.” American Economic Journal: Economic Policy 4(4):169–198.
Im, Kyung So, M Hashem Pesaran and Yongcheol Shin. 2003. “Testing for unit roots inheterogeneous panels.” Journal of econometrics 115(1):53–74.
Keen, Michael. 1998. “The balance between specific and ad valorem taxation.” Fiscalstudies 19(1):1–37.
Kenkel, Donald S. 2005. “Are alcohol tax hikes fully passed through to prices? Evidencefrom Alaska.” The American economic review 95(2):273–277.
Kopczuk, Wojciech, Justin Marion, Erich Muehlegger, Joel Slemrod et al. 2016. “Doestax-collection invariance hold? evasion and the pass-through of state diesel taxes.”American Economic Journal: Economic Policy 8(2):251–86.
Loretz, Simon and Harald Oberhofer. 2016. ‚ÄúWhen Helping the Small Hurts theMiddle‚Äù: Beer Excise Duties and Market Concentration. In Brewing, Beer andPubs. Springer pp. 97–119.
Marketrealist. 2015. “Competitive Forces? Who Rules the US Beer Indus-try.” Website report by Sharon Bailey, last accessed online on April 14,2019 at https://articles.marketrealist.com/2015/03/competitive-forces-rules-us-beer-industry/.
25

Myles, Gareth D. 1996. “Imperfect competition and the optimal combination of advalorem and specific taxation.” International Tax and Public Finance 3(1):29–44.
Sandler, Danielle H and Ryan Sandler. 2014. “Multiple event studies in public financeand labor economics: A simulation study with applications.” Journal of Economicand Social Measurement 39(1, 2):31–57.
Shrestha, Vinish and Sara Markowitz. 2016. “The Pass-Through of Beer Taxes to Prices:Evidence from State and Federal Tax Changes.” Economic Inquiry 54(4):1946–1962.
The Brewers of Europe. 2016. “The Contribution made by Beer to the EuropeanEconomy.” Europe Economics.
Weyl, E Glen and Michal Fabinger. 2013. “Pass-through as an economic tool: Principlesof incidence under imperfect competition.” Journal of Political Economy 121(3):528–583.
Young, Douglas J and Agnieszka Bielińska-Kwapisz. 2002. “Alcohol taxes and beverageprices.” National Tax Journal pp. 57–73.
7 Appendix: Re-scaling of excise tax rates
As reported by Eurostat, member states compute the harmonized indices ofconsumer prices separately and according to their national consumption basket.Therefore, the structure of the underlying consumption basket in the referenceperiod can potentially be different across various member states. To assess thepass-through of excise taxes on the respective price indices thus requires to relatethe taxes to the quantities in the consumption baskets underlying each index.Furthermore, beer excise taxes are imposed on a specific quantity. According toarticle 3 of directive 92/83/EEC18, the excise duties on beer can be levied perhectoliter/degrees Plato or per hectoliter/degrees of actual alcoholic strength byvolume, in each member state. Thus, an additional concern stems from varyingunits of measure of the excise tax rate in different countries.
To address these issues, we make use of the so-called harmonized index ofconsumer prices at constant tax rates (HICP-CT thereafter) which are available
18"Council Directive 92/83/EEC of 19 October 1992 on the harmonization of the structuresof excise duties on alcohol and alcoholic beverages"
26

for most of the member states from 2005 onwards. The difference between theHICP and the HICP-CT is as follows. For each country HICP-CT is computed forhypothetical fixed tax rates under the assumption of a one-to-one pass-throughwhile the HICP allows for the actual tax variations in each period. Therefore,the difference among the two indices captures the extent to which price changescorrespond to a particular value of excise tax changes assuming instantaneousand full pass-through in each country (European Commission (2011)).
We exploit the differences between the values of HICP and HICP-CT with anidentical reference year (2015 = 100) relative to the value of effective tax change toidentify the tax. Consider a period in which t0 changes to t1, based on the definitionof HICP-CT, P1 = (q0
1 + m∆t + mt0)(1 + nτ1) and P ct1 = (q0
1 + mt0)(1 + nτ1)we have P1 − P ct
1 = m∆t(1 + nτ1). Rearranging and multiplying both sides by1
(1+τ1)∆t givesP1 − P ct
1(1 + τ1)∆t = m(1 + nτ1)
1 + τ1= η. (14)
The term on the right hand side corresponds to the pass-through of excise tax (η).The underlying assumption of Eurostat’s HICP-CT is full and instantaneous pass-through and therefore η = 1, which means P1−P ct
1(1+τ1)∆t = 1 should hold. Computing
this ratio for all the countries and for all those periods where the difference betweenHICP and HICP-CT is induced based on a single excise tax change reveals thatfor none of them the ratio P1−P ct
1(1+τ1)∆t equals one. This implies that our excise tax
rates should be re-scaled, and we use this ratio for this purpose.The term P1−P ct
1(1+τ1)∆t in a period with an excise tax change (∆t) and a fixed value
of VAT rate (τ1), captures the relationship between the variations of excise tax(measured either by hectoliter per degree alcohol or hectoliter degree Plato) andthe price index which are used as a weight in each country to re-scale excise taxrates. Finally, for all periods in which a member state had already adopted theEuro as the national currency, all excise tax rates are converted into pre-existingnational currencies using the irrevocably fixed conversion rates.
27