Tavant webcast slides: How the Right Warranty Management Solution Can Help Improve Your...
148
Research Powered By © 2017 Strategies For Growth SM “Research Analysts to the Services Industry” How the Right Warranty Management Solution Can Help Improve Your Organization’s Bottom Line Special Management Webcast Hosted by: March 1, 2017
-
Upload
tavant-technologies-inc -
Category
Automotive
-
view
38 -
download
0
Transcript of Tavant webcast slides: How the Right Warranty Management Solution Can Help Improve Your...

Research Powered By© 2017 Strategies For GrowthSM
“Research Analysts to the Services Industry”
How the Right Warranty Management Solution Can Help Improve Your
Organization’s Bottom Line
Special Management Webcast Hosted by:
March 1, 2017

Research Powered By
SFG℠’s 2017 Warranty Chain Management Survey:
Launched on January 10, 2017
Based on data collected through February 20, 2017
“Live” for 41 Days
215 Total Respondents

Research Powered By
(Percent Response)
0.0 20.0 40.0 60.0 80.0 100.0
Process is Fully Automated
Process Is Partially Automated
Process Is All Manual
No Formal Warranty Management Process
20
57
15
7
22% of Organizations Have Either a Manual WM Process – or None at All …
n = 143
22%

Research Powered By
(Percent Response)
0.0 20.0 40.0 60.0 80.0 100.0
Process is Fully Automated
Process Is Partially Automated
Process Is All Manual
No Formal Warranty Management Process
20
57
15
7
However, More than Three-Quarters Are At Least Partially Automated …
n = 143
77%

Research Powered By
(Percent Response)
0.0 20.0 40.0 60.0 80.0 100.0
Process is Fully Automated
Process Is Partially Automated
Process Is All Manual
No Formal Warranty Management Process
20
57
15
7
… But, Only 20% Are Currently Fully Automated …
n = 143

Research Powered By
(Percent Response)
0.0 20.0 40.0 60.0 80.0 100.0
Process is Fully Automated
Process Is Partially Automated
Process Is All Manual
No Formal Warranty Management Process
29
71
0
0
However, This Figure Jumps to 29% Among Organizations that Have Acquired or Upgraded Their WM Solution within the Past 3 Years:
n = 52

Research Powered By
(Percent Response)
0.0 20.0 40.0 60.0 80.0 100.0
Process is Fully Automated
Process Is Partially Automated
Process Is All Manual
No Formal Warranty Management Process
29
71
0
0
Leading to at Least Partially Automated Among Organizations that Have Acquired or Upgraded Their WM Solution within the Past 3 Years:
n = 52
100%

Research Powered By
0.0 20.0 40.0 60.0 80.0 100.0
Decrease by >10%+
Decrease by 5% to 9%
Decrease by < 5%
Remain the Same
Increase by < 5%
Increase by 5% to 9%
Increase by > 10%+
6
2
10
38
19
12
13
Overall, Annual Warranty Budgets Are Largely Expected to Increase* …
n = 120
* In the next 12 months.
(Percent Response)

Research Powered By
0.0 20.0 40.0 60.0 80.0 100.0
Decrease by >10%+
Decrease by 5% to 9%
Decrease by < 5%
Remain the Same
Increase by < 5%
Increase by 5% to 9%
Increase by > 10%+
6
2
10
38
19
12
13
Overall, Annual Warranty Budgets Are Largely Expected to Increase* …
n = 120
44%
18%
* In the next 12 months.
Expected to Increase over Decrease by a
ratio of > 2:1!
(Percent Response)

Research Powered By
0.0 20.0 40.0 60.0 80.0 100.0
No - Neither Implemented nor Upgraded OurWM Solution
Yes - Upgraded Existing WM Solution
Yes - Implemented a New WM Solution
51
34
15
Roughly Half (49%) of the WM Segment Have Implemented and/or Upgraded Their Respective WM Solutions in the Past Three Years or Less …
n = 107
49%
(Percent Response)

Research Powered By
0.0 20.0 40.0 60.0 80.0 100.0
Declined by >25%
Declined by 10% to 24%
Declined by < 10%
No Change
Improved by < 10%
Improved by 10% to 24%
Improved by > 25%
3
3
12
12
21
12
12
Warranty Claims Processing Time Has Improved Since Implementation …
n = 33
(Percent Response)
Base: Have Implemented or Upgraded Their WarrantyManagement Solution in the Past Three Years

Research Powered By
0.0 20.0 40.0 60.0 80.0 100.0
Declined by >25%
Declined by 10% to 24%
Declined by < 10%
No Change
Improved by < 10%
Improved by 10% to 24%
Improved by > 25%
3
3
12
12
21
12
12
45%
Warranty Claims Processing Time Has Improved Since Implementation …
n = 33
(Percent Response)
Base: Have Implemented or Upgraded Their WarrantyManagement Solution in the Past Three Years
18%
Improved is cited over Declined by a
ratio of 2.5:1!

Research Powered By
0.0 20.0 40.0 60.0 80.0 100.0
Declined by >25%
Declined by 10% to 24%
Declined by < 10%
No Change
Improved by < 10%
Improved by 10% to 24%
Improved by > 25%
3
12
16
25
34
9
0
Total Warranty Expense Has Improved Since Implementation …
n = 32
(Percent Response)
Base: Have Implemented or Upgraded Their WarrantyManagement Solution in the Past Three Years

Research Powered By
0.0 20.0 40.0 60.0 80.0 100.0
Declined by >25%
Declined by 10% to 24%
Declined by < 10%
No Change
Improved by < 10%
Improved by 10% to 24%
Improved by > 25%
3
12
16
25
34
9
0
43%
Total Warranty Expense Has Improved Since Implementation …
n = 32
(Percent Response)
Base: Have Implemented or Upgraded Their WarrantyManagement Solution in the Past Three Years
31%
Improved is cited over Declined by a
ratio of 1.4:1!

Research Powered By
0.0 20.0 40.0 60.0 80.0 100.0
Declined by >25%
Declined by 10% to 24%
Declined by < 10%
No Change
Improved by < 10%
Improved by 10% to 24%
Improved by > 25%
3
7
0
33
33
27
7
Supplier / Vendor Recovery Has Improved Since Implementation …
n = 30
(Percent Response)
Base: Have Implemented or Upgraded Their WarrantyManagement Solution in the Past Three Years
Research Powered By
0.0 20.0 40.0 60.0 80.0 100.0
Declined by >25%
Declined by 10% to 24%
Declined by < 10%
No Change
Improved by < 10%
Improved by 10% to 24%
Improved by > 25%
3
7
0
33
33
27
7
67%
Supplier / Vendor Recovery Has Improved Since Implementation …
n = 30
(Percent Response)
Base: Have Implemented or Upgraded Their WarrantyManagement Solution in the Past Three Years
10%
Improved is cited over Declined by a ratio almost 7:1!

Research Powered By
Comparison of Organizations with New WM Implementations vs. Upgrades
Mean KPI values reflect a significant advantage for those organizations that have implemented “new” Warranty Management solutions within the past three years vs. those that have upgraded existing WM solutions, as follows:
Key Performance Organizations with “New” With UpgradedIndicator (KPI) WM Implementations WM Solutions
Warranty Claims 14% Improvement 6% ImprovementProcessing Time
Warranty Expense 3% Decline No Change(as a % of Total Sales)
Supplier / Vendor 8% Improvement 5% ImprovementRecovery (as a % ofTotal Warranty Expense)

Research Powered By
A Majority of Organizations Currently Offer an Extended Warranty Agreement or Service Contract …
n = 204
55%
25%
20%
Currently Offer Extended Warranties
Yes
No
Don't Know
n = 161

Research Powered By
0.0 20.0 40.0 60.0 80.0 100.0
Equally In-House & by Third Parties
Managed Mostly by Third Parties
Managed Entirely by Third Parties
Managed Mostly In-House
Managed Entirely In-House
10
2
9
12
67
With About Two-Thirds Managing Extended Warranties Entirely In-House …
n = 87
(Percent Response)

Research Powered By
0.0 20.0 40.0 60.0 80.0 100.0
Equally In-House & by Third Parties
Managed Mostly by Third Parties
Managed Entirely by Third Parties
Managed Mostly In-House
Managed Entirely In-House
10
2
9
12
67
Almost 4-in-5 Managing Extended Warranties at Least Mostly In-House …
n = 87
(Percent Response)
79%

Research Powered By
0.0 20.0 40.0 60.0 80.0 100.0
Equally In-House & by Third Parties
Managed Mostly by Third Parties
Managed Entirely by Third Parties
Managed Mostly In-House
Managed Entirely In-House
10
2
9
12
67
And Nearly 9-in-10 Managing Portions of Extended Warranties In-House
n = 87
(Percent Response)
79%
89%
10%

Research Powered By
(Percent Response)
0.0 20.0 40.0 60.0 80.0 100.0
Mandate to Drive Increased Service Revenues
Product Defect-related Costs
Dealing with Inferior/Deficient Product Quality
Customer Demand for Improved WarrantyServices
Desire to Improve Customer Retention
Post-Sale Customer Satisfaction Issues
23
26
28
36
43
47
The Principal Drivers Impacting Today’s Warranty Management Initiatives
n = 132

Research Powered By
(Percent Response)
0.0 20.0 40.0 60.0 80.0 100.0
Mandate to Drive Increased Service Revenues
Product Defect-related Costs
Dealing with Inferior/Deficient Product Quality
Customer Demand for Improved WarrantyServices
Desire to Improve Customer Retention
Post-Sale Customer Satisfaction Issues
23
26
28
36
43
47
… Are, First, Customer-Focused …
n = 132
Customer-focused

Research Powered By
(Percent Response)
0.0 20.0 40.0 60.0 80.0 100.0
Mandate to Drive Increased Service Revenues
Product Defect-related Costs
Dealing with Inferior/Deficient Product Quality
Customer Demand for Improved WarrantyServices
Desire to Improve Customer Retention
Post-Sale Customer Satisfaction Issues
23
26
28
36
43
47
… Then, Product Quality-focused …
n = 132
Customer-focused
Product Quality-focused

Research Powered By
(Percent Response)
0.0 20.0 40.0 60.0 80.0 100.0
Mandate to Drive Increased Service Revenues
Product Defect-related Costs
Dealing with Inferior/Deficient Product Quality
Customer Demand for Improved WarrantyServices
Desire to Improve Customer Retention
Post-Sale Customer Satisfaction Issues
23
26
28
36
43
47
… And, Finally, Cost/Revenue-focused …
n = 132
Customer-focused
Product Quality-focused
Cost/Revenue-focused

Research Powered By
(Percent Response)
Other Key Drivers Focus on Costs,
n = 132
0.0 20.0 40.0 60.0 80.0 100.0
Costs Associated with Fradulent Claims
Escalating Warranty Administrative Costs
Need to Improve Supply Chain Performance
Compliance to Regulatory Requirements
Mandate to Improve Service Profitability
Logistics and/or Reverse Logistics Costs
6
11
13
14
18
20
Research Powered By
(Percent Response)
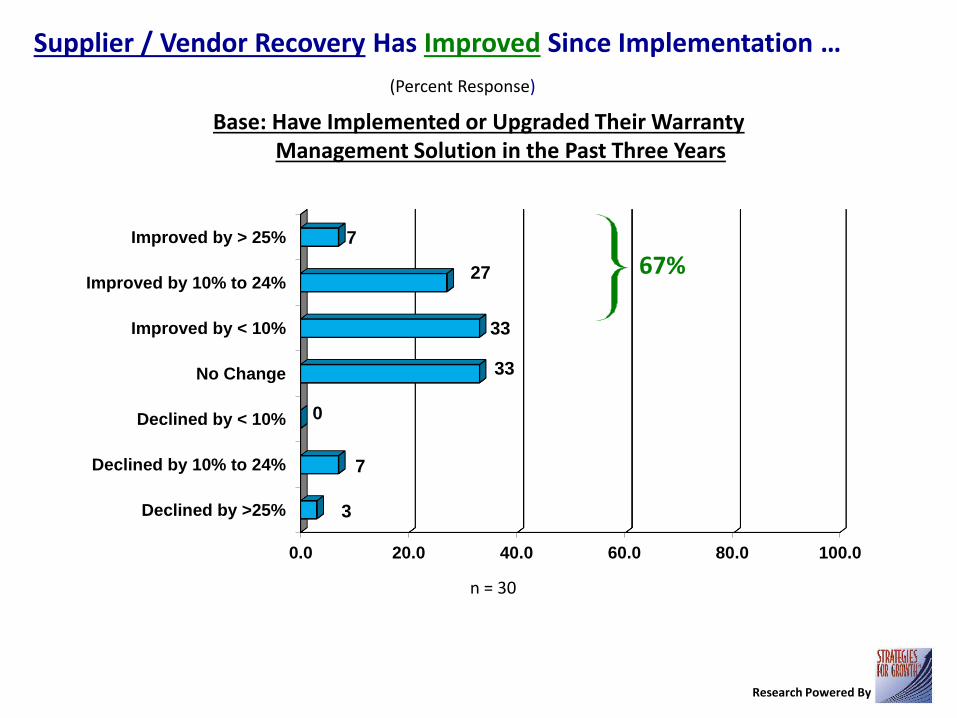
Other Key Drivers Focus on Costs, Profitability
n = 132
0.0 20.0 40.0 60.0 80.0 100.0
Costs Associated with Fradulent Claims
Escalating Warranty Administrative Costs
Need to Improve Supply Chain Performance
Compliance to Regulatory Requirements
Mandate to Improve Service Profitability
Logistics and/or Reverse Logistics Costs
6
11
13
14
18
20

Research Powered By
(Percent Response)
Other Key Drivers Focus on Costs, Profitability, Compliance
n = 132
0.0 20.0 40.0 60.0 80.0 100.0
Costs Associated with Fradulent Claims
Escalating Warranty Administrative Costs
Need to Improve Supply Chain Performance
Compliance to Regulatory Requirements
Mandate to Improve Service Profitability
Logistics and/or Reverse Logistics Costs
6
11
13
14
18
20

Research Powered By
(Percent Response)
Other Key Drivers Focus on Costs, Profitability, Compliance & Performance
n = 132
0.0 20.0 40.0 60.0 80.0 100.0
Costs Associated with Fradulent Claims
Escalating Warranty Administrative Costs
Need to Improve Supply Chain Performance
Compliance to Regulatory Requirements
Mandate to Improve Service Profitability
Logistics and/or Reverse Logistics Costs
6
11
13
14
18
20

Research Powered By
(Percent Response)
The Greatest Challenges Facing Today’s Warranty Management Initiatives …
n = 122
0.0 20.0 40.0 60.0 80.0 100.0
High Levels of NFFs
Repair Management
Data Quality
Claims Processing Time & Accuracy
Product Quality Issues
ID of Root Causes of Product Failures
20
25
25
30
30
42

Research Powered By
(Percent Response)
Other Challenges include Systems, Costs, Sales & Management Issues:
n = 122
0.0 20.0 40.0 60.0 80.0 100.0
Reverse Logistics Management
Constraints of Repair Network
Sale of Extended Warranties
Managing Admin Costs for WarrantyFulfillment
Cost Recovery from Suppliers
System Limitations
13
15
16
16
17
18
Research Powered By
(Percent Response)
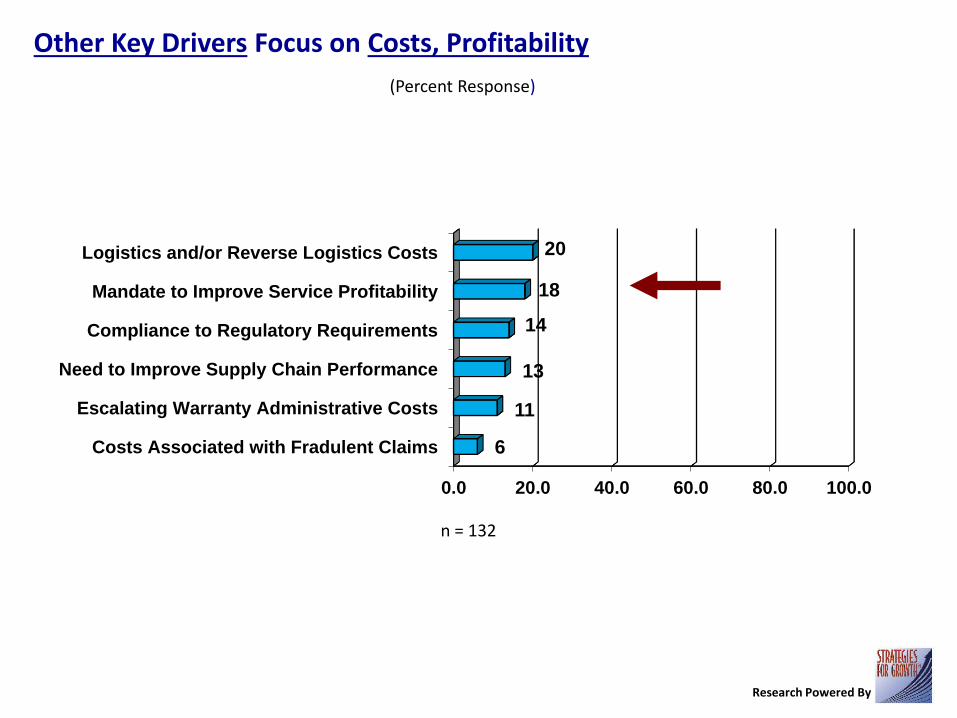
Specific Challenges Relating to Product Complexity include:
n = 124
0.0 20.0 40.0 60.0 80.0 100.0
Lack of Certified / Experienced Technicians
Increased Reliance on OEM for Joint Support
Increasing Labor Charges / Costs
No Significant Challenges
29
29
29
31

Research Powered By
(Percent Response)
Specific Challenges Relating to Product Complexity include:
n = 124
0.0 20.0 40.0 60.0 80.0 100.0
Lack of Certified / Experienced Technicians
Increased Reliance on OEM for Joint Support
Increasing Labor Charges / Costs
No Significant Challenges
29
29
29
31

Research Powered By
(Percent Response)
Specific Challenges Relating to Product Complexity include:
n = 124
0.0 20.0 40.0 60.0 80.0 100.0
Lack of Certified / Experienced Technicians
Increased Reliance on OEM for Joint Support
Increasing Labor Charges / Costs
No Significant Challenges
29
29
29
31

Research Powered By
(Percent Response)
Specific Actions Taken to Address Product Complexity Issues include:
n = 118
0.0 20.0 40.0 60.0 80.0 100.0
Increasing the Organizations Mfg. Activities
Establishing Contracts with OEMs for FieldService Support
Outsourcing Field Service to SpecializedVendors
Providing Self-Diagnostic Capabilities
Increased Technician Training / Certifications
No Specific Actions Required
14
18
21
35
38
24

Research Powered By
(Percent Response)
Specific Challenges Relating to Changing Customer Expectations include:
n = 124
0.0 20.0 40.0 60.0 80.0 100.0
Need to Provide Instant Decisions on Claims
Ability to Provide B2B Customers w/ B2CService
Demand for Quicker Claims Turnaround Time
No Significant Challenges
20
22
53
26

Research Powered By
Putting Things in Perspective: Current Strategic Actions Already in Place:
The top Strategic Actions currently being undertaken by Services Organizations to address the key Drivers/Challenges of Warranty Chain Performance are:

Research Powered By
Putting Things in Perspective: Current Strategic Actions Already in Place:
The top Strategic Actions currently being undertaken by Services Organizations to address the key Drivers/Challenges of Warranty Chain Performance are:
43% Develop/Improve Metrics, or KPIs for Advanced Warranty Chain Analytics
28% Foster a Closer Working Collaboration Between Product Design & Service
28% Institute/Enforce Process Workflow Improvements for Supplier Cost Recovery
27% Streamline Parts Return Process to Improve Overall Efficiency
23% Restructure for Improved Warranty Management Oversight & Accountability
22% Purchase or Upgrade an Automated Warranty Chain Management Solution
20% Improve Warranty Management-related Planning and Forecasting Activities
20% Outsource some, or all, Warranty Management Activities to Third Parties
20% Implement a Claims Review Process to Curb Fraudulent Claims
19% Restructure/Update Existing Warranty Pricing Schedule
18% Provide Additional Training to Extended Warranty Sales Personnel

Research Powered By
Putting Things in Perspective: Planned Strategic Actions (Next 12 Months):
The top Strategic Actions being planned in the next 12 months to address the key Drivers/Challenges of Warranty Chain Performance are:

Research Powered By
Putting Things in Perspective: Planned Strategic Actions (Next 12 Months):
The top Strategic Actions being planned in the next 12 months to address the key Drivers/Challenges of Warranty Chain Performance are:
26% Develop/Improve Metrics, or KPIs for Advanced Warranty Chain Analytics
25% Restructure for Improved Warranty Management Oversight & Accountability
24% Improve Warranty Management-related Planning and Forecasting Activities
22% Institute/Enforce Process Workflow Improvements for Supplier Cost Recovery
19% Foster a Closer Working Collaboration Between Product Design & Service
18% Purchase or Upgrade an Automated Warranty Chain Management Solution
17% Streamline Parts Return Process to Improve Overall Efficiency
16% Provide Additional Training to Extended Warranty Sales Personnel
15% Restructure/Update Existing Warranty Pricing Schedule
9% Implement a Claims Review Process to Curb Fraudulent Claims
7% Outsource some, or all, Warranty Management Activities to Third Parties

Research Powered By
(Percent Response)
0.0 20.0 40.0 60.0 80.0 100.0
Early Warning: Systematic Failures
Sr. Executive Oversight of All WM Activities
Separate Reporting of WM FinancialPerformance Data
End-to-End Workflow Process to HandleClaims & Returns
Structured WM Integration w/ All ServiceFunctions
44
44
45
46
46
The Top Warranty Management Capabilities Currently in Place include …
n = 93

Research Powered By
(Percent Response)
0.0 20.0 40.0 60.0 80.0 100.0
Ability to Track In-Warranty Repairs at PoS
KPI Measurement: Claim Rates
Centralized Data Warehouse
KPI Measurement: Claim Processing Time
KPI Measurement: Total Warranty Costs
37
38
40
41
44
Other Key Warranty Management Capabilities Currently in Place include …
n = 93

Research Powered By
(Percent Response)
0.0 20.0 40.0 60.0 80.0 100.0
Closed-Loop WM System in Place
Multi-Division Collaboration
WM Operational/Financial Info Distribution
KPI: Detection-to-Correction Time
Ability of Field Techs to Review WarrantyEntitlements on Each Job
29
29
30
32
35
But, Wait – There’s More:
n = 93

Research Powered By
(Percent Response)
0.0 20.0 40.0 60.0 80.0 100.0
Structured WM Integration w/ All ServiceFunctions
End-to-End Workflow Process to HandleClaims & Returns
KPI: Claims Processing Time Time
Centralized Data Warehouse for ProductPerformance & WM Information
Early Warning: Systematic Failures
24
25
26
27
27
… And, Even More Being Planned* (in the Next 12 Months) …
n = 93
* By at least one-quarter of respondents.

Research Powered By
Putting Things in Perspective: Technology Applications Currently Used
Technology applications currently being used by Services Organizations include:

Research Powered By
Putting Things in Perspective: Technology Applications Currently Used
Technology applications currently being used by Services Organizations include:
63% Customer Relationship Management (CRM)
58% Enterprise Resource Planning (ERP)
53% Financial / Accounting System (separate from ERP)
52% Warranty Management
49% Spare Parts / Inventory Management
45% Contract Management
37% Business Intelligence / Analytics
35% Product Lifecycle Management (PLM)
35% Workforce Management System (WMS)
30% Knowledge Management (KM) Application
28% Enterprise Asset Management System (EAMS)
27% Service Lifecycle Management (SLM)
26% Service Forecasting and Planning Application
26% Remote Asset Monitoring / Management

Research Powered By
Putting Things in Perspective: Technology Applications Being Planned*
* In the next 12 months.
Technology applications currently being planned for use* include:

Research Powered By
Putting Things in Perspective: Technology Applications Being Planned*
* In the next 12 months.
Technology applications currently being planned for use* include:
21% Service Lifecycle Management (SLM)
20% Business Intelligence / Analytics
20% Knowledge Management (KM) Application
20% Remote Asset Monitoring / Management
19% Service Forecasting and Planning Application
18% Workforce Management System (WMS)
17% Product Lifecycle Management (PLM)
14% Enterprise Asset Management System (EAMS)
13% Spare Parts / Inventory Management
13% Contract Management
13% Warranty Management
12% Enterprise Resource Planning (ERP)
12% Financial / Accounting System (separate from ERP)
9% Customer Relationship Management (CRM)

Research Powered By
Putting Things in Perspective: Emerging Technologies Currently Used
Emerging Technologies currently being used by Services Organizations include:

Research Powered By
Putting Things in Perspective: Emerging Technologies Currently Used
Emerging Technologies currently being used by Services Organizations include:
35% New, dedicated mobile applications
35% Self-learning applications for technicians
33% Remote asset monitoring / management
28% Leveraging the Internet of Things (IoT) and telemetry data
28% Machine learning and other advanced analytics platforms
28% Work order / shop floor management systems for your dealers
14% Augmented Reality (AR) / Virtual Reality (VR) / Mixed Reality (MR)
13% Artificial Intelligence

Research Powered By
Putting Things in Perspective: Emerging Technologies Planned for Use*
Emerging Technologies planned for use* by Services Organizations include:
* In the next 12 months.

Research Powered By
Putting Things in Perspective: Emerging Technologies Planned for Use*
Emerging Technologies planned for use* by Services Organizations include:
35% New, dedicated mobile applications
33% Leveraging the Internet of Things (IoT) and telemetry data
30% Self-learning applications for technicians
27% Remote asset monitoring / management
23% Machine learning and other advanced analytics platforms
21% Augmented Reality (AR) / Virtual Reality (VR) / Mixed Reality (MR)
21% Artificial Intelligence
18% Work order / shop floor management systems for your dealers
* In the next 12 months.

Research Powered By
Nearly Half (45%) of Respondents Are Clearly Looking at Investing in Predictive Maintenance Systems; Most Are Unsure – But None Rule It Out
n = 204
29%
16%55%
Yes - CurrentlyInvestingYes - Planning toInvestDon't Know /Unsure
(Percent Response)
n = 90
Currently Investing / Planning to Invest*
* In the next 12 months.

Research Powered By
(Percent Response)
0.0 20.0 40.0 60.0 80.0 100.0
To Make Manufacturing Changes
To Improve Depot Repair Processes
To Improve Equipment / Part ReturnProcesses
To Make Product Design Changes
To Improve Field Service Processes
34
37
45
45
70
The Top Uses of Data/Information Collected from Warranty Events Are:
n = 83

Research Powered By
(Percent Response)
0.0 20.0 40.0 60.0 80.0 100.0
To Make Changes to Product Documentation
To Make Purchasing Decisions
For Inclusion in Regular Corporate FinancialPerformance Reporting
To Make Supplier Selection
25
25
27
30
Other Key Uses of Data/Information Collected from Warranty Events Are:
n = 83

Research Powered By
(Percent Response)
0.0 20.0 40.0 60.0 80.0 100.0
Claims Administration
Entire Warranty Process, incl. Service Mgmt.
Spare Parts Planning and Inventory Mgmt.
Returns / Exchange Management
Overall Repair Operations
Reverse Logistics
21
25
29
37
37
37
Roughly One-Third of Respondents Outsource Their RL, Repair & Returns …
n = 52

Research Powered By
(Percent Response)
0.0 20.0 40.0 60.0 80.0 100.0
Claims Administration
Entire Warranty Process, incl. Service Mgmt.
Spare Parts Planning and Inventory Mgmt.
Returns / Exchange Management
Overall Repair Operations
Reverse Logistics
21
25
29
37
37
37
And, One-Quarter Currently Outsource Their Entire Warranty Process …
n = 52

Research Powered By
(Percent Response)
0.0 20.0 40.0 60.0 80.0 100.0
Spare Parts Planning and Inventory Mgmt.
Overall Repair Operations
Returns / Exchange Management
Reverse Logistics
Entire Warranty Process, incl. Service Mgmt.
Claims Administration
10
10
12
17
17
23
Plans for Outsourcing* Are Greatest for Claims Administration …
n = 52
* In the next 12 months.

Research Powered By
(Percent Response)
0.0 20.0 40.0 60.0 80.0 100.0
Spare Parts Planning and Inventory Mgmt.
Overall Repair Operations
Returns / Exchange Management
Reverse Logistics
Entire Warranty Process, incl. Service Mgmt.
Claims Administration
10
10
12
17
17
23
But Somewhat Less So for All Other Individual WM Activities …
n = 52
* In the next 12 months.

Research Powered By
(Percent Response)
0.0 20.0 40.0 60.0 80.0 100.0
Spare Parts Planning and Inventory Mgmt.
Overall Repair Operations
Returns / Exchange Management
Reverse Logistics
Entire Warranty Process, incl. Service Mgmt.
Claims Administration
10
10
12
17
17
23
However, an Additional One-in-Six Plan to Outsource* All WM Activities …
n = 52
* In the next 12 months.

Research Powered By
(Percent Response)
0.0 20.0 40.0 60.0 80.0 100.0
Specific Geographic Experience
Data / Info Reporting Capabilities
Warranty Management Experience
Industry Reputation
Cost of Services
38
41
47
47
70
When Evaluating Outsourced Support, Cost of Services Is Most Important:
n = 66

Research Powered By
(Percent Response)
0.0 20.0 40.0 60.0 80.0 100.0
Specific Geographic Experience
Data / Info Reporting Capabilities
Warranty Management Experience
Industry Reputation
Cost of Services
38
41
47
47
70
When Evaluating Outsourced Support, Cost of Services Is Most Important:
n = 66

Research Powered By
(Percent Response)
0.0 20.0 40.0 60.0 80.0 100.0
Specific Geographic Experience
Data / Info Reporting Capabilities
Warranty Management Experience
Industry Reputation
Cost of Services
38
41
47
47
70
… Followed By Industry Reputation and WM Experience …
n = 66

Research Powered By
(Percent Response)
0.0 20.0 40.0 60.0 80.0 100.0
Specific Geographic Experience
Data / Info Reporting Capabilities
Warranty Management Experience
Industry Reputation
Cost of Services
38
41
47
47
70
… And Data/Info Reporting and Geographic Experience:
n = 66

Research Powered By
(Percent Response)
0.0 20.0 40.0 60.0 80.0 100.0
Business Vision and Strategy
Specific Vertical Market Experience
Global Footprint / Coverage
Ability to Integrate with Installed Systems
Financial Viability
26
29
29
32
33
Other Outsourced Partner Evaluation Factors also Include:
n = 56

Research Powered By
Primary Key Performance Indicators (KPIs) Currently Being Used Are …
Primary KPIs currently being used by Services Organizations are:

Research Powered By
Primary Key Performance Indicators (KPIs) Currently Being Used Are …
Primary KPIs currently being used by Services Organizations are:
68% Customer Satisfaction
54% Total Warranty Costs

Research Powered By
Primary Key Performance Indicators (KPIs) Currently Being Used Are …
Primary KPIs currently being used by Services Organizations are:
68% Customer Satisfaction
54% Total Warranty Costs
42% Warranty Costs, Per Product
41% Warranty incidents, Per Product
35% Claims Processing Time
34% In-Warranty Product Return Rate
29% Total Revenues from Extended Warranty Sales
29% Time from Defect Detection to Correction
27% Claims Processing Costs
26% Analysis Cycle Time
25% Time from Product Sale to Defect Detection
12% Re-imbursement Cycle time (i.e., from Suppliers)
11% Warranty Reserve Variation

Research Powered By
The Singular Most Important KPIs Currently Being Used Are …
The most important KPIs currently being used by Services Organizations are:

Research Powered By
The Singular Most Important KPIs Currently Being Used Are …
The most important KPIs currently being used by Services Organizations are:
35% Customer Satisfaction Cited by 35%Cited by 35%

Research Powered By
The Singular Most Important KPIs Currently Being Used Are …
The most important KPIs currently being used by Services Organizations are:
35% Customer Satisfaction
19% Total Warranty Costs Cited by 35%Cited by 19%
Cited by 35%Cited by 35%

Research Powered By
The Singular Most Important KPIs Currently Being Used Are …
The most important KPIs currently being used by Services Organizations are:
35% Customer Satisfaction
19% Total Warranty Costs
14% Time from Defect Detection to Correction
Cited by 35%Cited by 19%
Cited by 35%Cited by 35%
Cited by 35%Cited by 14%

Research Powered By
The Singular Most Important KPIs Currently Being Used Are …
The most important KPIs currently being used by Services Organizations are:
35% Customer Satisfaction
19% Total Warranty Costs
14% Time from Defect Detection to Correction
8% Warranty Costs, Per Product
5% In-Warranty Product Return Rate
5% Claims Processing Costs
4% Claims Processing Time
4% Warranty incidents, Per Product
3% Time from Product Sale to Defect Detection
1% Total Revenues from Extended Warranty Sales
1% Re-imbursement Cycle time (i.e., from Suppliers)
0% Warranty Reserve Variation
0% Analysis Cycle Time
Cited by 35%Cited by 19%
Cited by 35%Cited by 35%
Cited by 35%Cited by 14%

Research Powered By
Current KPI Values Reflect Mixed Performance Among Respondents …
Mean KPI values currently being used to measure Warranty Management performance appear to be reasonably high – but somewhat lower than in past years:

Research Powered By
Current KPI Values Reflect Mixed Performance Among Respondents …
Mean KPI values currently being used to measure Warranty Management performance appear to be reasonably high – but somewhat lower than in past years:
82% Customer Satisfaction

Research Powered By
Current KPI Values Reflect Mixed Performance Among Respondents …
Mean KPI values currently being used to measure Warranty Management performance appear to be reasonably high – but somewhat lower than in past years:
82% Customer Satisfaction (Down from 85% in 2016)

Research Powered By
Current KPI Values Reflect Mixed Performance Among Respondents …
Mean KPI values currently being used to measure Warranty Management performance appear to be reasonably high – but somewhat lower than in past years:
82% Customer Satisfaction (Down from 85% in 2016)
8.9 Days Warranty Claims Processing Time

Research Powered By
Current KPI Values Reflect Mixed Performance Among Respondents …
Mean KPI values currently being used to measure Warranty Management performance appear to be reasonably high – but somewhat lower than in past years:
82% Customer Satisfaction (Down from 85% in 2016)
8.9 Days Warranty Claims Processing Time (Increased from 5.57 Days in 2016)
25% Services Profitability

Research Powered By
Current KPI Values Reflect Mixed Performance Among Respondents …
Mean KPI values currently being used to measure Warranty Management performance appear to be reasonably high – but somewhat lower than in past years:
82% Customer Satisfaction (Down from 85% in 2016)
8.9 Days Warranty Claims Processing Time (Increased from 5.57 Days in 2016)
25% Services Profitability (Not measured in 2016)
However, many Organizations are still not attaining even Industry Average levels of performance:
56% Not attaining at least 90% Customer Satisfaction

Research Powered By
Current KPI Values Reflect Mixed Performance Among Respondents …
Mean KPI values currently being used to measure Warranty Management performance appear to be reasonably high – but somewhat lower than in past years:
82% Customer Satisfaction (Down from 85% in 2016)
8.9 Days Warranty Claims Processing Time (Increased from 5.57 Days in 2016)
25% Services Profitability (Not measured in 2016)
However, many Organizations are still not attaining even Industry Average levels of performance:
56% Not attaining at least 90% Customer Satisfaction29% Not attaining at least 80% Customer Satisfaction
78% Not Attaining 2 Days or Less Warranty Claims Processing Time

Research Powered By
Current KPI Values Reflect Mixed Performance Among Respondents …
Mean KPI values currently being used to measure Warranty Management performance appear to be reasonably high – but somewhat lower than in past years:
82% Customer Satisfaction (Down from 85% in 2016)
8.9 Days Warranty Claims Processing Time (Increased from 5.57 Days in 2016)
25% Services Profitability (Not measured in 2016)
However, many Organizations are still not attaining even Industry Average levels of performance:
56% Not attaining at least 90% Customer Satisfaction29% Not attaining at least 80% Customer Satisfaction
78% Not Attaining 2 Days or Less Warranty Claims Processing Time49% Not Attaining 4 Days or Less Warranty Claims Processing Time

Research Powered By
Current KPI Values Reflect Mixed Performance Among Respondents …
Mean KPI values currently being used to measure Warranty Management performance appear to be reasonably high – but somewhat lower than in past years:
82% Customer Satisfaction (Down from 85% in 2016)
8.9 Days Warranty Claims Processing Time (Increased from 5.57 Days in 2016)
25% Services Profitability (Not measured in 2016)
However, many Organizations are still not attaining even Industry Average levels of performance:
56% Not attaining at least 90% Customer Satisfaction29% Not attaining at least 80% Customer Satisfaction
78% Not Attaining 2 Days or Less Warranty Claims Processing Time49% Not Attaining 4 Days or Less Warranty Claims Processing Time24% Taking 15 Days or More for Warranty Claims Processing Time
59% Not attaining at least 30% Services Profitability

Research Powered By
Current KPI Values Reflect Mixed Performance Among Respondents …
Mean KPI values currently being used to measure Warranty Management performance appear to be reasonably high – but somewhat lower than in past years:
82% Customer Satisfaction (Down from 85% in 2016)
8.9 Days Warranty Claims Processing Time (Increased from 5.57 Days in 2016)
25% Services Profitability (Not measured in 2016)
However, many Organizations are still not attaining even Industry Average levels of performance:
56% Not attaining at least 90% Customer Satisfaction29% Not attaining at least 80% Customer Satisfaction
78% Not Attaining 2 Days or Less Warranty Claims Processing Time49% Not Attaining 4 Days or Less Warranty Claims Processing Time24% Taking 15 Days or More for Warranty Claims Processing Time
59% Not attaining at least 30% Services Profitability45% Not attaining at least 20% Services Profitability

Research Powered By
Current KPI Values Reflect Mixed Performance Among Respondents …
Mean KPI values currently being used to measure Warranty Management performance appear to be reasonably high – but somewhat lower than in past years:
82% Customer Satisfaction (Down from 85% in 2016)
8.9 Days Warranty Claims Processing Time (Increased from 5.57 Days in 2016)
25% Services Profitability (Not measured in 2016)
However, many Organizations are still not attaining even Industry Average levels of performance:
56% Not attaining at least 90% Customer Satisfaction29% Not attaining at least 80% Customer Satisfaction
78% Not Attaining 2 Days or Less Warranty Claims Processing Time49% Not Attaining 4 Days or Less Warranty Claims Processing Time24% Taking 15 Days or More for Warranty Claims Processing Time
59% Not attaining at least 30% Services Profitability45% Not attaining at least 20% Services Profitability25% Not attaining at least 10% Services Profitability

Research Powered By
Overall, Things Appear to Be Getting Better for WM Organizations …
Mean KPI values for most key Warranty Management activities reflect year-over-year growth in most cases – although somewhat lower than in past years:

Research Powered By
Overall, Things Appear to Be Getting Better for WM Organizations …
Mean KPI values for most key Warranty Management activities reflect year-over-year growth in most cases – although somewhat lower than in past years:
Warranty Claims Processing Time (30% Improvement; 21% Decline = 1.4:1 Ratio)
Reimbursement Cycle Time (18% Improvement; 8% Decline = >2:1 Ratio)
Revenue from Extended Warranties (47% Improvement; 13% Decline = >3:1 Ratio)
Warranty Claims Processing Costs (40% Decline; 15% Improvement = ~3:1 Ratio)

Research Powered By
Comparative Year-over-Year KPIs of Organizations with “New” WM Implementations, Upgraded WM Solutions vs. All Others:
Mean KPI values reflect a significant advantage for those organizations that have implemented “new” Warranty Management solutions within the past three years vs. those that have merely upgraded existing WM solutions:
Key Performance “New” WM Upgraded AllIndicator (KPI) Implementation WM Solution Others
Warranty Claims 8.8% -2.5% 0.1%Processing Time
Reimbursement 1.7% -1.6% -0.3%Cycle Time(from Suppliers)
Revenues from 12.5% 10.8% 4.4%Extended WarrantySales

Research Powered By
0.0 20.0 40.0 60.0 80.0 100.0
Not at All Satisfied
Not Very Satisfied
Neither Satisfied nor Dissatisfied
Very Satisfied
Extremely Satisfied
3
12
44
30
12
Only 42% of Users Are Presently Satisfied with their Primary WM Vendor …
n = 77
(Percent Response)

Research Powered By
0.0 20.0 40.0 60.0 80.0 100.0
Not at All Satisfied
Not Very Satisfied
Neither Satisfied nor Dissatisfied
Very Satisfied
Extremely Satisfied
3
12
44
30
12
Only 42% of Users Are Presently Satisfied with their Primary WM Vendor …
n = 77
42%
(Percent Response)

Research Powered By
0.0 20.0 40.0 60.0 80.0 100.0
Not at All Satisfied
Not Very Satisfied
Neither Satisfied nor Dissatisfied
Very Satisfied
Extremely Satisfied
3
12
44
30
12
… But, Only 12% Are Extremely Satisfied:
n = 77
42%
(Percent Response)
12%

Research Powered By
Even More (44%) Are Fairly Complacent About Their Primary Vendors:
(Percent Response)
0.0 20.0 40.0 60.0 80.0 100.0
Not at All Satisfied
Not Very Satisfied
Neither Satisfied nor Dissatisfied
Very Satisfied
Extremely Satisfied
3
12
44
30
12
n = 77

Research Powered By
However, Roughly 1-in-6 are Not Very/Not at All Satisfied:
15%
(Percent Response)
0.0 20.0 40.0 60.0 80.0 100.0
Not at All Satisfied
Not Very Satisfied
Neither Satisfied nor Dissatisfied
Very Satisfied
Extremely Satisfied
3
12
44
30
12
n = 77

Research Powered By
Key Takeaways from SFG℠’s 2017 Warranty Management Benchmark:
Roughly two-thirds (66%) of FSOs currently manage Service as a Profit Center
More than half (57%) are presently using a partially automated WM process;however, about one-fifth (20%) are fully automated
Annual Warranty Budgets are largely expected to increase for 2017
Principal Drivers currently influencing today’s WM initiatives are:
First, Customer-focused (i.e., Satisfaction, Retention, Improved WM Services) Second, Product Quality-focused (i.e., Dealing w/ Inferior/Deficient Product Quality) Third, Cost/Revenue-focused (i.e., Defect-related Costs, Increased Service Revenues)
Top challenges facing today’s WM initiatives are:
Identification of root causes of product failures Product quality issues Claims processing time and accuracy
Roughly half of Organizations (49%) have implemented and/or upgraded their respective WM solutions in the past three years; and, as a result, have realized:
9% improvement in Warranty Claims Processing Time 6% improvement in Supplier/Vendor Recovery (as a % of Total WM Expenses)

Research Powered By
Key Takeaways from SFG℠’s 2017 Warranty Management Benchmark:
Top uses of the data/information collected from Warranty-related events are to:
Improve Field Service processes Make Product Design changes Improve Equipment / Part Return processes Improve Depot Repair Processes Make Manufacturing changes
Primary Key Performance Indicators (KPIs) currently being used for WM are:
Customer Satisfaction Total Warranty Costs Warranty Costs, per Product / Warranty Incidents, per Product
Roughly half of Organizations are not currently attaining at least 90% Customer Satisfaction (56%), 4 Days or Less Warranty Claims Processing Times (49%), or at least 20% Services Profitability (45%)
Revenues from Extended Warranty Sales have increased somewhat over the past year; but so have Warranty Claims Processing costs
Less than half (42%) of Organizations are “Very Satisfied or Extremely Satisfied” with the performance of their Primary WM solution vendor

Research Powered By
Key Takeaways from SFG℠’s 2017 Warranty Management Benchmark:
Organizations that have implemented a “new” Warranty Management solution in the past three years have experienced significantly greater year-over-year improvements than those who have merely upgraded their existing WM systems (and vs. All Others) in:
Warranty Claims Processing Time
Reimbursement Cycle Time (from Suppliers)
Revenues from Extended Warranty Sales
A majority of Warranty Chain managers (54%) cite Best Practices as the one Services-related area they are most interested in understanding better
This bodes extremely well for the future well-being of Warranty Chain Management

Research Powered By
SFG℠ Contact Information
Bill Pollock, President
Strategies For Growth℠
(610) 399-9717
www.s4growth.com
@PollockOnService

Research Powered By
Rohit Lohan, Senior Product Manager, Tavant Technologies

Research Powered By 142
Choose Right Solution/Product
Self-service
Support Business Growth
Collaborate withpartners
Intelligent
Closed loopIOT readyCustomer focusBeyond Wnty

Research Powered By 143
Tavant Warranty Products
Tavant Warranty- Enterprise ready- On-premise- Closed Loop Wnty Mgmt
Tavant Warranty on Demand- Enterprise ready- Cloud based- Closed Loop Wnty Mgmt
Tavant Manufacturing Analytics Platform- Exhaustive schema- Cloud based- Plug-n-play architecture
Product Registration Service Center

Research Powered By 144
Tavant Warranty
Inventory Management
(product registration, PDI, transfers, inspections)
Recall/field improvement campaigns
Claims Management
(warranty, EW, PM, service)
Supplier Recovery
Integrated part returns
Fraud Scoring
CORE
(rules, workflow, BI)
Highly Configurable
Closed loop Wnty Management
Modular & Integrated

Research Powered By 145
Tavant Warranty on Demand
Salesforce Platform(customer information)
Sales Cloud, Service Cloud, Marketing Cloud
(Capture customer touch points)
Tavant Warranty On DemandTavant Warranty On Demand
leveraging Force.com cloud environment
Highly Configurable
Customer Focused
Collaboration

Research Powered By
TAVANT Solution
Successful Solution Deployment
Impactful
Flex
ible
146
+
CUSTOMER
Scalable
Industry Experience <Business Nuisances <
Customer Policies <
Warranty Domain Expertise <Best Practices <
Business Analytics Lab <Data Sciences Expertise <
Scalable solution Backbone <
Predictive Analytics Platform
Cost Advantage
Machine Learning Out of box
dashboards
Faster, Better,
Decision Making
Flexible Business Model
Real-time decision
support API
Dedicated Data
Scientists
Tavant Manufacturing Analytics Platform

Research Powered By

Research Powered By
Thank you for attending the WebinarWebinar playback will soon be available through www.tavant.com
Any other questions? Feel free to write to [email protected]