TAURUS Times April'11 E Version - Taurus Mutual Fund Times_… · · 2016-06-14... (Including SIP...
16
TIMES M O N T H LY R E P O R T • M A R C H 2011 Disclaimer: The Ratings are subject to change every month. The Rating is based on primary data provided by respective funds, Value Research does not guarantee the accuracy. Value Research Rating Methodology: The Value Research Ratings are published in Monthly Mutual Fund Performance Report and Mutual Fund Insight. Statutory Details: Sponsor: Trustee: Investment Manager: Taurus Asset Management Company Ltd. Scheme Nature & Objective: Taurus Starshare is an open-end equity scheme with a focus on multi cap stocks. The basic objective of the Scheme is to provide long-term capital appreciation. Emphasis will be on sharing growth through appreciation as well as on distribution of income by way of dividend. Asset Allocation : Equity & Equity Related Instruments: 85% to 100%, Debt Instruments: 0% to 15%, Money Market & other Assets: 0% to 10%. Entry Load: NIL, Exit Load : Up to any amount (Including SIP application): • 1% if exited before 1 year • Nil if exited after 1 year (Switch: Equity to Equity-Exit Load Nil, Equity to Debt-Relevant exit load applicable as mentioned above, Equity to ELSS-Relevant exit load applicable as mentioned above) Risk Factors: All investments in mutual funds and securities are subject to market risks and the NAV of the scheme may go up or down depending upon the factors and forces affecting the securities market. There can be no assurance that the scheme's investment objectives will be achieved. The past performance of the mutual fund is not indicative of the future performance of the scheme. The sponsor is not responsible or liable for any loss resulting from the operation of the scheme beyond the initial contribution of ` 2 Lacs made towards setting up of the mutual fund. Taurus Starshare is only the name of the scheme and does not in any manner indicate the quality of the scheme, its future prospects and returns. There is no guarantee or assurance as to any returns on investments of the unit holders. All dividend distributions are subject to the investment performance of the scheme. The investment made by the scheme is subject to external risks on transferring, pricing, trading volumes, settlement risks etc of securities. Please read the Scheme Information Document, Statement of Additional Information and Key Information Memorandum - cum - Application Form of the scheme carefully before investing. Taurus Mutual Fund has been constituted as a Trust under the Indian Trust Act, 1882. HB Portfolio Ltd. Taurus Investment Trust Company Ltd., • Ranked No. 2 • Flexible investment strategy • Demonstrated Industry leaders • Multi-cap nature • Well diversified in the Multi-cap category by Value Research as on 5th April 2011. (Ranking is on the basis of 1 year return in open-ended equity Multi-cap category of 63 funds) to align with the market cycles. as a part of core portfolio. allows fund manager the flexibility to take calls on potential small mid-caps for generating alpha. across sectors and market-caps. SMS TSS to 72000 22222 E-mail:[email protected] www.taurusmutualfund.com TAX TAX Date NAV Dividend / Unit 26-03-2010 39.66 06-11-2009 39.68 `3/- 10-07-2009 41.48 `5/- `5/- • Dividends in Dividend Plan of the scheme: • Face Value `10/- (Pursuant to the payment of dividend, the NAV of the dividend plan of the Scheme will fall to the extent of payout, and statutory levy, if any.) Net Asset Value as on March 31, 2011 Growth: ` 57.03 Dividend: ` 40.15 This STAR SHARES lot more than just its twinkle... An open-end equity scheme with a focus on multi cap stocks Taurus Starshare
Transcript of TAURUS Times April'11 E Version - Taurus Mutual Fund Times_… · · 2016-06-14... (Including SIP...

TIMESM O N T H L Y R E P O R T • M A R C H 2 0 1 1
Disclaimer: The Ratings are subject to change every month. The Rating is based on primary data provided by respective funds, Value Research does not guarantee the accuracy.
Value Research Rating Methodology: The Value Research Ratings are published in Monthly Mutual Fund Performance Report and Mutual Fund Insight.
Statutory Details: Sponsor: Trustee: Investment Manager: Taurus Asset Management Company Ltd. Scheme Nature & Objective: Taurus Starshare is an open-end equity scheme with a focus on multi cap stocks. The basic objective of the Scheme is to provide long-term capital appreciation. Emphasis will be on sharing growth through appreciation as well as on distribution of income by way of dividend. Asset Allocation : Equity & Equity Related Instruments: 85% to 100%, Debt Instruments: 0% to 15%, Money Market & other Assets: 0% to 10%. Entry Load: NIL, Exit Load : Up to any amount (Including SIP application): • 1% if exited before 1 year • Nil if exited after 1 year (Switch: Equity to Equity-Exit Load Nil, Equity to Debt-Relevant exit load applicable as mentioned above, Equity to ELSS-Relevant exit load applicable as mentioned above) Risk Factors: All investments in mutual funds and securities are subject to market risks and the NAV of the scheme may go up or down depending upon the factors and forces affecting the securities market. There can be no assurance that the scheme's investment objectives will be achieved. The past performance of the mutual fund is not indicative of the future performance of the scheme. The sponsor is not responsible or liable for any loss resulting from the operation of the scheme beyond the initial contribution of 2 Lacs made towards setting up of the mutual fund. Taurus Starshare is only the name of the scheme and does not in any manner indicate the quality of the scheme, its future prospects and returns. There is no guarantee or assurance as to any returns on investments of the unit holders. All dividend distributions are subject to the investment performance of the scheme. The investment made by the scheme is subject to external risks on transferring, pricing, trading volumes, settlement risks etc of securities. Please read the Scheme Information Document, Statement of Additional Information and Key Information Memorandum - cum - Application Form of the scheme carefully before investing.
Taurus Mutual Fund has been constituted as a Trust under the Indian Trust Act, 1882. HB Portfolio Ltd. Taurus Investment Trust Company Ltd.,
• Ranked No. 2
• Flexible investment strategy
• Demonstrated Industry leaders
• Multi-cap nature
• Well diversified
in the Multi-cap category byValue Research as on 5th April 2011.(Ranking is on the basis of 1 year return in open-ended equity Multi-cap
category of 63 funds)
to align withthe market cycles.
as a part of core portfolio.
allows fund manager the flexibilityto take calls on potential small mid-caps forgenerating alpha.
across sectors and market-caps.
SMS TSS to 72000 22222E-mail:[email protected] www.taurusmutualfund.com
TAXTAX
Date NAV Dividend / Unit
26-03-2010 39.66
06-11-2009 39.68 `3/-
10-07-2009 41.48 `5/-
`5/-
• Dividends in Dividend Plan of the scheme:
•
Face Value `10/-
(Pursuant to the payment of dividend, the NAV of the
dividend plan of the Scheme will fall to the extent of
payout, and statutory levy, if any.)
Net Asset Value as on March 31, 2011Growth: ` 57.03 Dividend: ` 40.15
This STAR SHARES lot more than just its twinkle...
An open-end equity scheme with a focus on multi cap stocks
Taurus Starshare

INDEX Page No.
1
2
3
4
5
6
7
8
9
10
11
12
13
TAURUS STARSHARE
AN OPEN-END EQUITY SCHEME WITH A FOCUS ON MULTI CAP STOCKS
TAURUS INFRASTRUCTURE FUND ...............................................................................................................................................................................5
AN OPEN-END EQUITY THEMATIC SCHEME
TAURUS ETHICAL FUND .......................................................................................................................................................................................................6
AN OPEN-END EQUITY ORIENTED SCHEME
TAURUS TAX SHIELD ..............................................................................................................................................................................................................7
AN OPEN-END EQUITY LINKED SAVING SCHEME (ELSS)
TAURUS NIFTY INDEX FUND .......................................................................................................................................................................................... 8AN OPEN-ENDED INDEX LINKED EQUITY SCHEME
TAURUS BONANZA FUND .................................................................................................................................................................................................9
AN OPEN-END EQUITY SCHEME WITH A LARGE CAP FOCUS
TAURUS DISCOVERY FUND ............................................................................................................................................................................................10
AN OPEN-END EQUITY FUND WITH MID CAP AND SMALL CAP FOCUS
TAURUS ULTRA SHORT TERM BOND FUND ....................................................................................................................................................11
AN OPEN-END DEBT SCHEME
TAURUS LIQUID FUND .......................................................................................................................................................................................................12
AN OPEN-END LIQUID SCHEME
TAURUS SHORT TERM INCOME FUND...................................................................................................................................................................13
AN OPEN-END BOND SCHEME
TAURUS GILT FUND .............................................................................................................................................................................................................14
AN OPEN-END GILT SCHEME
TAURUS MIP ADVANTAGE................................................................................................................................................................................................15
AN OPEN - ENDED INCOME SCHEME
TAURUS DYNAMIC INCOME FUND..........................................................................................................................................................................16
AN OPEN ENDED INCOME SCHEME
.................................................................................................................................................................................................................4
HOUSE OF TAURUS
Dear Investor,
It’ s that time of the year when we recap those significant events that shaped the last financial year and which could shed some light on how they tend to influence the year ahead.
The global financial environment continues to be stable with a positive bias, despite the two major worrisome events that were enough to derail global growth: rising oil prices and the earthquake off Japan’ s northeast coast and the subsequent tsunami. Revolutions and the continuing unrest in the Middle-East and North Africa have elevated oil prices to new highs, from about $37 a barrel in December 2008 to about $115 now. Yet, despite the oil-price spike, many of the world economies have continued to demonstrate growth. Job growth in the world’ s largest economy has been steady and the rate of unemployment has slipped to less than 9%. In fact, the past year also saw developed countries display a considerable improvement in market performance. Many emerging markets have also shown strong domestic demand-led growth, particularly India and China. The euro area too is picking up well, with good domestic-growth economies. Overall, the consensus is that the global economy should clock a growth rate of around 3.7 per cent, up 50 basis points over last year.
Still, we cannot ignore negative surprises in store such as higher oil prices and spiraling commodity prices. With prices of many commodities, especially agricultural such as food grains and pulses, near all-time highs, countries like India are particularly vulnerable to slackening growth, brought on by creeping, continuing and intractable inflation. On the other hand, the euro zone is not completely out of the woods yet as the sovereign debt crisis continues to rattle many of Europe’ s smaller economies. Inflation generally tends to inch up, and could push the European Central Bank to raise interest rates in the latter half of this fiscal.
Meanwhile, the mutual fund sector, after whethering the Global upheavals and the Regulatory changes has emerged stronger and is poised to grow at a faster clip from here. In the Union Budget 2010-11, the finance minister proposed allowing foreign individuals who meet the Know-Your-Customer norms to invest in Indian equity schemes. It remains how useful would this be. For fund houses with a good performance track record of managing equity and debt schemes such as yours, FY 12 appears to be a promising year. As the stock markets continue to gain momentum this year since the attractiveness of Indian equities is still robust, expect a healthier performance by equity mutual funds in the year ahead. Besides, rising interest rates should help spike interest in debt funds in coming months.
At Taurus Mutual Fund, we had an exciting business year. We went on to add 3 new Funds to our fund basket, which included Taurus Nifty Index Fund, Taurus MIP Advantage and Taurus Dynamic Income Fund. Our existing Funds kept up consistency in their performance, which is a pure reflection of our investment philosophy and tight risk management processes. Fixed Income business attracted big volumes and played its role in our steady growth. Of course all of this would not have been possible without the unmatchable efforts of my team. We added almost 40 more members across various levels in different functions, pan India and the team is still growing.
Lastly, congratulations to the Indian Cricket Team for bringing home the top cricketing trophy – the World Cup!
Warm regards
Yours truly,
Waqar NaqviChief Executive
FROM THE CEO'S DESK

4
PE
RF
OR
MA
NC
E
TAURUS STARSHARE - AN OPEN-END EQUITY SCHEME WITH A FOCUS ON MULTI CAP STOCKS
Date of Allotment: Jan 29, 1994.Dividend Option introduced on Jan 1, 2009.
Net Asset Value (NAV) ` 40.15 (D), 57.03 (G) per unit.AAUM: ` 164.64 Cr.Minimum Application Amount: ` 5000/- & multiples of ` 1000/ thereof.Sharpe Ratio: 0.57Standard Deviation:16.24Alpha: 4.84Beta: 0.9(The above measures have been calculated by taking month end NAV for 1year period from 31st March, 2010 to 31st March, 2011.)NAV Calculation: All business days.Fund Manager: Mr. Sadanand ShettyRegistrar & Transfer Agent: M/s. Karvy Computershare Private Ltd.
FUND DATA As on 31st March 2011
RISK FACTOR: Mutual Fund investments are subject to market risks. Please read the Scheme Information Document carefully before investing.
Investment Objective
The basic objective of the Scheme is to provide long-term capital appreciation. Emphasis will be on sharing growth through appreciation as well as on distribution of income by way of dividend.
Sale & repurchase on all business days.
Tax-free dividends in the hands of investors, no Gift Tax, no Wealth Tax as per the present Income Tax Act.
1 Year 15.10 8.15 3 Years 3.17 7.175 Years 10.78 10.98Since Inception 10.66 9.50
Past performance may or may not be sustained in future.
Note: Returns are calculated on compounded annualised basis for a period of more than one year and absolute basis for a period less than or equal to one year, with reinvestment of dividends/ bonus, if any.
` 5 per unit dividend in July 2009` 3 per unit dividend in November 2009` 5 per unit dividend in March 2010
SCHEME FEATURES
DIVIDEND HISTORY
Liquidity
Tax Benefits
Period Returns (%)
*Benchmark Index
NAV BSE 200*
Entry Load - NILExit Load - Up to any amount (Including SIP application):
1% if exited before 1 year Nil if exited after 1 year
Switch: Equity to Equity-Exit Load Nil, Equity to Debt-Relevant exit load applicable as mentioned above, Equity to ELSS-Relevant exit load applicable as mentioned above.
LOAD STRUCTURE
••
*Industry exposure, scrip aum, asset aum scrip investment, asset investment not available as listing is awaited.
Fund Manager's Comment: A mutlicap diversified fund, Taurus Star Share is focused on investing across the market cap segment. In the present current scenario, portfolio allocation has good mix of large cap stocks and mid cap stocks. Cash level is maintained at comfortable level. Top sector in terms of allocation are Banking, IT and Capital Goods. 0.61
0.690.79
0.870.95
1.451.961.96
2.682.732.83
3.583.793.86
4.324.40
6.596.60
7.31
9.5012.60
14.73
Cement
Pharmaceuticals
Auto Ancillaries
Retailing
Non - Ferrous MetalsDiversified
Healthcare Services
Ferrous Metals
GasTelecom - Services
Construction Project
Industrial Products
Pesticides
FinanceOil
Auto
Consumer Non Durables
Fertilisers
Petroleum ProductsIndustrial Capital Goods
Software
Banks
0.00 5.00 10.00 15.00 20.00
EQUITY SECTOR ALLOCATION
Name of the scrip % to Net Assets
PORTFOLIO As on 31st March, 2011
Name of the scrip % to Net Assets
Infosys Technologies Ltd. 8.05
Reliance Industries Ltd. 7.31
ITC Ltd. 4.98
Oil & Natural Gas Corporation Ltd. 4.32
Siemens Ltd. 4.14
State Bank of India 3.97
Housing Development Finance Cor Ltd.3.86
Rallis India Ltd. 3.79
ICICI Bank Ltd. 3.54
Coromandel International Ltd. 3.46
Tata Chemicals Ltd. 3.14
Punjab National Bank 3.13
HCL Technologies Ltd. 2.89
Bharat Heavy Electricals Ltd. 2.86
Larsen & Toubro Ltd. 2.83
Bharti Airtel Ltd. 2.73
Gail (India) Ltd. 2.68
Mahindra & Mahindra Ltd. 2.66
Thermax India Ltd. 2.50
Union Bank of India 2.19
Bharat Forge Ltd. 2.12
Tata Steel Ltd. 1.96Apollo Hospitals Enterprise Ltd. 1.96
Wipro Ltd. 1.65
Titan Industries Ltd. 1.61
Jain Irrigation Systems Ltd. 1.46
Hindustan Unilever Ltd. 1.45
Bank of Baroda 1.35
Maruti Suzuki India Ltd. 1.06
Pantaloon Retail (India) Ltd. 0.87
Exide Industries Ltd. 0.79
Dr. Reddy's Laboratories Ltd. 0.69
Tata Motors Ltd. 0.69
Grasim Industries Ltd. 0.61
Sterlite Industries Ltd. 0.61
HDFC Bank Ltd. 0.55
Hindalco Industries Ltd. 0.34
*Wellwin Industry Limited 0.00
Cash & Others 5.19
Total - Equity 94.81
TOTAL 100.00
0.00
10.00
20.00
30.00
40.00
50.00
60.00
70.00Ap
r - 10
May -
10
Jun - 1
0
Jul - 1
0
Aug -
10
Sep -
10
Oct -
10
Nov -1
0
Dec -1
0
Jan- 1
1
Feb - 1
1
Mar -1
1
NAV movement in the last one year vis-a-vis BSE 200
Taurus Starshare BSE 200

5
RISK FACTOR: Mutual Fund investments are subject to market risks. Please read the Scheme Information Document carefully before investing.
TAURUS INFRASTRUCTURE FUND - AN OPEN-END EQUITY THEMATIC SCHEMEP
ER
FO
RM
AN
CE
Investment Objective
To provide capital appreciation and income distribution to unitholders by investing pre-dominantly in equity and equity related securities of the companies belonging to infrastructure sector, it's related industries inclusive of suppliers of capital goods, raw materials and other supportive services to infrastructure companies and balance in debt and money market instruments.
Sale and repurchase on all business days.
Tax-free dividends in the hands of investors, no Gift Tax, no Wealth Tax as per the present Income Tax Act.
NAV BSE 200*
1 Year (4.19) 8.15
3 Years 4.62 7.17
Since Inception 7.15 12.50
Past performance may or may not be sustained in future.
Note: Returns are calculated on a compounded annualised basis for a period of more than one year and absolute basis for a period less than or equal to one year, with reinvestment of dividends/ bonus, if any.
SCHEME FEATURES
Liquidity
Tax Benefits
Period Returns (%)
*Benchmark Index
FUND DATA As on 31st March 2011
Date of Allotment: Mar 5, 2007.Net Asset Value (NAV) ` 12.43 (D), 13.25 (G) per unit.AAUM: 17.93 Cr.Minimum Application Amount: `Sharpe Ratio: -0.37Standard Deviation:17.64 Alpha: --10.93Beta: 0.91(The above measures have been calculated by taking month end NAV for 1year period from 31st March, 2010 to 31st March, 2011.)
NAV Calculation: All business days.Fund Manager: Mr. Sadanand ShettyRegistrar & Transfer Agent: M/s. Karvy Computershare Private Ltd.
5000/- & multiples of 1000/ thereof.
Entry Load - NILExit Load - Up to any amount (Including SIP application):
1% if exited before 1 year Nil if exited after 1 year
Switch: Equity to Equity-Exit Load Nil, Equity to Debt-Relevant exit load applicable as mentioned above, Equity to ELSS-Relevant exit load applicable as mentioned above.
LOAD STRUCTURE
••
Fund Manager's Comment: The budget has given a necessary boost to the infrastructure financing in terms of the project and opening up new avenues to avail finance. Our Investment pattern favours the companies which have a strong execution track record and sustained balance sheet liquidity. Portfolio consists of stocks which are into niche segment within the infrastructure space.
` 1 per unit dividend in Aug. 2010.
DIVIDEND HISTORY
Media & Entertainment
Auto
Ferrous Metals
Engineering Services
Trading
Minerals/mining
Banks
Industrial Products
Transportation
Construction Project
Telecom - Services
Non - Ferrous Metals
Oil
Petroleum Products
Finance
Power
Gas
Industrial Capital
1.46
2.02
2.23
2.52
2.96
4.36
4.50
4.58
5.27
5.91
6.15
6.17
6.66
7.19
7.68
7.71
7.72
9.31
0.00 2.00 4.00 6.00 8.00 10.00
EQUITY SECTOR ALLOCATION
Name of the scrip % to Net Assets
PORTFOLIO As on 31st March 2011
Name of the scrip % to Net Assets
Reliance Industries Ltd. 7.19
Bharti Airtel Ltd. 6.15
Bharat Heavy Electricals Ltd. 5.07
Power Finance Corporation Limited4.51
COAL India Ltd. 4.36
PTC India Limited 4.33
Sterlite Industries Ltd. 4.32
Larsen & Toubro Ltd. 3.82
Oil & Natural Gas Corporation Ltd. 3.80
Mundra Port & Special Eco Zone Ltd.3.44
GVK Power & Infrastructure Ltd. 3.37
Gujarat State Petronet Ltd. 3.28
Infrastructure Development Finance Co. Ltd.3.17
Adani Enterprises Ltd. 2.96
Cairn India Limited 2.86
Crompton Greaves Ltd. 2.62
VA Tech Wabag Ltd. 2.52
Petronet Lng Ltd 2.43
ICICI Bank Ltd. 2.41
Tata Steel Ltd. 2.23
Bharat Forge Ltd. 2.10
State Bank of India 2.09
NCC Ltd. 2.09
Tata Motors Ltd. 2.02
Gail (India) Ltd. 2.01
Hindalco Industries Ltd. 1.86
Mercator Lines Limited 1.83
Praj Industries Limited 1.62
Kirloskar Oil Engines Ltd. 1.52
Hathway Cable And Datacom Limited1.46
Jain Irrigation Systems Ltd. 0.97
Total - Equity 94.40
Cash & Others 5.60
Total 100.00
NAV movement in the last one year vis-a-vis BSE 200
0.002.004.006.008.00
10.0012.0014.0016.0018.0020.00
Apr -
10
May -
10
Jun -
10
Jul -1
0
Aug -
10
Se0p
-10
Oct -1
0
Nov -
10
Dec -
10
Jan -
11
Feb -
11
Mar -
11
BSE 200Taurus Infrastructure Fund

PE
RF
OR
MA
NC
E
6
RISK FACTOR: Mutual Fund investments are subject to market risks. Please read the Scheme Information Document carefully before investing.
Date of Allotment: April 6, 2009
AAUM: ` 26.13 Cr.Minimum Application Amount: 5000/- & multiples of Re. 1/- thereof.
Sharpe Ratio: 0.37Standard Deviation: 13.57Alpha: 1.67Beta: 0.69(The above measures have been calculated by taking month end NAV for 1year period from 31st March, 2010 to 31st March, 2011.)
NAV Calculation: All business days.Fund Manager: Mr. Sadanand ShettyRegistrar & Transfer Agent: M/s. Karvy Computershare Private Ltd.
FUND DATA As on 31st March, 2011
Net Asset Value (NAV) ` 15.64 (D), 23.16 (G), 23.15 (B) per unit.
Investment Objective
To provide capital appreciation and income distribution to unitholders through investment in a diversified portfolio of equities, which are based on the principles of Shariah.
Sale & repurchase on all business days.
Tax free dividends in the hands of Investor, No Gift Tax, No Wealth Tax as per the present Income Tax Act.
1 Month 5.66 7.94
3 Months (6.84) (6.68)
6 Months (7.51) (4.06)
1 Year 9.45 5.12
Since Inception 52.71 34.53
Past performance may or may not be sustained in future.
Note: Returns are calculated on a compounded annualised basis for a period of more than one year and absolute basis for a period less than or equal to one year, with reinvestment of dividends/ bonus, if any.
1.80 per unit dividend in Dec. 2010, 2 per unit dividend in Feb. 2010, ` 1 per unit dividend in September 2009, ` 1.5 per unit dividend in July 2009.
SCHEME FEATURES
DIVIDEND HISTORY
Liquidity
Tax Benefits
Period Returns (%)
*Benchmark Index
NAV S&P CNX 500 Shariah Index*
Entry Load- NILExit Load - Up to any amount (Including SIP application):
1% if exited before 1 year Nil if exited after 1 year
Switch: Equity to Equity-Exit Load Nil, Equity to Debt-Relevant exit load applicable as mentioned above, Equity to ELSS - Relevant exit load applicable as mentioned above.
LOAD STRUCTURE
••
Fund Manager's Comment: The fund objective is to invest in companies which are compliant with Shariah Investment laws. The fund focuses on creating wealth by investing in selected companies which are part of the S&P CNX Shariah Index. The fund is expected to perform well as the stocks selected are relatively immune to the interest rate risk in the system.
Name of the scrip % to Net Assets
PORTFOLIO As on 31st March, 2011
Name of the scrip % to Net Assets
Infosys Technologies Ltd. 7.20
Reliance Industries Ltd. 6.22
Oil & Natural Gas Corporation Ltd.5.11
Havells India Limited 4.98
Apollo Hospitals Enterprise Ltd. 4.90
Bharti Airtel Ltd. 4.21
Thermax India Ltd. 4.13
PTC India Limited 3.29
Engineers India Ltd. 3.29
Rallis India Ltd. 3.11
HCL Technologies Ltd. 3.10
Maruti Suzuki India Ltd. 3.03
Sterlite Industries Ltd. 2.86
Bharat Heavy Electricals Ltd. 2.77
Bajaj Auto Limited 2.76
Exide Industries Ltd. 2.65
Indraprastha Gas Limited 2.49
Redington India Ltd. 2.31
Mundra Port & Special Eco Zone Ltd.2.26
Dabur India Ltd. 2.23
Siemens Ltd. 2.15
IPCA Laboratories Limited 2.10
GVK Power & Infrastructure Ltd. 2.05
Titan Industries Ltd. 2.02
Adani Enterprises Ltd. 2.01
Greaves Cotton Ltd. 1.93
Cairn India Limited 1.66
Voltas Ltd. 1.21
Gail (India) Ltd. 1.18
Cipla Ltd. 1.17
NCC Ltd. 0.74
Total - Equity 91.13
Cash & Others 8.87
TOTAL 100.00
Industrial ProductsConstruction Project
Trading
TransportationHardware
Auto AncillariesNon - Ferrous Metals
PesticidesPharmaceuticals
EngineeringGas
Telecom - ServicesConsumer Non Durables
Healthcare Services
Consumer DurablesPower
AutoPetroleum Products
Oil
Industrial Capital Goods
Software
1.931.952.01
2.262.31
2.652.86
3.113.273.29
3.674.214.26
4.904.98
5.345.79
6.226.77
9.0510.30
0.00 5.00 10.00 15.00
EQUITY SECTOR ALLOCATION
TAURUS ETHICAL FUND - AN OPEN-END EQUITY ORIENTED SCHEME
Apr -1
0
May -
10
Jun -1
0
Jul -1
0
Aug -
10
Se0p
-10
Oct -1
0
Nov -
10
Dec -1
0
Jan - 1
1
Feb -
11
Mar -
11
0.00
5.00
10.00
15.00
20.00
25.00
30.00
NAV movement in the last one year vis-a-vis S&P CNX 500 Shariah
Taurus Ethical Fund
S&P CNX 500 Shariah

TAURUS TAX SHIELD - AN OPEN-END EQUITY LINKED SAVING SCHEME (ELSS)P
ER
FO
RM
AN
CE
7
RISK FACTOR: Mutual Fund investments are subject to market risks. Please read the Scheme Information Document carefully before investing.
Investment Objective
To provide long term capital appreciation over the life of the scheme through investment pre-dominantly in equity shares, besides tax benefits.
Sale on all business days. As per Income Tax Laws, the redemption facility is available after a lock-in period of 3 years from the date of investment.
As per Section 80C of the Income Tax Act, an individual or a HUF is allowed deduction from income to an amount upto a maximum of Rs. 1 Lakh by investment in the scheme. Tax -free dividends in the hands of investors.
NAV BSE 200*
3 Years 14.07 7.17
5 Years 13.87 10.98
Since Inception 11.92 13.72
Past performance may or may not be sustained in future.
*Benchmark Index
Note: Returns are calculated on a compounded annualised basis for a period of more than one year and absolute basis for a period less than or equal to one year, with reinvestment of dividends/ bonus, if any.
Growth plan: 3.5 per unit in Dec. 2005, 1.6 per unit in Feb. 2004, 1.1 per unit in Sept. 2003, Dividend plan: 1.25 per unit in Mar. 2011, 1.25 per unit in Feb. 2011, 2 per unit in Dec. 2010, 2.25 per unit in Mar. 2010, 2 per unit in Feb. 2010, 1.5 per unit in Jan. 2010, 1 per unit in
Nov. 2009, `1 per unit in Mar. 2009, 1 per unit in Jan. 2009, 1 per unit in Dec. 2008.
SCHEME FEATURES
DIVIDEND HISTORY
Liquidity
Tax Benefits
Period Returns (%)
1 Year 12.83 8.15
` `
Dividend Option introduced on May 6, 2008.
Net Asset Value (NAV) 16.72 (D), 35.70 (G) per unit.AAUM: 63.87 Cr.Minimum Application Amount: ` 500/- & multiples of 500/ thereof
Sharpe Ratio: 0.36Standard Deviation: 16.11 Alpha: 1.62Beta: 0.85(The above measures have been calculated by taking month end NAV for 1year period from 31st March, 2010 to 31st March, 2011.)
NAV Calculation: All business days.Fund Manager: Mr. Sadanand ShettyRegistrar & Transfer Agent: M/s. Karvy Computershare Private Ltd.
FUND DATA As on 31st March, 2011
Date of Allotment: Mar 31, 1996.
.
Entry Load - NILExit Load - Up to any amount (Including SIP application): NA
Switch: Taurus Tax Shield to other scheme after lock - in period of 3 years exit load Nil.
LOAD STRUCTURE
Best Equity Tax Planning Fund by Businessworld for the year 2009-10
Fund Manager's Comment: Investment objective of the scheme is focused on taking long term calls and value creation. The long time horizon helps us to take position in stocks which are expected to deliver huge returns in long term. Top sector by allocation are IT, Banking and Capital Goods segment. Focus of the portfolio is to invest in companies with stable cash flows and sustainable operating margins.
Name of the scrip % to Net Assets
PORTFOLIO As on 31st March, 2011
Name of the scrip % to Net Assets
Infosys Technologies Ltd. 7.70
Reliance Industries Ltd. 7.45
Bharti Airtel Ltd. 4.80
ITC Ltd. 4.43
Housing Development Finance Cor Ltd. 4.41
Oil & Natural Gas Corporation Ltd. 4.40
Tata Chemicals Ltd. 3.99
State Bank of India 3.75
ICICI Bank Ltd. 3.63
HDFC Bank Ltd. 3.47
Tata Motors Ltd. 3.45
Mahindra & Mahindra Ltd. 3.08
Maruti Suzuki India Ltd. 2.98
Bharat Forge Ltd. 2.94
Gail (India) Ltd. 2.76
Bharat Heavy Electricals Ltd. 2.52
Bajaj Auto Limited 2.38
Larsen & Toubro Ltd. 2.05
Bank of Baroda 2.00
Exide Industries Ltd. 1.88
HCL Technologies Ltd. 1.70
Chambal Fertilisers & Chemicals Ltd. 1.65
Axis Bank Limited 1.59
Sterlite Industries Ltd. 1.58
Engineers India Ltd 1.35
Vijaya Bank 1.33
Network 18 Media And Investments Ltd. 1.23
Tata Steel Ltd. 1.10
Grasim Industries Ltd. 1.08
Hindustan Unilever Ltd. 1.07
Cipla Ltd. 0.94
Hathway Cable And Datacom Limited0.86
NCC Ltd. 0.83
PTC India Limited 0.61
Shriram Transport Finance Co Ltd. 0.51
Apollo Hospitals Enterprise Ltd. 0.48
Sundaram Fasteners Ltd. 0.45
Indian Hotels Company Ltd. 0.44
Mundra Port & Special Eco Zone Ltd. 0.40
Andhra Bank Ltd. 0.39
Max India Limited 0.35
Cash & Others 6.01
Total - Equity 93.99
Total 100.00
EQUITY SECTOR ALLOCATION
0.400.440.480.610.860.941.071.081.101.351.58
2.342.522.762.88
3.294.404.43
4.805.64
6.157.45
9.3911.89
16.14
0.00 5.00 10.00 15.00 20.00
TransportationHotels
Healthcare ServicesPower
Media & EntertainmentPharmaceuticals
DiversifiedCement
Ferrous MetalsEngineering
Non - Ferrous MetalsAuto Ancillaries
Industrial Capital GoodsGas
Construction ProjectIndustrial Products
OilConsumer Non Durables
Telecom - ServicesFertilisers
FinancePetroleum Products
SoftwareAuto
Banks
NAV movement in the last one year vis-a-vis BSE 200
Apr -
10
May -
10
Jun -
10
Jul -1
0
Aug -
10
Se0p
-10
Oct -1
0
Nov -
10
Dec -
10
Jan -
11
Feb -
11
Mar -
11
0.005.00
10.0015.00
20.0025.00
30.0035.00
40.00
45.00
Taurus Tax ShieldBSE 200
0.54
0.62
1.16
1.66
2.55
2.72
2.80
2.87
3.03
3.35
4.31
4.33
4.90
5.37
6.34
7.13
10.32
14.02
19.53
Construction
Minerals/mining
Gas
Diversified
Industrial Capital Goods
Cement
Telecom - Services
Non - Ferrous Metals
Oil
Pharmaceuticals
Power
Ferrous Metals
Construction Project
Consumer Non Durables
Finance
Auto
Petroleum Products
Software
Banks
0.00 5.00 10.00 15.00 20.00 25.00
8
RISK FACTOR: Mutual Fund investments are subject to market risks. Please read the Scheme Information Document carefully before investing.
PE
RFO
RM
AN
CE
Date of Allotment: June 19, 2010Net Asset Value (NAV) ` 11.09 (D), 11.09 (G) per unit.AAUM: ` 1.33 Cr.Minimum Application Amount: ` 5000/- & in multiples of 1000/ thereof.NAV Calculation: All business days.Fund Manager: Mr. Sadanand ShettyRegistrar & Transfer Agent: M/s. Karvy Computershare Private Ltd.
FUND DATA As on 31st March, 2011
Entry Load - NILExit Load - Up to any amount (Including SIP application): NA
Switch: Exit Load - NIL
LOAD STRUCTURE
Name of the scrip % to Net Assets
PORTFOLIO As on 31st March, 2011
Name of the scrip % to Net Assets
Reliance Industries Limited 9.88Infosys Technologies Ltd. 8.69ICICI Bank Ltd. 7.14ITC Ltd. 5.37Housing Development Finance Cor Ltd.5.06Larsen & Toubro Ltd. 4.90HDFC Bank Ltd. 4.64State Bank of India 3.95Tata Consultancy Services Ltd. 3.34Tata Motors Ltd. 2.42Bharti Airtel Ltd. 2.40Tata Steel Ltd. 2.27Oil & Natural Gas Corporation Ltd. 2.18Axis Bank Limited 2.01Mahindra & Mahindra Ltd. 1.84Bharat Heavy Electricals Ltd. 1.81Hindustan Unilever Ltd. 1.66Jindal Steel & Power Ltd. 1.51Hindalco Industries Ltd. 1.49Sterlite Industries Ltd. 1.37NTPC Ltd. 1.37Wipro Ltd. 1.35Tata Power Co. Ltd. 1.20Gail (India) Ltd. 1.16Dr. Reddy's Laboratories Ltd. 1.14Bajaj Auto Limited 1.10Sun Pharmaceutical Industries Ltd. 0.93
Maruti Suzuki India Ltd. 0.92Infrastructure Development Finance Co.Ltd.0.91Cipla Ltd. 0.91Kotak Mahindra Bank Ltd. 0.90Punjab National Bank 0.90Grasim Industries Ltd. 0.87Cairn India Limited 0.85Hero Honda Motors Ltd. 0.84Power Grid Corporation Ltd. 0.80Siemens Ltd. 0.74Ambuja Cements Limited 0.67HCL Technologies Ltd. 0.64Sesa Goa Ltd. 0.62Jaiprakash Associates Ltd. 0.59ACC Ltd. 0.58Steel Authority of India Ltd. 0.55DLF Limited 0.54Reliance Infrastructure Limited 0.54Bharat Petroleum Corporation Ltd. 0.44Reliance Power Limited 0.40Reliance Communications Ltd. 0.40Ranbaxy Laboratories Ltd. 0.38Reliance Capital Ltd. 0.36
Cash & Others 2.45Total - Equity 97.55
Total 100.00
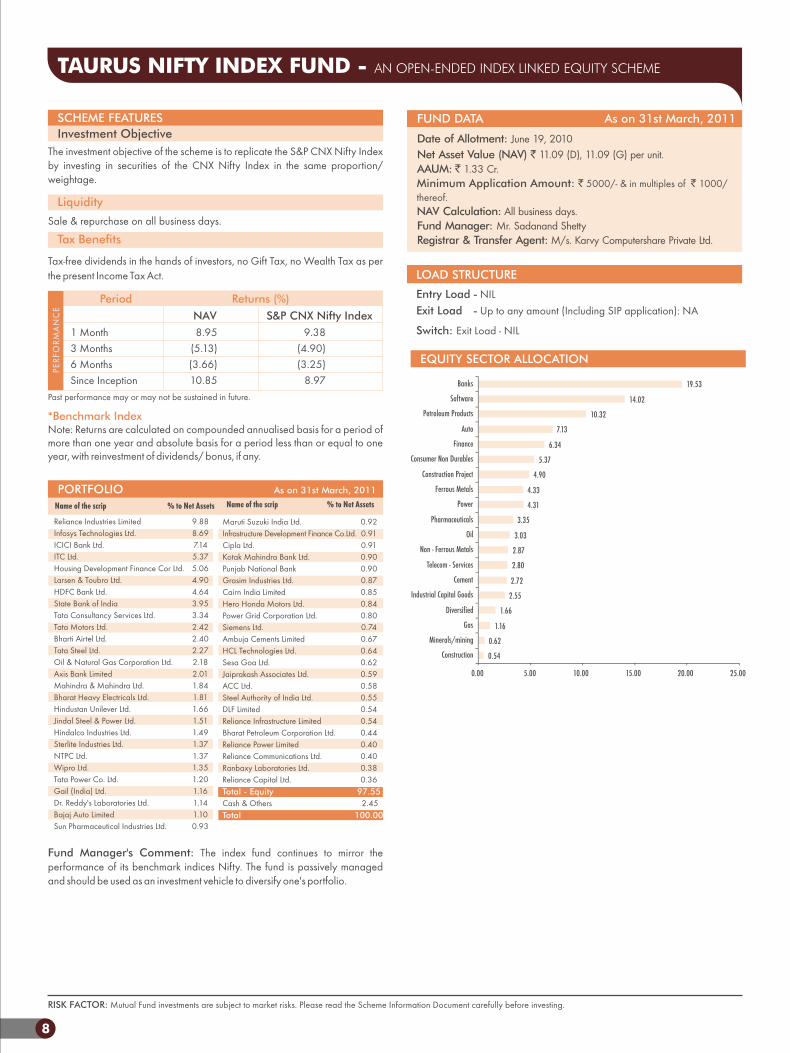
Fund Manager's Comment: The index fund continues to mirror the performance of its benchmark indices Nifty. The fund is passively managed and should be used as an investment vehicle to diversify one's portfolio.
Investment Objective
The investment objective of the scheme is to replicate the S&P CNX Nifty Index by investing in securities of the CNX Nifty Index in the same proportion/ weightage.
Sale & repurchase on all business days.
Tax-free dividends in the hands of investors, no Gift Tax, no Wealth Tax as per the present Income Tax Act.
NAV S&P CNX Nifty Index
1 Month 8.95 9.38 3 Months (5.13) (4.90)6 Months (3.66) (3.25)Since Inception 10.85 8.97
Past performance may or may not be sustained in future.
Note: Returns are calculated on compounded annualised basis for a period of more than one year and absolute basis for a period less than or equal to one year, with reinvestment of dividends/ bonus, if any.
SCHEME FEATURES
Liquidity
Tax Benefits
Period Returns (%)
*Benchmark Index
EQUITY SECTOR ALLOCATION
TAURUS NIFTY INDEX FUND - AN OPEN-ENDED INDEX LINKED EQUITY SCHEME

9
RISK FACTOR: Mutual Fund investments are subject to market risks. Please read the Scheme Information Document carefully before investing.
0.570.590.950.990.991.19
1.551.87
2.873.443.693.88
4.354.914.91
5.716.306.35
6.9111.30
14.56
0.00 5.00 10.00 15.00 20.00
GasPowerHotels
Minerals/miningEngineering
Non - Ferrous MetalsConstruction Project
TransportationDiversified
CementOil
Telecom - ServicesFerrous Metals
AutoPharmaceuticals
Consumer Non DurablesPetroleum Products
FinanceIndustrial Capital Goods
BanksSoftware
Investment Objective
Taurus Bonanza Fund is an open-end growth scheme. The investment objective is to provide investors long-term capital appreciation. Investments shall be primarily in Equity and Equity related instruments that offer scope for long-term capital appreciation. The Fund will also be invested in debt and money market instruments.
Sale & repurchase on all business days.
Tax-free dividends in the hands of investors, no Gift Tax, no Wealth Tax as per the present Income Tax Act.
NAV BSE 100*
1 Year 10.77 8.55
3 Years 1.78 7.04
5 Years 5.68 11.32
Since Inception 12.07 11.87
Past performance may or may not be sustained in future.
Note: Returns are calculated on a compounded annualised basis for a period of more than one year and absolute basis for a period less than or equal to one year, with reinvestment of dividends/ bonus, if any.
Bonus in the ratio of 1:3 in October 2003. Dividend - ` 2.5 per unit in July, 2006 from growth option
SCHEME FEATURES
Liquidity
Tax Benefits
Period Returns (%)
*Benchmark Index
FUND DATA As on 31st March, 2011
Date of Allotment: Feb 28, 1995.Dividend Option introduced on May 6, 2008.
Net Asset Value (NAV) 43.48 (D), 43.19 (G) per unit.AAUM: 33.72 Cr.Minimum Application Amount: `Sharpe Ratio: 0.29Standard Deviation: 15.23 Alpha: 0.15Beta: 0.88(The above measures have been calculated by taking month end NAV for 1year period from 31st March, 2010 to 31st March, 2011.)
NAV Calculation: All business days.Fund Manager: Mr. Sadanand ShettyRegistrar & Transfer Agent: M/s. Karvy Computershare Private Ltd.
5000/- & multiples of 1000/- thereof.
Entry Load- NILExit Load - 1% if exited up to 1 year, Nil if exited after 1 year (Including SIP application):
LOAD STRUCTURE
PE
RF
OR
MA
NC
E
Fund Manager's Comment: Taurus Bonanza is a large cap fund, oriented to create long term wealth by investing in large cap companies. The investment philosophy is driven by the bottom up approach and focuses on the sustainable margin and visible growth. Our sectoral exposure remained broad based while we continue to take active bets in IT and Capital Goods, Banks and Consumer Discretionary Segments. Cash level is also maintained so as to take any opportunity.
Name of the scrip % to Net Assets
PORTFOLIO As on 31st March, 2011
Name of the scrip % to Net Assets
Infosys Technologies Ltd. 7.91
Reliance Industries Ltd. 6.30
ITC Ltd. 5.71
Housing Development Finance Cor Ltd. 5.41
Bharat Heavy Electricals Ltd. 4.59
HDFC Bank Ltd. 4.57
Tata Consultancy Services Ltd. 4.45
Tata Steel Ltd. 4.35
State Bank of India 4.18
Bharti Airtel Ltd. 3.88
Oil & Natural Gas Corporation Ltd. 3.69
Sun Pharmaceutical Industries Ltd. 3.50
Grasim Industries Ltd. 3.44
Hindustan Unilever Ltd. 2.87
Wipro Ltd. 2.20
ICICI Bank Ltd. 1.90
Mahindra & Mahindra Ltd. 1.88
Mundra Port & Special Eco Zone Ltd 1.87
Tata Motors Ltd. 1.72
Larsen & Toubro Ltd. 1.55
Cipla Ltd. 1.42
Bajaj Auto Limited 1.31
Thermax India Ltd. 1.26
Crompton Greaves Ltd. 1.06
Engineers India Ltd 0.99
Coal India Ltd 0.99
Indian Hotels Company Ltd. 0.95
Hindalco Industries Ltd. 0.81
Axis Bank Limited 0.64
PTC India Limited 0.59
Gujarat State Petronet Ltd. 0.57
Power Finance Corporation Limited 0.50
Infrastructure Development Finance Co. Ltd.0.44
Sterlite Industries Ltd. 0.38
Cash & Others 12.10
Total - Equity 87.90
Total 100.00
EQUITY SECTOR ALLOCATION
TAURUS BONANZA FUND - AN OPEN-END EQUITY SCHEME WITH A LARGE CAP FOCUS
Taurus Bonanza Fund BSE 100
NAV movement in the last one year vis-a-vis BSE 100
0.00
10.00
20.00
30.00
40.00
50.00
60.00Ap
r -10
May -
10
Jun -
10
Jul -1
0
Aug -
10
Se0p
-10
Oct -1
0
Nov -
10
Dec -
10
Jan -
11
Feb -
11
Mar -
11
PE
RF
OR
MA
NC
E
10
RISK FACTOR: Mutual Fund investments are subject to market risks. Please read the Scheme Information Document carefully before investing.
TAURUS DISCOVERY FUND - AN OPEN-END EQUITY FUND WITH MID CAP AND SMALL CAP FOCUS
Date of Allotment: Sep 5, 1994.Net Asset Value (NAV) ` 14.05 (D), 14.03 (G) per unit.AAUM: 25.47 Cr.Minimum Application Amount: `Sharpe Ratio: -0.34Standard Deviation: 18.98 Alpha: -10.71Beta: 0.88(The above measures have been calculated by taking month end NAV for 1year period from 31st March, 2010 to 31st March, 2011.)
NAV Calculation: All business days.Fund Manager: Mr. Sadanand ShettyRegistrar & Transfer Agent: M/s. Karvy Computershare Private Ltd.
FUND DATA As on 31st March, 2011
5000/- & multiples of 1000/- thereof.
Investment Objective
The primary objective of the Scheme is to identify and select low priced stocks through price discovery mechanism, which would broadly include: • To capitalise on available opportunity on growth potential offered by undervalued penny stocks. • Such stocks being low priced and if dividend paying, decent dividend yield will give desired cushion in the volatile capital market. • Lower side risk is minimum in such investments. • Many of such cases where investment will be made, may be turnaround cases, therefore, greater potential for improvement in NAV.
Sale & repurchase on all business days.
Tax-free dividends in the hands of investors, no Gift Tax, no Wealth Tax as per the present Income Tax Act.
NAV CNX Midcap Index*
1 Month 5.33 9.09
1 Year (4.43) 4.35
3 Years (12.92) 8.81
5 Years (1.98) 10.92
Since Inception 2.06 8.12
Past performance may or may not be sustained in future.
Note: Returns are calculated on a compounded annualised basis for a period of more than one year and absolute basis for a period less than or equal to one year, with reinvestment of dividends/ bonus, if any.
SCHEME FEATURES
Liquidity
Tax Benefits
Period Returns (%)
*Benchmark Index
Entry Load - NILExit Load - Up to any amount (Including SIP application):
• 1% if exited before 1 year • Nil if exited after 1 year
Switch: Equity to Equity-Exit Load Nil, Equity to Debt-Relevant exit load applicable as mentioned above, Equity to ELSS-Relevant exit load applicable as mentioned above.
LOAD STRUCTURE
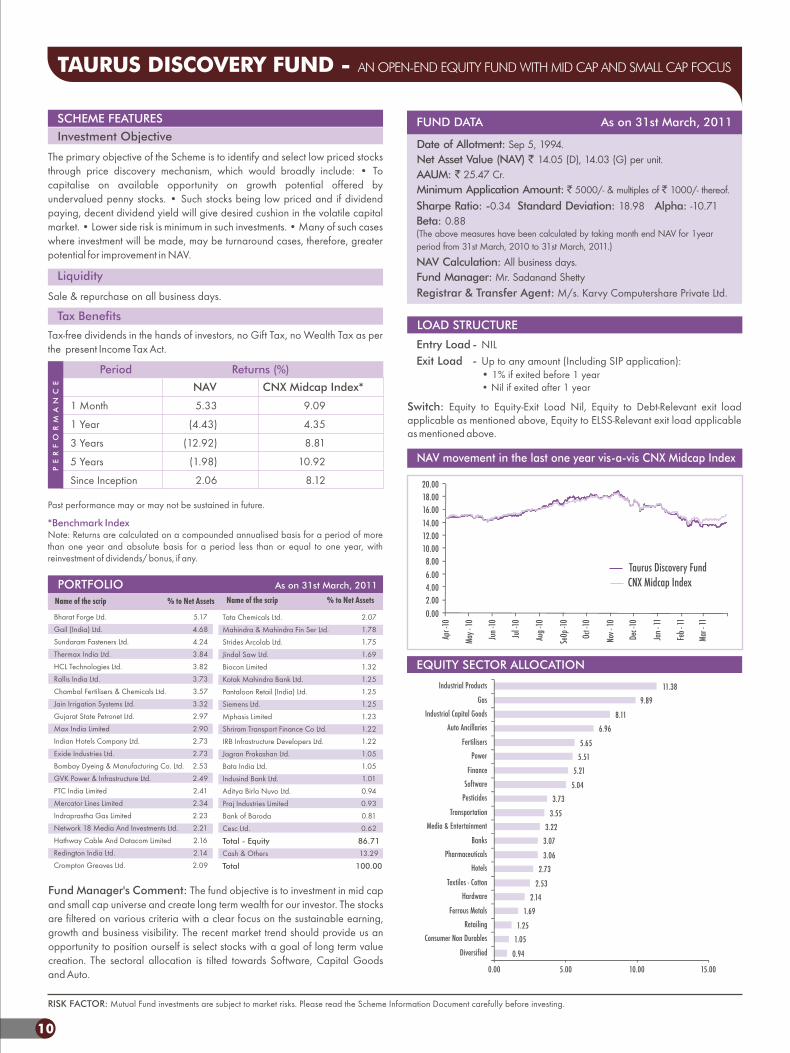
Fund Manager's Comment: The fund objective is to investment in mid cap and small cap universe and create long term wealth for our investor. The stocks are filtered on various criteria with a clear focus on the sustainable earning, growth and business visibility. The recent market trend should provide us an opportunity to position ourself is select stocks with a goal of long term value creation. The sectoral allocation is tilted towards Software, Capital Goodsand Auto.
EQUITY SECTOR ALLOCATION
Name of the scrip % to Net Assets
PORTFOLIO As on 31st March, 2011
Tata Chemicals Ltd. 2.07
Mahindra & Mahindra Fin Ser Ltd. 1.78
Strides Arcolab Ltd. 1.75
Jindal Saw Ltd. 1.69
Biocon Limited 1.32
Kotak Mahindra Bank Ltd. 1.25
Pantaloon Retail (India) Ltd. 1.25
Siemens Ltd. 1.25
Mphasis Limited 1.23
Shriram Transport Finance Co Ltd. 1.22
IRB Infrastructure Developers Ltd. 1.22
Jagran Prakashan Ltd. 1.05
Bata India Ltd. 1.05
Indusind Bank Ltd. 1.01
Aditya Birla Nuvo Ltd. 0.94
Praj Industries Limited 0.93
Bank of Baroda 0.81
Cesc Ltd. 0.62
Total - Equity 86.71
Cash & Others 13.29
Total 100.00
Name of the scrip % to Net Assets
Bharat Forge Ltd. 5.17
Gail (India) Ltd. 4.68
Sundaram Fasteners Ltd. 4.24
Thermax India Ltd. 3.84
HCL Technologies Ltd. 3.82
Rallis India Ltd. 3.73
Chambal Fertilisers & Chemicals Ltd. 3.57
Jain Irrigation Systems Ltd. 3.32
Gujarat State Petronet Ltd. 2.97
Max India Limited 2.90
Indian Hotels Company Ltd. 2.73
Exide Industries Ltd. 2.73
Bombay Dyeing & Manufacturing Co. Ltd.2.53
GVK Power & Infrastructure Ltd. 2.49
PTC India Limited 2.41
Mercator Lines Limited 2.34
Indraprastha Gas Limited 2.23
Network 18 Media And Investments Ltd. 2.21
Hathway Cable And Datacom Limited2.16
Redington India Ltd. 2.14
Crompton Greaves Ltd. 2.09
Diversified
Consumer Non Durables
Retailing
Ferrous Metals
Hardware
Textiles - Cotton
Hotels
Pharmaceuticals
Banks
Media & Entertainment
Transportation
Pesticides
Software
Finance
Power
Fertilisers
Auto Ancillaries
Industrial Capital Goods
Gas
Industrial Products
0.94
1.05
1.25
1.69
2.14
2.53
2.73
3.06
3.07
3.22
3.55
3.73
5.04
5.21
5.51
5.65
6.96
8.11
9.89
11.38
0.00 5.00 10.00 15.00
NAV movement in the last one year vis-a-vis CNX Midcap Index
Taurus Discovery FundCNX Midcap Index
0.002.004.006.008.00
10.0012.0014.0016.0018.0020.00
Apr -
10
May -
10
Jun -
10
Jul -1
0
Aug -
10
Se0p
-10
Oct -1
0
Nov -
10
Dec -
10
Jan -
11
Feb -
11
Mar -
11

11
RISK FACTOR: Mutual Fund investments are subject to market risks. Please read the Scheme Information Document carefully before investing.
Individuals Corporate NRI
Short Term 12.5%+ 7.5% Bond Fund surcharge+surcharge+surcharge+
3% cess 3% cess 3% cess
Total Tax 13.841%22.145%13.841%
Money Market and 25%+ 7.5%25%+ 7.5%25%+ 7.5%Liquid Schemes surcharge+surcharge+surcharge+
3% cess 3% cess 3% cess
Total Tax 27.681%27.681%27.681%
20%+ 7.5% 12.5%+ 7.5%
Investment Objective
To generate returns with higher liquidity and low volatility from a portfolio of money market and debt instruments. However, there is no assurance that the investment objective of the scheme will be realised.
Sale & repurchase on all business days.
SCHEME FEATURES
Tax Benefits for Dividend Distribution
Liquidity
Fund Manager's Comment: Liquidity situation hardened in March because of tax outflows. The accruals of the scheme increased because of rise in short term rates and incremental flows/maturities were redeployed at higher levels and we also maintained lower cash holdings. While the proportion of bank assets increased in March, we also increased the average maturity of the portfolio on anticipation of a sharp fall in short term rates. We continued to deliver consistent performance during the previous month. We would continue to have a judicious mix of assets in order to deliver a consistent optimal performance.
LOAD STRUCTURE
Entry Load Exit LoadNIL • Retail Plan: Nil
• Institutional Plan: Nil• Super Institutional Plan: Nil
Switch: Exit Load NIL.
PE
RF
OR
MA
NC
E
FUND DATA As on 31st March, 2011
CRISIL Rated AAAf FundDate of Allotment: December 1, 2008.Net Asset Value (NAV):Retail ` 1,001.7360 (D), 1,145.7300 (G), 1,003.0940 (W) per unit.Institutional 1,001.7367 (D), 1,149.0994 (G) per unit.Super Institutional ` 1,001.7390 (D), 1,153.5587 (G) per unit.Average Maturity Period: 0.44 years.AAUM: ` 738.05 Cr.Retail: Sharpe Ratio: 11.6 Standard Deviation: 0.18 Alpha: 2.13 Beta: 0.02Institutional: Sharpe Ratio:12.06 Standard Deviation: 0.19 Alpha: 2.22 Beta: 0.02Super Institutional: Sharpe Ratio:12.59 Standard Deviation: 0.19Alpha:2.32Beta: 0.02Minimum Application Amount:Retail Plan: 5,000/- per application and thereafter in multiplesof 1,000/-. thereofInstitutional Plan: 1 cr. per application and thereafter inmultiples of ` 1000/- thereof.Super Institutional Plan: 5 crs. per application and thereafter in multiples of ` 1000/- thereof.Additional Subscription Amount:Retail Plan: 1,000/- per application and thereafter in multiples of ` 1,000/-.Institutional Plan: 1lakh per application and thereafter inmultiples of ` 1000/-.Super Institutional Plan: 1lakh per application and thereafter in multiples of ` 1000/-.Fund Manager: Mr. Rahul Pal & Mr. Pankaj Jain (Co - Fund Manager)Registrar & Transfer Agent: M/s. Karvy Computershare Private Ltd.
Rated
AAAf by CRISIL
NAV Crisil LiquidFund Index*
Retail Institutional SuperInstitutional
3 Months 2.14 2.17 2.19 1.96
6 Months 3.99 4.04 4.10 3.71
1 Year 6.80 6.90 7.01 6.21
Since Inception 6.01 6.14 6.32 5.51
The past performance may or may not be sustained in future.
Note: (1) Returns are calculated on a compounded annualised basis for a period of more than one year and absolute basis for a period less than or equal to one year, with reinvestment of dividends/bonus, if any.
Period Returns (%)
*Benchmark Index:
Name of the scrip % to Net Assets
PORTFOLIO As on 31st March, 2011
Name of the scrip % to Net Assets
CDs Rating
Central Bank of India P1+22.11
State Bank of India P1+7.99
State Bank of Bikaner & Jaipur P1+6.86
Bank of India P1+6.84
State Bank of Hyderabad P1+3.14
TOTAL CDs 46.95
CBs Rating
Fullerton India Credit Co. Ltd. LAA+14.89
India Infoline Investment Serv Ltd.A1+7.55
Reliance Capital Ltd. AAA2.99
TOTAL CBs 25.43
ZCBs Rating
DHFL Holding Pvt Ltd. PR1+19.34
TOTAL ZCBs 19.34
PTCs
CLSS 17 TRUST 2011 SERIES APR1+(SO)15.26
Originator - Kotak Mahindra Prime Ltd.Underlying Asset Exposure - Borrow for general corporate loan
TOTAL PTCs 15.26
Mutual Fund Units
Taurus Fixed Maturity Plan 120 Days Series 2 - Gr 2.15
Taurus Fixed Maturity PlanSeries D 370 Days- Gr 1.83
TOTAL Mutual Fund Units 3.98
CBLO Transaction -10.96
TOTAL 100.00
TAURUS ULTRA SHORT TERM BOND FUND - AN OPEN-END DEBT SCHEME
Face Value changed from ` 10 to 1000 w.e.f. 20th Feb., 2010. Historical NAV adjusted as per new Face value of ` 1000
1040
1060
1080
1100
1120
1140
1160
Apr -
10
May -
10
Jun -
10
Jul -1
0
Aug -
10
Se0p
-10
Oct -1
0
Nov -
10
Dec -
10
Jan -
11
Feb -
11
Mar -
11NAV movement in the last one year vis-a-vis Crisil Liquid Fund Index
Taurus Short Term Bond Fund -Ultra Super Insti Crisil Liquid Fund Index

12
RISK FACTOR: Mutual Fund investments are subject to market risks. Please read the Scheme Information Document carefully before investing.
Rated
AAAf by CRISIL
PE
RF
OR
MA
NC
E
FUND DATA As on 31st March, 2011
Institutional and Super Institutional plan introduced w.e.f. 26th Sep, 2008
1,001.2175 (D), 1,288.3705 (G) per unit.
Institutional ` 1,000.0639 (D), 1,076.7509 (G), per unit.
Super Institutional ` 1,000.0639 (D), 1,055.1831 (G), 1,001.7882 (W) per unit.
Average Maturity Period: 0.20 years.
AAUM: ` 1,321.99 Cr.Minimum Application Amount:
Retail Plan: ` 5,000/- per application and thereafter in multiplesof ` 1,000/- thereof.
Institutional Plan: ` 1 cr. per application and thereafter inmultiples of 1000/- thereof.
Super Institutional Plan: ` 5 crs. per application and thereafter in multiples of 1000/- thereof.
Additional Subscription Amount:
Retail Plan: ` 1,000/- per application and thereafter in multiplesof ` 1,000/-.
Institutional Plan: ` 1lakh per application and thereafter inmultiples of 1000/-.
Super Institutional Plan: ` 1lakh per application and thereafter in multiples of ` 1000/-.
Sharpe Ratio: 10.4 Standard Deviation: 0.19 Alpha: 1.95Beta: 0.02(The above measures have been calculated by taking month end NAV for 1year period from 31st March, 2010 to 31st March, 2011.)
NAV Calculation: All business days.
Fund Manager: Mr. Pankaj JainRegistrar & Transfer Agent: M/s. Karvy Computershare Private Ltd.
CRISIL Rated AAAf Fund
Date of Allotment: Aug 31, 2006.
Net Asset Value (NAV) `
Investment Objective
To generate steady and reasonable income, with low risk and high level of liquidity from a portfolio of money market securities and high quality debt.
Sale & repurchase on all business days.
Tax free dividends in the hands of investors, no Gift Tax, no Wealth Tax as per the present Income Tax Act.
NAV Crisil Liquid Fund Index*
3 Months 2.02 1.96 6 Months 3.83 3.71 1 Year 6.61 6.21 3 Years 5.54 6.22 Since Inception 5.68 6.53
The past performance may or may not be sustained in future.
Note: Returns are calculated on a compounded annualised basis for a period of more than one year and absolute basis for a period less than or equal to one year, with reinvestment of dividends/ bonus, if any.
SCHEME FEATURES
Liquidity
Tax Benefits
Period Returns (%)
*Benchmark Index:
Face Value changed from `10 to `1000 w.e.f. 20th Feb., 2010. Historical NAV adjusted as per new Face value of ` 1000
Switch: Exit Load NIL.
Fund Manager's Comment: Liquidity situation hardened in March because of tax outflows. The accruals of the scheme increased significantly during the month as the scheme swiftly moved towards high yielding short term papers and had lower cash holdings. We continued to maintain a judicious balance between bank and non bank assets taking into account the risks embedded in the various asset classes. We increased the average maturity of the portfolio down in anticipation of a sharp fall in short term rates in the near future. We continued to deliver consistent performance during the previous month. We would continue to have a judicious mix of assets in order to deliver a consistent optimal performance.
TAURUS LIQUID FUND - AN OPEN-END LIQUID SCHEME
Apr -
10
May -
10
Jun -
10
Jul -1
0
Aug -
10
Se0p
-10
Oct -1
0
Nov -
10
Dec -
10
Jan -
11
Feb -
11
Mar -
11
1160.00
1180.00
1200.00
1220.00
1240.00
1260.00
1280.00
1300.00
NAV movement in the last one year vis-a-vis CrisilLiquid Fund Index
Taurus Liquid FundCrisil Liquid Fund Index
TOTAL 100.00
PORTFOLIO As on 31st March, 2011
Name of the scrip Rating % to Net Assets
CDsUCO Bank P1+ 19.89Canara Bank P1+ 6.81State Bank of Mysore P1+ 5.45Punjab & Sind Bank Ltd. P1+ 5.38Allahabad Bank P1+ 3.13Federal Bank Ltd. P1+ 2.70State Bank of Bikaner & Jaipur P1+ 2.69Punjab National Bank P1+ 2.69Syndicate Bank Ltd. PR1+ 1.08State Bank of India P1+ 0.83Bank of India P1+ 0.14Dhanlaxmi Bank Ltd. P1+ 0.08Total CDs 50.87CPsMuthoot Finance Limited P1+ 10.72Manappuram General Fin & Leasing Ltd P1+ 5.38Ericsson India Private Ltd A1+ 5.38Shree Renuka Sugars Ltd P1+ 5.38Shree Renuka Sugars Ltd A1+ 5.38Religare Finvest Limited A1+ 3.04Future Capital Holdings Ltd PR1+ 2.74India Infoline Ltd. A1+ 0.37Total CPs 38.39CBsDeccan Chronicle Holdings Ltd. PR1+ 5.49Total CBs 4.49ZCBsDHFL Holding Pvt Ltd. PR1+ 3.96TOTAL ZCBs 3.96MUTUAL FUND UNITSTaurus FMP 91 Days- Series E -retail Growth 0.77Cash & Cash Receivables 0.52

13
PE
RF
OR
MA
NC
E
Investment Objective
To generate income and capital appreciation with low volatility by investing in tfolio of short term debt and money market instruments.
Sale & repurchase on all business days.
Tax-free dividends in the hands of investors, no Gift Tax, no Wealth Tax as per the present Income Tax Act.
NAV Crisil Short Term Bond Fund Index*
6 Months 4.16 2.74
1 Year 7.20 5.12
3 Years 4.13 6.91
5 Years 4.77 7.04
Since Inception 5.48 5.77
Past performance may or may not be sustained in future.
*Benchmark index changed from 9th April,2010.
Note: Returns are calculated on a compounded annualised basis for a period of more than one year and absolute basis for a period less than or equal to one year, with reinvestment of dividends/ bonus, if any.
12 per unit dividend in July 2010. 0.30 per unit dividend in February 2002.
SCHEME FEATURES
DIVIDEND HISTORY
a diversified por
Liquidity
Tax Benefits
Period Returns (%)
FUND DATA As on 31st March, 2011
Date of Allotment: Aug 18, 2001.Net Asset Value (NAV) ` 1,531.2029 (D), 1,671.1950 (G) per unit.AAUM: ` 70.62 Cr.Minimum Application Amount: ` 5000/- & multiples of 1000/- thereof.
NAV Calculation: All business days.Fund Manager: Mr. Rahul Pal & Mr. Pankaj Jain (Co - Fund Manager)Registrar & Transfer Agent: M/s. Karvy Computershare Private Ltd.
RISK FACTOR: Mutual Fund investments are subject to market risks. Please read the Scheme Information Document carefully before investing.
Entry Load - NILExit Load - Up to any amount (Including SIP application):
• 0.25% if exited before 1 month• Nil if exited after 1 month
Switch: Debt to debt/Equity - relevant exit load applicable as mentioned above.
LOAD STRUCTURE
TAURUS SHORT TERM INCOME FUND - AN OPEN-END BOND SCHEME(formerly known as Taurus Income Fund)
PORTFOLIO As on 31st March, 2011
TOTAL 100.00
Name of the scrip % to Net Assets
CPs Rating
India Infoline Ltd. A1+ 22.23Fullerton India Credit Co. Ltd. A1+ 17.05Muthoot Finance Limited P1+ 15.49RHC Holding Pvt Ltd. A1+ 11.08Future Capital Holdings Ltd PR1+ 10.78Future Capital Financial Ser Ltd A1+ 10.77Essar Shipping Ports & Logis Ltd PR1 5.79Total CPs 93.18
CDs
Punjab & Sind Bank Ltd P1+ 21.70Axis Bank Limited P1+ 14.82Central Bank of India P1+ 11.09Indian Overseas Bank P1+ 10.35UCO Bank P1+ 6.67State Bank of Hyderabad P1+ 4.73Total CDs 69.35
CBs
Naman Finance & Investment Pvt Ltd. LAAA 11.27Total CBs 11.27
Cash & Cash Receivables -73.80
Fund Manager's Comment: The scheme witnessed a sharp spike in assets under its management in the month. We increased the average maturity of the scheme in anticipation of a sharp fall in short term rates. We intend to decrease the average maturity of the portfolio during the next month and expect the portfolio to be conservatively positioned in its average maturity profile. We would continue to have a judicious mix of assets in order to deliver a consistent optimal performance.
Face Value changed from `10 to `1000 w.e.f. 26th Apr., 2010. Historical NAV adjusted as per new Face value of 1000
1500.001520.001540.001560.001580.001600.001620.001640.001660.001680.00
Apr -
10
May -
10
Jun
-10
Jul -1
0
Aug -
10
Se0p
-10
Oct -
10
Nov -
10
Dec -
10
Jan
- 11
Feb -
11
Mar -
11
NAV movement in the last one year vis-a-vis CrisilShort Term Bond Fund Index
Taurus Short Term Income FundCrisil Short Term Bond Fund Index

14
RISK FACTOR: Mutual Fund investments are subject to market risks. Please read the Scheme Information Document carefully before investing.
PE
RF
OR
MA
NC
E
FUND DATA As on 31sth March, 2011
Date of Allotment: Aug 18, 2001.Net Asset Value (NAV) 14.0637 (D), 14.3563 (G) per unit.AAUM: 0.01 Cr.Minimum Application Amount: ` 5000/- & multiples of ` 1000/- thereof.Sharpe Ratio: -3.49Standard Deviation: 0.29 Alpha: -1.02(The above measures have been calculated by taking month end NAV for 1year period from 31st March, 2010 to 31st March, 2011.)
NAV Calculation: All business days.
Fund Manager: Mr. Pankaj Jain.
Registrar & Transfer Agent: M/s. Karvy Computershare Private Ltd.
Investment Objective
To provide risk free returns to the investors even for a shorter duration through investment in securities issued by Central Government or State Government or any security unconditionally guaranteed by Government of India. Investment will also be made in repos and reverse repos.
Sale & repurchase on all business days.
Tax-free dividends in the hands of investors, no Gift Tax, no Wealth Tax as per the present Income Tax Act.
NAV I-Sec Composite Index
6 Months 2.19 3.52 1 Year 3.16 6.413 Years 2.30 7.835 Years 2.74 7.65Since Inception 3.83 6.89
Past performance may or may not be sustained in future.
Note: Returns are calculated on a compounded annualised basis for a period of more than one year and absolute basis for a period less than or equal to one year, with reinvestment of dividends/bonus, if any.
0.30 per unit dividend declared in the scheme in February 2002.
Fund Manager's Comment:The scheme continues to maintain cash because of its low Asset under Management.
SCHEME FEATURES
Liquidity
Tax Benefits
Period Returns (%)
Entry Load - NILExit Load - Up to any amount (Including SIP application):
• 1% if exited before 1 year • Nil if exited after 1 month
Switch: Debt to debt/Equity - relevant exit load applicable as mentioned above.
LOAD STRUCTURE
PORTFOLIO As on 28th February 2011
TOTAL 100.00
Name of the scrip % to Net Assets
Cash & Cash Receivables 100.00
TAURUS GILT FUND - AN OPEN-END GILT SCHEME
13.20
13.40
13.60
13.80
14.00
14.20
14.40
14.60
14.80
15.00
Apr -
10
May -
10
Jun -
10
Jul -1
0
Aug -
10
Se0p
-10
Oct -1
0
Nov -
10
Dec -
10
Jan -
11
Feb -
11
Mar -
11
NAV movement in the last one year vis-a-vis I SecComposite Index
Taurus Gilt FundI Sec Composite Index

RISK FACTOR: Mutual Fund investments are subject to market risks. Please read the Scheme Information Document carefully before investing.
15
PE
RF
OR
MA
NC
E
Date of Allotment: August 6, 2010Net Asset Value (NAV) ` 10.2217 (D), 10.3644 (G) per unit.AAUM: ` 62.78 Cr.Minimum Investment Amount: a)Growth option: ` 5000/- & multiples of ` 1000/- there ofb)Dividend option: 25000/- & multiples of 1000/- there ofc)Additional purchase: `1000/- & multiples of 1000/- there ofNAV Calculation: All business days.Fund Manager: Mr. Rahul Pal (Debt) & Mr. Sadanand Shetty (Equity &
Gold ETFs)Registrar & Transfer Agent: M/s. Karvy Computershare Private Ltd.
FUND DATA As on 31st March, 2011
Investment Objective
To generate regular income through a portfolio of fixed income securities, Gold ETFs and equity & equity related instruments.
Sale & repurchase on all business days.
Tax-free dividends in the hands of investors, no Gift Tax, no Wealth Tax as per the present Income Tax Act.
Index & 25% Price of Gold
1 Month 1.63 1.653 Months 0.82 0.646 Months 0.73 8.35Since Inception 3.64 7.02
Past performance may or may not be sustained in future.
Note: Returns are calculated on compounded annualised basis for a period of more than one year and absolute basis for a period less than or equal to one year, with reinvestment of dividends/ bonus, if any.
0.05 per unit dividend in October 2010.
SCHEME FEATURES
DIVIDEND HISTORY
Liquidity
Tax Benefits
Period Returns (%)
*Benchmark Index
NAV 75% - CRISIL MIP Blended fund
Investment Amount -
Entry Load - NILExit Load - Up to any amount (Including SIP)
1.00% if exited up to 1 year & Nil if exited after 1 year from the date of allotment
i)A Switch-Out/Withdrawal under SWP will also attract an exit load like any redemption. ii)In case of SIP / STP, the above criteria for Exit Load will be applicable for each installment.iii)Exit load is applicable for all the options under the Scheme by applying First in First basisiv)No Exit Load is chargeable in case of switches made between different Sub-options of the
same option.
LOAD STRUCTURE
Up to any amount
Fund Manager's Comment: The scheme maintained a high allocation to money market instruments having low maturity and thereby the portfolio had a low embedded volatility/risk. We will continue with our strategy of trading in gilts in the scheme when the opportunity arises. We will gradually increase the maturity profile of the debt portion of the scheme as we gain clarity on the direction of rates increase.
Name of the scrip % to Net Assets
PORTFOLIO As on 31st March, 2011
Name of the scrip % to Net Assets
Bharti Airtel Ltd. 1.66
Infosys Technologies Ltd. 1.42
ITC Ltd 1.34
Reliance Industries Ltd. 1.16
State Bank of India 0.77
Tata Motors Ltd. 0.75
Sterlite Industries Ltd. 0.73
Gail (India) Ltd. 0.68
HCL Technologies Ltd. 0.67
Hindustan Unilever Ltd. 0.63
Maruti Suzuki India Ltd. 0.51
Power Finance Corporation Limited0.48
Bharat Heavy Electricals Ltd. 0.35
Andhra Bank Ltd. 0.22
Total - Equity 11.37
CDs
Axis Bank Limited 22.88
State Bank of India 19.99
IDBI Bank Ltd 10.08
State Bank Of Hyderabad 5.81
Total - CDs 58.76
CPs
Essar Shipping Ports & Logis Ltd. 10.06
Total - CPs 10.06
Exchange Traded Funds
Gold Benchmark ETF (Gold Bees) 6.52
Total - Exchange Traded Funds 6.52
Floating Rate Note
Kotak Mahindra Bank Ltd. 0.58
Total - Floating Rate Note 0.58
Cash & Others 12.71
Total 100.00
TAURUS MIP ADVANTAGE - AN OPEN - ENDED INCOME SCHEME
EQUITY SECTOR ALLOCATION
0.35
0.48
0.63
0.68
0.73
0.99
1.16
1.26
1.34
1.66
2.09
0.00 0.50 1.00 1.50 2.00 2.50
Industrial Capital Goods
Finance
Diversified
Gas
Non - Ferrous Metals
Banks
Petroleum Products
Auto
Consumer Non Durables
Telecom - Services
Software

16
RISK FACTOR: Mutual Fund investments are subject to market risks. Please read the Scheme Information Document carefully before investing.
PERFO
RM
AN
CE
Investment Objective
To generate optimal returns with high liquidity through active management of the portfolio by investing in Debt and Money Market Instruments. However, there is no assurance or guarantee that the objectives of the scheme will be realized and the scheme does not assure or guarantee any returns.
Sale & repurchase on all business days.
Tax-free dividends in the hands of investors, no Gift Tax, no Wealth Tax as per the present Income Tax Act.
NAV Composite Bond Fund Index*
1 Month 0.81 0.85
Since Inception 0.40 0.38
Past performance may or may not be sustained in future.
Note: Returns are calculated on a compounded annualised basis for a period of more than one year and absolute basis for a period less than or equal to one year, with reinvestment of dividends/ bonus, if any.
Fund Manager's Comment: The scheme has invested in short duration papers currently and will realign its portfolio as the AUM increases. We will be initiating trading strategies to generate a consistent optimal performance.
SCHEME FEATURES
Liquidity
Tax Benefits
Period Returns (%)
FUND DATA As on 31st March, 2011
Date of Allotment: Jan 25, 2011.Net Asset Value (NAV) ` 10.1219 (D), 10.1219 (G) per unit.AAUM: ` 1.55 Cr.Minimum Application Amount: ` 5000/- & multiples of 1000/- thereof.
NAV Calculation: All business days.Fund Manager: Mr. Rahul PalRegistrar & Transfer Agent: M/s. Karvy Computershare Private Ltd.
Entry Load - NILExit Load - 1% if exited upto 90 days & Nil if exited after 90 days from the date of allotment
Switch: Debt to debt/Equity - relevant exit load applicable as mentioned above.
LOAD STRUCTURE
PORTFOLIO As on 31st March, 2011
TOTAL 100.00
Name of the scrip % to Net Assets
CDs Rating
IDBI Bank Ltd A1+ 29.87Andhra Bank Ltd P1+ 29.83UCO Bank P1+ 29.83Total CDs 89.53
Floating Rate Note
Kotak Mahindra Bank Ltd. LAA+ 6.32
Total - Floating Rate Note 6.32
Cash & Cash Receivables 4.15
TAURUS DYNAMIC INCOME FUND - AN OPEN ENDED INCOME SCHEME